Embed Size (px)
Citation preview

ORIGINAL PAPER
Treatment of Collapsibility of Gypseous Soils by DynamicCompaction
Mohammed Y. Fattah • Hawraa
H. M. al-Musawi • Firas A. Salman
Received: 17 February 2012 / Accepted: 20 August 2012 / Published online: 29 August 2012
� The Author(s) 2012. This article is published with open access at Springerlink.com
Abstract Gypseous soils are distributed in vast areas
and various regions of Iraq and other countries. Many
foundation failure problems that occur in these soils
are associated with percolation of water and dissolu-
tion of gypsum. Many attempts were made by several
researchers to treat and improve the properties of
gypseous soils to decrease the dissolution of gypsum
and collapse potential of these soils. The purpose of
the present work is to investigate the effect of dynamic
compaction process on the behaviour of gypseous
soils. Extensive laboratory tests are carried out to
study the geotechnical properties and the behaviour
of three gypseous soils of different gypsum contents;
60.5, 41.1 and 27 %. The tests included compaction
characteristics, compressibility, and collapsibility
tests for samples tested before and after treatment by
dynamic compaction process under different number
of blows, falling weights and heights of falling of the
weights. Three weights are used to compact the
samples, namely; 2, 3 and 5 kg. The number of blows
is varied between 20 and 40, while three heights of
drop are tried (35, 50 and 65) cm. The results showed
that the best improvement in compressibility is
achieved when the sample is compacted by 20 blows;
above this number a negligible decrease in the
compression index CC is obtained. As the gypsum
content increases, the dynamic compaction has greater
effect on improvement of compressibility of the soil,
while as the height of drop increases, the compression
index CC decreases.
Keywords Gypseous soil � Dynamic compaction �Collapse � Improvement
1 Introduction
Gypsiferous soils are soils that contain sufficient
quantities of gypsum (calcium sulphate) to interfere
with plant growth (Nettleton et al. 1982). They occupy
about 90 million ha across Algeria, Argentina, Aus-
tralia, Iraq, Libya, Somalia, Spain, Sudan, Syria, the
former USSR and other arid and semi-arid countries
with annual rainfall of less than 500 mm (FAO 1990).
In Iraq, gypseous soils cover wide areas, sometimes
with high gypsum content that exceeds the soil content,
M. Y. Fattah (&)
Building and Construction Engineering Department,
University of Technology, Baghdad, Iraq
e-mail: [email protected]
H. H. M. al-Musawi
Civil Engineering Department, College of Engineering,
University of Kufa, Kufa, Iraq
F. A. Salman
Department of Civil Engineering, Faculty of Engineering,
University of Malaya, 50603 Kuala Lumpur, Malaysia
e-mail: [email protected]
123
Geotech Geol Eng (2012) 30:1369–1387
DOI 10.1007/s10706-012-9552-z

and today engineering properties of these soils in some
areas are unknown. The basin of Iraq covers more than
about 30 % of Iraqi area (Nashat 1994).
Gypseous soils usually stiff when they are dry, but
these soils may be affected greatly when subjected to
changes in water content due to water table fluctua-
tion, or due to water infiltration which may dissolve
gypsum causing, pores, cracks and producing cavities
that lead to increase the permeability in gypseous
soils. Therefore, the safety and good performance of
the foundations of structures and earth structures, such
as embankments and dams, will be governed by the
changes in the properties of these soils.
Rollins et al. (1998) evaluated the influence of
moisture content on dynamic compaction efficiency at
six field test cells, each with a progressively higher
average moisture content. The soil profile consisted of
collapsible sandy silt, and average test cell moisture
contents ranged from 6 to 20 %. At each cell, compac-
tion was performed with a 4.54 ton weight dropped from
a height of 24.3 m. Compaction efficiency was evalu-
ated using (1) crater depth measurements, (2) cone
penetration tests before and after compaction, and (3)
undisturbed samples before and after compaction. It was
found that crater depth increased by a factor of 4 as
moisture content increased. The degree of improvement
increased up to a moisture content of about 17 % and
then decreased. The optimum moisture content and the
maximum dry unit weight are similar to those predicted
by laboratory Proctor testing using energy levels
comparable to those employed in the field. Maximum
dry unit weight decreased with depth, while optimum
moisture content increased before the compactive
energy decreased with depth below the impact point.
Rollins and Mark (2005) described the dynamic
compaction carried out in Wyoming. The deep dynamic
compaction (DDC) work typically involved a 20 ton
weight, 4 ft (1.22 m) in diameter, with a drop height of
100 ft (30.48 m). Generally, primary drop points were
spaced at 10 and 12 ft (3.05 and 3.66 m) on centers
transverse and parallel to the direction of traffic,
respectively. Secondary drops were spaced at the center
of four primary drop points. Five drops were typically
made at each primary drop point and 2 at each
secondary point. The number of drops per point was
typically limited to 5 or 6 for the primary points and 2–3
for the secondary points. The applied energy per
volume increased from about 60 % of the standard
Proctor test energy in the 1989–1990 work to about
95 % for the second set of tests. These relatively high
energy levels are common for treating collapsible soils.
Inspectors monitored the number of drops and the crater
depth for each drop point. The average crater depths
were typically between 5 and 7 ft (1.52 and 2.13 m)
deep after treatment and the crater diameter typically
increased to about 10 ft (3.05 m) at the ground surface.
Dynamic cone penetration tests were performed at
several locations along each roadway section before
and after treatment. Substantial increases in cone
penetration resistance occurred when soil types con-
sisted of silty sands (SM) or low-plasticity silts (ML or
CL-ML) and the natural water content was relatively
low. In these cases, the average penetration resistance
increased from an average of 5–7 blows/ft to an average
of 25–30 blows/ft. However, in cases where the soil
profile contained layers of plastic clay (CH) with higher
natural water contents, little improvement in penetra-
tion resistance was observed. Under these conditions,
the clay soil appeared to absorb a significant percentage
of the impact energy rather than transmitting it to the
deeper layers.
Rollins and Kim (2010) presented case histories
provided for 15 projects at 10 locations in the United
States where collapsible soils were treated with
dynamic compaction (DC). For each site, the soil
properties, compaction procedures, and subsequent
improvement were summarized. Although cohesion-
less and low-plasticity collapsible soils were success-
fully compacted, clay layers in the profile appeared
to absorb energy and severely reduced compaction
effectiveness. Correlations were presented for estimat-
ing the maximum depth of improvement, the degree of
improvement versus depth, the depth of craters, and the
level of vibration based on measurements made at the
various sites. The compactive energy per volume was
typically higher than for non-collapsible soils because
collapsible soils are usually loose but relatively stiff.
The maximum depth of improvement was similar to
that for non-collapsible soils; however, significant
scatter was observed about the best-fit line. Improve-
ment was non-uniform with nearly 80 % of the total
improvement occurring within the top 60 % of the
improvement zone. The crater depth was related to a
number of factors besides the drop energy including
the number of drops, drop spacing, and contact
pressure.
1370 Geotech Geol Eng (2012) 30:1369–1387
123

1.1 Problems with Gypseous Soils
The problems encountered in gypseous soils are
summarized in the following points as reported by
Saaed (1990) and Al-Abdullah (1996):
• Great losses in strength upon wetting.
• Sudden increase in compressibility upon wetting.
• Continuation of deformation and collapse upon
leaching due to water movement.
• The existence of cracks due to seasonal changes.
• The existence of sink holes in the soil due to local
dissolution of gypsum.
1.2 Improvement of Gypseous Soils
The improvement of gypseous soils means decreasing
the effect of water on the gypseous soils to ensure the
safety and stability of the engineering structures. This
treatment can be achieved chemically or physically:
• The chemical treatment means that the soil prop-
erties are improved with some chemical additives,
such as lime, cement, bituminous, bentonite,
dehydrate calcium chloride, etc.
• The physical treatment means that the soil prop-
erties are improved using mechanical methods,
such as compaction, soil reinforcement, dynamic
compaction, pre-wetting, soil replacement and
others.
The major purpose of this study is to make an
attempt to improve gypseous soil characteristics using
a dynamic compaction process. A special apparatus
is manufactured to compact the soil. Different soils
having different gypsum contents are used to study the
effect of dynamic compaction on improving the
collapsibility characteristics of these soils.
2 Experimental Work
This section includes description of the sampling
methods, the testing apparatus used in addition to the
procedures of testing. Three types of natural gypsuous
soils used in this study are taken from three locations
of Al-Garmaa in Al-Anbar governorate western Iraq.
The first and second soil samples are taken from a
depth of 1.0 m and the third sample is obtained from a
depth of 2.0 m below the natural ground surface.
The samples are tested in the Soil Mechanics Labo-
ratory at Al-Mustansiriya University in Baghdad. The
samples were remolded to control the soil density.
A detailed testing program included the main tests
conducted on the samples. The testing program in this
study can be summarized in the following groups:
• Classification tests are performed first including
physical and chemical tests. The physical tests
include specific gravity, Atterberg limits, grain
size distribution and water content, while chemical
tests are preformed to determine the chemical
components of the samples.
• Standard Proctor and modified Proctor compaction
tests are carried out to determine the moisture-
density relationships.
• Compressibility test is performed using oedometer
apparatus. Double oedometer tests are carried out
on soaked and unsoaked samples at untreated and
compacted states.
Weight
Compaction Box Steel base
Manual Handle
1.75
m
Var
iabl
e
Fig. 1 Details of soil dynamic compaction apparatus parts
Geotech Geol Eng (2012) 30:1369–1387 1371
123

2.1 Physical Tests
The specific gravity of the soil is determined according
to the British standards (BS 1377: 1990, Test No. 6 B;
Head 2006), but ‘‘Kerosene’’ is used instead of water
due to the dissolution of gypsum in water. The liquid
limit test is carried out in accordance with (BS 1377:
1990, Test 2A), using cone penetrometer method.
The plastic limit is determined in accordance with
(BS 1377: 1990, Test No. 3). The liquid and plastic
limits are carried out on soil passing sieve No. 40 and
the temperature used for drying is maintained at
(45–50) �C due to the presence of gypsum in the soil
(ASTM 2216 1998).
The grain size distribution is determined by sieve
analysis test, which is conducted in accordance with
(ASTM D422 2002) with dry sieving.
The water content is performed in accordance with
(BS 1377: 1990, Test (A); Head 2006). The water
content is determined at drying temperature of 45 �C
because the soil contains a significant amount of
gypsum, thus preventing the loss of crystal water is
required.
2.2 Chemical Tests
Several chemical tests are carried out on the samples.
These tests included:
• Total soluble salts TSS % which are determined
according to the BS 1377: (1990), Test 9.
0.01 0.10 1.00 10.00
Particle Diameter, mm
20
60
100
0
40
80
Per
cent
Fin
er, %
S1S2S3
Fig. 2 Grain size distribution curves for the three soils
Table 1 Summary of physical properties of the three soils
Soil property Type of soil
S1 S2 S3
Specific gravity, Gs 2.28 2.34 2.41
Initial void ratio, eo 0.915 0.85 0.927
Initial water content (%) 0.91 0.82 0.73
Liquid limit, L.L (%) 55 43 41
Plastic limit, P.L (%) 39 31 29
Plasticity index, PI (%) 16 12 12
Coefficient of curvature, Cc 0.842 0.73 1.01
Uniformity coefficient, Cu 6.42 5.17 4.17
Percent of fines (%) 9 7 8
Sand percent (%) 91 93 92
Soil classification
according to (USCS)
SP - SM SP - SM SP - SM
Table 2 Results of
chemical testsType of soil Total soluble
salts TSS (%)
BS 1377 Al-Mufty and Nashat (2000)
SO3 (%) Gypsum content, v (%) SO3 (%) v (%)
S1 67.83 28.84 60.5 27.3 58.7
S2 50.63 20.87 41.1 18.84 40.5
S3 30.51 13.32 27 12 25.8
Table 3 Results of compaction tests
Type of test Soil property Type of soil
S1 S2 S3
Standard compaction Maximum dry unit weight, kN/m3 14.45 15.35 15.2
Optimum water content (%) 14.5 15.0 15.0
Modified compaction Maximum dry unit weight, kN/m3 19.67 18.5 16.5
Optimum moisture content (%) 10.0 12.7 13.8
1372 Geotech Geol Eng (2012) 30:1369–1387
123

• Total content of SO3% which is determined
according to BS 1377.
In this study, the gypsum content is determined by
two methods:
1. Gypsum content is determined according to the
British standards (BS 1377: 1990), The gypsum
content is determined from the sulfate content
of the soil by the following equation (BS 1377:
1990):
v ð%Þ ¼ SO3 � 2:15 ð1Þ
2. The gypsum content is also found according to the
method suggested by Al-Mufty and Nashat (2000).
This method consists of oven drying the soil at 45 �C
until the weight of the sample becomes constant.
The weight of sample at 45 �C is recorded. Then,
the same sample is dried at 110 �C until the weight
becomes constant and recorded.
The gypsum content is calculated according to the
following equation:
v ð%Þ ¼ W45�C �W110�C
W45�C� 4:778� 100 ð2Þ
where v = Gypsum content (%), W45 �C = Weight of
the sample at 45 �C, W110 �C = Weight of the sample
at 110 �C.
2.3 Mechanical Tests
2.3.1 Compaction Tests
Standard and modified compaction tests are carried
out for the untreated soils to determine the moisture-
unit weight relationship.
3010 200
Water Content, %
13
15
12
14
16
Dry
Uni
t Wei
ght,
kN
/m3
Standard CompactionS1S2S3
3010 200
Water Content, %
14
18
12
16
Dry
Uni
t Wei
ght,
kN
/m3
Modified Compaction
S1
S2
S3
Fig. 3 Compaction curves
for soils S1, S2 and S3
100010010
0.6
1.0
0.4
0.8
1.2
Voi
d R
atio
soaked unsoaked
S1
Effective Stress, kPa
0.6
1.0
0.4
0.8
1.2
Voi
d R
atio
S2soakedunsoaked
Effective Stress, kPa
0.7
0.9
0.6
0.8
1.0
Voi
d R
atio
S3soakedunsoaked
100010010
100010010
Effective Stress, kPa
Fig. 4 Results of compression test on untreated soils
Geotech Geol Eng (2012) 30:1369–1387 1373
123
1. Standard Compaction Test: This test is performed
according to (ASTM D698, Method A 2003).
2. Modified Compaction Test: This test is carried out
according to (ASTM D1557, Method A 2003).
2.3.2 Compressibility Tests
A series of oedometer tests is performed in accordance
with (ASTM 2435 2002). These tests are carried out on
untreated and compacted samples to determine the
compressibility characteristics. To conduct the tests,
the fixed type consolidometer cells and loading frame
with specimens of 75 mm diameter and 20 mm height
are used.
2.4 Double Oedometer Test
This test is conducted according to the procedure
suggested by Jennings and Knight (1957). In this test,
two identical samples are tested independently. The
10 100 1000
0.5
0.7
0.4
0.6
Voi
ud R
atio
W=2 kgsoakedunsoaked
10 100 1000
Effective Stress, kPa
0.3
0.5
0.4
0.6
Voi
d R
atio
W=2 kgsoakedunsoaked
10 100 1000
Effective Stress, kPa
0.2
0.6
0.4
0.8
Voi
d R
atio
W=3 kgsoakedunsoaked
10 100 1000
0.5
0.7
0.4
0.6
Voi
d R
atio
W=5 kgsoakedunsoaked
10 100 1000
Effectiv Stress, kPa
0.2
0.6
0.4
0.8W=3 kgsoakedunsoaked
10 100 1000
Effective Stress, kPa
0.2
0.6
0.4
0.8
Voi
d R
atio
W=5 kgsoakedunsoaked
Voi
d R
atio
Effective Stress, kPa
Effective Stress, kPa
(a) (b)Fig. 5 Results of
compression test on soil S1
compacted at no. of blows
20 and height of drop:
a H = 35 cm, b H = 50 cm
1374 Geotech Geol Eng (2012) 30:1369–1387
123

first one is loaded without the addition of any water
(unsoaked). Another sample is soaked and then loaded
progressively as in the standard consolidation test.
Both samples are stressed beginning from (25) kPa.
Then, the test is continued following the standard
procedure of doubling the applied loads until a stress
of 800 kPa is reached. The sample is then unloaded by
stress decrements through two stages 400 and
200 kPa. The difference between the two compression
curves quantifies the amount of deformation that
would occur at any stress level if the soil to be
saturated during its loading history.
10 100 1000
0.5
0.7
0.4
0.6
Voi
d R
atio
W=2 kgsoakedunsoaked
Effective Stress, kPa
0.3
0.5
0.4
0.6
Voi
d R
atio
W=3 kgsoakedunsoaked
Effectiv Stress, kPa
0.3
0.5
0.4
0.6
Voi
d R
atio
W=5 kgsoakedunsoaked
Effective Stress, kPa
10 100 1000
10 100 1000
Fig. 6 Results of compression test on soil S1 compacted at no.
of blows 20 and height of drop (H = 65) cm
10 100 1000
Effective Stress, kPa
0.3
0.5
0.4
0.6
Voi
d R
atio
W=2 kg
soakedunsoaked
Effective Stress, kPa
0.3
0.5
0.4
0.6
Voi
d R
atio
W=3 kg
soakedunsoaked
0.5
0.7
0.4
0.6
0.8
Voi
d R
atio
W=5 kg
soakedunsoaked
Effective Stress, kPa
10 100 1000
10 100 1000
Fig. 7 Results of compression test on soil S1 compacted at no.
of blows 30 and height of drop (H = 35) cm
Geotech Geol Eng (2012) 30:1369–1387 1375
123

2.5 Description of Dynamic Compaction
Apparatus
The full details of the soil dynamic compaction apparatus
can be shown in Fig. 1. All components of apparatus are
made of rigid steel. Generally, the apparatus consists of:
2.5.1 The Compaction Box
It is a steel box of (50 9 50 9 35) cm dimensions
which has a gate in order to make the operation of
extrusion of the compacted samples easy. The box can
be moved by a group of rollers.
10 100 1000
0.2
0.6
0.4
0.8
Voi
d R
atio
W=2 kgsoakedunsoaked
Effective Stress, kPa
0.2
0.6
0.4
0.8
Voi
d R
atio
W=2 kgsoakedunsoaked
0.5
0.7
0.4
0.6
Voi
d R
atio
W=3 kgsoakedunsoaked
Effective Stress, kPa
0.45
0.55
0.4
0.5
0.6
Voi
d R
atio
W=3 kgsoakedunsoaked
Effective Stress, kPa
0.2
0.6
0.4
0.8
Voi
d R
atio
W=5 kgsoakedunsoaked
(a)
0.5
0.6
0.7
Voi
d R
atio
W=5 kgsoakedunsoaked
(b)
10 100 1000
10 100 100010 100 1000
10 100 1000 10 100 1000
Effective Stress, kPa
Effective Stress, kPa
Effective Stress, kPa
Fig. 8 Results of compression test on soil S1 compacted at no. of blows 30 and height of drop: a H = 50 cm, b H = 65 cm
1376 Geotech Geol Eng (2012) 30:1369–1387
123
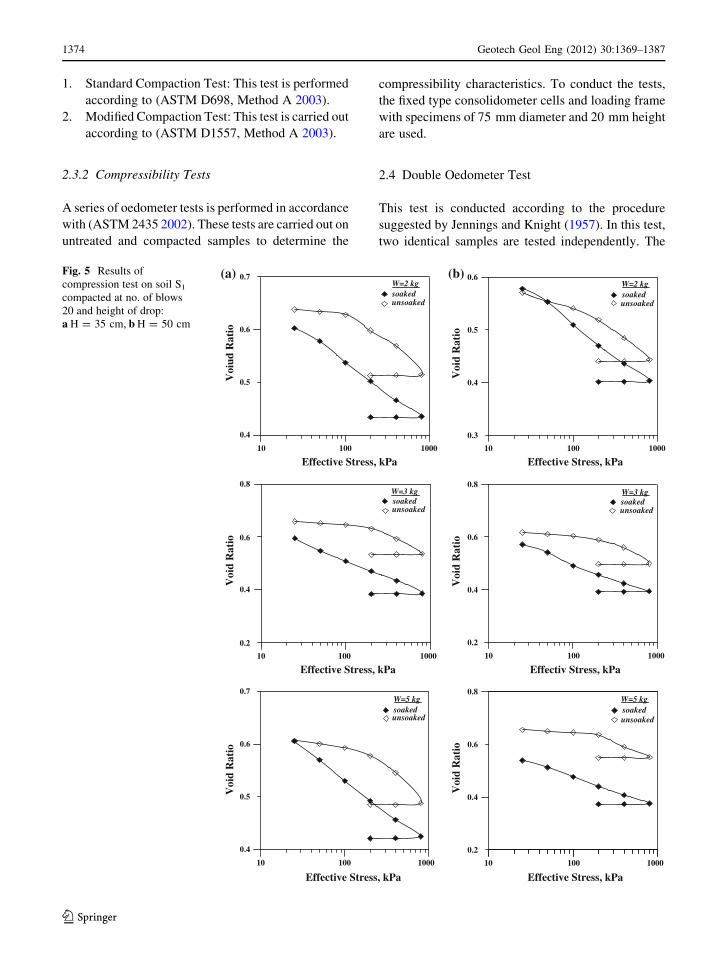
2.5.2 Compaction Arm
It is a steel pipe having the form of letter (L) connected
from the bottom with a steel base of dimensions
(36 9 36) cm. The side part of compaction arm is
a steel pipe of length L = 40 cm and diameter
D = 9 cm, it ends with a toothed crow bar rotated
manually by hand for controlling the height of falling
of weights and to ensure free fall of the weights. This is
done through controlling length of the metal wire, with
which it is connected during the movement of the
toothed crow bar of other side. The middle part of the
compaction arm is interfered pipe of steel. The outer
pipe which is connected to the base of the arm has
dimensions of inner diameter ID = 10 cm, outer
diameter OD = 11 cm and height H = 100 cm. The
interior pipe which is connected to the side part has
dimensions of D = 9 cm and H = 75 cm.
Effective Stress, kPa
0.2
0.6
0.4
0.8
Voi
d R
atio
W=2 kgsoakedunsoaked
10 100 1000
Effective Stress, kPa
0.2
0.6
0.4
0.8
Voi
d R
atio
W=2 kgsoakedunsoaked
Effective Stress, kPa
0.3
0.5
0.4
0.6
Voi
d R
atio
W=3 kgsoakedunsoaked
Effective Stress, kPa
0.2
0.6
0.4
0.8V
oid
Rat
io
W=3 kgsoakedunsoaked
0.3
0.5
0.2
0.4
0.6
Voi
d R
atio
W=5 kgsoakedunsoaked
0.3
0.5
0.2
0.4
0.6
Voi
d R
atio
W=5 kgsoakedunsoaked
10 100 1000
10 100 100010 100 1000
10 100 1000
10 100 1000
Effective Stress, kPa Effective Stress, kPa
(a) (b) Fig. 9 Results of
compression test on soil S1
compacted at no. of blows
40 and height of drop:
a H = 35 cm, b H = 50 cm
Geotech Geol Eng (2012) 30:1369–1387 1377
123
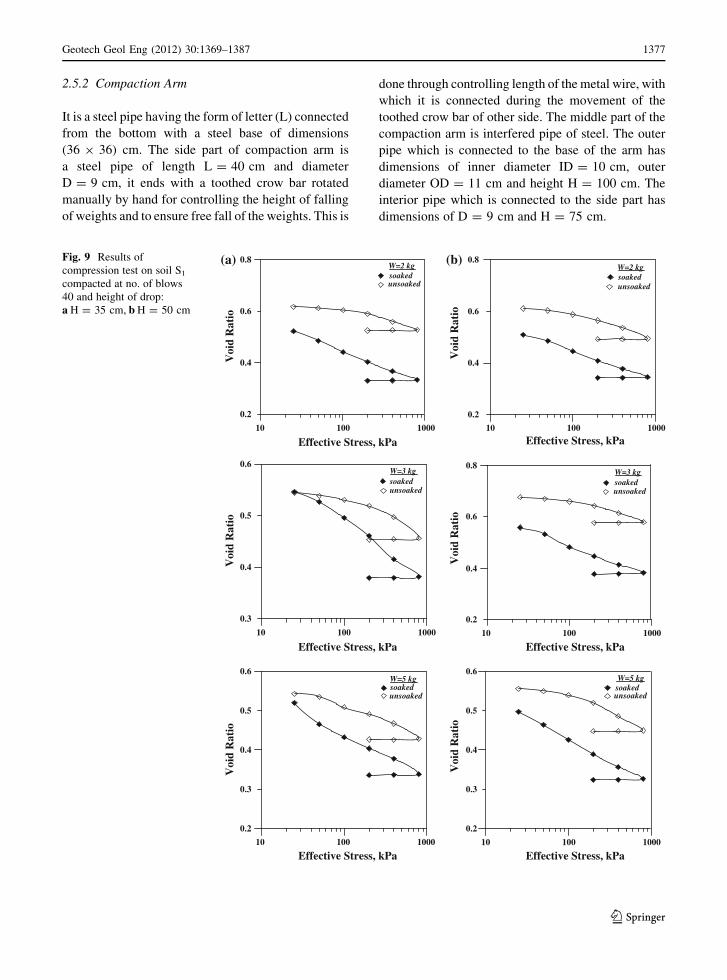
3 Preparation of the Soil Sample
In this study, compacted soil samples are prepared at
moisture content equal to the optimum moisture
content according to ASTM D698 (2003). The prep-
aration of the soil sample is summarized in the
following:
• The natural water content is determined according
to (BS 1377: 1990, test A; Head 2006).
• Dry soil is mixed carefully with the required amount
of water till it reaches the optimum moisture content.
4 Soil Compaction by Dynamic Compaction
Apparatus
1. The compaction box is filled with soil. The soil
layer thickness in the box is limited to 20 cm due
to sample preparation requirements. It is known
from previous studies on dynamic compaction,
such as Rollins and Mark (2005), that for the used
loads, 2.5–4 cm is the effective depth of influence
of dynamic compaction, from which it is suffi-
cient to obtain samples (after dynamic compac-
tion) for oedometer test. The soil is compacted
through the falling weights at different heights and
the required number of blows. In this study, three
weights of 2, 3 and 5 kg are used with three heights
of falling 35, 50 and 65 cm and three different
numbers of blows; 20, 30 and 40 are tried.
2. The required weight is fastened by the metal wire
and raised to the specific height by moving the hold
by hand then it is locked with the toothed crow bar.
3. The lock of the crow bar is opened, and then the
weight falls freely on the soil. This operation is
repeated to reach the required number of blows.
The loads are controlled to be distributed at
enough area for extraction of at least two samples
of the compacted soil which are necessary for
preparing samples for oedometer test. The box is
to be rolled by hand to ensure distribution of the
blows over the required area.
4. Two rings of the oedometer test apparatus are
pushed in the compacted space of the soil to get
the required samples for oedometer test.
5. The gate of the compaction box is opened to
extract the samples.
5 Results and Discussion
5.1 Grain Size Distribution
The results of particle size distribution tests conducted
using dry sieve analysis are shown in Fig. 2. From
10 100 1000
Effective Stress, kPa
0.3
0.5
0.2
0.4
0.6
Voi
d R
atio
W=2 kg
soakedunsoaked
Effective Stress, kPa
0.2
0.6
0.4
0.8
Voi
d R
atio
W=3 kgsoakedunsoaked
Effective Stress, kPa
0.3
0.5
0.4
0.6
Voi
d R
atio
W=5 kg
soakedunsoaked
10 100 1000
10 100 1000
Fig. 10 Results of compression test on soil S1 compacted at no.
of blows 40 and height of drop (H = 65) cm
1378 Geotech Geol Eng (2012) 30:1369–1387
123
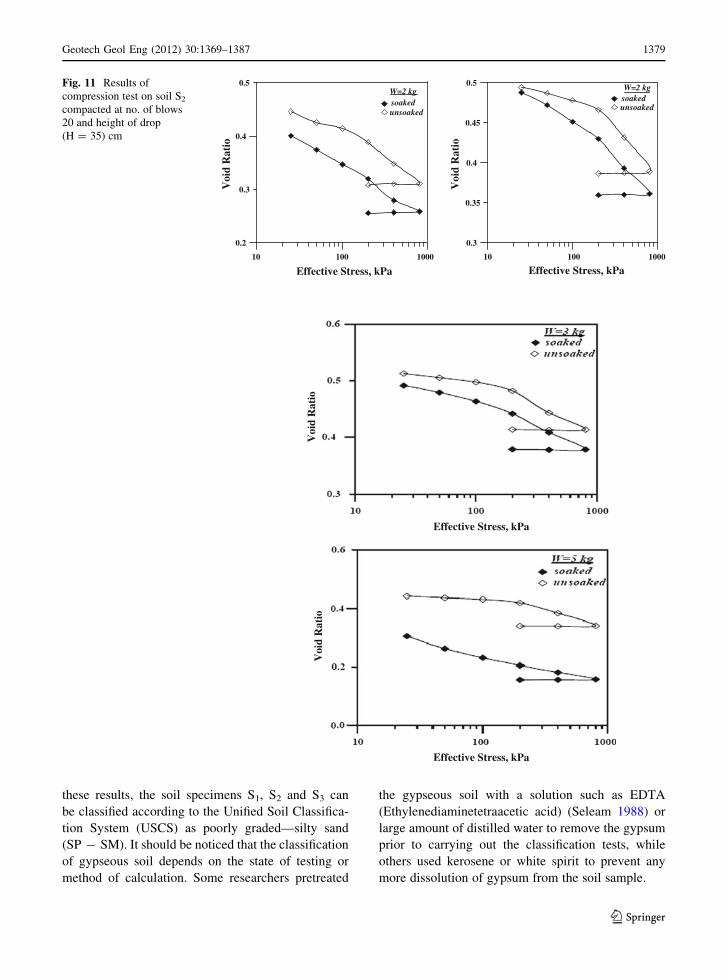
these results, the soil specimens S1, S2 and S3 can
be classified according to the Unified Soil Classifica-
tion System (USCS) as poorly graded—silty sand
(SP - SM). It should be noticed that the classification
of gypseous soil depends on the state of testing or
method of calculation. Some researchers pretreated
the gypseous soil with a solution such as EDTA
(Ethylenediaminetetraacetic acid) (Seleam 1988) or
large amount of distilled water to remove the gypsum
prior to carrying out the classification tests, while
others used kerosene or white spirit to prevent any
more dissolution of gypsum from the soil sample.
10 100 1000
Effective Stress, kPa
0.3
0.5
0.2
0.4
Voi
d R
atio
W=2 kgsoakedunsoaked
0.35
0.45
0.3
0.4
0.5
Voi
d R
atio
W=2 kg
unsoakedsoaked
10 100 1000
Effective Stress, kPa
Voi
d R
atio
Voi
d R
atio
Effective Stress, kPa
Effective Stress, kPa
Fig. 11 Results of
compression test on soil S2
compacted at no. of blows
20 and height of drop
(H = 35) cm
Geotech Geol Eng (2012) 30:1369–1387 1379
123

5.2 Specific Gravity
It can be noticed that the specific gravity decreases for
the soil having high gypsum content. The low specific
gravity of the three soils, which ranges between 2.28
and 2.41 is attributed to the low specific gravity of
gypsum, which is equal to 2.32, compared to other soil
constituents.
5.3 Atterberg Limits
Atterberg limits tend to increase with the increase of
gypsum content (Al-Gabri 2003). This behaviour may
be related to the small particles of gypsum, which
cause an increase in the surface area of the soil, the
requirements of water are increased until these limits.
Similar results are found in this study as can be noticed
in Table 1 in which the liquid limit values are high
despite that the soil is granular. This may be attributed
to the fact that the soil has apparent cohesion caused
by the presence of gypsum which gives the soil the
consistency of fine soil. The results of Atterberg limits
are summarized in Table 1.
5.4 Chemical Tests
Table 2 shows the results of chemical tests. Since the
gypsum content of the three soils is more than (25 %);
the soils are classified according to Barzanji (1973) as
‘‘highly gypsiferous’’.
5.5 Compaction Testes
The results of compaction tests are tabulated in
Table 3. The relationships between dry unit weight
and water content for the tested soils are shown in
Fig. 3 for compactive efforts associated with the
modified and standard Proctor test.
It is noticed that the standard maximum dry unit
weight of soil S2 is somewhat higher than the standard
maximum dry unit weight of soil S1, while the
opposite is true for the modified compaction test.
This is due to the role of gypsum in the compaction
(Al-Mufty 1997): First, the gypsum particles act as
pore filling fines especially if the gypsum particles
are of small size compared to the soil grains, thus,
increasing the dry unit weight. Second, gypsum causes
10 100 1000
0.3
0.5
0.2
0.4
Voi
d R
atio
W=3 kgsoakedunsoaked
0.4
0.5
0.3
0.4
0.5
Voi
d R
atio
W=3 kgsoaked
unsoaked
Effective Stress, kPa
0.1
0.3
0.2
0.4
Voi
d R
atio
W=5 kg
unsoakedsoaked
0.3
0.5
0.2
0.4
Voi
d R
atio
W=5 kgsoakedunsoaked
10 100 1000
10 100 1000 10 100 1000
Effective Stress, kPa Effective Stress, kPa
Effective Stress, kPa
(a) (b) Fig. 12 Results of
compression test on soil S2
compacted at no. of blows
20 and height of drop:
a H = 50 cm, b H = 65 cm
1380 Geotech Geol Eng (2012) 30:1369–1387
123
cementation to soil particles that helps resistance to
compaction effort and increases the required water
content to reach the maximum unit weight. In other
words, the decrease in the maximum dry unit weight
may be attributed to the loss of some compactive
energy in breaking the cementation bonds, which
may form between clay and gypsum particles. Third,
increasing gypsum at the expense of soil particles
causes a lower specific gravity for the soil as a whole,
and leads to decreasing the dry unit weight.
It can be concluded from the water content—unit
weight relationships that the test results depend on the
soluble salt content (gypsum content), water content,
the solubility degree of gypsum in water and comp-
active effort. This agrees with the findings of Farwana
and Majid (1988).
10 100 1000
0.45
0.55
0.4
0.5
0.6
Voi
d R
atio
W=2 kgsoakedunsoaked
Effective Stress, kPa
0.3
0.5
0.2
0.4
0.6
Voi
d R
atio
W=2 kgsoakedunsoaked
0.35
0.45
0.3
0.4
0.5
Voi
d R
atio
W=3 kgsoakedunsoaked
0.35
0.45
0.3
0.4
0.5
Voi
d R
atio
W=3 kgsoakedunsoaked
0.3
0.5
0.2
0.4
Voi
d R
tio
W=5 kgsoakedunsoaked
0.3
0.4
0.2
0.3
0.4
Voi
d R
atio
W=5 kgsoakedunsoaked
10 100 1000
10 100 1000 10 100 1000
10 100 1000 10 100 1000
Effective Stress, kPa
Effective Stress, kPa Effective Stress, kPa
Effective Stress, kPa Effective Stress, kPa
(a)(a) (b)
Fig. 13 Results of compression test on soil S2 compacted at no. of blows 30 and height of drop: a H = 35 cm, b H = 50 cm
Geotech Geol Eng (2012) 30:1369–1387 1381
123

5.6 Compression Test
This test is carried out on two samples for each soil.
The first sample is tested at the optimum water
content, while the other is directly tested after soaking
in water. The results are presented as void ratio versus
logarithm of effective stress as shown in Figs. 4, 5, 6,
7, 8, 9, 10, 11, 12, 13, 14, 15, 16 for all tested
specimens. Figure 4 presents the relationship for the
untreated samples, while Figs. 5, 6, 7, 8, 9, 10, 11, 12,
13, 14, 15, 16 show the relationship for samples tested
after treatment by dynamic compaction under differ-
ent numbers of blows, falling weights and height of
falling of the weights.
10 100 1000
0.3
0.5
0.2
0.4
Voi
d R
atio
W=2 kgsoakedunsoaked
Effective Stress, kPa
0.25
0.35
0.2
0.3
0.4
Voi
d R
atio
W=3 kg
soakedunsoaked
0.25
0.35
0.2
0.3
0.4
Voi
d R
atio
W=5 kgsoakedunsoaked
10 100 1000
10 100 1000
Effective Stress, kPa
Effective Stress, kPa
Fig. 14 Results of compression test on soil S2 compacted at no.
of blows 30 and height of drop (H = 65) cm
10 100 1000
Effective stress, kpa
0.3
0.5
0.2
0.4
Voi
d R
atio
W=2 kgsoakedunsoaked
0.25
0.35
0.2
0.3
0.4
Voi
d R
atio
W=3 kgsoakedunsoaked
0.2
0.6
0.0
0.4
Voi
d R
atio
W=5 kgsoakedunsoaked
10 100 1000
10 100 1000
Effective stress, kpa
Effective stress, kpa
Fig. 15 Results of compression test on soil S2 compacted at no.
of blows 40 and height of drop (H = 35) cm
1382 Geotech Geol Eng (2012) 30:1369–1387
123

From these results, it can be seen that:
• The initial void ratio eo for the compacted sample
of soil S1 is greater than the initial void ratio of
soils S2 and S3. This is due to the effect of gypsum
content. The presence of gypsum enlarges the
voids within the soil structure.
• The void ratio at stress level 800 kPa increases
slightly with the increase in the height of drop H
from 35 cm to 50 cm, but decreases under H =
65 cm.
• The void ratio at stress level 800 kPa for soaked
compacted samples decreases with the increase in
the falling weight.
10 100 1000
0.3
0.5
0.2
0.4
0.6
Voi
d R
atio
W=2 kgsoakedunsoaked
Effective Stress, kPa
0.3
0.5
0.2
0.4
Voi
d R
atio
W=2 kgsoakedunsoaked
0.3
0.5
0.2
0.4
0.6
Voi
d R
atio
W=3 kgsoakedunsoaked
0.3
0.5
0.2
0.4
Voi
d R
atio
W=3 kg
unsoakedsoaked
0.3
0.2
0.4
Voi
d R
atio
W=5 kgsoakedunsoaked
0.3
0.5
0.2
0.4
Voi
d R
atio
W=5 kgsoakedunsoaked
10 100 1000
10 100 1000 10 100 1000
10 100 1000 10 100 1000
Effective Stress, kPa
Effective Stress, kPa Effective Stress, kPa
Effective Stress, kPa Effective Stress, kPa
0.5
(a) (b)
Fig. 16 Results of compression test on soil S2 compacted at no. of blows 40 and height of drop: a H = 50 cm, b H = 65 cm
Geotech Geol Eng (2012) 30:1369–1387 1383
123

• The void ratio at stress level 800 kPa for soaked
compacted samples decreases with the increase in
the number of blows.
• In samples subjected to dynamic compaction, the
change in void ratio De upon soaking becomes
smaller than that of untreated samples which
means that the collapse potential decreases.
In Figs. 17, 18, 19, the compression index CC is
plotted versus the number of blows. It becomes clear
that the compression index for soil S1 increases from
0.011 to 0.221 upon soaking in water. The same
behaviour is observed for the other two soils, as shown
in Table 4. This behaviour is attributed to the fact that
the gypsum acts as cementing material by adding
resistance to deformation, but upon wetting, softening
occurs due to cement loss.
It can be also noticed that, for saturated soil
samples, the compression index decreases as the
sample is compacted under a number of blows among
20-40. The best improvement in compressibility is
achieved when the sample is subjected to 20 drops.
Above this number, a negligible decrease in CC is
obtained. For soil S1, as the number of blows
increases, the CC increases due to the increase in the
height of drop, while for soils S2 and S3, the large
number of blows greater than 30 may lead to increase
CC. This may be attributed to breakage of soil grains
and a decrease in particle interlocking and hence
increase in void ratio. The decrease in compression
050301 04020
No. of Blows
0.1
0.3
0.0
0.2
Com
pres
sion
Ind
ex (
Cc) Unsoaked Test
2 Kg3 Kg5 Kg
Soaked Test2 kg3 kg5 kg
050301 04020
No. of Blows
0.1
0.3
0.0
0.2
Com
pres
sion
Ind
ex (
Cc) Unsoaked Test
2 Kg3 Kg5 Kg
Soaked Test2 kg3 kg 5 kg
050301 04020
No. of Blows
0.1
0.3
0.0
0.2
Com
pres
sion
Ind
ex (
Cc)
Soaked Test
2 Kg3 Kg5 Kg
Unsoaked Test
2 kg 3 kg5 kg
(a)
(b)
(c)
Fig. 17 Number of blows versus compression index for
compacted soil S1 at: a H = 35 cm, b H = 50 cm and
c H = 65 cm
050301 04020
No. of Blows
0.05
0.15
0.0
0.1
0.2
Com
pres
sion
Ind
ex (
Cc)
Soaked Test
2 Kg3 Kg5 Kg
Unsoaked Test
2 Kg3 Kg5 Kg
(a)
050301 04020
No. of Blows
0.05
0.15
0.0
0.1
0.2
Soaked Test
2 Kg3 Kg5 Kg
Unsoaked Test
2 Kg3 Kg5 Kg
(b)
050301 04020
No. of Blows
0.05
0.15
0.0
0.1
0.2
Com
pres
sion
Ind
ex (
Cc) Unsoaked Test
2 Kg3 Kg5 Kg
Soaked Test2 Kg3 Kg5 Kg
(c)
Com
pres
sion
Ind
ex (
Cc)
Fig. 18 Number of blows versus compression index for
compacted soil S2 at: a H = 35 cm, b H = 50 cm and
c H = 65 cm
1384 Geotech Geol Eng (2012) 30:1369–1387
123
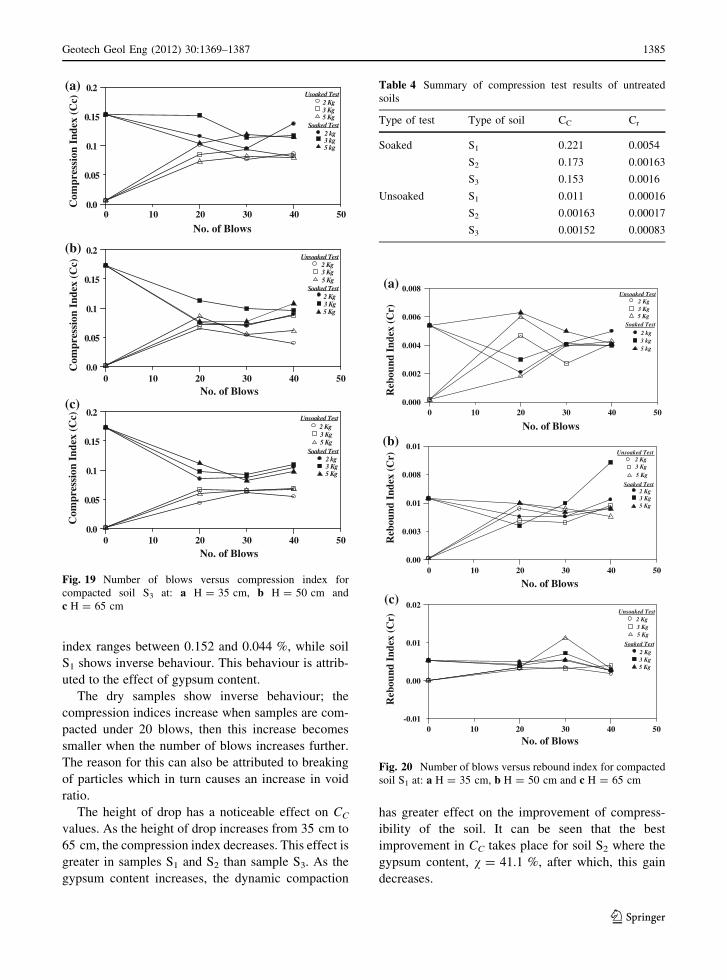
index ranges between 0.152 and 0.044 %, while soil
S1 shows inverse behaviour. This behaviour is attrib-
uted to the effect of gypsum content.
The dry samples show inverse behaviour; the
compression indices increase when samples are com-
pacted under 20 blows, then this increase becomes
smaller when the number of blows increases further.
The reason for this can also be attributed to breaking
of particles which in turn causes an increase in void
ratio.
The height of drop has a noticeable effect on CC
values. As the height of drop increases from 35 cm to
65 cm, the compression index decreases. This effect is
greater in samples S1 and S2 than sample S3. As the
gypsum content increases, the dynamic compaction
has greater effect on the improvement of compress-
ibility of the soil. It can be seen that the best
improvement in CC takes place for soil S2 where the
gypsum content, v = 41.1 %, after which, this gain
decreases.
10 30 500 20 40
No. of Blows
0.05
0.15
0.0
0.1
0.2
Wet Test2 Kg3 Kg5 Kg
Usoaked Test2 Kg3 Kg5 Kg
Soaked Test2 kg3 kg5 kg
(a)
0.05
0.15
0.0
0.1
0.2Unsoaked Test
2 Kg3 Kg5 Kg
Soaked Test2 Kg3 Kg5 Kg
(b)
0.05
0.15
0.0
0.1
0.2Unsoaked Test
2 Kg3 Kg5 Kg
Soaked Test2 kg3 Kg5 Kg
(c)No. of Blows
No. of Blows
Com
pres
sion
Ind
ex (
Cc)
Com
pres
sion
Ind
ex (
Cc)
Com
pres
sion
Ind
ex (
Cc)
10 30 500 20 40
10 30 500 20 40
Fig. 19 Number of blows versus compression index for
compacted soil S3 at: a H = 35 cm, b H = 50 cm and
c H = 65 cm
Table 4 Summary of compression test results of untreated
soils
Type of test Type of soil CC Cr
Soaked S1 0.221 0.0054
S2 0.173 0.00163
S3 0.153 0.0016
Unsoaked S1 0.011 0.00016
S2 0.00163 0.00017
S3 0.00152 0.00083
503010 40200
No. of Blows
0.002
0.006
0.000
0.004
0.008
Reb
ound
Ind
ex (
Cr)
Unsoaked Test
2 Kg3 kg5 Kg
Soaked Test
2 Kg3 Kg5 Kg
2 kg 3 kg5 kg
(a)
No. of Blows
0.003
0.008
0.00
0.01
0.01
Reb
ound
Ind
ex (
Cr) Unsoaked Test
2 Kg3 Kg5 Kg
Soaked Test2 Kg3 Kg5 Kg
(b)
-0.01
0.01
0.00
0.02
Reb
ound
Ind
ex (
Cr)
Unsoaked Test2 Kg3 Kg5 Kg
Soaked Test2 Kg3 Kg5 Kg
(c)
503010 40200
503010 40200
No. of Blows
Fig. 20 Number of blows versus rebound index for compacted
soil S1 at: a H = 35 cm, b H = 50 cm and c H = 65 cm
Geotech Geol Eng (2012) 30:1369–1387 1385
123

The same behaviour can be seen in Figs. 20, 21, 22,
which show the relationship between the rebound
index Cr and the number of blows for samples
compacted at different weights and heights of drop.
Generally, from these figures, it can be noticed that for
soaked soil sample S1, Cr increases with increasing the
number of blows, while for the unsoaked sample, Cr
decreases at a number of blows equals to 30 then it
increased at a number of blows equals to 40.
For soil S2, it can be observed that for soaked samples,
Cr decreases with increasing the number of blows, while
for the unsoaked samples, Cr decreases at a number of
blows equals to 30, then it increased at a number of blows
equals to 40. The opposite is true for soil S3.
The improvement in Cr decreases with the increase
in gypsum content. The improvement is greater for
sample S3 where v = 27 %. This may be attributed
to the presence of gypsum fragments within these
soils, whose crystallization structures have extremely
strong structural bonds, but are very brittle and are
irreversibly destroyed by mechanical action during the
loading stage (Petrukhin and Arakelyan 1985; Al-
Qaissy 1989).
6 Conclusions
In this work, three samples with different gypsum
contents are treated by both standard compaction tests
and dynamic compaction apparatus. From the results
and analysis of the tests on soil samples with gypsum
content 60.5, 41.1 and 27 %, the following conclu-
sions can be made:
503010 40200
No. of Blows
0.002
0.006
0.000
0.004
0.008R
ebou
nd I
ndex
(C
r)Unsoaked Test
2 Kg3 Kg5 Kg
Soaked Test2 Kg3 Kg5 Kg
(a)
No. of Blows
0.005
0.015
0.00
0.01
0.02
Reb
ound
Ind
ex (
Cr)
Soaked Test
2 Kg3 Kg5 Kg
Unsoaked Test
2 Kg3 Kg5 Kg
(b)
0.002
0.006
0.000
0.004
0.008
Reb
ound
Ind
ex (
Cr)
Unsoaked Test2 Kg3 Kg5 Kg
Soaked Test2 Kg3 Kg5 Kg
(c)
503010 40200
503010 40200
No. of Blows
Fig. 21 Number of blows versus rebound index for compacted
soil S2 at: a H = 35 cm, b H = 50 cm and c H = 65 cm
503010 40200
No. of Blows
0.002
0.006
0.00
0.00
0.01
Reb
ound
Ind
ex (
Cr)
Soaked Test
2 Kg3 Kg5 Kg
Unsoaked Test
2 Kg3 Kg5 Kg
(a)
No. of Blows
-0.01
0.01
-0.02
0.00
0.02
Reb
ound
Ind
ex (
Cr)
Soaked Test
2 Kg3 Kg5 Kg
Unsoaked Test
2 Kg3 Kg5 Kg
(b)
No. of Blows
0.002
0.006
0.000
0.004
0.008
Reb
ound
Ind
ex (
Cr) 2 Kg
3 Kg5 Kg
2 Kg3 Kg5 Kg
Unsoaked Test
Soaked Test
(c)
503010 40200
503010 40200
Fig. 22 Number of blows versus rebound index for compacted
soil S3 at: a H = 35 cm, b H = 50 cm and c H = 65 cm
1386 Geotech Geol Eng (2012) 30:1369–1387
123

1. The best improvement in compressibility is
achieved when the samples are subjected to 20
drops, this conclusion is based on the improve-
ment of compression index of soaked samples
obtained after treatment. Above this number, a
negligible decrease in the compression index CC
is obtained.
2. As the height of drop increases from 35 to 65 cm,
the compression index CC decreases. This effect
increases with the increase in the gypsum content.
The same behaviour of the compression index CC
can be noticed on the rebound index Cr.
3. As the gypsum content increases, the dynamic
compaction has greater effect on improvement of
compressibility of the soil. In samples subjected
to dynamic compaction, the change in void ratio
De upon soaking becomes smaller than that of
untreated samples which means that the collapse
potential decreases.
Open Access This article is distributed under the terms of the
Creative Commons Attribution License which permits any use,
distribution, and reproduction in any medium, provided the
original author(s) and the source are credited.
References
Al-Abdullah SFI (1996) The upper limit of gypseous salts in the
clay core of AI-Adhaim Dam. Ph.D. Thesis, Department of
Civil Engineering, University of Baghdad, Iraq
Al-Gabri MKA (2003) Collapsibility of gypseous soils using
three different methods. M.Sc. Thesis, Building and
Construction Engineering Department, University of
Technology, Baghdad, Iraq
Al-Mufty AA (1997) Effect of gypsum dissolution on the
mechanical behavior of gypseous soils. Ph.D. Thesis, Civil
Engineering Department, University of Baghdad, Iraq
Al-Mufty AA, Nashat EH (2000) Gypsum content determina-
tion in gypseous soils and rocks. In: Proceedings of the 3th
Jordanian international mining conference, Amman, vol 2,
pp 485–492
Al-Qaissy FF (1989) Effect of gypsum content and its migration
on compressibility and shear strength of the soil. M.Sc.
Thesis, Building and Construction Engineering Depart-
ment, University of Technology, Baghdad, Iraq
ASTM D2216 (1998) Standard test method for laboratory
determination of water (moisture) content of soil and
rock by mass. Annual book of ASTM standards, vol 04.08,
ASTM international, West Conshohocken, PA, pp 1–5
ASTM D422 (2002) Standard test method for particle size
analysis of soils. Annual book of ASTM standards, vol
04.08, ASTM International, West Conshohocken, PA,
pp 1–8
ASTM D2435 (2002) Standard test method for one-dimensional
consolidation properties of soils. Annual book of ASTM
standards, vol 04.08, ASTM international, West Cons-
hohocken, PA, pp 1–10
ASTM D698 (2003) Standard test method for laboratory com-
paction characteristics of soil using standard effort. Annual
book of ASTM standards, vol 04.08, ASTM international,
West Conshohocken, PA, pp 1–8
ASTM D1557 (2003) Test methods for laboratory compaction
characteristics of soil using modified efforts. Annual book
of ASTM standards, vol 04.08, ASTM international, West
Conshohocken, PA, pp 1–8
Barzanji AF (1973) Gypesous soil of Iraq. Ph.D. Thesis,
University of Ghent, Belgium
BS 1377 - 2 (British Standard Institution) (1990) Method of test
for soils for civil engineering purposes. British Standard
Institution, London, UK
FAO (1990) Management of gypsiferous soils. FAO Soils Bull
62
Farwana TA, Majid ZK (1988) An investigation into the use of
emulsified asphalt in the stabilization of sandy sabkha. In:
Proceedings of the 3rd IRF Middle East, Regional Meeting,
Kingdom of Saudi Arabia
Head KH (2006) Manual of soil laboratory testing, Vol. 1, Soil
classification and compaction tests, 3rd edn. Whittles
publishing, UK
Jennings JK, Knight K (1957) The additional settlement of
foundation due to a collapse of structure of sandy subsoil
on wetting. In: Proceedings of 4th international conference
on soil mechanics and foundation engineering, vol 2,
pp 316–319
Nashat IH (1994) Exploit of gypseous soil. Report, Ministry of
Housing and Construction—National Center for Con-
struction Laboratories NCCL, Baghdad, Iraq, pp 54–63
Nettleton WD, Nelson RE, Brasher BR, Derr PS (1982) Gyp-
siferous soils in the Wester United States. In: Soil Science
Society of America Special Publication, No. 10, pp 147–
168
Petrukhin VP, Arakelyan EA (1985) Strength of gypsum-day
soils and its variation during the leaching of salts. J Soil
Mech Found Eng 21(6):23–25
Rollins KM, Kim J (2010) Dynamic compaction of collapsible
soils based on U.S. case histories. J Geotech Geoenviron
Eng ASCE 136(9):1178–1186
Rollins KM, Mark F (2005) Dynamic deep compaction treat-
ment of collapsible soils in Wyoming. Salt Lake City
annual meeting, October 16–19, 2005, Geological Society
of America Abstracts with Programs, vol 37, No. 7, p 328
Rollins KM, Jorgensen ST, Ross TE (1998) Optimum moisture
content for dynamic compaction of collapsible soils. J
Geotech Geoenviron Eng ASCE 124(8):699–708
Saaed SA (1990) Characteristics of gypseous soil. Almuhan-
disson J (3):23–35
Seleam SNM (1988) Geotechnical characteristics of a gypseous
sandy soil including the effect of contamination with some
oil products. M.Sc. Thesis, Building and Construction
Engineering Department, University of Technology,
Baghdad, Iraq
Geotech Geol Eng (2012) 30:1369–1387 1387
123