Embed Size (px)
Citation preview
energies
Article
Treatment of Slaughterhouse Waste Water Mixed withSerum from Lacteal Industry of Extremadura in Spainto Produce Clean Energy
A. C. Marcos 1,*, A. Al-Kassir 1, Francisco Cuadros 1 and Talal Yusaf 2
1 School of Industrial Engineering, University of Extremadura, Avda. de Elvas s/n, 06006 Badajoz, Spain;[email protected] (A.A.-K.); [email protected] (F.C.)
2 School of Mechanical and Electrical Engineering, The University of Southern Queensland, Toowoomba 4350,QLD, Australia; [email protected]
* Correspondence: [email protected]; Tel.: +34-924-289-600 (ext. 86516)
Academic Editor: Xidong WangReceived: 3 April 2017; Accepted: 24 May 2017; Published: 31 May 2017
Abstract: The problem of slaughterhouse waste water can be resolved by mixing it with serum fromlacteal industry to produce a biogas. The effect of serum addition on the anaerobic co-digestion ofsolid and liquid slaughterhouse waste has been studied. The experimental device consisted of acontinuous digester by recirculation of biogas produced in the anaerobic digestion. The input effluentwas a mixture of slaughterhouse waste from Badajoz city (Spain) and animal serum in a proportionof 20%. The anaerobic digestion was developed in a complete mixing continuous digester with acapacity of 6.2 L at 37 ◦C and a feed rate of 350 mL/day. From the results obtained for the co-digestionof the feeding effluent of the slaughterhouse waste, without and with serum added, in the sameoperating conditions, comparative data about the biological depuration and biogas production havebeen obtained. A 10 L biogas production was obtained with the slaughterhouse waste and 18 Lwith the slaughterhouse waste with serum added. In conclusion, the highest energetic yield (97.52%higher) was obtained in the second case, due to the positive action of catalytic enzymes present in theanimal serum.
Keywords: slaughterhouse waste water; treatment; anaerobic biodigestion; lacteal serum
1. Introduction
From the 1960s, the rise of industries and demographic growth have seriously affected our waterand air reserves. Since then, we have begun to contemplate our environment as something verydelicate that we have to preserve, because if we do not, irreversible alterations could result. In fact, theEuropean Union, for many years, has been seriously legislating in an effort to deal with this problem.
With this demographic and industrial growth and the agglomeration of the population in largecities, the generation of agro-industrial wastes has been rising to such alarming levels that the publichas become sensitized to the problems caused by this waste if it is not properly managed. Until a fewyears ago, the waste generated by the small populations and the few industries that existed posedno great problem, since nature itself was able to recycle it into the environment. Today, however, thegeneration of waste biomass is so abundant and so localized that there is insufficient capacity for itsnatural degradation, and various treatment techniques have to be applied [1–4].
One of the most polluting food industries is the meat industry. In general, there are three mainpoints of waste production: the livestock pens, the slaughterhouse and the area where the dead animalsare handled. The most important focus of contamination occurs in the slaughterhouses, where theslaughter, preparation of meat and some elaborations of secondary products take place. In general, the
Energies 2017, 10, 765; doi:10.3390/en10060765 www.mdpi.com/journal/energies
Energies 2017, 10, 765 2 of 15
slaughterhouse waste is composed of solids (viscera and offal), purines, blood and cleaning water andit contains organic matter, fats, suspended solids, phosphates, nitrates, nitrites and sodium chloride.The average composition of their liquid effluent, once separated from the voluminous solids, is asfollows: total solids 4000 mg L−1, volatile solids 2000 mg L−1, chemical oxygen demand (COD)2500 mg L−1, 5-day biochemical oxygen demand (BOD5) 1000 mg L−1, and nitrogen 250 mg L−1 [2,5].
Slaughterhouses use a large volume of hot water and steam to clean and sterilize the deadcarcasses. The aqueous waste from this process, along with the blood, is often downloaded untreatedinto the municipal sewerage systems or, in many cases, directly over open drains or, worse, oversurface water currents. Sometimes, the solid waste is removed by burying or incineration. In the eventof burying, the final result is generally the same, because the organic components are filtered intounderground systems.
Slaughterhouse effluent has the additional problem of its great variability in composition andconcentration, not only from one day to another, but even over the course of a single day according tothe operations being carried out at any given time [2].
The meat processing industry uses 24% of the total freshwater consumed by the food and beverageindustry and up to 29% of that consumed by the agricultural sector worldwide [1,6,7].
Anaerobic digestion is the preferred biological treatment that is applied in slaughterhousewastewater treatment due to its effectiveness in treating high strength wastewater [1,8].
Although anaerobic treatment possesses great advantages, it hardly produces effluents thatcomply with current discharge limits and standards. Generally speaking, although anaerobic treatmentis an efficient process, the slaughterhouse wastewater organic strength makes it difficult to achievecomplete stabilization of the organic compounds [1,9].
The dairy industries, which produce a derivative highly polluting whey or dairy serum, are alsoamong the food industries generating the highest quantity of waste. Dairy serum is defined as a milkfraction, of any species, that does not precipitate because of the action of rennet or because of theacids during the cheese-making process. The main contributors of organic load to these effluents arecarbohydrates, proteins and fats originating from the milk [10–12].
The polluting power of dairy serum is very high and, the previous treatment with natural andconventional treatment plants does not fulfill its function, because of the wealth of organic materialscarried in lactic sera. The proteins and the lactose become contaminants when the liquid is dischargedinto the environment without any type of treatment, because the load of organic matter that it containsallows the reproduction of microorganisms.
The dairy wastewaters can be partly reused [13] or treated. Biological processes are usuallypreferred to treat dairy wastewaters like treatment in ponds, activated sludge plants and anaerobictreatment [12].
The most common purification methods used for the treatment of the discharge liquids producedby the meat and dairy industries, the anaerobic treatments, are insufficient and have importantconsequences that have been little studied with regard to microbial flora dragging. The problem iswhen these effluents, poorly cleared and with large biological contributions, are discharged into publicwaterways, due to unawareness of their impact on health.
The anaerobic digestion process is an imperative tool for the production of clean energy sources,such as hydrogen and methane [12]. Liquids produced by the meat and dairy industries can beprocessed with anaerobic digestion to produce biogas that can be used to generate heat or electricity.The biogas can be used in a cogeneration system or used for biomethane production which in turn canbe sent to national natural gas network or used as a biocombustible fuel in the automotive sector [14,15].There are several studies on the optimization of this process to obtain biogas from slaughterhousewaste [16–18] to solve this problem.
In this work, the influence of the addition of animal dairy serum on the anaerobic codigestionof solid and liquid waste from the municipal slaughterhouse of Badajoz has been studied. From theresults of the codigestion of the effluent of solids (viscera and offal), purines, blood and cleaning
Energies 2017, 10, 765 3 of 15
water mixed with serum and without serum, in the same conditions of operation, comparative dataof biological depuration and the production of biogas has been obtained. This would solve theproblem of whey leftovers in the milk industry and at the same time optimize the production of biogasin slaughterhouses.
2. Serum and Waste from Dairy and Meat Industry and Their Potential Environmental Pollution
Serum is from 100 to 200 times more polluting than sewage water, and most municipal treatmentplants cannot treat it suitably. Dumping serum into rivers is impossible because it removes oxygenfrom the water, preventing the life of aquatic fauna. Burying serum in wasteland or gravel pits is notusually convenient because of its filtration into water supplies.
In 2014, cheese production in Spain, according to European Union estimates, was 387,700 tons [19]as shown in Table 1.
Table 1. Lactic serum production [19].
Product 2012 Production(in 1000 TM)
2013 Production(in 1000 TM)
2014 Production(in 1000 TM)
Cheese 322.6 361.9 387.7Butter 36.7 35.5 39.8
Added lactic serum 1509.9 1794.8 1798.7Total lactic serum 2903.4 3257.1 3489.3
During the cheese-making process, lactoserum is the liquid fraction of milk obtained after theprecipitation and recovery of caseine [20] (Table 2).
Table 2. Lactic serum chemical composition [20].
Parameter Sample
COD (g L−1) 68.6BOD5 (g L−1) 37.71SST (g L−1) 1.35
Lactose (g L−1) 45.9Proteins (g L−1) 2.71
pH 4.9NTK (g L−1) 1.12
FT (g L−1) 0.5 × 10⁻³
This subproduct is around 85–95% of the total volume of the milk used and it is estimatedto contain 55% of nutrient [21]. The production established is around 9 L/kg of the producedcheese [21] and it is therefore considered the main subproduct of the cheese industry. Accordingly, thequantity of serum produced in Spain could be approximately 3,489,300,000 L/year (Table 1), of which1,798,700,000 L/year have been used in the production of different dairy products.
From the other 1,690,600,000 L/year, a dairy serum production of 4,631,780 L/day can beproduced, with a polluting power similar to a population of 15–19 million habitants per day [22,23].
The biological oxygen demand (BOD) of lactic serum varies between 20,000 and 50,000 mg ofO2/L [24]. In consequence, around 0.25–0.30 L of serum are equivalent to the black waters producedby a person per day PE (population equivalent) [23,24].
According to the Ministry of Agriculture, Fishing and Food of Spain [19], the volume of nationalserum production has increased considerably (Table 1) because of the increase of cheese and butterproduction. It is interesting to note that an average cheese industry that produces 400,000 L ofunpurified serum daily is producing daily pollution similar to a population of 1,250,000 [23,24].
Energies 2017, 10, 765 4 of 15
On the other hand, in the meat industry the waste generated is so abundant that self-degradationis insufficient, and different treatment techniques must be applied. According to the agriculturemacromagnitudes for 2014 of the Ministry of Agriculture, Fishing and Food of Spain [19], the censusof animals per species is summarized in Table 3.
Table 3. Animals census by species, 2014 [19].
Animal Badajoz Cáceres Extremadura Spain
Bovine 281,694 504,022 785,716 6,078,733Ovine 1,976,013 1,065,321 3,041,334 15,431,804
Caprine 112,534 135,173 247,707 2,704,229Porcine 809,200 119,529 928,729 26,567,578
At regional level, the number of slaughtered heads in Extremadura during the period between2000 and 2014 is shown in Table 4, and this would lead to great environmental pollution, dependingon the waste generated. Table 5 reports the residues generated per sacrificed animal [24].
Table 4. Number of sacrificed animals in 2011, 2012, 2013 and 2014 in Extremadura (Spain) [1].
SacrificedAnimals
Number ofAnimals 2011
Number ofAnimals 2012
Number ofAnimals 2013
Number ofAnimals 2014
Bovine 81,178 74,373 80,298 88,943Porcine 608,496 524,838 429,295 489,281Ovine 300,209 276,622 276,253 275,619
Caprine 34,103 22,504 23,644 22,505Total 1,023,986 898,337 809,490 876,348
Table 5. Estimate of the quantity of offal generated per carcass [25].
Type ofAnimal
GrossWeight (kg)
CarcassWeight (kg)
Total by-Products(kg)
Blood(L)
Fat(kg)
Intestines(kg)
Otherby-Products (kg)
Bovine 540 300 240 39.4 32.6 26.6 141.4Porcine 160 115 45 11.2 1.7 1.3 30.8Ovine 20 11 9 1.4 0.5 1.9 5.2
Caprine 12 6 6 0.8 0.3 1 3.9
The pollution generated by products obtained from the slaughter of the different species oflivestock can be estimated in terms of BOD (biological oxygen demand). Hence, expressing thevalues of BOD in terms of population equivalent, the pollution generated by the slaughterhousesof Extremadura Community for 2014 would be approximately 181,404 PE (population equivalent)(Table 6). Population equivalent is the number expressing the ratio of the of the total pollution loadproduced during 24 h and the individual one produced by one person in the same time. For this workit is assumed this number equals 60 g of BOD per 24 h.
Table 6. Pollution expressed in population equivalents (PE) in 2014.
TYPE OFANIMAL
AnimalsButchered in 2014
BOD5(g L−1)/Carcass
Contaminationin PE
Total Contamination(PE) in the Region of
Extremadura
Bovine 88,943 12.42 0.2070 18,411Porcine 489,281 12.42 0.2070 101,281Ovine 275,619 12.42 0.2070 57,053
Caprine 22,505 12.42 0.2070 4659Total 181,404
Energies 2017, 10, 765 5 of 15
3. Materials and Methods
3.1. Experimental Assembly
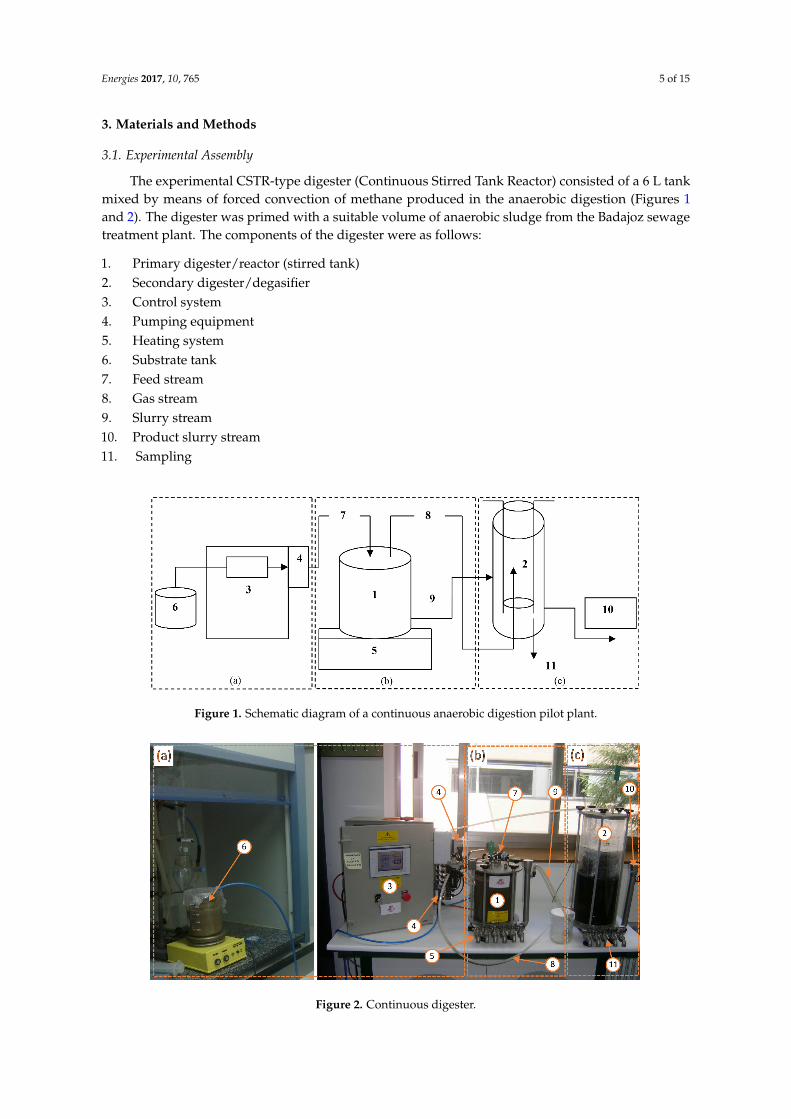
The experimental CSTR-type digester (Continuous Stirred Tank Reactor) consisted of a 6 L tankmixed by means of forced convection of methane produced in the anaerobic digestion (Figures 1and 2). The digester was primed with a suitable volume of anaerobic sludge from the Badajoz sewagetreatment plant. The components of the digester were as follows:
1. Primary digester/reactor (stirred tank)2. Secondary digester/degasifier3. Control system4. Pumping equipment5. Heating system6. Substrate tank7. Feed stream8. Gas stream9. Slurry stream10. Product slurry stream11. Sampling
Energies 2017, 10, 765 5 of 14
1. Primary digester/reactor (stirred tank) 2. Secondary digester/degasifier 3. Control system 4. Pumping equipment 5. Heating system 6. Substrate tank 7. Feed stream 8. Gas stream 9. Slurry stream 10. Product slurry stream 11. Sampling
Three groups have been formed to describe the configuration of the experiment:
(a) Substrate tank, control system and pumping equipment (b) Primer digester, heating system and feed and gas streams (c) Secondary digester, slurry stream, product slurry stream and sampling
Figure 1. Schematic diagram of a continuous anaerobic digestion pilot plant.
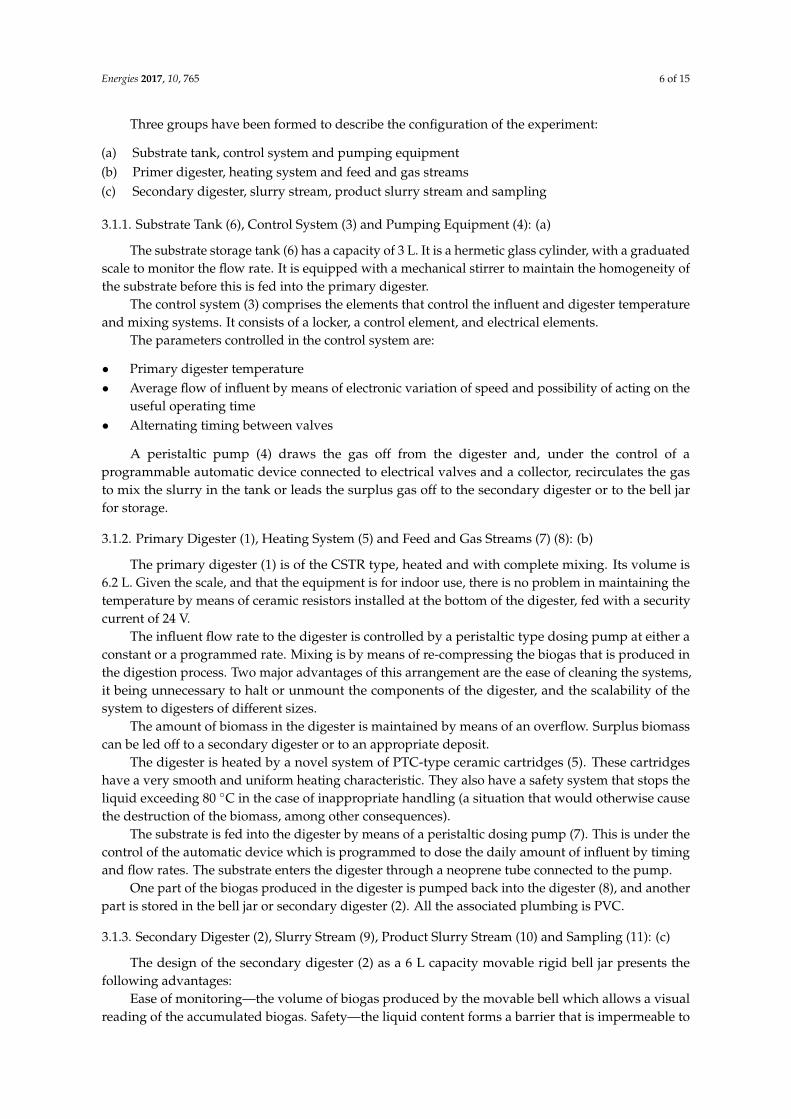
Figure 2. Continuous digester.
3.1.1. Substrate Tank (6), Control System (3) and Pumping Equipment (4): (a)
The substrate storage tank (6) has a capacity of 3 L. It is a hermetic glass cylinder, with a graduated scale to monitor the flow rate. It is equipped with a mechanical stirrer to maintain the homogeneity of the substrate before this is fed into the primary digester.
Figure 1. Schematic diagram of a continuous anaerobic digestion pilot plant.
Energies 2017, 10, 765 5 of 14
1. Primary digester/reactor (stirred tank) 2. Secondary digester/degasifier 3. Control system 4. Pumping equipment 5. Heating system 6. Substrate tank 7. Feed stream 8. Gas stream 9. Slurry stream 10. Product slurry stream 11. Sampling
Three groups have been formed to describe the configuration of the experiment:
(a) Substrate tank, control system and pumping equipment (b) Primer digester, heating system and feed and gas streams (c) Secondary digester, slurry stream, product slurry stream and sampling
Figure 1. Schematic diagram of a continuous anaerobic digestion pilot plant.
Figure 2. Continuous digester.
3.1.1. Substrate Tank (6), Control System (3) and Pumping Equipment (4): (a)
The substrate storage tank (6) has a capacity of 3 L. It is a hermetic glass cylinder, with a graduated scale to monitor the flow rate. It is equipped with a mechanical stirrer to maintain the homogeneity of the substrate before this is fed into the primary digester.
Figure 2. Continuous digester.
Energies 2017, 10, 765 6 of 15
Three groups have been formed to describe the configuration of the experiment:
(a) Substrate tank, control system and pumping equipment(b) Primer digester, heating system and feed and gas streams(c) Secondary digester, slurry stream, product slurry stream and sampling
3.1.1. Substrate Tank (6), Control System (3) and Pumping Equipment (4): (a)
The substrate storage tank (6) has a capacity of 3 L. It is a hermetic glass cylinder, with a graduatedscale to monitor the flow rate. It is equipped with a mechanical stirrer to maintain the homogeneity ofthe substrate before this is fed into the primary digester.
The control system (3) comprises the elements that control the influent and digester temperatureand mixing systems. It consists of a locker, a control element, and electrical elements.
The parameters controlled in the control system are:
• Primary digester temperature• Average flow of influent by means of electronic variation of speed and possibility of acting on the
useful operating time• Alternating timing between valves
A peristaltic pump (4) draws the gas off from the digester and, under the control of aprogrammable automatic device connected to electrical valves and a collector, recirculates the gasto mix the slurry in the tank or leads the surplus gas off to the secondary digester or to the bell jarfor storage.
3.1.2. Primary Digester (1), Heating System (5) and Feed and Gas Streams (7) (8): (b)
The primary digester (1) is of the CSTR type, heated and with complete mixing. Its volume is6.2 L. Given the scale, and that the equipment is for indoor use, there is no problem in maintaining thetemperature by means of ceramic resistors installed at the bottom of the digester, fed with a securitycurrent of 24 V.
The influent flow rate to the digester is controlled by a peristaltic type dosing pump at either aconstant or a programmed rate. Mixing is by means of re-compressing the biogas that is produced inthe digestion process. Two major advantages of this arrangement are the ease of cleaning the systems,it being unnecessary to halt or unmount the components of the digester, and the scalability of thesystem to digesters of different sizes.
The amount of biomass in the digester is maintained by means of an overflow. Surplus biomasscan be led off to a secondary digester or to an appropriate deposit.
The digester is heated by a novel system of PTC-type ceramic cartridges (5). These cartridgeshave a very smooth and uniform heating characteristic. They also have a safety system that stops theliquid exceeding 80 ◦C in the case of inappropriate handling (a situation that would otherwise causethe destruction of the biomass, among other consequences).
The substrate is fed into the digester by means of a peristaltic dosing pump (7). This is under thecontrol of the automatic device which is programmed to dose the daily amount of influent by timingand flow rates. The substrate enters the digester through a neoprene tube connected to the pump.
One part of the biogas produced in the digester is pumped back into the digester (8), and anotherpart is stored in the bell jar or secondary digester (2). All the associated plumbing is PVC.
3.1.3. Secondary Digester (2), Slurry Stream (9), Product Slurry Stream (10) and Sampling (11): (c)
The design of the secondary digester (2) as a 6 L capacity movable rigid bell jar presents thefollowing advantages:
Ease of monitoring—the volume of biogas produced by the movable bell which allows a visualreading of the accumulated biogas. Safety—the liquid content forms a barrier that is impermeable to
Energies 2017, 10, 765 7 of 15
the biogas. Surplus biogas or biogas produced within the bell jar is completely sealed off, and can beled off to a secure place (burner, a Tedlar gas sampling bag, or simply to the exterior). Fire risks andbad odours are thus totally obviated.
There is the possibility of secondary digestion in which the gasometer can operate as a secondarydigester, with a second accumulation of the effluent (without temperature control). It can also operatewithout secondary digestion by being filled with clean water. In the secondary digester mode, it has apurging system for sampling the settled sludge, and an overflow system that is analogous to that ofthe primary digester for control of the level.
A slurry stream (9) can be set up between the overflows of the primary and secondary digestersusing PVC tubing.
The degraded slurry from both primary and secondary digesters is led off through the installedoverflows (10).
Taps (11) on the lower part of the primary and of the secondary digesters allow samples tobe taken.
The optimal composition of the substrate that the biodigester would allow without inhibition ofthe process was, according to our experimental data, 84% wastewater, 10% purines, and 6% solids [26].
3.2. Characterization of Influent
To perform the experiments of anaerobic digestion, it is essential to know, upon implementationof the biodigester:
(i) (The optimum percentage of the composition of the feed stream which is limited in terms of the% maximum of solids that the biodigester can admit without being inhibited, and it has beendetermined experimentally:
• For experiment 1, codigestion of slaughterhouse waste [26]:
- 6% solids (viscera and offal)- 10% purines- 84% blood + cleaning water
• For experiment 2, codigestion of slaughterhouse waste mixed with animal serum:
- 80% Slaughterhouse waste:
- 6% solids (viscera and offal)- 10% purines- 84% blood + cleaning water
- 20% Dairy serum
(ii) The operating conditions selected to obtain the maximum treatment and biogas production,which have also been determined in the laboratory:
• Feeding rate: 350 mL/day [8].• Digester temperature: mesophilic regimen 37 ◦C.
Once the composition of each preset input current was fixed, we proceeded to its physico-chemicalcharacterization, determining parameters such as pH, COD, BOD5, VSS, nitrogen, phosphates, etc.(determined according to the methodology obtained from the literature [27,28]), which are indicativeof the contamination present in the sample.
According to experiment 1 (codigestion of slaughterhouse waste, Table 7), approximately similarvalues are obtained as for the input effluent of experiment 2 (codigestion of slaughterhouse waste+ animal serum, Table 7), except for the case of chemical and biochemical oxygen demand andvolatile acidity.
Energies 2017, 10, 765 8 of 15
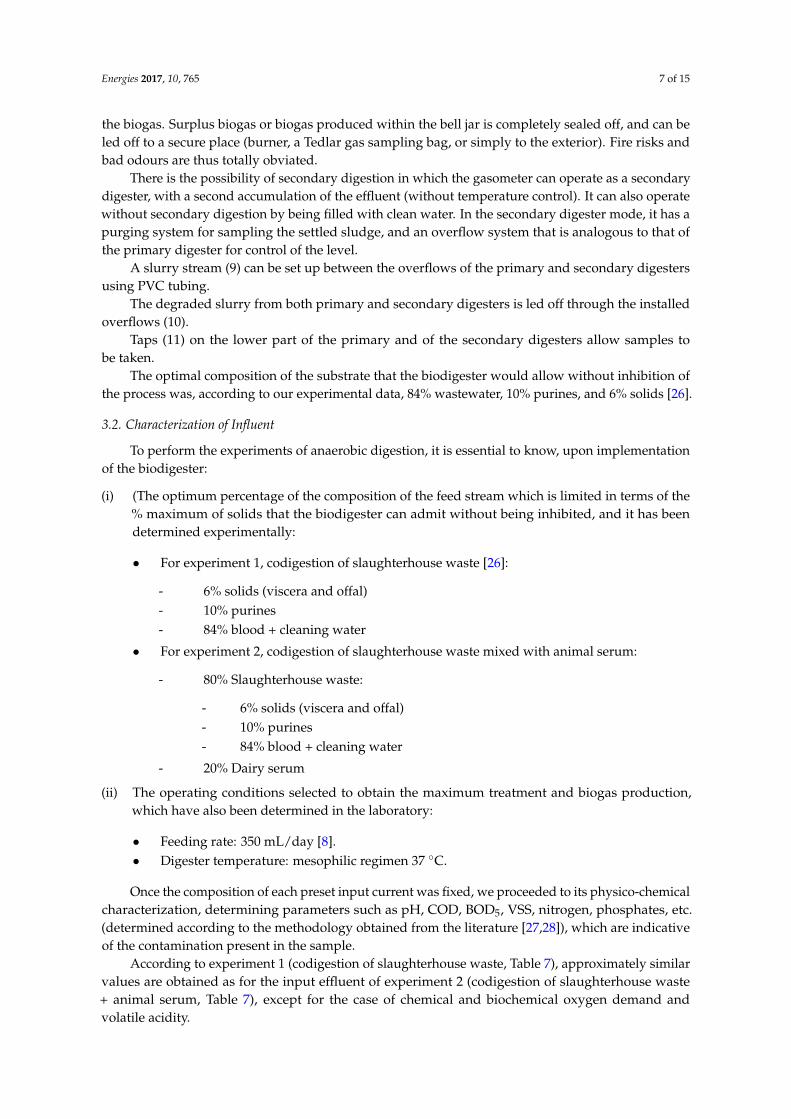
Table 7. Characterization of the influent substrate in experiments.
Experiment pH CODtotal(mg/L)
BOD5(mg/L)
VSS(g/L)
TotalNitrogen (g/L)
Volatile Acid (gAcetic Acid/L)
Alkalinity(gCaCO3/L)
Phosphates(g/L)
1 6.51 41,500 12,420 8.56 1.27 0.95 1.1 0.192 6.64 50,000 17,450 8.25 1.1 1.9 1 0.19
This difference is explained by the addition of animal serum at a proportion of 20% in experiment 2:the increase of the COD is due to the richness in organic matter in the whey.
Once the operating conditions and inflows are known, various codigestions are performed in thedigester (Figure 1), obtaining the final values once the steady state is reached of the main parametersof each experiment, shown in Table 8.
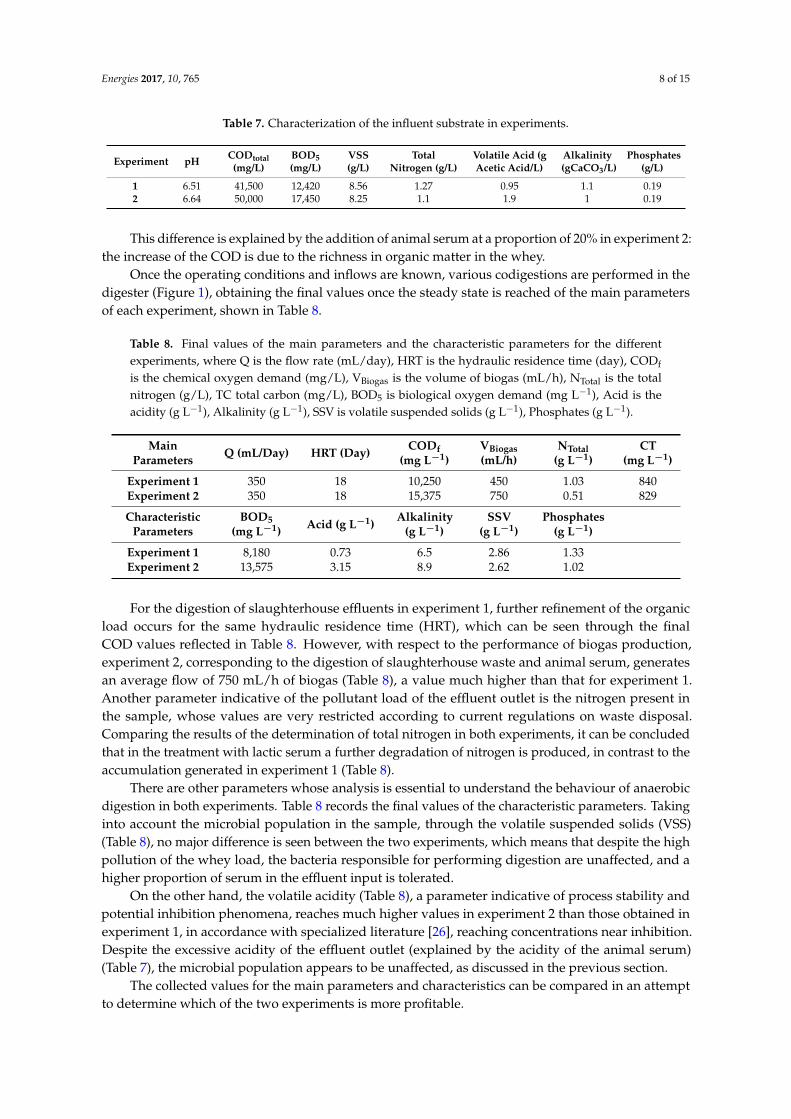
Table 8. Final values of the main parameters and the characteristic parameters for the differentexperiments, where Q is the flow rate (mL/day), HRT is the hydraulic residence time (day), CODf
is the chemical oxygen demand (mg/L), VBiogas is the volume of biogas (mL/h), NTotal is the totalnitrogen (g/L), TC total carbon (mg/L), BOD5 is biological oxygen demand (mg L−1), Acid is theacidity (g L−1), Alkalinity (g L−1), SSV is volatile suspended solids (g L−1), Phosphates (g L−1).
MainParameters Q (mL/Day) HRT (Day) CODf
(mg L−1)VBiogas(mL/h)
NTotal(g L−1)
CT(mg L−1)
Experiment 1 350 18 10,250 450 1.03 840Experiment 2 350 18 15,375 750 0.51 829
CharacteristicParameters
BOD5(mg L−1) Acid (g L−1)
Alkalinity(g L−1)
SSV(g L−1)
Phosphates(g L−1)
Experiment 1 8,180 0.73 6.5 2.86 1.33Experiment 2 13,575 3.15 8.9 2.62 1.02
For the digestion of slaughterhouse effluents in experiment 1, further refinement of the organicload occurs for the same hydraulic residence time (HRT), which can be seen through the finalCOD values reflected in Table 8. However, with respect to the performance of biogas production,experiment 2, corresponding to the digestion of slaughterhouse waste and animal serum, generatesan average flow of 750 mL/h of biogas (Table 8), a value much higher than that for experiment 1.Another parameter indicative of the pollutant load of the effluent outlet is the nitrogen present inthe sample, whose values are very restricted according to current regulations on waste disposal.Comparing the results of the determination of total nitrogen in both experiments, it can be concludedthat in the treatment with lactic serum a further degradation of nitrogen is produced, in contrast to theaccumulation generated in experiment 1 (Table 8).
There are other parameters whose analysis is essential to understand the behaviour of anaerobicdigestion in both experiments. Table 8 records the final values of the characteristic parameters. Takinginto account the microbial population in the sample, through the volatile suspended solids (VSS)(Table 8), no major difference is seen between the two experiments, which means that despite the highpollution of the whey load, the bacteria responsible for performing digestion are unaffected, and ahigher proportion of serum in the effluent input is tolerated.
On the other hand, the volatile acidity (Table 8), a parameter indicative of process stability andpotential inhibition phenomena, reaches much higher values in experiment 2 than those obtained inexperiment 1, in accordance with specialized literature [26], reaching concentrations near inhibition.Despite the excessive acidity of the effluent outlet (explained by the acidity of the animal serum)(Table 7), the microbial population appears to be unaffected, as discussed in the previous section.
The collected values for the main parameters and characteristics can be compared in an attemptto determine which of the two experiments is more profitable.
Energies 2017, 10, 765 9 of 15
3.3. Methods
In general, industrial wastewater lacks suitable microorganisms to perform biodigestion, so it isnecessary to have an acclimated inoculum [29]. In our case, as the starting inoculums in the biodigestorwe use a mixture of anaerobic sludge from an urban sewage treatment plant and cow manure rich inmethanogenic bacteria.
First of all, and in all experiments, it is necessary to acclimate this anaerobic population to thedegradation of the slaughterhouse residue and added serum. For this purpose, increasing volumetricloads of residues were added, for one month, until a steady-state condition was reached, that is to say,a constant in the production of methane. Next, the feed of liquid waste was started.
To prepare the samples for the different experiments that we carried out, account was taken of theaverage number of heads from the slaughterhouse of Badajoz, as well as the species, sacrificed duringthe year (Table 4). The experimentation carried out in the municipal slaughterhouse of Badajoz allowsus to know the average amount of residues which is generated by the slaughter and later processing inthe slaughterhouse, per head of each animal species. These values are shown in Table 5.
The experiments, carried out with a feeding of 350 mL day−1, were developed for different porcine,bovine, ovine and caprine cases. The results obtained enabled a comparison of the yield achievedin terms of degraded COD and methane production for different bloods, following the evolutionof parameters such as pH, COD, BOD5, SSV, nitrogen, phosphates, etc., through the methodologyobtained from the literature [27,28].
The parameters that we studied and controlled for each experiment were: the main parametersof the COD, the volume of methane produced (Table 9) and the characteristic parameters of volatileacidity, alkalinity, BOD5, VSS, nitrogen and phosphates (Table 10), for the same initial load of feed ofthe porcine, ovine and bovine, and caprine types investigated in experiment 1 and with 20% serumadded in experiment 2.
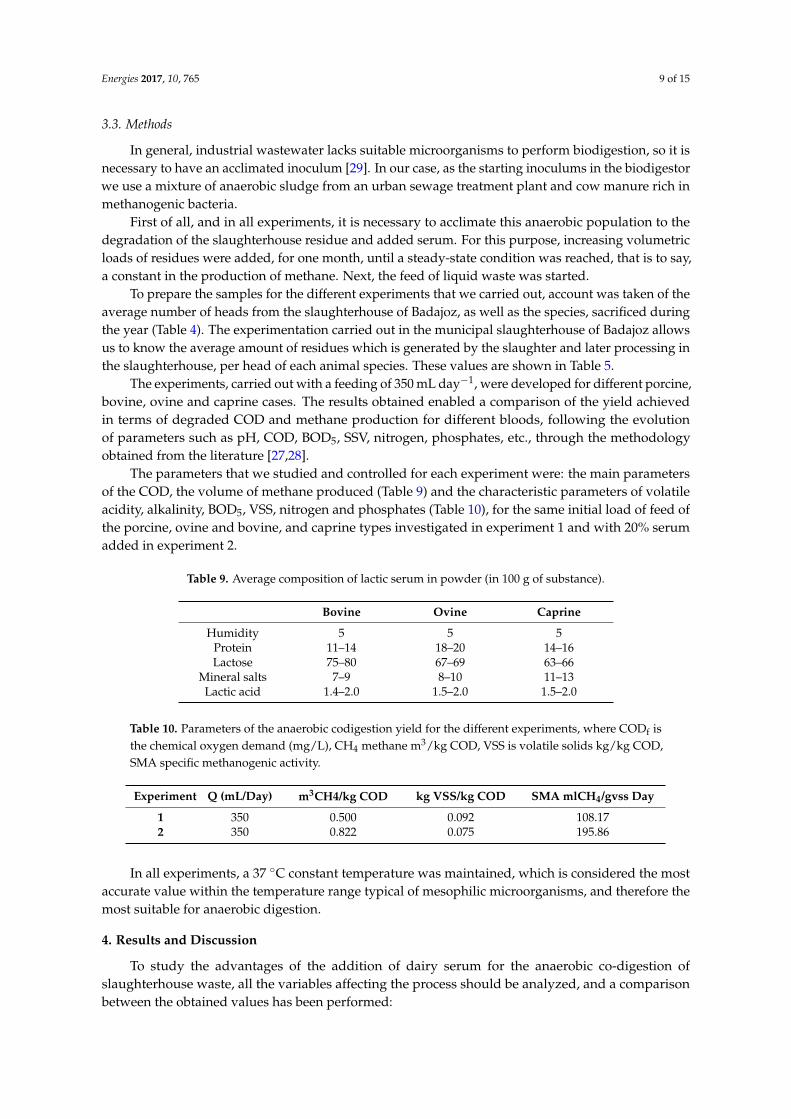
Table 9. Average composition of lactic serum in powder (in 100 g of substance).
Bovine Ovine Caprine
Humidity 5 5 5Protein 11–14 18–20 14–16Lactose 75–80 67–69 63–66
Mineral salts 7–9 8–10 11–13Lactic acid 1.4–2.0 1.5–2.0 1.5–2.0
Table 10. Parameters of the anaerobic codigestion yield for the different experiments, where CODf isthe chemical oxygen demand (mg/L), CH4 methane m3/kg COD, VSS is volatile solids kg/kg COD,SMA specific methanogenic activity.
Experiment Q (mL/Day) m3CH4/kg COD kg VSS/kg COD SMA mlCH4/gvss Day
1 350 0.500 0.092 108.172 350 0.822 0.075 195.86
In all experiments, a 37 ◦C constant temperature was maintained, which is considered the mostaccurate value within the temperature range typical of mesophilic microorganisms, and therefore themost suitable for anaerobic digestion.
4. Results and Discussion
To study the advantages of the addition of dairy serum for the anaerobic co-digestion ofslaughterhouse waste, all the variables affecting the process should be analyzed, and a comparisonbetween the obtained values has been performed:
Energies 2017, 10, 765 10 of 15
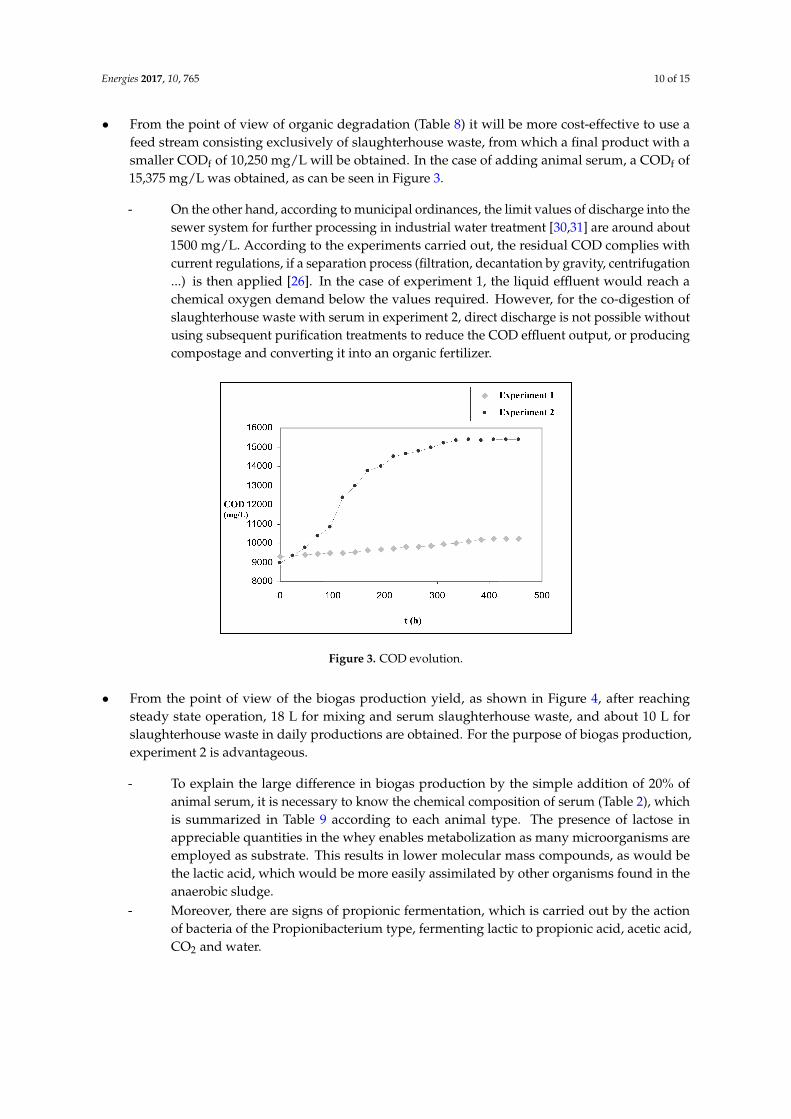
• From the point of view of organic degradation (Table 8) it will be more cost-effective to use afeed stream consisting exclusively of slaughterhouse waste, from which a final product with asmaller CODf of 10,250 mg/L will be obtained. In the case of adding animal serum, a CODf of15,375 mg/L was obtained, as can be seen in Figure 3.
- On the other hand, according to municipal ordinances, the limit values of discharge into thesewer system for further processing in industrial water treatment [30,31] are around about1500 mg/L. According to the experiments carried out, the residual COD complies withcurrent regulations, if a separation process (filtration, decantation by gravity, centrifugation...) is then applied [26]. In the case of experiment 1, the liquid effluent would reach achemical oxygen demand below the values required. However, for the co-digestion ofslaughterhouse waste with serum in experiment 2, direct discharge is not possible withoutusing subsequent purification treatments to reduce the COD effluent output, or producingcompostage and converting it into an organic fertilizer.Energies 2017, 10, 765 10 of 14
Figure 3. COD evolution.
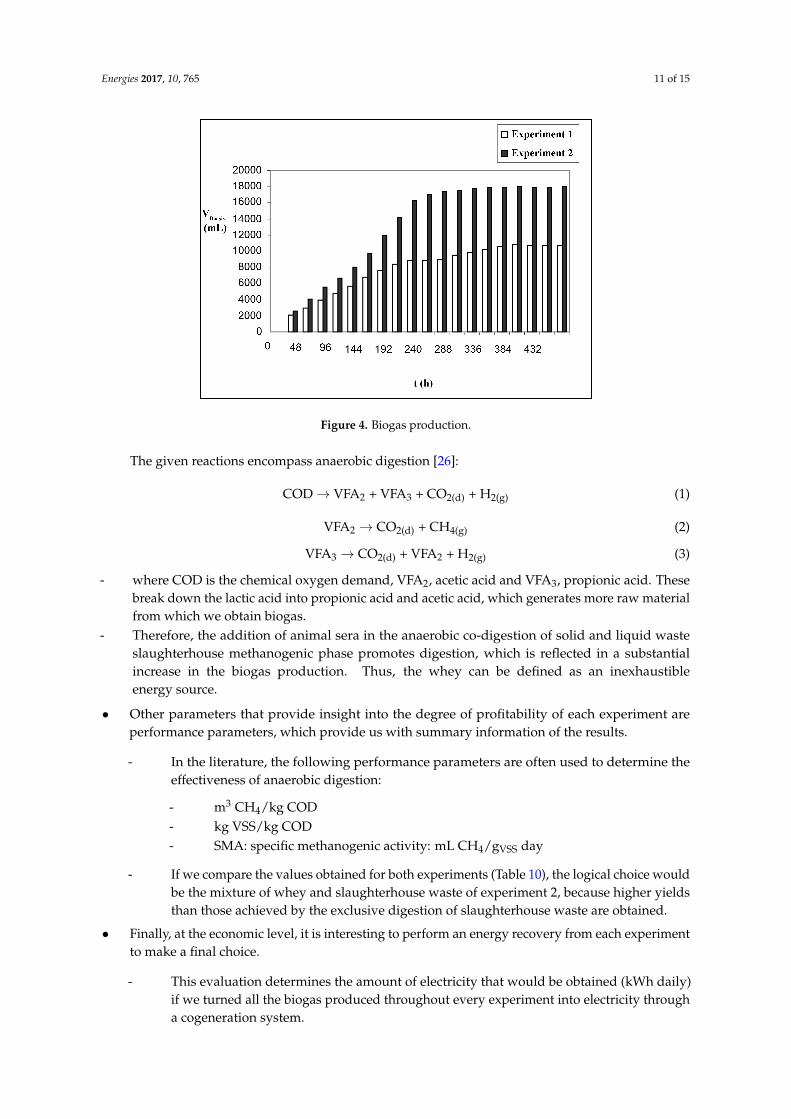
• From the point of view of the biogas production yield, as shown in Figure 4, after reaching steady state operation, 18 L for mixing and serum slaughterhouse waste, and about 10 L for slaughterhouse waste in daily productions are obtained. For the purpose of biogas production, experiment 2 is advantageous.
Figure 4. Biogas production.
- To explain the large difference in biogas production by the simple addition of 20% of animal serum, it is necessary to know the chemical composition of serum (Table 2), which is summarized in Table 9 according to each animal type. The presence of lactose in appreciable quantities in the whey enables metabolization as many microorganisms are employed as substrate. This results in lower molecular mass compounds, as would be the lactic acid, which would be more easily assimilated by other organisms found in the anaerobic sludge.
- Moreover, there are signs of propionic fermentation, which is carried out by the action of bacteria of the Propionibacterium type, fermenting lactic to propionic acid, acetic acid, CO2 and water.
The given reactions encompass anaerobic digestion [26]:
Figure 3. COD evolution.
• From the point of view of the biogas production yield, as shown in Figure 4, after reachingsteady state operation, 18 L for mixing and serum slaughterhouse waste, and about 10 L forslaughterhouse waste in daily productions are obtained. For the purpose of biogas production,experiment 2 is advantageous.
- To explain the large difference in biogas production by the simple addition of 20% ofanimal serum, it is necessary to know the chemical composition of serum (Table 2), whichis summarized in Table 9 according to each animal type. The presence of lactose inappreciable quantities in the whey enables metabolization as many microorganisms areemployed as substrate. This results in lower molecular mass compounds, as would bethe lactic acid, which would be more easily assimilated by other organisms found in theanaerobic sludge.
- Moreover, there are signs of propionic fermentation, which is carried out by the actionof bacteria of the Propionibacterium type, fermenting lactic to propionic acid, acetic acid,CO2 and water.
Energies 2017, 10, 765 11 of 15
Energies 2017, 10, 765 10 of 14
Figure 3. COD evolution.
• From the point of view of the biogas production yield, as shown in Figure 4, after reaching steady state operation, 18 L for mixing and serum slaughterhouse waste, and about 10 L for slaughterhouse waste in daily productions are obtained. For the purpose of biogas production, experiment 2 is advantageous.
Figure 4. Biogas production.
- To explain the large difference in biogas production by the simple addition of 20% of animal serum, it is necessary to know the chemical composition of serum (Table 2), which is summarized in Table 9 according to each animal type. The presence of lactose in appreciable quantities in the whey enables metabolization as many microorganisms are employed as substrate. This results in lower molecular mass compounds, as would be the lactic acid, which would be more easily assimilated by other organisms found in the anaerobic sludge.
- Moreover, there are signs of propionic fermentation, which is carried out by the action of bacteria of the Propionibacterium type, fermenting lactic to propionic acid, acetic acid, CO2 and water.
The given reactions encompass anaerobic digestion [26]:
Figure 4. Biogas production.
The given reactions encompass anaerobic digestion [26]:
COD→ VFA2 + VFA3 + CO2(d) + H2(g) (1)
VFA2 → CO2(d) + CH4(g) (2)
VFA3 → CO2(d) + VFA2 + H2(g) (3)
- where COD is the chemical oxygen demand, VFA2, acetic acid and VFA3, propionic acid. Thesebreak down the lactic acid into propionic acid and acetic acid, which generates more raw materialfrom which we obtain biogas.
- Therefore, the addition of animal sera in the anaerobic co-digestion of solid and liquid wasteslaughterhouse methanogenic phase promotes digestion, which is reflected in a substantialincrease in the biogas production. Thus, the whey can be defined as an inexhaustibleenergy source.
• Other parameters that provide insight into the degree of profitability of each experiment areperformance parameters, which provide us with summary information of the results.
- In the literature, the following performance parameters are often used to determine theeffectiveness of anaerobic digestion:
- m3 CH4/kg COD- kg VSS/kg COD- SMA: specific methanogenic activity: mL CH4/gVSS day
- If we compare the values obtained for both experiments (Table 10), the logical choice wouldbe the mixture of whey and slaughterhouse waste of experiment 2, because higher yieldsthan those achieved by the exclusive digestion of slaughterhouse waste are obtained.
• Finally, at the economic level, it is interesting to perform an energy recovery from each experimentto make a final choice.
- This evaluation determines the amount of electricity that would be obtained (kWh daily)if we turned all the biogas produced throughout every experiment into electricity througha cogeneration system.
Energies 2017, 10, 765 12 of 15
- (a) Yield parameters. Table 10 lists the yield parameters for the two experiments.- Of the two experiments performed, a higher yield was obtained in experiment 2 than in
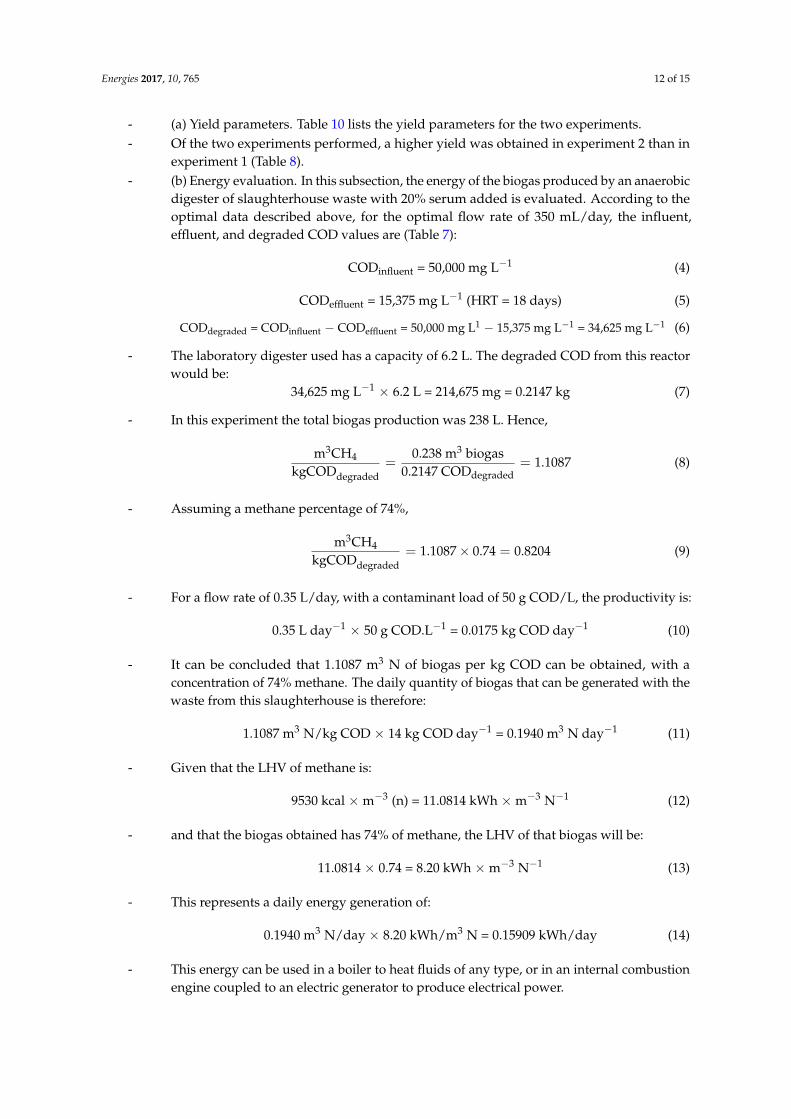
experiment 1 (Table 8).- (b) Energy evaluation. In this subsection, the energy of the biogas produced by an anaerobic
digester of slaughterhouse waste with 20% serum added is evaluated. According to theoptimal data described above, for the optimal flow rate of 350 mL/day, the influent,effluent, and degraded COD values are (Table 7):
CODinfluent = 50,000 mg L−1 (4)
CODeffluent = 15,375 mg L−1 (HRT = 18 days) (5)
CODdegraded = CODinfluent − CODeffluent = 50,000 mg L1 − 15,375 mg L−1 = 34,625 mg L−1 (6)
- The laboratory digester used has a capacity of 6.2 L. The degraded COD from this reactorwould be:
34,625 mg L−1 × 6.2 L = 214,675 mg = 0.2147 kg (7)
- In this experiment the total biogas production was 238 L. Hence,
m3CH4
kgCODdegraded=
0.238 m3 biogas0.2147 CODdegraded
= 1.1087 (8)
- Assuming a methane percentage of 74%,
m3CH4
kgCODdegraded= 1.1087× 0.74 = 0.8204 (9)
- For a flow rate of 0.35 L/day, with a contaminant load of 50 g COD/L, the productivity is:
0.35 L day−1 × 50 g COD.L−1 = 0.0175 kg COD day−1 (10)
- It can be concluded that 1.1087 m3 N of biogas per kg COD can be obtained, with aconcentration of 74% methane. The daily quantity of biogas that can be generated with thewaste from this slaughterhouse is therefore:
1.1087 m3 N/kg COD × 14 kg COD day−1 = 0.1940 m3 N day−1 (11)
- Given that the LHV of methane is:
9530 kcal ×m−3 (n) = 11.0814 kWh ×m−3 N−1 (12)
- and that the biogas obtained has 74% of methane, the LHV of that biogas will be:
11.0814 × 0.74 = 8.20 kWh ×m−3 N−1 (13)
- This represents a daily energy generation of:
0.1940 m3 N/day × 8.20 kWh/m3 N = 0.15909 kWh/day (14)
- This energy can be used in a boiler to heat fluids of any type, or in an internal combustionengine coupled to an electric generator to produce electrical power.
Energies 2017, 10, 765 13 of 15
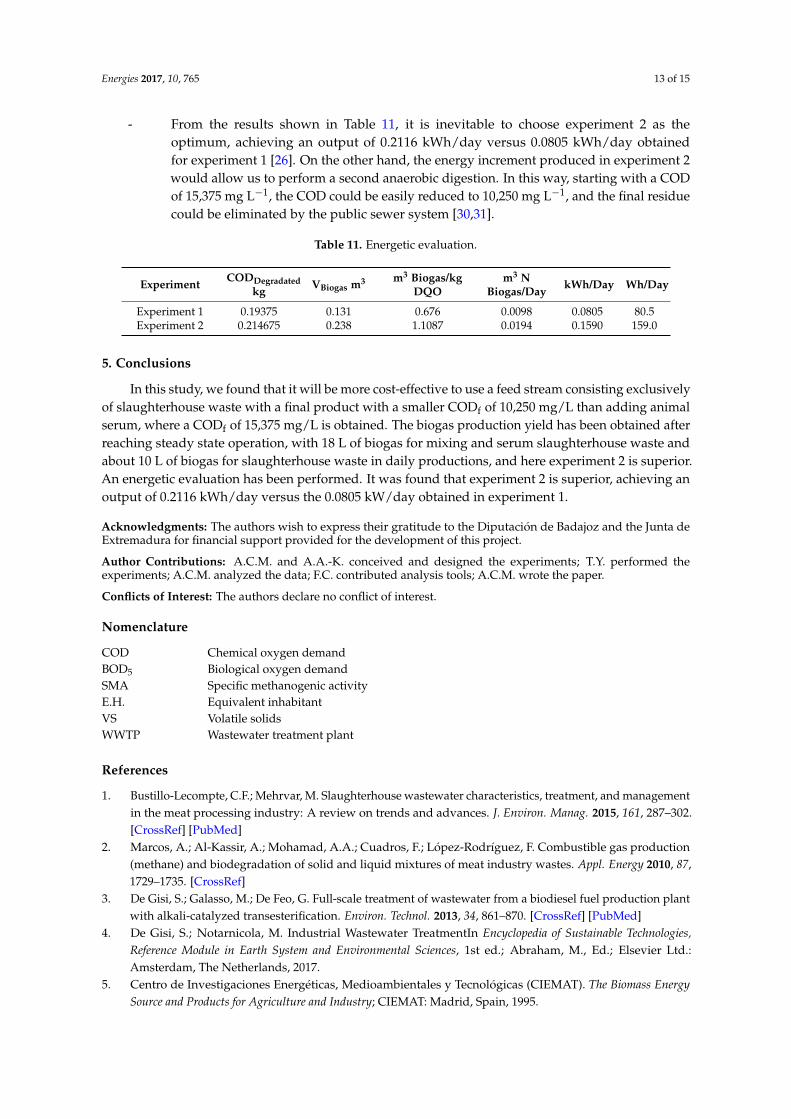
- From the results shown in Table 11, it is inevitable to choose experiment 2 as theoptimum, achieving an output of 0.2116 kWh/day versus 0.0805 kWh/day obtainedfor experiment 1 [26]. On the other hand, the energy increment produced in experiment 2would allow us to perform a second anaerobic digestion. In this way, starting with a CODof 15,375 mg L−1, the COD could be easily reduced to 10,250 mg L−1, and the final residuecould be eliminated by the public sewer system [30,31].
Table 11. Energetic evaluation.
Experiment CODDegradatedkg VBiogas m3 m3 Biogas/kg
DQOm3 N
Biogas/DaykWh/Day Wh/Day
Experiment 1 0.19375 0.131 0.676 0.0098 0.0805 80.5Experiment 2 0.214675 0.238 1.1087 0.0194 0.1590 159.0
5. Conclusions
In this study, we found that it will be more cost-effective to use a feed stream consisting exclusivelyof slaughterhouse waste with a final product with a smaller CODf of 10,250 mg/L than adding animalserum, where a CODf of 15,375 mg/L is obtained. The biogas production yield has been obtained afterreaching steady state operation, with 18 L of biogas for mixing and serum slaughterhouse waste andabout 10 L of biogas for slaughterhouse waste in daily productions, and here experiment 2 is superior.An energetic evaluation has been performed. It was found that experiment 2 is superior, achieving anoutput of 0.2116 kWh/day versus the 0.0805 kW/day obtained in experiment 1.
Acknowledgments: The authors wish to express their gratitude to the Diputación de Badajoz and the Junta deExtremadura for financial support provided for the development of this project.
Author Contributions: A.C.M. and A.A.-K. conceived and designed the experiments; T.Y. performed theexperiments; A.C.M. analyzed the data; F.C. contributed analysis tools; A.C.M. wrote the paper.
Conflicts of Interest: The authors declare no conflict of interest.
Nomenclature
COD Chemical oxygen demandBOD5 Biological oxygen demandSMA Specific methanogenic activityE.H. Equivalent inhabitantVS Volatile solidsWWTP Wastewater treatment plant
References
1. Bustillo-Lecompte, C.F.; Mehrvar, M. Slaughterhouse wastewater characteristics, treatment, and managementin the meat processing industry: A review on trends and advances. J. Environ. Manag. 2015, 161, 287–302.[CrossRef] [PubMed]
2. Marcos, A.; Al-Kassir, A.; Mohamad, A.A.; Cuadros, F.; López-Rodríguez, F. Combustible gas production(methane) and biodegradation of solid and liquid mixtures of meat industry wastes. Appl. Energy 2010, 87,1729–1735. [CrossRef]
3. De Gisi, S.; Galasso, M.; De Feo, G. Full-scale treatment of wastewater from a biodiesel fuel production plantwith alkali-catalyzed transesterification. Environ. Technol. 2013, 34, 861–870. [CrossRef] [PubMed]
4. De Gisi, S.; Notarnicola, M. Industrial Wastewater TreatmentIn Encyclopedia of Sustainable Technologies,Reference Module in Earth System and Environmental Sciences, 1st ed.; Abraham, M., Ed.; Elsevier Ltd.:Amsterdam, The Netherlands, 2017.
5. Centro de Investigaciones Energéticas, Medioambientales y Tecnológicas (CIEMAT). The Biomass EnergySource and Products for Agriculture and Industry; CIEMAT: Madrid, Spain, 1995.
Energies 2017, 10, 765 14 of 15
6. Mekonnen, M.M.; Hoeskstra, A.Y. A global assessment of the water footprint of farm animal products.Ecosystems 2012, 15, 401–415. [CrossRef]
7. Gerbens-Leenes, P.W.; Mekonnen, M.M.; Hoekstra, A.Y. The water footprint of poultry, pork and beef:A comparative study in different countries and production systems. Water Resour. Ind. 2013, 1, 25–36.[CrossRef]
8. Cao, W.; Mehvar, M. Slaughterhouse wastewater treatment by combined anaerobic baffled reactor andUV/H2O2 processes. Chem. Eng. Res. Des. 2011, 89, 1136–1143. [CrossRef]
9. Chan, Y.J.; Chong, M.F.; Law, C.L.; Hassell, D. A review on anaerobic-aerobic treatment of industrial andmunicipal wastewater. Chem. Eng. J. 2009, 155, 1–18. [CrossRef]
10. Perle, M.; Kimchie, S.; Shelef, G. Somebiochemical aspects of the anaerobic degradation of dairy wastewater.Water Res. 1995, 29, 1549–1554. [CrossRef]
11. Kasapgil, B.; Anderson, G.K.; Ince, O. An investigation into the pretreatment of dairy wastewater prior toaerobic biological treatment. Water Sci. 1994, 29, 205–212.
12. Demirel, B.; Yenigun, O.; Onay, T.T. Anaerobic treatment of dairy wastewaters: A review. Process Biochem.2005, 40, 2583–2595. [CrossRef]
13. Sharkar, B.; Chakrabarti, P.P.; Vijaykumar, A.; Kale, V. Wastewater treatment in dairy industries—Possibilityof reuse. Desalination 2006, 195, 141–152. [CrossRef]
14. Molino, A.; Nanna, F.; Ding, Y.; Bikson, B.; Braccio, G. Biomethane production by anaerobic digestion oforganic waste. Fuel 2013, 103, 1003–1009. [CrossRef]
15. Fantin, V.; Giulano, A.; Manfredi, M.; Ottaviano, G. Environmental assessment of electricity generation froman Italian anaerobic digestion plant. Biomass Bioenergy 2015, 83, 422–435. [CrossRef]
16. Molino, A.; Nanna, F.; Villone, A.; Iovane, P.; Tarquini, P.; Migliori, M.; Giordano, G.; Braccio, G. Pressureand time effect over semi-continuous gasification of zootechnical sludge near critical condition of water forgreen chemicals production. Fuel 2014, 136, 172–176. [CrossRef]
17. Molino, A.; Nanna, F.; Iovane, P. Low pressure biomethane production by anaerobic digestion (AD) for thesmart grid injection. Fuel 2015, 154, 319–325. [CrossRef]
18. Ware, A.; Power, N. Biogas from cattle slaughterhouse waste: Energy recovery towards an energyself-sufficient industry in Ireland. Renew. Energy 2016, 97, 541–549. [CrossRef]
19. Ministerio de Agricultura, Pesca y Alimentación, MAPA Anuario de Estadística. Available online: http://www.mapama.gob.es (accessed on 20 May 2017).
20. Saddoud, A.; Hassaïri, I.; Sami, S. Anaerobic membrane reactor with phase separation for the treatment ofcheese whey. Bioresour. Technol. 2007, 98, 2102–2108. [CrossRef] [PubMed]
21. Remón, J.; Laseca, M.; García, L.; Arauzo, J. Hydrogen production from cheese whey by catalytic steamreforming: Preliminary study using lactose as a model compound. Energy Convers. Manag. 2016, 114,122–141. [CrossRef]
22. Inda, A. Queso; Organización de los Estados Americanos (OEA): Ciudad de Mexico, Mexico, 2000.23. Jelen, P. Whey processing-Utilization and productsIn Encyclopedia of Dairy Sciences, 1st ed.; Roginski, H., Ed.;
Elsevier: Oxford, UK, 2002; Volume 3, pp. 2739–2745.24. Valencia, E.; Ramírez, M. La industria de la leche y la contaminación del agua. Cienc. Cult. Elem. 2009, 73,
27–31.25. Junta de Extremadura. Consejería de Medio Ambiente y Rural, Políticas Agrarias y Territorio. Available
online: http://www.juntaex.es (accessed on 20 May 2017).26. Marcos, A.; Al-Kassir, A.; López, F.; Cuadros, F.; Brito, P. Environmental treatment of slaughterhouse
wastes in a continuously stirred anaerobic reactor: Effect of flow rate variation on biogas production.Fuel Process. Technol. 2012, 103, 178–182. [CrossRef]
27. American Public Health Association (APHA); American Water Works Association (AWWA); Water PollutionControl Federation (WPCF). Standard Methods for the Examination of Water and Wastewater, 15th ed.; AmericanPublic Health Association: Washington, DC, USA, 1980.
28. Ramalho, R.S. Tratamiento de Aguas Residuales; Reverté: Barcelona, Spain, 1991.29. Vrieze, J.; Gildemyn, S.; Vilchez-Vargas, R.; Jáuregui, R.; Pieper, D.H.; Verstraete, W.; Boon, N. Inoculum
selection is crucial to ensure operational stability in anaerobic digestion. Appl. Microbiol. Biotechnol. 2015, 99,189–199. [CrossRef] [PubMed]

Energies 2017, 10, 765 15 of 15
30. Anexo, II. Ordenanzas Municipales de vertidos a la red de alcantarillados públicosIn LEY 10/1993, de 26 deOctubre, Sobre Vertidos Industriales al Sistema Integral de Saneamiento; BOCM 269, de 12-11-1993; C.E BOCM307, de 27-12-1994; Comunidad de Madrid: Madrid, Spain, 1993.
31. Ordenanza de Vertidos a la Red de Alcantarillado del Excmo, Ayuntamiento de GranadaIn. Ordenanzas deMedio Ambiente; BOP N. 129, 30/5/2000; Ayuntamiento de Granada: Granada, Spain, 2000.
© 2017 by the authors. Licensee MDPI, Basel, Switzerland. This article is an open accessarticle distributed under the terms and conditions of the Creative Commons Attribution(CC BY) license (http://creativecommons.org/licenses/by/4.0/).