Embed Size (px)
Citation preview

A WASTE TO ENERGY PLANT BASED PACKAGING COMPANY THAT WILL ESTABLISH ITS BRAND IN THE BEVERAGE INDUSTRY AND
THEN WILL EXPAND TO OTHER PRODUCTS AND INDUSTRIES | THE
WORLD’S FIRST ECO-FRIENDLY, TOXIN-FREE, TRASH ELIMINATING, CLEAN ENERGY MAKING, GREAT TASTING, NATURALLY PURE BEVERAGES!
TREESON, INC. BUSINESS PLAN
C o n f i d e n t i a l B u s i n e s s P l a n - 1 | P A G E
Table of Contents
Confidentiality Agreement .................................................................................................................4
Executive Summary ............................................................................................................................5
The Enterprise, The Business, & Model ............................................................................................. 11
Overview ................................................................................................................................................. 11
Legal Structure ........................................................................................................................................ 11
Founded .................................................................................................................................................. 11
Company Ownership ............................................................................................................................... 11
Location .................................................................................................................................................. 11
Highlights to our McCloud Millwork's Lease .......................................................................................... 12
The Business ............................................................................................................................................ 13
Products .................................................................................................................................................. 13
Our Water ............................................................................................................................................... 14
Packaging ............................................................................................................................................... 16
Our System - Recycling 2.0 ...................................................................................................................... 17
Eco Preservation Technology .................................................................................................................. 18
IP Scope & Strategy................................................................................................................................. 19
The Business Model ................................................................................................................................ 20
Revenue & Pricing ................................................................................................................................... 21
Opportunity............................................................................................................................................. 23
Objectives ............................................................................................................................................... 23
Competition ............................................................................................................................................ 24
Competitive Advantages ......................................................................................................................... 25
Unique Value Proposition ....................................................................................................................... 25
The Market Opportunity .................................................................................................................. 26
Markets and Scope ................................................................................................................................. 26
U.S. BEVERAGE MARKET ......................................................................................................................... 27
U.S. PACKAGING MARKET ....................................................................................................................... 33
Water ...................................................................................................................................................... 38
Cannabis-Infusions Open New Opportunities for Beverage-Makers ...................................................... 42
U.S. BIO FUEL MARKET ........................................................................................................................... 57
The World's Oceans & Plastic ................................................................................................................. 60
Hemp ...................................................................................................................................................... 63
M&A Transactions .................................................................................................................................. 65
Target Market ......................................................................................................................................... 65
Eco-Conscious Consumers ....................................................................................................................... 65
Average Annual Expenditures in the US ................................................................................................. 67
Demographics - United States (People & Businesses) ............................................................................ 67
C o n f i d e n t i a l B u s i n e s s P l a n - 2 | P A G E
Industry Reports & Market Analysis ................................................................................................. 69
Bottled Water Production in the US - IBISWorld Industry Report ($7.2bn) ............................................ 69
Snapshot of Energy Drink Production in the US - IBISWorld Industry Report ($8.9bn) .......................... 83
Plastic Bottle Manufacturing in the US - IBISWorld Industry Report ($13.1bn): For Comparison or Market
Share ....................................................................................................................................................... 84
Snapshot of Recycling Facilities in the US - IBISWorld Industry Report ($6.6bn).................................... 95
Snapshot Retail Trade in the US - IBISWorld Sector Report ($5.5tr) ....................................................... 96
E-Commerce & Online Auctions in the US - IBISWorld Industry Report ($512.9bn) ............................... 97
Snapshot of Internet Publishing and Broadcasting in the US - IBISWorld Industry Report ($124.7bn) .. 98
Marketing Strategy .......................................................................................................................... 99
Marketing ............................................................................................................................................... 99
Web Plan Summary .............................................................................................................................. 100
Strategic Alliances................................................................................................................................. 101
Branding & Corporate Literature .......................................................................................................... 101
Positioning Statement .......................................................................................................................... 101
Key Members of the Company/Management ................................................................................. 102
Management Team .............................................................................................................................. 102
Carlton Solle, Founder, CMO, & Owner ................................................................................................ 102
The Treeson Story: as told by Carlton Solle........................................................................................... 102
Mark Tillemans, CEO, Owner ................................................................................................................ 105
Brian Whalen ........................................................................................................................................ 105
Taylor Woods ........................................................................................................................................ 105
Mark Levitan, Legal, Key Consultant .................................................................................................... 105
Management ........................................................................................................................................ 105
Funding ......................................................................................................................................... 107
Funding ................................................................................................................................................. 107
Use Of Funds ......................................................................................................................................... 107
Exit Strategy .......................................................................................................................................... 107
Conclusion ..................................................................................................................................... 108
Pro Forma - 5 Year Financial Forecast ............................................................................................. 109
Start-up Summary/Use of Funds .......................................................................................................... 109
Assumptions.......................................................................................................................................... 110
Pro Forma Summary Chart ................................................................................................................... 110
Income (Revenue) Statement ............................................................................................................... 111
Profit & Loss Statement ........................................................................................................................ 112
Cash Flow Statement ............................................................................................................................ 114
Financial Indicators ............................................................................................................................... 114
Breakeven Analysis ............................................................................................................................... 115
Personnel .............................................................................................................................................. 115
C o n f i d e n t i a l B u s i n e s s P l a n - 3 | P A G E
Balance Sheet ....................................................................................................................................... 117
12-Month Revenue Projections ............................................................................................................ 118
12-Month Profit & Loss Statement ....................................................................................................... 119
12-Month Cash Flow Statement ........................................................................................................... 120
12-Month Balance Sheet ...................................................................................................................... 121
Financial Highlights .............................................................................................................................. 122
C o n f i d e n t i a l B u s i n e s s P l a n - 4 | P A G E
Confidentiality Agreement
This agreement is to acknowledge that the information provided by Treeson, Inc. (also referred to as “The
Company”) in this business plan is unique to this business and confidential; therefore, anyone reading this
plan agrees not to disclose any of the information in this business plan without the express written
permission of Carlton Solle & Mark Tillemans, Owners.
It is also acknowledged by the reader of this business plan that the information furnished in this business
plan, other than information that is in the public domain, may cause serious harm or damage to Treeson,
and will be kept in the strictest confidence.
Upon request, this document is to be immediately returned to Carlton Solle & Mark Tillemans, Owners.
___________________
Signature
___________________
Name (typed or printed)
___________________
Date
This is a business plan. It does not imply an offering of securities.

C o n f i d e n t i a l B u s i n e s s P l a n - 5 | P A G E
Executive Summary
Purpose The purpose of this plan is to provide investors with the information necessary to evaluate the merits of the value proposition and growth strategy of Treeson. The Company will demonstrate that there is a large enough market to service; Treeson has the effective sales and marketing strategies to establish, grow and expand the Company. Treeson will also demonstrate that the Company has eliminated or reduced as many variables of risk as possible.
Introduction Treeson, Inc. (also referred to as “The Company”) is a closed
loop1 waste to energy plant based packaging start-up company
that will establish its brand in the beverage industry and then
will expand to other products and industries.
The Company offers Treeson branded and packaged Bio Bottle
beverages that are made from plant based materials. The
Company will license the packaging, system, and technology to
other brands, and later other consumer products in the
beverage, packaging, recycling, energy, and technology
markets.
The Company has identified a number of critical approaches to
strategic development and marketing start-up efforts, assessed
alternatives, and developed a series of executable, and
cohesive but independent, categories of action to aid the
business in its core, overarching goals.
Many of these strategies will require an investment of time and
human resources over several months to achieve their
intended outcome. Projections are provided to create a
framework for developing actual implementation, based on the
business and marketing plan, and ultimately assessing the
potential impact to the revenue streams in the plan. It is
imperative that analytical tools be engaged to accurately and
appropriately assess each component of the integrated
1 A closed loop control system is a set of mechanical or electronic devices that automatically regulates a process variable to a desired state or set
point without human interaction. Closed loop control systems contrast with open loop control systems, which require manual input.- https://whatis.techtarget.com/definition/closed-loop-control-system
Treeson, Inc.
909 Mill Rd,
McCloud, CA 96057
Co-packer in Colorado
treeson.us
Ownership
Co-founder equal partners.
Revenue Forecast
Year 1: $6,700,000
Year 2: $62,900,000
Year 3: $233,800,000
Year 4: $315,630,000
Year 5: $426,100,500
Profitability Forecast
(EBITDA)
Year 1: $1,255,392
Year 2: $16,178,472
Year 3: $73,310,629
Year 4: $124,959,466
Year 5: $169,101,767
Funding Needed: $14 million
C o n f i d e n t i a l B u s i n e s s P l a n - 6 | P A G E
development effort in order to evaluate expected return on the strategic investment against actual
results.
As summarized in the following plan, the core strategies and specific tactical approaches address the
major requirements of a comprehensive strategic development and start-up initiative to grow the
business. This business plan encompasses both the spirit of the Company, as well as the functionalities of
the Company plan to map out specific strategies and tactics for development and the marketing
strategies.
Problem/Need No one wants to stumble across discarded packaging on a hike or to see plastic water bottles washed up
on their favorite beach. Awareness of the environmental impact of trash continues to grow and, while the
demand for convenience shows no sign of slowing, people seek new products that provide innovative
solutions. People want products that are not only healthy for them and their families, but also better for
the planet.
People identify with brands aligned with their own values. Brands that are authentic built by people
passionate about creating incredible products yet equally committed to making a positive impact. They
believe in brands that take a stand and they want products to deliver revolutionary, compelling solutions.
No one brand has harnessed all of the above with a simple, powerful identity. An identity that not only
helps reinforce and educate consumers about the origin and quality of its products, but also captures the
driving force and passion behind the brand.
Solution Our brand does exactly that and much more. We produce beverages using only the best natural
ingredients formulated to always deliver on our natural, healthy promise. As part of our commitment to
end to the pollution caused by single use bottles, our products come in revolutionary new packaging. Our
packaging won't end up in a landfill, a river, or the ocean but instead gets converted into green energy.
To give consumers a way to experience it all firsthand we have created the first Eco Preservation
Technology. Our technology allows customers to track their bottles and see how much clean energy they
helped create and gives them a way to see the real time impact of their actions along with options to
improve their footprint and get rewarded for doing so.
Our plan is to start with the beverage industry and then license our packaging and technology to other
beverage brands and then do it all over again with other consumer products.
Our brand can become an icon, which people will be proud to carry because it says “I’m taking a stand”.
People are ready for change and our brand is here to lead the charge!
C o n f i d e n t i a l B u s i n e s s P l a n - 7 | P A G E
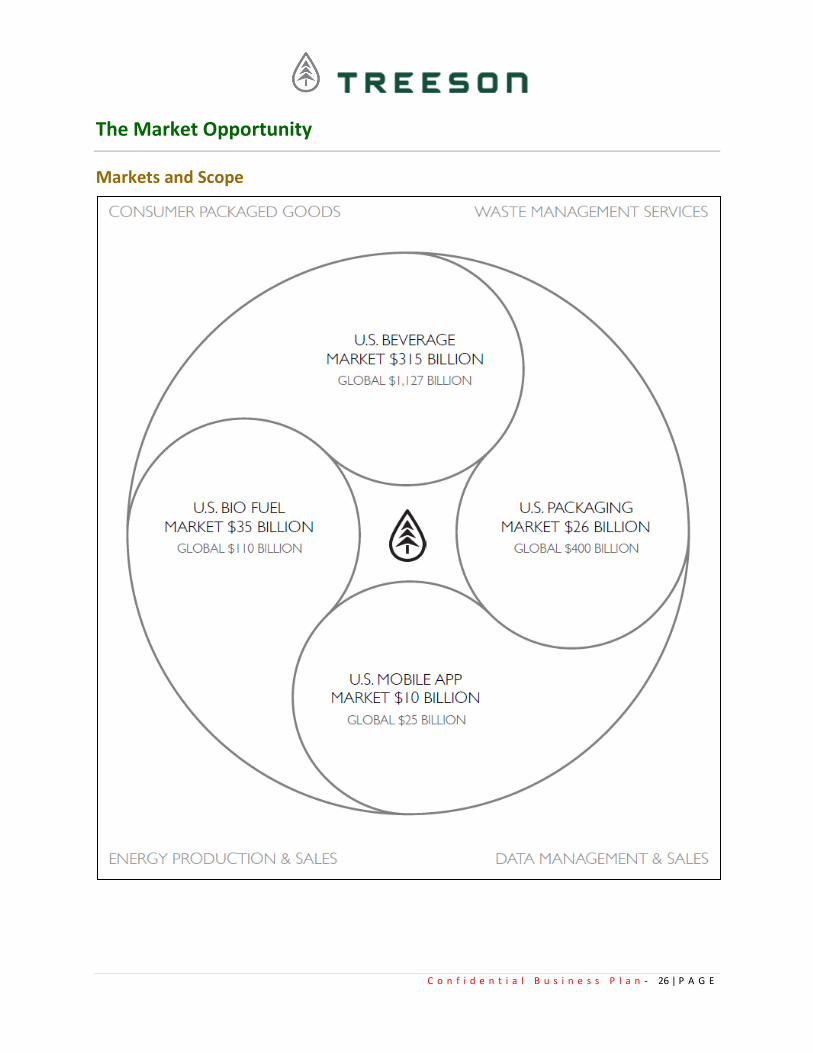
Market Opportunity Markets And Scope:2
• U.S. Beverage Market $315 Billion
• U.S. Packaging Market $26 Billion
• U.S. Mobile App Market $10 Billion
• U.S. Bio Fuel Market $35 Billion
The Bottled Water Production (the flagship product will be bottled water) industry expanded over the
five years to 2019, despite some difficult conditions. The industry adapted to changing consumer taste
preferences and consumer awareness of sustainable water sourcing and recyclable packaging materials.
Over the five years to 2019, industry revenue is expected to rise at an annualized rate of 1.0% to $7.2
billion, including a 1.6% increase in 2019 alone. Companies have focused on public relations efforts by
pledging to use sustainable bottling materials and will likely continue to market bottling operations to
emphasize its shrinking negative effect on the environment. The Bottled Water Production industry will
likely experience slow yet consistent growth over the five years to 2024; however, substitute products,
such as water filters and reusable bottles, will continue to inhibit demand for bottled water products.
Nonetheless, projected increases in per capita disposable income levels will drive consumers to make
more bottled water purchases. IBISWorld estimates industry revenue will steadily improve over the five
years to 2024, rising an annualized 1.2% to $7.7 billion.3
Business Insider citing Canaccord Genuity, says that the financial firm is predicting that cannabidiol (CBD)
beverages will become a $260 million market by 2022.4
The Plastic Bottle Manufacturing industry (For comparison) manufactures a range of bottles from various
plastic compounds based on their end use. These bottles are then sold to beverage, food and chemical
manufacturers to use as packaging for soft drinks, milk, condiments and household and automotive
chemicals. As the economy continues to grow and consumers increase their spending, downstream
customers will increase their demand for plastic bottles. Consequently, over the five years to 2024,
industry revenue is forecast to increase an annualized 0.4% to $13.4 billion.
The U.S. flexible packaging market is projected to grow from USD 23.72 billion in 2016 to USD 29.64
billion by 2021, at an estimated CAGR of 4.56%.5 On a global scale, the packaging industry is an enormous
economic generator. Statistics from the well-recognized Smithers Pica organization indicate the
world packaging industry’s market value will reach $1 trillion by 2020. According to the Flexible
Packaging Association, the United States accounts for $135 billion in the world’s entire packaging
industry. Recycled packaging is part of the worldwide sustainability movement. Federal, state, and local
authorities also promote and encourage packaging recycle programs. But the main thing driving the 2019
trend toward recycled packaging products is consumer choice. People avoid purchasing anything
2 Client provided/internal data 3 WWW.IBISWORLD.COM Bottled Water Production in the US March 2019 4 https://www.bevindustry.com/articles/91926-cannabis-infused-beverages-will-see-growth-through-2022?v=preview 5 http://www.micromarketmonitor.com/pressreleases/u-s-flexible-packaging.html
C o n f i d e n t i a l B u s i n e s s P l a n - 8 | P A G E
packaged in non-recyclable materials. Today’s consumers are far too aware of their environmental
footprint. More people than ever are joining the ecological fight and doing their part to protect their share
of the world. The packaging industry must recognize and respect consumers’ desire to maintain a
smaller carbon footprint. They can do that by making smaller and greener packages.6
The global Beverage Can Market (For comparison) is expected to reach USD 63.24 Billion by 2026,
according to a new report by Reports and Data. Growing concerns regarding the consumption of
sustainable packaging materials are expected to fuel the market. Recyclability of metal is one of the
driving factors. Aluminum cans are 100% recyclable, and approximately 30% of it is used in the beverage
market.7
The global biofuels market was valued at USD 168 billion in 2016, is expected to reach USD 218.7 billion
in 2022, and is anticipated to grow at a CAGR of 4.5% between 2017 and 2022. North America is
anticipated to account for the leading share of the revenue pie throughout the forecast horizon. The rising
awareness regarding the advantages of biofuels over conventional fuels, regulatory & political support
and agricultural and economic support along with policies pertaining to environment conservation along
with the increasing environmental concerns among the populace are contributing to the growth of the
region.8
More than 40% of U.S. consumers participate in the $300 billion conscious consumer market (CCM). In
the past decade, the growth of the CCM has not gone unnoticed by startups and established multinational
corporations.9
The United States is a world leader in consumer goods market research, product innovation,
manufacturing, and branding and marketing. The United States also has a highly skilled workforce in the
consumer products arena. In 2019, the U.S. consumer goods market (defined as consumer-packaged
goods) was the largest in the world, estimated at $635 billion, based on a comprehensive study conducted
by Statista.10
The subscription model is a booming field. In recent years, this market has grown by more than 100% a
year, increasing from $57 million in sales in 2011 to $2.6 billion in 2016, according to one expert.11
Mobile App Market is the fastest growing segment in the mobile industry. The app industry has seen an
immense growth in the past ten years and even has no end in sight. In the year 2012, mobile app’s financial
state was around $53B and it grew up to $63.7B by the year 2016. Various researchers even predict that
mobile app economy will touch $188.9 billion worldwide by the year 2020. 12
6 https://www.yorksaw.com/packaging-industry-trends/ 7 https://www.reportsanddata.com/report-detail/beverage-cans-market 8 https://www.globenewswire.com/news-release/2018/01/09/1285912/0/en/Biofuels-Market-Size-Will-Reach-USD-218-7-Billion-by-2022-Globally-Zion-Market-
Research.html 9 https://journals.sagepub.com/doi/abs/10.1177/0008125617722792?journalCode=cmra 10 https://www.selectusa.gov/consumer-goods-industry-united-states 11 https://www.gsb.stanford.edu/insights/why-every-business-will-soon-be-subscription-business 12 https://www.knowband.com/blog/mobile-app/growth-of-mobile-app-market/
C o n f i d e n t i a l B u s i n e s s P l a n - 9 | P A G E
If you invent a product that offers a benefit across many different categories, sells worldwide, and involves
consumables, the royalties can easily earn you millions.13 Licensing is a $270 billion-plus industry that
provides brands an additional stream of revenue -- in some cases serving as the primary income driver as
well as a marketing staple. That's why licensing grew over 3 percent last year. 14
Industry and Market Reports Reports below in the plan:
• Bottled Water Production in the US - IBISWorld Industry Report ($7.2bn)
• Snapshot of Energy Drink Production in the US - IBISWorld Industry Report ($8.9bn)
• Plastic Bottle Manufacturing in the US - IBISWorld Report ($13.1bn): For Comparison
• Snapshot of Recycling Facilities in the US - IBISWorld Industry Report ($6.6bn)
• Snapshot Retail Trade in the US - IBISWorld Sector Report ($5.5tr)
• E-Commerce & Online Auctions in the US - IBISWorld Industry Report ($512.9bn)
• Snapshot of Internet Publishing and Broadcasting - IBISWorld Report ($124.7bn)
Competitive Advantages/ Unique Value Proposition • Less energy, less CO2, less harm, less travel, no waste, no oil, and no GMO.
• A traditional water bottle takes an average of 12 total trips in its lifecycle before it is recycled or
ends up in a landfill, river, or ocean around the world. Treeson bottles only take 4 total trips in
their lifecycle before the Company converts them into clean energy that we use to make more
bottles!
• There is nothing like it on the planet, the demand for plant based packaging is massive, and the
industry is at its infancy.
• The Northern California location the Company has secured as our headquarters is acutely unique
(See Highlights to our McCloud Millwork's Lease) with respect to its industrial zoning, water rights,
and proximity to the West Coast marketplace.
• Treeson is one of the few companies out there that actually has a WHY…..a serious why.
• Closed loop plant-based packaging used to create clean renewable energy. Treeson will be able
to duplicate concept for basically everything on the grocery/ c-store shelf and any consumer-
packaged goods sold worldwide.
13 https://www.inc.com/stephen-key/where-big-money-is-made-licensing-product-ideas.html 14 https://www.inc.com/jeff-haden/what-every-entrepreneur-should-know-about-brand-licensing.html
C o n f i d e n t i a l B u s i n e s s P l a n - 10 | P A G E
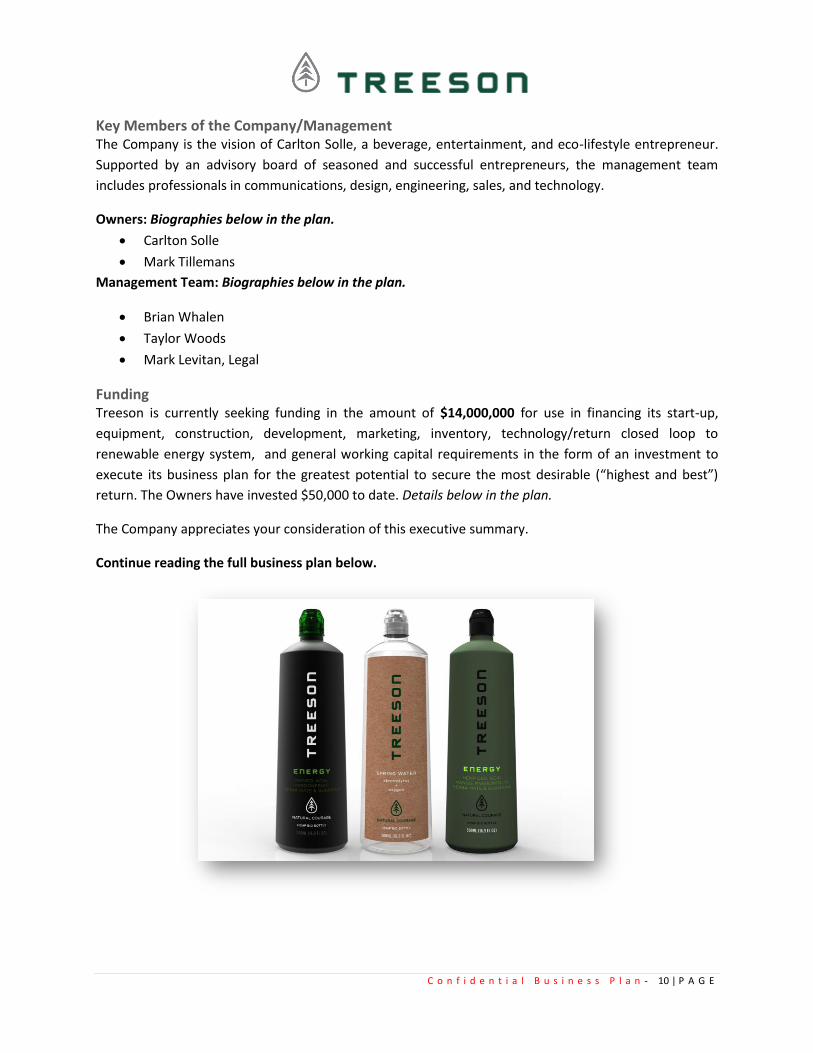
Key Members of the Company/Management The Company is the vision of Carlton Solle, a beverage, entertainment, and eco-lifestyle entrepreneur.
Supported by an advisory board of seasoned and successful entrepreneurs, the management team
includes professionals in communications, design, engineering, sales, and technology.
Owners: Biographies below in the plan.
• Carlton Solle
• Mark Tillemans
Management Team: Biographies below in the plan.
• Brian Whalen
• Taylor Woods
• Mark Levitan, Legal
Funding Treeson is currently seeking funding in the amount of $14,000,000 for use in financing its start-up,
equipment, construction, development, marketing, inventory, technology/return closed loop to
renewable energy system, and general working capital requirements in the form of an investment to
execute its business plan for the greatest potential to secure the most desirable (“highest and best”)
return. The Owners have invested $50,000 to date. Details below in the plan.
The Company appreciates your consideration of this executive summary.
Continue reading the full business plan below.

C o n f i d e n t i a l B u s i n e s s P l a n - 11 | P A G E
The Enterprise, The Business, & Model
Overview
Legal Structure
The legal structure of the Company is a Delaware C Corporation.
Assets:
• McCloud Headquarters Lease (copy available, see highlights below)
• Trademarks & IP
Founded
Incorporation in Delaware is May 2019.
Company Ownership
Mark Tillemans and Carlton Solle are the owners of the company.
Location
The Company’s current offices and contact information is:
909 Mill Rd, McCloud, CA 96057.
The Company has an 8,000 sq ft warehouse with unlimited expansion to house our return waste to energy
system and future bottling plant.
Headquarters: Map above.
Unlimited expansion capabilities on 278 acre site in northern California. Zoned heavy industrial + power
substation on-site with 3 billion gallons per year surface water rights.
C o n f i d e n t i a l B u s i n e s s P l a n - 12 | P A G E
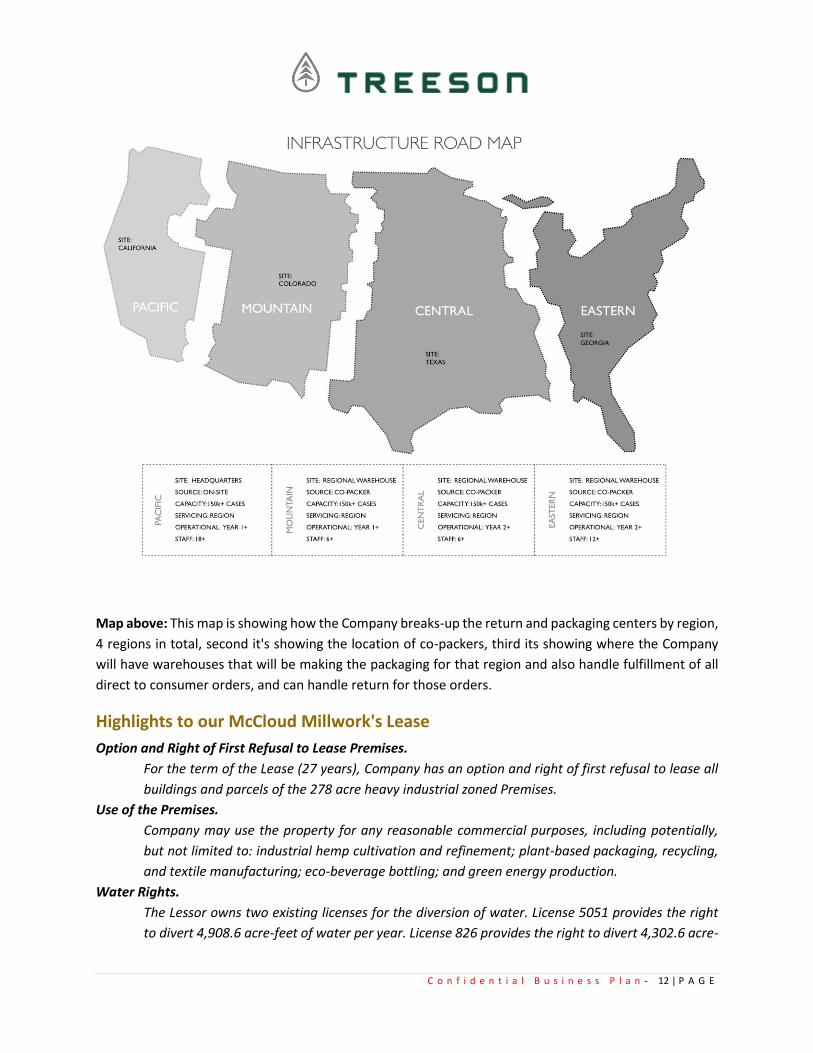
Map above: This map is showing how the Company breaks-up the return and packaging centers by region,
4 regions in total, second it's showing the location of co-packers, third its showing where the Company
will have warehouses that will be making the packaging for that region and also handle fulfillment of all
direct to consumer orders, and can handle return for those orders.
Highlights to our McCloud Millwork's Lease
Option and Right of First Refusal to Lease Premises.
For the term of the Lease (27 years), Company has an option and right of first refusal to lease all
buildings and parcels of the 278 acre heavy industrial zoned Premises.
Use of the Premises.
Company may use the property for any reasonable commercial purposes, including potentially,
but not limited to: industrial hemp cultivation and refinement; plant-based packaging, recycling,
and textile manufacturing; eco-beverage bottling; and green energy production.
Water Rights.
The Lessor owns two existing licenses for the diversion of water. License 5051 provides the right
to divert 4,908.6 acre-feet of water per year. License 826 provides the right to divert 4,302.6 acre-

C o n f i d e n t i a l B u s i n e s s P l a n - 13 | P A G E
feet of water per year with a maximum direct diversion rate of 3 billion gallons. The terms of the
McCloud Millworks Lease give the Company the right to use up to ten percent (10%) of these water
rights. These are surface water rights. There is spring water locally available, but not contracted
for or permitted at this time.
The Business
Treeson is a closed loop15 waste to energy plant based packaging start-up company that will establish its
brand in the beverage industry and then will expand to other products and industries.
Our plan is to establish our brand in the beverage space using our packaging, system, and technology, and
then license them to other brands to use and to begin to branch out into other consumer products with
the other packaging solutions the Company has already developed.
Products
Naturally Inspired + Naturally Engineered + Naturally Packaged + Naturally Harvested + Naturally
Enriched = Naturally You
Types: Natural Spring Water - Energy Drinks & Energy Shots - CBD Infused Drinks & Shots - Ready To
Drink Teas - Cold Pressed Juices - CBD Oils & Isolates - Beer & Wine
Flagship Product, Treeson Spring Water Our flagship product, Treeson Spring Water, fulfills those consumer needs. It was inspired by the rainforest
and features the finest natural spring water, enriched with electrolytes for balance and oxygen for some
natural rainforest energy. It comes in a revolutionary new packaging that combines environmentally
friendly materials with the world’s first built-in return and recycling system.
With the Companies return system, packaging can be returned individually or in bulk. The returned
packaging is instantly turned into clean energy that is used to make new bottles - starting the cycle all
over again. Additionally, we offer consumers the opportunity to make an immediate positive
environmental impact with every purchase through our “One Bottle One Tree” initiative. We plant one
tree for every bottle sold to help ensure that there will be plenty of clean air and fresh water for
generations to come.
15 A closed loop control system is a set of mechanical or electronic devices that automatically regulates a process variable to a desired state or set
point without human interaction. Closed loop control systems contrast with open loop control systems, which require manual input.- https://whatis.techtarget.com/definition/closed-loop-control-system
C o n f i d e n t i a l B u s i n e s s P l a n - 14 | P A G E
Our Water

C o n f i d e n t i a l B u s i n e s s P l a n - 15 | P A G E
The world's first eco-friendly, toxin-free, trash eliminating, clean energy making, tree planting, great
tasting, natural spring water!
C o n f i d e n t i a l B u s i n e s s P l a n - 16 | P A G E
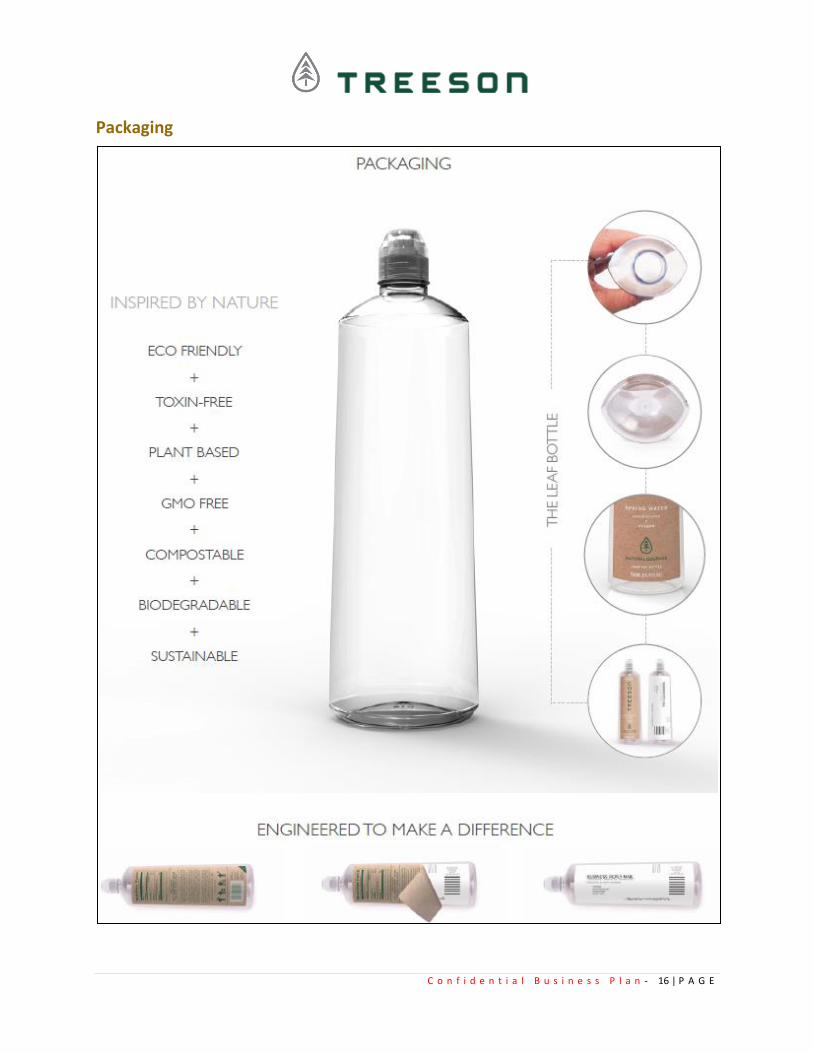
Packaging
C o n f i d e n t i a l B u s i n e s s P l a n - 17 | P A G E
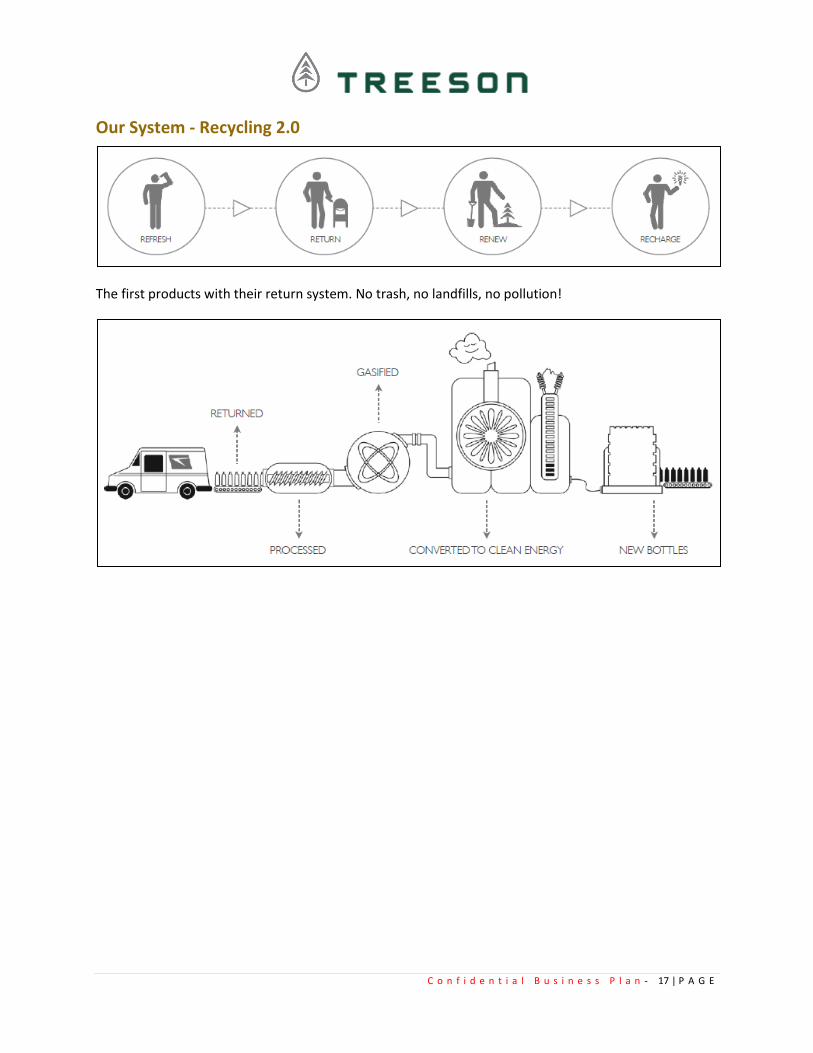
Our System - Recycling 2.0
The first products with their return system. No trash, no landfills, no pollution!
C o n f i d e n t i a l B u s i n e s s P l a n - 18 | P A G E
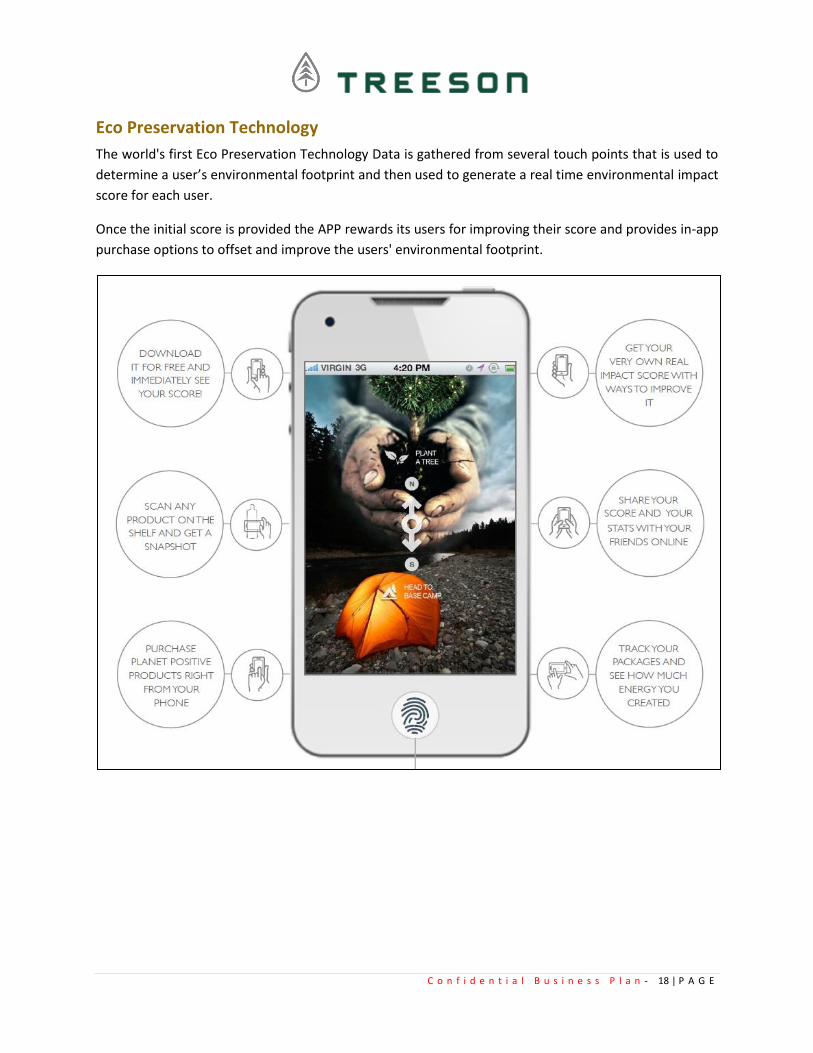
Eco Preservation Technology
The world's first Eco Preservation Technology Data is gathered from several touch points that is used to
determine a user’s environmental footprint and then used to generate a real time environmental impact
score for each user.
Once the initial score is provided the APP rewards its users for improving their score and provides in-app
purchase options to offset and improve the users' environmental footprint.
C o n f i d e n t i a l B u s i n e s s P l a n - 19 | P A G E
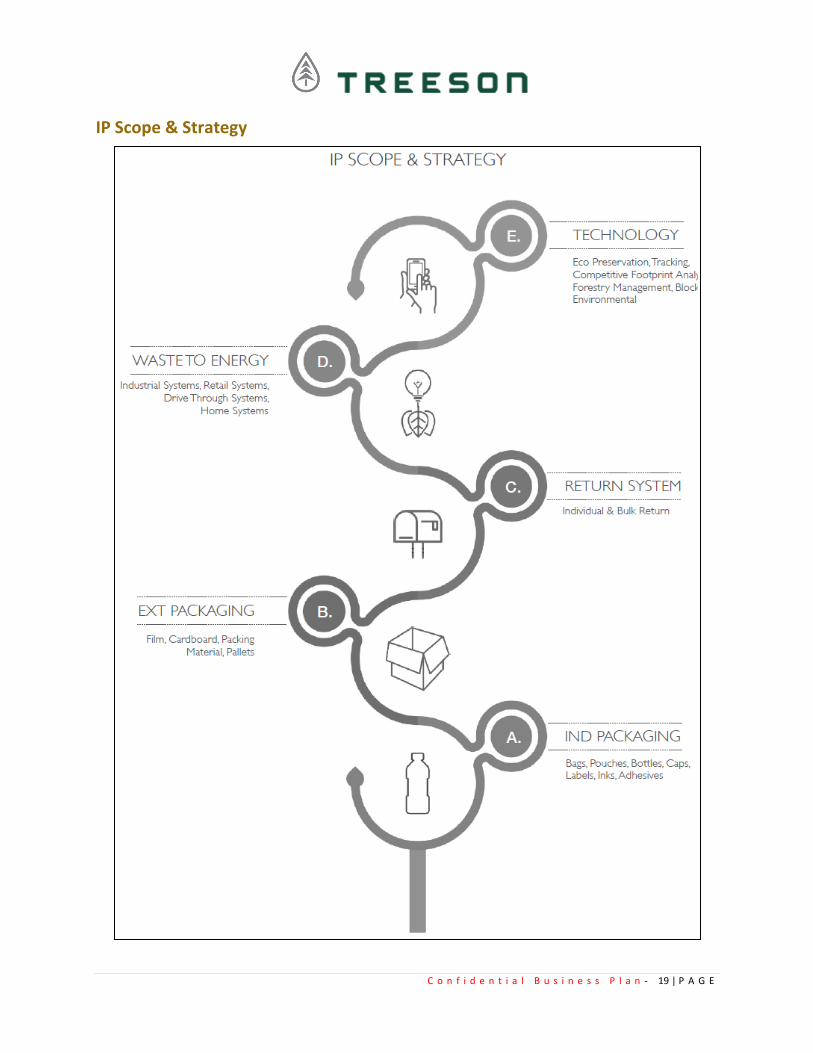
IP Scope & Strategy
C o n f i d e n t i a l B u s i n e s s P l a n - 20 | P A G E
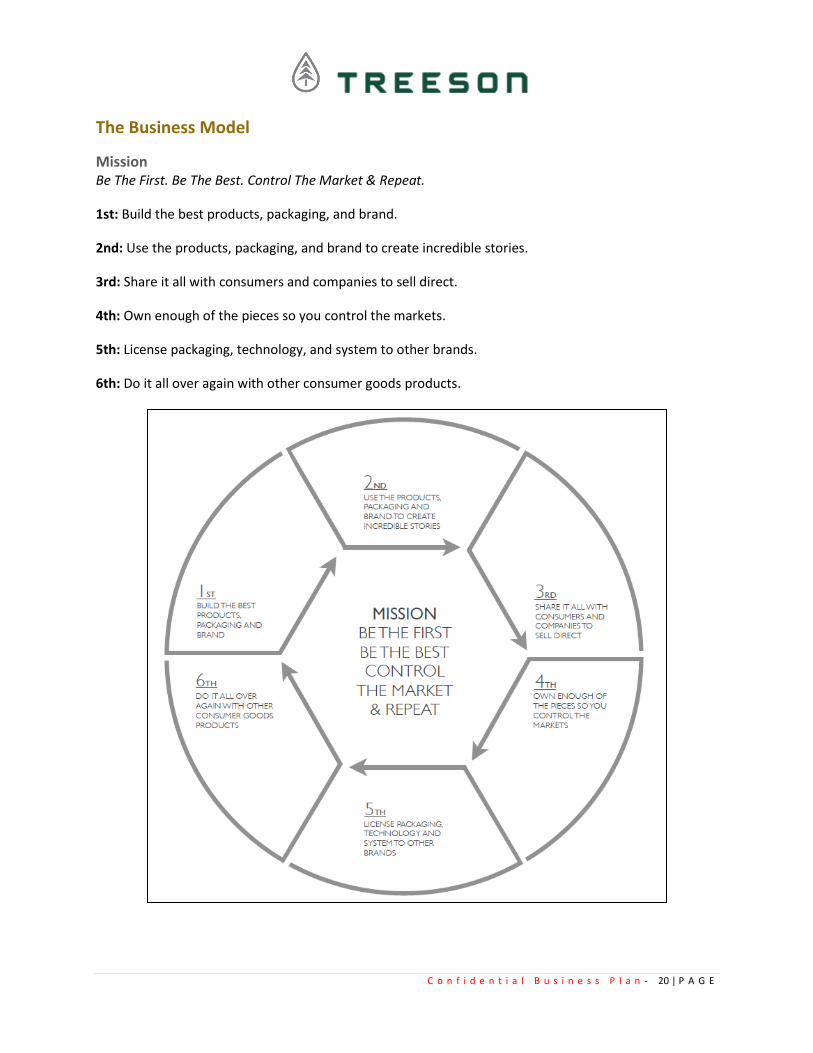
The Business Model
Mission Be The First. Be The Best. Control The Market & Repeat.
1st: Build the best products, packaging, and brand.
2nd: Use the products, packaging, and brand to create incredible stories.
3rd: Share it all with consumers and companies to sell direct.
4th: Own enough of the pieces so you control the markets.
5th: License packaging, technology, and system to other brands.
6th: Do it all over again with other consumer goods products.

C o n f i d e n t i a l B u s i n e s s P l a n - 21 | P A G E
Use our products, systems and technology to educate and tell our story direct to partners and consumers,
the more they know the better it gets and the more powerful the brand becomes, control as many pieces
as possible, then license it to other brands and expand into other markets.
Revenue & Pricing
The Company projects a gradual ramp up of sales and profits during the first year of transition to the
business model.
The Company will sell products retail and on a subscription basis. See pro forma for details.
Our Subscription Service: Direct To Consumer Time is precious why lug home a case of water when you can have it delivered right to your door. Our
subscription service creates a personal relationship with our customers and it allows them to see firsthand
how our system is better for the environment & it also happens to be better for the bottom line. Delivered
right to your door = best for the environment & best for the bottom line.
Subscription Business Model 16 The subscription based business model is a business model that charges customers a recurring fee —
typically monthly or yearly — to access a product or service.
Subscription revenue model: A subscription revenue model helps you capitalize on the compounding
value of customer relationships. That means that as long as your customers continually see the value your
company provides for them, they'll continue to pay you for it. Recurring revenue models lead to higher
revenues and stronger customer relationships. This compounding growth is what makes customers so
powerful here. Through subscription, customers become more valuable the longer they use your product.
The state of subscription business models in 2019: The subscription model continues to grow in
popularity. According to our research, customer acquisition costs (CAC) are up more than 50% and
willingness to pay for software has declined steadily for the past five years. There's never been a better
time to start capitalizing on your customer relationships through subscription. And it's not going away any
time soon. According to a survey by McKinsey & Company, 46% of customers already pay for an online
streaming service and 15% have subscribed to an e-commerce service within one year of the survey. That's
why companies such as GoPro and Adobe have pivoted to this business model; it's the most reliable way
to continue adding value for customers. They understand how this pricing strategy helps position them
for long-term success.
16 https://www.priceintelligently.com/blog/subscription-business-model

C o n f i d e n t i a l B u s i n e s s P l a n - 22 | P A G E
Pricing
Licensing, Partnerships, & Co-Packing We have had several companies express interest in co-branding and also licensing our bottle and
technology. Our plan is to establish our brand as the first and the premiere and then begin to license our
packaging and technology to other brands to use.
We have had several companies express interest in partnerships to utilize our system in their retail
operations and or on their corporate campuses. Our plan is to strategically select a few of them to
showcase our complete system while at the same time building our customer base and brand awareness.
C o n f i d e n t i a l B u s i n e s s P l a n - 23 | P A G E
Because of the strategic and high quality water sources we have secured we have had several other brands
express interest in using our water and having us co-pack their beverages. Once we have built out and
mastered our bottling operations our plan is to offer co-packing for other brands.
Opportunity
To give consumers a way to experience it all firsthand we have created the first Eco Preservation
Technology. Our companion mobile app allows customers to track their bottles and see how much clean
energy they helped create. They can also get actual pictures of the trees they helped plant along with the
GPS coordinates for where they are planted and watch them grow with our updates. Our mobile app
incentivizes consumers to purchase planet positive products, gives them a way to see the real time impact
of their actions along with options to improve their earth-score and get rewarded for doing so.
Our initial test market for Treeson Spring Water received international media attention. We not only
caught the eyes of some of the industry´s biggest players but also some of its biggest and most prestigious
customers and they are ready to place significant orders. Our plan is to fulfill these first orders while
putting in the necessary infrastructure required showcasing our system at scale. A full-scale launch of
Treeson Spring Water and our Mobile App will follow shortly thereafter. All products will be sold direct
through our e-commerce site, mobile app and via strategic partners in the U.S. We are already in talks
with several established partners in a handful of countries outside of the U.S. including Central America
and Europe where we will use both direct and traditional distribution models.
The Company’s growth opportunities are excellent. License packaging, technology, and system to other
brands; then do it all over again with other consumer goods products.
Objectives
Treeson has definite objectives in order to fulfill its desire to participate and achieve an ever-growing
market share of the exciting industry that it is in. What follows is a brief summary of the key objectives
of Treeson:
• Penetrate the market in the business of a waste to energy plant based packaging brand in the
beverage industry and then will license and expand to other products and industries.
• Continue to develop management and team capabilities to ensure a strong foundation for
participation in the Company.
• Increase sales and revenue at the rates projected in this plan.
• License packaging, technology, and system to other brands.
• Expand into other consumer goods products and Countries.
C o n f i d e n t i a l B u s i n e s s P l a n - 24 | P A G E
Competition
Beverage According to the Forbes Largest Companies Global 2000 list, PepsiCo Inc. (PEP), Coca Cola Co. (KO), and
Anheuser-Bush InBev (BUD) are the top three beverage companies in the world, as measured by a
composite score of revenue, profit, assets, and market value. The top 5 companies in the beverage sector
had a combined market value of $649.6 billion. 17
The world’s biggest drinks companies in 2018:18
• Anheuser-Busch InBev – $56.44bn
• The Coca-Cola Company – $35.41bn
• Pepsico – $29.85bn
• Nestle – $28.53bn
• Heineken – $ 26.21bn
• Fomento Economico Mexicano – $23.38bn
• Starbucks Corporation – $22.38bn
• Suntory Holdings – $17.4bn
• Asahi Group Holdings – $17.1bn
• Diageo – $16.43bn
Packaging North America is undisputed leader in global packaging market. As per our research findings there are
nine U.S. based corporations who rank among top 15 packaging companies in world. The ranking is
based on annual revenue reported by companies in their SEC filings/ Annual reports.19
• WestRock : USD 14.8 Billion
• International Paper Company (IPC): USD 14.49 Billion
• Reynolds Group Holdings Limited (RGHL): USD 10.5 Billion
• Ball Corporation: USD 10.01 Billion
• Smurfit Kappa ('SKG'): USD 9.93 Billion
• Amcor Limited: USD 9.3 Billion
• Crown Holdings: USD 8.69 Billion
• Mondi Plc: USD 8.23 Billion
• DS Smith plc: USD 7.4 Billion
• Berry Group, Inc.: USD 7.0 Billion
• Owens-Illinois Inc.(O-I): USD 6.8 Billion
• Packaging Corporation of America (PCA): USD 5.3 Billion
• Sealed Air Corporation (SAC): USD 4.46 Billion
• Graphic Packaging International, LLC. (GPI): USD 4.4 Billion
17 https://www.investopedia.com/news/worlds-largest-food-and-beverage-players-2017-nestle-pepsi-coke-topple-peers/ 18 https://www.drinks-insight-network.com/uncategorised/the-worlds-biggest-drinks-companies-in-2018/ 19 https://www.marketresearchreports.com/blog/2018/09/12/top-packaging-companies-revenue
C o n f i d e n t i a l B u s i n e s s P l a n - 25 | P A G E
• Stora Enso Oyj: USD 4.37 Billion
Industry Major Players Listed in the industry reports.
Competitive Advantages
Treeson will enjoy a number of significant, competitive advantages over its competitors, including the
following:
• Less energy, less CO2, less harm, less travel, no waste, no oil, and no GMO.
• A traditional water bottle takes an average of 12 total trips in its lifecycle before it is recycled or
ends up in a landfill, river, or ocean around the world. Treeson bottles only take 4 total trips in
their lifecycle before the Company converts them into clean energy that we use to make more
bottles!
Unique Value Proposition
Treeson will differentiate itself by offering:
• Less energy, less CO2, less harm, less travel, no waste, no oil, and no GMO.
• A traditional water bottle takes an average of 12 total trips in its lifecycle before it is recycled or
ends up in a landfill, river, or ocean around the world. Treeson bottles only take 4 total trips in
their lifecycle before the Company converts them into clean energy that we use to make more
bottles!
• There is nothing like it on the planet, the demand for plant based packaging is massive, and the
industry is at its infancy.
• The Northern California location the Company has secured as our headquarters is acutely unique
(See Highlights to our McCloud Millwork's Lease) with respect to its industrial zoning, water rights,
and proximity to the West Coast marketplace.
• Treeson is one of the few companies out there that actually has a WHY…..a serious why.
• Closed loop plant-based packaging used to create clean renewable energy. Treeson will be able
to duplicate concept for basically everything on the grocery/ c-store shelf and any consumer-
packaged goods sold worldwide.
Ultimately, the value proposition will deliver tangible results impacting:
• Steadily increasing revenues for the business
• Increased conscious consumers
• Steadily improving relationships for both business and consumers
• Steadily increasing market share for the business
• Strong customer retention levels for the business
C o n f i d e n t i a l B u s i n e s s P l a n - 26 | P A G E
The Market Opportunity
Markets and Scope
C o n f i d e n t i a l B u s i n e s s P l a n - 27 | P A G E
U.S. BEVERAGE MARKET
Food & Beverages United States20
• Revenue in the Food & Beverages segment amounts to US$18,374m in 2019.
• Revenue is expected to show an annual growth rate (CAGR 2019-2023) of 11.0%, resulting in a
market volume of US$27,872m by 2023.
• User penetration is 49.7% in 2019 and is expected to hit 64.8% by 2023.
• The average revenue per user (ARPU) currently amounts to US$112.41.
• Users by age in percent: 33.0% of users are 25-34 years old.
• Users by gender: 54.1% of users are male.
• Users by income: 37.7% of users have high income and 35.2% have mid-level/medium incomes.
Global Comparison - Revenue:
Top 5
China US$21,945m
United States US$18,374m
Japan US$16,618m
United Kingdom US$13,378m
South Korea US$9,372m
Top 5 online stores by net sales:
• amazon.com: Net sales (2018) US$1,476.9m
• walmart.com: Net sales (2018) US$953.3m
• ediblearrangements.com: Net sales (2018) US$456.5m
• costco.co: Net sales (2018) US$398.2m
• target.com: Net sales (2018) US$241.1m
Non-alcoholic Beverages and Soft Drinks - Statistics & Facts 21
The non-alcoholic beverages industry encompasses liquid refreshment beverages (LRB) such as bottled
water, carbonated soft drinks, energy drinks, fruit beverages, ready-to-drink coffee, and tea, sports
beverages, and value-added water.
20 https://www.statista.com/outlook/253/109/food-beverages/united-states 21 https://www.statista.com/topics/1662/non-alcoholic-beverages-and-soft-drinks-in-the-us/- Aug 23, 2018

C o n f i d e n t i a l B u s i n e s s P l a n - 28 | P A G E
Important key figures
Liquid refreshment beverages (LRB)
Sales volume growth of bottled water in the U.S., 7%
Sales volume of water in the U.S. (in 192-oz cases), 6,430m
Sales volume of juice drinks worldwide, 14bn cases
Volume sales share of sports/energy drinks, 3%
Market size of soft drinks in the U.S., 98,429m USD
Price growth of ready-to-drink tea in the U.S., 1.5%
Carbonated soft drinks (CSD)
Carbonated soft drink volume of North America, 51.16bn
Per capita consumption of soft drinks in the U.S., 39.25 gal
Per capita consumption of CSD in the U.S. (in 8-ounce servings), 628
Per capita consumption growth of CSD in the U.S., -2%
Market share of cola-flavored CSD in the U.S., 50.7%
Market share of Coca-Cola Co. in the U.S., 42.8%
Leading CSD brands
Leading carbonated Beverage Company worldwide, based on market share, Coca-Cola Co.
Brand value of Coca-Cola worldwide, 66,042m USD
Global revenue of Red Bull, 6.28bn EUR
Net operating revenue of the Coca-Cola Company worldwide, 31.86bn USD
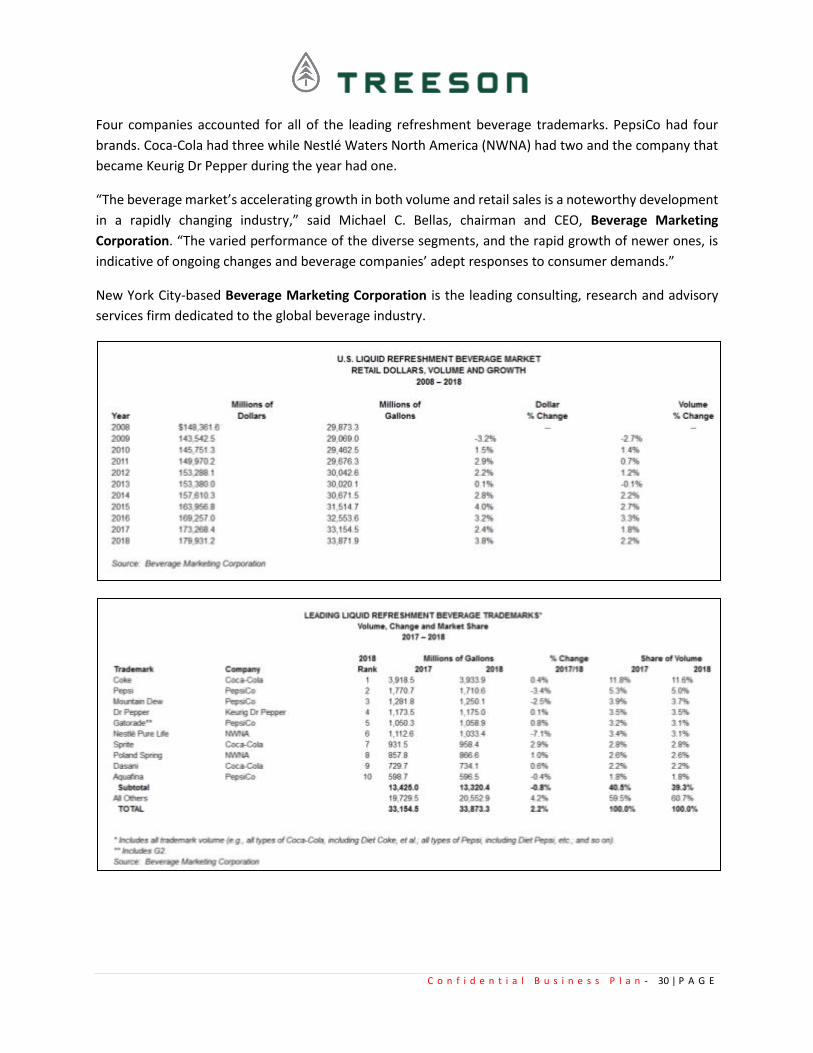
U.S. Liquid Refreshment Beverage Market Retail Dollars And Volume Growth Rates Accelerated In
2018, Reports Beverage Marketing Corporation 22
22 https://www.globenewswire.com/news-release/2019/05/15/1825401/0/en/U-S-LIQUID-REFRESHMENT-BEVERAGE-MARKET-RETAIL-
DOLLARS-AND-VOLUME-GROWTH-RATES-ACCELERATED-IN-2018-REPORTS-BEVERAGE-MARKETING-CORPORATION.html
C o n f i d e n t i a l B u s i n e s s P l a n - 29 | P A G E
(GLOBE NEWSWIRE): The U.S. liquid refreshment beverage market grew again in 2018, with retail sales
increasing by 3.8% and volume by 2.2%, according to newly released preliminary data from Beverage
Marketing Corporation. By both measures, the market grew faster than it had the year before. Specifically
beverage-related factors, such as the enduring robustness of the sizeable bottled water segment, as well
as more general ones, such as continuing economic growth, contributed to the overall increase in liquid
refreshment beverage volume, which neared 33.9 billion gallons in 2018. In terms of retail sales, the
market approached $180 billion, propelled both by the fast growth of small, niche segments as well as
solid growth by bigger, established categories, including carbonated soft drinks. All but one segment of
the liquid refreshment beverage market enlarged retail sales in 2018, with ready-to-drink coffee and tea,
bottled water (conventional and value-added), energy drinks, sports drinks and carbonated soft drinks
showing growth, and only fruit beverages declining.
Bottled water, which surpassed carbonated soft drinks to become the number-one beverage by volume
in 2016, grew again in 2018 but at slower rates than in prior years. The category’s essential qualities –
healthful, natural, calorie-free, and convenient – reliably appeal to U.S. consumers. Volume enlarged by
almost 5% and retail sales advanced by more than 7%.
While smaller in retail size, niche segments once again outperformed most traditional mass-market ones.
With regards to both volume and dollars, value-added water, energy drinks, and ready-to-drink (RTD)
coffee in particular moved forcefully in 2018. Indeed, value-added water outshined all other segments
with a 15.5% increase in volume and a 16.6% increase in retail dollars. No other segment saw double-digit
growth rates in either volume or dollars, but energy drinks and RTD coffee moved up with rates in the
high single digits. Fruit beverages, in contrast, experienced contraction in both volume and dollars.
Carbonated soft drinks’ retail dollar sales grew by 2.4% even as volume declined slightly as beverage
companies continued to downsize packages and introduce more no-sugar offerings in response to
consumers’ desire for less sugar.
Despite their growth, no energy drink, RTD coffee or value-added water brand ranked among the leading
trademarks by volume. (No fruit beverage brand did either.)
Sports beverages, on the other hand, had Gatorade (including all brand variations) as the fifth largest
liquid refreshment beverage trademark during the year with volume greater than 1 billion gallons.
Carbonated soft drinks continued to account for four of the five top beverage brands by volume. The rate
of retail sales growth for carbonated soft drinks doubled from the prior year (up by 2.4% in 2018 compared
to 1.2% in 2017) as pricing rose. Carbonated soft drink volume performance was essentially flat at 12.2
billion gallons – the category’s best performance since 2005. Coca-Cola and Pepsi Cola retained their usual
first and second positions among the 10 leading beverage trademarks in 2018, with Mountain Dew and
Dr Pepper claiming third and fourth place. Coca-Cola and Dr Pepper both recorded modest volume growth
during the year, while Sprite (ranked seventh) grew relatively quickly.
Bottled water had four entries among the leading trademarks in 2018, but only two of them grew, and
they did so at rates slower than the overall liquid refreshment beverage category.
C o n f i d e n t i a l B u s i n e s s P l a n - 30 | P A G E
Four companies accounted for all of the leading refreshment beverage trademarks. PepsiCo had four
brands. Coca-Cola had three while Nestlé Waters North America (NWNA) had two and the company that
became Keurig Dr Pepper during the year had one.
“The beverage market’s accelerating growth in both volume and retail sales is a noteworthy development
in a rapidly changing industry,” said Michael C. Bellas, chairman and CEO, Beverage Marketing
Corporation. “The varied performance of the diverse segments, and the rapid growth of newer ones, is
indicative of ongoing changes and beverage companies’ adept responses to consumer demands.”
New York City-based Beverage Marketing Corporation is the leading consulting, research and advisory
services firm dedicated to the global beverage industry.
C o n f i d e n t i a l B u s i n e s s P l a n - 31 | P A G E
Bottled Water Bottled water remained the No. 1 beverage by volume, increasing by 7% to 13.7 billion gallons in 2017.
Retail sales jumped 11% to $18.5 billion. Annual per capita consumption of bottled water was over 42
gallons in 2017, which was ahead of 37.5 gallons for carbonated soft drinks. “Amid worries about obesity,
diabetes, heart disease and other health matters, bottled water’s lack of calories and artificial ingredients,
convenience and refreshing taste attracts health-conscious consumers,” said Joe Doss, president and chief
executive officer of the International Bottled Water Association, Alexandria, Va.23
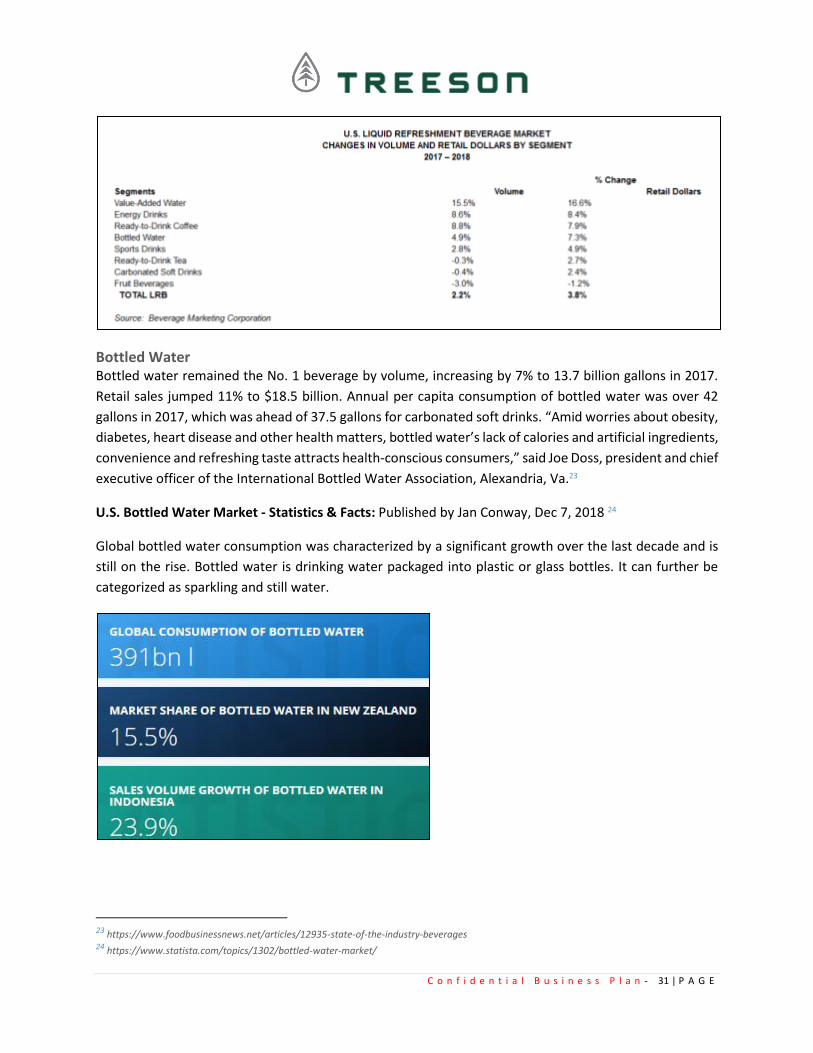
U.S. Bottled Water Market - Statistics & Facts: Published by Jan Conway, Dec 7, 2018 24
Global bottled water consumption was characterized by a significant growth over the last decade and is
still on the rise. Bottled water is drinking water packaged into plastic or glass bottles. It can further be
categorized as sparkling and still water.
23 https://www.foodbusinessnews.net/articles/12935-state-of-the-industry-beverages 24 https://www.statista.com/topics/1302/bottled-water-market/
C o n f i d e n t i a l B u s i n e s s P l a n - 32 | P A G E
Important key figures
Brand and retail facts
Value of U.S. product shipments of bottled water, 6.88bn USD
Sales share of bottled water in U.S. grocery stores, 25.6%
Sales volume of bottled water in the U.S., 13.7b gal
Sales volume growth of bottled water in the U.S., 7%
Sales of Dasani bottled still water in the U.S., 1,088.2m USD
Sales of Nestlé Waters North America's bottled water in the U.S., 2379.78m USD
Market share of Dasani's bottled still water in the U.S., 9%
Sales of Perrier sparkling water in the U.S., 277.93m USD
Consumption
Per capita consumption of bottled water in the U.S., 42.1 gal
Share of Americans who buy name-brand bottled water, 26%
Share of Americans who drink water every day, 88%
Share of Americans who drink mineral water/water while watching the Super Bowl, 30%
More Statista • The volume of bottled water in the U.S. amounted to about 13.7 billion gallons in 2017.25
• The per capita consumption of bottled water amounted to 42.1 gallons in 2017. Bottled water is
drinking water sold in plastic or glass water bottles. It can be carbonated or still. The bottled water
brand Dasani was ranked among the leading bottled still water brands in the United States that
year. The United States was also one of the largest consumer markets for bottled water, based on
per capita consumption.26
• For the 52 weeks ending August 12, 2018, private labels of bottled still water in the United States
generated about 2.78 billion U.S. dollars in sales.
• 88 percent of the respondents answered that they drink water every day.27
• 24 percent of respondents indicated that their ideal bottled water would be GMO-free.28
U.S. Bottled Water Market The United States has the biggest consumer market for bottled water worldwide. The widely consumed
beverage is regulated by the U.S. Food and Drug Administration (FDA). According to the FDA, bottled
water is intended for human consumption and comes sealed in a bottle or similar containers with no
additional ingredients. Bottled water can be either carbonated or not.29
Still water has no added carbonation. The non-bubbly beverage is mostly found in larger containers in the
retail aisles, but smaller bottles or containers are also available. Bottled sparkling water combines
convenient and healthy characteristics for consumers in the United States. These characteristics were
25 https://www.statista.com/statistics/237832/volume-of-bottled-water-in-the-us/ 26 https://www.statista.com/statistics/183377/per-capita-consumption-of-bottled-water-in-the-us-since-1999/ 27 https://www.statista.com/statistics/679800/frequency-of-water-consumption-us-consumers/ 28 https://www.statista.com/statistics/659199/main-criteria-or-ideal-bottled-water-us-by-type/ 29 https://www.statista.com/statistics/188312/top-bottled-still-water-brands-in-the-united-states/
C o n f i d e n t i a l B u s i n e s s P l a n - 33 | P A G E
supported by marketers and advertisers trying to set up the image that bottled water is safer than its
counterpart tap water. Mostly unknown to the public is that some bottled waters also come from
municipal sources. Before it is bottled, it will be treated by distillation, reverse osmosis, filtration, or
ozonation.
Top selling still bottled water brands competing in the U.S. market are Dasani, Aquafina, Nestlé Pure Life,
and Glaceau Smart Water. Those brands can be easily attributed to the biggest bottled water companies
such as PepsiCo, the Coca-Cola Company, and Nestlé Waters. Apart from private label products, these
three key players captured all sales in the top five ranking for bottled still water in 2016. The bottled water
brands Dasani and Glaceau are owned by Atlanta-based Coca-Cola.
U.S. PACKAGING MARKET
U.S Flexible Packaging Market worth $29.64 billion by 2021. The Report “U.S Flexible Packaging
Market by Material (Plastic Film, Aluminium Foil, Paper, Bioplastic), Type (Stand-Up Pouches, Retort
Pouches, Gusseted Bags, Others), Printing Technology (Flexography, Rotogravure, Digital, Others),
Application – Analysis and Forecast to 2021” is estimated to reach $29.64 billion by 2021, growing at a
CAGR of 4.56% from 2016 to 2021.30
The U.S. flexible packaging market is projected to grow from USD 23.72 billion in 2016 to USD 29.64 billion
by 2021, at an estimated CAGR of 4.56%. This growth is due to the increasing demand from various end-
user industries such as food & beverages, healthcare, cosmetics & toiletries, and others (oil & lubricants,
household products, agricultural products, and sporting goods). Factors such as growing consumer
preferences towards convenient packaging, ease of use, and its lightweight characteristic are driving the
demand for flexible packaging in the U.S. Manufacturers are shifting towards flexible packaging as it
produces less waste due to lower consumption of raw materials, requires less storage space, is easy to
transport, and has excellent barrier properties.
Northeast region to play a key role in the market for U.S. flexible packaging
On the basis of region, the U.S. flexible packaging market is segmented into Midwest, West, Northeast,
Southeast, and Southwest. The Northeast region accounted for the largest share among all regions in
2015. However, Southwest region is projected to grow at the highest rate from 2016 to 2021, owing to
the increasing demand for flexible packaging in this region, coupled with the growing food & beverage
and healthcare industry. With increasing disposable incomes, the urbanized population is shifting towards
packaged foods which are healthy and safe. Therefore, rising income and consumption levels would also
lead to the growth of flexible packaging market in this region.
The key players in the U.S. flexible packaging market are Bemis Company, Inc. (U.S.), Sonoco Products
Company (U.S.), Sealed Air Corporation (U.S.), Berry Plastics Group, Inc. (U.S.), and Coveris Holdings S.A.
30 http://www.micromarketmonitor.com/pressreleases/u-s-flexible-packaging.html
C o n f i d e n t i a l B u s i n e s s P l a n - 34 | P A G E
(U.S.). Other players include Ampac Holdings, LLC (U.S.), Tredegar Corporation (U.S.), Printpack, Inc. (U.S.),
American Packaging Corporation (U.S.), and Glenroy, Inc. (U.S.).
Packaging Industry Trends 31 On a global scale, the packaging industry is an enormous economic generator. Statistics from the well-
recognized Smithers Pica organization indicate the world packaging industry’s market value will reach $1
trillion by 2020. That’s up from $839 billion in 2015. Consumer trends and industry trends for packaging
drive this gigantic growth rate. To understand this phenomenon and appreciate where it’s heading, it’s
necessary to examine the top packaging industry trends for 2019.
Packaging is an all-encompassing industry term for the technology and design work going into protecting
or enclosing every sort of product destined for storage, shipping, and sale. Packaging also takes in the
product manufacturer’s marketing efforts. For leading manufacturers, the way they package their
products signifies their brand. They view packaging as an essential part of their business model. That’s
next to producing an excellent product, of course.
Every industry has megatrends. That means overall changes in the marketplace that affect manufacturers’
product placement and presentation. At the forefront of today’s market change from brick-and-mortar
stores to e-commerce is a definite swing in how every type of product is getting packaged, labeled and
offered for sale. Here are the top packaging trends for 2019.
Transparency and Clean Labels
Presenting product information in a clear and transparent way is another strong packaging industry trend
for 2019. This trend is all about trust and honesty. In today’s world where consumers have so much access
to information, they can better educate themselves about product choices. At the top of smart
consumers’ interest list are what their product choices contain and the packaging methods they use.
“Transparency” refers to manufacturers being completely open and honest about what the products
contain. “Clean” means products are safe and don’t contain harmful ingredients. When a manufacturer
packages their product in a way that makes content information clear, concise, and open, it promotes
trust in the company’s brand name.
Clean and transparent labeling strongly affects the packaging industry’s food sector. Reports from a new
Mintel study into packaging transparency and clean foods found more than 50 percent of U.S. consumers
have an interest in scanning food packages with their smartphones to find out exactly what they contain.
Part of the clean and transparent trend in 2019 is the rise of the Smart Label™. The label code immediately
connects consumers to a landing page with transparent information about how clean this choice may be.
31 https://www.yorksaw.com/packaging-industry-trends/
C o n f i d e n t i a l B u s i n e s s P l a n - 35 | P A G E
Private Labels and Store Brands Dominating
Bold Colors and Effects
Growth in Flexible Packaging
Flexible packaging is a trend that’s gaining great popularity, and there’s a good reason for it. Technological
advancement in flexible packaging materials makes them suitable to far more consumer products today
that were once restricted to rigid and hard materials.
According to the Flexible Packaging Association, the United States accounts for $135 billion in the world’s
entire packaging industry. Out of all the packaging material options, flexible packaging materials are the
second-largest form in existence. Flexible packaging takes in all non-rigid materials. The most popular
flexible packages are wraps, bags, pouches, and envelopes.
Flexible packaging has many advantages over rigid packages. They’re easier to store, more convenient to
open and highly practical to close or reseal. Products in flexible packaging have attractive shelf appeal,
use less material, and have better shipping characteristics, which is an essential point in e-commerce.
Part of the reason flexible packaging is such a prominent 2019 trend is material advancement. For years,
most flexible packaging materials were polyvinyl chloride. This plastic wouldn’t break down or
decompose, which made it environmentally hostile. Today, most flexible packaging uses materials made
of polyethylene, polyethylene terephthalate, or polypropylene. These high-tech plastics are durable when
in use but deteriorate when discarded.
Recycled Packaging Products in Use
The recycled packaging trend has never been so popular. The movement started a generation ago with
the 3-R principle: reduce, reuse, and recycle. Today, the 3-R model creates a circular economy where it’s
a mainstay for how proper product packaging performs. Recycling has now become firmly embedded in
the American psyche.
Recycled packaging is part of the worldwide sustainability movement. For years, the vast majority of
packaging waste found its way to landfills. Worse yet is the mass of non-perishable plastics currently
floating in the oceans. That mess is no longer acceptable, and most consumers now do their part to
prevent it. They’re choosing recyclable product packaging instead.
Technology is also improving the packaging material industry. Advancements in plastic and paper
chemistry now allow recycling to be easier and more convenient than ever. Federal, state, and local
authorities also promote and encourage packaging recycle programs. But the main thing driving the 2019
trend toward recycled packaging products is consumer choice. People avoid purchasing anything
packaged in non-recyclable materials.
Minimalist Packaging of Products

C o n f i d e n t i a l B u s i n e s s P l a n - 36 | P A G E
“Less is more” is an adage that’s true in many cases. It’s certainly true in 2019 packaging industry trends.
Minimalist packaging around products is popular for trendy consumers who reject the idea that products
must have excessive wrapping and protection around them.
Minimalist packaging works well because it’s simple. Consumers appreciate simplicity and economy,
which is one reason brown paper wrappings are so popular. It’s a pushback to unnecessary excessiveness.
The minimalist trend also affects product labels. People resist information overload. Labels with fine print
and too much detail are a turnoff. Packages with simple labels that tell consumers what the product is
and what’s in it for them are today’s trendy move. Companies that ignore the minimalist message do so
at their marketing peril.
Label Printing Over Stick-On Shipping Labels
Packaging for E-Commerce Purchases
E-commerce isn’t a 2019 trend. Its here to stay, and will only grow as consumers get comfortable with
online buying. But specialized packaging specifically for e-commerce is trending in 2019. Amazon is the
giant of e-commerce, and there are some valid lessons to learn from Amazon’s e-commerce packaging.
Amazon is a pack-to-order company. Once they receive an order, workers pick and process the items.
Amazon has automated every step of their process, including the physical packaging and digital printing.
That includes some individual items and a multiple order in one shipping box.
Amazon might be big, but it’s not the only e-commerce player. Many companies find the trend to e-
commerce purchasing effective and profitable. E-commerce packaging still reflects the same basic
principles as real-time shopping. Products have to be professionally presented, protected and please
consumer expectations.
Smaller and Greener Packaging
The green movement has only gained momentum in 2019. Every company that deals with packaged goods
can’t ignore the green wave. It’s all about responsibility through sustainable goods and environmentally
friendly products. The green scene also involves smaller packaging.
Reduce, reuse and recycle is part of the green commitment to being responsible in the world. Today’s
consumers are far too aware of their environmental footprint. More people than ever are joining the
ecological fight and doing their part to protect their share of the world. The packaging industry must
recognize and respect consumers’ desire to maintain a smaller carbon footprint. They can do that by
making smaller and greener packages.

C o n f i d e n t i a l B u s i n e s s P l a n - 37 | P A G E
Insight: Five Consumer Packaging Trends Shaking up the Industry 32 Smithers Pira provides 5 of the most important consumer packaging market trends in this insight feature.
Make sure you are aware of these packaging industry trends.
Consumers are continually changing the way they view, interact with, and discard packaging. Whether
you're a manufacturer or a product marketer, you know how important it is to keep up with packaging
market trends and reflect the changing needs of the consumer in your products.
From convenience to traceability, here are five of the most important consumer packaging market trends
you need to know about to maximize the potential of packaging your products in today's market.
1. Sustainability
Consumers are becoming increasingly more aware of global environmental issues and are changing their
buying habits accordingly. These days, its 'cool to care', and consumers are actively seeking out semiotic
signs on packaging that manufacturers have a green conscience (but are wary of green washing).
Understanding how commitment to sustainability can be communicated in an engaging way on the
packaging is key to attracting, relating to, and keeping consumers.
Sustainable Packaging: Myth or Reality, an expert white paper by PWC, explains how sustainable practice
has become essential to the perception and identity of a brand. In line with their ambition to be the 'most
sustainable and desirable sportswear brand', Puma worked with PWC to produce an environmental profit
and loss account, highlighting a €145 million environmental impact across their supply chain. Recognition
of this allows them to build a more sustainable and resilient model for the future, and to communicate
their green achievements to consumers.
It seems that sustainability is no longer an optional add-on - it's an essential part of future business
planning for those in the packaging industry. The complete story of a product is becoming a key factor in
purchasing decisions - where does it come from, how was it made, what are its recycling credentials?
2. Healthy Living
3. Convenience
4. Authenticity and Trust
5. Cost-effective Shopping
32 https://www.smitherspira.com/resources/2013/september/five-consumer-packaging-industry-trends
C o n f i d e n t i a l B u s i n e s s P l a n - 38 | P A G E
Water
Bottled Water Market - Global Trends, Competitive Scenario, and Forecast to 2023 33
Bottled Water Market
The demand for bottled water has been growing during the last decade, owing to health and wellness
concerns. Beverage companies are improving their packaging due to environmental concerns. Coca-Cola
has reduced its cap size in bottles that are 24 ounces or smaller in order to reduce the plastic intake by
the company. The bottled water industry was valued at USD 185 billion in 2015 and is expected to reach
USD 334 billion by 2023, growing at an 8.5% CAGR during the forecast period 2018-2023.
Market Dynamics
The bottled water industry is driven by the health concerns regarding drinking water. Changing lifestyles,
preference for vitamin and minerals rich drinking water, and ease of handling and portability of bottled
water are some of the factors driving the market. Bottled water manufacturers are introducing new
products with health benefits and new flavors. It is resulting in several product launches in the bottled
water market. The new products are offering functional benefits, convenience, and better taste which are
preferred by consumers. The growth of PET bottles sector globally has also helped in the widespread
supply of bottled water, through wide network organized markets as well as several grocery and club
stores. These factors are expected to boost the growth of the bottled water market in the near future.
However, there are a few restraints slowing down the pace of the industry, such as the environmental
pollution through plastic bottles. This issue has encouraged the initiation of several stringent government
regulations regarding the use of recyclable packaging solutions and adopting ways to help reduce carbon
footprint of the industry. An instance is the European Parliament and Council Directive 94/62/EC. It
requires the member states to enforce regulations regarding increased use of reusable or recoverable
packaging, volume to reduce hazardous substances and materials and reduction of packaging weight in
the packaging, and meet packaging material recovery and recycling targets. Such regulations will hamper
the overall development of the global bottled water market. Lack of awareness regarding the health issues
associated with low-cost tap water is also a restraining factor.
The major opportunities identified for the bottled water industry are innovative products with minimum
environmental and health hazards and penetration in developing markets.
Market Segmentation
The bottled water market can be segmented by product types, distribution channel, and geography. By
product type, the bottled water market is sub-segmented into still water, carbonated water, flavored
water, and functional water. Still water is the largest sub-segment of bottled water, accounting for more
than 65% of the demand, followed by carbonated water. Product innovation in terms of flavor and
33 https://www.mordorintelligence.com/industry-reports/bottled-water-market
C o n f i d e n t i a l B u s i n e s s P l a n - 39 | P A G E
packaging has triggered the flavored water demand. According to distribution channel types, this market
can be segmented into hypermarkets, supermarkets, convenience stores, departmental stores, specialty
stores, and online purchases. The segment of still bottled water has dominance in terms of both revenue
and volume in the global market. The segment is expected to account for a share of 78% of market’s
overall revenue by 2022. Carbonated is the second largest segment of the bottled water market.
Carbonated bottled water is expected to witness a slight decline in its market share in the years to come.
The flavored and functional water segment is expected to witness rapid growth during the forecast period.
Regional Analysis
Asia-Pacific is the largest market in terms of revenue and total consumption, accounting for 33% market
share. It is also the fastest growing market for bottled water, covering more than one-thirds of the market
demand, supported by the large population, high demand, untapped market and demography, and rapid
urbanization. As a result, there is business expansion by almost all the big players in the market. Led by
China and India, Asia-Pacific is expected to register the highest CAGR during the forecast period. Europe
is the second largest market, with 28% market share. Other regions like North America, South America,
and Africa have a significant share of the bottled water market. North America is a saturated market with
steady demand and the highest per capita bottled water consumption currently. U.S. bottled water
market has hit an historic high point in 2015, when volume exceeded 11.7 billion gallons.
Competitive Environment
The bottled water market is fragmented due to the presence of a large number of private label brands
and local bottlers. More than 60% of the global market is covered by regional and national level players.
The competition is reported to be huge mostly in North America and Europe, where the markets are
saturated with slow growth and steady demand. The growing demand for thirst crunching products,
health and hygienic concerns, multiple market distribution channels, and social acceptance of bottled
water are expected to help the market grow at a good pace. The competition is steadily increasing. The
internal competition in the bottled water market is comparatively high owing to a large number of major
providers of bottled water products and increase in the number of small domestic players in the market.
The global bottled water industry is facing external competition from producers & distributors, which are
adopting forward and backward integration strategies to develop their own facilities to produce bottled
water.
The top players in the bottled water market are:
• Ajegroup SA
• CG Roxane, LLC
• Coca-Cola Company
• Fonti Di Vinadio S.P.A.
• Groupe Danone
• HassiaWaters International GmbH & Co. KG
• Nestle Waters
C o n f i d e n t i a l B u s i n e s s P l a n - 40 | P A G E
• PepsiCo, Inc.
Water Bottle Industry Statistics, Trends & Analysis 34 When you take a look at the water bottle industry in the United States, the contrast this product has when
compared to the trends governing soft drinks is quite striking. Water products are rising rapidly while its
primary competition continues to lose its market share. According to data offered by the Beverage
Marketing Corporation, the 42.1 gallons that consumers drink of water almost matches the 2012 levels of
carbonated soft drink consumption.
People are changing their attitudes about water bottles today. Although there are still concerns about
plastics in the bottles being recycled, the growing trend of purchasing reusable containers is helping the
market continue to grow. With an increase in home and office deliveries to consider as well, consumers
are finding more ways to make water portable, which may lead to societal health benefits in the coming
years.
The sparkling bottled water segment grew by double-digit percentages for the fourth consecutive year in
2017, with over 5 billion gallons of new product consumed. With revenues soon topping $20 billion, the
water bottle industry is poised to reach new records in the coming years.
Important Water Bottle Industry Statistics
#1. Bottled water is the top beverage product in the United States by volume. Over 13.7 billion gallons
were sold in 2017, which represents a 7% increase from the year before. (Beverage Daily)
#2. The total revenues generated by the water bottle industry were $18.5 billion, representing an increase
of 8.8%. This occurs at the same time that carbonated soft drinks saw their 13th-consecutive decline in
sales. (Beverage Daily)
#3. The average person in the United States consumes 42 gallons of bottled water each year, compared
to the 37.5 gallons of carbonated soft drinks that are also consumed. (Beverage Daily)
#4. All segments of bottled water grew in 2017. Non-sparkling water saw an increase of 5.5%, while
domestic sparkling water grew by 27.5%. Even imported water sales grew by 9.2%. (Beverage Daily)
#5. Office and home delivery of bottled water in 3-gallon and 5-gallon sizes saw an increase of 1.3% for
2017 from the year before. (Beverage Daily)
#6. 63% of consumers say that bottled water, either sparkling or still, is one of their preferred beverages
when they are thirsty. That ranks higher than coffee at 62% or a carbonated soft drink, diet or regular, at
58%. (Harris Poll)
#7. Several companies which are produced bottled water for sale are using up to 100% rPET for their
containers, while curbside recycling rates in the United States for the product reached 53.9% in 2017.
Even plastic bottles and caps are 100% recyclable today. (Beverage Daily)
#8. Bottled water uses only .011% of all water that is used in the United States each year. (IBWA)
#9. It only takes 0.24 megajoules of energy to produce 1 liter of bottled water for consumers in the United
States. (IBWA)
34 https://brandongaille.com/30-water-bottle-industry-statistics-trends-analysis/
C o n f i d e n t i a l B u s i n e s s P l a n - 41 | P A G E
#10. Bottled water takes a 23.9% volume share of the beverage segment in the United States, which makes
it the top product purchased by consumers. Carbonated soft drinks have a 22.3% share of the market.
Then it is coffee (12.5%), beer, and cider (11.5%0, and milk (10%). (Beverage Marketing Corporation)
#11. 69.5% of the bottled water that Americans consume each year comes in a PET single-serve bottle.
Only 10.6% of the volume share comes from HOD, while 8.7% comes through retail bulk sales. Vending
machines contribute 7.3% of the bottled water sales achieved by the industry each year. (Beverage
Marketing Corporation)
#12. China is the global leader for the consumption of bottled water, with over 25.4 billion gallons
consumed in 2017. The growth of their market from figures in 2012 was 11.8%. The United States is the
only other market to exceed 10 billion gallons of water consumed, and its CAGR during that time was
7.1%. (Beverage Marketing Corporation)
#13. India achieved 10.4% market growth for bottled water consumption between 2012-2017, reaching
5.75 billion gallons of water consumed for the year. (Beverage Marketing Corporation)
#14. The Top 10 consumers for the water bottle industry used a total of 80 billion gallons of water, while
the world total came just under 100 billion gallons for the first time. Total water consumption globally has
increased by 6.4% since 2012. (Beverage Marketing Corporation)
#15. Mexico is the largest per capita consumer of bottled water in the world today, with the average
person drinking 67.2 gallons. Thailand comes in second, with 57.5 per capital. These two leaders are
followed by Italy (48.2), the United States (42.1), Germany (37.9), and France (36.4). (Beverage Marketing
Corporation)
#16. The global average for bottled water consumption per capita is just 13.2, although that rate is about
3 gallons higher than it was in 2012. (Beverage Marketing Corporation)
#17. Only three countries in the Top 20 of bottled water consumption saw a per capita decrease in their
consumption levels: Switzerland, Argentina, and Austria. (Beverage Marketing Corporation)
#18. It requires three times the amount of water to produce a plastic bottle than it does to fill it,
contributing to a cost factor that is 1,000 times higher when compared to tap water. (Ban the Bottle)
#19. Although the average American uses 167 water bottles over the course of a year, they will only
recycle 38 of them. (Ban the Bottle)
#20. It requires 17 million barrels of oil to produce the number of plastic bottles which are used each year,
which could create enough fuel to operate 1 million vehicles for an entire year. (Ban the Bottle)
#21. Bottled water at the average rates that Americans consume it can cost about $350 per year, but if
you drank the same amount in tap water, the total cost would only be $0.48. That means the average
household could save $3,400 per person by switching from bottled to tap water. (Consumer Reports)
#22. The bottled water industry generates over $100 billion in revenues each year in the United States
alone. (National Geographic)
#23. Up to 80% of the plastic bottles which do not make it into a recycling program in the United States
will end up in a landfill. They do not break down naturally, which runs the risk of releasing toxic chemicals
when they do start decomposing. (National Geographic)
#24. Brazil leads the world in total annual renewable water resources, with over 1,975 cubic miles of
product access. Russia comes in second with 1,079 cubic miles, followed by Canada (792), the United
States (736), and Indonesia (681).
C o n f i d e n t i a l B u s i n e s s P l a n - 42 | P A G E
#25. Kuwait has the fewest annual renewable water resources in the world, with access to just 0.005 cubic
miles of this resource. They are followed by Barbados (0.02), Antigua and Barbuda (0.02), Bahrain (0.02),
and the Central African Republic (0.07). (Seametrics)
#26. 88% of the fatal cases of malaria, cholera, typhoid, and diarrhea are due to limited water access that
could be solved by stronger distribution networks of bottled water. (Seametrics)
#27. For every $1 that is spent by the water bottle industry on sanitation projects and water access, there
is a $9 return produced. (Seametrics)
#28. Although tap water is cheaper than bottled water, 95% of the water that enters the average home
in the United States will go down the drain. Showers account for 27% of the total water use in the United
States each year. (Seametrics)
#29. The United Nations estimates that the cost of providing global access to safe water is just $30 billion.
If the United States took that money out of their defense budget, there would still be $580 billion to
spend, which would still be higher than the next 9 countries expenses combined for the same resource.
(Seametrics)
#30. Over 443 million school days are lost each year because of water-related disease issues that the
water bottle industry could help to solve. (Seametrics)
Water Bottle Industry Trends and Analysis Water consumption is expected to continue increasing in the United States over the next 10-year period,
with the average per capita rate topping 50 gallons by 2028 – if not before. 94% of Americans say that
drinking bottled water is a healthier choice when compared to a soft drink. 93% say that they would like
to see this product become available in all retail situations. There are multiple qualities which contribute
to the water bottle industry’s continued attraction to American consumers, with benefits seen in safety,
convenience, value, and health. This trend will only continue to grow as customers step away from the
idea that buying water that they could get from a tap is a waste of funds. Addressing this issue through
filters and reusable bottles has helped to secure strong growth for the industry. With consumption levels
expected to continue increasing in the U.S. and around the world, the only issue to consider in this forecast
for the industry is how much growth it will achieve. Although the double-digit percentages for some
segments will wind down, we expect to see a CAGR of 4% at minimum for the industry as a whole, with
the sparkling segment averaging 7% through 2029.
Cannabis-Infusions Open New Opportunities for Beverage-Makers
In terms of modern society, historians commonly will point to three industrial revolutions that have
greatly advanced society: the steam engine, the age of science and mass production, and the integration
of digital technology. Each was revolutionary for the time periods in which they emerged and continue to
impact many aspects of current society. For the consumer packaged goods (CPG) market, the emergence
of a certain category also might cause a revolution in terms of CPG development — cannabis.
Whether it is tobacco, packaged foods, consumer health, beverages, or beauty and personal care, many
market analysts recognize that cannabis is poised to disrupt these consumer markets as the flowering
plant makes inroads in legalization and mainstream acceptance.
C o n f i d e n t i a l B u s i n e s s P l a n - 43 | P A G E
In its 2018 report titled “Here Comes Cannabis: How Legalization Will Disrupt Global Industries,” Chicago-
based Euromonitor International estimates that the legal and illegal global market for cannabis equates
to $150 billion, with the legal market expected to grow 77 percent of total sales at $166 billion by 2025.
“Within the next decade, some form of cannabis will be a part of consumers’ daily routines, either as a
functional ingredient in foods, beverages and beauty or as a wellness mood enhancer in health,” the
report states.
Cannabis 101
Although cannabis continues to grab headlines across consumer and business trade media outlets, the
scientific components and definitions go deeper than what is able to fit in a two-minute story package.
When asked which edible marijuana/cannabis formats they’d be interested in consuming, 34 percent of
consumers in legal states said tea, Mintel’s Beth Bloom says. (Image courtesy of Buddha Teas)
“The cannabis plant has three main species: sativa (hemp and marijuana), indica (marijuana) and
ruderalis,” Euromonitor’s report states. “Ruderalis is rarely used for consumption. All cannabis plants
contain cannabinoids, which interact with the human body’s endocannabinoid system.
“Over 100 different cannabinoids exist, of which cannabidiol (CBD) and tetrahydrocannabinol (THC), a
psychoactive substance, is the most well-known,” it continues.
Danny Brager, senior vice president at Nielsen for U.S. Beverage Alcohol Practice, further elaborates on
the cannabis compounds and its various effects.
“CBD is found in both the aerial parts (those above the ground) of both marijuana and hemp,” he says. “It
is a compound called a cannabinoid that is associated with easing pain and providing relaxation. THC is
also a cannabinoid, but unlike CBD, it is only found at levels greater than 0.3 percent in marijuana.
“THC is the cannabinoid primarily responsible for the psychoactive effects of marijuana often referred to
as a ‘high’ or a ‘buzz,’” Brager continues. “THC and its associated intoxicating effect is the main reason the
federal government still considers any product derived from marijuana as a controlled substance and it
remains federally illegal.”
The legal status of cannabis in the United States remains complicated as a number of states have legalized
the drug for medical use while a choice number has done so for recreational use, despite its illegal
designation at the federal level.
“Cannabis regulation is currently divided into medical and recreational or ‘adult’ use”, Euromonitor’s
report states. “Medical use is only legal with a prescription or by registering as a medical patient.
Recreational use allows cannabis products containing THC to be sold freely through licensed outlets at a
taxable price. The government either controls the production and sale of the product, or it delegates this
to the industry under strict legal guidelines.”

C o n f i d e n t i a l B u s i n e s s P l a n - 44 | P A G E
For recreational marijuana sales, Euromonitor details that 10 U.S. states have authorized it while 33 states
allow for medical marijuana usage. “Euromonitor International expects federal legalization of recreational
cannabis in the U.S. within the next 10 years”, the report states. “In the rest of the world, medicinal
marijuana is a stronger prospect with some large markets, such as Germany, Czech Republic, and
Australia, moving forward with liberalized structures.”
One of the most significant legal impacts for the cannabis market was the de-scheduling of hemp-derived
CBD as part of the 2018 Farm Bill.
“Through the de-scheduling of hemp-derived CBD, it is no longer federally illegal for manufacturers and
retailers to sell non-ingestible forms of hemp-derived CBD,” says Rick Maturo, associate client director for
Nielsen Beverage Alcohol and Cannabis Practice. “These formats include topicals, sprays, rubs, and hand
and body care products. Because the FDA has not approved hemp-derived CBD as an ingredient in
ingestibles (capsules, drops, edibles, drinks, etc.) these formats are not on the shelves of major chain CPG
retailers, nor are they included in the product portfolio of larger manufacturers. That said, although
ingestible hemp-derived CBD products are not approved, there are cases today where some of these
products may be found in smaller niche retailers (e.g., health food stores, vape shops) and eCommerce
channels, including some that are direct-to-consumer.”
What the 2018 Farm Bill ultimately did was escalate the battle that existed with CPGs, the pharmaceutical
industry and marijuana businesses in serving the needs of American’s pain management and holistic
treatment solutions, Maturo adds.
Joybird Wellness beverages featuring 8 mg of CBD that is sourced from domestic, organic hemp, the
company says. (Image courtesy of Joybird Wellness)
Despite the de-scheduling of hemp-derived CBD for non-ingestible products, the cannabis market remains
complex.
“Regulations vary significantly not only by individual state but also across municipalities within legal
recreational states to include things like traceability, adult-only purchasing, and use, dispensary locations,
advertising, brand imagery, and many others,” Maturo says. “Also, because marijuana is federally illegal,
all facets of the marijuana ecosystem must be contained within each legal state. There is no legal
interstate commerce for marijuana.”
Because cannabis remains illegal at the federal level and the 2018 Farm Bill only cleared hemp-derived
CBD for non-ingestibles, many legal hurdles still need to be overcome for the growing market, experts
note.
“THC and CBD from the marijuana plant continues to be federally illegal and highly regulated at the state
level within those states that legally permit adult purchasing and consumption,” Maturo says. “Only
licensed dispensaries can sell marijuana, and those facilities cannot sell any non-marijuana related
products, including CPG-type products. The de-scheduling of hemp-derived CBD (for non-ingestible
C o n f i d e n t i a l B u s i n e s s P l a n - 45 | P A G E
products) has provided opportunity — or risk — for CPG manufacturers and retailers that make or sell
products that overlap with the need states that the hemp-derived CBD products also address.”
Drinkable future
Although the legal standing for consumable forms of cannabis still has more questions than answers, CPG
manufacturers see vast potential for this emerging market, including beverage formulators.
“Headset’s Insights Data Platform today covers the legal cannabis markets of California, Nevada,
Washington, and Colorado,” Nielsen’s Brager says. “Within that dataset, recreational cannabis sales
topped $4 billion last year (vs. $2.5 billion in prior year), and amounted to $1.2 billion in Q1 2019.”
Manny Perez, vice president of marketing for Headset, reports that sales for infused beverages in those
markets in 2018 totaled $41 million with a 2 percent basket penetration. Additionally, 80 percent of the
sales were among the Top 5 brands in each state, averaging $15 an item.
Early 2019 sales also are showing potential. “Q1 2019 sales were $12.3 million across our measured
markets — California, Washington, Nevada, and Colorado — this amounts to approximately 1 percent of
total recreational cannabis sales,” Perez says.
Based on Headset data, the overall legal cannabis market is forecasted to be between $4.8 and $6 billion
in 2019 with beverages predicted to account for 1 percent of the market, which would put beverages sales
range between $48 and $60 million, Perez says.
However, Perez adds that those predictions are a reflection of uncertainty because of Senate Bill 67 in
California. The now amended measure would invalidate the expiration date of temporary licenses issued
by the California Department of Food and Agriculture (CDFA) as long as licensees annually submit
applications and fees prior to expiration and under the condition that the licensees remain in the location
and business venture, according to an opinion article from the Desert Sun newspaper. Additionally, the
CDFA would have more time under the measure to transition growers from temporary to provisional or
full annual licenses, it adds.
Featuring 10 mg of raw organic cannabis extract, Nubrain California Cannabis promotes its positive energy
and thoughts on its label. (Image courtesy of Tesla Nootropics Inc.)
“In 2019, the thing that everyone is keeping an eye on is SB67 in California,” he says. “If not resolved, we
could see a contraction in the market, versus. If resolved, growth would hopefully continue as it has. This
makes it difficult to forecast California.”
Although beverages account for a small percentage of sales within the legal cannabis market, they still
offer much potential, says Beth Bloom, associate director of U.S. Food and Drink Reports for Chicago-
based Mintel.

C o n f i d e n t i a l B u s i n e s s P l a n - 46 | P A G E
“When we asked consumers in legal states which edible marijuana/cannabis formats they’d be interested
in consuming, 34 percent said tea,” she explains. “This is the fourth leading format of interest behind
baked goods, chocolate candy, and non-chocolate candy. Beyond tea, 32 percent are interested in juice,
29 percent are interested in carbonated soft drinks, 27 percent are interested in coffee, and 21 percent
are interested in sparkling water.”
Nielsen’s Brager also notes consumers’ interest in cannabis-infused beverages. “Cannabis interacts and
overlaps with a broad set of more traditional consumer packaged goods categories, including beverages,
both alcoholic and non-alcoholic,” he says. “For example, our consumer research suggests that cannabis-
interested consumers are more likely to drink beer (53 percent) and spirits (50 percent) than wine (37
percent). Only 35 percent of current wine drinkers are interested in legally consuming cannabis for
recreational purposes, versus 41 percent for beer drinkers and 44 percent for spirits drinkers.”
In its report, Euromonitor details that the beverage alcohol market has some of the stronger ties to
cannabis exploration as major manufacturers already are investing in the space.
“At least three leading corporate players have a stake in cannabis producers”, the report states. “Alcoholic
drinks that contain any form of THC currently tend not to contain alcohol, as the effects of THC in alcohol
are still being researched. The industry is already headed in a low- / non-alcohol direction and so a future
where THC replaces ABV in alcoholic beverages with an intoxicating buzz is on the horizon.”
As a result, Mintel’s Bloom cautions that the beverage alcohol market could be challenged as
manufacturers experiment with cannabis infusions.
“While the impact of cannabis legalization in parts of the country remains to be seen, 34 percent of
cannabis users say they’ve reduced alcohol consumption since legalization, pointing to a likely challenge
to be addressed,” she says. “Relaxation is the leading reason for consumption of both cannabis and
alcohol, pitting the two markets as competitors. Dollar sales of alcohol at home were flat in 2018, growing
only 0.3 percent in 2018 (-2.1 percent when adjusted for inflation).
“This is down from a 3.8 percent recent annual gain high point in 2015,” Bloom continues. “While a
significantly smaller number of consumers use cannabis than drink alcohol, staving off sales losses will
require alcohol players to be mindful of the competitive threat. Cannabis is more likely peeling away some
consumption occasions from alcohol rather than converting consumers wholesale.”
Nielsen’s Brager also notes that cannabis-infused beverages could serve as an alternative to beverage
alcohol, but adds that the social element of cannabis consumption extends beyond beverages.
“CBD- and THC-infused beverages provide consumers with another choice in satisfying certain needs that
parallel similar needs also met by alcoholic beverages, particularly those associated with social
enablement and experience enhancement,” he says. “Some consumers may choose to substitute an
alcohol occasion for a cannabis occasion, and choices of the latter include, but go beyond just beverage

C o n f i d e n t i a l B u s i n e s s P l a n - 47 | P A G E
cannabis product formats to also include other formats like vapes, concentrates, flower, pre-rolls,
tinctures, and edibles.
“On the other hand, cannabis can facilitate social interactions that bring people together and because of
this could generate some additional beverage alcohol occasions, as cannabis is not for all,” Brager adds.
Yet, cannabis infusions are not limited to the beverage alcohol space as analysts point to the numerous
non-alcohol beverage categories in which cannabis compounds can open up opportunities.
“Beverages including infused-waters, coffee, teas, carbonated beverages and energy drinks are viable
foundational beverages for infusing CBD and THC, so there is an opportunity for manufacturers to
introduce a cannabis-infused beverage, where or when it’s legal to do so,” Brager says. “But this also poses
risks and opportunity for today’s non-alcoholic beverage industry.”
Mintel’s Bloom, however, notes that CBD isn’t experiencing strong demand when it comes to non-alcohol
beverages.
“Only 8 percent of non-alcoholic beverage drinkers would be persuaded to choose a drink due to the
inclusion of CBD,” she says. “However, the importance of functionality in the non-alcoholic beverage
market suggests that interest may grow, especially considering that 38 percent of consumers would be
persuaded to choose a drink with calming/relaxing properties, — this is second only to an interest in
hydration.”
This could stem from consumers being more aware of the THC compounds within cannabis versus CBD.
“Our research shows more education is in order, especially when it comes to CBD-only products,” Bloom
says. “Sixty percent of cannabis users say THC amount is important in their cannabis choice, second only
to price. This suggests that consumers are aware of the role THC plays in the product. A much smaller 32
percent say CBD amount is important in their choice. Stronger education efforts around CBD are in order.”
C o n f i d e n t i a l B u s i n e s s P l a n - 48 | P A G E
Motivating experimentation
As beverage manufacturers look to create cannabis-infused beverages, analysts highlight the importance
of recognizing the product attributes that spark consumers’ exploration.
“Leading reasons for use of marijuana/cannabis include relaxation, stress relief, and mood improvement,”
Bloom says. “Leading reasons for using CBD-only products include pain relief, improved sleep, and
relaxation, suggesting that while both marijuana/cannabis and CBD-only products have strong therapeutic
associations, CBD has a stronger association with medicinal outcomes.”
Yet, the curiosity aspect associated with cannabis and consumer usage actually is lower on the list of
reasons for trying, Bloom adds.
“The leading reasons for cannabis consumption (and for interested non-users) are restorative in nature,”
she says. “Fun, curiosity and experience enhancement fall further down the list, suggesting the promotion
of fundamental and functional benefits may have a stronger draw than recreation. While this may be
impacted by consumer willingness (or unwillingness) to admit they turn to a product purely for a good
time, it suggests that leading with recreational messaging alone may not be the best approach.”
For marijuana and hemp-derived CBD beverages, Nielsen’s Brager explains that product attributes can
vary based upon the ratio of CBD or THC in the product.
Even though consumer interest in cannabis-infused beverages is increasing, experts note some
formulation challenges need to be addressed.
“Most beverages are very bitter,” says Brian Sudano, managing partner for New York-based Beverage
Marketing Corporation. “However, a breakthrough disruptive technology from Infusion Biosciences (APP
Technology) addresses both the onset and offset as well as flavor profile which will open up cannabis
beverages to a broad audience that would likely reject pervasively available offerings at this time.”
Nielsen’s Maturo also recognizes the taste implications when formulating cannabis-infused beverages,
but highlights that it depends on the beverage category and the target demographic when deciding how
to tackle this challenge.
“This depends upon whether the beverage is an alcoholic beverage (especially for beer, the cannabis
terpenes are in alignment with the hoppy taste profile of beer) or a non-alcoholic beverage,” he says. “It
is likely that high sugar concentrations in non-alcoholic beverages to mask the cannabis flavor profile will
continue to dominate juices, carbonated beverages, and fruit drinks. Consumers of functional beverages
may be a bit more forgiving in cannabis taste profile of the beverage if the messaging around the
functional purpose resonates with them.”
As beverage-makers address the various challenges of the emerging cannabis market, analysts note that
many already have exhibited their investments in cannabis infusions.
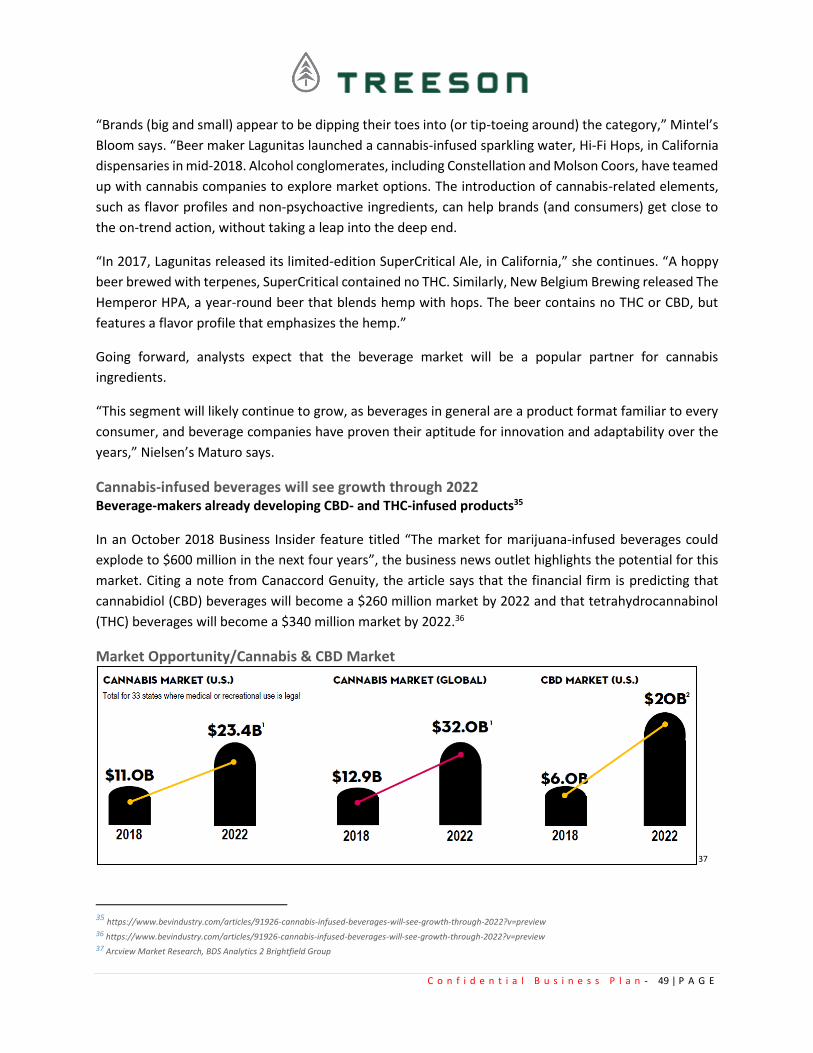
C o n f i d e n t i a l B u s i n e s s P l a n - 49 | P A G E
“Brands (big and small) appear to be dipping their toes into (or tip-toeing around) the category,” Mintel’s
Bloom says. “Beer maker Lagunitas launched a cannabis-infused sparkling water, Hi-Fi Hops, in California
dispensaries in mid-2018. Alcohol conglomerates, including Constellation and Molson Coors, have teamed
up with cannabis companies to explore market options. The introduction of cannabis-related elements,
such as flavor profiles and non-psychoactive ingredients, can help brands (and consumers) get close to
the on-trend action, without taking a leap into the deep end.
“In 2017, Lagunitas released its limited-edition SuperCritical Ale, in California,” she continues. “A hoppy
beer brewed with terpenes, SuperCritical contained no THC. Similarly, New Belgium Brewing released The
Hemperor HPA, a year-round beer that blends hemp with hops. The beer contains no THC or CBD, but
features a flavor profile that emphasizes the hemp.”
Going forward, analysts expect that the beverage market will be a popular partner for cannabis
ingredients.
“This segment will likely continue to grow, as beverages in general are a product format familiar to every
consumer, and beverage companies have proven their aptitude for innovation and adaptability over the
years,” Nielsen’s Maturo says.
Cannabis-infused beverages will see growth through 2022 Beverage-makers already developing CBD- and THC-infused products35
In an October 2018 Business Insider feature titled “The market for marijuana-infused beverages could
explode to $600 million in the next four years”, the business news outlet highlights the potential for this
market. Citing a note from Canaccord Genuity, the article says that the financial firm is predicting that
cannabidiol (CBD) beverages will become a $260 million market by 2022 and that tetrahydrocannabinol
(THC) beverages will become a $340 million market by 2022.36
Market Opportunity/Cannabis & CBD Market
37
35 https://www.bevindustry.com/articles/91926-cannabis-infused-beverages-will-see-growth-through-2022?v=preview 36 https://www.bevindustry.com/articles/91926-cannabis-infused-beverages-will-see-growth-through-2022?v=preview 37 Arcview Market Research, BDS Analytics 2 Brightfield Group
C o n f i d e n t i a l B u s i n e s s P l a n - 50 | P A G E
U.S. MOBILE APP MARKET
10 years of growth of Mobile App Market 38
Mobile applications have been a part of smartphones for over a decade. Mobile App Market is the fastest
growing segment in the mobile industry. There were a few app developers who were aware of the
potential opportunity that app development had in the mobile industry. However, now the scenario has
totally changed. With the ever-growing popularity of mobile apps, various OS providers and device
vendors have even launched their own application stores. The growing advent of mobile devices, along
with apps is perhaps the biggest technical phenomena in the recent times. Smartphone with featured
apps has now become the remote control for our lives and can easily boost our small business.
Evolution of smartphones: Over the last decade
Now, It is kind of impossible to imagine our life without smartphones. Many software and hardware
companies have worked off over the decade to narrow down all the features in small devices. The
wondrous journey of smartphone evolution has been from the old BlackBerry to the current behemoth
(iPhone X). The smartphone makers try to make the phone as small as possible while having the biggest
display of that size. From the flat small display to the curved big screens is the long road, mobile phones
have came over the last ten years. This trend isn’t stopping soon as this field will always be in the state of
innovation.
Growth of Mobile App Market: An overview
The app industry has seen an immense growth in the past ten years and even has no end in sight. Following
figures itself says how big this industry is:
• In the year 2012, mobile app’s financial state was around $53B and it grew up to $63.7B by the
year 2016.
• Various researcher even predict that mobile app economy will touch $188.9B worldwide by the
year 2020
In-app ads, purchases, and other monetization models have come up immensely with the app market.
According to a Forbes report, a huge rise is seen in the usage of monetization models by the app
developers. Last year, In 2017, 49% of the app developers went for in-app advertising (for non-gaming
apps) and 79 % chosen in-app purchases of items for gaming apps.
This growth is mainly due to a high potential of mobile applications which is acquired in various steps.
Let’s see how mobile apps have managed to grab such a high place in the current economy in a short span
of time.
38 https://www.knowband.com/blog/mobile-app/growth-of-mobile-app-market/
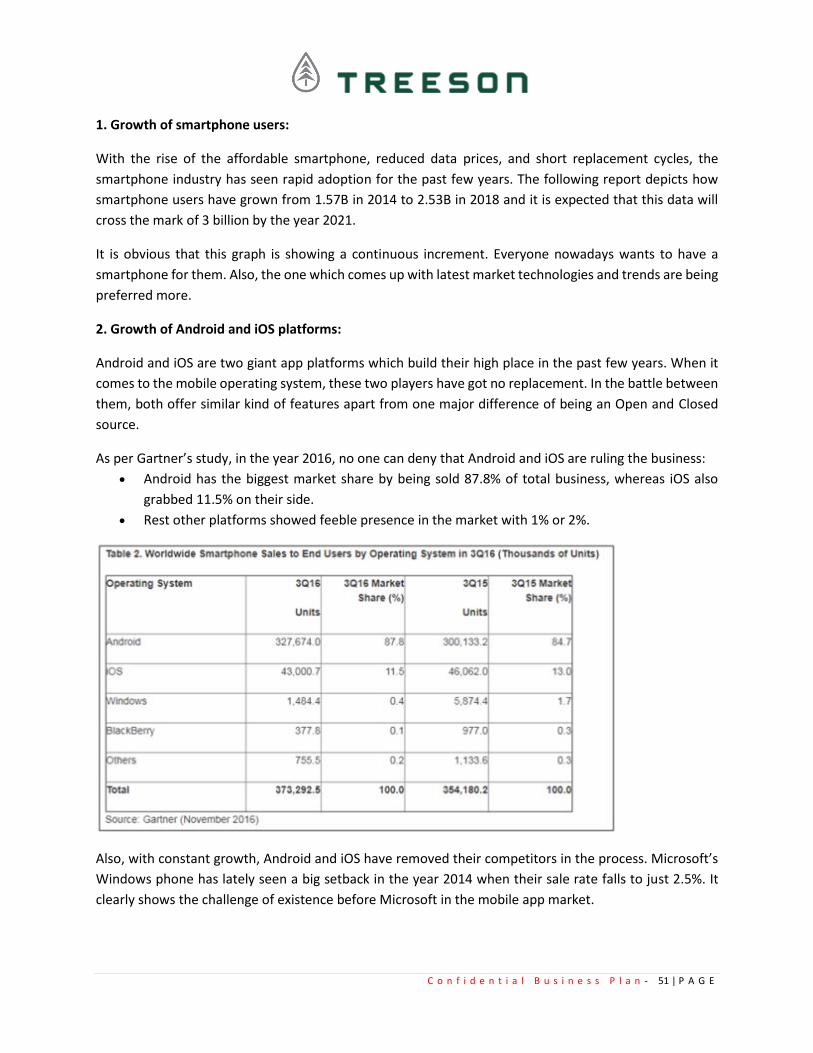
C o n f i d e n t i a l B u s i n e s s P l a n - 51 | P A G E
1. Growth of smartphone users:
With the rise of the affordable smartphone, reduced data prices, and short replacement cycles, the
smartphone industry has seen rapid adoption for the past few years. The following report depicts how
smartphone users have grown from 1.57B in 2014 to 2.53B in 2018 and it is expected that this data will
cross the mark of 3 billion by the year 2021.
It is obvious that this graph is showing a continuous increment. Everyone nowadays wants to have a
smartphone for them. Also, the one which comes up with latest market technologies and trends are being
preferred more.
2. Growth of Android and iOS platforms:
Android and iOS are two giant app platforms which build their high place in the past few years. When it
comes to the mobile operating system, these two players have got no replacement. In the battle between
them, both offer similar kind of features apart from one major difference of being an Open and Closed
source.
As per Gartner’s study, in the year 2016, no one can deny that Android and iOS are ruling the business:
• Android has the biggest market share by being sold 87.8% of total business, whereas iOS also
grabbed 11.5% on their side.
• Rest other platforms showed feeble presence in the market with 1% or 2%.
Also, with constant growth, Android and iOS have removed their competitors in the process. Microsoft’s
Windows phone has lately seen a big setback in the year 2014 when their sale rate falls to just 2.5%. It
clearly shows the challenge of existence before Microsoft in the mobile app market.

C o n f i d e n t i a l B u s i n e s s P l a n - 52 | P A G E
Apple’s App Store and Google’s Play Store have always been the most popular app stores. Now, they are
at a place in mobile app market, that it seems impossible for any other competitor to catch up with them.
The major reason behind their success is having a variety of applications and developers. Forbes shared a
report illustrating the growth scope of app developers. At the Worldwide Developer Conference, Apple
talked about 1.25 million apps in the App Store and it paid $5 billion to developers last year. The average
mobile app developer revenue is shown in the table below:
This data shows that why developers focus on making an app for every simple task, not only it makes our
life easy but also provides them with a huge money-making option.
3. Growth in mobile app usage:
Mobile has now overpowered the position of the desktop by making it secondary touch point for the
digital users. With the increase in the number of digital users, the mobile apps now grab 65% share of
digital media time. If we categorize the digital time on the basis of usage, these results follows:
1. Music – 79%
2. Health and fitness – 51%
3. Social networking – 49%
4. Travel – 28%
5. Entertainment – 22%
6. Sports – 16%
7. Games – 15%
8. News – 14%
The percentage of mobile apps that were only used once shrunk to 20% in 2015 after improving from 22%
in 2014. The percentage of app usage increased by 39% in 2016. Mobile devices entice us to spend a
maximum of our time on them and we seem to be doing so. The smartphone is ascendant, and every
section of our society prefers them to keep everything at their fingertips.
The new 2018 Global Digital Suite of reports reveals the following data related to increased internet and
smartphone usage:
• The number of internet users worldwide in 2018 is 4.021 billion, up 7 percent year-on-year.

C o n f i d e n t i a l B u s i n e s s P l a n - 53 | P A G E
• The number of social media users worldwide in 2018 is 3.196 billion, up 13 percent year-on-year.
• The number of mobile phone users in 2018 is 5.135 billion, up 4 percent year-on-year.
More time spent on mobile applications is directly proportional to their development rate. Such high data
of time spent on mobile apps shows that there is no end to mobile app usage in the upcoming years. It
will only see the rise.
4. Growth in mobile app downloads:
Worldwide smartphone users downloaded 60% more apps in 2017 as compared in 2015. Simplifying this
data means that nearly two apps were downloaded every month per human being on the planet. Lately,
in September 2016, India has also seen a rapid growth in app download with unlimited 4G access by
Reliance Jio. Gartner shared a report on how mobile app downloads have increased in the past years and
this data is gradually increasing:
This data is of worldwide mobile app downloads and the graph is just getting higher and higher. By the
end of this year hopefully, it would cross the mark of 300 billion.
Current technology trends and their future scope:
1. IoT (Internet Of Things)
2. AR and VR development
3. Blockchain development
4. Cloud base app development
5. Accelerated mobile pages
6. Artificial Intelligence and Chatbots:
7. Location-based apps will hold the gears
8. Enhanced Security Constraints
9. Mobile Wallets
C o n f i d e n t i a l B u s i n e s s P l a n - 54 | P A G E
The future of Mobile Apps in a nut-shell
With millions of mobile apps listed in at the various app stores, people might say that the industry is
saturated. However, if you take a closer look at the stats, you’ll know that there is still a lot of room to
grow. The gross revenue of mobile apps worldwide in the year 2015 was 96.7 billion US dollar. This figure
showed a skyrocket increment in the following year and reached an amount of 88.3 billion US dollar. If
you think that this is the limit, then, watch out for the future predictions. As per Statista, this figure is
expected to reach 188.9 billion US dollar.
Mobile apps have also the reason behind growth in E-Commerce industry. Users can engage through
mobile apps, which makes the communication easy and develops a bond of trust and loyalty. Mobile apps
are easily accessible and contain all the required info required while product purchase.
Mobile App Download and Usage Statistics (2019) 39 With over 2.7 billion smartphone users across the world, it’s no surprise that the mobile app industry is
thriving. App usage and smartphone penetration are still growing at a steady rate, without any signs of
slowing down in the foreseeable future.
Now factor in the 1.35 billion tablet users worldwide, which is a number that has doubled over the past
six years.
Key Mobile App Statistics
• Mobile apps are expected to generate $189 billion in revenue by 2020.
• The Apple App Store has 2.2 million apps available for download.
• There are 2.8 million apps available for download on the Google Play Store.
• 21% of Millennials open an app 50+ times per day.
• 49% of people open an app 11+ times each day.
• 57% of all digital media usage comes from mobile apps.
• The average smartphone owner uses 30 apps each month.
Mobile App Usage
Now that you’ve seen how users across the world download apps, it’s time to analyze how people are
using mobile apps. The average smartphone user spends 2 hours and 15 minutes each day using apps.
Research shows that there are between 60 and 90 apps installed on the average smartphone. But with
that said, people aren’t using all of those apps. Here’s a deeper look at how many apps people really use.
39 https://buildfire.com/app-statistics/

C o n f i d e n t i a l B u s i n e s s P l a n - 55 | P A G E
The majority of mobile time is spent using three apps. Even though the average person uses 25 apps per
month, 96% of that time is split between just ten apps. 71% of app users churn within the first 90 days of
downloading an app. Give users a reason to keep coming back and using your app down the road.
If you look at this list, it makes sense. All of the top apps are used for different purposes and could be used
on a daily basis.
• Amazon for purchases
• Gmail for email communication
• Facebook for social media
• YouTube for video content
• Maps for navigation
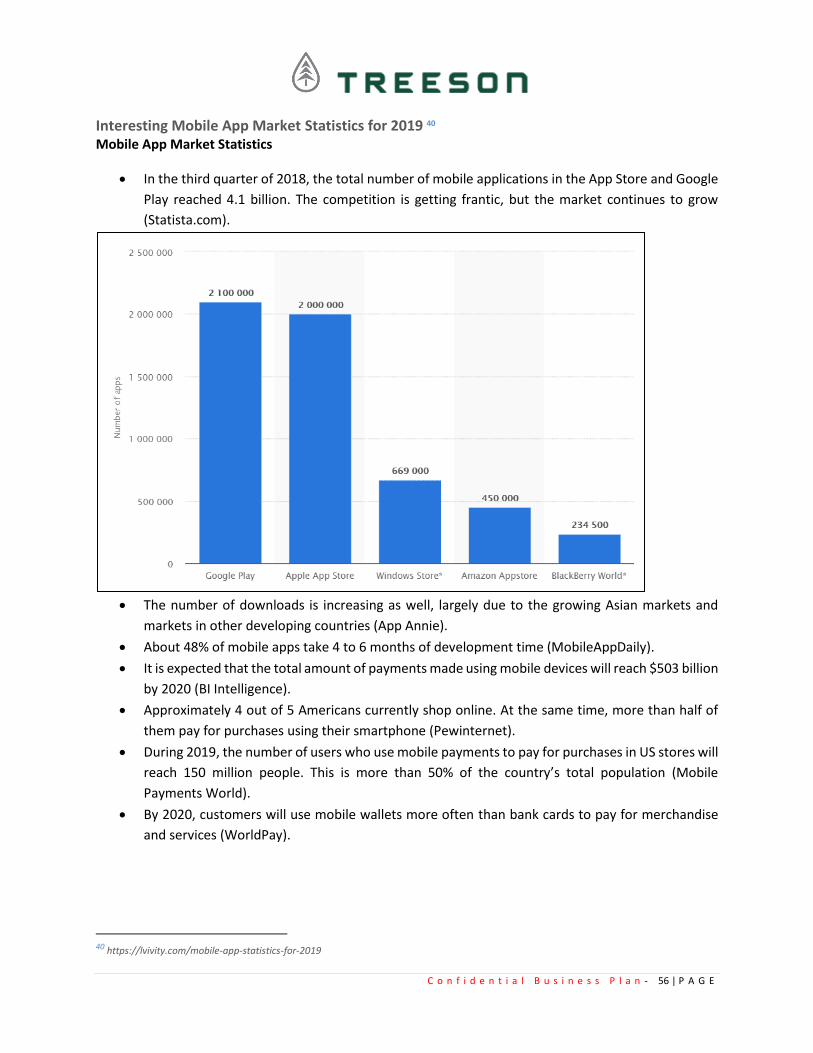
C o n f i d e n t i a l B u s i n e s s P l a n - 56 | P A G E
Interesting Mobile App Market Statistics for 2019 40 Mobile App Market Statistics
• In the third quarter of 2018, the total number of mobile applications in the App Store and Google
Play reached 4.1 billion. The competition is getting frantic, but the market continues to grow
(Statista.com).
• The number of downloads is increasing as well, largely due to the growing Asian markets and
markets in other developing countries (App Annie).
• About 48% of mobile apps take 4 to 6 months of development time (MobileAppDaily).
• It is expected that the total amount of payments made using mobile devices will reach $503 billion
by 2020 (BI Intelligence).
• Approximately 4 out of 5 Americans currently shop online. At the same time, more than half of
them pay for purchases using their smartphone (Pewinternet).
• During 2019, the number of users who use mobile payments to pay for purchases in US stores will
reach 150 million people. This is more than 50% of the country’s total population (Mobile
Payments World).
• By 2020, customers will use mobile wallets more often than bank cards to pay for merchandise
and services (WorldPay).
40 https://lvivity.com/mobile-app-statistics-for-2019
C o n f i d e n t i a l B u s i n e s s P l a n - 57 | P A G E
Mobile App Usage Statistics
• More than 1.2 billion people in the world access the Internet from their smartphones. This
number has increased over the past 6 years by 42%. To compare, it took almost 45 years for
landline phones to reach the same distribution rate (Mobify.com).
• In 2019, 1/6 of the total media content consumed by users will consist of online videos viewed on
mobile device screens (App Annie).
• 61% of mobile users claim that they often make purchases on mobile websites and on apps that
personalize data according to their location and preferences, say, based on browsing or shopping
history (Thinkwithgoogle).
• Under these circumstances, the main conclusion to make is that it is crucial for any business to
take advantage of mobile market to ensure growth and expansion.
U.S. BIO FUEL MARKET
Biofuels Market Size Will Reach USD 218.7 Billion by 2022, Globally: Zion Market Research 41
According to the report, global biofuel market was valued at USD 168 billion in 2016, is expected to reach
USD 218.7 billion in 2022 and is anticipated to grow at a CAGR of 4.5% between 2017 and 2022.
Biofuel is an economically important and versatile vegetable oil used as a raw material for both food and
nonfood products. Biofuel is most widely used vegetable oil in the world and is found in supermarkets
ranging from sweets, baked goods, margarine, cereals, washing powders, and cosmetics. Biofuel is also
used as a first-generation fuel. It is also used in preventing vitamin A deficiency, cancer, brain disease,
aging; and treating malaria, high blood pressure, high cholesterol, and cyanide poisoning. Most biofuels
are produced in Asia, Africa, and South America because the trees require warm temperatures, sunlight,
and plenty of rain in order to maximize crop production.
Factors such as improving economic conditions, rising living standards, and changing eating habits in
emerging countries, and growing demand for vegetable oil as a feedstock for biodiesel production are
driving the biofuels market growth. Furthermore, stringent regulations on trans-fat foods in U.S. and
Europe are resulting in a rapid shift in consumption of soybeans oil to biofuels. Additionally, low price of
biofuels than other vegetable oils is expected to boost the market growth within the forecast period.
Moreover, increasing market penetration by major producing countries such as Indonesia, Malaysia, and
Thailand may open up a new opportunity in the biofuels market in the forecast period.
Biofuels market derivative segment includes crude palm oil, palm kernel oil, palm kernel cake, and others.
The crude oil segment was a leading segment among the other biofuels derivative in the global biofuels
market size in 2015 owing to growing applications such as edible oil, surfactants, cosmetics, biofuel, and
lubricants. On the basis of application biofuels market is divided into edible oil, cosmetics, bio-diesel,
41 https://www.globenewswire.com/news-release/2018/01/09/1285912/0/en/Biofuels-Market-Size-Will-Reach-USD-218-7-Billion-by-2022-
Globally-Zion-Market-Research.html
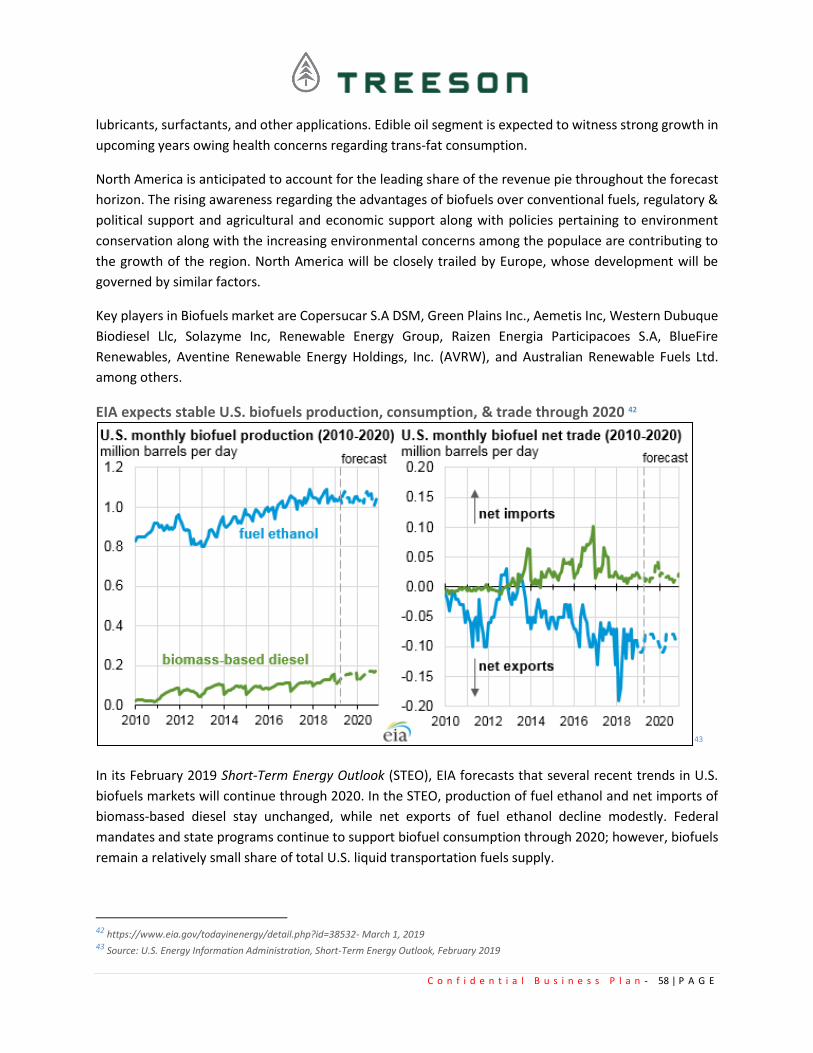
C o n f i d e n t i a l B u s i n e s s P l a n - 58 | P A G E
lubricants, surfactants, and other applications. Edible oil segment is expected to witness strong growth in
upcoming years owing health concerns regarding trans-fat consumption.
North America is anticipated to account for the leading share of the revenue pie throughout the forecast
horizon. The rising awareness regarding the advantages of biofuels over conventional fuels, regulatory &
political support and agricultural and economic support along with policies pertaining to environment
conservation along with the increasing environmental concerns among the populace are contributing to
the growth of the region. North America will be closely trailed by Europe, whose development will be
governed by similar factors.
Key players in Biofuels market are Copersucar S.A DSM, Green Plains Inc., Aemetis Inc, Western Dubuque
Biodiesel Llc, Solazyme Inc, Renewable Energy Group, Raizen Energia Participacoes S.A, BlueFire
Renewables, Aventine Renewable Energy Holdings, Inc. (AVRW), and Australian Renewable Fuels Ltd.
among others.
EIA expects stable U.S. biofuels production, consumption, & trade through 2020 42
43
In its February 2019 Short-Term Energy Outlook (STEO), EIA forecasts that several recent trends in U.S.
biofuels markets will continue through 2020. In the STEO, production of fuel ethanol and net imports of
biomass-based diesel stay unchanged, while net exports of fuel ethanol decline modestly. Federal
mandates and state programs continue to support biofuel consumption through 2020; however, biofuels
remain a relatively small share of total U.S. liquid transportation fuels supply.
42 https://www.eia.gov/todayinenergy/detail.php?id=38532- March 1, 2019 43 Source: U.S. Energy Information Administration, Short-Term Energy Outlook, February 2019

C o n f i d e n t i a l B u s i n e s s P l a n - 59 | P A G E
The most common biofuels consumed both domestically and globally are fuel ethanol and biomass-based
diesel. Fuel ethanol is primarily blended with motor gasoline blendstock in the United States to produce
10% ethanol blended motor gasoline, or E10. Biomass-based diesel, which collectively refers to biodiesel
and renewable diesel, is typically mixed with ultra-low sulfur distillate fuel at varying percentages.
EIA expects that U.S. fuel ethanol production will remain near current levels, decreasing slightly in 2019
to 1.04 million b/d and increasing to 1.05 million b/d in 2020. Fuel ethanol production is largely dependent
on domestic motor gasoline consumption, which has been relatively stable in recent years, as fuel
economy improvements have largely offset increases in population and vehicle miles traveled.
U.S. ethanol exports have accounted for an increasing share of production since 2013 and have
contributed to market growth. EIA forecasts net ethanol exports, which reached nearly 110,000 b/d in
2018, will fall to an average of 90,000 b/d in 2019 and 2020, driven primarily by the expectation that
record levels of ethanol exports to Brazil in early 2018 will not persist.
Biomass-based diesel production—excluding renewable diesel—was about 120,000 b/d in 2018 and
grows to 160,000 b/d in 2020. Total biomass-based diesel consumption will increase from an estimated
134,000 b/d in 2018 to 174,000 b/d in 2020. Growth in domestic production will continue to be supported
by antidumping and countervailing duties placed on biodiesel imports from Argentina and Indonesia that
went into effect in 2017. Current import restrictions on these countries will contribute to flat biomass-
based diesel net imports through 2020, with U.S. biomass-based diesel net imports about 70% lower than
the 2016 peak.
Biofuels account for a relatively small share of total transportation fuels, with consumption supported
over time by the federal Renewable Fuel Standard as well as state-level biofuel programs. U.S.
consumption of motor gasoline was 9.31 million b/d in 2018, and EIA expects that it will increase by less
than 1% annually to 9.36 million b/d by 2020.
Of the motor gasoline demand in 2020, domestic ethanol consumption will contribute about 950,000 b/d,
corresponding to a national-level blend rate estimate of 10.2%. Limited demand and ongoing regulatory
and infrastructure hurdles for ethanol blends higher than E10 (e.g., E15, E85) and lower-priced petroleum
blendstocks restrict higher domestic ethanol consumption rates.

C o n f i d e n t i a l B u s i n e s s P l a n - 60 | P A G E
44
U.S. diesel fuel consumption, which includes biomass-based diesel, is expected to increase from 3.8
million b/d to 3.9 million b/d between 2018 and 2020 in the STEO. The share of biomass-based diesel in
diesel fuel increases from 3.6% in 2018 to 4.5% in 2020. Demand for renewable diesel, which includes
stand-alone production facilities as well as petroleum refiners that co-process renewable feedstocks in
downstream units such as hydrotreaters, is expected to grow in 2020.
The World's Oceans & Plastic
The World's Oceans Are Infested With Plastic 45
How often does the same old sad story repeat itself? You set out for a nice walk along a seemingly pristine
beach but once you're out on the sand, it's clogged with plastic bottles and other garbage. A grim report
estimates that there are over 5.25 trillion pieces of plastic weighing over 250,000 tons floating on the
world's oceans. All of that pollution has had a serious impact on the environment with evidence even
suggesting that marine organisms as far as 10km beneath the surface have ingested plastic fragments.
The infographic below shows the distribution of plastic pollution across the world's oceans. The North
Pacific has the highest level of contamination with nearly 2 trillion pieces of plastic while the Indian Ocean
comes second with 1.3 trillion. According to a recent Greenpeace report, the world's top-6 companies sell
plastic bottles weighing over 2 million tons every year - that's the same weight as 10,000 blue whales.
Even though all plastic bottles can be recycled, unfortunately a huge number of them still end up in the
ocean and landfill rather than the recycling plant.
44 Source: U.S. Energy Information Administration, Short-Term Energy Outlook, February 2019 45 https://www.statista.com/chart/8616/the-worlds-oceans-are-infested-with-plastic/

C o n f i d e n t i a l B u s i n e s s P l a n - 61 | P A G E
Plastic Can Take 500 Years To Bio-Degrade In The Ocean 46 In 2018, the European Parliament overwhelmingly backed a sweeping ban on a range of single-use plastics
in an effort to curb maritime pollution. The proposed directive will ban items such as plastic straws,
cutlery, plates, and cotton swabs by 2021 and ensure that 90 percent of plastic bottles are recycled by
2025. MEPs backed the legislation by 571 votes to 53.
According to the European Parliament, the products that will be banned account for over 70 percent of
maritime litter. MEPs also agreed that measures need to be taken to reduce pollution from tobacco
products, particularly cigarette filters that contain plastic. They are the second most littered single-use
plastic item and one butt can pollute between 500 and 1,000 liters of water, taking up to a decade to bio-
degrade. Under the directive, waste from cigarette filters containing plastic will have to be reduced by 50
percent by 2025 and 80 percent by 2030.
The following infographic uses data from NOAA and Woods Hole Sea Grant to show just how long it takes
for a range of other plastic items to bio-degrade in a marine environment. Governments have been highly
active banning plastic grocery bags and they can take twice as long as cigarette butts to bio-degrade.
46 https://www.statista.com/chart/15905/the-estimated-number-of-years-for-selected-items-to-bio-degrade/

C o n f i d e n t i a l B u s i n e s s P l a n - 62 | P A G E
Other items are far worse, however, with plastic beverage holders, plastic bottles, and disposable diapers
all taking 400 years or longer to finally break up and disappear.
PepsiCo Announces Waste Diversion 47 As a part of the 2025 initiative, the company aims to design 100 percent of their packaging to be
recyclable, compostable, or biodegradable. The packaging initiative began execution when the 2016
sustainability report came out. In 2017, 85 percent of PepsiCo’s worldwide packaging met the criteria,
Aulisi said.
The report also discussed progress toward the company’s packaging and waste reduction goals. “We’re
already piloting plant-based, bioplastic bags in three locations across the globe, including Chile, India, and
here in the U.S.,” Aulisi said. “These bags are produced from renewable resources and can be composted
in industrial composting facilities.
47 https://www.bevindustry.com/articles/91299-pepsico-announces-waste-diversion-2017-packaging-results
C o n f i d e n t i a l B u s i n e s s P l a n - 63 | P A G E
Hemp
Hemp has been making headlines for its impact on several mature markets – from food and textiles, to
building construction and nutraceuticals. Hemp is emerging as a potential commodity ripe to not only
influence but possibly revolutionize major economic sectors around the world. 48
The United States is currently the largest importer of hemp goods in the world. The hemp market
generated over $820 million in sales in the U.S. in 2017, up from $680 million in 2016, and is expected to
swell to $1.9 billion by 2022. Just under 10,000 acres of hemp were cultivated in the U.S. under
agricultural pilot and other programs in 2016, and that number more than doubled to just under 26,000
acres in 2017. Using available data for 2018, the Hemp Industries Association® estimates there are
upwards of 1,200 licensed U.S. hemp farmers operating on over 40,000 acres, along with hundreds of
processors across the nation. The new Farm Bill opens the floodgates to domestic production, economic
stimulus, job creation, and opportunities for international trade.49
The global industrial hemp market size is expected to reach USD $10.6 billion by 2025, according to a
new report by Grand View Research, Inc. and the market is anticipated to expand at a CAGR of 14.0%.50
Hemp is a fast growing, high margin business growing at a 22% CAGR currently valued at over $688
million, and estimated to grow to $1.8 billion by 2020 in the USA.51
A lot of what happens in the hemp industry will depend on the federal government. Right now, it’s an
open market. People are trying to work as fast as possible to meet that high demand.52
Ways Hemp Plastic Could Change the World53
Did you know that it takes between 500-1,000 years for plastic to degrade? Plastic pollution is destroying
our planet by the minute. In fact, so much plastic is thrown away each year it could circle the earth four
times. And these numbers are on the rise. In the United States alone, Americans throw away 35 billion
plastic water bottles every year. This plastic ends up in the land and the sea, devastating natural
ecosystems. Worse yet, this same plastic pollution end up in our bodies. It’s estimated that 93 percent of
Americans over the age of six test positive for BPA, a chemical in plastic linked to cancer, diabetes,
impaired immunity, and much more. Clearly, plastic pollution is an environmental and health hazard. But
what if hemp could help? The basic building blocks of plastic are cellulose. Currently, cellulose is primarily
obtained from petroleum. However, petroleum-based plastics are harmful to human health. Not to
mention destructive to the environment. Hemp, on the other hand, happens to be an excellent source of
cellulose and is sustainable.
48 The Global State of HEMP - 2019 Industry Outlook - Hemp Business Journal
49 https://www.thehia.org/HIAhemppressreleases/6968011 50 https://www.prnewswire.com/news-releases/bright-future-for-cbd-and-hemp-industry-as-demand-continues-to-grow-822086414.html
51https://www.prnewswire.com/news-releases/future-farm-closes-on-120-acre-licensed-industrial-hemp-farm-projects-over-10million-in-revenue-660746053.html
52 https://www.telegram.com/news/20190330/fast-growing-hemp-industry-seen-as-22b-us-operation-in-next-three-years
53 https://www.green-flower.com/articles/448/7-ways-hemp-plastic-could-change-the-world
C o n f i d e n t i a l B u s i n e s s P l a n - 64 | P A G E
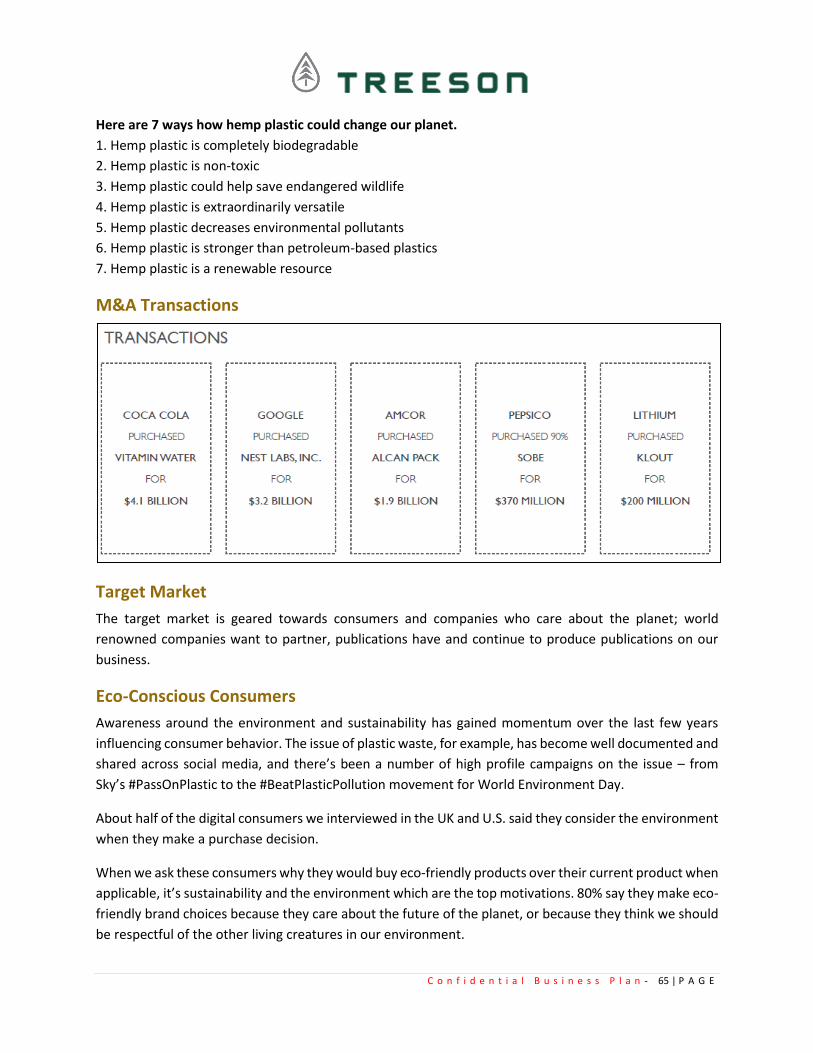
C o n f i d e n t i a l B u s i n e s s P l a n - 65 | P A G E
Here are 7 ways how hemp plastic could change our planet.
1. Hemp plastic is completely biodegradable
2. Hemp plastic is non-toxic
3. Hemp plastic could help save endangered wildlife
4. Hemp plastic is extraordinarily versatile
5. Hemp plastic decreases environmental pollutants
6. Hemp plastic is stronger than petroleum-based plastics
7. Hemp plastic is a renewable resource
M&A Transactions
Target Market
The target market is geared towards consumers and companies who care about the planet; world
renowned companies want to partner, publications have and continue to produce publications on our
business.
Eco-Conscious Consumers
Awareness around the environment and sustainability has gained momentum over the last few years
influencing consumer behavior. The issue of plastic waste, for example, has become well documented and
shared across social media, and there’s been a number of high profile campaigns on the issue – from
Sky’s #PassOnPlastic to the #BeatPlasticPollution movement for World Environment Day.
About half of the digital consumers we interviewed in the UK and U.S. said they consider the environment
when they make a purchase decision.
When we ask these consumers why they would buy eco-friendly products over their current product when
applicable, it’s sustainability and the environment which are the top motivations. 80% say they make eco-
friendly brand choices because they care about the future of the planet, or because they think we should
be respectful of the other living creatures in our environment.
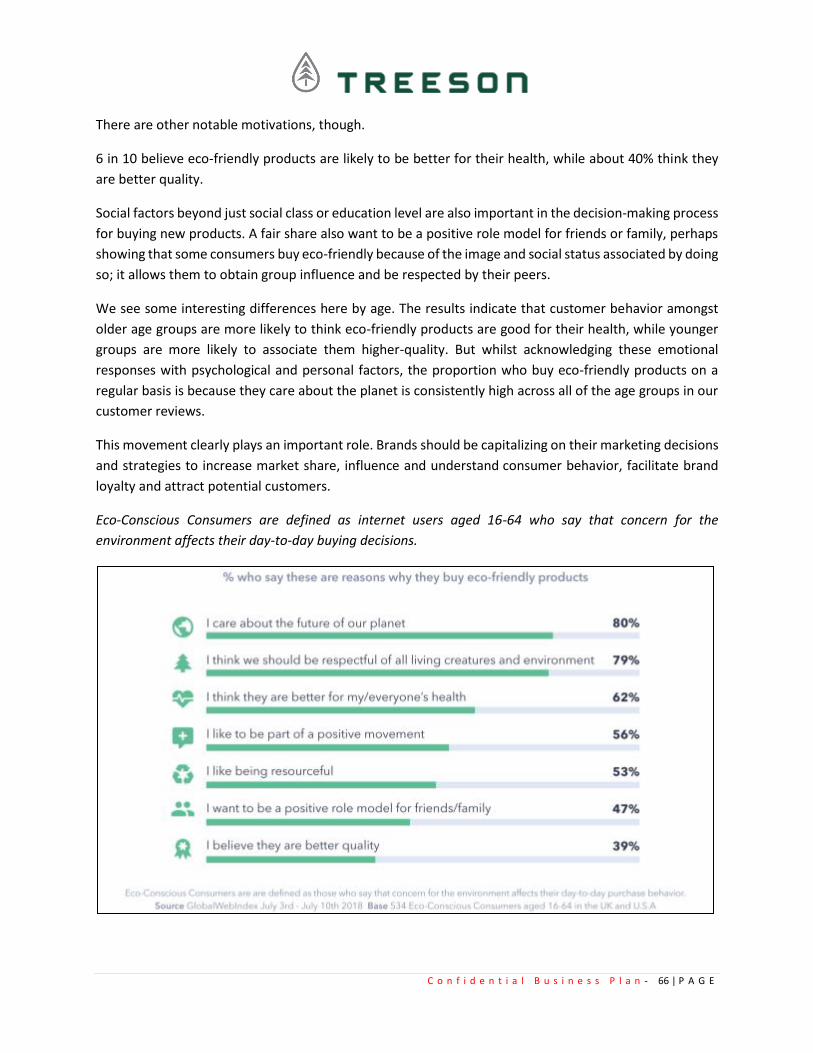
C o n f i d e n t i a l B u s i n e s s P l a n - 66 | P A G E
There are other notable motivations, though.
6 in 10 believe eco-friendly products are likely to be better for their health, while about 40% think they
are better quality.
Social factors beyond just social class or education level are also important in the decision-making process
for buying new products. A fair share also want to be a positive role model for friends or family, perhaps
showing that some consumers buy eco-friendly because of the image and social status associated by doing
so; it allows them to obtain group influence and be respected by their peers.
We see some interesting differences here by age. The results indicate that customer behavior amongst
older age groups are more likely to think eco-friendly products are good for their health, while younger
groups are more likely to associate them higher-quality. But whilst acknowledging these emotional
responses with psychological and personal factors, the proportion who buy eco-friendly products on a
regular basis is because they care about the planet is consistently high across all of the age groups in our
customer reviews.
This movement clearly plays an important role. Brands should be capitalizing on their marketing decisions
and strategies to increase market share, influence and understand consumer behavior, facilitate brand
loyalty and attract potential customers.
Eco-Conscious Consumers are defined as internet users aged 16-64 who say that concern for the
environment affects their day-to-day buying decisions.
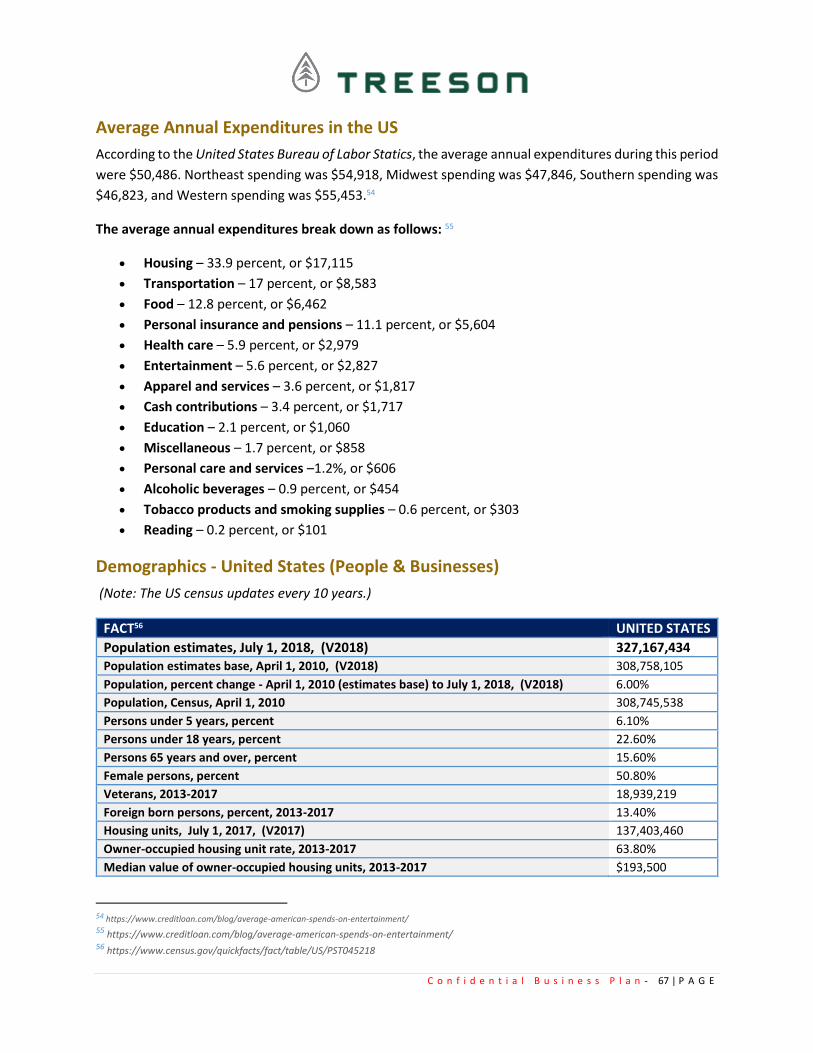
C o n f i d e n t i a l B u s i n e s s P l a n - 67 | P A G E
Average Annual Expenditures in the US
According to the United States Bureau of Labor Statics, the average annual expenditures during this period
were $50,486. Northeast spending was $54,918, Midwest spending was $47,846, Southern spending was
$46,823, and Western spending was $55,453.54
The average annual expenditures break down as follows: 55
• Housing – 33.9 percent, or $17,115
• Transportation – 17 percent, or $8,583
• Food – 12.8 percent, or $6,462
• Personal insurance and pensions – 11.1 percent, or $5,604
• Health care – 5.9 percent, or $2,979
• Entertainment – 5.6 percent, or $2,827
• Apparel and services – 3.6 percent, or $1,817
• Cash contributions – 3.4 percent, or $1,717
• Education – 2.1 percent, or $1,060
• Miscellaneous – 1.7 percent, or $858
• Personal care and services –1.2%, or $606
• Alcoholic beverages – 0.9 percent, or $454
• Tobacco products and smoking supplies – 0.6 percent, or $303
• Reading – 0.2 percent, or $101
Demographics - United States (People & Businesses)
(Note: The US census updates every 10 years.)
FACT56 UNITED STATES
Population estimates, July 1, 2018, (V2018) 327,167,434 Population estimates base, April 1, 2010, (V2018) 308,758,105
Population, percent change - April 1, 2010 (estimates base) to July 1, 2018, (V2018) 6.00%
Population, Census, April 1, 2010 308,745,538
Persons under 5 years, percent 6.10%
Persons under 18 years, percent 22.60%
Persons 65 years and over, percent 15.60%
Female persons, percent 50.80%
Veterans, 2013-2017 18,939,219
Foreign born persons, percent, 2013-2017 13.40%
Housing units, July 1, 2017, (V2017) 137,403,460
Owner-occupied housing unit rate, 2013-2017 63.80%
Median value of owner-occupied housing units, 2013-2017 $193,500
54 https://www.creditloan.com/blog/average-american-spends-on-entertainment/ 55 https://www.creditloan.com/blog/average-american-spends-on-entertainment/ 56 https://www.census.gov/quickfacts/fact/table/US/PST045218
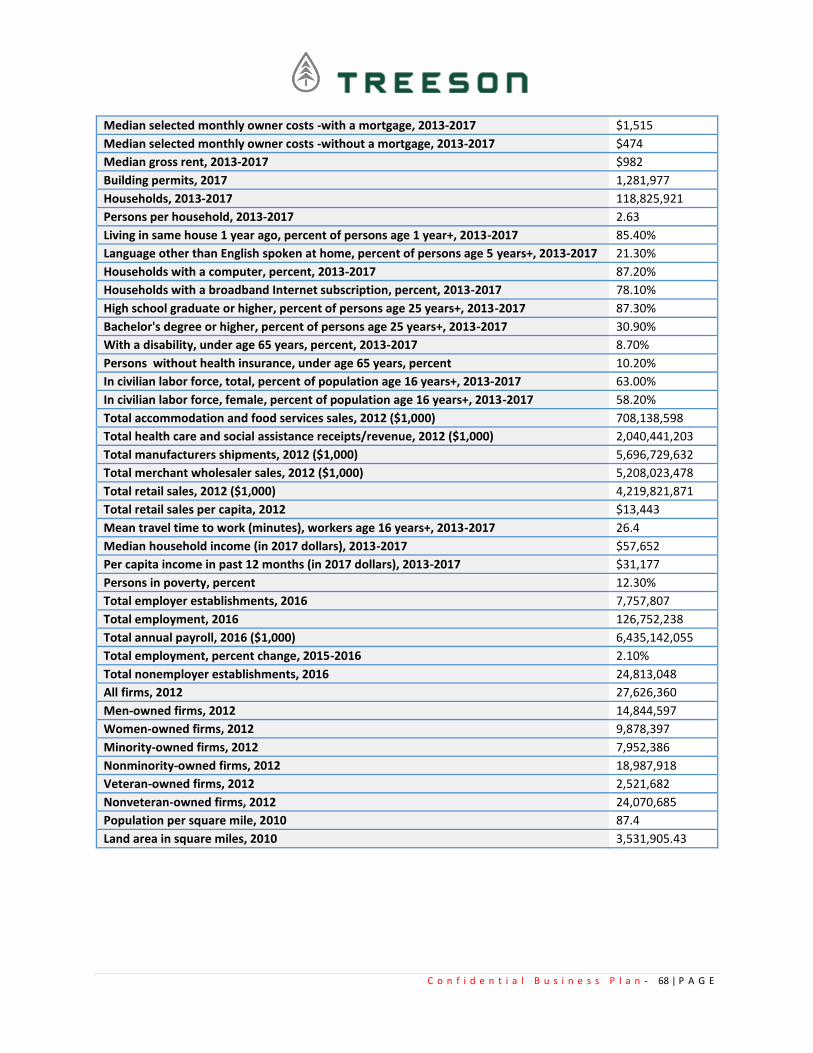
C o n f i d e n t i a l B u s i n e s s P l a n - 68 | P A G E
Median selected monthly owner costs -with a mortgage, 2013-2017 $1,515
Median selected monthly owner costs -without a mortgage, 2013-2017 $474
Median gross rent, 2013-2017 $982
Building permits, 2017 1,281,977
Households, 2013-2017 118,825,921
Persons per household, 2013-2017 2.63
Living in same house 1 year ago, percent of persons age 1 year+, 2013-2017 85.40%
Language other than English spoken at home, percent of persons age 5 years+, 2013-2017 21.30%
Households with a computer, percent, 2013-2017 87.20%
Households with a broadband Internet subscription, percent, 2013-2017 78.10%
High school graduate or higher, percent of persons age 25 years+, 2013-2017 87.30%
Bachelor's degree or higher, percent of persons age 25 years+, 2013-2017 30.90%
With a disability, under age 65 years, percent, 2013-2017 8.70%
Persons without health insurance, under age 65 years, percent 10.20%
In civilian labor force, total, percent of population age 16 years+, 2013-2017 63.00%
In civilian labor force, female, percent of population age 16 years+, 2013-2017 58.20%
Total accommodation and food services sales, 2012 ($1,000) 708,138,598
Total health care and social assistance receipts/revenue, 2012 ($1,000) 2,040,441,203
Total manufacturers shipments, 2012 ($1,000) 5,696,729,632
Total merchant wholesaler sales, 2012 ($1,000) 5,208,023,478
Total retail sales, 2012 ($1,000) 4,219,821,871
Total retail sales per capita, 2012 $13,443
Mean travel time to work (minutes), workers age 16 years+, 2013-2017 26.4
Median household income (in 2017 dollars), 2013-2017 $57,652
Per capita income in past 12 months (in 2017 dollars), 2013-2017 $31,177
Persons in poverty, percent 12.30%
Total employer establishments, 2016 7,757,807
Total employment, 2016 126,752,238
Total annual payroll, 2016 ($1,000) 6,435,142,055
Total employment, percent change, 2015-2016 2.10%
Total nonemployer establishments, 2016 24,813,048
All firms, 2012 27,626,360
Men-owned firms, 2012 14,844,597
Women-owned firms, 2012 9,878,397
Minority-owned firms, 2012 7,952,386
Nonminority-owned firms, 2012 18,987,918
Veteran-owned firms, 2012 2,521,682
Nonveteran-owned firms, 2012 24,070,685
Population per square mile, 2010 87.4
Land area in square miles, 2010 3,531,905.43
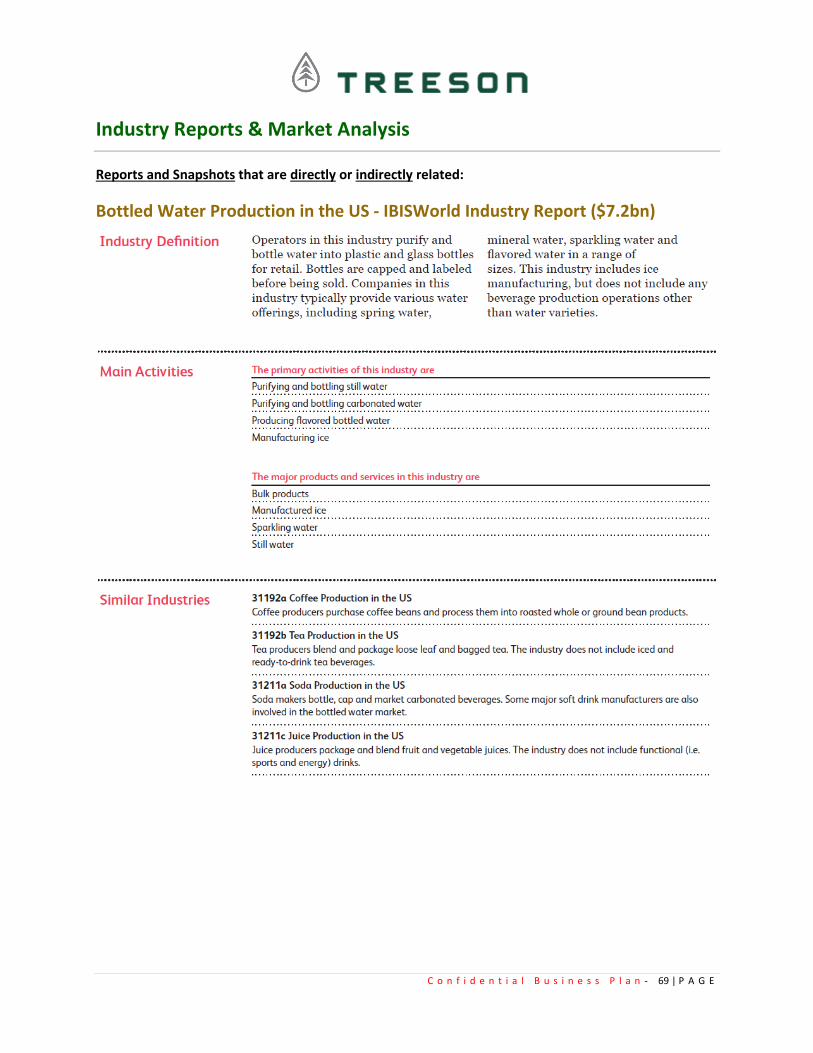
C o n f i d e n t i a l B u s i n e s s P l a n - 69 | P A G E
Industry Reports & Market Analysis
Reports and Snapshots that are directly or indirectly related:
Bottled Water Production in the US - IBISWorld Industry Report ($7.2bn)
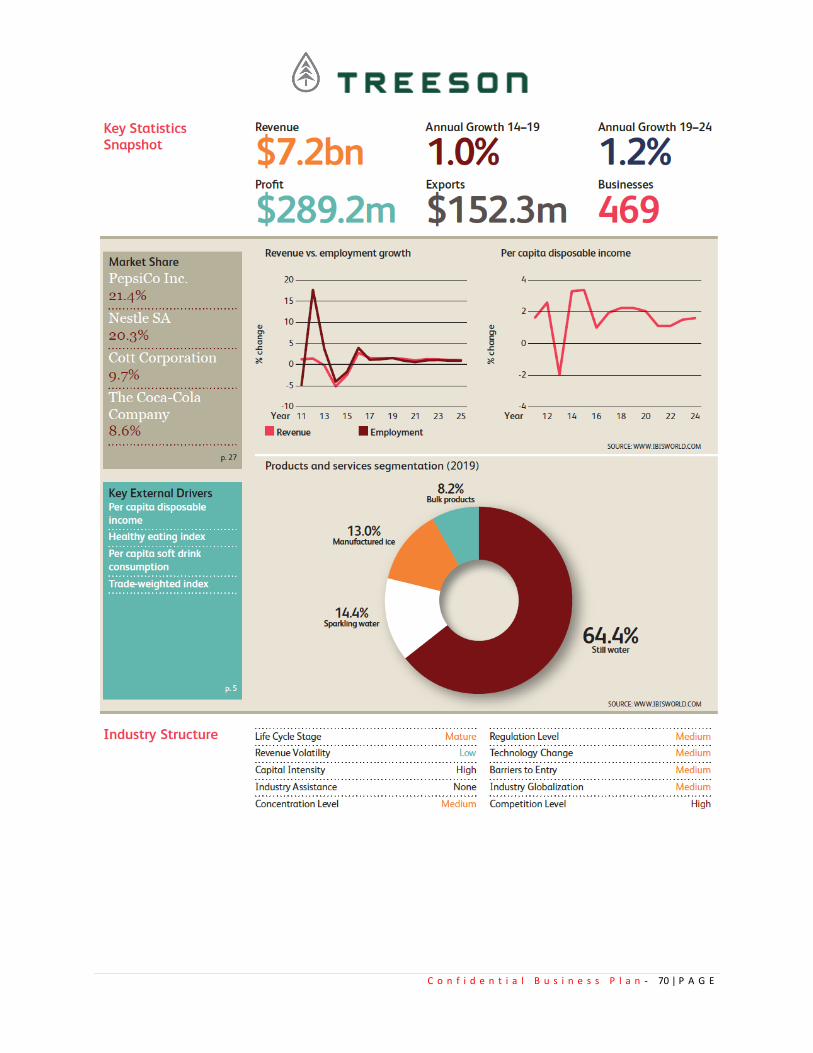
C o n f i d e n t i a l B u s i n e s s P l a n - 70 | P A G E
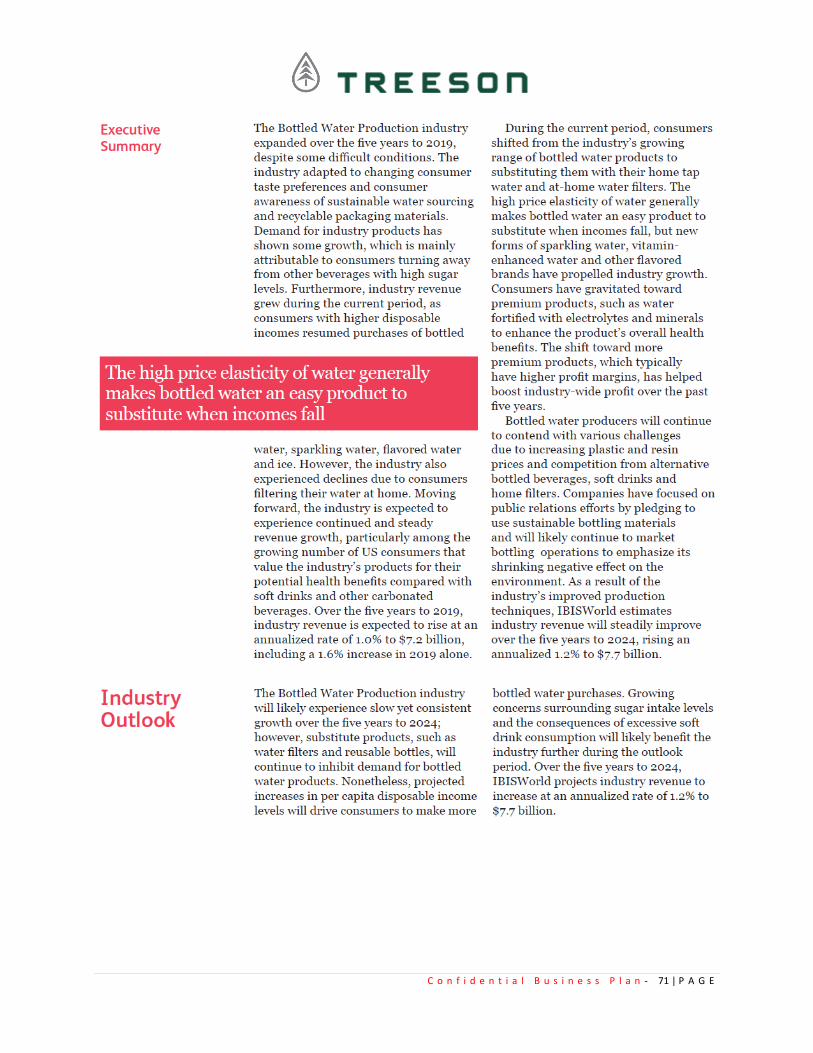
C o n f i d e n t i a l B u s i n e s s P l a n - 71 | P A G E

C o n f i d e n t i a l B u s i n e s s P l a n - 72 | P A G E
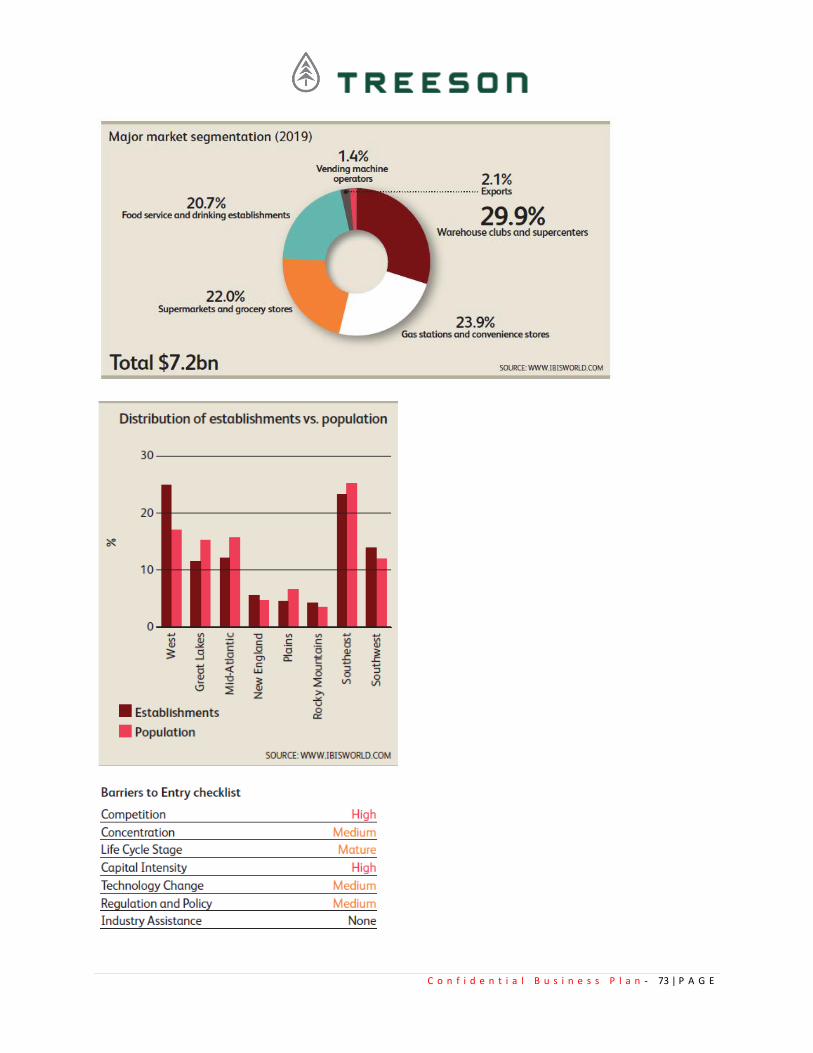
C o n f i d e n t i a l B u s i n e s s P l a n - 73 | P A G E
C o n f i d e n t i a l B u s i n e s s P l a n - 74 | P A G E
C o n f i d e n t i a l B u s i n e s s P l a n - 75 | P A G E
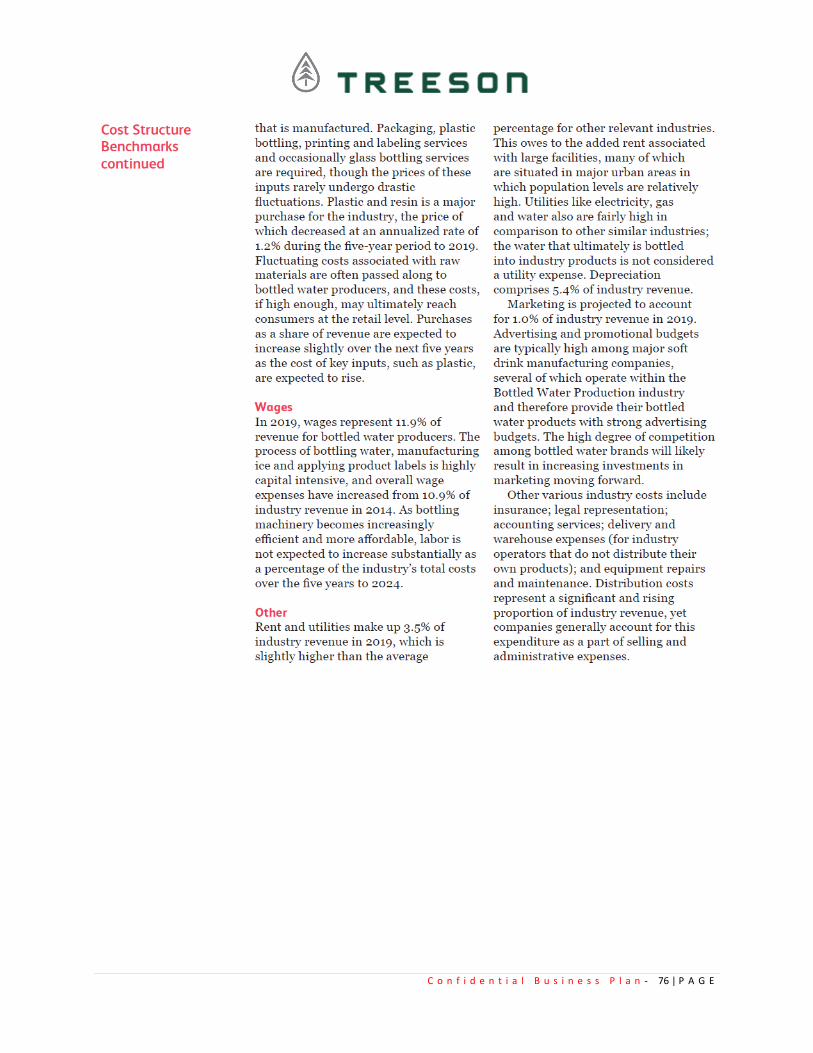
C o n f i d e n t i a l B u s i n e s s P l a n - 76 | P A G E
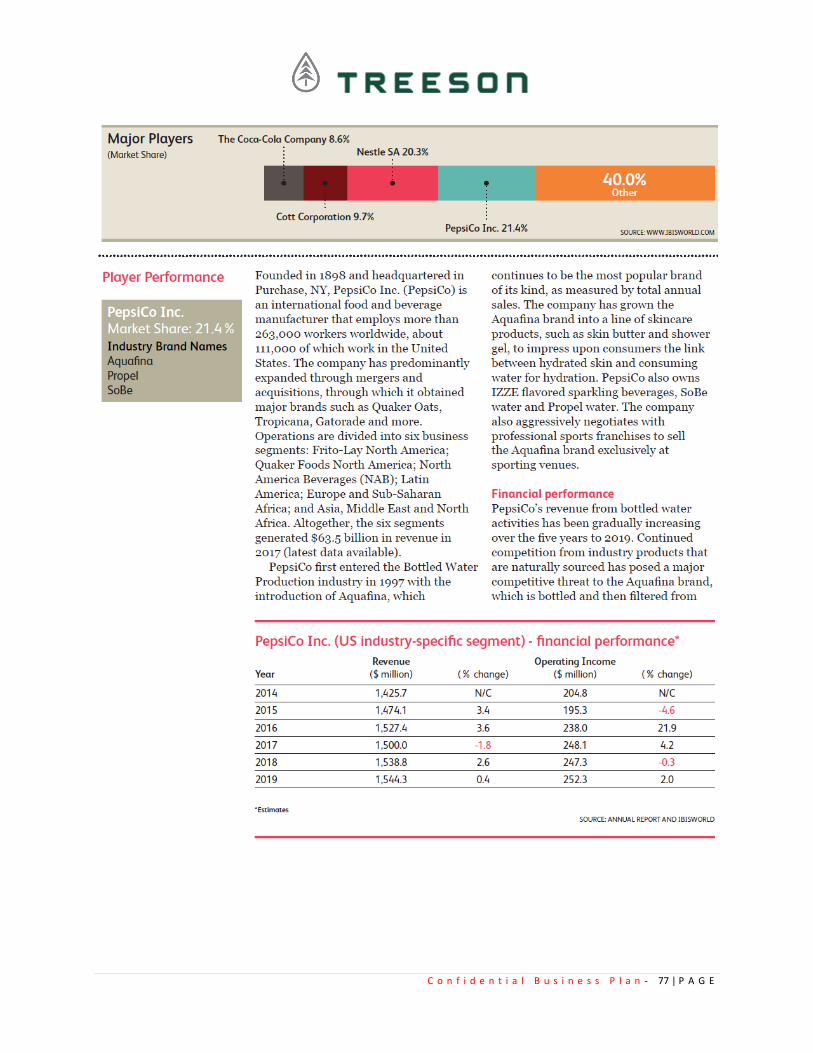
C o n f i d e n t i a l B u s i n e s s P l a n - 77 | P A G E
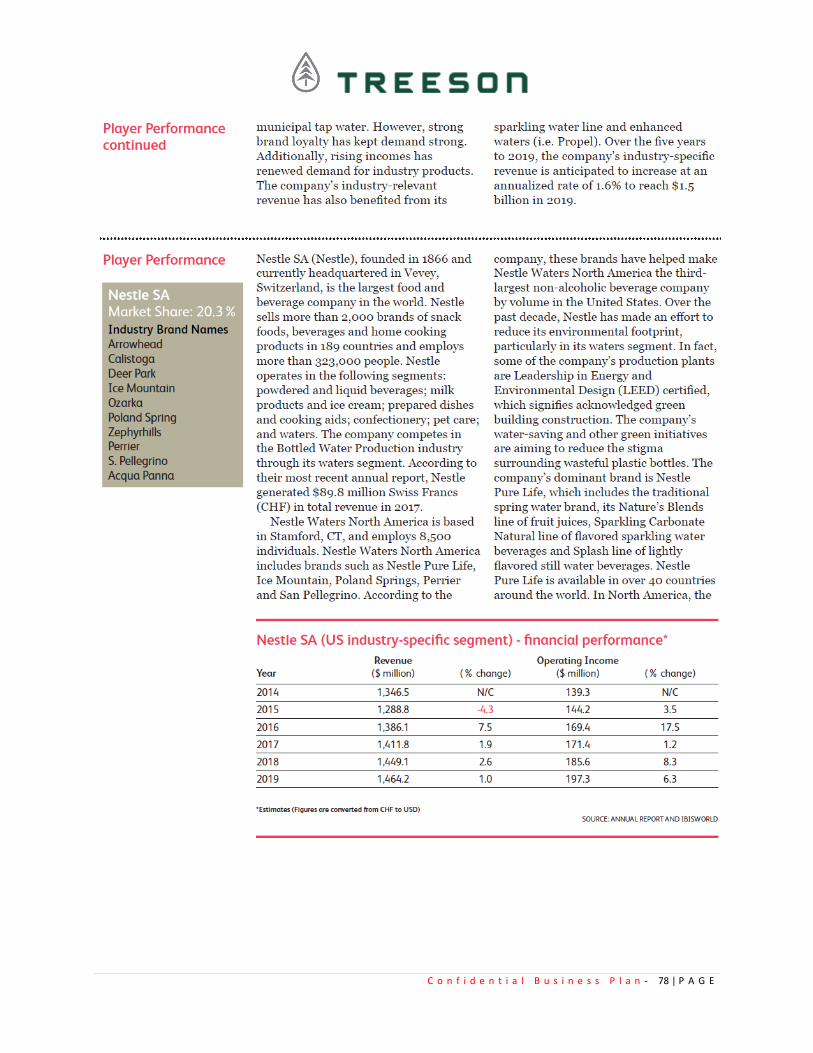
C o n f i d e n t i a l B u s i n e s s P l a n - 78 | P A G E

C o n f i d e n t i a l B u s i n e s s P l a n - 79 | P A G E
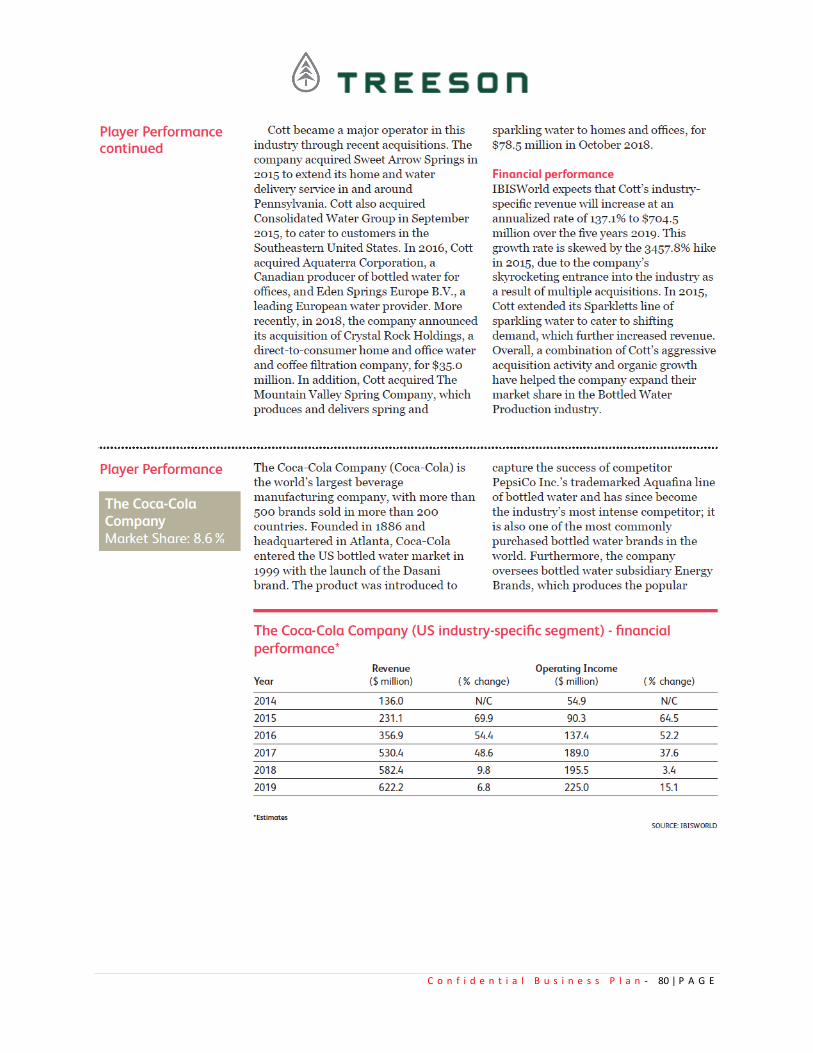
C o n f i d e n t i a l B u s i n e s s P l a n - 80 | P A G E
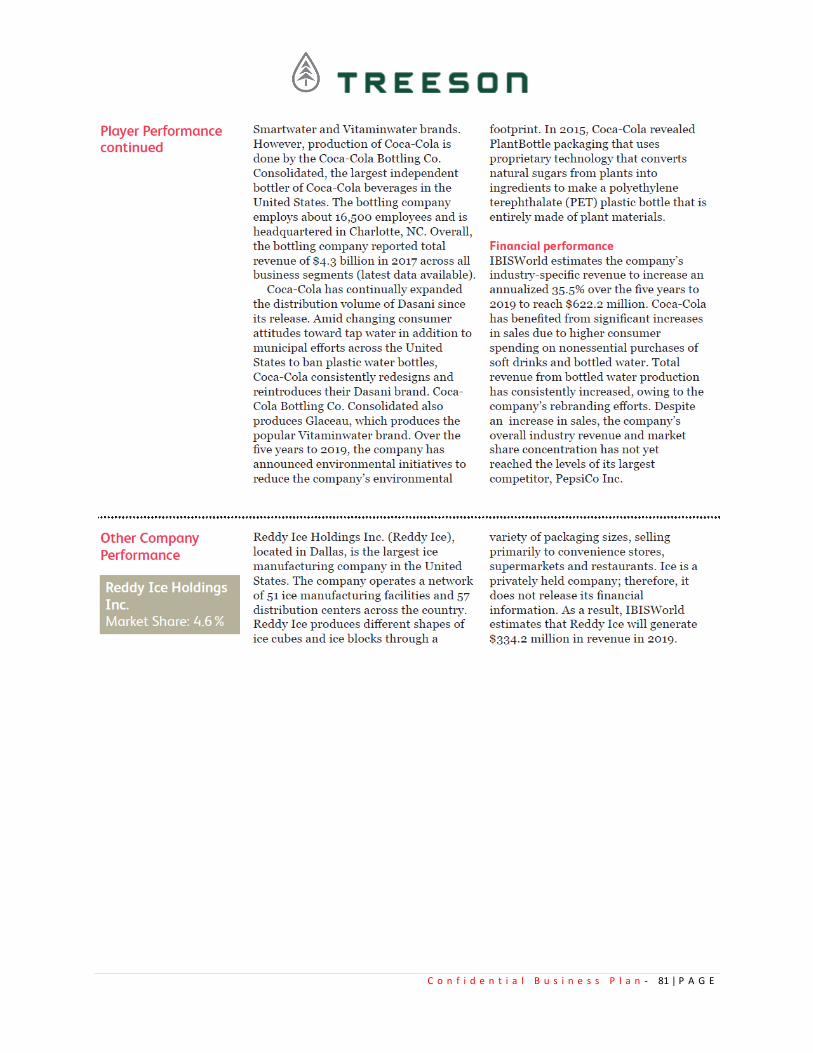
C o n f i d e n t i a l B u s i n e s s P l a n - 81 | P A G E
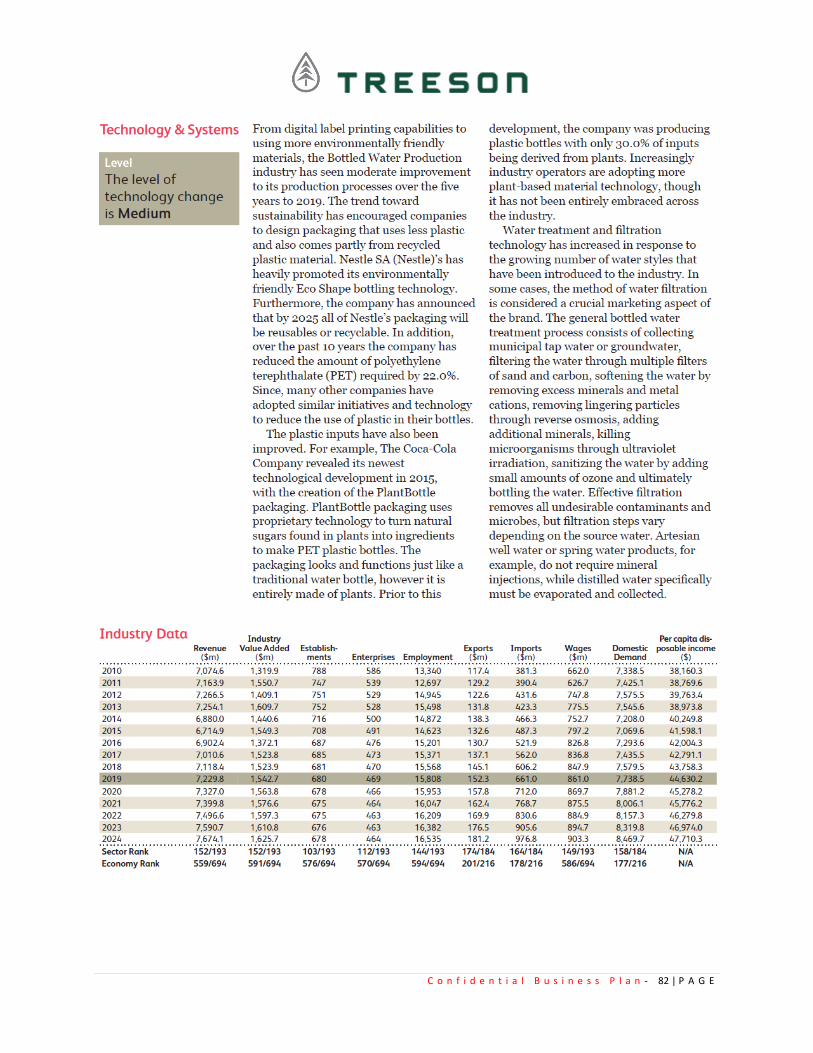
C o n f i d e n t i a l B u s i n e s s P l a n - 82 | P A G E

C o n f i d e n t i a l B u s i n e s s P l a n - 83 | P A G E
Snapshot of Energy Drink Production in the US - IBISWorld Industry Report ($8.9bn)
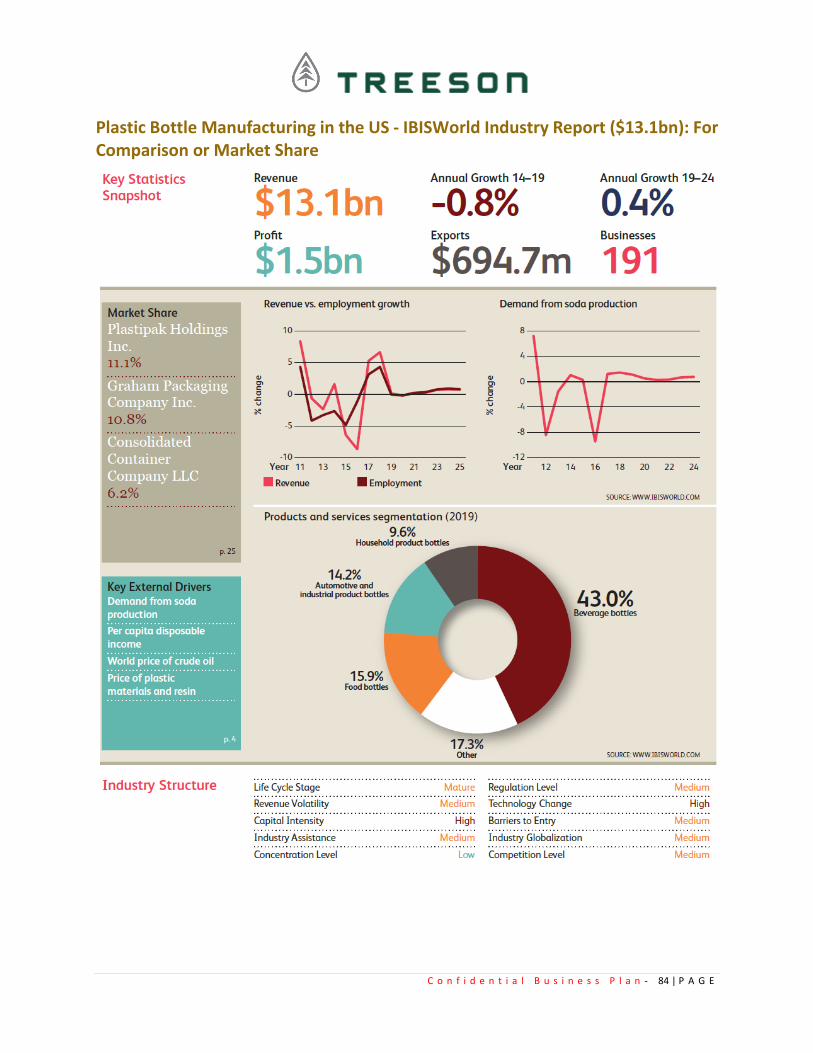
C o n f i d e n t i a l B u s i n e s s P l a n - 84 | P A G E
Plastic Bottle Manufacturing in the US - IBISWorld Industry Report ($13.1bn): For Comparison or Market Share
C o n f i d e n t i a l B u s i n e s s P l a n - 85 | P A G E
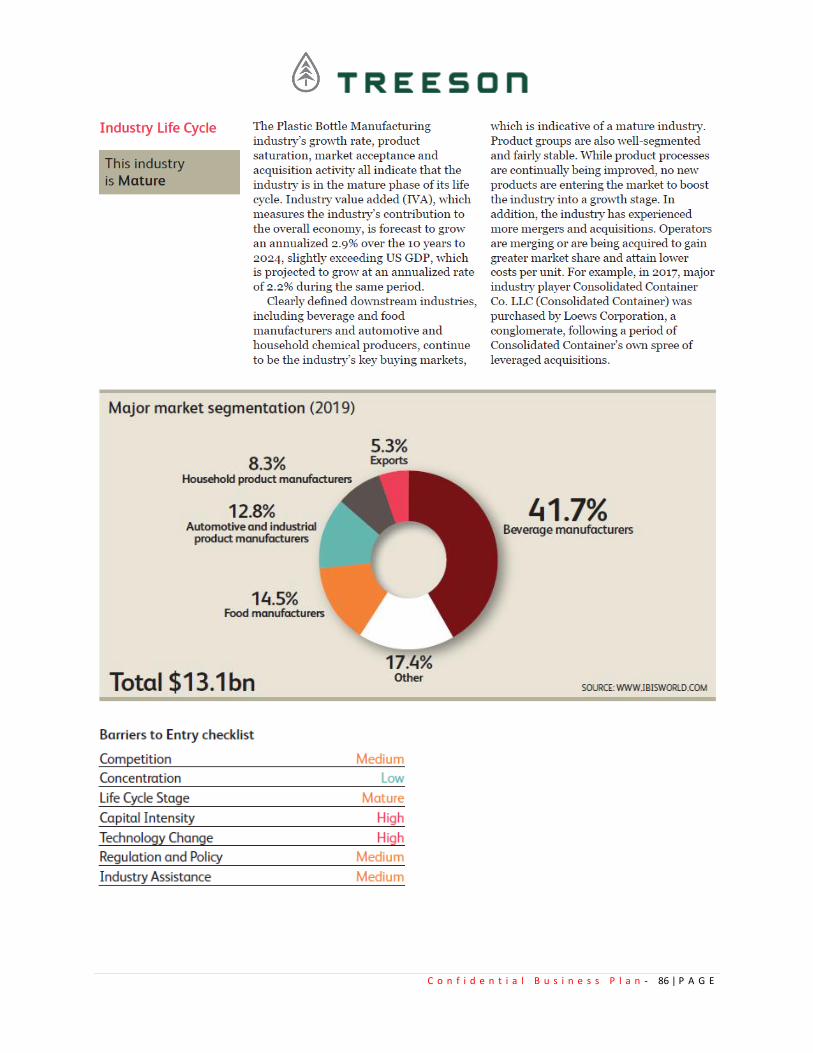
C o n f i d e n t i a l B u s i n e s s P l a n - 86 | P A G E
C o n f i d e n t i a l B u s i n e s s P l a n - 87 | P A G E
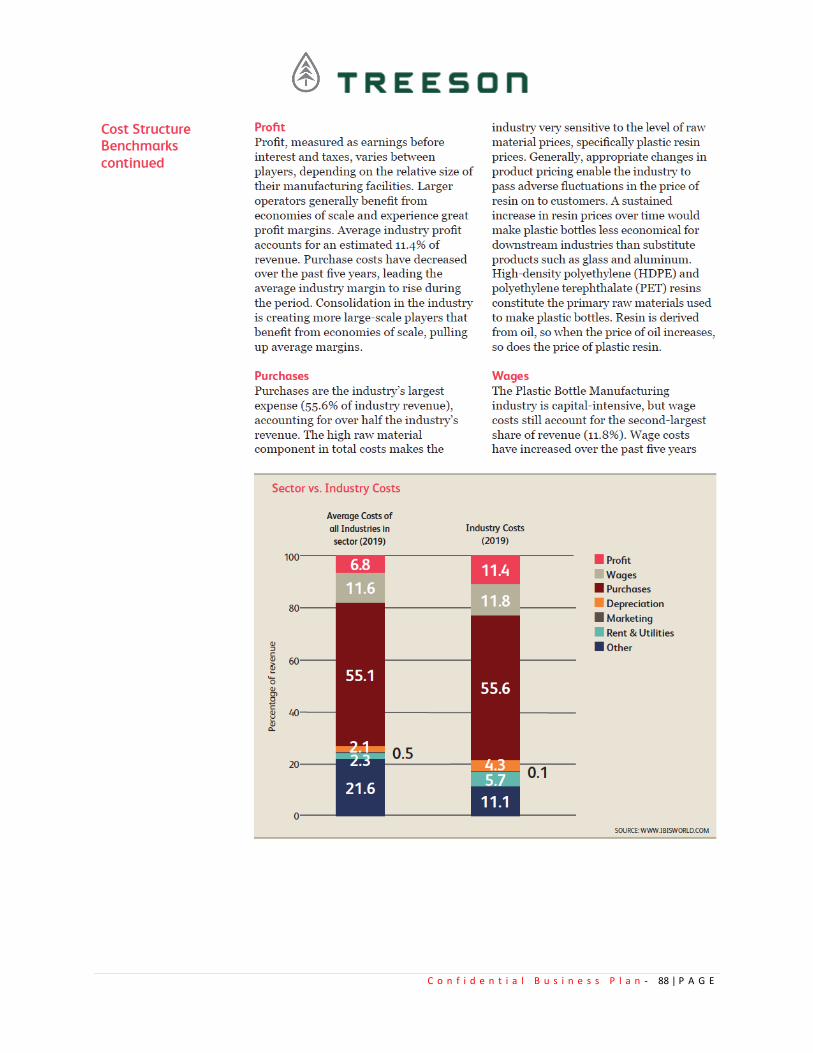
C o n f i d e n t i a l B u s i n e s s P l a n - 88 | P A G E
C o n f i d e n t i a l B u s i n e s s P l a n - 89 | P A G E
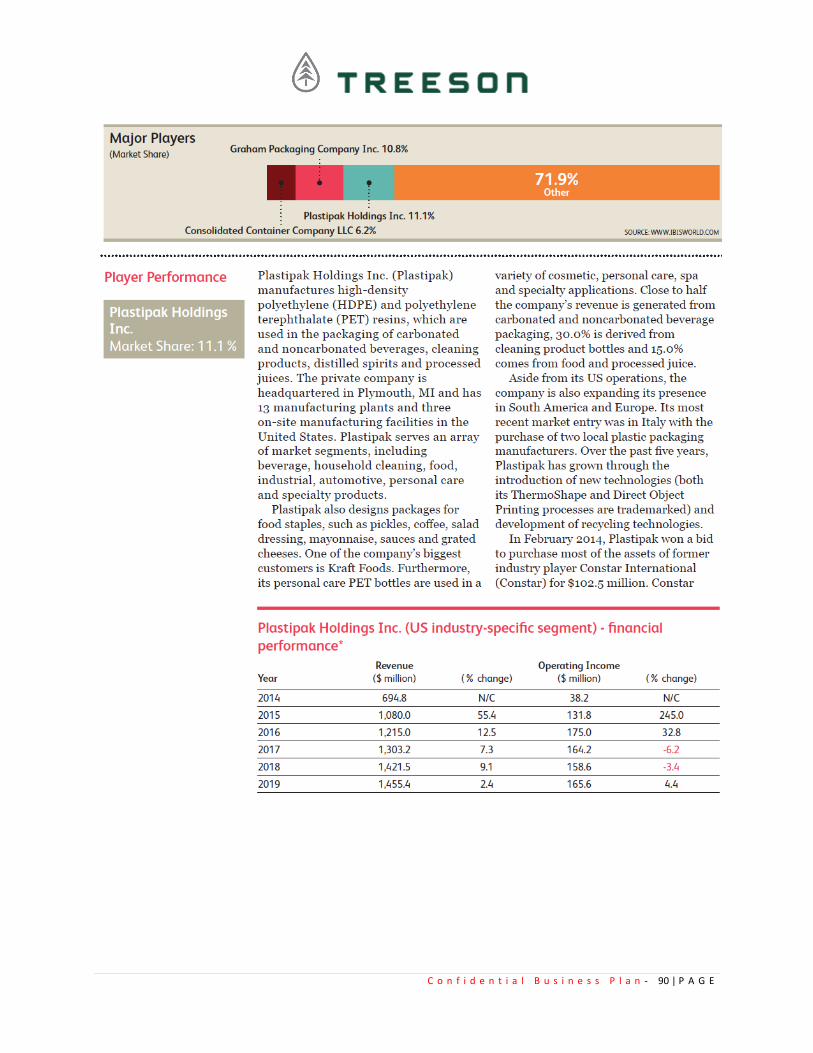
C o n f i d e n t i a l B u s i n e s s P l a n - 90 | P A G E

C o n f i d e n t i a l B u s i n e s s P l a n - 91 | P A G E
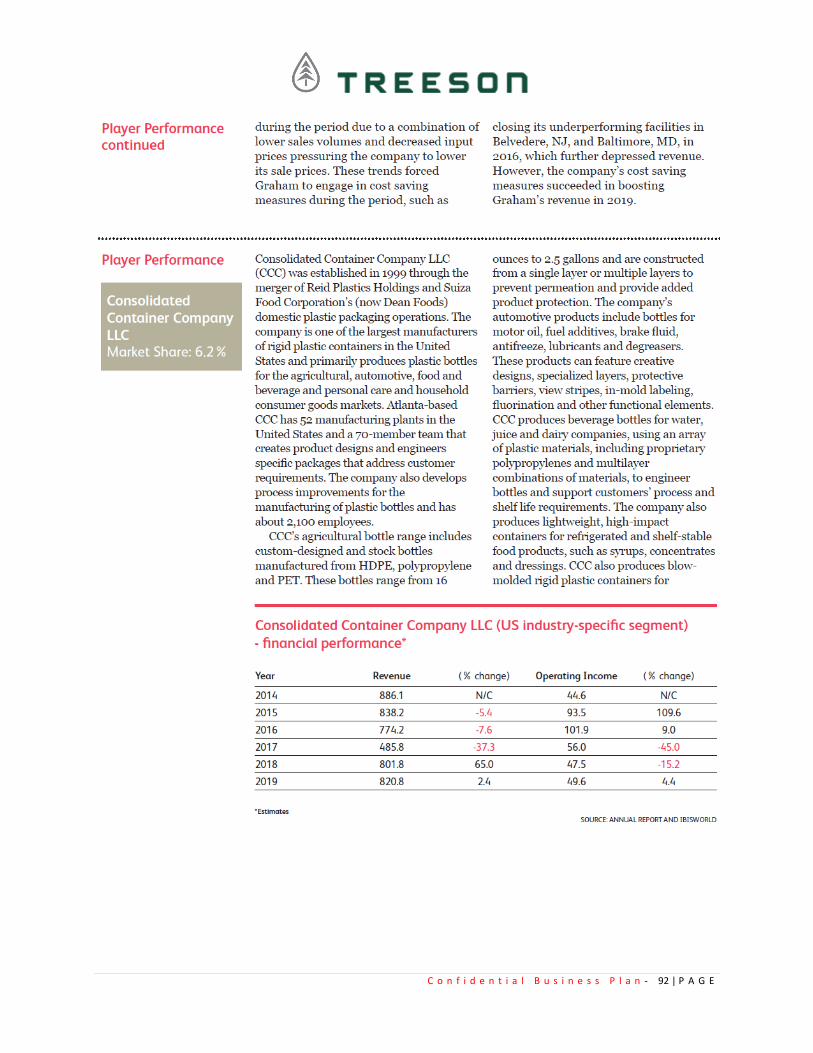
C o n f i d e n t i a l B u s i n e s s P l a n - 92 | P A G E
C o n f i d e n t i a l B u s i n e s s P l a n - 93 | P A G E
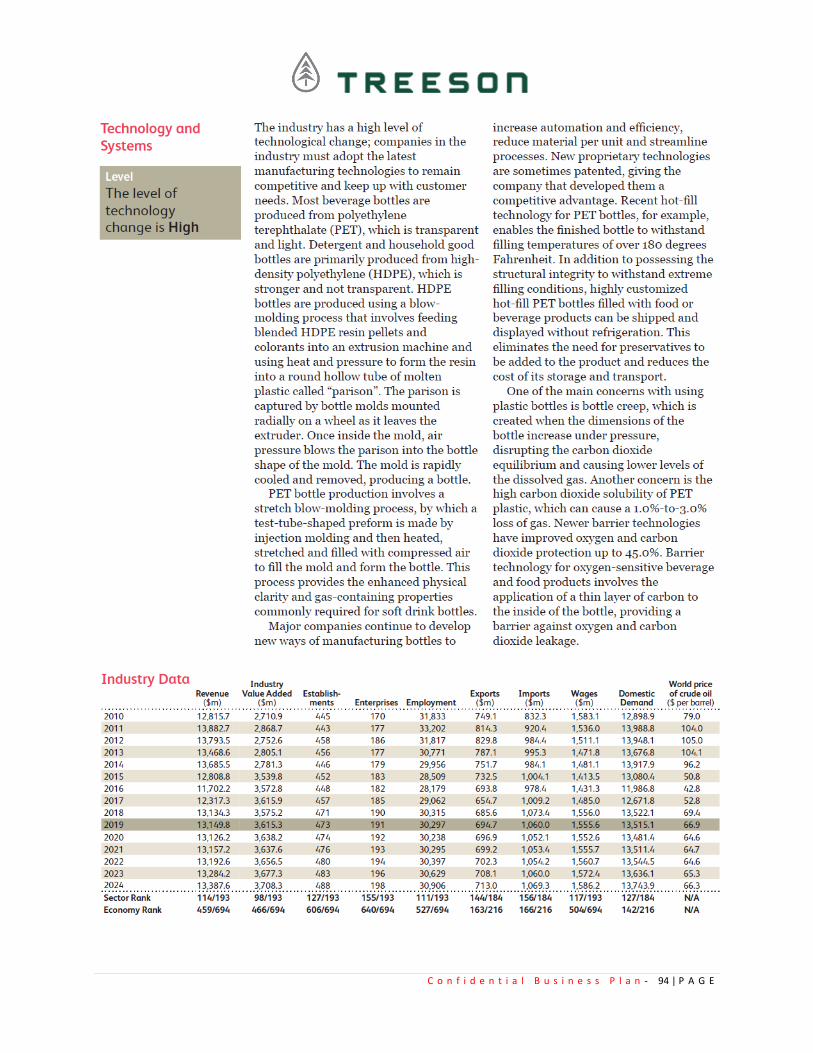
C o n f i d e n t i a l B u s i n e s s P l a n - 94 | P A G E

C o n f i d e n t i a l B u s i n e s s P l a n - 95 | P A G E
Snapshot of Recycling Facilities in the US - IBISWorld Industry Report ($6.6bn)

C o n f i d e n t i a l B u s i n e s s P l a n - 96 | P A G E
Snapshot Retail Trade in the US - IBISWorld Sector Report ($5.5tr)
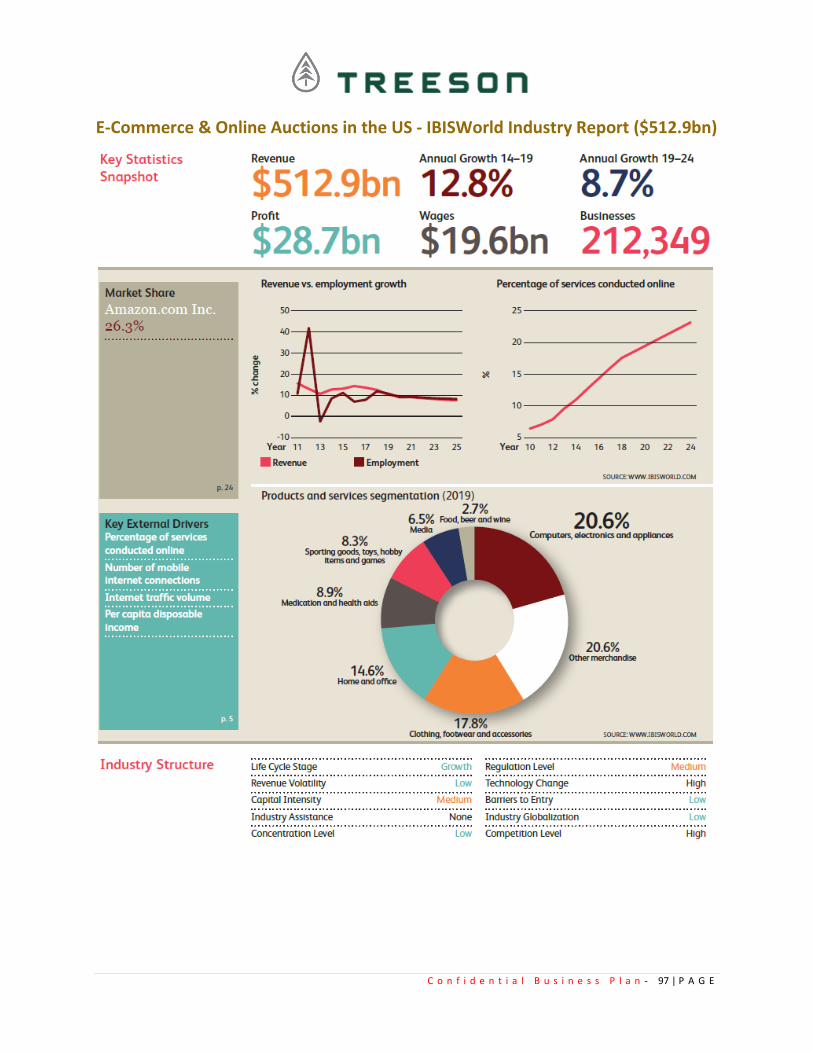
C o n f i d e n t i a l B u s i n e s s P l a n - 97 | P A G E
E-Commerce & Online Auctions in the US - IBISWorld Industry Report ($512.9bn)
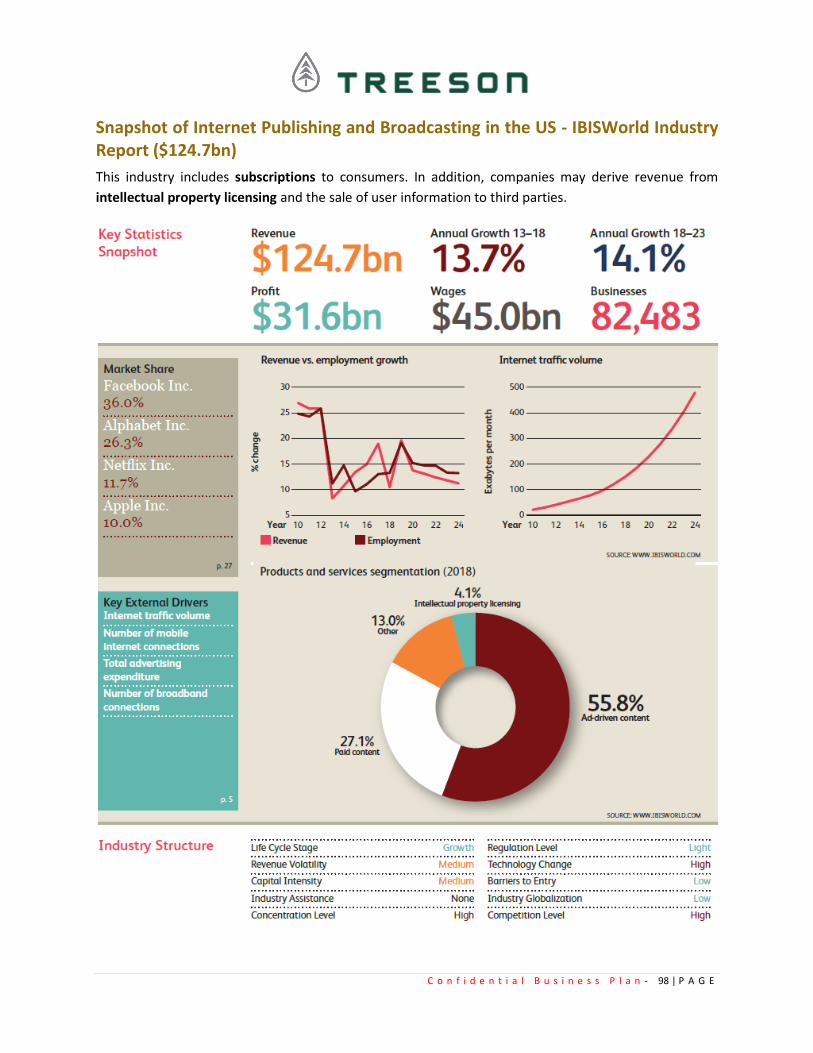
C o n f i d e n t i a l B u s i n e s s P l a n - 98 | P A G E
Snapshot of Internet Publishing and Broadcasting in the US - IBISWorld Industry Report ($124.7bn)
This industry includes subscriptions to consumers. In addition, companies may derive revenue from
intellectual property licensing and the sale of user information to third parties.
C o n f i d e n t i a l B u s i n e s s P l a n - 99 | P A G E
Marketing Strategy
Marketing
Treeson utilizes a variety of marketing methods that collectively make up the Company’s marketing
strategy. Treeson will utilize the latest technology and advertising to tell our story direct to consumers.
With the help of strategic corporate partners, influencers, and digital media Treeson will educate
consumers on the one of a kind attributes of our brand, products and services.
The Company’s primary means of attracting new customers include the following:
• Tech
• Internet
• Video
• TV/Story-sharing
• Corporate
• Events
• Influencers
• Partners
Additional means of attracting new clients and customer's includes:
• Advertising
• Affiliate Marketing
• Brand Management
• Brand Managers
• Campaigns/Ad Word Campaigns
• Company’s Website
• Content Distribution
• Content Marketing
• Data Analytics
• Direct Marketing
• Email Marketing
• Emails
• Facebook Ads/Google Ads
• Free Content
• Google Ad Words
• Influencer Marketing
• Internet Marketing Funnels
• Landing Pages For KEYWORDS
• Lead Generation
• Mobile Marketing
• Online Marketplaces
C o n f i d e n t i a l B u s i n e s s P l a n - 100 | P A G E
• Paid Search Campaigns
• Pay-Per-Click (PPC)/ Bid Per Click
• PR
• Routing Through Blog And Social Media
• SEM (Search Engine Marketing)
• SEO (Search Engine Optimization)
• Social Media
• Social Media Marketing
• Website Design
• Word-Of-Mouth
The marketing team will execute an integrated marketing communications strategy with the following
objectives:
• Generate Brand Awareness
• Drive Participation
• Drive Usage and Users
The marketing communications strategy will employ the following marketing activities to build effective
branding and engagement initiatives.
• Online Marketing
• Mobile Marketing
• Email Marketing
• Search Engine Marketing
Marketing Programs
• Responsive Website, Platform, and Portal
• Blog
• Company News
• Market Reports
• Videos
• Newsletter
• SEO
• Tracking Results
Web Plan Summary
treeson.us
https://www.youtube.com/watch?v=FYy6MK3smps&t=28s
Treeson has a well designed website. The Company understands the increasing importance of online
marketing. The management team will continually strive to have a competitive edge by maintaining a
significant presence, and plans for sophisticated exposure online. It is important that those interested in
C o n f i d e n t i a l B u s i n e s s P l a n - 101 | P A G E
finding their services will do so from online first and easily. Treeson will apply the necessary resources to
be an industry leader in utilization of the internet’s potential.
Strategic Alliances
Treeson is constantly working to build a network of key individuals and companies that work as alliances
to accomplish its major strategies. The Company is also committed to networking with any and all
individuals that may have a favorable impact on the business. A great strength of this Company is its vast
network of professional alliances that stand ready, willing, and able to facilitate the growth of this
Company as soon as it begins to take off. The Company will be most concerned with developing concrete
alliances that ensure the funding the Company needs to grow, as well as developing support systems for
the businesses that facilitate their success.
Branding & Corporate Literature
The majority of the positioning and branding strategies as well as the creative aspects of the brands,
logos, slogans, Company fonts, color scheme, etc. will be the responsibility of The management/marketing
teams. The management/marketing teams will be responsible to assure that all personnel use the
designated logo and brand uniformly. The advice of a web designer and graphic artist will be blended to
create the best possible presentation at all levels and in all venues.
Positioning Statement
Treeson takes the position that its primary role in the marketplace is to create the first consumer products
co-op for the planet to showcase our brand and other brands that use our packaging and our system. This
is how Treeson will distinguish itself in the marketplace. The Company wants people associate Treeson
with quality products and solutions.
C o n f i d e n t i a l B u s i n e s s P l a n - 102 | P A G E
Key Members of the Company/Management
The Company is the vision of Carlton Solle, a beverage, entertainment, and eco-lifestyle entrepreneur.
Supported by an advisory board of seasoned and successful entrepreneurs, the management team
includes professionals in communications, design, engineering, sales, and technology.
The Company is a for profit entity with products in the beverage, packaging, recycling, energy and
technology markets.
Management Team
Carlton Solle, Founder, CMO, & Owner
Carlton’s background includes more than 20 years in sales, marketing, and business development. His
portfolio of successful ventures includes a long list of projects he has developed from concept to market.
He has worked both independently and with some of the world’s most trendy and well known consumer
brands. He is a natural marketer and consummate idea guy with a passion for the environment and
creating products that not only raise awareness about environmental issues but also empower people to
help make a difference.
Carlton brought Red Bull into the club scene and helped Rockstar Energy Drink expand into Central &
South America. Learning about the beverage business first hand and then realizing the dark underbelly of
the industry and the planet’s plastic epidemic 10 years ago, he set out to engineer a plant-based packaging
solution, the best possible. We will be seeking industry experience to help manage the beverage aspect
and as we grow into the renewable energy, CBD infusion, and other aspects under the McCloud lease, we
will hire accordingly.
He has worked both independently and with some of the world’s most trendy and well known consumer
brands. Many of these endeavors have been multimillion dollar revenue generators that have attracted
great attention with both national media and popular culture. He is a natural marketer and a consummate
idea guy with passion and energy that are contagious and unwavering.
The Treeson Story: as told by Carlton Solle
While living in Costa Rica, I took my wife and daughter out to the coast for the day. While walking down a
beautiful, pristine beach I saw an old plastic water bottle. I picked it up to drop in the trash and then I came
across another, and another, and another... By the end of the walk I had picked up all I could carry.
Later that night, I did some research and found out about the “Great Pacific Garbage Patch” a swirling
vortex of trash floating in the middle of the ocean, larger than the state of Texas and growing at an
alarming rate every year. That’s when I came up with an idea. What if we could take something bad and
turn it into something good?
C o n f i d e n t i a l B u s i n e s s P l a n - 103 | P A G E
I had already spent some time previously working on a waste-to-energy project so I was familiar with the
technologies available. The best of those is a machine that turns the material into a gas that can be used
as fuel to power a generator to create electricity. The machine converts the majority of any material placed
into it into gas, leaving only a small bi-product. The bi-product and emissions are of course determined by
what you put into the machine so to create clean energy that meant we couldn’t use traditional plastic
bottles. We needed to create our own bottle and it would have to be the greenest bottle to ever exist.
The other concern was that, because plastic bottles were so light, it would take a lot of them to actually
do what we wanted to do and we needed to ensure that we had a steady stream of bottles coming back
to generate a substantial amount of power.
With that in mind, I started studying recycling to see if there was a way to utilize the existing system. Of
the 50 billion plastic water bottles sold in the U.S. every year less than twenty percent actually get recycled.
The remaining 40 billion end up in landfills, rivers, and oceans around the world. So much of the “recycling”
we so diligently and responsibly sort at home still ends up in a landfill or gets put on a barge and becomes
somebody else’s problem. So, if you put something into the existing system, there was no way to know
where it would end up. The only way that we could actually guarantee that our bottles did not end up
where they should not, and ensure a steady stream of them, was to take them out of the trash. So, we
designed our own return recycling system.
It’s a totally new system that eliminates trash & uses the bottle returned to make clean energy to do it all
over again. It's convenient, it's free, and it supports the oldest government institution in the United States
of America, the USPS, and the organization with the greenest fleet on the streets. If we can do it with
bottled water and beverage packaging why couldn’t we do it with everything on the supermarket shelf?
It’s a big idea and a big shift and will take a lot of work to put in motion but in the end it could be a huge
step in the right direction!
Most companies design their bottles to make them look cool so you will grab their bottle off the shelf. With
our bottle, it not only had to look cool and function like a traditional bottle but it also had to literally be
not only the best bottle for you and your family, but also the best bottle for the planet. It had to be the
greenest to ever exist and... oh yeah, it now also had to be able to be returned in the mail! Basically, it was
a bottle that would be designed to put all others to shame. We went through over 100 different bottle and
label designs. We kept on running into issues until the day my daughter helped bring it all together. She
loves the outdoors and is always picking up stuff and bringing it back home with her. One of those
souvenirs, a perfectly shaped leaf, ended up becoming the design inspiration for the shape of our bottle
and the key to it all. That is why we call it The Bio Bottle. It is made of plant-based materials, not petroleum
based.
It is 100% toxin free and is certified free of any GMOs (many "bio-plastics" are made from GMO corn). Our
labels are made from rocks and are completely safe for the environment. It looks similar to the traditional
bottles you are used to it fits in the cup holder in your car and it feels great in your hand but there is one
major difference that you might not see at first glance. Its shape allows it to naturally collapse flat when
C o n f i d e n t i a l B u s i n e s s P l a n - 104 | P A G E
empty for easy mailing. This gives you a way to take it out of the trash stream and return it to us so we
can use it to make clean energy to make more bottles to do it all over again.
Water is truly an incredible thing. We are all born in it, we are all made of it, it’s the main ingredient in
practically everything, and it really does help make the world go round. I come from a place where there
a lot of folks promoting the use of tap water so I started studying the difference. I learned that many, if
not most, of the popular brands on the shelf are just that, actually municipal tap water with some fancy
marketing thrown in.
I also learned that, as crazy as it sounds, water actually has a memory, and it is affected by everything that
it goes through to get to us. So, every twist and turn, every different container, every process is "stored" in
the water and affects it all along the way. So, the folks promoting tap water and refillable canteens are
doing a good thing by helping reduce waste but they are also promoting us all drinking water that has
travelled miles through old pipes and been through a fight to get out of that tap. Is that the water you
want to be drinking?
If you don't believe me, there is a fun test that you can do for yourself: Take tap water and natural spring
water and put them both in front of your dog or cat and see which one they choose. You will see that they
choose the spring water every time. So, to make the best water product, we absolutely had to start with
the best natural spring water.
After studying water in its natural environment, I got to know water in the wild and, in doing so, I got to
know the rainforest. Much like a fruit or a vegetable once “harvested” water starts to deteriorate so we
not only had to start with the best source, but we also needed to figure out how to replace what is lost
after you take it out of its natural environment and what is lost after it is packaged. I knew that, if we could
do all of that, we would create a product so fresh and so natural that you would be able to taste the
difference. We did it! We start with the world's finest spring water. We then purify it via a system modeled
after how water is filtered in the rainforest canopy. We then add back the vital nutrients and the
electrolytes lost during purification, replacing them to help balance your body’s natural performance. We
also add oxygen to return it to the state it was in at the source, giving your body a boost of natural
Rainforest energy. There is nothing else out there like it.
Once we had the bottle and the water figured out, we looked at the product as a whole. That was really
the first time we were able to look at the big picture. The big idea was to use bottles to make clean energy
but that was really only addressing a symptom of a much bigger problem. Millions of people around the
world do not have access to clean water sources and that is why bottled water is actually a necessity in
many places for those who can afford it. We wanted to do something about that and that was when we
came up with the real big idea. To give you the power to help restore water sources around the world so
people could once again get water from that natural source that used to be pure and clean.
What are Mother Nature’s best water filters? Trees! Not only do you help get rid of trash and create clean
energy but you also help restore vital habitats and ensure that there will be plenty of fresh water and clean
C o n f i d e n t i a l B u s i n e s s P l a n - 105 | P A G E
air for all of us for years to come! We’re literally putting the power of a rainforest into the palm of your
hand.
Mark Tillemans, CEO, Owner
Mark has years of leadership within social, educational, and economic development programs. As an
elected County Supervisor, Mark has a strong understanding of the public policy process. He has
successfully managed multi-million dollar budgets throughout his career and is respected for creating
rewarding employment opportunities in the public, private, and tribal sectors. With his entrepreneurial
spirit and results-based approach to new endeavors, Mark’s enthusiasm and passion create an optimal
working environment. Perhaps his strongest attribute is his ability to connect people with purpose while
leading his team to success.
Brian Whalen
Brian's unique perspectives are an indispensable asset to the CEOs he serves. Two master's degrees in
finance and taxation from world-class business schools compliment his unwavering attention-to-detail
and focus on regulatory compliance. Rarely will you find a CPA with two decades of experience supervising
the operation of multi-billion-dollar assets and broad groups of people in the military, government, and
massive corporations.
Taylor Woods
Taylor has maintained an entrepreneurial career path spanning clean energy, beverage, cannabis, and
clean technology. He has developed various technologies including carbon dioxide reclamation
equipment, bio-plastic formulations, and semiautonomous control systems. His background includes
mechanical engineering, process development, marketing, strategy, automation/industrial controls, and
material science.
Mark Levitan, Legal, Key Consultant
Mark has over 20 years of experience as a transactional attorney working in business development. He
has worked extensively on behalf of businesses and American Indian tribes across the United States on
economic development projects. Mark has been an active presence in the cannabis business field for more
than 3 years. He has negotiated and implemented cannabis investment and development agreements,
and has participated in several California cannabis legislative and regulatory efforts. He is regularly invited
to speak on cannabis development issues at conferences, and provides consultation to Congressional staff
on cannabis legislation drafting.
Management
Treeson recognizes that in any growing Company management personnel often have to fill more than one
role. As a result a gap or gaps may exist until the Company is developed enough to have a specific person
for every task required. Treeson currently has everything covered and feels confident that each task is
being handled competently by management. As the Company hires more people the Company will always
C o n f i d e n t i a l B u s i n e s s P l a n - 106 | P A G E
be sensitive to this issue and prevent any weaknesses by planning a contingency program that overlaps
job responsibilities.
The Company is confident that the team has the experience and skills needed to grow this Company.
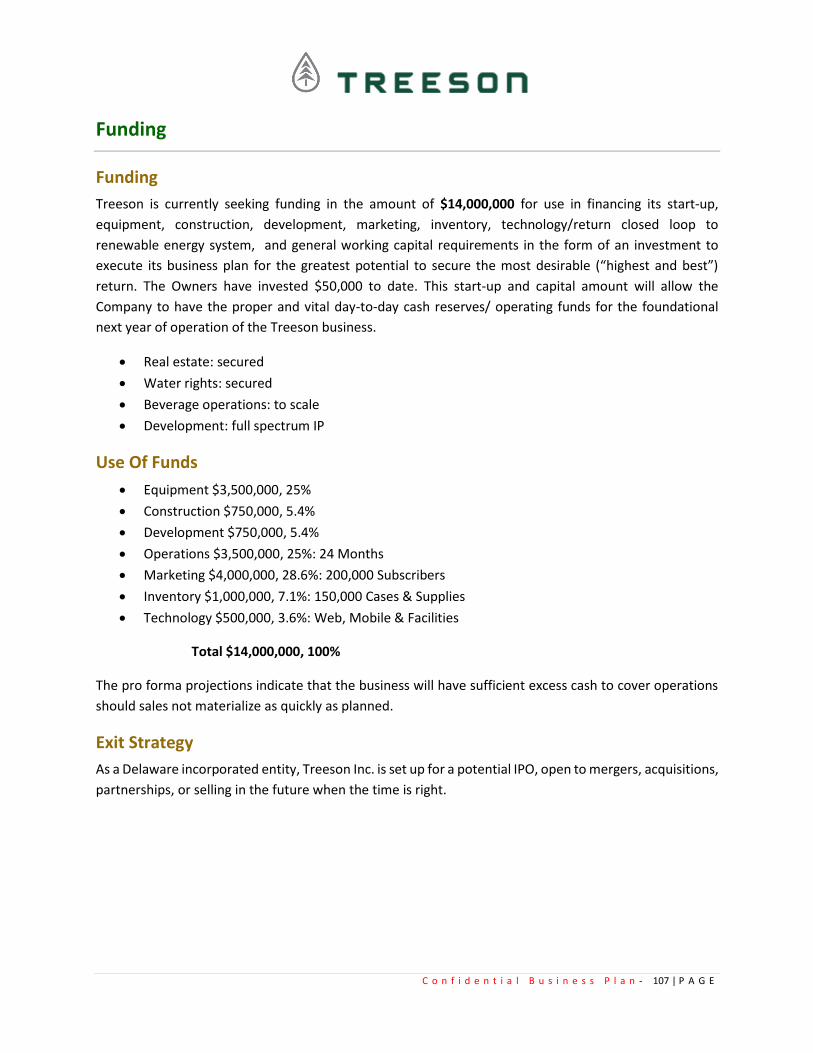
C o n f i d e n t i a l B u s i n e s s P l a n - 107 | P A G E
Funding
Funding
Treeson is currently seeking funding in the amount of $14,000,000 for use in financing its start-up,
equipment, construction, development, marketing, inventory, technology/return closed loop to
renewable energy system, and general working capital requirements in the form of an investment to
execute its business plan for the greatest potential to secure the most desirable (“highest and best”)
return. The Owners have invested $50,000 to date. This start-up and capital amount will allow the
Company to have the proper and vital day-to-day cash reserves/ operating funds for the foundational
next year of operation of the Treeson business.
• Real estate: secured
• Water rights: secured
• Beverage operations: to scale
• Development: full spectrum IP
Use Of Funds
• Equipment $3,500,000, 25%
• Construction $750,000, 5.4%
• Development $750,000, 5.4%
• Operations $3,500,000, 25%: 24 Months
• Marketing $4,000,000, 28.6%: 200,000 Subscribers
• Inventory $1,000,000, 7.1%: 150,000 Cases & Supplies
• Technology $500,000, 3.6%: Web, Mobile & Facilities
Total $14,000,000, 100%
The pro forma projections indicate that the business will have sufficient excess cash to cover operations
should sales not materialize as quickly as planned.
Exit Strategy
As a Delaware incorporated entity, Treeson Inc. is set up for a potential IPO, open to mergers, acquisitions,
partnerships, or selling in the future when the time is right.
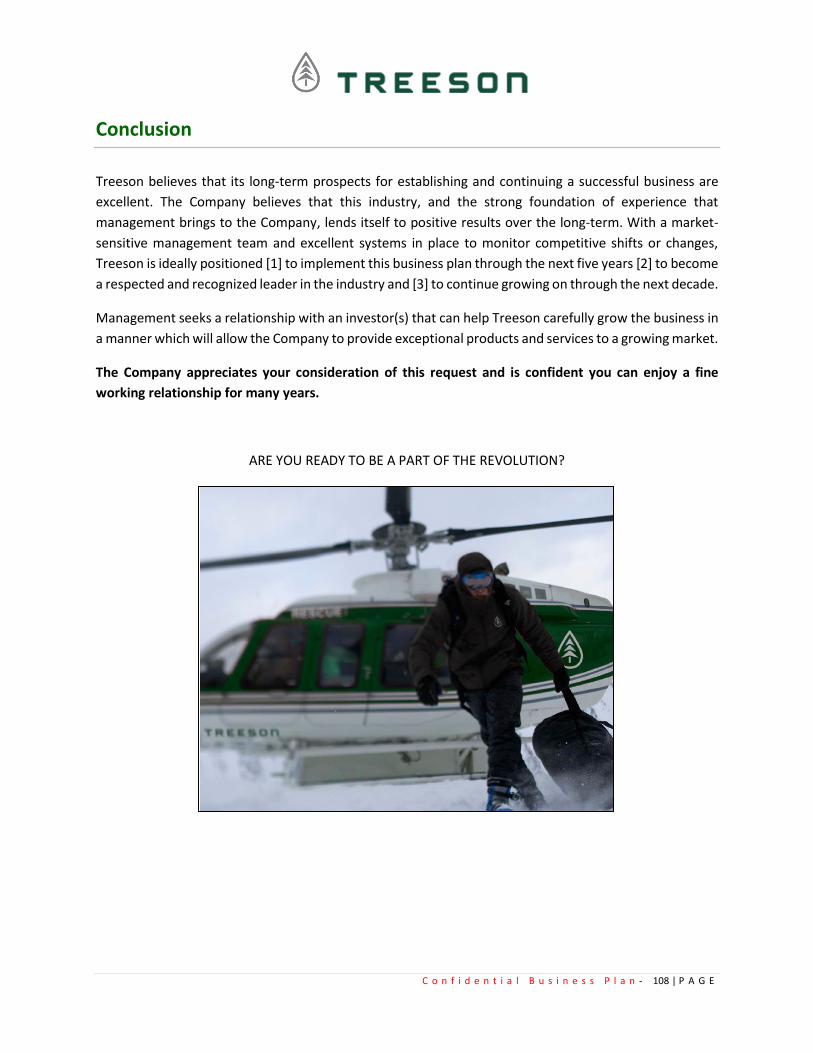
C o n f i d e n t i a l B u s i n e s s P l a n - 108 | P A G E
Conclusion
Treeson believes that its long-term prospects for establishing and continuing a successful business are
excellent. The Company believes that this industry, and the strong foundation of experience that
management brings to the Company, lends itself to positive results over the long-term. With a market-
sensitive management team and excellent systems in place to monitor competitive shifts or changes,
Treeson is ideally positioned [1] to implement this business plan through the next five years [2] to become
a respected and recognized leader in the industry and [3] to continue growing on through the next decade.
Management seeks a relationship with an investor(s) that can help Treeson carefully grow the business in
a manner which will allow the Company to provide exceptional products and services to a growing market.
The Company appreciates your consideration of this request and is confident you can enjoy a fine
working relationship for many years.
ARE YOU READY TO BE A PART OF THE REVOLUTION?

C o n f i d e n t i a l B u s i n e s s P l a n - 109 | P A G E
Pro Forma - 5 Year Financial Forecast
Treeson’ financial projections show that the Company will competently utilize the requested funding to
capitalize its growth efforts. The Company projects a significant increase in net income over the next (5)
years as its business plan is implemented. The Company has fully developed this financial plan to cover
the next five years in business. The purpose of the financial plan is to survey solid growth through the
exciting business model punctuated by a healthy relation between continually increasing revenues, and
diligent monitoring of an optimum cost structure.
Start-up Summary/Use of Funds
Use of Start-up Funding
Expenses
Equipment $3,500,000
Construction $750,000
Development $750,000
Operations $3,500,000
Marketing / Subscribers $4,000,000
Inventory / Cases & Supplies $1,000,000
Technology / Web, Mobile & Facilities $500,000
Total Start-up Expenses $14,000,000
Total Long-Term Assets $0
Total Short-Term Assets $0
Total Start-up Expenses $14,000,000
Total Start-up Assets $0
Total Funding Requirements $14,000,000
Total Start-up Funding
Total Amount Being Requested $14,000,000
Total Funds Already Received $50,000
Total Funding $14,050,000
New Start-up Funding Being Requested
Bank Amount Being Requested $0
Investor Amount Being Requested $14,000,000
Total Amount Being Requested $14,000,000
Start-up Funding Already Received
Owner Contribution $50,000
Investor Contribution $0
Total Funding Already Received $50,000
Start-up Capital and Liabilities
Loss at Start-up (Start-up Expenses) ($14,000,000)
Total Funds Received & Requested $14,050,000
Total Start-up Assets $0
Cash Balance $28,057
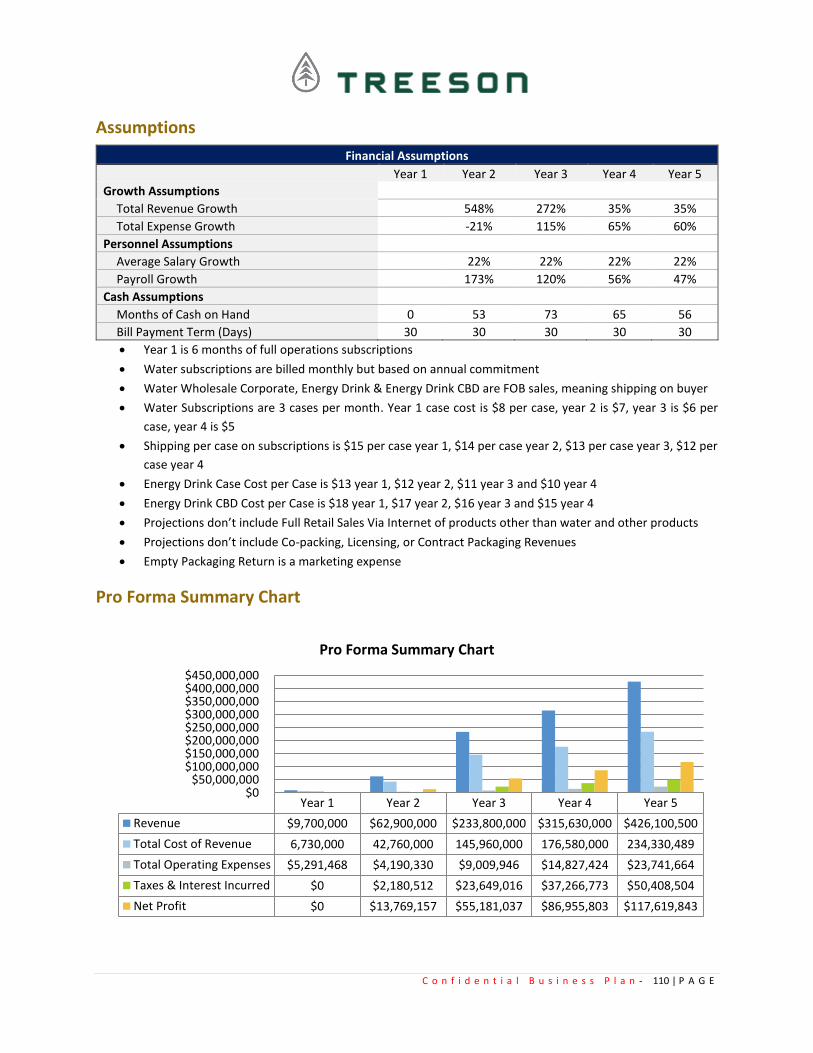
C o n f i d e n t i a l B u s i n e s s P l a n - 110 | P A G E
Assumptions
Financial Assumptions
Year 1 Year 2 Year 3 Year 4 Year 5
Growth Assumptions
Total Revenue Growth 548% 272% 35% 35%
Total Expense Growth -21% 115% 65% 60%
Personnel Assumptions
Average Salary Growth 22% 22% 22% 22%
Payroll Growth 173% 120% 56% 47%
Cash Assumptions
Months of Cash on Hand 0 53 73 65 56
Bill Payment Term (Days) 30 30 30 30 30
• Year 1 is 6 months of full operations subscriptions
• Water subscriptions are billed monthly but based on annual commitment
• Water Wholesale Corporate, Energy Drink & Energy Drink CBD are FOB sales, meaning shipping on buyer
• Water Subscriptions are 3 cases per month. Year 1 case cost is $8 per case, year 2 is $7, year 3 is $6 per
case, year 4 is $5
• Shipping per case on subscriptions is $15 per case year 1, $14 per case year 2, $13 per case year 3, $12 per
case year 4
• Energy Drink Case Cost per Case is $13 year 1, $12 year 2, $11 year 3 and $10 year 4
• Energy Drink CBD Cost per Case is $18 year 1, $17 year 2, $16 year 3 and $15 year 4
• Projections don’t include Full Retail Sales Via Internet of products other than water and other products
• Projections don’t include Co-packing, Licensing, or Contract Packaging Revenues
• Empty Packaging Return is a marketing expense
Pro Forma Summary Chart
Year 1 Year 2 Year 3 Year 4 Year 5
Revenue $9,700,000 $62,900,000 $233,800,000 $315,630,000 $426,100,500
Total Cost of Revenue 6,730,000 42,760,000 145,960,000 176,580,000 234,330,489
Total Operating Expenses $5,291,468 $4,190,330 $9,009,946 $14,827,424 $23,741,664
Taxes & Interest Incurred $0 $2,180,512 $23,649,016 $37,266,773 $50,408,504
Net Profit $0 $13,769,157 $55,181,037 $86,955,803 $117,619,843
$0$50,000,000
$100,000,000$150,000,000$200,000,000$250,000,000$300,000,000$350,000,000$400,000,000$450,000,000
Pro Forma Summary Chart
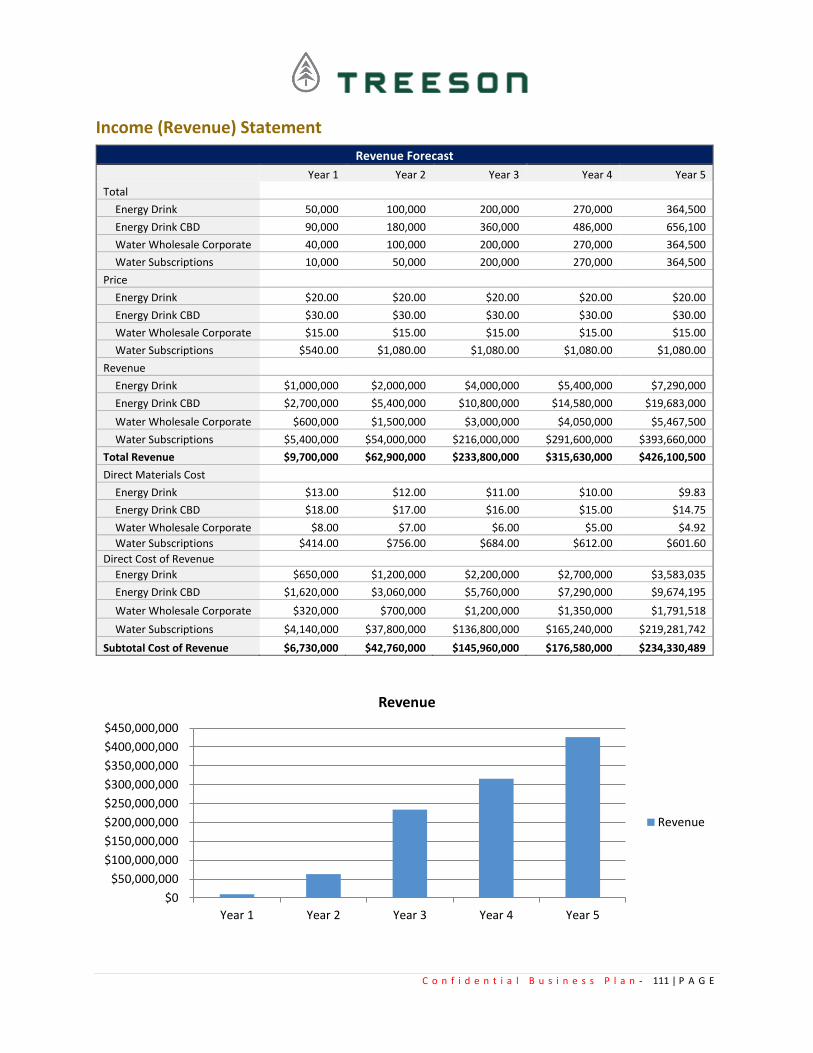
C o n f i d e n t i a l B u s i n e s s P l a n - 111 | P A G E
Income (Revenue) Statement
Revenue Forecast
Year 1 Year 2 Year 3 Year 4 Year 5
Total
Energy Drink 50,000 100,000 200,000 270,000 364,500
Energy Drink CBD 90,000 180,000 360,000 486,000 656,100
Water Wholesale Corporate 40,000 100,000 200,000 270,000 364,500
Water Subscriptions 10,000 50,000 200,000 270,000 364,500
Price
Energy Drink $20.00 $20.00 $20.00 $20.00 $20.00
Energy Drink CBD $30.00 $30.00 $30.00 $30.00 $30.00
Water Wholesale Corporate $15.00 $15.00 $15.00 $15.00 $15.00
Water Subscriptions $540.00 $1,080.00 $1,080.00 $1,080.00 $1,080.00
Revenue
Energy Drink $1,000,000 $2,000,000 $4,000,000 $5,400,000 $7,290,000
Energy Drink CBD $2,700,000 $5,400,000 $10,800,000 $14,580,000 $19,683,000
Water Wholesale Corporate $600,000 $1,500,000 $3,000,000 $4,050,000 $5,467,500
Water Subscriptions $5,400,000 $54,000,000 $216,000,000 $291,600,000 $393,660,000
Total Revenue $9,700,000 $62,900,000 $233,800,000 $315,630,000 $426,100,500
Direct Materials Cost
Energy Drink $13.00 $12.00 $11.00 $10.00 $9.83
Energy Drink CBD $18.00 $17.00 $16.00 $15.00 $14.75
Water Wholesale Corporate $8.00 $7.00 $6.00 $5.00 $4.92
Water Subscriptions $414.00 $756.00 $684.00 $612.00 $601.60
Direct Cost of Revenue
Energy Drink $650,000 $1,200,000 $2,200,000 $2,700,000 $3,583,035
Energy Drink CBD $1,620,000 $3,060,000 $5,760,000 $7,290,000 $9,674,195
Water Wholesale Corporate $320,000 $700,000 $1,200,000 $1,350,000 $1,791,518
Water Subscriptions $4,140,000 $37,800,000 $136,800,000 $165,240,000 $219,281,742
Subtotal Cost of Revenue $6,730,000 $42,760,000 $145,960,000 $176,580,000 $234,330,489
$0
$50,000,000
$100,000,000
$150,000,000
$200,000,000
$250,000,000
$300,000,000
$350,000,000
$400,000,000
$450,000,000
Year 1 Year 2 Year 3 Year 4 Year 5
Revenue
Revenue
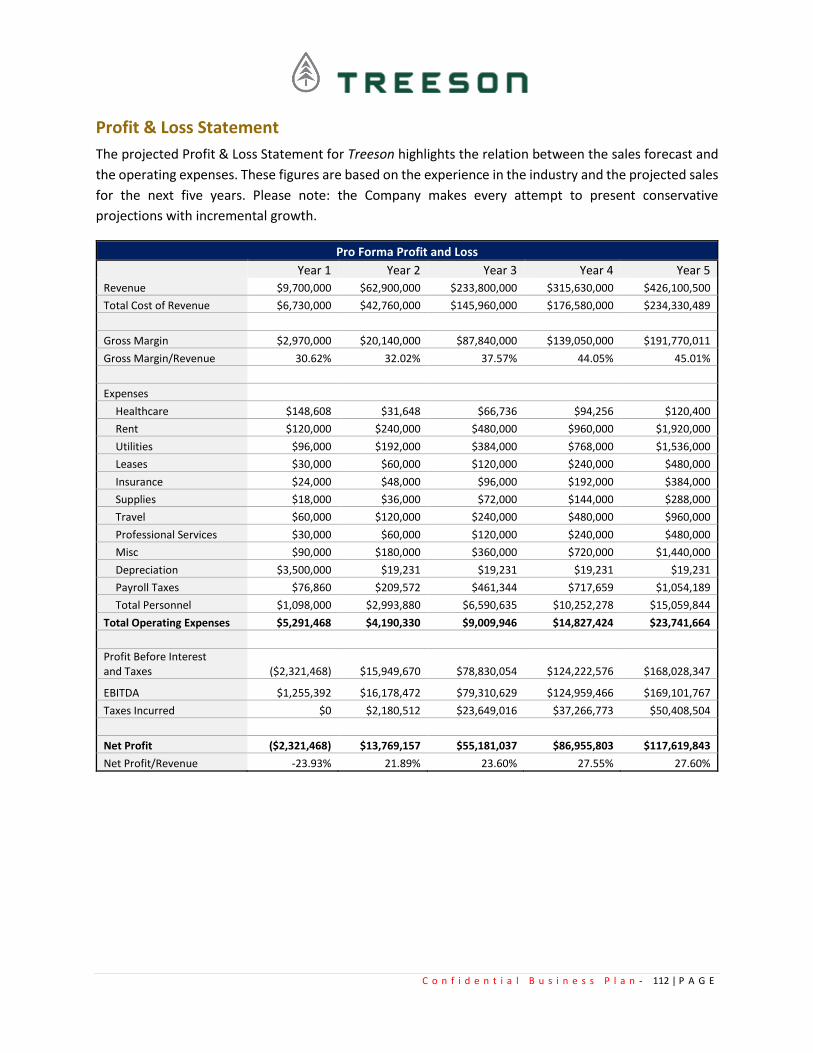
C o n f i d e n t i a l B u s i n e s s P l a n - 112 | P A G E
Profit & Loss Statement
The projected Profit & Loss Statement for Treeson highlights the relation between the sales forecast and
the operating expenses. These figures are based on the experience in the industry and the projected sales
for the next five years. Please note: the Company makes every attempt to present conservative
projections with incremental growth.
Pro Forma Profit and Loss
Year 1 Year 2 Year 3 Year 4 Year 5
Revenue $9,700,000 $62,900,000 $233,800,000 $315,630,000 $426,100,500
Total Cost of Revenue $6,730,000 $42,760,000 $145,960,000 $176,580,000 $234,330,489
Gross Margin $2,970,000 $20,140,000 $87,840,000 $139,050,000 $191,770,011
Gross Margin/Revenue 30.62% 32.02% 37.57% 44.05% 45.01%
Expenses
Healthcare $148,608 $31,648 $66,736 $94,256 $120,400
Rent $120,000 $240,000 $480,000 $960,000 $1,920,000
Utilities $96,000 $192,000 $384,000 $768,000 $1,536,000
Leases $30,000 $60,000 $120,000 $240,000 $480,000
Insurance $24,000 $48,000 $96,000 $192,000 $384,000
Supplies $18,000 $36,000 $72,000 $144,000 $288,000
Travel $60,000 $120,000 $240,000 $480,000 $960,000
Professional Services $30,000 $60,000 $120,000 $240,000 $480,000
Misc $90,000 $180,000 $360,000 $720,000 $1,440,000
Depreciation $3,500,000 $19,231 $19,231 $19,231 $19,231
Payroll Taxes $76,860 $209,572 $461,344 $717,659 $1,054,189
Total Personnel $1,098,000 $2,993,880 $6,590,635 $10,252,278 $15,059,844
Total Operating Expenses $5,291,468 $4,190,330 $9,009,946 $14,827,424 $23,741,664
Profit Before Interest and Taxes ($2,321,468) $15,949,670 $78,830,054 $124,222,576 $168,028,347
EBITDA $1,255,392 $16,178,472 $79,310,629 $124,959,466 $169,101,767
Taxes Incurred $0 $2,180,512 $23,649,016 $37,266,773 $50,408,504
Net Profit ($2,321,468) $13,769,157 $55,181,037 $86,955,803 $117,619,843
Net Profit/Revenue -23.93% 21.89% 23.60% 27.55% 27.60%
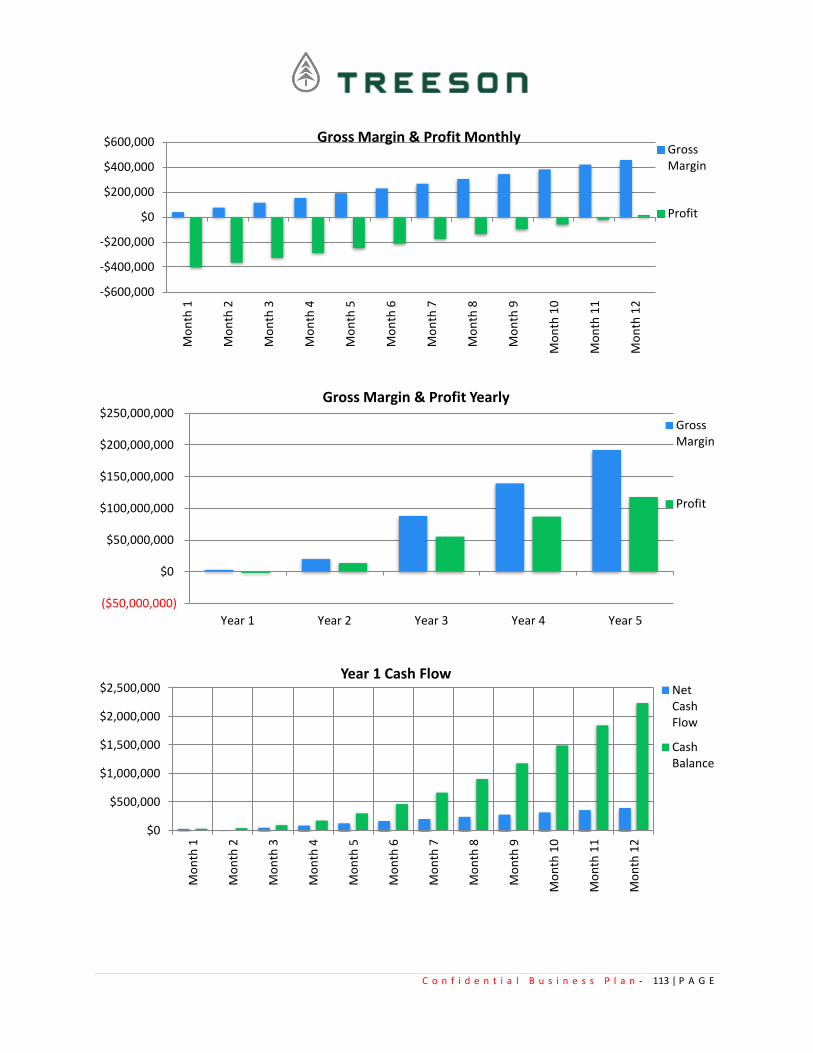
C o n f i d e n t i a l B u s i n e s s P l a n - 113 | P A G E
-$600,000
-$400,000
-$200,000
$0
$200,000
$400,000
$600,000
Mo
nth
1
Mo
nth
2
Mo
nth
3
Mo
nth
4
Mo
nth
5
Mo
nth
6
Mo
nth
7
Mo
nth
8
Mo
nth
9
Mo
nth
10
Mo
nth
11
Mo
nth
12
Gross Margin & Profit MonthlyGrossMargin
Profit
($50,000,000)
$0
$50,000,000
$100,000,000
$150,000,000
$200,000,000
$250,000,000
Year 1 Year 2 Year 3 Year 4 Year 5
Gross Margin & Profit Yearly
GrossMargin
Profit
$0
$500,000
$1,000,000
$1,500,000
$2,000,000
$2,500,000
Mo
nth
1
Mo
nth
2
Mo
nth
3
Mo
nth
4
Mo
nth
5
Mo
nth
6
Mo
nth
7
Mo
nth
8
Mo
nth
9
Mo
nth
10
Mo
nth
11
Mo
nth
12
Year 1 Cash FlowNetCashFlow
CashBalance

C o n f i d e n t i a l B u s i n e s s P l a n - 114 | P A G E
Cash Flow Statement
The projected Cash Flow Statement for Treeson represents what the Company believes the business will
take in and what it will spend. Cash flow will be crucial to the survival of the business. The Company is
confident that the Company will have ample cash on hand to ensure that investors can be paid on time.
The Company offers this statement of the business’s positive cash flow as perhaps the single most
powerful gauge of the expected financial performance.
Pro Forma Cash Flow
Year 1 Year 2 Year 3 Year 4 Year 5 Cash Received
Revenue 9,700,000 62,900,000 233,800,000 315,630,000 426,100,500
Proceeds from Property/Land 0 0 0 0 0
Proceeds from Bank Loan 0 0 0 0 0
Proceeds from Current Assets 0 0 0 0 0
Proceeds From Long-term Assets 0 0 0 0 0
Proceeds from Investor 14,000,000 0 0 0 0
Subtotal Cash Received 23,700,000 62,900,000 233,800,000 315,630,000 426,100,500
Expenditures from Operations
Cash Spending 1,098,000 2,993,880 6,590,635 10,252,278 15,059,844
Bill Payments 6,366,734 43,510,318 162,006,769 214,716,622 287,442,766
Subtotal Spent on Operations 7,464,734 46,504,198 168,597,404 224,968,900 302,502,610
Additional Cash Spent
Investor Repayment 0 0 0 0 0
Principal Loan Repayment 0 0 0 0 0
Purchase Long-term Assets 0 0 0 0 0
Dividends Paid 0 0 29,088,053 64,788,931 92,633,338
Subtotal Cash Spent 21,464,734 46,504,198 197,685,457 289,757,831 395,135,948
Net Cash Flow 2,235,266 16,395,802 36,114,543 25,872,169 30,964,552
Cash Balance 2,235,266 18,631,069 54,745,612 80,617,781 111,582,333
Financial Indicators
Treeson recognizes that the most important financial indicators are cash and bottom line. Treeson will
constantly monitor the flow of revenue to the Company as well as the expense requirements that deplete
the Company of its cash. Treeson will always try to improve the ratio of revenue and expenses to generate
a healthier bottom line in addition to a healthier cash base.
Financial Indicators
Year 1 Year 2 Year 3 Year 4 Year 5
Profitability %'s:
Gross Margin 30.62% 32.02% 37.57% 44.05% 45.01%
Net Profit Margin -23.93% 21.89% 23.60% 27.55% 27.60%
EBITDA to Revenue 12.94% 25.72% 33.92% 39.59% 39.69%
Return on Assets 183.55% 91.12% 107.76% 112.84% 108.90%
Return on Equity -19.88% 54.11% 107.06% 117.97% 119.18%
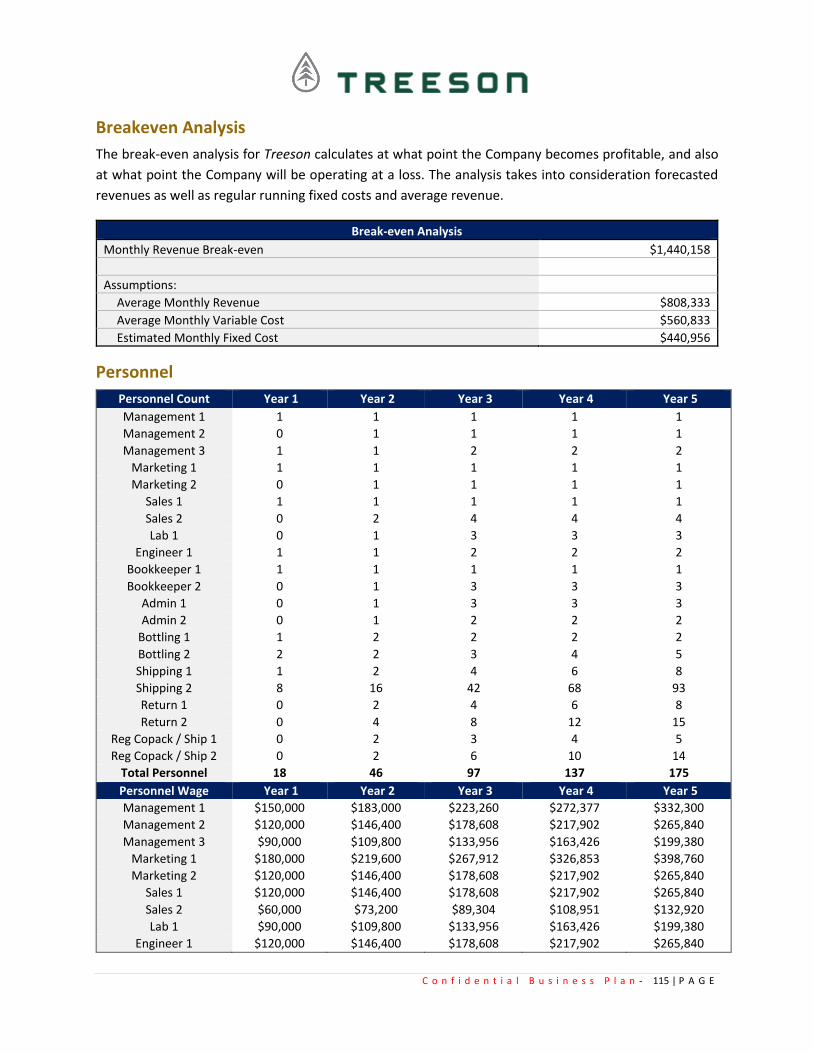
C o n f i d e n t i a l B u s i n e s s P l a n - 115 | P A G E
Breakeven Analysis
The break-even analysis for Treeson calculates at what point the Company becomes profitable, and also
at what point the Company will be operating at a loss. The analysis takes into consideration forecasted
revenues as well as regular running fixed costs and average revenue.
Break-even Analysis
Monthly Revenue Break-even $1,440,158
Assumptions:
Average Monthly Revenue $808,333
Average Monthly Variable Cost $560,833
Estimated Monthly Fixed Cost $440,956
Personnel
Personnel Count Year 1 Year 2 Year 3 Year 4 Year 5
Management 1 1 1 1 1 1
Management 2 0 1 1 1 1
Management 3 1 1 2 2 2
Marketing 1 1 1 1 1 1
Marketing 2 0 1 1 1 1
Sales 1 1 1 1 1 1
Sales 2 0 2 4 4 4
Lab 1 0 1 3 3 3
Engineer 1 1 1 2 2 2
Bookkeeper 1 1 1 1 1 1
Bookkeeper 2 0 1 3 3 3
Admin 1 0 1 3 3 3
Admin 2 0 1 2 2 2
Bottling 1 1 2 2 2 2
Bottling 2 2 2 3 4 5
Shipping 1 1 2 4 6 8
Shipping 2 8 16 42 68 93
Return 1 0 2 4 6 8
Return 2 0 4 8 12 15
Reg Copack / Ship 1 0 2 3 4 5
Reg Copack / Ship 2 0 2 6 10 14
Total Personnel 18 46 97 137 175
Personnel Wage Year 1 Year 2 Year 3 Year 4 Year 5
Management 1 $150,000 $183,000 $223,260 $272,377 $332,300
Management 2 $120,000 $146,400 $178,608 $217,902 $265,840
Management 3 $90,000 $109,800 $133,956 $163,426 $199,380
Marketing 1 $180,000 $219,600 $267,912 $326,853 $398,760
Marketing 2 $120,000 $146,400 $178,608 $217,902 $265,840
Sales 1 $120,000 $146,400 $178,608 $217,902 $265,840
Sales 2 $60,000 $73,200 $89,304 $108,951 $132,920
Lab 1 $90,000 $109,800 $133,956 $163,426 $199,380
Engineer 1 $120,000 $146,400 $178,608 $217,902 $265,840
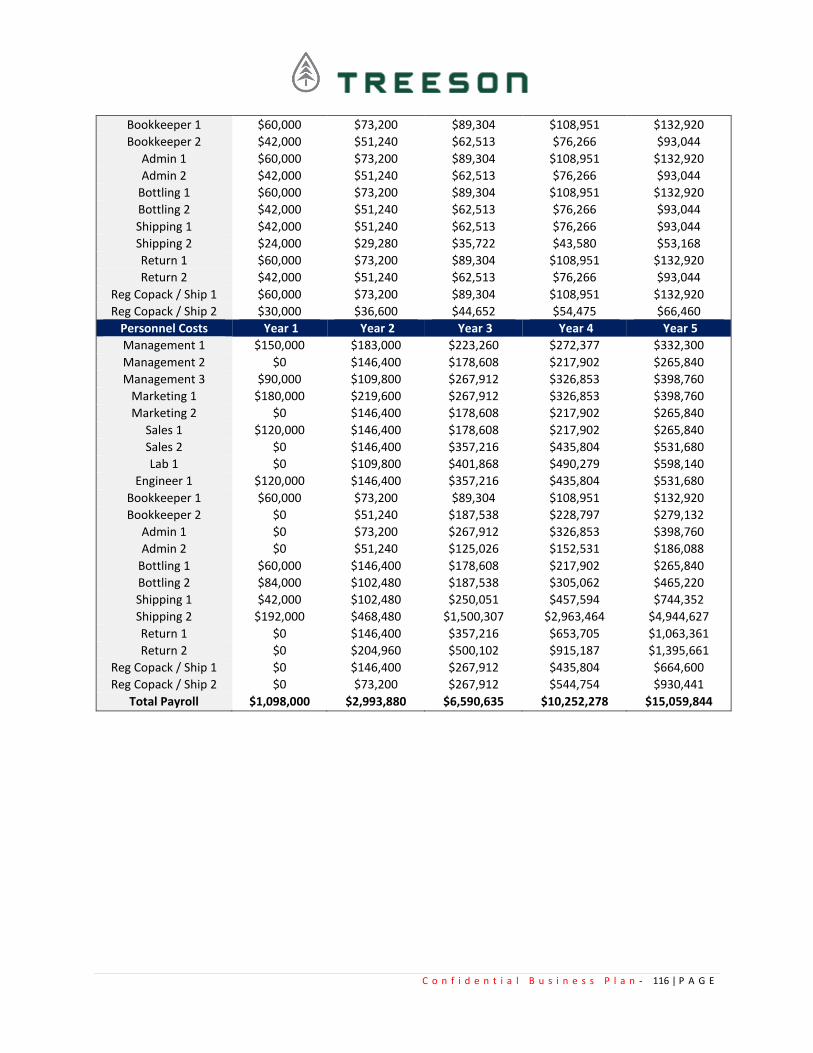
C o n f i d e n t i a l B u s i n e s s P l a n - 116 | P A G E
Bookkeeper 1 $60,000 $73,200 $89,304 $108,951 $132,920
Bookkeeper 2 $42,000 $51,240 $62,513 $76,266 $93,044
Admin 1 $60,000 $73,200 $89,304 $108,951 $132,920
Admin 2 $42,000 $51,240 $62,513 $76,266 $93,044
Bottling 1 $60,000 $73,200 $89,304 $108,951 $132,920
Bottling 2 $42,000 $51,240 $62,513 $76,266 $93,044
Shipping 1 $42,000 $51,240 $62,513 $76,266 $93,044
Shipping 2 $24,000 $29,280 $35,722 $43,580 $53,168
Return 1 $60,000 $73,200 $89,304 $108,951 $132,920
Return 2 $42,000 $51,240 $62,513 $76,266 $93,044
Reg Copack / Ship 1 $60,000 $73,200 $89,304 $108,951 $132,920
Reg Copack / Ship 2 $30,000 $36,600 $44,652 $54,475 $66,460
Personnel Costs Year 1 Year 2 Year 3 Year 4 Year 5
Management 1 $150,000 $183,000 $223,260 $272,377 $332,300
Management 2 $0 $146,400 $178,608 $217,902 $265,840
Management 3 $90,000 $109,800 $267,912 $326,853 $398,760
Marketing 1 $180,000 $219,600 $267,912 $326,853 $398,760
Marketing 2 $0 $146,400 $178,608 $217,902 $265,840
Sales 1 $120,000 $146,400 $178,608 $217,902 $265,840
Sales 2 $0 $146,400 $357,216 $435,804 $531,680
Lab 1 $0 $109,800 $401,868 $490,279 $598,140
Engineer 1 $120,000 $146,400 $357,216 $435,804 $531,680
Bookkeeper 1 $60,000 $73,200 $89,304 $108,951 $132,920
Bookkeeper 2 $0 $51,240 $187,538 $228,797 $279,132
Admin 1 $0 $73,200 $267,912 $326,853 $398,760
Admin 2 $0 $51,240 $125,026 $152,531 $186,088
Bottling 1 $60,000 $146,400 $178,608 $217,902 $265,840
Bottling 2 $84,000 $102,480 $187,538 $305,062 $465,220
Shipping 1 $42,000 $102,480 $250,051 $457,594 $744,352
Shipping 2 $192,000 $468,480 $1,500,307 $2,963,464 $4,944,627
Return 1 $0 $146,400 $357,216 $653,705 $1,063,361
Return 2 $0 $204,960 $500,102 $915,187 $1,395,661
Reg Copack / Ship 1 $0 $146,400 $267,912 $435,804 $664,600
Reg Copack / Ship 2 $0 $73,200 $267,912 $544,754 $930,441
Total Payroll $1,098,000 $2,993,880 $6,590,635 $10,252,278 $15,059,844
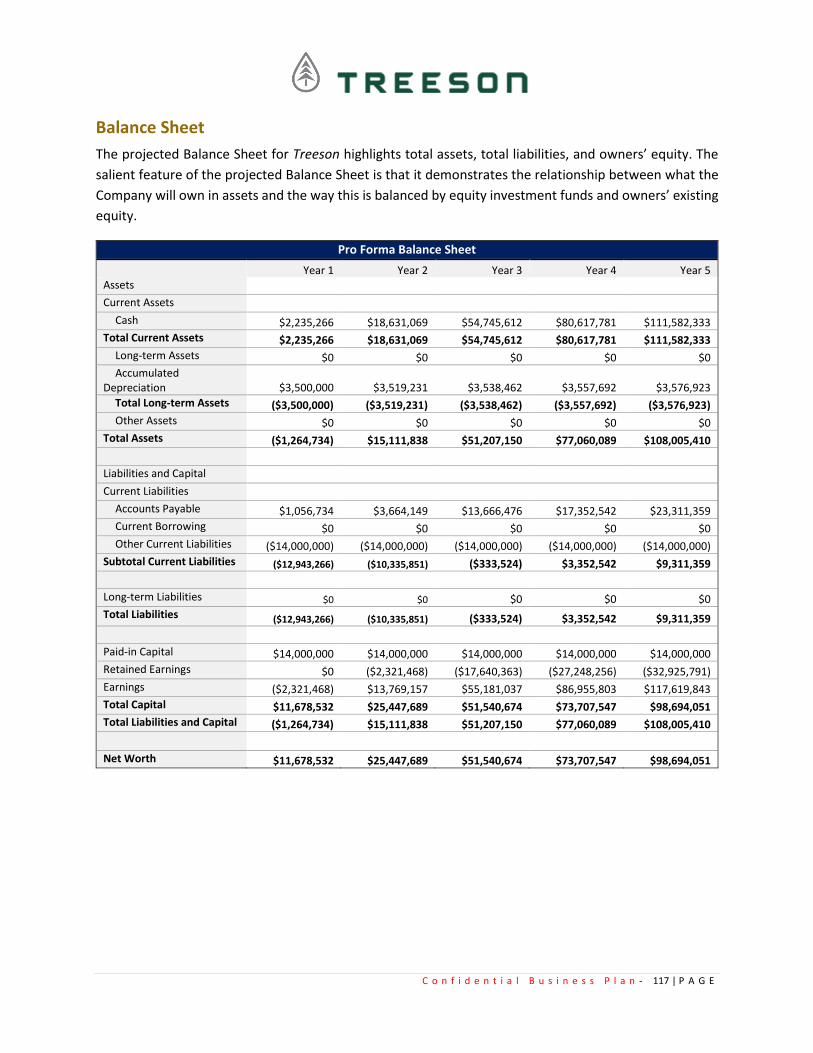
C o n f i d e n t i a l B u s i n e s s P l a n - 117 | P A G E
Balance Sheet
The projected Balance Sheet for Treeson highlights total assets, total liabilities, and owners’ equity. The
salient feature of the projected Balance Sheet is that it demonstrates the relationship between what the
Company will own in assets and the way this is balanced by equity investment funds and owners’ existing
equity.
Pro Forma Balance Sheet
Year 1 Year 2 Year 3 Year 4 Year 5 Assets
Current Assets
Cash $2,235,266 $18,631,069 $54,745,612 $80,617,781 $111,582,333
Total Current Assets $2,235,266 $18,631,069 $54,745,612 $80,617,781 $111,582,333
Long-term Assets $0 $0 $0 $0 $0
Accumulated Depreciation $3,500,000 $3,519,231 $3,538,462 $3,557,692 $3,576,923
Total Long-term Assets ($3,500,000) ($3,519,231) ($3,538,462) ($3,557,692) ($3,576,923)
Other Assets $0 $0 $0 $0 $0
Total Assets ($1,264,734) $15,111,838 $51,207,150 $77,060,089 $108,005,410
Liabilities and Capital
Current Liabilities
Accounts Payable $1,056,734 $3,664,149 $13,666,476 $17,352,542 $23,311,359
Current Borrowing $0 $0 $0 $0 $0
Other Current Liabilities ($14,000,000) ($14,000,000) ($14,000,000) ($14,000,000) ($14,000,000)
Subtotal Current Liabilities ($12,943,266) ($10,335,851) ($333,524) $3,352,542 $9,311,359
Long-term Liabilities $0 $0 $0 $0 $0
Total Liabilities ($12,943,266) ($10,335,851) ($333,524) $3,352,542 $9,311,359
Paid-in Capital $14,000,000 $14,000,000 $14,000,000 $14,000,000 $14,000,000
Retained Earnings $0 ($2,321,468) ($17,640,363) ($27,248,256) ($32,925,791)
Earnings ($2,321,468) $13,769,157 $55,181,037 $86,955,803 $117,619,843
Total Capital $11,678,532 $25,447,689 $51,540,674 $73,707,547 $98,694,051
Total Liabilities and Capital ($1,264,734) $15,111,838 $51,207,150 $77,060,089 $108,005,410
Net Worth $11,678,532 $25,447,689 $51,540,674 $73,707,547 $98,694,051

C o n f i d e n t i a l B u s i n e s s P l a n - 118 | P A G E
12-Month Revenue Projections
Year 1 Revenue Forecast
Month 1 Month 2 Month 3 Month 4 Month 5 Month 6 Month 7 Month 8 Month 9 Month 10 Month 11 Month 12
Total
Energy Drink 641 1,282 1,923 2,564 3,205 3,846 4,487 5,128 5,769 6,410 7,051 7,692
Energy Drink CBD 1,154 2,308 3,462 4,615 5,769 6,923 8,077 9,231 10,385 11,538 12,692 13,846
Water Wholesale Corporate 513 1,026 1,538 2,051 2,564 3,077 3,590 4,103 4,615 5,128 5,641 6,154
Water Subscriptions 128 256 385 513 641 769 897 1,026 1,154 1,282 1,410 1,538
Price
Energy Drink $20.00 $20.00 $20.00 $20.00 $20.00 $20.00 $20.00 $20.00 $20.00 $20.00 $20.00 $20.00
Energy Drink CBD $30.00 $30.00 $30.00 $30.00 $30.00 $30.00 $30.00 $30.00 $30.00 $30.00 $30.00 $30.00
Water Wholesale Corporate $15.00 $15.00 $15.00 $15.00 $15.00 $15.00 $15.00 $15.00 $15.00 $15.00 $15.00 $15.00
Water Subscriptions $540.00 $540.00 $540.00 $540.00 $540.00 $540.00 $540.00 $540.00 $540.00 $540.00 $540.00 $540.00
Revenue
Energy Drink $12,821 $25,641 $38,462 $51,282 $64,103 $76,923 $89,744 $102,564 $115,385 $128,205 $141,026 $153,846
Energy Drink CBD $34,615 $69,231 $103,846 $138,462 $173,077 $207,692 $242,308 $276,923 $311,538 $346,154 $380,769 $415,385
Water Wholesale Corporate $7,692 $15,385 $23,077 $30,769 $38,462 $46,154 $53,846 $61,538 $69,231 $76,923 $84,615 $92,308
Water Subscriptions $69,231 $138,462 $207,692 $276,923 $346,154 $415,385 $484,615 $553,846 $623,077 $692,308 $761,538 $830,769
Total Revenue $124,359 $248,718 $373,077 $497,436 $621,795 $746,154 $870,513 $994,872 $1,119,231 $1,243,590 $1,367,949 $1,492,308
Direct Materials Cost
Energy Drink $13.00 $13.00 $13.00 $13.00 $13.00 $13.00 $13.00 $13.00 $13.00 $13.00 $13.00 $13.00
Energy Drink CBD $18.00 $18.00 $18.00 $18.00 $18.00 $18.00 $18.00 $18.00 $18.00 $18.00 $18.00 $18.00
Water Wholesale Corporate $8.00 $8.00 $8.00 $8.00 $8.00 $8.00 $8.00 $8.00 $8.00 $8.00 $8.00 $8.00
Water Subscriptions $414.00 $414.00 $414.00 $414.00 $414.00 $414.00 $414.00 $414.00 $414.00 $414.00 $414.00 $414.00
Direct Cost of Revenue
Energy Drink $8,333 $16,667 $25,000 $33,333 $41,667 $50,000 $58,333 $66,667 $75,000 $83,333 $91,667 $100,000
Energy Drink CBD $20,769 $41,538 $62,308 $83,077 $103,846 $124,615 $145,385 $166,154 $186,923 $207,692 $228,462 $249,231
Water Wholesale Corporate $4,103 $8,205 $12,308 $16,410 $20,513 $24,615 $28,718 $32,821 $36,923 $41,026 $45,128 $49,231
Water Subscriptions $53,077 $106,154 $159,231 $212,308 $265,385 $318,462 $371,538 $424,615 $477,692 $530,769 $583,846 $636,923
Subtotal Cost of Revenue $86,282 $172,564 $258,846 $345,128 $431,410 $517,692 $603,974 $690,256 $776,538 $862,821 $949,103 $1,035,385
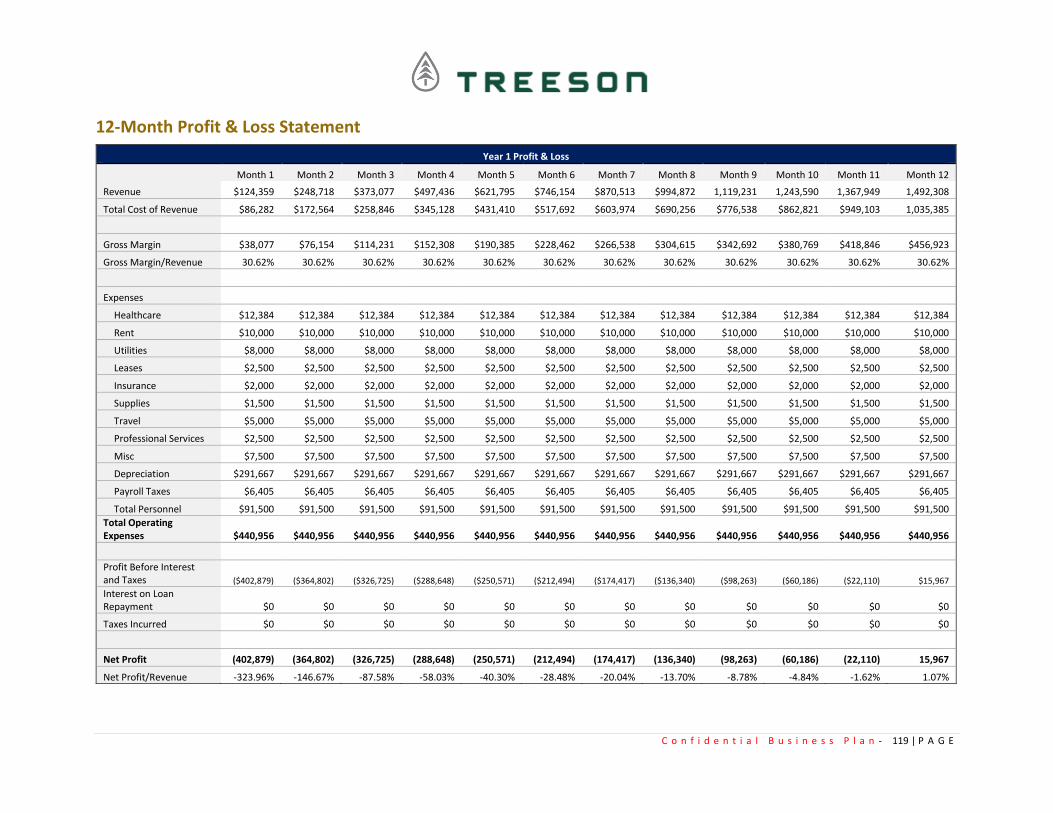
C o n f i d e n t i a l B u s i n e s s P l a n - 119 | P A G E
12-Month Profit & Loss Statement
Year 1 Profit & Loss
Month 1 Month 2 Month 3 Month 4 Month 5 Month 6 Month 7 Month 8 Month 9 Month 10 Month 11 Month 12
Revenue $124,359 $248,718 $373,077 $497,436 $621,795 $746,154 $870,513 $994,872 1,119,231 1,243,590 1,367,949 1,492,308
Total Cost of Revenue $86,282 $172,564 $258,846 $345,128 $431,410 $517,692 $603,974 $690,256 $776,538 $862,821 $949,103 1,035,385
Gross Margin $38,077 $76,154 $114,231 $152,308 $190,385 $228,462 $266,538 $304,615 $342,692 $380,769 $418,846 $456,923
Gross Margin/Revenue 30.62% 30.62% 30.62% 30.62% 30.62% 30.62% 30.62% 30.62% 30.62% 30.62% 30.62% 30.62%
Expenses
Healthcare $12,384 $12,384 $12,384 $12,384 $12,384 $12,384 $12,384 $12,384 $12,384 $12,384 $12,384 $12,384
Rent $10,000 $10,000 $10,000 $10,000 $10,000 $10,000 $10,000 $10,000 $10,000 $10,000 $10,000 $10,000
Utilities $8,000 $8,000 $8,000 $8,000 $8,000 $8,000 $8,000 $8,000 $8,000 $8,000 $8,000 $8,000
Leases $2,500 $2,500 $2,500 $2,500 $2,500 $2,500 $2,500 $2,500 $2,500 $2,500 $2,500 $2,500
Insurance $2,000 $2,000 $2,000 $2,000 $2,000 $2,000 $2,000 $2,000 $2,000 $2,000 $2,000 $2,000
Supplies $1,500 $1,500 $1,500 $1,500 $1,500 $1,500 $1,500 $1,500 $1,500 $1,500 $1,500 $1,500
Travel $5,000 $5,000 $5,000 $5,000 $5,000 $5,000 $5,000 $5,000 $5,000 $5,000 $5,000 $5,000
Professional Services $2,500 $2,500 $2,500 $2,500 $2,500 $2,500 $2,500 $2,500 $2,500 $2,500 $2,500 $2,500
Misc $7,500 $7,500 $7,500 $7,500 $7,500 $7,500 $7,500 $7,500 $7,500 $7,500 $7,500 $7,500
Depreciation $291,667 $291,667 $291,667 $291,667 $291,667 $291,667 $291,667 $291,667 $291,667 $291,667 $291,667 $291,667
Payroll Taxes $6,405 $6,405 $6,405 $6,405 $6,405 $6,405 $6,405 $6,405 $6,405 $6,405 $6,405 $6,405
Total Personnel $91,500 $91,500 $91,500 $91,500 $91,500 $91,500 $91,500 $91,500 $91,500 $91,500 $91,500 $91,500
Total Operating Expenses $440,956 $440,956 $440,956 $440,956 $440,956 $440,956 $440,956 $440,956 $440,956 $440,956 $440,956 $440,956
Profit Before Interest and Taxes ($402,879) ($364,802) ($326,725) ($288,648) ($250,571) ($212,494) ($174,417) ($136,340) ($98,263) ($60,186) ($22,110) $15,967
Interest on Loan Repayment $0 $0 $0 $0 $0 $0 $0 $0 $0 $0 $0 $0
Taxes Incurred $0 $0 $0 $0 $0 $0 $0 $0 $0 $0 $0 $0
Net Profit (402,879) (364,802) (326,725) (288,648) (250,571) (212,494) (174,417) (136,340) (98,263) (60,186) (22,110) 15,967
Net Profit/Revenue -323.96% -146.67% -87.58% -58.03% -40.30% -28.48% -20.04% -13.70% -8.78% -4.84% -1.62% 1.07%
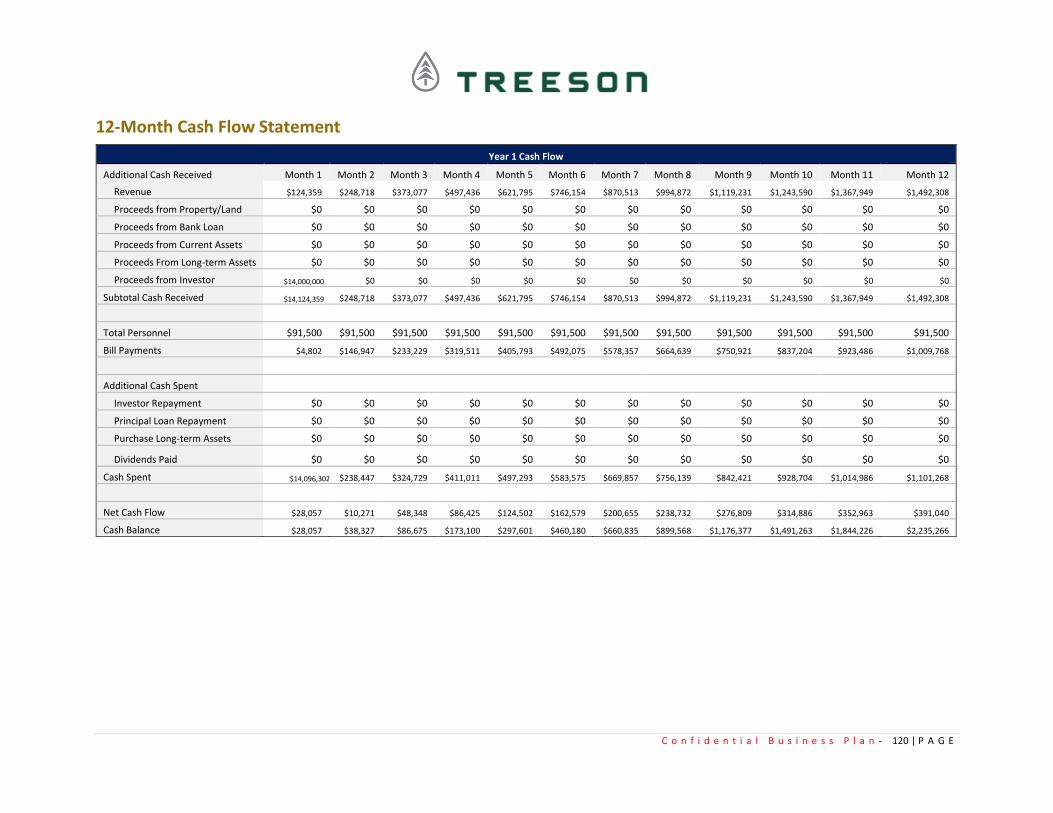
C o n f i d e n t i a l B u s i n e s s P l a n - 120 | P A G E
12-Month Cash Flow Statement
Year 1 Cash Flow
Additional Cash Received Month 1 Month 2 Month 3 Month 4 Month 5 Month 6 Month 7 Month 8 Month 9 Month 10 Month 11 Month 12
Revenue $124,359 $248,718 $373,077 $497,436 $621,795 $746,154 $870,513 $994,872 $1,119,231 $1,243,590 $1,367,949 $1,492,308
Proceeds from Property/Land $0 $0 $0 $0 $0 $0 $0 $0 $0 $0 $0 $0
Proceeds from Bank Loan $0 $0 $0 $0 $0 $0 $0 $0 $0 $0 $0 $0
Proceeds from Current Assets $0 $0 $0 $0 $0 $0 $0 $0 $0 $0 $0 $0
Proceeds From Long-term Assets $0 $0 $0 $0 $0 $0 $0 $0 $0 $0 $0 $0
Proceeds from Investor $14,000,000 $0 $0 $0 $0 $0 $0 $0 $0 $0 $0 $0
Subtotal Cash Received $14,124,359 $248,718 $373,077 $497,436 $621,795 $746,154 $870,513 $994,872 $1,119,231 $1,243,590 $1,367,949 $1,492,308
Total Personnel $91,500 $91,500 $91,500 $91,500 $91,500 $91,500 $91,500 $91,500 $91,500 $91,500 $91,500 $91,500
Bill Payments $4,802 $146,947 $233,229 $319,511 $405,793 $492,075 $578,357 $664,639 $750,921 $837,204 $923,486 $1,009,768
Additional Cash Spent
Investor Repayment $0 $0 $0 $0 $0 $0 $0 $0 $0 $0 $0 $0
Principal Loan Repayment $0 $0 $0 $0 $0 $0 $0 $0 $0 $0 $0 $0
Purchase Long-term Assets $0 $0 $0 $0 $0 $0 $0 $0 $0 $0 $0 $0
Dividends Paid $0 $0 $0 $0 $0 $0 $0 $0 $0 $0 $0 $0
Cash Spent $14,096,302 $238,447 $324,729 $411,011 $497,293 $583,575 $669,857 $756,139 $842,421 $928,704 $1,014,986 $1,101,268
Net Cash Flow $28,057 $10,271 $48,348 $86,425 $124,502 $162,579 $200,655 $238,732 $276,809 $314,886 $352,963 $391,040
Cash Balance $28,057 $38,327 $86,675 $173,100 $297,601 $460,180 $660,835 $899,568 $1,176,377 $1,491,263 $1,844,226 $2,235,266
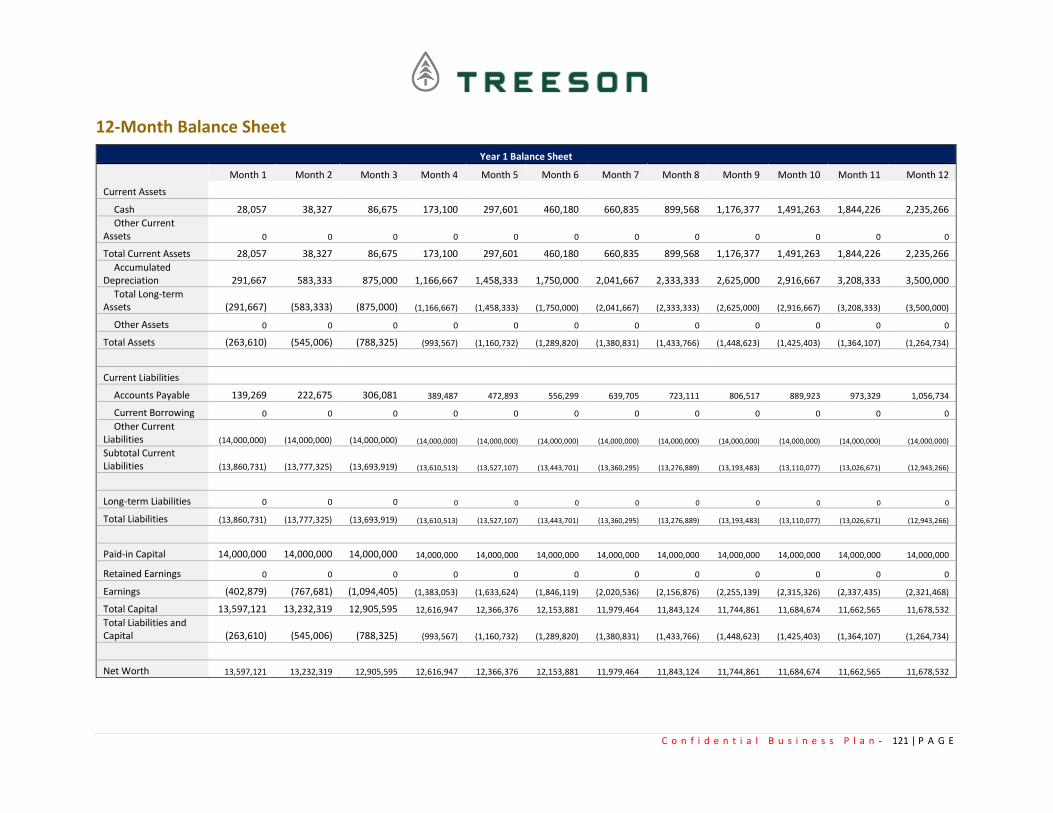
C o n f i d e n t i a l B u s i n e s s P l a n - 121 | P A G E
12-Month Balance Sheet
Year 1 Balance Sheet
Month 1 Month 2 Month 3 Month 4 Month 5 Month 6 Month 7 Month 8 Month 9 Month 10 Month 11 Month 12
Current Assets
Cash 28,057 38,327 86,675 173,100 297,601 460,180 660,835 899,568 1,176,377 1,491,263 1,844,226 2,235,266
Other Current Assets 0 0 0 0 0 0 0 0 0 0 0 0
Total Current Assets 28,057 38,327 86,675 173,100 297,601 460,180 660,835 899,568 1,176,377 1,491,263 1,844,226 2,235,266
Accumulated Depreciation 291,667 583,333 875,000 1,166,667 1,458,333 1,750,000 2,041,667 2,333,333 2,625,000 2,916,667 3,208,333 3,500,000
Total Long-term Assets (291,667) (583,333) (875,000) (1,166,667) (1,458,333) (1,750,000) (2,041,667) (2,333,333) (2,625,000) (2,916,667) (3,208,333) (3,500,000)
Other Assets 0 0 0 0 0 0 0 0 0 0 0 0
Total Assets (263,610) (545,006) (788,325) (993,567) (1,160,732) (1,289,820) (1,380,831) (1,433,766) (1,448,623) (1,425,403) (1,364,107) (1,264,734)
Current Liabilities
Accounts Payable 139,269 222,675 306,081 389,487 472,893 556,299 639,705 723,111 806,517 889,923 973,329 1,056,734
Current Borrowing 0 0 0 0 0 0 0 0 0 0 0 0
Other Current Liabilities (14,000,000) (14,000,000) (14,000,000) (14,000,000) (14,000,000) (14,000,000) (14,000,000) (14,000,000) (14,000,000) (14,000,000) (14,000,000) (14,000,000)
Subtotal Current Liabilities (13,860,731) (13,777,325) (13,693,919) (13,610,513) (13,527,107) (13,443,701) (13,360,295) (13,276,889) (13,193,483) (13,110,077) (13,026,671) (12,943,266)
Long-term Liabilities 0 0 0 0 0 0 0 0 0 0 0 0
Total Liabilities (13,860,731) (13,777,325) (13,693,919) (13,610,513) (13,527,107) (13,443,701) (13,360,295) (13,276,889) (13,193,483) (13,110,077) (13,026,671) (12,943,266)
Paid-in Capital 14,000,000 14,000,000 14,000,000 14,000,000 14,000,000 14,000,000 14,000,000 14,000,000 14,000,000 14,000,000 14,000,000 14,000,000
Retained Earnings 0 0 0 0 0 0 0 0 0 0 0 0
Earnings (402,879) (767,681) (1,094,405) (1,383,053) (1,633,624) (1,846,119) (2,020,536) (2,156,876) (2,255,139) (2,315,326) (2,337,435) (2,321,468)
Total Capital 13,597,121 13,232,319 12,905,595 12,616,947 12,366,376 12,153,881 11,979,464 11,843,124 11,744,861 11,684,674 11,662,565 11,678,532
Total Liabilities and Capital (263,610) (545,006) (788,325) (993,567) (1,160,732) (1,289,820) (1,380,831) (1,433,766) (1,448,623) (1,425,403) (1,364,107) (1,264,734)
Net Worth 13,597,121 13,232,319 12,905,595 12,616,947 12,366,376 12,153,881 11,979,464 11,843,124 11,744,861 11,684,674 11,662,565 11,678,532

C o n f i d e n t i a l B u s i n e s s P l a n - 122 | P A G E
Financial Highlights
($thousands)
Financial Highlights ($thousands)
M1 M2 M3 M4 M5 M6 M7 M8 M9 M10 M11 M12 Y1 Y2 Y3 Y4 Y5
Revenue 124 249 373 497 622 746 871 995 1,119 1,244 1,368 1,492 9,700 62,900 233,800 315,630 426,101
Gross Margin 38 76 114 152 190 228 267 305 343 381 419 457 2,970 20,140 87,840 139,050 191,770
Operating Expenses 441 441 441 441 441 441 441 441 441 441 441 441 5,291 4,190 9,010 14,827 23,742
EBITDA -111 -73 -35 3 41 79 117 155 193 231 270 308 1,179 16,178 79,311 124,959 169,102
Net Profit -403 -365 -327 -289 -251 -212 -174 -136 -98 -60 -22 16 -2,321 13,769 55,181 86,956 117,620
Gross Margin/Revenue 31% 31% 31% 31% 31% 31% 31% 31% 31% 31% 31% 31% 31% 32% 38% 44% 45%
EBITDA/Revenue -89% -29% -9% 1% 7% 11% 13% 16% 17% 19% 20% 21% 12% 26% 34% 40% 40%
Net Profit/Revenue -324% -147% -88% -58% -40% -28% -20% -14% -9% -5% -2% 1% -24% 22% 24% 28% 28%
Net Cash Flow 28 10 48 86 125 163 201 239 277 315 353 391 2,235 16,396 36,115 25,872 30,965
Cash Balance - Ending 28 38 87 173 298 460 661 900 1,176 1,491 1,844 2,235 2,235 18,631 54,746 80,618 111,582