Embed Size (px)
Citation preview
Trencor LimiTed inTegraTed annuaL reporT 2015
Trencor Limited Integrated Annual Report 2015
B
Trencor Limited Integrated Annual Report 2015
1
Contents1 Highlights 21 Sustainability report
2 directors and committees 24 annual Financial Statements
3 group profile 77 analysis of Shareholders
3 group chart 78 directorate: Brief résumés
4 Five Year review 79 notice to Shareholders
5 Tribute to neil and cecil Jowell 85 Form of proxy
6 chairman’s Statement 88 corporate information
10 review of operations 88 diary
13 corporate governance
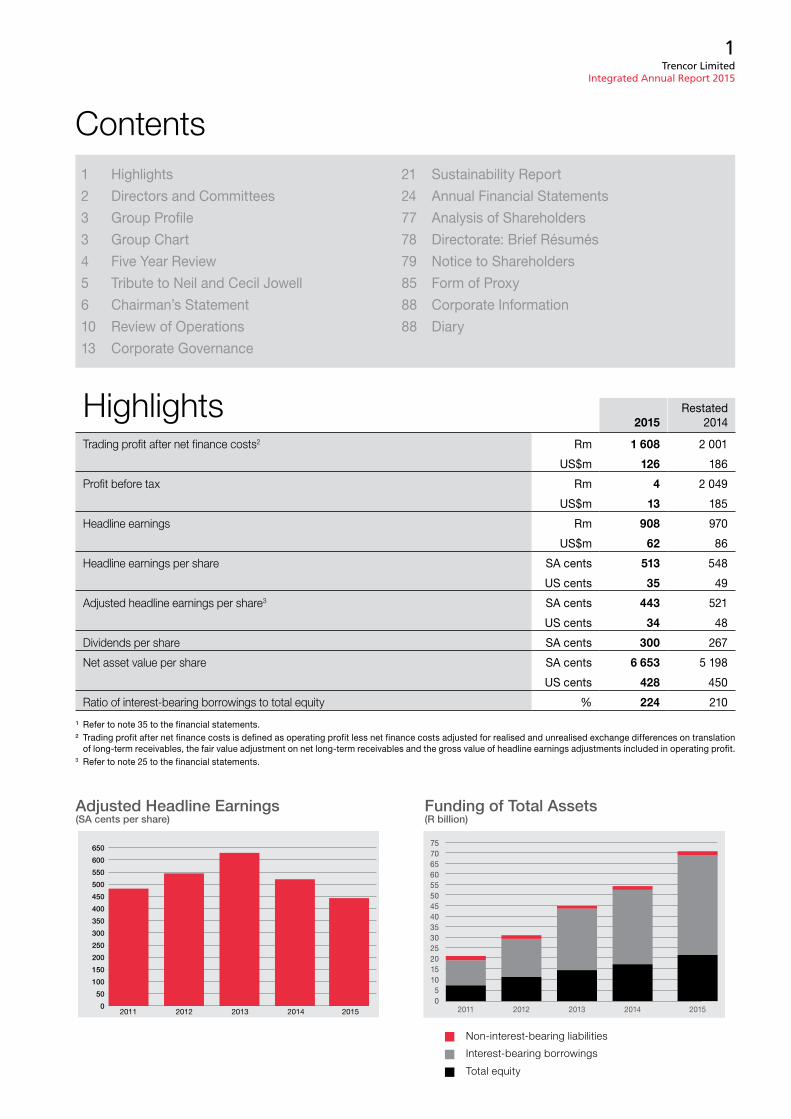
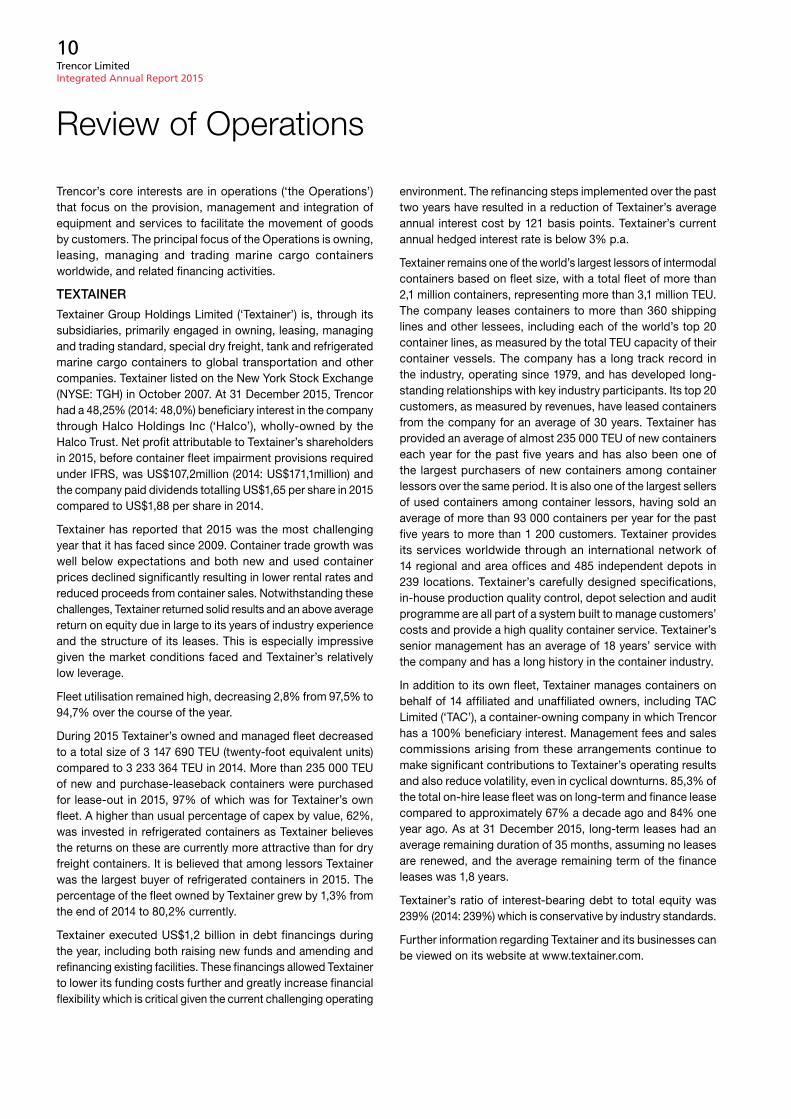
Adjusted Headline Earnings (SA cents per share)
Funding of Total Assets (R billion)
Non-interest-bearing liabilities
Interest-bearing borrowings
Total equity
Highlights2015
restated 2014
Trading profit after net finance costs2 rm 1 608 2 001
uS$m 126 186
Profit before tax rm 4 2 049
uS$m 13 185
Headline earnings rm 908 970
uS$m 62 86
Headline earnings per share Sa cents 513 548
uS cents 35 49
Adjusted headline earnings per share3 Sa cents 443 521
uS cents 34 48
Dividends per share Sa cents 300 267
Net asset value per share Sa cents 6 653 5 198
uS cents 428 450
Ratio of interest-bearing borrowings to total equity % 224 210
¹ refer to note 35 to the financial statements.² Trading profit after net finance costs is defined as operating profit less net finance costs adjusted for realised and unrealised exchange differences on translation
of long-term receivables, the fair value adjustment on net long-term receivables and the gross value of headline earnings adjustments included in operating profit.3 refer to note 25 to the financial statements.
2011 2012 2013 2014 20150
50
100
150
200
250
300
350
400
450
500
550
600
650757065605550454035302520151050
2011 2012 2013 2014 2015
Trencor Limited Integrated Annual Report 2015
2
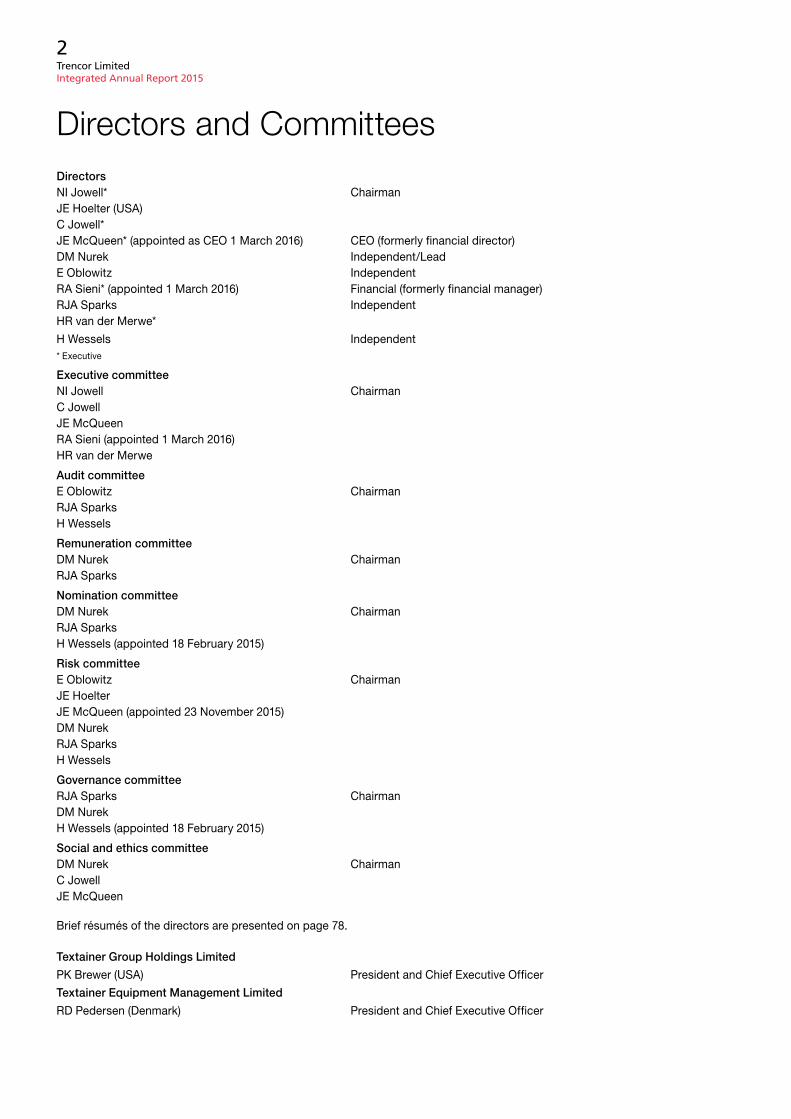
Directorsni Jowell* chairmanJe Hoelter (uSa)c Jowell*Je mcQueen* (appointed as ceo 1 march 2016) ceo (formerly financial director)dm nurek independent/Leade oblowitz independentra Sieni* (appointed 1 march 2016) Financial (formerly financial manager)rJa Sparks independentHr van der merwe*
H Wessels independent* executive
Executive committeeni Jowell chairmanc JowellJe mcQueenra Sieni (appointed 1 march 2016)Hr van der merwe
Audit committeee oblowitz chairmanrJa SparksH Wessels
Remuneration committeedm nurek chairmanrJa Sparks
Nomination committeedm nurek chairmanrJa SparksH Wessels (appointed 18 February 2015)
Risk committeee oblowitz chairmanJe HoelterJe mcQueen (appointed 23 november 2015)dm nurekrJa SparksH Wessels
Governance committeerJa Sparks chairmandm nurekH Wessels (appointed 18 February 2015)
Social and ethics committeedm nurek chairmanc JowellJe mcQueen
Brief résumés of the directors are presented on page 78.
Textainer Group Holdings Limited
pK Brewer (uSa) president and chief executive officer
Textainer Equipment Management Limited
rd pedersen (denmark) president and chief executive officer
Directors and Committees
Trencor Limited Integrated Annual Report 2015
3
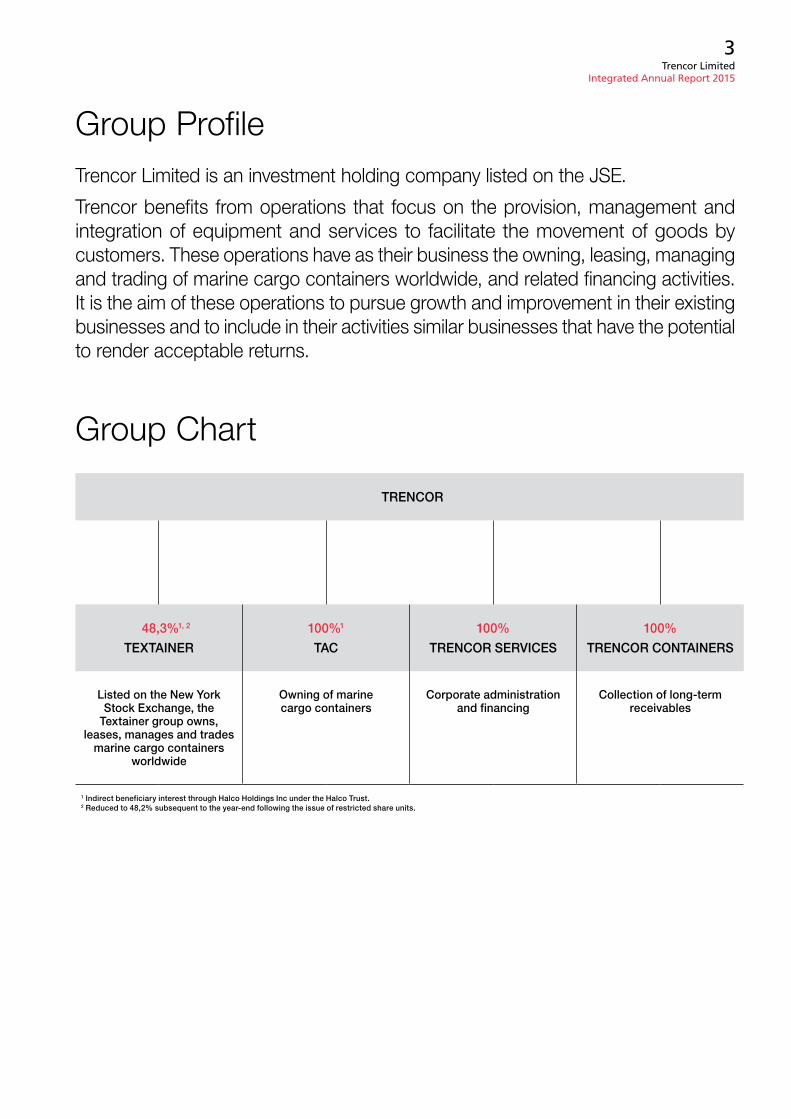
Group ProfileTrencor Limited is an investment holding company listed on the JSE.
Trencor benefits from operations that focus on the provision, management and integration of equipment and services to facilitate the movement of goods by customers. These operations have as their business the owning, leasing, managing and trading of marine cargo containers worldwide, and related financing activities. It is the aim of these operations to pursue growth and improvement in their existing businesses and to include in their activities similar businesses that have the potential to render acceptable returns.
Group Chart
TRENCOR
48,3%1, 2
TEXTAINER
100%1
TAC
100%
TRENCOR SERVICES
100%
TRENCOR CONTAINERS
Listed on the New York Stock Exchange, the
Textainer group owns, leases, manages and trades
marine cargo containers worldwide
Owning of marine cargo containers
Corporate administration and financing
Collection of long-term receivables
1 Indirect beneficiary interest through Halco Holdings Inc under the Halco Trust.2 Reduced to 48,2% subsequent to the year-end following the issue of restricted share units.
Trencor Limited Integrated Annual Report 2015
4
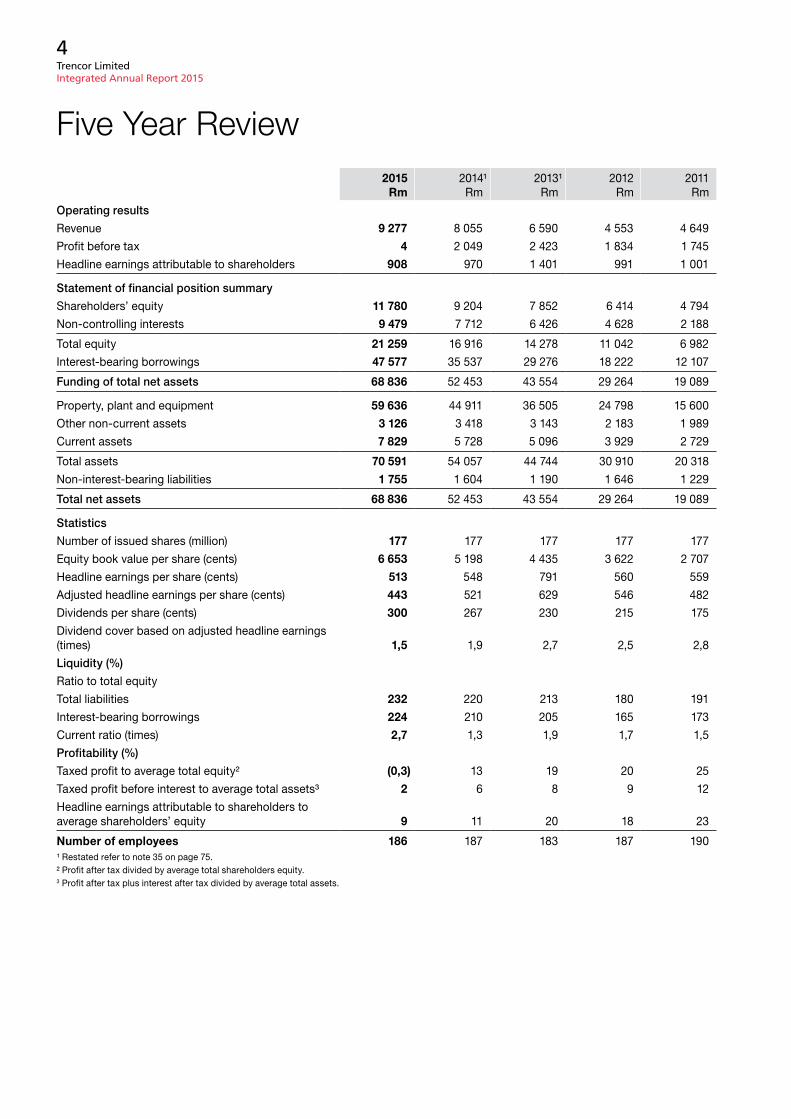
2015 2014¹ 2013¹ 2012 2011Rm rm rm rm rm
Operating results
revenue 9 277 8 055 6 590 4 553 4 649
profit before tax 4 2 049 2 423 1 834 1 745
Headline earnings attributable to shareholders 908 970 1 401 991 1 001
Statement of financial position summary
Shareholders’ equity 11 780 9 204 7 852 6 414 4 794
non-controlling interests 9 479 7 712 6 426 4 628 2 188
Total equity 21 259 16 916 14 278 11 042 6 982
interest-bearing borrowings 47 577 35 537 29 276 18 222 12 107
Funding of total net assets 68 836 52 453 43 554 29 264 19 089
property, plant and equipment 59 636 44 911 36 505 24 798 15 600
other non-current assets 3 126 3 418 3 143 2 183 1 989
current assets 7 829 5 728 5 096 3 929 2 729
Total assets 70 591 54 057 44 744 30 910 20 318
non-interest-bearing liabilities 1 755 1 604 1 190 1 646 1 229
Total net assets 68 836 52 453 43 554 29 264 19 089
Statistics
number of issued shares (million) 177 177 177 177 177
equity book value per share (cents) 6 653 5 198 4 435 3 622 2 707
Headline earnings per share (cents) 513 548 791 560 559
adjusted headline earnings per share (cents) 443 521 629 546 482
dividends per share (cents) 300 267 230 215 175
dividend cover based on adjusted headline earnings (times) 1,5 1,9 2,7 2,5 2,8
Liquidity (%)
ratio to total equity
Total liabilities 232 220 213 180 191
interest-bearing borrowings 224 210 205 165 173
current ratio (times) 2,7 1,3 1,9 1,7 1,5
Profitability (%)
Taxed profit to average total equity² (0,3) 13 19 20 25
Taxed profit before interest to average total assets³ 2 6 8 9 12
Headline earnings attributable to shareholders to average shareholders’ equity 9 11 20 18 23
Number of employees 186 187 183 187 190¹ restated refer to note 35 on page 75.² profit after tax divided by average total shareholders equity.3 profit after tax plus interest after tax divided by average total assets.
Five Year Review
Trencor Limited Integrated Annual Report 2015
5
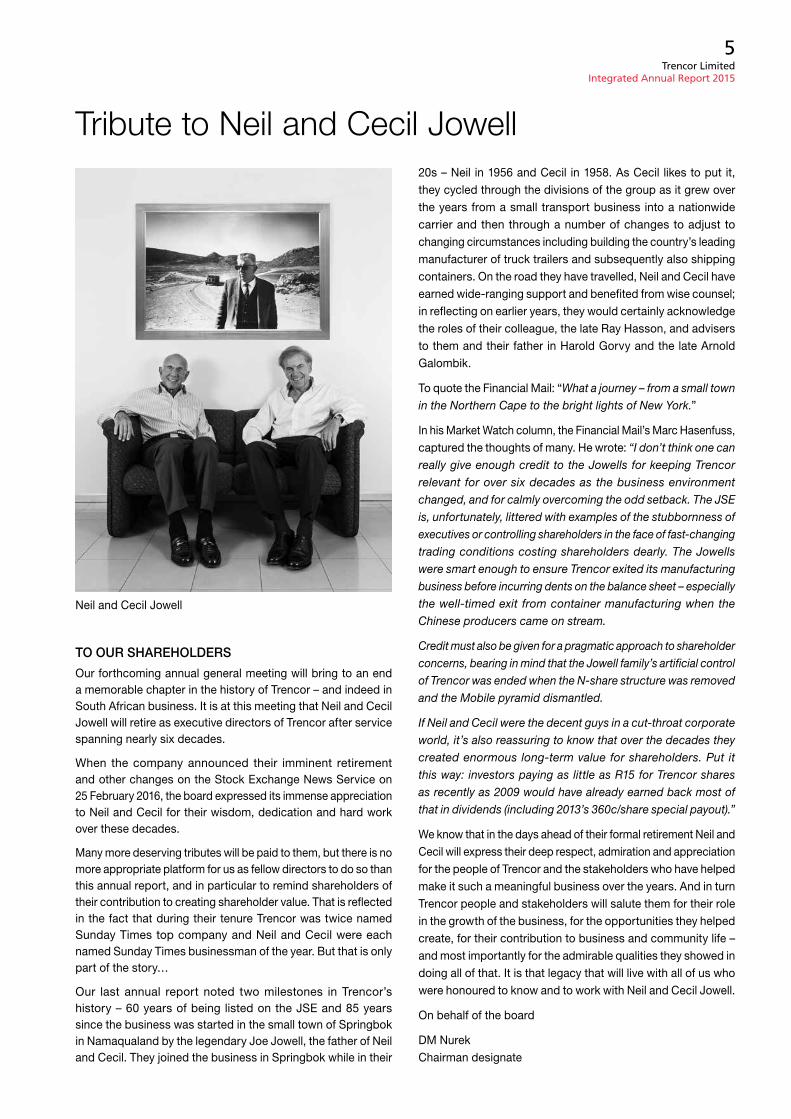
Tribute to Neil and Cecil Jowell
neil and cecil Jowell
TO OuR SHAREHOLDERS
our forthcoming annual general meeting will bring to an end a memorable chapter in the history of Trencor – and indeed in South african business. it is at this meeting that neil and cecil Jowell will retire as executive directors of Trencor after service spanning nearly six decades.
When the company announced their imminent retirement and other changes on the Stock exchange news Service on 25 February 2016, the board expressed its immense appreciation to neil and cecil for their wisdom, dedication and hard work over these decades.
many more deserving tributes will be paid to them, but there is no more appropriate platform for us as fellow directors to do so than this annual report, and in particular to remind shareholders of their contribution to creating shareholder value. That is reflected in the fact that during their tenure Trencor was twice named Sunday Times top company and neil and cecil were each named Sunday Times businessman of the year. But that is only part of the story…
our last annual report noted two milestones in Trencor’s history – 60 years of being listed on the JSe and 85 years since the business was started in the small town of Springbok in namaqualand by the legendary Joe Jowell, the father of neil and cecil. They joined the business in Springbok while in their
20s – neil in 1956 and cecil in 1958. as cecil likes to put it, they cycled through the divisions of the group as it grew over the years from a small transport business into a nationwide carrier and then through a number of changes to adjust to changing circumstances including building the country’s leading manufacturer of truck trailers and subsequently also shipping containers. on the road they have travelled, neil and cecil have earned wide-ranging support and benefited from wise counsel; in reflecting on earlier years, they would certainly acknowledge the roles of their colleague, the late ray Hasson, and advisers to them and their father in Harold gorvy and the late arnold galombik.
To quote the Financial mail: “What a journey – from a small town in the Northern Cape to the bright lights of New York.”
in his market Watch column, the Financial mail’s marc Hasenfuss, captured the thoughts of many. He wrote: “I don’t think one can really give enough credit to the Jowells for keeping Trencor relevant for over six decades as the business environment changed, and for calmly overcoming the odd setback. The JSE is, unfortunately, littered with examples of the stubbornness of executives or controlling shareholders in the face of fast-changing trading conditions costing shareholders dearly. The Jowells were smart enough to ensure Trencor exited its manufacturing business before incurring dents on the balance sheet – especially the well-timed exit from container manufacturing when the Chinese producers came on stream.
Credit must also be given for a pragmatic approach to shareholder concerns, bearing in mind that the Jowell family’s artificial control of Trencor was ended when the N-share structure was removed and the Mobile pyramid dismantled.
If Neil and Cecil were the decent guys in a cut-throat corporate world, it’s also reassuring to know that over the decades they created enormous long-term value for shareholders. Put it this way: investors paying as little as R15 for Trencor shares as recently as 2009 would have already earned back most of that in dividends (including 2013’s 360c/share special payout).”
We know that in the days ahead of their formal retirement neil and cecil will express their deep respect, admiration and appreciation for the people of Trencor and the stakeholders who have helped make it such a meaningful business over the years. and in turn Trencor people and stakeholders will salute them for their role in the growth of the business, for the opportunities they helped create, for their contribution to business and community life – and most importantly for the admirable qualities they showed in doing all of that. it is that legacy that will live with all of us who were honoured to know and to work with neil and cecil Jowell.
on behalf of the board
dm nurekchairman designate
Trencor Limited Integrated Annual Report 2015
6
in this year of my retirement from Trencor after 43 years as chairman, i cannot help but reflect on two major milestones in the group’s history achieved in 2015 – 60 years being listed on the JSe and 85 years since the business was started in Springbok. i look back upon this long and successful history of the group with no small measure of satisfaction.
Trencor’s results reflect the performance of Textainer – the global container leasing business in which Trencor has a 48% beneficiary interest through Halco Holdings under the Halco Trust. Textainer operates worldwide and is listed on the new York Stock exchange with its headquarters in Bermuda.
The container industry has had the most challenging year since 2009, and under these circumstances our results are satisfactory.
Trading profit after net financing costs decreased by 20% from r2 001 million in 2014 (restated) to r1 608 million.
Headline earnings per share (including the effect of net realised and unrealised foreign exchange translation gains) were 512,6 cents (2014: 547,9 cents – restated).
Adjusted headline earnings per share (which excludes the effect of net unrealised foreign exchange translation gains) were 443,3 cents (2014: 520,7 cents – restated).
net unrealised foreign exchange gains arising on translation of net dollar receivables and the related valuation adjustments, not included in adjusted headline earnings, were r123 million or 69,3 cents per share (2014: r48 million or 27,2 cents per share).
These various earnings are better reflected in tabular form:
2015restated
2014
Cents pershare
cents pershare
Basic (loss)/earnings per share (82,7) 543,2Headline earnings per share 512,6 547,9deduct:net unrealised foreign exchange translation gains 69,3 27,2Adjusted headline earnings per share 443,3 520,7Year-end rate of exchange: Sa rand to uS dollar 15,53 11,54average rate of exchange for the year: Sa rand to uS dollar 12,75 10,78
Based on the spot exchange rate of uS$1 = r15,53 and the price of Textainer’s shares listed on the nYSe on 31 december 2015 (uS$14,11), the net asset value of Trencor at that date was as follows:
R million R per shareBeneficiary interest in Textainer 5 977,6 33,75Beneficiary interest in Tac 577,1 3,26net interest in long-term receivables 555,3 3,14cash 2 399,1 13,55net liabilities (86,3) (0,49)
9 422,8 53,21
Chairman’s Statement
Trencor Limited Integrated Annual Report 2015
7
TEXTAINER
i am again including as a direct quote, the annual letter sent by the president and ceo of Textainer and myself as chairman of the Textainer board to the shareholders of Textainer:
“To Our Shareholders:Textainer has been leasing containers since 1979. During that time we have experienced strong leasing markets and weathered weak ones while operating successfully and profitably through both. 2015 was the most challenging year we have faced since 2009. Container trade growth was well below expectations and both new and used container prices declined significantly resulting in lower rental rates and reduced proceeds from container sales. Notwithstanding these challenges, we returned solid results and an above average return on equity due in large part to our years of experience and the structure of our leases. We believe this is especially impressive given the market conditions we faced and our relatively low leverage.
Year in ReviewWe were optimistic at the start of the year given predictions of 4-5% trade growth, slightly higher than what we had seen in 2014. Unfortunately, our optimism was unfounded. 2015 proved to be a disappointing year primarily for two reasons.
First, 2015 trade growth was approximately 2% or less than half of what was predicted at the beginning of the year. The traditional mid-year pick-up in demand we saw in 2014 never materialized in 2015. The limited demand for leased containers and an increase in the quantity of containers being returned from maturing leases led to increases in depot stocks and storage expense. Many of the returned containers were old and put to sale, putting pressure on used container prices.
Second, the collapse of iron ore and steel prices caused new container prices to fall from about $1,900/CEU at the beginning of the year to $1,300/CEU at year’s end, a decline of more than 30%. New container rental rates are directly correlated to new container prices and interest rates. The combination of falling container prices and low interest rates led to significant declines in both new and depot container rental rates. Used container prices, which were already declining due to the increased quantity of sales containers, fell further.
As a result of the decline in used container prices, we decreased the residual value for 40’ high cube containers for depreciation purposes from $1,650 to $1,450 per container during the third quarter. This change resulted in a $10.5 million increase in depreciation expense for the year.
We also recognized significant non-cash asset impairments especially during the third and fourth quarters. Impairments arise when containers are off-hired and identified for sale. If the sales price in the location of the container is less than the book value of the container, we write down the value of the container to the local sales price. Should sales prices decline again before we sell the container, we further write-down
its value. We do this even though we may eventually move the container to another location for sale where the sales price is higher. Asset impairments totaled $32.7 million for the year and are expected to continue at a similar level in 2016 as long as sales prices and volumes remain at or around current levels.
It is worth noting that the magnitude of the decline in new container rental rates is not representative of the decline in the average rental rate for our fleet. Thus, although new container rental rates decreased by more than 30% over the course of the year, the average rental rate on our fleet decreased by less than 5%. There are two primary reasons for this difference. First, 85% of our fleet is subject to long-term (including direct finance) leases. Due to our consistent new container investment program, we believe we have been the largest buyer of new containers among lessors over the preceding 5 years. Only 7.7% of our long-term fleet matured in 2015 and 8.5% is due to mature in 2016. Second, we benefit from the structure of our leases. The majority of on-lease containers must be returned in Asia. After our shipping line customers have incurred the cost to reposition a container to Asia, they may be reluctant to return it as they have to pay for damages and often need to re-use the container. If they do return the container, we get it back in Asia which is where we want it.
We sold about 160,000 in-fleet and trading containers in 2015, the highest quantity of containers we have ever sold in one year. While the prices were well below the levels seen from 2011-2014, they were not out-of-line when compared to new container prices. The average sales price per CEU in December 2015 was approximately 50% of the new container CEU price at that time, which is consistent with past years.
As already mentioned, new container rental rates are directly related to new container prices and interest rates. We have yet to see a meaningful increase in interest rates and one does not seem likely now. However, we are starting to see indications that bank and capital markets financing for lessors is becoming more selective and expensive. We have long felt that the debt markets have not differentiated in terms of borrowing costs between Textainer, as one of the largest lessors with the most conservative financial structure and an established global presence and operational expertise, and smaller, more highly leveraged lessors that have fewer resources to manage and dispose of containers over their lifecycle. We view increased selectivity among lenders positively as we believe our low leverage and market leading position may allow us to borrow at more attractive terms than some of our competitors.
We purchased more than 235,000 TEU of new and purchase-leaseback containers for lease-out in 2015, 97% of which was for our own fleet. A higher than usual percentage of our capex, 62%, was invested in refrigerated containers as we believe the returns are currently more attractive than for dry freight containers. We also believe that among lessors we were the largest buyer of refrigerated containers in 2015. At
Trencor Limited Integrated Annual Report 2015
8
year-end, our fleet totaled 3.1 million TEU. The percentage of our fleet which we own grew by 1.3 percentage points from the end of 2014 to 80.2% currently.
Total new dry freight container output in 2015 was approximately 2.4 million TEU, a significant decline from the 3.0 million TEU produced in 2014. We estimate leasing companies purchased 45% of these containers. This is further evidence that our industry does not over-order when market conditions do not support new investment. Such capex discipline should help our industry maintain high utilization over the coming year.
We continue to invest in tank containers via our joint venture with Trifleet, one of the leading tank lessors. Trifleet has proven to be an excellent partner with a similar operating and growth strategy as Textainer. We look forward to continuing to grow our tank fleet.
In August 2015, one of our customers became insolvent and we are working to recover the containers on lease to this customer. Our lessee default insurance after deductibles covers the value of unrecoverable containers, the costs to recover containers and a period of lost future rental income. A $2.0 million impairment, net of estimated insurance proceeds, was recognized and included in container impairment for unrecoverable containers and a $2.6 million bad debt provision was recognized to fully reserve for the customer’s accounts receivable.
Our owned fleet lease rental income for 2015 totaled $510.5 million, up slightly compared to 2014. Our cash flow remains strong. Net cash provided by operating activities increased 2% from 2014 to $370 million. Utilization remained high, decreasing 2.8 percentage points from 97.5% to 94.7% over the course of the year. Utilization currently is 93.8%. We invested more than $600 million in new and used containers for lease-out in 2015. Adjusted net income for the year was $108.7 million.
LiquidityWe continue to maintain a strong and flexible balance sheet. Our debt-to-equity ratio at 2.4:1 remains the lowest among all our publicly listed peers. Our financial results and relatively low leverage have allowed us to access the capital markets when and as needed and at very competitive terms. Our financial strength and strong liquidity enable us to remain one of the industry’s most reliable suppliers, and we have the ability to take advantage of any investment opportunities which arise.
During 2015, we executed $1.2 billion in debt financings, including both raising new funds and amending and refinancing existing facilities. These financings allowed us to lower our funding costs further and greatly increased our financial flexibility which is critical given the current challenging operating environment. The refinancing steps we have implemented over the past two years have resulted in a reduction in our average annual interest cost by 121 basis points. Our current average annual hedged interest rate is below 3%.
DividendsWe paid a total of $1.65 per share in dividends in 2015. We reduced our dividend during the third quarter from $0.47/share to $0.24/share in response to the decline in our fleet performance and adjusted net income. We will continue to review our dividend each quarter. Our policy is to pay a dividend which is sustainable over the long term taking into account the appropriate mix between investing in our business and rewarding shareholders.
Outlook The outlook for 2016 remains challenging for many of the same reasons that affected our 2015 results. Improved performance depends largely on an increase in demand, container prices, and/or interest rates, none of which seems likely in the near term. We did not see a traditional pre-Lunar New Year increase in demand and are expecting weak demand to remain into the first half of 2016. Indeed with projections for weak global economic growth in 2016, a strong U.S. dollar and low oil prices, significant increases in interest rates or commodity prices do not appear likely in the near term.
Freight rates are likely to remain under pressure which could affect the creditworthiness of our lessees. Approximately 8% of the worldwide containership fleet is currently idle and ship capacity is expected to increase by more than 4% in 2016 after taking into account newbuilding deliveries and vessel scrapping. Competition for lease-outs is expected to remain strong and maturing leases that are extended will be repriced at rental rates below their current levels. Impairments of sales containers are likely to continue until resale prices improve.
While we believe that new container prices are currently lower than the cost of production and perhaps at or near a floor, we do not expect prices to increase materially over the first half of 2016. Having said that, the last time container prices were at this level was 2002-2003. The containers we purchased at that time proved to be very good investments.
We must keep in mind that our industry is and always has been cyclical. We have been in business for 36 years and have successfully managed through many ups and downs. We have the lowest leverage and operating costs of any of our public competitors. 85% of our fleet is subject to long-term or finance leases with an average remaining term of 40 months. As we have been a consistent buyer of containers over the years, only 8.5% of our term leases mature in 2016. If history is a guide, containers purchased at today’s prices will generate attractive returns over their lives. We believe we are well positioned for the challenging market conditions we expect.
We are an industry leader because of the support and dedication of our shareholders, customers, suppliers and employees. Thank all of you for the trust you have placed in Textainer.”
End of Textainer letter.
Trencor Limited Integrated Annual Report 2015
9
CASH FLOW AND DIVIDEND
as i noted in my statement last year, the high levels of capital available for investment in containers and competitive structure of the industry continue to leave the market in a fluid state after some years of relative stability. notwithstanding these conditions, Textainer continues to seek growth opportunities and to the extent that this may require raising fresh capital with Halco wishing to maintain its approximate shareholding in Textainer (as we understand), Halco’s ongoing cash retention is likely to take into consideration this potential cash requirement. Furthermore, Halco has utilised a portion of its cash resources to advance funds to its wholly-owned subsidiary Tac Limited to assist it in continuing to invest in new containers and refresh its existing fleet.
The board declared a final dividend of 220 cents per share, bringing the total for the year to 300 cents, an increase of 12% over the 2014 distribution.
APPRECIATION
as announced, my brother cecil and i have retired from the board of Textainer and will retire from Trencor at our forthcoming agm. We would like to use this opportunity to extend our appreciation to all the people in Trencor and Textainer, past and present, who have over so many years made the success of Trencor possible.
i will always value the contribution of my colleagues and remain conscious of their probity and diligence in my interaction with them.
i note the major contribution by cecil and the late ray Hasson in the growth of Trencor. cecil was a confidant and involved in all group activities and together with ray, developed our successful export activities.
i value the role of Jimmy mcQueen, our longtime finance director and now my successor as chief executive officer, and Hennie van der merwe who served as managing director from 2003 till 2011.
i appreciate the role of david nurek, as our longtime advisor and lead director, who now becomes Trencor’s non-executive chairman. i thank the directors of Trencor for the contribution from their wide experience that they make to our affairs.
i also value the major contributions made by the chief executive officers of Textainer (past and present) – Jim Hoelter, John maccarone, phil Brewer, and their colleague robert pedersen. Finally i note the important roles of deon Blignaut and the late alex Brown in Trencor.
ni Jowell
20 June 2016
Trencor Limited Integrated Annual Report 2015
10
Review of Operations
Trencor’s core interests are in operations (‘the operations’) that focus on the provision, management and integration of equipment and services to facilitate the movement of goods by customers. The principal focus of the operations is owning, leasing, managing and trading marine cargo containers worldwide, and related financing activities.
TEXTAINER
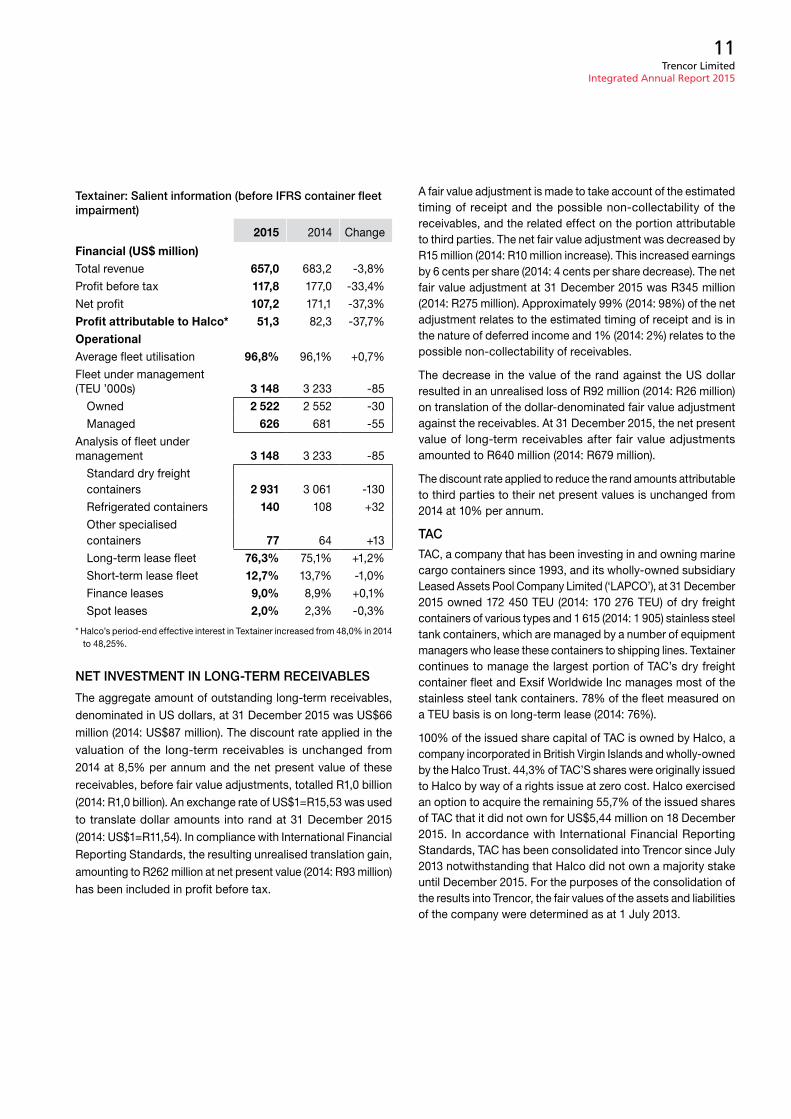
Textainer group Holdings Limited (‘Textainer’) is, through its subsidiaries, primarily engaged in owning, leasing, managing and trading standard, special dry freight, tank and refrigerated marine cargo containers to global transportation and other companies. Textainer listed on the new York Stock exchange (nYSe: TgH) in october 2007. at 31 december 2015, Trencor had a 48,25% (2014: 48,0%) beneficiary interest in the company through Halco Holdings inc (‘Halco’), wholly-owned by the Halco Trust. net profit attributable to Textainer’s shareholders in 2015, before container fleet impairment provisions required under iFrS, was uS$107,2million (2014: uS$171,1million) and the company paid dividends totalling uS$1,65 per share in 2015 compared to uS$1,88 per share in 2014.
Textainer has reported that 2015 was the most challenging year that it has faced since 2009. container trade growth was well below expectations and both new and used container prices declined significantly resulting in lower rental rates and reduced proceeds from container sales. notwithstanding these challenges, Textainer returned solid results and an above average return on equity due in large to its years of industry experience and the structure of its leases. This is especially impressive given the market conditions faced and Textainer’s relatively low leverage.
Fleet utilisation remained high, decreasing 2,8% from 97,5% to 94,7% over the course of the year.
during 2015 Textainer’s owned and managed fleet decreased to a total size of 3 147 690 Teu (twenty-foot equivalent units) compared to 3 233 364 Teu in 2014. more than 235 000 Teu of new and purchase-leaseback containers were purchased for lease-out in 2015, 97% of which was for Textainer’s own fleet. a higher than usual percentage of capex by value, 62%, was invested in refrigerated containers as Textainer believes the returns on these are currently more attractive than for dry freight containers. it is believed that among lessors Textainer was the largest buyer of refrigerated containers in 2015. The percentage of the fleet owned by Textainer grew by 1,3% from the end of 2014 to 80,2% currently.
Textainer executed uS$1,2 billion in debt financings during the year, including both raising new funds and amending and refinancing existing facilities. These financings allowed Textainer to lower its funding costs further and greatly increase financial flexibility which is critical given the current challenging operating
environment. The refinancing steps implemented over the past two years have resulted in a reduction of Textainer’s average annual interest cost by 121 basis points. Textainer’s current annual hedged interest rate is below 3% p.a.
Textainer remains one of the world’s largest lessors of intermodal containers based on fleet size, with a total fleet of more than 2,1 million containers, representing more than 3,1 million Teu. The company leases containers to more than 360 shipping lines and other lessees, including each of the world’s top 20 container lines, as measured by the total Teu capacity of their container vessels. The company has a long track record in the industry, operating since 1979, and has developed long-standing relationships with key industry participants. its top 20 customers, as measured by revenues, have leased containers from the company for an average of 30 years. Textainer has provided an average of almost 235 000 Teu of new containers each year for the past five years and has also been one of the largest purchasers of new containers among container lessors over the same period. it is also one of the largest sellers of used containers among container lessors, having sold an average of more than 93 000 containers per year for the past five years to more than 1 200 customers. Textainer provides its services worldwide through an international network of 14 regional and area offices and 485 independent depots in 239 locations. Textainer’s carefully designed specifications, in-house production quality control, depot selection and audit programme are all part of a system built to manage customers’ costs and provide a high quality container service. Textainer’s senior management has an average of 18 years’ service with the company and has a long history in the container industry.
in addition to its own fleet, Textainer manages containers on behalf of 14 affiliated and unaffiliated owners, including Tac Limited (‘Tac’), a container-owning company in which Trencor has a 100% beneficiary interest. management fees and sales commissions arising from these arrangements continue to make significant contributions to Textainer’s operating results and also reduce volatility, even in cyclical downturns. 85,3% of the total on-hire lease fleet was on long-term and finance lease compared to approximately 67% a decade ago and 84% one year ago. as at 31 december 2015, long-term leases had an average remaining duration of 35 months, assuming no leases are renewed, and the average remaining term of the finance leases was 1,8 years.
Textainer’s ratio of interest-bearing debt to total equity was 239% (2014: 239%) which is conservative by industry standards.
Further information regarding Textainer and its businesses can be viewed on its website at www.textainer.com.
Trencor Limited Integrated Annual Report 2015
11
Textainer: Salient information (before IFRS container fleet impairment)
2015 2014 change
Financial (US$ million)
Total revenue 657,0 683,2 -3,8%
profit before tax 117,8 177,0 -33,4%
net profit 107,2 171,1 -37,3%
Profit attributable to Halco* 51,3 82,3 -37,7%
Operationalaverage fleet utilisation 96,8% 96,1% +0,7%
Fleet under management (Teu ’000s) 3 148 3 233 -85
owned 2 522 2 552 -30
managed 626 681 -55
analysis of fleet under management 3 148 3 233 -85
Standard dry freight containers 2 931 3 061 -130
refrigerated containers 140 108 +32
other specialised containers 77 64 +13
Long-term lease fleet 76,3% 75,1% +1,2%
Short-term lease fleet 12,7% 13,7% -1,0%
Finance leases 9,0% 8,9% +0,1%
Spot leases 2,0% 2,3% -0,3%
* Halco’s period-end effective interest in Textainer increased from 48,0% in 2014 to 48,25%.
NET INVESTMENT IN LONG-TERM RECEIVABLES
The aggregate amount of outstanding long-term receivables, denominated in uS dollars, at 31 december 2015 was uS$66 million (2014: uS$87 million). The discount rate applied in the valuation of the long-term receivables is unchanged from 2014 at 8,5% per annum and the net present value of these receivables, before fair value adjustments, totalled r1,0 billion (2014: r1,0 billion). an exchange rate of uS$1=r15,53 was used to translate dollar amounts into rand at 31 december 2015 (2014: uS$1=r11,54). in compliance with international Financial reporting Standards, the resulting unrealised translation gain, amounting to r262 million at net present value (2014: r93 million) has been included in profit before tax.
a fair value adjustment is made to take account of the estimated timing of receipt and the possible non-collectability of the receivables, and the related effect on the portion attributable to third parties. The net fair value adjustment was decreased by r15 million (2014: r10 million increase). This increased earnings by 6 cents per share (2014: 4 cents per share decrease). The net fair value adjustment at 31 december 2015 was r345 million (2014: r275 million). approximately 99% (2014: 98%) of the net adjustment relates to the estimated timing of receipt and is in the nature of deferred income and 1% (2014: 2%) relates to the possible non-collectability of receivables.
The decrease in the value of the rand against the uS dollar resulted in an unrealised loss of r92 million (2014: r26 million) on translation of the dollar-denominated fair value adjustment against the receivables. at 31 december 2015, the net present value of long-term receivables after fair value adjustments amounted to r640 million (2014: r679 million).
The discount rate applied to reduce the rand amounts attributable to third parties to their net present values is unchanged from 2014 at 10% per annum.
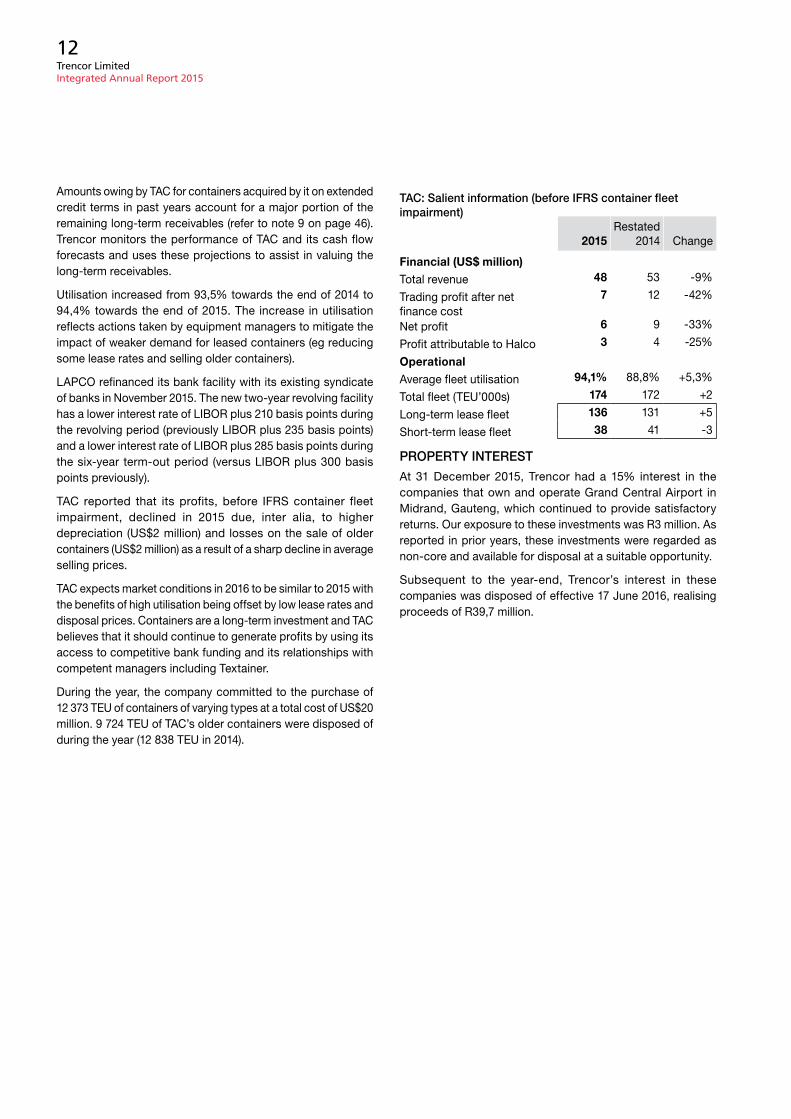
TAC
Tac, a company that has been investing in and owning marine cargo containers since 1993, and its wholly-owned subsidiary Leased assets pool company Limited (‘Lapco’), at 31 december 2015 owned 172 450 Teu (2014: 170 276 Teu) of dry freight containers of various types and 1 615 (2014: 1 905) stainless steel tank containers, which are managed by a number of equipment managers who lease these containers to shipping lines. Textainer continues to manage the largest portion of Tac’s dry freight container fleet and exsif Worldwide inc manages most of the stainless steel tank containers. 78% of the fleet measured on a Teu basis is on long-term lease (2014: 76%).
100% of the issued share capital of Tac is owned by Halco, a company incorporated in British Virgin islands and wholly-owned by the Halco Trust. 44,3% of Tac’S shares were originally issued to Halco by way of a rights issue at zero cost. Halco exercised an option to acquire the remaining 55,7% of the issued shares of Tac that it did not own for uS$5,44 million on 18 december 2015. in accordance with international Financial reporting Standards, Tac has been consolidated into Trencor since July 2013 notwithstanding that Halco did not own a majority stake until december 2015. For the purposes of the consolidation of the results into Trencor, the fair values of the assets and liabilities of the company were determined as at 1 July 2013.
Trencor Limited Integrated Annual Report 2015
12
amounts owing by Tac for containers acquired by it on extended credit terms in past years account for a major portion of the remaining long-term receivables (refer to note 9 on page 46). Trencor monitors the performance of Tac and its cash flow forecasts and uses these projections to assist in valuing the long-term receivables.
utilisation increased from 93,5% towards the end of 2014 to 94,4% towards the end of 2015. The increase in utilisation reflects actions taken by equipment managers to mitigate the impact of weaker demand for leased containers (eg reducing some lease rates and selling older containers).
Lapco refinanced its bank facility with its existing syndicate of banks in november 2015. The new two-year revolving facility has a lower interest rate of LiBor plus 210 basis points during the revolving period (previously LiBor plus 235 basis points) and a lower interest rate of LiBor plus 285 basis points during the six-year term-out period (versus LiBor plus 300 basis points previously).
Tac reported that its profits, before iFrS container fleet impairment, declined in 2015 due, inter alia, to higher depreciation (uS$2 million) and losses on the sale of older containers (uS$2 million) as a result of a sharp decline in average selling prices.
Tac expects market conditions in 2016 to be similar to 2015 with the benefits of high utilisation being offset by low lease rates and disposal prices. containers are a long-term investment and Tac believes that it should continue to generate profits by using its access to competitive bank funding and its relationships with competent managers including Textainer.
during the year, the company committed to the purchase of 12 373 Teu of containers of varying types at a total cost of uS$20 million. 9 724 Teu of Tac’s older containers were disposed of during the year (12 838 Teu in 2014).
TAC: Salient information (before IFRS container fleet impairment)
2015restated
2014 change
Financial (US$ million)Total revenue 48 53 -9%
Trading profit after net finance cost
7 12 -42%
net profit 6 9 -33%
profit attributable to Halco 3 4 -25%
Operationalaverage fleet utilisation 94,1% 88,8% +5,3%
Total fleet (Teu’000s) 174 172 +2
Long-term lease fleet 136 131 +5
Short-term lease fleet 38 41 -3
PROPERTY INTEREST
at 31 december 2015, Trencor had a 15% interest in the companies that own and operate grand central airport in midrand, gauteng, which continued to provide satisfactory returns. our exposure to these investments was r3 million. as reported in prior years, these investments were regarded as non-core and available for disposal at a suitable opportunity.
Subsequent to the year-end, Trencor’s interest in these companies was disposed of effective 17 June 2016, realising proceeds of r39,7 million.
Trencor Limited Integrated Annual Report 2015
13
Corporate Governance
Trencor endorses the principles underlying the code of corporate practices and conduct in the King iii report on corporate governance (‘the code’ or ‘the King report’). ongoing enhancement of corporate governance principles is a global movement, supported by the board which, together with senior management, will continue to follow and adopt, as appropriate, existing and new principles which advance good practical corporate governance and add value to the company.
The principles recommended by the King report have been assessed and the disclosure on how each has been applied or an explanation why or to what extent they were not applied is contained in a register available on the company’s website.
Save as may be indicated in that register and in this report, the board is not aware of any non-compliance with the code during the year under review.
The salient features of corporate governance as applied in the group are set out below.
BOARD OF DIRECTORSCOMPOSITION
The names and brief résumés of the directors appear on page 78.
during the year the board comprised nine directors, four of whom are executive and five non-executive of whom four qualify as independent non-executive directors in terms of the King report. The board is satisfied that there is a clear balance of power and authority at board level and that no one individual director or block of directors has undue influence on decision-making. The directors have considerable experience and an excellent understanding of the business. mr ra Sieni was appointed to the board as financial director effective 1 march 2016.
Board effectiveness reviews are undertaken on an annual basis and the board is satisfied with the results of this process.
nominations for appointment to the board are formal and transparent and submitted by the nomination committee to the full board for consideration.
CHAIRMAN/CEO
until mr ni Jowell’s announced retirement as director and executive, Trencor had an executive chairman and did not require a separate ceo, due to its small corporate office and the limited nature of its activities as an investment holding company.
in view of the fact that the chairman was an executive, mr dm nurek was the appointed lead independent non-executive director.
The appointment of the chairman is reviewed on an annual basis.
mr ni Jowell, as the current executive chairman, retires from all positions in the group at the close of the forthcoming annual general meeting and the board has determined that mr dm nurek is to succeed him as independent non-executive chairman from that date. mr Je mcQueen (formerly financial director) was appointed as chief executive officer effective 1 march 2016.
PROFESSIONAL ADVICE
all directors have access to the company secretary and management and are entitled to obtain independent professional advice at the company’s expense if required.
COMPANY SECRETARY
The company secretary is Trencor Services proprietary Limited, a wholly-owned subsidiary of the company, which is mainly responsible for corporate administration of the company’s corporate office functions. The board is of the opinion that, in view of the fact that the company secretary is a wholly-owned subsidiary, an arms-length relationship is not feasible. Based on the outcome of an annual assessment conducted by the executive committee, the board is satisfied that the specific individual employed by Trencor Services proprietary Limited to carry out the duties of a secretary of a public company has the requisite competence, knowledge and experience to effectively perform the role as the gatekeeper of good governance.
MEETINGS
The board meets on a scheduled quarterly basis and at such other times as circumstances may require. during the year ended 31 december 2015, four meetings were held and these were attended by all directors in person or by telephone/video link, save for mr H Wessels who attended three meetings.
Board papers are timeously issued to all directors prior to each meeting and contain relevant detail to inform members of the financial and trading position of the company and each of the operations. When appropriate, strategic matters and developments are also addressed.
The chairman meets with non-executive directors, either individually or collectively, on an ad-hoc basis to apprise them of any significant matters that may require their input and guidance. in addition, the independent non-executive directors may hold separate meetings as and when they deem it appropriate.
DIRECTORS’ SERVICE CONTRACTS
none of the directors have service agreements. all executive directors have an engagement letter which provides for a notice period of between one and three months to be given by either party.
in terms of the memorandum of incorporation, not less than one-third of the directors are required to retire by rotation at each annual general meeting of the company and may offer themselves for re-election. new directors appointed during the year are required to retire at the next annual general meeting, but may offer themselves for re-election.
Trencor Limited Integrated Annual Report 2015
14
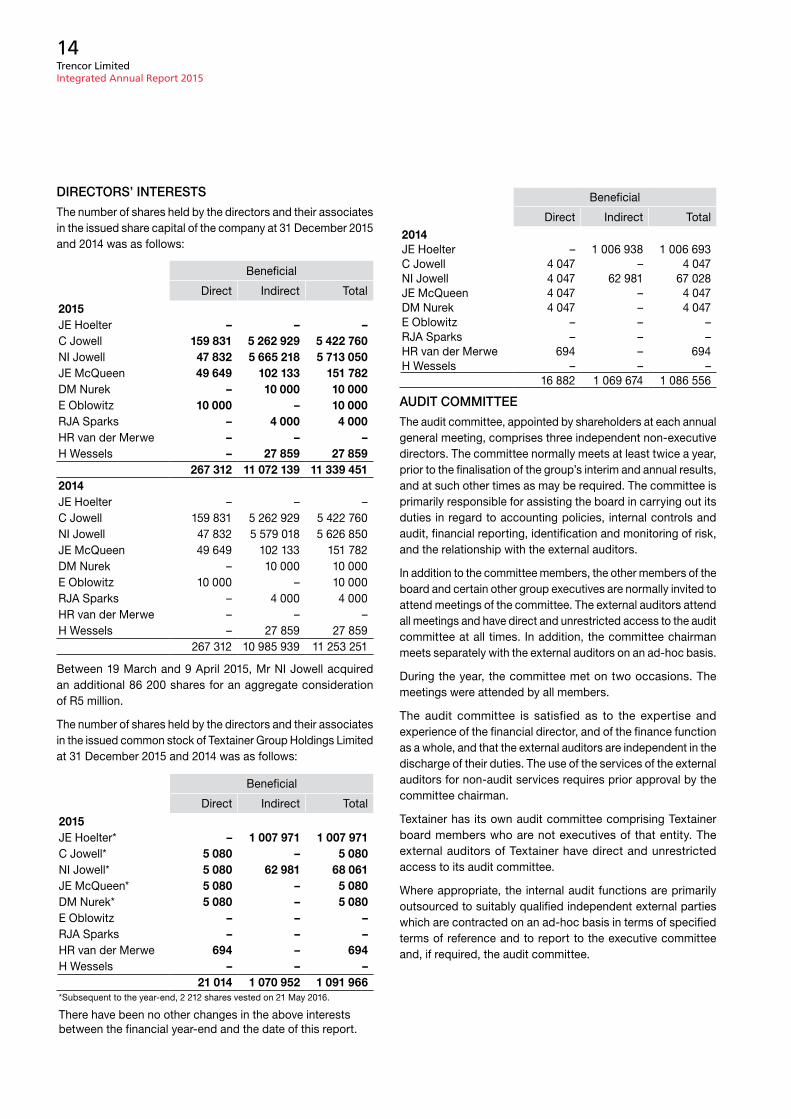
DIRECTORS’ INTERESTS
The number of shares held by the directors and their associates in the issued share capital of the company at 31 december 2015 and 2014 was as follows:
Beneficial
direct indirect Total
2015Je Hoelter – – –c Jowell 159 831 5 262 929 5 422 760ni Jowell 47 832 5 665 218 5 713 050Je mcQueen 49 649 102 133 151 782dm nurek – 10 000 10 000e oblowitz 10 000 – 10 000rJa Sparks – 4 000 4 000Hr van der merwe – – –H Wessels – 27 859 27 859
267 312 11 072 139 11 339 4512014Je Hoelter – – –c Jowell 159 831 5 262 929 5 422 760ni Jowell 47 832 5 579 018 5 626 850Je mcQueen 49 649 102 133 151 782dm nurek – 10 000 10 000e oblowitz 10 000 – 10 000rJa Sparks – 4 000 4 000Hr van der merwe – – –H Wessels – 27 859 27 859
267 312 10 985 939 11 253 251
Between 19 march and 9 april 2015, mr ni Jowell acquired an additional 86 200 shares for an aggregate consideration of r5 million.
The number of shares held by the directors and their associates in the issued common stock of Textainer group Holdings Limited at 31 december 2015 and 2014 was as follows:
Beneficial
direct indirect Total
2015Je Hoelter* – 1 007 971 1 007 971c Jowell* 5 080 – 5 080ni Jowell* 5 080 62 981 68 061Je mcQueen* 5 080 – 5 080dm nurek* 5 080 – 5 080e oblowitz – – –rJa Sparks – – –Hr van der merwe 694 – 694H Wessels – – –
21 014 1 070 952 1 091 966*Subsequent to the year-end, 2 212 shares vested on 21 may 2016.
There have been no other changes in the above interests between the financial year-end and the date of this report.
Beneficial
direct indirect Total
2014Je Hoelter – 1 006 938 1 006 693c Jowell 4 047 – 4 047ni Jowell 4 047 62 981 67 028Je mcQueen 4 047 – 4 047dm nurek 4 047 – 4 047e oblowitz – – –rJa Sparks – – –Hr van der merwe 694 – 694H Wessels – – –
16 882 1 069 674 1 086 556
AuDIT COMMITTEE
The audit committee, appointed by shareholders at each annual general meeting, comprises three independent non-executive directors. The committee normally meets at least twice a year, prior to the finalisation of the group’s interim and annual results, and at such other times as may be required. The committee is primarily responsible for assisting the board in carrying out its duties in regard to accounting policies, internal controls and audit, financial reporting, identification and monitoring of risk, and the relationship with the external auditors.
in addition to the committee members, the other members of the board and certain other group executives are normally invited to attend meetings of the committee. The external auditors attend all meetings and have direct and unrestricted access to the audit committee at all times. in addition, the committee chairman meets separately with the external auditors on an ad-hoc basis.
during the year, the committee met on two occasions. The meetings were attended by all members.
The audit committee is satisfied as to the expertise and experience of the financial director, and of the finance function as a whole, and that the external auditors are independent in the discharge of their duties. The use of the services of the external auditors for non-audit services requires prior approval by the committee chairman.
Textainer has its own audit committee comprising Textainer board members who are not executives of that entity. The external auditors of Textainer have direct and unrestricted access to its audit committee.
Where appropriate, the internal audit functions are primarily outsourced to suitably qualified independent external parties which are contracted on an ad-hoc basis in terms of specified terms of reference and to report to the executive committee and, if required, the audit committee.
Trencor Limited Integrated Annual Report 2015
15
BOARD AND BOARD COMMITTEE TERMS OF REFERENCE
The board is ultimately accountable and responsible for the performance and affairs of the company. in essence, it provides strategic direction, monitors and evaluates operational performance and executive management, determines policies and processes to ensure effective risk management and internal controls, determines policies regarding communication and is responsible for ensuring an effective composition of the board.
COMMITTEES OF THE BOARD
Several committees of the board exist, each with specific terms of reference, to assist the board in discharging its responsibilities. The terms of reference are reviewed on an annual basis. The composition of these committees is reviewed on an ongoing basis. The names of the members of the committees appear on page 2.
NOMINATION COMMITTEE
The nomination committee comprises of three independent non-executive directors and identifies and recommends to the board suitable competent candidates for appointment as directors.
The committee meets on an ad-hoc basis. during the year, the committee held one meeting which was attended by all members. mr H Wessels was appointed to the committee on 18 February 2015.
Directors’ independence
The committee has conducted the necessary annual assessment and is satisfied as to the independence of each of the independent non-executive directors of the company and, in particular, those who have been in office for more than nine years, having regard to the requirements of the King report and the provisions of the companies act of South africa.
Succession planning
The nomination committee of the board is satisfied that suitable succession plans are in place.
EXECuTIVE COMMITTEE
The executive committee, comprising the four executive directors during 2015, met formally on a regular basis throughout the year and informally as and when required. during the year, ten formal monthly meetings were held which were attended by all members, save for mr c Jowell who attended nine meetings. mr ra Sieni was appointed to the committee effective 1 march 2016. The minutes of these meetings are distributed to non-executive directors after each meeting.
This committee has the authority of the board, which is subject to annual review, to take decisions on matters involving financial risk management and matters requiring immediate action (subject to the approval of the committee chairman or his nominee) and passing of enabling resolutions, which:
• do not have major policy implications for the group, or
• have been discussed with and the support obtained from a majority of board members, save that any dissenting director has the right to call a board meeting, or
• if requiring significant capital expenditure, are in the normal course of business.
REMuNERATION COMMITTEE
The remuneration committee reports directly to the board and comprises two independent non-executive directors. The committee’s task is to review the compensation of executive and non-executive directors and senior management of the company. The chairman of the board is usually invited to attend meetings of the committee, but does not participate in any discussion relating to his own remuneration.
during the year, one committee meeting was held which was attended by both members.
The committee, in assessing base salaries and other forms of guaranteed remuneration, takes into account appropriate benchmarking including, where required, input from independent remuneration consultants.
Remuneration policies and practices
Trencor seeks to employ persons of superior ability who will adequately meet the needs of our stakeholders and believes remuneration should be at least commensurate with that of similarly qualified people in comparable positions in like industries and in similar geographic locations.
• executive directors
executive directors are paid a guaranteed amount on a cost to company basis, which includes salaries as well as medical aid and pension fund contributions.
They are also paid an annual incentive based on the adjusted headline earnings which excludes, inter alia, the effect of any unrealised translation gains or losses on translation of the long-term receivables arising as a result of changes in the rand/uS dollar exchange rate. accordingly, the annual incentive bonus payments are directly correlated to the performance of the company.
Trencor Limited Integrated Annual Report 2015
16
remuneration is pro-rated in respect of executives who are employed on a part-time basis.
• members of management who are not executive directors
The company’s policy in respect of these executives is that their guaranteed pay, determined on a cost to company basis, together with an incentive bonus paid should be attractive compared to levels paid in equivalent positions in other companies. The policy is on the same terms as for executive directors.
• changes to incentive bonus arrangements for executives and senior management
With effect from 1 January 2016 the amounts of the incentive bonuses that were paid to executive directors and senior management in respect of the financial year ended 31 december 2015 have been incorporated into their guaranteed remuneration. With effect from 1 January 2016, executive directors and senior management will no longer qualify to receive annual incentive bonuses. This change has been effected because the current structure and operations of the group are such that the executives are no longer able to make a direct material contribution to the results or profitability of the company.
• non-executive directors
The remuneration committee recommends the fees payable to non-executive directors to the board for approval which, in turn, proposes such fees to shareholders for approval. These fees are also determined with reference to appropriate benchmarking against comparable companies.
Shareholders will be asked at the forthcoming annual general meeting to approve the proposed remuneration payable to non-executive directors in their capacities as such from 1 July 2016 until the next annual general meeting, which represents an increase of 7%.
The uS-based non-executive director is paid in uS dollars. other non-executives are compensated for special services to the group.
Directors’ remuneration
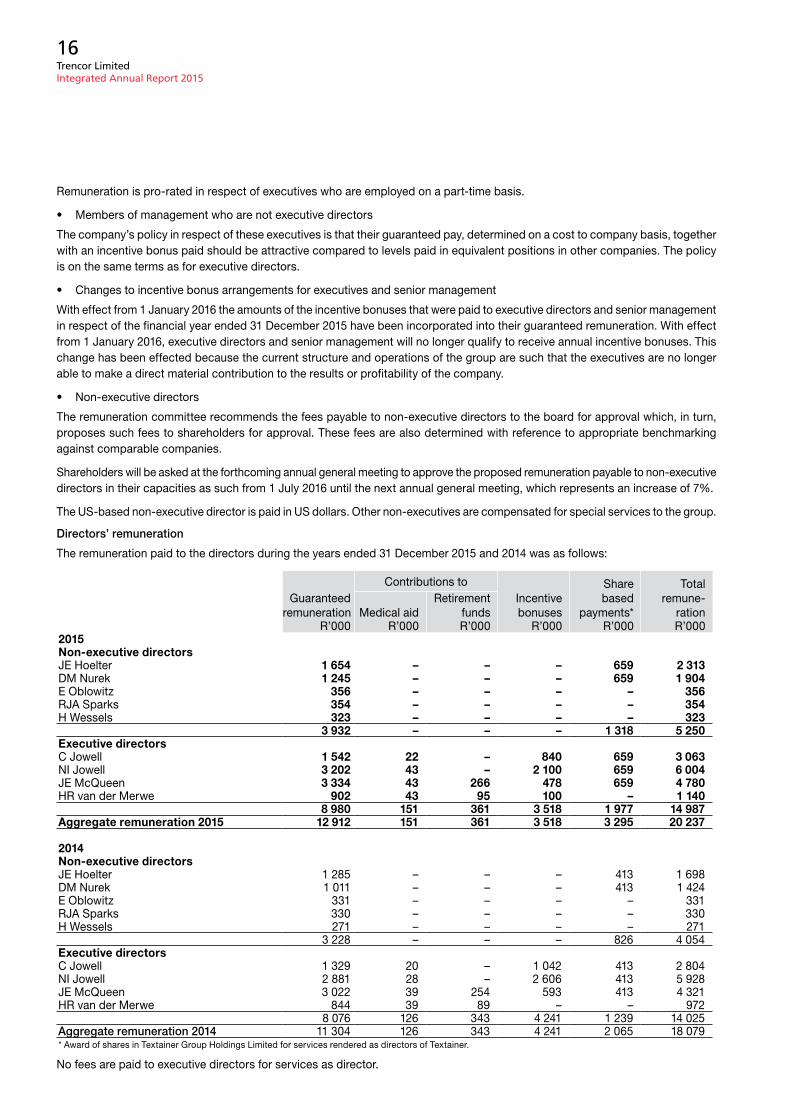
The remuneration paid to the directors during the years ended 31 december 2015 and 2014 was as follows:
guaranteedremuneration
contributions toincentive bonuses
Share based
payments*
Total remune-
rationmedical aidretirement
fundsr’000 r’000 r’000 r’000 r’000 r’000
2015Non-executive directorsJe Hoelter 1 654 – – – 659 2 313dm nurek 1 245 – – – 659 1 904e oblowitz 356 – – – – 356rJa Sparks 354 – – – – 354H Wessels 323 – – – – 323
3 932 – – – 1 318 5 250Executive directors c Jowell 1 542 22 – 840 659 3 063ni Jowell 3 202 43 – 2 100 659 6 004Je mcQueen 3 334 43 266 478 659 4 780Hr van der merwe 902 43 95 100 – 1 140
8 980 151 361 3 518 1 977 14 987Aggregate remuneration 2015 12 912 151 361 3 518 3 295 20 237
2014Non-executive directorsJe Hoelter 1 285 – – – 413 1 698dm nurek 1 011 – – – 413 1 424e oblowitz 331 – – – – 331rJa Sparks 330 – – – – 330H Wessels 271 – – – – 271
3 228 – – – 826 4 054Executive directors c Jowell 1 329 20 – 1 042 413 2 804ni Jowell 2 881 28 – 2 606 413 5 928Je mcQueen 3 022 39 254 593 413 4 321Hr van der merwe 844 39 89 – – 972
8 076 126 343 4 241 1 239 14 025Aggregate remuneration 2014 11 304 126 343 4 241 2 065 18 079* award of shares in Textainer group Holdings Limited for services rendered as directors of Textainer.
no fees are paid to executive directors for services as director.
Trencor Limited Integrated Annual Report 2015
17
The Trencor Share Option Plan
in terms of The Trencor Share option plan, options were previously granted to certain executive directors and employees. all of these options have been exercised and there are no options currently outstanding.
There is currently no intention to grant further options but the plan is being maintained in its current dormant state in order that options may be granted in future should the need arise. accordingly, no authority is sought from shareholders at this stage to place the unissued shares reserved for the plan under the control of the directors and to authorise the directors to issue such shares.
GOVERNANCE COMMITTEE
The governance committee comprises of three independent non-executive directors. The committee is responsible for making recommendations to the board in all matters relating to the development, evaluation and monitoring of the company’s corporate governance processes, policies and principles; the development and implementation of and monitoring compliance with the company’s code of conduct and making recommendations to the board on revisions thereto from time to time as appropriate.
during the year, one committee meeting was held, which was attended by all members. mr H Wessels was appointed to the committee on 18 February 2015.
Restriction on trading in shares
a formal policy prohibits directors, officers and employees from dealing in the company’s shares from the end date of an interim reporting period until after the interim results have been published and similarly from the end date of the financial year until after the reviewed annual results have been published. directors and employees are reminded of this policy prior to the commencement of any restricted period.
in addition, no dealing in the company’s shares is permitted by any director, officer or employee whilst in possession of information which could affect the price of the company’s shares and which is not in the public domain.
directors of the company and of its major subsidiaries are required to obtain clearance from Trencor’s chairman (and in the case of the chairman, or in the absence of the chairman, from the chairman of the audit or remuneration committee) prior to dealing in the company’s shares, and to timeously disclose to the company full details of any transaction for notification to and publication by the JSe.
SOCIAL AND ETHICS COMMITTEE
given the limited nature of the company’s activities as an investment holding company, the activities of this committee are limited in nature.
The social and ethics committee comprises an independent non-executive director as chairman and two executive directors.
during the year, one committee meeting was held, which was attended by all members.
The main objective of the committee is to assist the board in monitoring the company’s performance as a good and responsible corporate citizen by monitoring sustainable development practices.
The committee is responsible for developing and reviewing policies with regard to the commitment, governance and reporting of sustainable development performance and for making recommendations to the board in this regard.
its role also includes the monitoring of any relevant legislation, other legal requirements or prevailing codes of best practice, specifically with regard to matters relating to social and economic development, good corporate citizenship, the environment, health and public safety, consumer relationships, as well as labour and employment. refer to the sustainability report on pages 21 to 23.
Code of ethics
The board, management and staff agreed a formal code of ethical conduct in 1998 which seeks to ensure high ethical standards. all directors and employees are expected to strive at all times to adhere to this code, and to enhance the reputation of the company. This code is signed by all directors, managers and employees on an annual basis.
any transgression of this code is required to be brought to the attention of the board. There were no transgressions during the year under review.
RISK COMMITTEE
The risk committee comprises the members of the audit committee and messrs Je Hoelter and dm nurek. mr Je mcQueen was appointed to the committee on 23 november 2015. during the year, two committee meetings were held, which were attended by all members.
in addition to the committee members, the chairman of the board, the financial director and certain other group executives are invited to attend meetings of the committee.
responsibility for managing risk lies ultimately with the board of directors. The risk committee and executive committee assist the board in discharging its responsibilities in this regard by identifying, monitoring and managing risk on an ongoing basis and within the authority conferred upon them by the board. The identification and mitigation of risk is a key responsibility of management and the executive committee.
The following significant risk exposures within the operations and the possible impacts and the measures taken to mitigate such risks have been identified:
Trencor Limited Integrated Annual Report 2015
18
• Exchange rate fluctuations
The operations are largely uS dollar-based and, accordingly, changes in the r/uS$ exchange rate can and do significantly affect the translation of assets, liabilities, profits and losses into South african currency. The long-term export receivables are all denominated in uS dollars. The board has resolved that these receivables should remain in uS dollars and should not be hedged into any other currency, save that the executive committee is authorised to sell limited amounts due to be collected forward, into rand, if it believes that doing so would protect the rand receipts. unrealised gains and losses arising on translation at reporting dates of the unhedged portion of the long-term receivables and related valuation adjustments are included in profit and loss and changes in the r/uS$ exchange rate may result in volatility in earnings when expressed in rand.
For the years ended 31 december 2015 and 2014, 27% and 28% respectively of Textainer’s direct container expenses were paid in eighteen foreign currencies other than the uS dollar. a decrease in the value of the uS dollar against non-uS currencies in which these expenses are incurred would translate into an increase in those expenses in uS dollar terms, which would decrease net income of Textainer and the group.
• Decrease in activity - effect on long-term receivable collections
declines in lease rates, utilisation and residual values of equipment in the container industry can adversely affect the cash flows of container owners and could impair the ability of these companies to meet their obligations to the group and its export partners under the long-term export contracts. conversely, improved market conditions may enhance their ability to meet these obligations. Trencor’s in-depth understanding of the industry and many of the main participants enables the company to monitor the activities of these entities and, where necessary, take whatever action may be required to protect the company’s and the export partners’ interests. changes in market conditions in the industry require the company to make appropriate fair value adjustments from time to time to recognise the changes in the timing and possible non-receipt of instalments under these long-term export contracts.
• Access to credit
The past several years have been characterised by weak global economic conditions, inefficiencies and uncertainty in the credit markets, a low level of liquidity in many financial markets and extreme volatility in many equity markets. although these conditions appear to be abating and global recoveries seem to be underway, it is not yet clear whether a sustainable recovery is currently taking place. any deceleration or reversal of the relatively slow and modest global economic recoveries could heighten a number of material risks to Textainer’s and Tac’s businesses, results of operations, cash flows and financial condition, as well as their future prospects, including the following:
– containerised cargo volume growth: a contraction or slowdown in containerised cargo volume growth or negative containerised cargo volume growth would likely create a surplus of containers, lower utilisation, higher direct costs, weaker shipping lines going out of business, pressure for lease concessions and lead to a reduction in the size of customers’ container fleets. High utilisation of containers and fleet growth may not be sufficient to provide revenue and income growth if increased competition or other factors keep container lease rates low for prolonged periods.
– credit availability and access to equity markets: continued issues involving liquidity and capital adequacy affecting lenders could affect the ability to fully access credit facilities or obtain additional debt and could affect the ability of lenders to meet their funding commitments. Further, high level of volatility in the equity markets may make it difficult for Textainer to access the equity markets for additional capital at attractive prices, if at all. if the company is unable to obtain credit or access the capital markets, its business could be negatively impacted. additionally, in recent years there has been increased access to debt financing on favourable terms by Textainer and Tac and their competitors and this has led to greater competition for lease transactions and lower container lease rates.
– credit availability to customers: it is believed that many customers are reliant on liquidity from global credit markets and, in some cases, require external financing to fund their operations. as a consequence, if these customers lack liquidity, it would likely negatively impact their ability to pay amounts due to Textainer and Tac.
many of these and other factors affecting the container industry are inherently unpredictable and beyond the control of the operations.
• Lessee defaults may harm Textainer’s and TAC’s businesses, results of operations and financial condition by decreasing revenue and increasing storage, repositioning, collection and recovery expenses
Textainer’s and Tac’s containers are leased to numerous container lessees. Lessees are required to pay rent and to indemnify the owners for damage to or loss of containers. Lessees may default in paying rent and performing other obligations under their leases. a delay or diminution in amounts received under the leases (including leases on managed containers), or a default in the performance of maintenance or other lessee obligations under the leases could adversely affect Textainer’s or Tac’s businesses, results of operations and financial condition and their ability to make payments on their debt.
When lessees default, Textainer or Tac may fail to recover all of their containers, and the containers that they do recover may be returned to locations where they will not be able to quickly re-lease or sell them on commercially acceptable terms. Historically these companies have recovered a very high percentage of
Trencor Limited Integrated Annual Report 2015
19
their containers from defaulting lessees. Textainer experienced several lessee defaults in 2015 which negatively impacted its performance. Textainer believes that there is a continued risk of lessee default in 2016. if a material amount of future recoveries from defaulting lessees continue to deviate from historical recovery experience, Textainer’s or Tac’s financial performance and cash flow could be severely adversely affected.
• Interest rates
Textainer and Tac have various borrowing facilities, all of which are denominated in uS dollars and borrowings made under the facilities may be subject to variable interest rates. Textainer and Tac have firm policies that long-term lease business should be financed with fixed rate debt and master lease (short-term) business should be financed with variable rate debt. interest on loans raised to purchase containers leased out under long-term leases (usually of five years’ duration at fixed rates) is swapped into fixed interest rate contracts of a similar term, while loans raised to purchase containers for master lease are at variable rates. Textainer and Tac have entered into various interest rate swap and cap agreements to mitigate the exposure associated with variable rate debt. The swap agreements involve payments to counterparties at fixed rates in return for receipts based upon variable rates indexed to the London interBank offered rate. There can be no assurance that these interest rate caps and swaps will be available in the future, or if available, will be on satisfactory terms. if Textainer and Tac are unable to obtain such interest rate caps and swaps or if a counterparty under the interest rate swap and cap agreements defaults, the exposure associated with the variable rate debt could increase. neither Textainer nor Tac applies hedge accounting to the interest rate swaps, notwithstanding that such swaps may be economically effective; they account on the basis that the net result of the marked-to-market valuation of these instruments is flowed through profit or loss. This may result in volatility of earnings.
• Credit risk concentration
Textainer’s customers are mainly international shipping lines which transport goods on international trade routes. once containers are on-hire to a lessee, Textainer does not track their location. The domicile of the lessee is not indicative of where the lessee is transporting containers. The business risk for Textainer in its international operations lies with the creditworthiness of the lessees rather than the geographic location of the containers or the domicile of the lessees.
Textainer’s five largest customers accounted for approximately 40,3% of its total owned and managed fleet’s 2015 lease billings (2014: 38,2%). Lease billings from Textainer’s 20 largest container lessees by lease billings represented 77,4% and 74,7% of total owned and managed fleet’s container lease billings in 2015 and 2014 respectively.
Textainer’s largest lessee accounted for 11,1% of lease rental income during 2015 (2014: 10,6%). The second largest lessee accounted for 10,5% of lease rental income in 2015 (2014: 9,8%). Textainer had no other lessee greater than 10%. These lessees individually accounted for 9,3% and 9,3%, and 9,7% and 8,9%, respectively in 2015 and 2014 of gross accounts receivable.
a default by any of these major customers could have a material adverse impact on Textainer’s business, results from operations and financial position.
• Container ownership
ownership of containers entails greater risk than management of containers for container investors. in 2015, Textainer increased the percentage of containers in its fleet that it owns from 78,9% at the beginning of the year to 80,1% at the end of the year. The increased number of containers in Textainer’s owned fleet increases its exposure to financing costs, financing risks, changes in per diem rates, re-leasing risk, changes in utilisation rates, lessee defaults, repositioning costs, storage expenses, impairment charges and changes in sales price upon disposition of containers. The number of containers in the owned fleet fluctuates over time as new containers are purchased, containers are sold into the secondary resale market, and other fleets are acquired. as part of its strategy, Textainer focuses on increasing the number of owned containers in its fleet and therefore ownership risk may be expected to increase correspondingly.
• Decrease in container fleet utilisation
a decline in utilisation, for example due to a reduction in world trade or in container traffic on particular routes or an oversupply of competitors’ containers, could result in reduced revenue, increased storage expenses and thus lower profit. in order to reduce volatility in revenue and earnings of the containers in Textainer’s on-hire fleet, 85,3% (2014: 84,0%) are on long-term lease and finance lease. Textainer has also developed a very active used-container trading operation and thus has an effective infrastructure to dispose of containers that have reached the end of their economic lives, on the best available terms. Textainer monitors containers due to come off lease and manages their disposal or re-lease.
• Container off-hires in low demand locations
a build-up of off-hire containers in low demand locations where they cannot easily be on-hired again could lead to decreased utilisation, reduced revenue, higher storage costs and the possibility of having to ship the equipment, at considerable cost, to positions where it can be leased out. To reduce this exposure, Textainer is increasingly placing containers into long-term leases and also negotiating more favourable lease terms that limit the number of containers that lessees may off-hire in low demand areas. it also regularly repositions containers from low to high demand locations.
Trencor Limited Integrated Annual Report 2015
20
• New container prices
changes in the prices of new container equipment have an impact on lease rates. in general, declining new container prices lead to softening in rates, while increasing prices may result in upward pressure on lease rates. if a downturn in new container prices is sustained, the lease rates of older, off-lease containers would also be expected to decrease and the prices obtained for containers sold at the end of their useful life would also be expected to decrease. if a reduction in the price of new containers is sustained such that the market lease rate or resale value for all containers is reduced, this trend could harm Textainer’s or Tac’s businesses, results of operations and financial condition, even if this sustained reduction in price would allow those companies to purchase new containers at a lower cost.
• Value of containers
The ultimate return from the ownership of a container will depend, in part, upon the residual value at the end of its economic life. The market value of a used container depends upon, among other things, its physical condition, supply and demand for containers of its type and remaining useful life in relation to the cost of a new container at the time of disposal and the location where it will be sold. a decline in residual values of containers can adversely affect returns from container ownership and cash flows.
• Reporting standards
Trencor reports its results in accordance with international Financial reporting Standards while Textainer and Tac report in accordance with generally accepted accounting policies in the united States of america. This may cause the reporting of Textainer and Tac’s results by Trencor to differ from that which is reported in the financial results of those companies. These differences may result in an inability to reconcile the results of the companies, market confusion and an inconsistent market reaction when the companies report.
INFORMATION RESOuRCES MANAGEMENT
Trencor, like other organisations, is reliant on information technology to effectively and efficiently conduct its business. The iT systems, policies and procedures are reviewed on an ongoing basis to ensure that effective internal controls are in place to manage risk and promote efficiencies, and as far as possible to comply with universally accepted standards and methods. attention is continuously focused on maximising the benefits whilst minimising the risks associated with all aspects of the iT portfolio as they apply to business operations.
Security policies and procedures for employees and the use of technologies such as enterprise and personal firewalls, antivirus systems, intrusion monitoring and detection are applied, as well as frequent application of software security ‘patches’ issued by vendors as and when vulnerabilities are discovered.
Trencor corporate office has established procedures that when invoked enable a complete recovery of the iT network and business systems within specified time limits. Textainer and Tac have their own business continuity plans.
STAKEHOLDER COMMuNICATION
members of the executive committee of the board meet on an ad-hoc basis with institutional investors, investment analysts, individuals and members of the financial media. discussions at such meetings are restricted to matters that are in the public domain. no such discussions are permitted in a closed period.
Shareholders are informed, by means of press announcements and releases in South africa and/or printed matter sent to such shareholders, of all relevant corporate matters and financial reporting as required in terms of prevailing legislation. in addition, such announcements are communicated via a broad range of channels in both the electronic and print media. The company maintains a corporate website (www.trencor.net) containing financial and other information, including interim, reviewed and annual results.
Trencor Limited Integrated Annual Report 2015
21
Sustainability Report
Trencor is an investment holding company listed on the JSe. its core interests are in the operations as reflected in the review of operations on pages 10 to 12 of this integrated annual report.
BuSINESS STRATEGIES
The operations will grow their businesses profitably by pursuing the following strategies:
• gain further leverage off Textainer’s position as one of the largest intermodal container lessors based on fleet size and consistent container purchaser in the container leasing industry.
• pursue attractive acquisitions in their chosen industry.
• offer purchase and leaseback transactions.
• renew expiring leases of in-fleet containers as far as possible.
• grow container resales.
• continue to focus on further increasing operating efficiency.
• ensure adequate access to appropriate sources of capital.
ORIGINS AND HISTORY
Trencor started business as a general motors dealership. in 1930 Trencor’s founders converted a Buick sedan to a small truck and started a road transport business which in due course became a leading nationwide carrier in South africa. Since then, the company and the group have undergone a number of changes to adjust to changing circumstances.
in 1955 Trencor listed on the JSe. 1969/70 saw the branching out into road trailer manufacturing through the acquisition of Henred Trailer manufacturing company, which subsequently merged with Fruehauf South africa to form Henred-Fruehauf Trailers.
1977 marked the beginning of manufacturing of dry freight marine cargo containers for the export market. This was later expanded to include the manufacture of folding flatrack containers and stainless steel tank containers. in 1979 Trencor commenced the sale of containers on long-term credit. The aggregate sales value of containers so exported from South africa exceeded uS$1 billion.
With the advent of globalisation and the freeing up of the South african economy, the focus shifted to the current interests described above. Today, Textainer, operating since 1979 and listed on the new York Stock exchange since 2007, is one of the world’s largest lessors of intermodal containers based on fleet size. Textainer leases containers to approximately 360 shipping lines and other lessees, sells containers to more than 1 200 customers and provides services worldwide via a network of 14 regional and area offices, as well as 500 independent depots.
The year 2015 marked two major milestones in Trencor’s history – 60 years of being listed on the JSe and 85 years since the business was started in Springbok.
SuSTAINABILITY STRATEGY OF OPERATIONS
Trencor and the operations recognise the interest of both internal and external stakeholders in their organisational and operational activities and performance. comprising socially responsible entities, the group embraces the goal of sustainable development.
The non-financial aspects of sustainability may ultimately have a financial impact on the operations and thus cannot be ignored. Sustainability is therefore important in enhancing shareholder value, quite apart from fulfilling social responsibility.
The sustainability strategy focuses on high level target areas, specific objectives and key performance indicators for each functional area.
MANAGING SuSTAINABILITY
The Trencor board as a whole assumes responsibility for sustainable and socially responsible management through its own board committees and management and through feedback in respect of those operations that are independently managed.
SuSTAINABLE RISK AREAS
The main areas focused on to ensure the long-term success and sustainability of the operations are shareholders, employees, customers, suppliers, regulatory requirements, environment and community.
MEASuRING PERFORMANCE
Sustainability is measured with reference to the ‘value add’ and wealth created for the benefit of all stakeholders over the long-term, through the operations.
Wealth created and distributed during the year ended 31 december 2015 was as follows:
rm
Wealth created:
Total revenue 9 277
Less: costs of goods and services (6 254)
3 023
Wealth distributed:
employees’ compensation 358
government (direct taxes) 61
Shareholders (dividends) 1 152
depreciation and amortisation (non-cash) 2 661
net loss (1 209)
3 023
cents per share
Shareholders
growth of shareholder wealth and returns
Loss (83)
dividends 300
Trencor share price at year-end 4 450
Trencor Limited Integrated Annual Report 2015
22
EMPLOYEES
Trencor and the operations all have succession plans approved by their respective corporate governance and nomination committees, as well as by their boards.
The operations promote an environment where employees have continuing opportunities for improving their professional skills and enhancing their personal growth through various training and development programmes. The operations offer their employees assistance in continuing their education.
details of the employee benefits provided by Trencor and Textainer respectively are provided in the notes to the financial statements included in this integrated annual report.
The operations aim to maintain open and productive work environments that are responsive to the needs and concerns of the employees. The operations believe that communication is the key to building successful relationships. The aim is to foster an environment of mutual respect and confidence in which employees can develop their skills and talents.
The company is committed to a policy of non-discrimination. employees with a disability or life-threatening illness will be allowed to continue working as long as they are able to meet the company’s performance standards, and their work does not present a direct threat to their own health or safety, or that of others.
REMuNERATION
The company’s remuneration practices and policies are described in the corporate governance section of this integrated annual report.
EMPLOYMENT EquITY
in South africa, the workforce at 31 december 2015 comprised the employees of Trencor Services proprietary Limited at Trencor’s corporate office consisting of 18 persons: four executive white male directors, four white males in senior management, one white disabled and one coloured male and one white female in junior management, two coloured and three white semi-skilled females and one unskilled coloured male and one unskilled african woman.
CuSTOMERS
Through ongoing interaction with their customers the operations believe they are able to provide an excellent product and service to their customers on a sustainable basis.
The customers of the operations are mainly international shipping lines, but they also lease containers to freight forwarding companies and the uS military.
Textainer leases containers to more than 360 shipping lines and other lessees, including each of the world’s top 20 container lines, as measured by the total Teu capacity of their container vessels. Textainer has a long track record in the industry, operating since
1979, and has developed long-standing relationships with key industry participants. its top 20 customers, as measured by revenues, have leased containers from it for an average of 30 years.
global sales and customer service forces are responsible for developing and maintaining relationships with customers’ senior management. Senior sales people in the operations have considerable industry experience and the quality of their customer relationships and level of communication with their customers represents an important advantage.
SuPPLIERS
Trencor acknowledges that to remain competitive and offer a comprehensive product range, goods and services need to be sourced globally by the operations. This includes establishing business relations with suppliers and manufacturers in developing countries where production cannot always be monitored by the operations. Textainer and Tac currently purchase almost all their containers in the peoples republic of china. The operations will not tolerate any violation of human rights and basic social standards of which they may become aware. at the same time the operations respect local laws, norms and culture provided these are not in conflict with fundamental ethical and human rights. Workplace standards of suppliers are monitored by the operations, where possible, and corrective action proposed when deemed appropriate, although the ability to influence change is often limited.
REGuLATORY MATTERS
Both Trencor and Textainer, as public listed companies, are subject to rules and regulations established and monitored by the regulatory bodies in the jurisdictions in which they are registered, listed and/or operate. Both companies are in compliance with these rules and regulations.
PROPRIETARY INFORMATION TECHNOLOGY
Textainer has developed iT systems that allow for the monitoring of container status offering its customers a high level of service. The systems include internet based updates regarding container availability and booking status.
ENVIRONMENT
Textainer is subject to federal, state, local and foreign laws and regulations relating to the protection of the environment, including those governing the discharge of pollutants to air and water, the management of hazardous substances and wastes and the cleanup of contaminated sites.
in addition to environmental regulations affecting container movement, shipping, movement and spillage, environmental regulations also impact container production and operation, including regulations on the use of chemical refrigerants due to their ozone depleting and global warming effects.
Trencor Limited Integrated Annual Report 2015
23
containers are made essentially of steel and timber and are re-usable for 10 to 13 years per container. This contrasts with break-bulk where packaging material is typically only used once resulting in much more depletion of natural resources such as timber, for crates and cardboard, and other packaging material. Furthermore, break-bulk results in the damage and deterioration of the environment because of the indiscriminate discarding of waste and packaging material. Huge quantities of world trade are involved and so the benefit to the environment and the preservation of natural resources resulting from the use of containers is immense.
The floors of dry containers are plywood made from timber that may include tropical hardwoods. due to concerns regarding de-forestation and climate change, many countries have implemented severe restrictions on the cutting and exporting of this wood. accordingly, container manufacturers have switched a significant portion of production to alternatives such as birch, bamboo and other farm grown wood. alternative designs are also evaluated to limit the amount of plywood required and the possible use of synthetic material.
it is accepted that the use of shipping containers has promoted world trade because of the efficiency and effective logistics of their deployment as opposed to break-bulk. With Textainer being one of the world’s largest lessors of shipping containers, we believe that we make a major contribution to the growth in world trade.
The factors mentioned above not only benefit the world community but because of their extensive benefits to the operations’ customers and their customers, in turn, all the way down the supply chain and the logistic framework, the company and the interest of its shareholders are strengthened and sustainability enhanced.
COMMuNITY
during the year under review, monetary assistance was granted to the community chest Western cape, an organisation which provides assistance to various community and welfare organisations, which the group has supported since 1974. Financial support was also provided to The red cross War memorial children’s Hospital, a highly specialised children’s healthcare facility in the cape well known for its excellence in child care and treatment on the african continent. other organisations supported include St. Luke’s Hospice, national Sea rescue institute, afrika Tikkun, Foodbank, WWF South africa, make a difference Foundation, Business against crime, Spca, BirdLife South africa, cape philharmonic orchestra, Sa institute for race relations, Business Womens’s association of South africa, Kidz positive, masicorp, Volunteer Wildfire Services and the abagold development Trust. in addition, donations were made to the university of the Western cape, Stellenbosch university, university of cape Town and the cape peninsula university of Technology.
EXTERNAL ASSuRANCE
no external assurance has been sought on any of the elements of this report. The board confirms, to the best of its knowledge and belief, the accuracy and integrity of the information provided in this report. The company anticipates providing independent assurance of the material aspects of this report in the future.
Trencor Limited Integrated Annual Report 2015
24
DIRECTORS’ RESPONSIBILITY STATEMENT
The directors are responsible for the preparation and fair presentation of the consolidated and separate annual financial statements of Trencor Limited, which comprise the statements of financial position at 31 december 2015, and the statements of comprehensive income, changes in equity and cash flows for the year then ended, and the notes to the financial statements which include a summary of significant accounting policies and other explanatory notes, in accordance with international Financial reporting Standards and the requirements of the companies act of South africa, as well as the directors’ report.
The directors are also responsible for such internal controls as the directors determine are necessary to enable the preparation of financial statements that are free from material misstatement, whether due to fraud or error, and for maintaining adequate accounting records and an effective system of risk management as well as the preparation of the supplementary schedules included in these annual financial statements.
The directors have made an assessment of the ability of the company and its subsidiaries to continue as going concerns and have no reason to believe that these businesses will not be going concerns in the year ahead.
The auditor is responsible for reporting on whether the consolidated and separate financial statements are fairly presented in accordance with the applicable financial reporting framework.
PREPARATION OF ANNuAL FINANCIAL STATEMENTS
These annual financial statements have been prepared by management under the supervision of the financial director, mr ra Sieni ca(Sa), and have been audited in accordance with the requirements of the companies act of South africa.
APPROVAL OF THE CONSOLIDATED AND SEPARATE ANNuAL FINANCIAL STATEMENTS
The consolidated and separate annual financial statements of Trencor Limited, which have been approved by the board of directors, are attached:
page 25 directors’ report
27 audit committee report
29 Statements of financial position
30 Statements of comprehensive income
31 Statements of changes in equity
32 Statements of cash flows
33 notes to the financial statements
Signed on behalf of the board
ni Jowell e oblowitz chairman director and chairman of
the audit committee
cape Town20 June 2016
Annual Financial StatementsTrencor Limited and Subsidiaries
Declaration by the Company Secretaryit is hereby certified that for the year ended 31 december 2015, the company has lodged with the companies and intellectual property commission all returns as are required by a public company in terms of the companies act of South africa and that such returns are true, correct and up to date.
Trencor Services proprietary LimitedSecretaries
per gW norvalcompany Secretary
cape Town20 June 2016
Trencor Limited Integrated Annual Report 2015
25
Directors’ Report
GENERAL REVIEW
The nature of the company’s interests is described on page 3. The financial results are reflected in the financial statements on pages 29 to 76.
The (loss)/profit attributable to equity holders of the company from the various classes of businesses was as follows:
restated
2015 2014Rm rm
container operations
container finance 62 9
Textainer/Tac (341) 934
exchange translation gains 134 52
net long-term receivable adjustment 11 (7)
interest and other corporate items (12) (26)
(146) 962
DIRECTORS AND SECRETARY
The names of the directors appear on page 2 and that of the secretary on page 88.
as announced on 25 February 2016, at the forthcoming annual general and with effect therefrom:
• mr ni Jowell will retire by rotation, but will not make himself available for re-election and, accordingly, will retire as chairman and executive director;
• mr c Jowell will retire as an executive director; and
• mr dm nurek, currently lead independent non-executive director, will be appointed as independent non-executive chairman in accordance with the board’s succession plans.
With effect from 1 march 2016, mr Je mcQueen (previously financial director) was appointed as chief executive officer and mr ra Sieni ca(Sa) (previously financial manager) was appointed as financial director in the place of mr Je mcQueen. mr Sieni was also appointed to the executive committee.
in terms of the memorandum of incorporation messrs ni Jowell, e oblowitz and rJa Sparks retire by rotation at the forthcoming annual general meeting and mr ra Sieni, who was appointed as a director effective 1 march 2016, also retires. These retiring directors, save for mr ni Jowell, are eligible and offer themselves for re-election.
Brief résumés of the directors are presented on page 78.
DIRECTORS’ INTERESTS
The aggregate of the direct and indirect beneficial interests of the directors in the issued shares of the company at 31 december 2015 was 6,4% (2014: 6,4%).
The direct and indirect beneficial interests of each director who held in excess of 1% of the issued shares at 31 december 2015 and 2014 were as follows:
2015 2014
% %
c Jowell 3,1 3,1
ni Jowell 3,2 3,2
Between 19 march and 9 april 2015, mr ni Jowell acquired an additional 86 200 shares for an aggregate consideration of r5 million, thereby increasing his indirect beneficial interest by 0,05%.
There have been no changes in these interests between the financial year-end and the date of this report.
CASH DIVIDENDS
payment number
record date
payment date
cents per
share (gross)
Total rm
2014
interim 98 12/09/14 15/09/14 72 128
Final 99 27/03/15 30/03/15 195 345
2015
interim 100 11/09/15 14/09/15 80 142
Final 101 27/05/16 30/05/16 220 389
REPORTING RESuLTS OF TEXTAINER AND TAC uNDER IFRS
The results of Textainer and Tac, reporting under uS gaap, are converted to iFrS for inclusion in the results of Trencor, which is required to report under iFrS. Historically, limited adjustments were necessary in so converting from uS gaap to iFrS. However, in the year to 31 december 2015 a decline in market conditions meant that differences in accounting treatment between uS gaap and iFrS, in the areas of impairment testing and a revision of the residual values of the container fleets, caused significant differences in financial results reported under the respective accounting conventions. The complex and time-consuming calculations required to make the necessary iFrS adjustments, at each reporting period, for the large owned container fleets resulted in a delay in the issuance of these results and may continue to do so in the future.
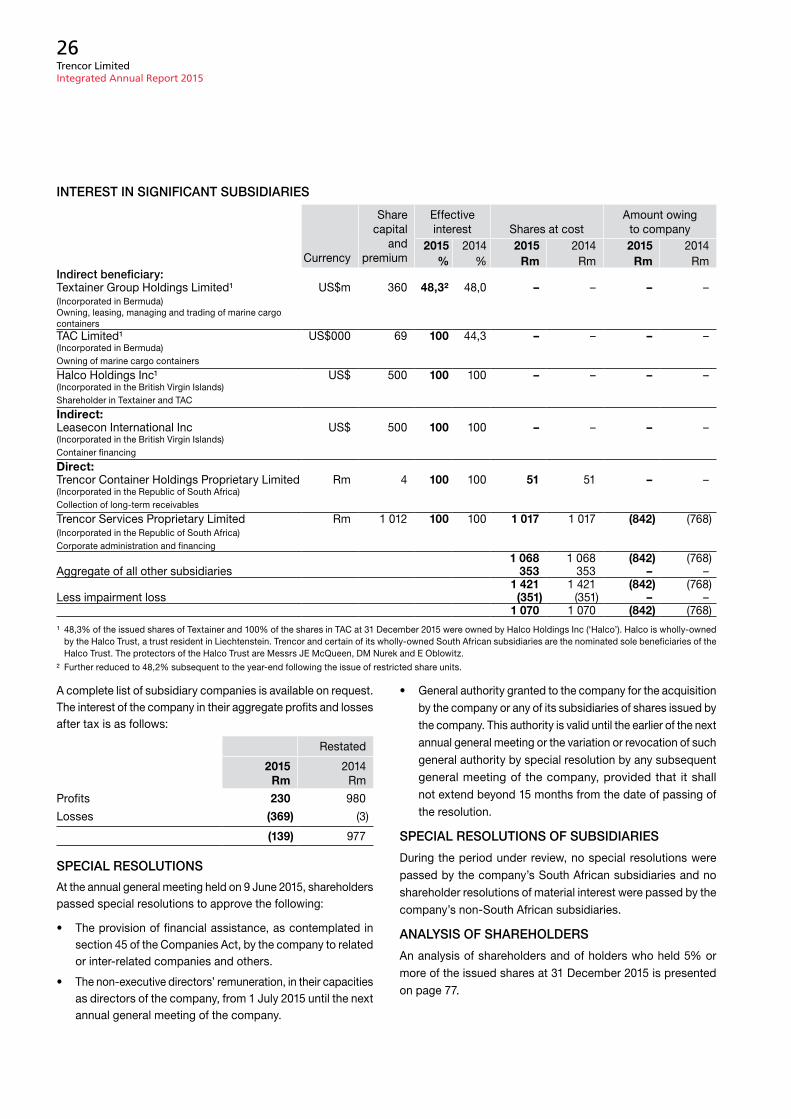
Trencor Limited Integrated Annual Report 2015
26
INTEREST IN SIGNIFICANT SuBSIDIARIES
currency
Share capital
and premium
effective interest Shares at cost
amount owing to company
2015 2014 2015 2014 2015 2014% % Rm rm Rm rm
Indirect beneficiary:Textainer group Holdings Limited¹ uS$m 360 48,3² 48,0 – – – –(incorporated in Bermuda)owning, leasing, managing and trading of marine cargo containersTac Limited¹ uS$000 69 100 44,3 – – – –(incorporated in Bermuda)owning of marine cargo containers
Halco Holdings inc¹ uS$ 500 100 100 – – – –(incorporated in the British Virgin islands)Shareholder in Textainer and Tac
Indirect:Leasecon international inc uS$ 500 100 100 – – – –(incorporated in the British Virgin islands)container financing
Direct:Trencor container Holdings proprietary Limited rm 4 100 100 51 51 – –(incorporated in the republic of South africa)collection of long-term receivables
Trencor Services proprietary Limited rm 1 012 100 100 1 017 1 017 (842) (768)(incorporated in the republic of South africa)corporate administration and financing
1 068 1 068 (842) (768)aggregate of all other subsidiaries 353 353 – –
1 421 1 421 (842) (768)Less impairment loss (351) (351) – –
1 070 1 070 (842) (768)
¹ 48,3% of the issued shares of Textainer and 100% of the shares in Tac at 31 december 2015 were owned by Halco Holdings inc (‘Halco’). Halco is wholly-owned by the Halco Trust, a trust resident in Liechtenstein. Trencor and certain of its wholly-owned South african subsidiaries are the nominated sole beneficiaries of the Halco Trust. The protectors of the Halco Trust are messrs Je mcQueen, dm nurek and e oblowitz.
² Further reduced to 48,2% subsequent to the year-end following the issue of restricted share units.
a complete list of subsidiary companies is available on request. The interest of the company in their aggregate profits and losses after tax is as follows:
restated
2015 2014Rm rm
profits 230 980
Losses (369) (3)
(139) 977
SPECIAL RESOLuTIONS
at the annual general meeting held on 9 June 2015, shareholders passed special resolutions to approve the following:
• The provision of financial assistance, as contemplated in section 45 of the companies act, by the company to related or inter-related companies and others.
• The non-executive directors’ remuneration, in their capacities as directors of the company, from 1 July 2015 until the next annual general meeting of the company.
• general authority granted to the company for the acquisition by the company or any of its subsidiaries of shares issued by the company. This authority is valid until the earlier of the next annual general meeting or the variation or revocation of such general authority by special resolution by any subsequent general meeting of the company, provided that it shall not extend beyond 15 months from the date of passing of the resolution.
SPECIAL RESOLuTIONS OF SuBSIDIARIES
during the period under review, no special resolutions were passed by the company’s South african subsidiaries and no shareholder resolutions of material interest were passed by the company’s non-South african subsidiaries.
ANALYSIS OF SHAREHOLDERS
an analysis of shareholders and of holders who held 5% or more of the issued shares at 31 december 2015 is presented on page 77.
Trencor Limited Integrated Annual Report 2015
27
Membership
The audit committee, comprising three independent non-executive directors, was appointed by shareholders at the previous annual general meeting and the board of directors appointed mr e oblowitz as chairman of the committee for the 2015 financial year.
Shareholders will be requested to vote on and approve the appointment of the members of the audit committee for the 2016 financial year at the forthcoming annual general meeting.
The committee’s operation is guided by its detailed terms of reference that are informed by the companies act of South africa and the King report and approved by the board.
The committee met with the external auditors on two occasions. in addition, in my capacity as chairman, i met from time to time with the auditors with and without management being present.
Purpose
The primary purpose of the committee is:
• to assist the board in discharging its duties relating to the safeguarding of assets, the operation of adequate systems, control and reporting processes, and the preparation of accurate reporting and financial statements in compliance with the applicable legal requirements and accounting standards;
• to meet with the external auditors at least on an annual basis;
• to review the company and group annual financial statements and reports as well as reports from subsidiary companies; and
• to conduct reviews of the committee’s work and terms of reference and make recommendations to the board to ensure that the committee operates at maximum effectiveness.
Execution of functions
The audit committee has executed its duties and responsibilities during the financial year in accordance with its terms of reference as they relate to the group’s accounting, internal control and financial reporting practices.
during the year under review:
• in respect of the external auditor and the external audit, the committee amongst other matters:
– nominated Kpmg inc to the shareholders for appointment as external auditor for the financial year ended 31 december 2015, and ensured that the appointment complied with all applicable legal and regulatory requirements for the appointment of an auditor. The committee confirms that the auditor and the designated auditor are accredited by the JSe;
– approved the external audit engagement letter, the audit plan and the budgeted audit fees payable to the external auditor;
– reviewed the audit, evaluated the effectiveness of the auditor and its independence and evaluated the external auditor’s internal quality control procedures;
– obtained an annual written statement from the auditor confirming that its independence was not impaired; and
– determined the nature and extent of all non-audit services provided by the external auditor and pre-approved all non-audit services undertaken.
• in respect of the financial statements, the committee amongst other matters:
– confirmed the going concern status as the basis of preparation of the interim and annual financial statements;
– examined and reviewed the interim and annual financial statements, as well as all financial information disclosed to the public, prior to submission and approval by the board;
– ensured that the interim and annual financial statements fairly present the financial position of the company and of the group as at the end of the financial year and the results of operations and cash flows for the financial year and considered the basis on which the company and the group were determined to be going concerns;
– considered accounting treatments, significant unusual transactions and accounting judgements;
– considered the appropriateness of the accounting policies adopted and changes thereto;
– reviewed the external auditor’s audit report;
– considered any problems identified and reviewed any significant legal and tax matters that could have a material impact on the financial statements; and
– met separately with management and the external auditor.
• in respect of internal control, the committee amongst other matters:
– received assurance that proper and adequate accounting records were maintained and that the systems safeguarded the assets against unauthorised use or disposal thereof; and
– based on the above, formed the opinion that there were no material breakdowns in internal control, including financial controls, business risk management and maintaining effective material control systems.
Independence of external auditor
The audit committee is satisfied that Kpmg inc is independent of the group.
Annual financial statements
Having achieved its objectives, the committee recommended the audited annual financial statements for the year ended 31 december 2015 for approval by the board. The board subsequently approved the financial statements, which will be open for discussion at the forthcoming annual general meeting.
Audit Committee Report
Trencor Limited Integrated Annual Report 2015
28
REPORT ON THE FINANCIAL STATEMENTS
We have audited the consolidated and separate financial statements of Trencor Limited, which comprise the statements of financial position at 31 december 2015, and the statements of comprehensive income, changes in equity and cash flows for the year then ended, and the notes to the financial statements which include a summary of significant accounting policies and other explanatory notes, as set out on pages 29 to 76.
DIRECTORS’ RESPONSIBILITY FOR THE FINANCIAL STATEMENTS
The company’s directors are responsible for the preparation and fair presentation of these financial statements in accordance with international Financial reporting Standards and the requirements of the companies act of South africa, and for such internal control as the directors determine is necessary to enable the preparation of financial statements that are free from material misstatement, whether due to fraud or error.
AuDITOR’S RESPONSIBILITY
our responsibility is to express an opinion on these financial statements based on our audit. We conducted our audit in accordance with international Standards on auditing. Those standards require that we comply with ethical requirements and plan and perform the audit to obtain reasonable assurance about whether the financial statements are free from material misstatement.
an audit involves performing procedures to obtain audit evidence about the amounts and disclosures in the financial statements. The procedures selected depend on the auditor’s judgement, including the assessment of the risks of material misstatement of the financial statements, whether due to fraud or error. in making those risk assessments, the auditor considers internal control relevant to the entity’s preparation and fair presentation of the financial statements in order to design audit procedures that are appropriate in the circumstances, but not for the purpose of expressing an opinion on the effectiveness of the entity’s internal control. an audit also includes evaluating the appropriateness of accounting policies used and the reasonableness of accounting estimates made by management, as well as evaluating the overall presentation of the financial statements.
We believe that the audit evidence we have obtained is sufficient and appropriate to provide a basis for our audit opinion.
OPINION
in our opinion, these financial statements present fairly, in all material respects, the consolidated and separate financial position of Trencor Limited at 31 december 2015 and its consolidated and separate financial performance and consolidated and separate cash flows for the year then ended in accordance with international Financial reporting Standards and the requirements of the companies act of South africa.
OTHER REPORTS REquIRED BY THE COMPANIES ACT
as part of our audit of the financial statements for the year ended 31 december 2015, we have read the directors’ report, the audit committee report and the declaration by the company Secretary for the purpose of identifying whether there are material inconsistencies between these reports and the audited financial statements. These reports are the responsibility of the respective preparers. Based on reading these reports we have not identified material inconsistencies between these reports and the audited financial statements. However, we have not audited these reports and accordingly do not express an opinion on these reports.
REPORT ON OTHER LEGAL AND REGuLATORY REquIREMENTS
in terms of the independent regulatory Board for auditors’ rule published in government gazette number 39475 dated 4 december 2015, we report that Kpmg inc has been the auditor of Trencor Limited for 15 years.
Kpmg incregistered auditor
per gm pickering
chartered accountant (Sa) mSc House
registered auditor 1 mediterranean Street
director Foreshore
20 June 2016 cape Town 8001
Independent Auditor’s Reportto the shareholders of Trencor Limited
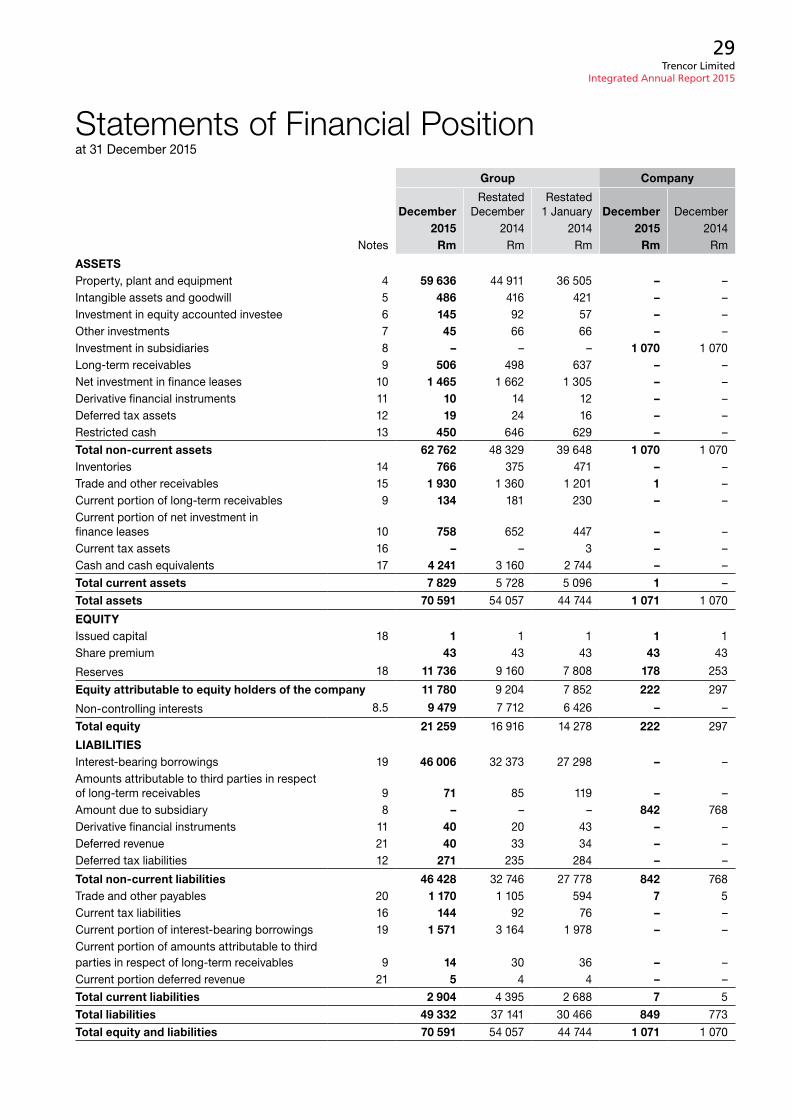
Trencor Limited Integrated Annual Report 2015
29
Statements of Financial Positionat 31 december 2015
Group Company
December
restated december
restated 1 January December december
2015 2014 2014 2015 2014notes Rm rm rm Rm rm
ASSETSproperty, plant and equipment 4 59 636 44 911 36 505 – –intangible assets and goodwill 5 486 416 421 – –investment in equity accounted investee 6 145 92 57 – –other investments 7 45 66 66 – –investment in subsidiaries 8 – – – 1 070 1 070Long-term receivables 9 506 498 637 – –net investment in finance leases 10 1 465 1 662 1 305 – –derivative financial instruments 11 10 14 12 – –deferred tax assets 12 19 24 16 – –restricted cash 13 450 646 629 – –
Total non-current assets 62 762 48 329 39 648 1 070 1 070inventories 14 766 375 471 – –Trade and other receivables 15 1 930 1 360 1 201 1 –current portion of long-term receivables 9 134 181 230 – –current portion of net investment in finance leases 10 758 652 447 – –current tax assets 16 – – 3 – –cash and cash equivalents 17 4 241 3 160 2 744 – –
Total current assets 7 829 5 728 5 096 1 –
Total assets 70 591 54 057 44 744 1 071 1 070
EqUITyissued capital 18 1 1 1 1 1Share premium 43 43 43 43 43
reserves 18 11 736 9 160 7 808 178 253
Equity attributable to equity holders of the company 11 780 9 204 7 852 222 297
non-controlling interests 8.5 9 479 7 712 6 426 – –
Total equity 21 259 16 916 14 278 222 297
LIABILITIESinterest-bearing borrowings 19 46 006 32 373 27 298 – –amounts attributable to third parties in respect of long-term receivables 9 71 85 119 – –amount due to subsidiary 8 – – – 842 768derivative financial instruments 11 40 20 43 – –deferred revenue 21 40 33 34 – –deferred tax liabilities 12 271 235 284 – –
Total non-current liabilities 46 428 32 746 27 778 842 768Trade and other payables 20 1 170 1 105 594 7 5current tax liabilities 16 144 92 76 – –current portion of interest-bearing borrowings 19 1 571 3 164 1 978 – –current portion of amounts attributable to third parties in respect of long-term receivables 9 14 30 36 – –current portion deferred revenue 21 5 4 4 – –
Total current liabilities 2 904 4 395 2 688 7 5
Total liabilities 49 332 37 141 30 466 849 773
Total equity and liabilities 70 591 54 057 44 744 1 071 1 070
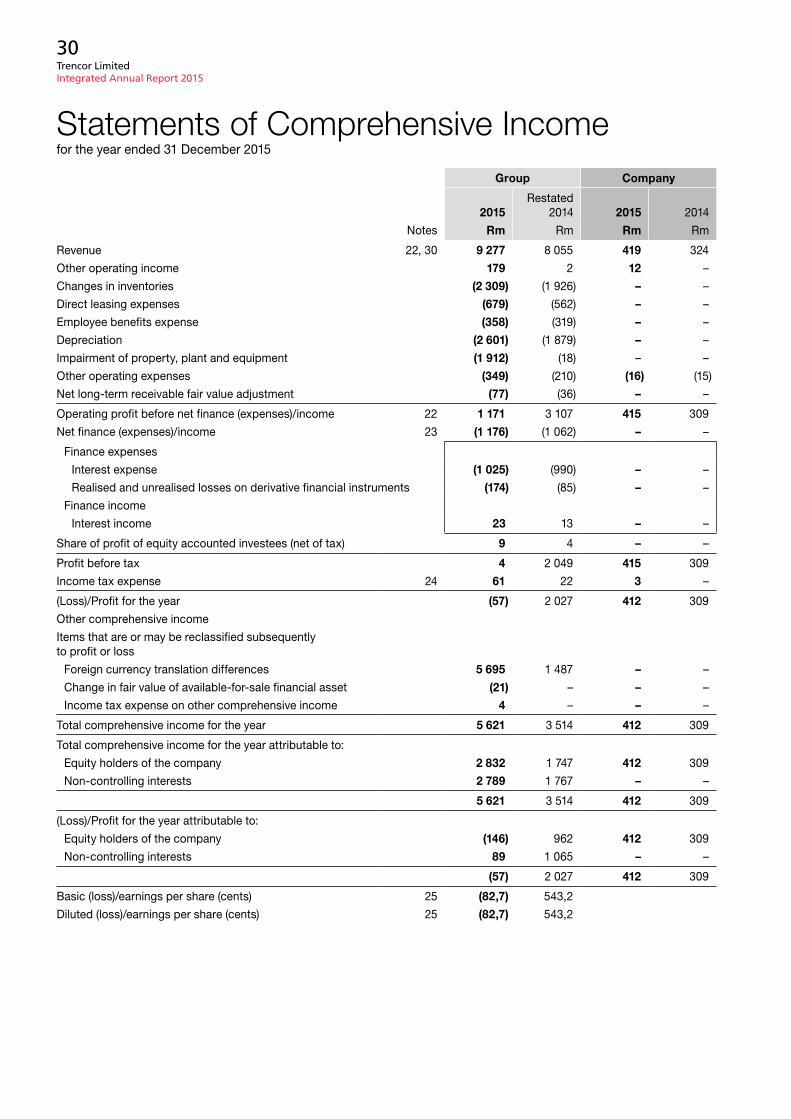
Trencor Limited Integrated Annual Report 2015
30
Statements of Comprehensive Incomefor the year ended 31 december 2015
Group Company
2015restated
2014 2015 2014
notes Rm rm Rm rm
revenue 22, 30 9 277 8 055 419 324
other operating income 179 2 12 –
changes in inventories (2 309) (1 926) – –
direct leasing expenses (679) (562) – –
employee benefits expense (358) (319) – –
depreciation (2 601) (1 879) – –
impairment of property, plant and equipment (1 912) (18) – –
other operating expenses (349) (210) (16) (15)
net long-term receivable fair value adjustment (77) (36) – –
operating profit before net finance (expenses)/income 22 1 171 3 107 415 309
net finance (expenses)/income 23 (1 176) (1 062) – –
Finance expenses
interest expense (1 025) (990) – –
realised and unrealised losses on derivative financial instruments (174) (85) – –
Finance income
interest income 23 13 – –
Share of profit of equity accounted investees (net of tax) 9 4 – –
profit before tax 4 2 049 415 309
income tax expense 24 61 22 3 –
(Loss)/profit for the year (57) 2 027 412 309
other comprehensive income
items that are or may be reclassified subsequently to profit or loss
Foreign currency translation differences 5 695 1 487 – –
change in fair value of available-for-sale financial asset (21) – – –
income tax expense on other comprehensive income 4 – – –
Total comprehensive income for the year 5 621 3 514 412 309
Total comprehensive income for the year attributable to:
equity holders of the company 2 832 1 747 412 309
non-controlling interests 2 789 1 767 – –
5 621 3 514 412 309
(Loss)/profit for the year attributable to:
equity holders of the company (146) 962 412 309
non-controlling interests 89 1 065 – –
(57) 2 027 412 309
Basic (loss)/earnings per share (cents) 25 (82,7) 543,2
diluted (loss)/earnings per share (cents) 25 (82,7) 543,2
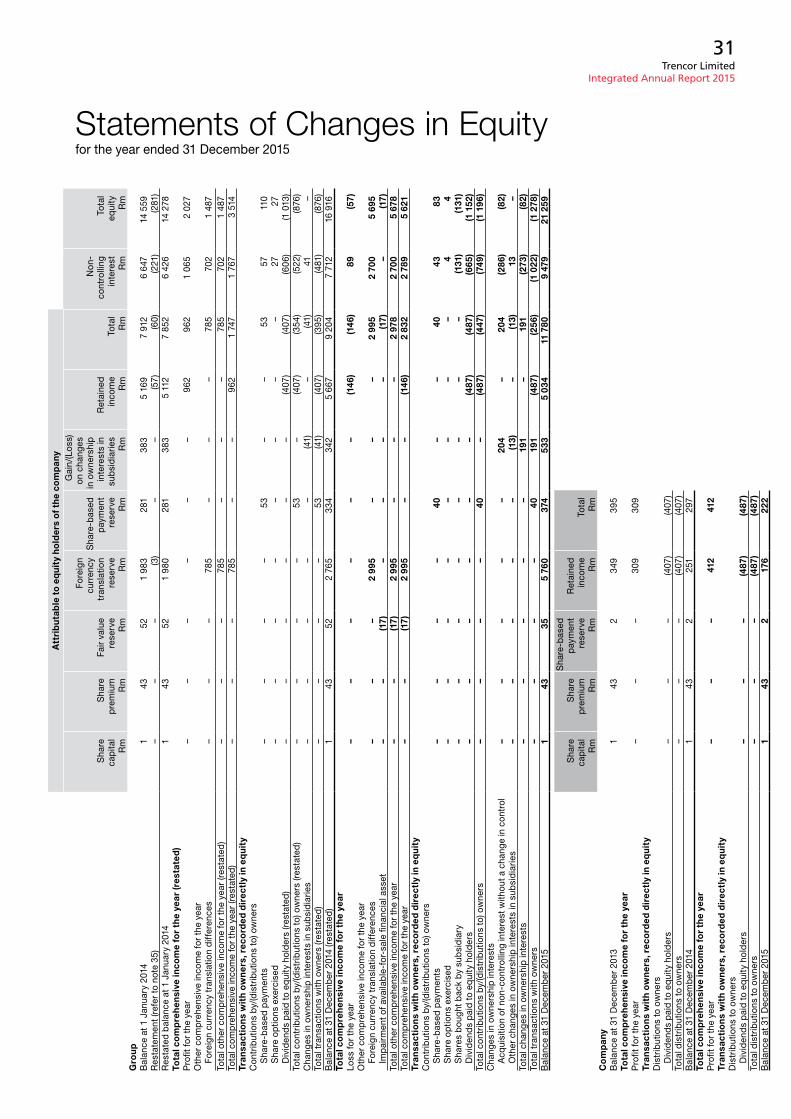
Trencor Limited Integrated Annual Report 2015
31
Statements of Changes in Equityfor the year ended 31 december 2015
Att
rib
utab
le t
o eq
uity
ho
lder
s o
f the
co
mp
any
Sha
reca
pita
lS
hare
pre
miu
mFa
ir va
lue
rese
rve
Fore
ign
curr
ency
tran
slat
ion
rese
rve
Sha
re-b
ased
paym
ent
rese
rve
gai
n/(L
oss)
on c
hang
es
in o
wne
rshi
p in
tere
sts
in
subs
idia
ries
ret
aine
din
com
eTo
tal
non
-co
ntro
lling
inte
rest
Tota
leq
uity
rm
rm
rm
rm
rm
rm
rm
rm
rm
rm
Gro
upB
alan
ce a
t 1 J
anua
ry 2
014
143
521
983
281
383
5 16
97
912
6 64
714
559
res
tate
men
t (re
fer t
o no
te 3
5)–
––
(3)
––
(57)
(60)
(221
)(2
81)
res
tate
d ba
lanc
e at
1 J
anua
ry 2
014
143
521
980
281
383
5 11
27
852
6 42
614
278
Tota
l co
mp
rehe
nsiv
e in
com
e fo
r th
e ye
ar (r
esta
ted
)p
rofit
for t
he y
ear
––
––
––
962
962
1 06
52
027
oth
er c
omp
rehe
nsiv
e in
com
e fo
r the
yea
rFo
reig
n cu
rren
cy tr
ansl
atio
n di
ffer
ence
s–
––
785
––
–78
570
21
487
Tota
l oth
er c
omp
rehe
nsiv
e in
com
e fo
r the
yea
r (re
stat
ed)
––
–78
5–
––
785
702
1 48
7To
tal c
omp
rehe
nsiv
e in
com
e fo
r the
yea
r (re
stat
ed)
––
–78
5–
–96
21
747
1 76
73
514
Tran
sact
ions
wit
h ow
ners
, rec
ord
ed d
irec
tly
in e
qui
tyc
ontr
ibut
ions
by/
(dis
trib
utio
ns to
) ow
ners
Sha
re-b
ased
pay
men
ts–
––
–53
––
5357
110
Sha
re o
ptio
ns e
xerc
ised
––
––
––
––
2727
div
iden
ds p
aid
to e
quity
hol
ders
(res
tate
d)
––
––
––
(407
)(4
07)
(606
)(1
013
)To
tal c
ontr
ibut
ions
by/
(dis
trib
utio
ns to
) ow
ners
(res
tate
d)
––
––
53–
(407
)(3
54)
(522
)(8
76)
cha
nges
in o
wne
rshi
p in
tere
sts
in s
ubsi
diar
ies
––
––
–(4
1)–
(41)
41–
Tota
l tra
nsac
tions
with
ow
ners
(res
tate
d)
––
––
53(4
1)(4
07)
(395
)(4
81)
(876
)B
alan
ce a
t 31
dec
emb
er 2
014
(rest
ated
)1
4352
2 76
533
434
25
667
9 20
47
712
16 9
16To
tal c
om
pre
hens
ive
inco
me
for
the
year
Loss
for t
he y
ear
––
––
––
(146
)(1
46)
89(5
7)o
ther
com
pre
hens
ive
inco
me
for t
he y
ear
Fore
ign
curr
ency
tran
slat
ion
diff
eren
ces
––
–2
995
––
–2
995
2 70
05
695
impa
irmen
t of a
vaila
ble-
for-
sale
fina
ncia
l ass
et–
–(1
7)–
––
–(1
7)–
(17)
Tota
l oth
er c
omp
rehe
nsiv
e in
com
e fo
r the
yea
r–
–(1
7)2
995
––
–2
978
2 70
05
678
Tota
l com
pre
hens
ive
inco
me
for t
he y
ear
––
(17)
2 99
5–
–(1
46)
2 83
22
789
5 62
1Tr
ansa
ctio
ns w
ith
owne
rs, r
eco
rded
dir
ectl
y in
eq
uity
con
trib
utio
ns b
y/(d
istr
ibut
ions
to) o
wne
rsS
hare
-bas
ed p
aym
ents
––
––
40–
–40
4383
Sha
re o
ptio
ns e
xerc
ised
––
––
––
––
44
Sha
res
bou
ght b
ack
by s
ubsi
diar
y–
––
––
––
–(1
31)
(131
)d
ivid
ends
pai
d to
equ
ity h
olde
rs–
––
––
–(4
87)
(487
)(6
65)
(1 1
52)
Tota
l con
trib
utio
ns b
y/(d
istr
ibut
ions
to) o
wne
rs–
––
–40
–(4
87)
(447
)(7
49)
(1 1
96)
cha
nges
in o
wne
rshi
p in
tere
sts
acq
uisi
tion
of n
on-c
ontr
ollin
g in
tere
st w
ithou
t a c
hang
e in
con
trol
––
––
–20
4–
204
(286
)(8
2)o
ther
cha
nges
in o
wne
rshi
p in
tere
sts
in s
ubsi
diar
ies
––
––
–(1
3)–
(13)
13–
Tota
l cha
nges
in o
wne
rshi
p in
tere
sts
––
––
–19
1–
191
(273
)(8
2)To
tal t
rans
actio
ns w
ith o
wne
rs–
––
–40
191
(487
)(2
56)
(1 0
22)
(1 2
78)
Bal
ance
at 3
1 d
ecem
ber
201
51
4335
5 76
037
453
35
034
11 7
809
479
21 2
59
Sha
reca
pita
lS
hare
pre
miu
m
Sha
re-b
ased
paym
ent
rese
rve
ret
aine
din
com
eTo
tal
rm
rm
rm
rm
rm
Co
mp
any
Bal
ance
at 3
1 d
ecem
ber
201
31
432
349
395
Tota
l co
mp
rehe
nsiv
e in
com
e fo
r th
e ye
arp
rofit
for t
he y
ear
––
–30
930
9Tr
ansa
ctio
ns w
ith
owne
rs, r
eco
rded
dir
ectl
y in
eq
uity
dis
trib
utio
ns to
ow
ners
div
iden
ds p
aid
to e
quity
hol
ders
––
–(4
07)
(407
)To
tal d
istr
ibut
ions
to o
wne
rs–
––
(407
)(4
07)
Bal
ance
at 3
1 d
ecem
ber
201
41
432
251
297
Tota
l co
mp
rehe
nsiv
e in
com
e fo
r th
e ye
arp
rofit
for t
he y
ear
––
–41
241
2Tr
ansa
ctio
ns w
ith
owne
rs, r
eco
rded
dir
ectl
y in
eq
uity
dis
trib
utio
ns to
ow
ners
div
iden
ds p
aid
to e
quity
hol
ders
––
–(4
87)
(487
)To
tal d
istr
ibut
ions
to o
wne
rs–
––
(487
)(4
87)
Bal
ance
at 3
1 d
ecem
ber
201
51
432
176
222
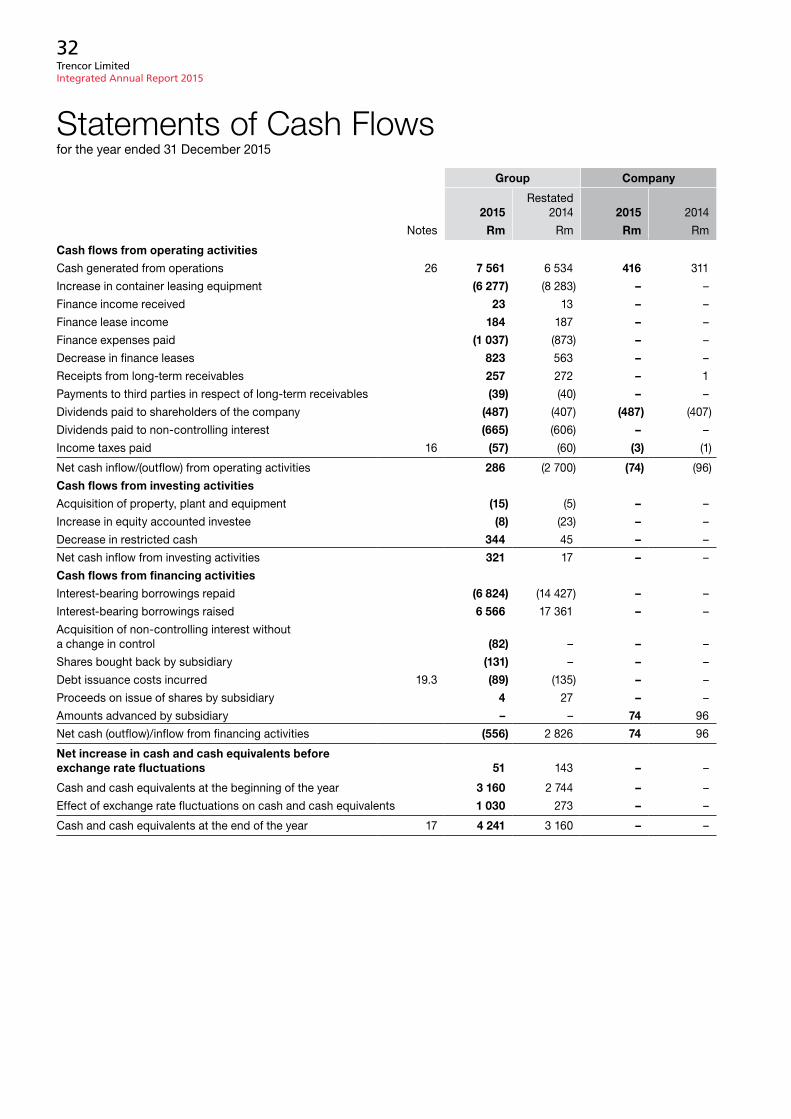
Trencor Limited Integrated Annual Report 2015
32
Statements of Cash Flowsfor the year ended 31 december 2015
Group Company
2015restated
2014 2015 2014
notes Rm rm Rm rm
Cash flows from operating activities
cash generated from operations 26 7 561 6 534 416 311
increase in container leasing equipment (6 277) (8 283) – –
Finance income received 23 13 – –
Finance lease income 184 187 – –
Finance expenses paid (1 037) (873) – –
decrease in finance leases 823 563 – –
receipts from long-term receivables 257 272 – 1
payments to third parties in respect of long-term receivables (39) (40) – –
dividends paid to shareholders of the company (487) (407) (487) (407)
dividends paid to non-controlling interest (665) (606) – –
income taxes paid 16 (57) (60) (3) (1)
net cash inflow/(outflow) from operating activities 286 (2 700) (74) (96)
Cash flows from investing activities
acquisition of property, plant and equipment (15) (5) – –
increase in equity accounted investee (8) (23) – –
decrease in restricted cash 344 45 – –
net cash inflow from investing activities 321 17 – –
Cash flows from financing activities
interest-bearing borrowings repaid (6 824) (14 427) – –
interest-bearing borrowings raised 6 566 17 361 – –
acquisition of non-controlling interest without a change in control (82) – – –
Shares bought back by subsidiary (131) – – –
debt issuance costs incurred 19.3 (89) (135) – –
proceeds on issue of shares by subsidiary 4 27 – –
amounts advanced by subsidiary – – 74 96
net cash (outflow)/inflow from financing activities (556) 2 826 74 96
Net increase in cash and cash equivalents before exchange rate fluctuations 51 143 – –
cash and cash equivalents at the beginning of the year 3 160 2 744 – –
effect of exchange rate fluctuations on cash and cash equivalents 1 030 273 – –
cash and cash equivalents at the end of the year 17 4 241 3 160 – –
Trencor Limited Integrated Annual Report 2015
33
1. Reporting entityTrencor Limited (the ‘company’) is a company incorporated in the republic of South africa. The address of the company’s registered office is 13th Floor, The Towers South, Heerengracht, cape Town, 8001. The consolidated financial statements of the company as at and for the year ended 31 december 2015 comprise the company and its subsidiaries, as defined by iFrS 10 Consolidated Financial Statements (‘iFrS 10’), together referred to as the ‘group’ and individually as ‘group entity/ies’, and the group’s interest in associates. The group interests are primarily owning, leasing, managing and trading marine cargo containers worldwide, and related financing activities.
2. Basis of preparation2.1 Statement of compliance
The consolidated and separate financial statements or otherwise referred to as ‘group’ and ‘company’ financial statements have been prepared in accordance with international Financial reporting Standards (‘iFrS’) and its interpretations adopted by the international accounting Standards Board, the South african institute of chartered accountants Financial reporting guides as issued by the accounting practices committee and Financial reporting pronouncements as issued by the Financial reporting Standards council and the requirements of the companies act of South africa. The financial statements were authorised for issue by the board of directors on 20 June 2016.
2.2 Basis of measurementThe consolidated and separate financial statements have been prepared on the historical cost basis except for the following:
• derivative financial instruments are measured at fair value;
• financial instruments at fair value through profit or loss are measured at fair value; and
• available-for-sale financial assets are measured at fair value.
2.3 Functional and presentation currencyThese consolidated and separate financial statements are presented in South african rand, which is the company’s functional currency. all financial information has been rounded to the nearest million.
2.4 use of estimates and judgementsThe preparation of financial statements in conformity with iFrS requires management to make judgements, estimates and assumptions that affect the application of accounting policies and reported amounts of assets, liabilities, income and expenses. actual results may differ from these estimates. estimates and underlying assumptions are reviewed on an ongoing basis. revisions to accounting estimates are recognised in the period in which the estimate is revised and any future periods affected.
information about significant areas of estimation uncertainty and critical judgements in applying accounting policies that have the most significant effect on the amounts recognised in the financial statements are described in note 34.
2.5 Adoption of new accounting standards The adoption of the amendments to annual improvements to iFrS 2010 – 2012 and iFrS 2011 – 2013 cycles has had no impact on current or comparative financial results.
3. Significant accounting policiesThe accounting policies set out below have been applied consistently to all periods presented in these consolidated and separate financial statements, and have been applied consistently by group entities.
3.1 Basis of consolidation3.1.1 Business combinations
Business combinations are accounted for using the acquisition method as at the acquisition date in accordance with iFrS 3 Business Combinations. The consideration transferred in the acquisition is generally measured at fair value, as are the identifiable net assets acquired. any goodwill that arises is tested annually for impairment. any gain on a bargain purchase is recognised in profit or loss immediately. Transaction costs are expensed as incurred, except if related to the issue of debt or equity securities.
3.1.2 Subsidiaries Subsidiaries are entities controlled by the group in accordance with iFrS 10. The financial statements of subsidiaries are included in the consolidated financial statements from the date that control commences until the date that control ceases.
in the case of the company, investments in subsidiaries are carried at cost, less accumulated impairment losses.
3.1.3 Changes in control changes in any group entity’s ownership interest in a subsidiary that do not result in loss of control are accounted for as equity transactions ie transactions with owners in their capacity as owners. accordingly, gains or losses which arise from acquisitions or disposals of non-controlling interests, calculated based on the carrying value of the assets and liabilities of the subsidiary, are recognised in equity (refer to note 18). When the relative ownership interests of the parent and non-controlling interest change, equity reserves are reallocated between the parent and the non-controlling interest to reflect the new ownership interests. Where there is a loss of control by the group over a subsidiary, the assets and liabilities and any related non-controlling interest and other components of equity of the subsidiary are derecognised. any resulting gain or loss is recognised in profit or loss. any interest retained in the former subsidiary is measured at fair value after control is lost.
Notes to the Financial Statementsfor the year ended 31 december 2015
Trencor Limited Integrated Annual Report 2015
34
3.1.4 Non-controlling interests an entity has a choice on a combination-by-combination basis to measure any non-controlling interest in the acquiree at either the proportionate share of the acquiree’s identifiable net assets or fair value. The former approach has been elected for all combinations to date.
3.1.5 Associates (equity accounted investees) associates are those entities in which the group has significant influence, but not control, over the financial and operating policies in accordance with iaS 28 Investment in Associates and Joint Ventures. investments in associates are accounted for using the equity method and are recognised initially at cost, which includes transaction costs. Subsequent to initial recognition the consolidated financial statements include the group’s share of profit or loss, other comprehensive income and equity movements of equity accounted investees, in accordance with accounting policies applied uniformly within the group, from the date that significant influence commences until the date that significant influence ceases. When the group’s share of losses exceeds its interest in an equity accounted investee, the carrying amount of that interest, including any long-term investments that form part thereof is reduced to nil and recognition of further losses is discontinued except to the extent that the group entity has an obligation or made payments on behalf of the investee. gains or losses arising on the dilution of investments in associates while maintaining equity accounting, are recognised in profit or loss and the net gain or loss attributable to the group is transferred to the appropriate reserve in equity (refer to note 18).
3.1.6 Transactions eliminated on consolidation intra-group balances and transactions, and any unrealised income and expenses arising from intragroup transactions, are eliminated in preparing the consolidated financial statements. unrealised gains arising from transactions with equity accounted investees are eliminated against the investment to the extent of the interest in the entity. unrealised losses are eliminated in the same way as unrealised gains, but only to the extent that there is no evidence of impairment.
3.2 Foreign currency3.2.1 Foreign currency transactions
Transactions in foreign currencies are translated to the respective functional currencies of group entities at exchange rates at the dates of the transactions.
monetary assets and liabilities denominated in foreign currencies are translated to the functional currency at the exchange rate at the reporting date. The foreign currency gain or loss on monetary items is the difference between amortised cost in the functional currency at the beginning of the period, adjusted for effective interest and payments during the period, and the amortised cost in foreign currency translated at the exchange rate at the end of the period.
non-monetary assets and liabilities denominated in foreign currencies that are measured at fair value are translated to the functional currency at the exchange rate at the date that the fair value was determined. non-monetary items in a foreign currency that are measured in terms of historical cost are translated using the exchange rate at the date of the transaction. Foreign currency differences arising on translation are recognised in profit or loss except for differences arising on the translation of available-for-sale equity instruments which are recognised in other comprehensive income.
3.2.2 Foreign operations The assets and liabilities of foreign operations, including goodwill and fair value adjustments arising on acquisition, are translated to Sa rand at exchange rates at the reporting date. The income and expenses of foreign operations are translated to Sa rand at rates at the dates of the transactions. Foreign currency differences are recognised in other comprehensive income, and presented in the foreign currency translation reserve in equity. However, if the operation is a non-wholly-owned subsidiary, then the relevant proportionate share of the translation difference is allocated to the non-controlling interests. When a foreign operation is disposed of, in part or in full, such that control or significant influence is lost, the relevant amount in the foreign currency translation reserve is reclassified to profit or loss as part of the gain or loss on disposal.
When only part of an interest is disposed in a subsidiary that includes a foreign operation while retaining control, as defined, the relevant proportion of the cumulative amount is attributed to non-controlling interests. When only part of an associate is disposed while retaining significant influence, the relevant proportion of the cumulative amount is reclassified to profit or loss.
3.3 Financial instruments3.3.1 Non-derivative financial instruments
non-derivative financial assets are classified into the following categories: available-for-sale financial assets, financial assets at fair value through profit or loss, and loans and receivables. non-derivative financial liabilities are classified into the following categories: financial liabilities at fair value through profit or loss and other financial liabilities.
non-derivative financial instruments are recognised initially at fair value plus, for instruments not at fair value through profit or loss, any directly attributable costs. Loans and receivables are recognised on the date that they are originated. all other financial instruments (including assets designated at fair value through profit or loss) are recognised initially on the trade date which is the date that a group entity becomes a party to the contractual provisions of the instrument. Subsequent to initial recognition non-derivative financial instruments are measured as described below.
3. Significant accounting policies (continued)
Trencor Limited Integrated Annual Report 2015
35
Financial assets are derecognised if a group entity’s contractual rights to the cash flows from the financial assets expire or if a group entity transfers the right to receive the contractual cash flows in a transaction in which substantially all risks and rewards of ownership of the financial asset are transferred, or it neither transfers nor retains substantially all of the risks and rewards of ownership and does not retain control over the asset transferred. any interest in the transferred financial assets that is created or retained by a group entity is recognised as a separate asset or liability. a group entity derecognises a financial liability when its contractual obligations are discharged, cancelled or expire.
Available-for-sale financial assets investments in equity securities are classified as available-for-sale financial assets, unless they meet the requirements of another iaS 39 financial instrument classification. Subsequent to initial recognition, they are measured at fair value and changes therein, other than impairment losses (refer to note 3.8), are recognised in other comprehensive income and presented within equity in the fair value reserve. When an investment is derecognised, the cumulative gain or loss in other comprehensive income is reclassified to profit or loss.
Assets at fair value through profit or loss an instrument is classified at fair value through profit or loss if it is held for trading or is designated as such upon initial recognition. Financial instruments are designated at fair value through profit or loss if a group entity manages such instruments and makes purchase and sale decisions based on their fair value in accordance with the group entity’s documented risk management or investment strategy. upon initial recognition, attributable transaction costs are recognised in profit or loss when incurred. Financial instruments at fair value through profit or loss are measured at fair value, and changes therein, including any interest or dividend income, are recognised in profit or loss.
Long-term receivables are designated at fair value through profit or loss. Sales under long-term credit agreements are discounted to their net present value at rates considered appropriate, having regard to their terms and the currency in which they are written. The deferred portion of income is recognised over the period of the agreements on a basis which produces a constant periodic rate of return. at the financial year-end, receivables denominated in foreign currencies are translated at rates of exchange ruling at the reporting date. any gains or losses arising from this translation are recognised in profit or loss.
Loans and receivables Loans and receivables are financial assets with fixed or determinable payments that are not quoted in an active market. Subsequent to initial recognition, loans and receivables are measured at amortised cost using the effective interest method, less any impairment
losses. Loans and receivables comprise trade and other receivables and cash and cash equivalents.
in the case of the company, the long-term receivable represents the participation in export partnerships and, subsequent to initial recognition, is measured at amortised cost less impairment losses. amortised cost is the company’s cost of the original participation plus its share of the gross profit less the share of the subsequent net amounts received as partner in the partnerships.
Cash and cash equivalents cash and cash equivalents comprise cash balances and call deposits. Bank overdrafts that are repayable on demand and form an integral part of cash management are included as a component of cash and cash equivalents for the purpose of the statement of cash flows. cash and cash equivalents are carried at amortised cost.
Non-derivative financial liabilities debt securities issued and subordinated liabilities are initially recognised on the date that they are originated. all other financial liabilities (including liabilities designated at fair value through profit or loss) are recognised initially on the trade date at which a group entity becomes a party to the contractual provisions of the instrument. debt issuance costs are capitalised and amortised over the term of the debt as required by application of the effective interest method.
Financial liabilities and other financial liabilities are recognised initially at fair value less any directly attributable transaction costs. Subsequent to initial recognition, these financial liabilities are measured at amortised cost using the effective interest method. other financial liabilities comprise borrowings and trade and other payables.
The amounts attributable to third parties in respect of long-term receivables are designated at fair value through profit or loss. To determine fair value, the amounts are discounted to their net present value at a rate considered appropriate, having regard to their term and their denominated currency. The deferred portion of expenditure is allocated over the period of the agreements on a basis which produces a constant periodic rate of return.
3.3.2 Derivative financial instrumentsderivative financial instruments are held to economically hedge foreign exchange and interest rate risk exposures arising from operational, financing and investing activities.
derivative financial instruments are recognised initially at fair value; attributable transaction costs are recognised in profit or loss when incurred. Subsequent to initial recognition derivatives are measured at fair value. Hedge accounting is not applied to such derivative financial instruments therefore the gain or loss on re-measurement to fair value is recognised in profit or loss.
Trencor Limited Integrated Annual Report 2015
36
3.3.3 OffsettingFinancial assets and liabilities are off-set and the net amount presented in the statement of financial position when a group entity has a legally enforceable right to set off the amounts and intends either to settle them on a net basis or to realise the asset and settle the liability simultaneously. income and expenses are presented on a net basis only when permitted by the accounting standards, or for gains and losses arising from a group of similar transactions.
3.3.4 Share capitalOrdinary shares ordinary shares are classified as equity. incremental costs directly attributable to the issue of ordinary shares and share options are recognised as a deduction from equity, net of any tax effects.
Dividends dividends (treated as distributions within equity) are recognised as a liability in the period in which they are declared.
3.4 Property, plant and equipment3.4.1 Recognition and measurement
items of property, plant and equipment, which includes improvements made to leasehold premises are measured at cost less accumulated depreciation (refer to note 3.4.3) and accumulated impairment losses (refer to note 3.8). cost includes expenditures that are directly attributable to the acquisition of the asset. purchased software that is integral to the functionality of equipment is capitalised as part of that equipment.
gains and losses on disposal of an item of property, plant and equipment (other than containers in the leasing fleet) are determined by comparing the proceeds from disposal with the carrying amount of property, plant and equipment, and are recognised on a net basis within other income in profit or loss. When containers in the leasing fleet cease to be rented or become held for sale they are transferred to inventory at their carrying amounts. on disposal the proceeds on the sale of these assets are recognised in revenue in accordance with iaS 18 Revenue (refer to note 3.9.1) and the carrying value is included in changes in inventories.
3.4.2 Subsequent costsThe cost of replacing part of an item of property, plant and equipment is recognised in the carrying amount of the item if it is probable that the future economic benefits embodied within the part will flow to a group entity and its cost can be measured reliably. The carrying amount of the replaced part is derecognised. The costs of the day-to-day servicing of property, plant and equipment are recognised in profit or loss as incurred.
3.4.3 Depreciationdepreciation is calculated on the depreciable amount, which is the cost of an asset, less its residual value. depreciation is recognised in profit or loss on a straight-line basis over the estimated useful lives of property,
plant and equipment. Leasehold improvements are depreciated over the shorter of the lease term or their useful lives. The estimated useful lives for the current and comparative periods are as follows:
Years container leasing equipment
non-refrigerated containers other than open top and flat rack containers 13 refrigerated containers 12Tanks 20open top and flat rack containers 14
plant and machinery 9 motor vehicles 4 – 5 other equipment 3 – 10
depreciation methods, useful lives and residual values are reassessed at each reporting date and adjusted if appropriate.
3.5 Intangible assets and goodwillgoodwill represents the excess of the sum of (a) fair value of consideration transferred, (b) the recognised amount of any non-controlling interest in the acquiree and (c) acquisition date fair value of any existing equity interest in the acquiree, over the acquisition date fair values of identifiable net assets. if the fair values of identifiable net assets exceed the sum described above, the excess amount (ie gain on a bargain purchase) is recognised in profit or loss immediately.
goodwill is measured at cost less accumulated impairment losses. intangible assets consist of exclusive rights to manage various fleets of containers and are measured at cost less accumulated amortisation (refer to note 3.5.2) and accumulated impairment losses (refer to note 3.8).
3.5.1 Subsequent expenditureSubsequent expenditure on capitalised intangible assets is capitalised only when it increases the future economic benefits embodied in the specific asset to which it relates. all other subsequent expenditure is expensed as incurred.
3.5.2 Amortisationintangible assets with finite useful lives are amortised over their useful lives. container management contracts are amortised based on the fees generated from the underlying container management agreements (which reflect the pattern in which the asset’s future economic benefits are expected to be consumed by a group entity). goodwill is not amortised.
The estimated useful lives are reassessed annually and are as follows for the current and comparative periods:
Years
container management contracts 11 – 13
3.6 Net investment in finance leasesamounts due from lessees under finance leases are recorded as finance lease receivables at the amount of the group entities’ net investment, which comprises the present value of the minimum lease payments and any un-guaranteed residual value accruing to the lessor.
3. Significant accounting policies (continued)
Trencor Limited Integrated Annual Report 2015
37
The present value is calculated by discounting the minimum lease payments due and any un-guaranteed residual value, at the interest rate implicit in the lease. initial direct costs are included in the calculation of the finance lease receivable, because the interest rate implicit in the lease, used for discounting the minimum lease payments, takes initial direct costs incurred into consideration. contingent rentals are excluded from the minimum lease payments and are recognised as they are incurred.
3.7 Inventoriesinventories are measured at the lower of cost and net realisable value. The cost of inventories is based on the first-in first-out principle and includes expenditure incurred in acquiring the inventories, and other costs incurred in bringing them to their existing location and condition. net realisable value is the estimated selling price in the ordinary course of business, less the estimated selling expenses.
3.8 Impairment3.8.1 Financial assets
at each reporting date it is assessed whether there is objective evidence that financial assets not carried at fair value through profit or loss, are impaired. a financial asset is considered to be impaired if objective evidence indicates that a loss event has occurred after the initial recognition of the asset, and that the loss event had a negative effect on the estimated future cash flows of that asset that can be estimated reliably.
objective evidence that financial assets (including equity securities) are impaired can include default or delinquency by a debtor, restructuring of an amount due to a group entity on terms that a group entity would not consider otherwise, indications that a debtor or issuer will enter bankruptcy, and the disappearance of an active market for a security or observable data indicating that there is a measurable decrease in the expected cash flows from a group of financial assets. in addition, for an investment in an equity security, a significant or prolonged decline in its fair value below its cost is objective evidence of impairment.
evidence of impairment for receivables is considered at both an individual asset and collective level. all individually significant receivables are assessed for impairment. Those found not to be impaired are then collectively assessed for any impairment that has been incurred but not yet individually identified. receivables that are not individually significant are collectively assessed for impairment by grouping together receivables with similar risk characteristics.
in assessing collective impairment, consideration is given to historical trends of the probability of default, timing of recoveries and the amount of loss incurred, adjusted for management’s judgement as to whether current economic and credit conditions are such that the actual losses are likely to be greater or lesser than suggested by historical trends.
an impairment loss in respect of a financial asset measured at amortised cost is calculated as the difference between its carrying amount and the present value of the estimated future cash flows discounted at the original effective interest rate. Losses are recognised in profit or loss and reflected in an allowance account against receivables. When a group entity considers that there are no realistic prospects of recovery of the receivable, the relevant amounts are written off. When a subsequent event causes the amount of impairment loss to decrease, and the decrease can be related objectively to an event occurring after the impairment was recognised, then the previously recognised impairment loss is reversed through profit or loss.
an impairment loss in respect of an available-for-sale financial asset is calculated with reference to its current fair value. impairment losses on available-for-sale investment securities are recognised by reclassifying the cumulative loss that has been recognised in other comprehensive income, and presented in the fair value reserve in equity, to profit or loss. The cumulative loss that is removed from other comprehensive income and recognised in profit or loss is the difference between the acquisition cost and the current fair value, less any impairment loss previously recognised in profit or loss. if the fair value of an impaired available-for-sale equity security subsequently increases and the increase can be related objectively to an event occurring after the impairment was recognised, then the impairment loss is reversed through other comprehensive income.
an impairment loss in respect of an equity-accounted investee is measured by comparing the recoverable amount of the investment with its carrying amount. an impairment loss is recognised in profit or loss, and is reversed if there has been a favourable change in the estimates used to determine the recoverable amount.
3.8.2 Non-financial assetsat each reporting date, the carrying amounts of non-financial assets (other than inventories and deferred tax assets) are reviewed to determine whether there is any indication of impairment. if any such indication exists, then the asset’s recoverable amount is estimated. goodwill is tested annually for impairment.
For impairment testing, assets are grouped together into the smallest group of assets that generates cash inflows from continuing use that are largely independent of the cash inflows of other assets or cash-generating units (cgus). goodwill arising from a business combination is allocated to cgus or groups of cgus that are expected to benefit from the synergies of the combination.
The recoverable amount of an asset or cgu is the greater of its value in use and its fair value less costs to sell. Value in use is based on the estimated future cash flows, discounted to their present value using a pre-tax discount rate that reflects current market assessments of the time value of money and the risks specific to the asset or cgu.
Trencor Limited Integrated Annual Report 2015
38
an impairment loss is recognised if the carrying amount of an asset or cgu exceeds its recoverable amount.
impairment losses are recognised in profit or loss. They are allocated first to reduce the carrying amount of any goodwill allocated to the cgu, and then to reduce the carrying amounts of the other assets in the cgu on a pro rata basis.
an impairment loss in respect of goodwill is not reversed. For other assets, an impairment loss is reversed only to the extent that the asset’s carrying amount does not exceed the carrying amount that would have been determined, net of depreciation or amortisation, if no impairment loss had been recognised.
3.9 Revenue3.9.1 Goods sold
revenue from the sale of goods, principally containers, is measured at the fair value of the consideration received or receivable, net of returns and allowances, trade discounts and volume rebates. revenue is recognised in profit or loss when persuasive evidence exists, usually in the form of an executed sales agreement, that the significant risks and rewards of ownership have been transferred to the customer, recovery of the consideration is probable, the associated costs and possible return of goods can be estimated reliably, there is no continuing managerial involvement with the goods, and the amount of revenue can be measured reliably.
3.9.2 Leasing incomeMarine cargo containersLeasing income arises principally from operating and finance leases.
under operating leases, container equipment owned by group entities is rented to various shipping lines and revenue is earned and recognised evenly over the period that the equipment is on lease, according to the terms of the contracts. These contracts are typically for terms of five years or less. considerations received in advance for future operating lease payments are discounted to their present values and deferred over the lease term. under finance leases, containers are leased for the remainder of the container’s useful life with a purchase option at the end of the lease term. The revenue recognised at the commencement of a finance lease, where a group entity is the lessor, is the fair value of the asset or if lower, the present value of the minimum lease payments accruing to the group entity, computed at a market rate of interest. The revenue associated with the sale of goods which are subject to finance leases is accounted for in terms of the accounting policy for goods sold (see note 3.9.1). The cost of sales recognised at the commencement of the lease term is the cost, or carrying amount if different, of the leased item less the present value of the unguaranteed residual value.
Leasing income in respect of finance lease receivables is earned and recognised over the lease term so as to produce a constant periodic rate of return on the net investment in the lease.
The leases generally require the lessee to pay for any damage to the container beyond normal wear and tear at the end of the lease term. a damage protection plan (‘dpp’) is offered to certain lessees. in terms of the dpp, an amount is charged, in addition to lease rentals, primarily on a daily basis and the lessees are no longer obligated for certain future repair costs for containers subject to the dpp. These revenues are recognised as earned on a daily basis over the related term of the lease.
revenue and related expense has not been recognised under the dpp for customers who are charged at the end of the lease term or for other lessees who do not participate in the dpp. Based on past history, there is uncertainty as to the collectability of these amounts from lessees who are billed at the end of the lease term because the amounts due under the dpp are typically renegotiated at the end of the lease term or the lease term is extended.
3.9.3 Management feesmanagement fees consist of fees earned by group entities for services related to the management of container equipment, reimbursements of administrative services necessary for the operation and management of equipment and net acquisition fees and sales commissions earned on the acquisition and sale of equipment. management fees are earned under management agreements on an as earned basis. Fees are typically calculated as a percentage of net operating income due to the owners of the fleets managed (which is revenue from the containers under management minus direct operating expense related to those containers).
3.9.4 Realised and unrealised exchange gainsrevenue includes realised and unrealised exchange gains arising from the translation of long-term receivables, as these are considered to be part of the operating activities of the container finance segment.
3.9.5 Dividend income and distributions from trustin the case of the company, revenue comprises dividend income and distributions from trust and is recognised when the right to receive payment is established.
3.10 Expenses3.10.1 Operating lease payments
payments made under operating leases are recognised in profit or loss on a straight-line basis over the term of the lease.
3. Significant accounting policies (continued)
Trencor Limited Integrated Annual Report 2015
39
3.10.2 Net finance expensesinterest expense comprises the effective interest expense on financial liabilities measured at amortised cost. capitalised debt issuance costs which are amortised over the term of the debt are included in interest expense as required by application of the effective interest method.
interest income, other than that arising in respect of finance lease receivables (refer note 3.9.2), is recognised in profit or loss as it accrues, using the effective interest method.
Fair value gains or losses on interest rate swaps are included in finance expenses.
3.11 Employee benefits3.11.1 Short-term employee benefits
The cost of all short-term employee benefits is recognised during the year in which the employee renders the related service. The accruals for employee entitlements to remuneration and annual leave represent the amount which group entities have a present obligation to pay as a result of employees’ services provided to the reporting date. The accruals have been calculated at undiscounted amounts based on current remuneration rates.
3.11.2 Retirement benefitscertain of the group entities contribute to defined contribution retirement funds. a defined contribution fund is a post-employment benefit plan under which an entity pays fixed contributions into a separate entity and will have no legal or constructive obligation to pay further amounts. obligations for contributions to these funds are recognised in profit or loss in the period during which services are rendered by employees.
3.11.3 Share-based payments transactionsThe company and certain group entities grant share options to certain employees under share option plans which are all classified as equity-settled. The grant date fair value of share-based awards granted is recognised as an expense with a corresponding increase in equity over the vesting period of the awards. The fair value is measured at grant date using the actuarial Binomial model or Black-Scholes-merton (‘Black-Scholes’) option pricing model, taking into account the terms and conditions upon which the options were granted. The amount recognised as an expense is adjusted for service and non-market performance conditions, so as to reflect the actual number of share-based awards that vest.
3.12 Income taxincome tax on the profit or loss for the year comprises current and deferred tax. income tax is recognised in profit or loss except to the extent that it relates to a business combination, or items recognised directly in equity or in other comprehensive income.
current tax is the expected tax payable on the estimated taxable income for the year, using tax rates enacted or substantively enacted at the reporting date, and any
adjustment to tax payable in respect of previous years. deferred tax is recognised in respect of temporary differences between the carrying amounts of assets and liabilities for financial reporting purposes and the amounts used for taxation purposes. The following temporary differences are not provided for: the initial recognition of goodwill, the initial recognition of assets or liabilities in a transaction that is not a business combination and that affects neither accounting nor taxable profit, and differences relating to investments in subsidiaries and associates to the extent that they will probably not reverse in the foreseeable future.
The amount of deferred tax provided is based on the expected manner of realisation or settlement of the carrying amount of assets and liabilities, based on the tax rates that have been enacted or substantively enacted at the reporting date. deferred tax assets and liabilities are off-set if there is a legally enforceable right to off-set current tax assets and liabilities, and they relate to income taxes levied by the same tax authority on the same taxable entity, or on different tax entities, but they intend to settle current tax assets and liabilities on a net basis or their tax assets and liabilities will be realised simultaneously.
a deferred tax asset is recognised only to the extent that it is probable that future taxable profits will be available against which the asset can be utilised. deferred tax assets are reduced to the extent that it is no longer probable that the related tax benefit will be realised.
3.13 Earnings per shareBasic earnings per share is calculated by dividing the profit or loss attributable to shareholders of the company by the weighted average number of shares outstanding during the period.
3.14 Accounting standards and interpretations in issue but not yet effectivea number of new standards, amendments to standards and interpretations are effective for annual periods beginning on or after 1 January 2016, and have not been applied in preparing these financial statements. The standards and interpretations which may be relevant to the company and group entities are set out below, although early adoption is not anticipated.
Effective for the financial year commencing 1 January 2016
Clarification of Acceptable Methods of Depreciation and Amortisation (Amendments IAS 38)The amendments to iaS 38 Intangible Assets introduces a rebuttable presumption that the use of revenue-based amortisation methods for intangible assets is inappropriate. The presumption can be overcome only when revenue and the consumption of the economic benefits of the intangible asset are ‘highly correlated’, or when the intangible asset is expressed as a measure of revenue.
Trencor Limited Integrated Annual Report 2015
40
a group entity currently has several intangible assets that are amortised using a revenue-based method. The above-mentioned rebuttable presumption cannot be overcome, and consequently the amortisation method for these items will have to change. it has been determined that the straight-line method is the most appropriate amortisation method.
The amendment applies prospectively for annual periods beginning on or after 1 January 2016.
Sale or Contribution of Assets between an Investor and its Associate or Joint Venture (Amendments to IFRS 10 and IAS 28)The amendments require the full gain to be recognised when assets transferred between an investor and its associate or joint venture meet the definition of a ‘business’ under iFrS 3 Business Combinations. Where the assets transferred do not meet the definition of a business, a partial gain to the extent of unrelated investors’ interests in the associate or joint venture is recognised. The definition of a business is key to determining the extent of the gain to be recognised.
The amendments apply prospectively for annual periods beginning on or after 1 January 2016.
Disclosure Initiative (Amendments to IAS 1)The amendments provide additional guidance on the application of materiality and aggregation when preparing financial statements. The amendments also clarify presentation principles applicable to the order of notes, other comprehensive income of equity accounted investees and sub-totals presented in the statement of financial position and statement of comprehensive income.
The amendments apply for annual periods beginning on or after 1 January 2016.
Effective for the financial year commencing 1 January 2018
IFRS 15 Revenue from Contracts with CustomersThis standard replaces iaS 18 Revenue. The standard contains a single model that applies to contracts with customers and two approaches to recognising revenue: at a point in time or over time. The model features a contract-based five-step analysis of transactions to determine whether, how much and when revenue is recognised.
This new standard will have limited impact on the group due to the nature of the revenue earned by group entities. The impact is currently being assessed and more information will be provided in financial statements for the year ending 31 december 2016.
IFRS 9 Financial Instrumentson 24 July 2014, the iaSB issued the final iFrS 9 Financial instruments Standard, which replaces earlier versions of iFrS 9 and completes the iaSB’s project to replace iaS 39 Financial Instruments: Recognition and Measurement.
This standard will result in changes in the measurement bases of the group’s financial assets to amortised cost, fair value through other comprehensive income or fair value through profit or loss. even though these measurement categories are similar to iaS 39, the criteria for classification into these categories are significantly different. in addition, the iFrS 9 impairment model has been changed from an ‘incurred loss’ model from iaS 39 to an ‘expected credit loss’ model, which could increase the provision for bad debts recognised in the group.
The standard is effective for annual periods beginning on or after 1 January 2018 with retrospective application, early adoption is permitted. The impact of the standard is currently being assessed.
Effective for the financial year commencing 1 January 2019
IFRS 16 LeasesiFrS 16 was published in January 2016. it sets out the principles for the recognition, measurement, presentation and disclosure of leases for both parties to a contract, ie the customer (‘lessee’) and the supplier (‘lessor’). iFrS 16 replaces the previous leases Standard, iaS 17 Leases, and related interpretations. iFrS 16 has one model for lessees which will result in almost all leases being included on the statement of financial position.
The standard is effective for annual periods beginning on or after 1 January 2019, with early adoption permitted only if the entity also adopts iFrS 15. The transitional requirements are different for lessees and lessors. The impact of the standard is currently being assessed, although no significant changes are anticipated for lessors.
3. Significant accounting policies (continued)
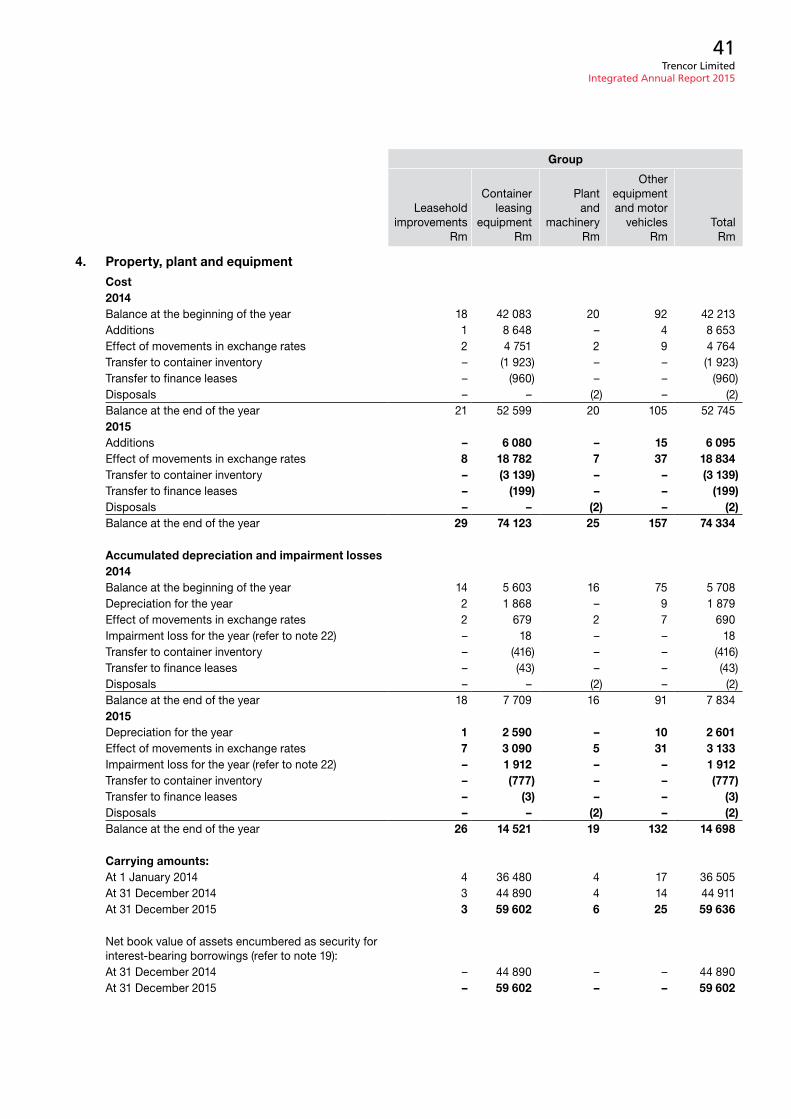
Trencor Limited Integrated Annual Report 2015
41
Group
Leaseholdimprovements
rm
containerleasing
equipmentrm
plantand
machineryrm
otherequipmentand motor
vehiclesrm
Totalrm
4. Property, plant and equipment
Cost2014Balance at the beginning of the year 18 42 083 20 92 42 213additions 1 8 648 – 4 8 653effect of movements in exchange rates 2 4 751 2 9 4 764Transfer to container inventory – (1 923) – – (1 923)Transfer to finance leases – (960) – – (960)disposals – – (2) – (2)Balance at the end of the year 21 52 599 20 105 52 7452015additions – 6 080 – 15 6 095effect of movements in exchange rates 8 18 782 7 37 18 834Transfer to container inventory – (3 139) – – (3 139)Transfer to finance leases – (199) – – (199)disposals – – (2) – (2)Balance at the end of the year 29 74 123 25 157 74 334
Accumulated depreciation and impairment losses2014Balance at the beginning of the year 14 5 603 16 75 5 708depreciation for the year 2 1 868 – 9 1 879effect of movements in exchange rates 2 679 2 7 690impairment loss for the year (refer to note 22) – 18 – – 18Transfer to container inventory – (416) – – (416)Transfer to finance leases – (43) – – (43)disposals – – (2) – (2)Balance at the end of the year 18 7 709 16 91 7 8342015depreciation for the year 1 2 590 – 10 2 601effect of movements in exchange rates 7 3 090 5 31 3 133impairment loss for the year (refer to note 22) – 1 912 – – 1 912Transfer to container inventory – (777) – – (777)Transfer to finance leases – (3) – – (3)disposals – – (2) – (2)Balance at the end of the year 26 14 521 19 132 14 698
Carrying amounts:at 1 January 2014 4 36 480 4 17 36 505at 31 december 2014 3 44 890 4 14 44 911at 31 december 2015 3 59 602 6 25 59 636
net book value of assets encumbered as security for interest-bearing borrowings (refer to note 19):at 31 december 2014 – 44 890 – – 44 890at 31 december 2015 – 59 602 – – 59 602
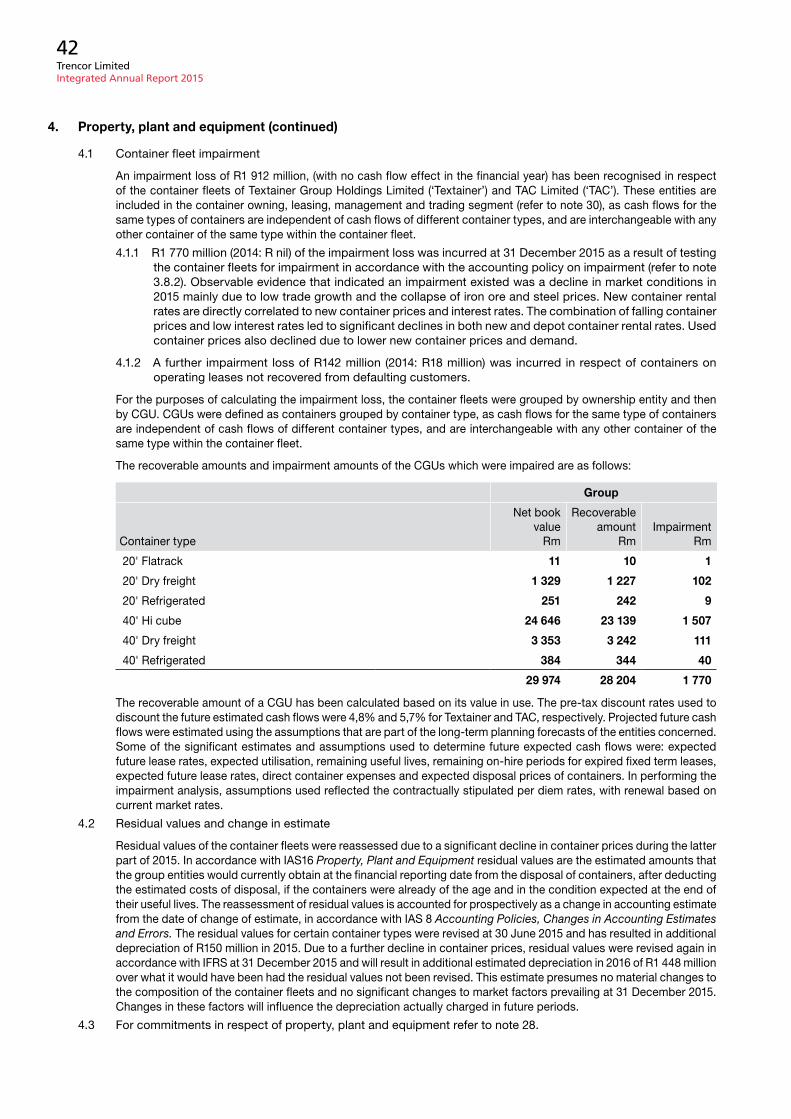
Trencor Limited Integrated Annual Report 2015
42
4.1 container fleet impairment
an impairment loss of r1 912 million, (with no cash flow effect in the financial year) has been recognised in respect of the container fleets of Textainer group Holdings Limited (‘Textainer’) and Tac Limited (‘Tac’). These entities are included in the container owning, leasing, management and trading segment (refer to note 30), as cash flows for the same types of containers are independent of cash flows of different container types, and are interchangeable with any other container of the same type within the container fleet.
4.1.1 r1 770 million (2014: r nil) of the impairment loss was incurred at 31 december 2015 as a result of testing the container fleets for impairment in accordance with the accounting policy on impairment (refer to note 3.8.2). observable evidence that indicated an impairment existed was a decline in market conditions in 2015 mainly due to low trade growth and the collapse of iron ore and steel prices. new container rental rates are directly correlated to new container prices and interest rates. The combination of falling container prices and low interest rates led to significant declines in both new and depot container rental rates. used container prices also declined due to lower new container prices and demand.
4.1.2 a further impairment loss of r142 million (2014: r18 million) was incurred in respect of containers on operating leases not recovered from defaulting customers.
For the purposes of calculating the impairment loss, the container fleets were grouped by ownership entity and then by cgu. cgus were defined as containers grouped by container type, as cash flows for the same type of containers are independent of cash flows of different container types, and are interchangeable with any other container of the same type within the container fleet.
The recoverable amounts and impairment amounts of the cgus which were impaired are as follows:
Group
container type
net book value
rm
recoverable amount
rmimpairment
rm
20' Flatrack 11 10 1
20' dry freight 1 329 1 227 102
20' refrigerated 251 242 9
40' Hi cube 24 646 23 139 1 507
40' dry freight 3 353 3 242 111
40' refrigerated 384 344 40
29 974 28 204 1 770
The recoverable amount of a cgu has been calculated based on its value in use. The pre-tax discount rates used to discount the future estimated cash flows were 4,8% and 5,7% for Textainer and Tac, respectively. projected future cash flows were estimated using the assumptions that are part of the long-term planning forecasts of the entities concerned. Some of the significant estimates and assumptions used to determine future expected cash flows were: expected future lease rates, expected utilisation, remaining useful lives, remaining on-hire periods for expired fixed term leases, expected future lease rates, direct container expenses and expected disposal prices of containers. in performing the impairment analysis, assumptions used reflected the contractually stipulated per diem rates, with renewal based on current market rates.
4.2 residual values and change in estimate
residual values of the container fleets were reassessed due to a significant decline in container prices during the latter part of 2015. in accordance with iaS16 Property, Plant and Equipment residual values are the estimated amounts that the group entities would currently obtain at the financial reporting date from the disposal of containers, after deducting the estimated costs of disposal, if the containers were already of the age and in the condition expected at the end of their useful lives. The reassessment of residual values is accounted for prospectively as a change in accounting estimate from the date of change of estimate, in accordance with iaS 8 Accounting Policies, Changes in Accounting Estimates and Errors. The residual values for certain container types were revised at 30 June 2015 and has resulted in additional depreciation of r150 million in 2015. due to a further decline in container prices, residual values were revised again in accordance with iFrS at 31 december 2015 and will result in additional estimated depreciation in 2016 of r1 448 million over what it would have been had the residual values not been revised. This estimate presumes no material changes to the composition of the container fleets and no significant changes to market factors prevailing at 31 december 2015. changes in these factors will influence the depreciation actually charged in future periods.
4.3 For commitments in respect of property, plant and equipment refer to note 28.
4. Property, plant and equipment (continued)
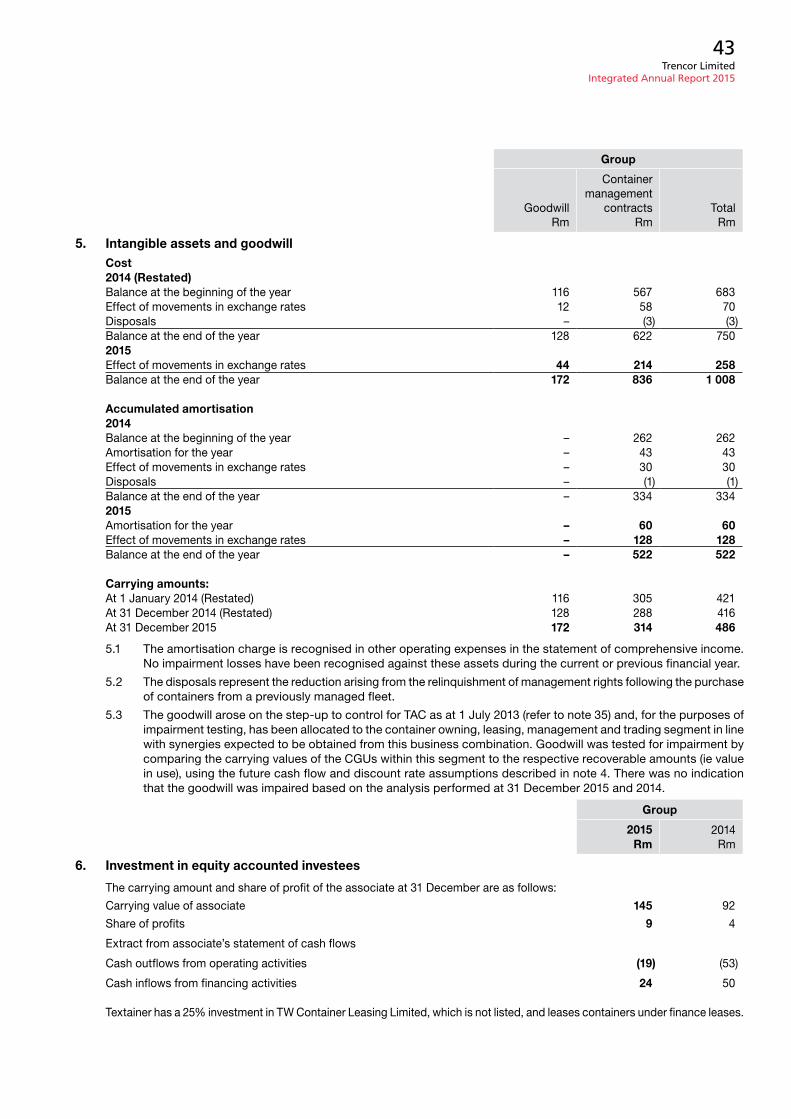
Trencor Limited Integrated Annual Report 2015
43
Group
goodwillrm
container management
contractsrm
Totalrm
5. Intangible assets and goodwillCost2014 (Restated)Balance at the beginning of the year 116 567 683effect of movements in exchange rates 12 58 70disposals – (3) (3)Balance at the end of the year 128 622 7502015effect of movements in exchange rates 44 214 258Balance at the end of the year 172 836 1 008
Accumulated amortisation2014Balance at the beginning of the year – 262 262amortisation for the year – 43 43effect of movements in exchange rates – 30 30disposals – (1) (1)Balance at the end of the year – 334 3342015amortisation for the year – 60 60effect of movements in exchange rates – 128 128Balance at the end of the year – 522 522
Carrying amounts:at 1 January 2014 (restated) 116 305 421at 31 december 2014 (restated) 128 288 416at 31 december 2015 172 314 486
5.1 The amortisation charge is recognised in other operating expenses in the statement of comprehensive income. no impairment losses have been recognised against these assets during the current or previous financial year.
5.2 The disposals represent the reduction arising from the relinquishment of management rights following the purchase of containers from a previously managed fleet.
5.3 The goodwill arose on the step-up to control for Tac as at 1 July 2013 (refer to note 35) and, for the purposes of impairment testing, has been allocated to the container owning, leasing, management and trading segment in line with synergies expected to be obtained from this business combination. goodwill was tested for impairment by comparing the carrying values of the cgus within this segment to the respective recoverable amounts (ie value in use), using the future cash flow and discount rate assumptions described in note 4. There was no indication that the goodwill was impaired based on the analysis performed at 31 december 2015 and 2014.
Group
2015Rm
2014rm
6. Investment in equity accounted investees
The carrying amount and share of profit of the associate at 31 december are as follows:
carrying value of associate 145 92
Share of profits 9 4
extract from associate’s statement of cash flows
cash outflows from operating activities (19) (53)
cash inflows from financing activities 24 50
Textainer has a 25% investment in TW container Leasing Limited, which is not listed, and leases containers under finance leases.
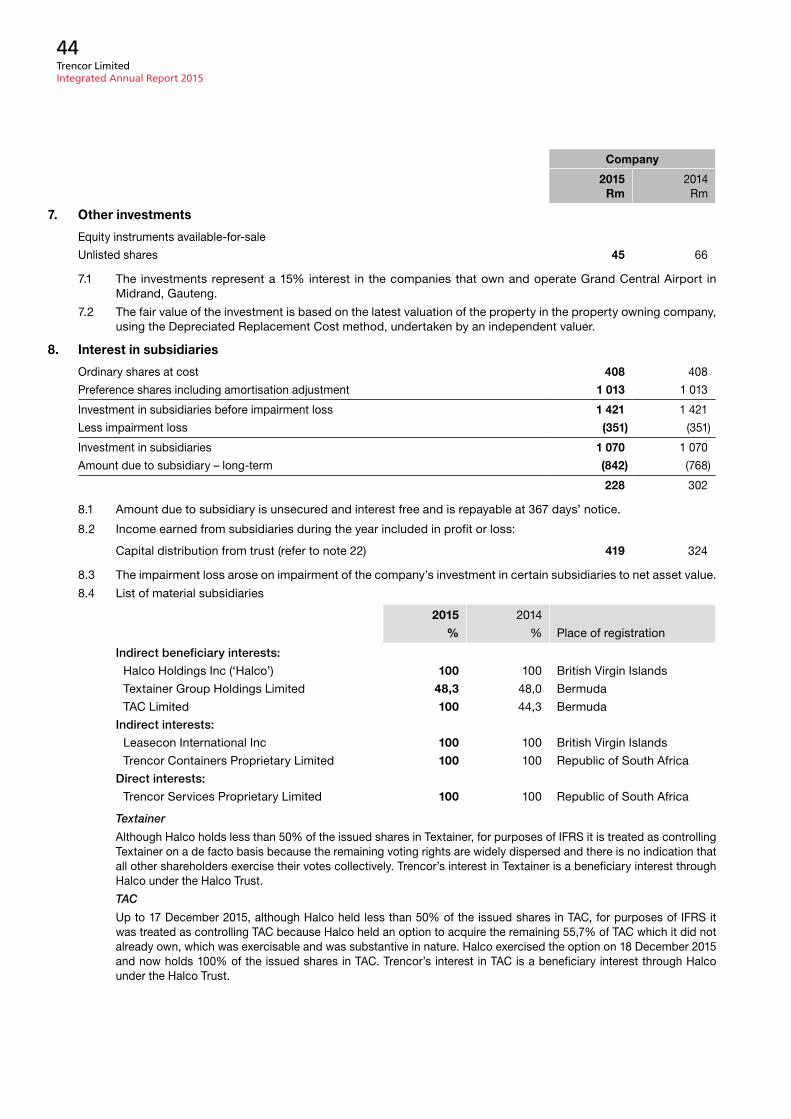
Trencor Limited Integrated Annual Report 2015
44
Company
2015Rm
2014rm
7. Other investments
equity instruments available-for-sale
unlisted shares 45 66
7.1 The investments represent a 15% interest in the companies that own and operate grand central airport in midrand, gauteng.
7.2 The fair value of the investment is based on the latest valuation of the property in the property owning company, using the depreciated replacement cost method, undertaken by an independent valuer.
8. Interest in subsidiaries
ordinary shares at cost 408 408
preference shares including amortisation adjustment 1 013 1 013
investment in subsidiaries before impairment loss 1 421 1 421
Less impairment loss (351) (351)
investment in subsidiaries 1 070 1 070
amount due to subsidiary – long-term (842) (768)
228 302
8.1 amount due to subsidiary is unsecured and interest free and is repayable at 367 days’ notice.
8.2 income earned from subsidiaries during the year included in profit or loss:
capital distribution from trust (refer to note 22) 419 324
8.3 The impairment loss arose on impairment of the company’s investment in certain subsidiaries to net asset value.
8.4 List of material subsidiaries
2015 2014
% % place of registration
Indirect beneficiary interests:
Halco Holdings inc (‘Halco’) 100 100 British Virgin islands
Textainer group Holdings Limited 48,3 48,0 Bermuda
Tac Limited 100 44,3 Bermuda
Indirect interests:
Leasecon international inc 100 100 British Virgin islands
Trencor containers proprietary Limited 100 100 republic of South africa
Direct interests:
Trencor Services proprietary Limited 100 100 republic of South africa
Textainer
although Halco holds less than 50% of the issued shares in Textainer, for purposes of iFrS it is treated as controlling Textainer on a de facto basis because the remaining voting rights are widely dispersed and there is no indication that all other shareholders exercise their votes collectively. Trencor’s interest in Textainer is a beneficiary interest through Halco under the Halco Trust.
TAC
up to 17 december 2015, although Halco held less than 50% of the issued shares in Tac, for purposes of iFrS it was treated as controlling Tac because Halco held an option to acquire the remaining 55,7% of Tac which it did not already own, which was exercisable and was substantive in nature. Halco exercised the option on 18 december 2015 and now holds 100% of the issued shares in Tac. Trencor’s interest in Tac is a beneficiary interest through Halco under the Halco Trust.
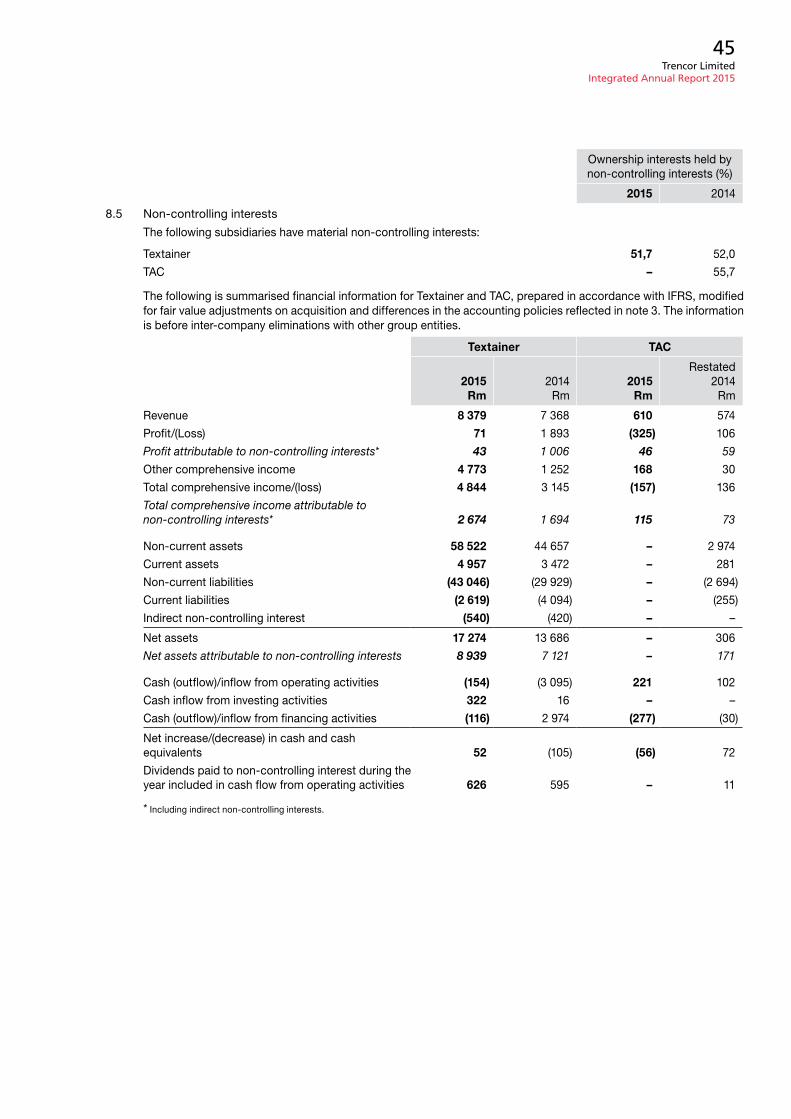
Trencor Limited Integrated Annual Report 2015
45
ownership interests held by non-controlling interests (%)
2015 2014
8.5 non-controlling interests
The following subsidiaries have material non-controlling interests:
Textainer 51,7 52,0
Tac – 55,7
The following is summarised financial information for Textainer and Tac, prepared in accordance with iFrS, modified for fair value adjustments on acquisition and differences in the accounting policies reflected in note 3. The information is before inter-company eliminations with other group entities.
Textainer TAC
2015Rm
2014rm
2015Rm
restated2014
rm
revenue 8 379 7 368 610 574
profit/(Loss) 71 1 893 (325) 106
Profit attributable to non-controlling interests* 43 1 006 46 59
other comprehensive income 4 773 1 252 168 30
Total comprehensive income/(loss) 4 844 3 145 (157) 136
Total comprehensive income attributable to non-controlling interests* 2 674 1 694 115 73
non-current assets 58 522 44 657 – 2 974
current assets 4 957 3 472 – 281
non-current liabilities (43 046) (29 929) – (2 694)
current liabilities (2 619) (4 094) – (255)
indirect non-controlling interest (540) (420) – –
net assets 17 274 13 686 – 306
Net assets attributable to non-controlling interests 8 939 7 121 – 171
cash (outflow)/inflow from operating activities (154) (3 095) 221 102
cash inflow from investing activities 322 16 – –
cash (outflow)/inflow from financing activities (116) 2 974 (277) (30)
net increase/(decrease) in cash and cash equivalents 52 (105) (56) 72
dividends paid to non-controlling interest during the year included in cash flow from operating activities 626 595 – 11
* including indirect non-controlling interests.
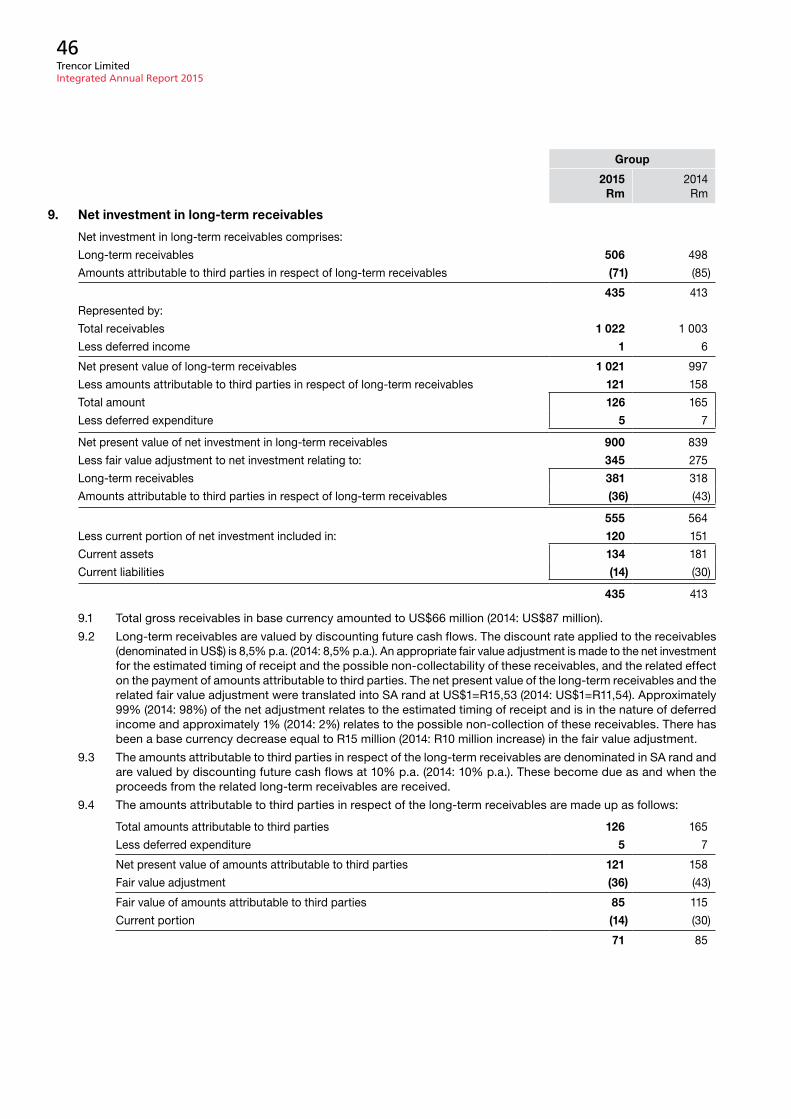
Trencor Limited Integrated Annual Report 2015
46
Group
2015Rm
2014rm
9. Net investment in long-term receivables
net investment in long-term receivables comprises:
Long-term receivables 506 498
amounts attributable to third parties in respect of long-term receivables (71) (85)
435 413
represented by:
Total receivables 1 022 1 003
Less deferred income 1 6
net present value of long-term receivables 1 021 997
Less amounts attributable to third parties in respect of long-term receivables 121 158
Total amount 126 165
Less deferred expenditure 5 7
net present value of net investment in long-term receivables 900 839
Less fair value adjustment to net investment relating to: 345 275
Long-term receivables 381 318
amounts attributable to third parties in respect of long-term receivables (36) (43)
555 564
Less current portion of net investment included in: 120 151
current assets 134 181
current liabilities (14) (30)
435 413
9.1 Total gross receivables in base currency amounted to uS$66 million (2014: uS$87 million).
9.2 Long-term receivables are valued by discounting future cash flows. The discount rate applied to the receivables (denominated in uS$) is 8,5% p.a. (2014: 8,5% p.a.). an appropriate fair value adjustment is made to the net investment for the estimated timing of receipt and the possible non-collectability of these receivables, and the related effect on the payment of amounts attributable to third parties. The net present value of the long-term receivables and the related fair value adjustment were translated into Sa rand at uS$1=r15,53 (2014: uS$1=r11,54). approximately 99% (2014: 98%) of the net adjustment relates to the estimated timing of receipt and is in the nature of deferred income and approximately 1% (2014: 2%) relates to the possible non-collection of these receivables. There has been a base currency decrease equal to r15 million (2014: r10 million increase) in the fair value adjustment.
9.3 The amounts attributable to third parties in respect of the long-term receivables are denominated in Sa rand and are valued by discounting future cash flows at 10% p.a. (2014: 10% p.a.). These become due as and when the proceeds from the related long-term receivables are received.
9.4 The amounts attributable to third parties in respect of the long-term receivables are made up as follows:
Total amounts attributable to third parties 126 165
Less deferred expenditure 5 7
net present value of amounts attributable to third parties 121 158
Fair value adjustment (36) (43)
Fair value of amounts attributable to third parties 85 115
current portion (14) (30)
71 85
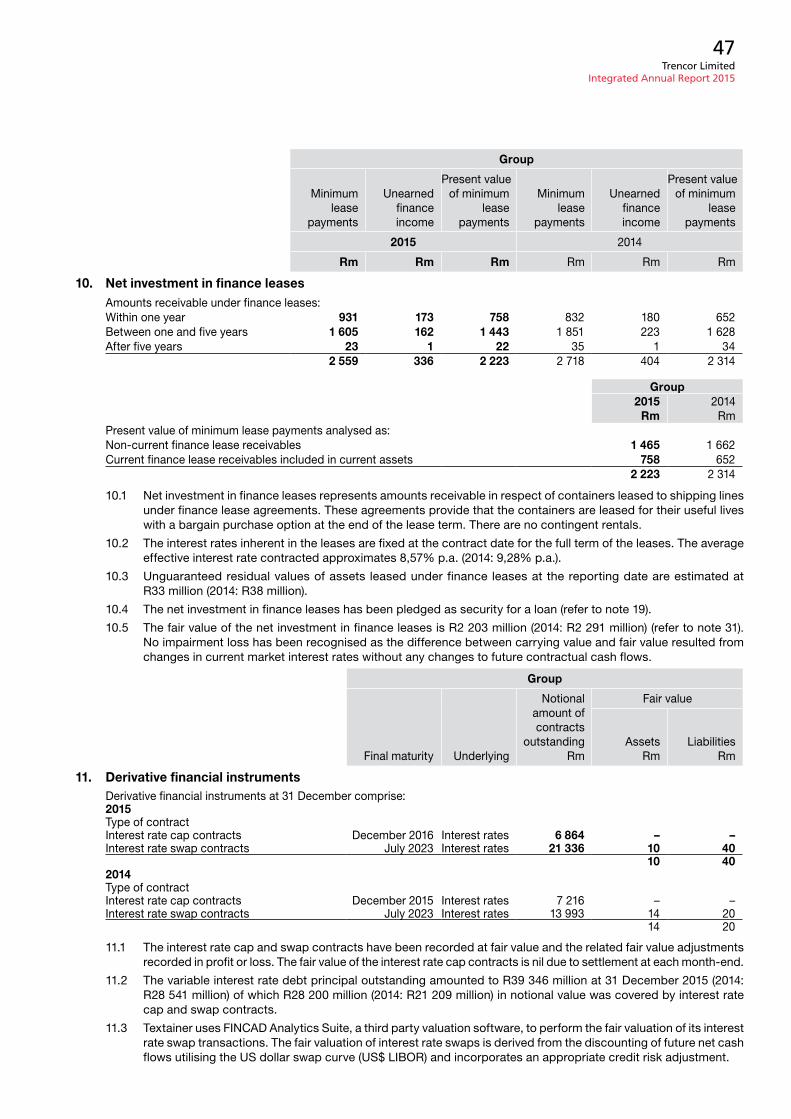
Trencor Limited Integrated Annual Report 2015
47
Group
minimum lease
payments
unearned finance income
present value of minimum
lease payments
minimum lease
payments
unearned finance income
present value of minimum
lease payments
2015 2014
Rm Rm Rm rm rm rm
10. Net investment in finance leases amounts receivable under finance leases:Within one year 931 173 758 832 180 652Between one and five years 1 605 162 1 443 1 851 223 1 628after five years 23 1 22 35 1 34
2 559 336 2 223 2 718 404 2 314
Group2015
Rm2014
rmpresent value of minimum lease payments analysed as:non-current finance lease receivables 1 465 1 662current finance lease receivables included in current assets 758 652
2 223 2 314
10.1 net investment in finance leases represents amounts receivable in respect of containers leased to shipping lines under finance lease agreements. These agreements provide that the containers are leased for their useful lives with a bargain purchase option at the end of the lease term. There are no contingent rentals.
10.2 The interest rates inherent in the leases are fixed at the contract date for the full term of the leases. The average effective interest rate contracted approximates 8,57% p.a. (2014: 9,28% p.a.).
10.3 unguaranteed residual values of assets leased under finance leases at the reporting date are estimated at r33 million (2014: r38 million).
10.4 The net investment in finance leases has been pledged as security for a loan (refer to note 19).
10.5 The fair value of the net investment in finance leases is r2 203 million (2014: r2 291 million) (refer to note 31). no impairment loss has been recognised as the difference between carrying value and fair value resulted from changes in current market interest rates without any changes to future contractual cash flows.
Group
Final maturity underlying
notional amount of
contractsoutstanding
rm
Fair value
assetsrm
Liabilitiesrm
11. Derivative financial instrumentsderivative financial instruments at 31 december comprise:2015Type of contractinterest rate cap contracts december 2016 interest rates 6 864 – –interest rate swap contracts July 2023 interest rates 21 336 10 40
10 402014Type of contractinterest rate cap contracts december 2015 interest rates 7 216 – –interest rate swap contracts July 2023 interest rates 13 993 14 20
14 20
11.1 The interest rate cap and swap contracts have been recorded at fair value and the related fair value adjustments recorded in profit or loss. The fair value of the interest rate cap contracts is nil due to settlement at each month-end.
11.2 The variable interest rate debt principal outstanding amounted to r39 346 million at 31 december 2015 (2014: r28 541 million) of which r28 200 million (2014: r21 209 million) in notional value was covered by interest rate cap and swap contracts.
11.3 Textainer uses Fincad analytics Suite, a third party valuation software, to perform the fair valuation of its interest rate swap transactions. The fair valuation of interest rate swaps is derived from the discounting of future net cash flows utilising the uS dollar swap curve (uS$ LiBor) and incorporates an appropriate credit risk adjustment.
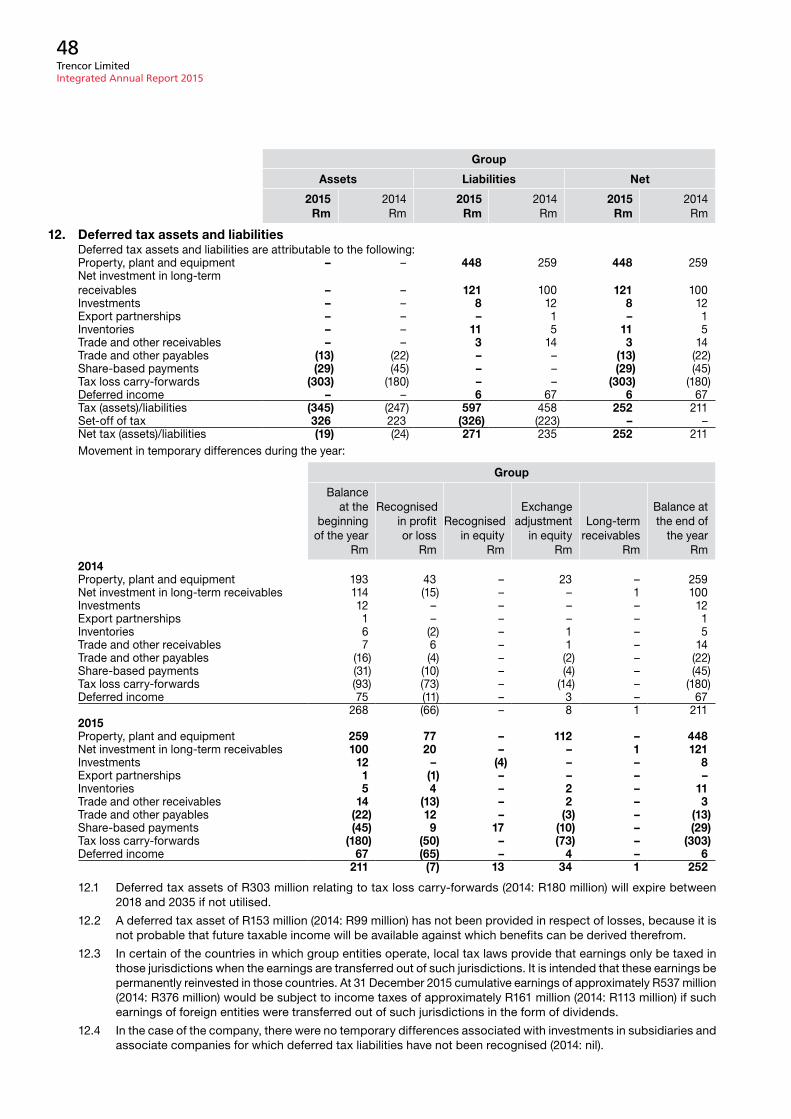
Trencor Limited Integrated Annual Report 2015
48
Group
Assets Liabilities Net
2015Rm
2014rm
2015Rm
2014rm
2015Rm
2014rm
12. Deferred tax assets and liabilitiesdeferred tax assets and liabilities are attributable to the following:property, plant and equipment – – 448 259 448 259net investment in long-term receivables – – 121 100 121 100investments – – 8 12 8 12export partnerships – – – 1 – 1inventories – – 11 5 11 5Trade and other receivables – – 3 14 3 14Trade and other payables (13) (22) – – (13) (22)Share-based payments (29) (45) – – (29) (45)Tax loss carry-forwards (303) (180) – – (303) (180)deferred income – – 6 67 6 67Tax (assets)/liabilities (345) (247) 597 458 252 211Set-off of tax 326 223 (326) (223) – –net tax (assets)/liabilities (19) (24) 271 235 252 211movement in temporary differences during the year:
Group
Balance at the
beginning of the year
rm
recognised in profit
or lossrm
recognised in equity
rm
exchange adjustment
in equityrm
Long-term receivables
rm
Balance at the end of
the yearrm
2014property, plant and equipment 193 43 – 23 – 259net investment in long-term receivables 114 (15) – – 1 100investments 12 – – – – 12export partnerships 1 – – – – 1inventories 6 (2) – 1 – 5Trade and other receivables 7 6 – 1 – 14Trade and other payables (16) (4) – (2) – (22)Share-based payments (31) (10) – (4) – (45)Tax loss carry-forwards (93) (73) – (14) – (180)deferred income 75 (11) – 3 – 67
268 (66) – 8 1 2112015property, plant and equipment 259 77 – 112 – 448net investment in long-term receivables 100 20 – – 1 121investments 12 – (4) – – 8export partnerships 1 (1) – – – –inventories 5 4 – 2 – 11Trade and other receivables 14 (13) – 2 – 3Trade and other payables (22) 12 – (3) – (13)Share-based payments (45) 9 17 (10) – (29)Tax loss carry-forwards (180) (50) – (73) – (303)deferred income 67 (65) – 4 – 6
211 (7) 13 34 1 252
12.1 deferred tax assets of r303 million relating to tax loss carry-forwards (2014: r180 million) will expire between 2018 and 2035 if not utilised.
12.2 a deferred tax asset of r153 million (2014: r99 million) has not been provided in respect of losses, because it is not probable that future taxable income will be available against which benefits can be derived therefrom.
12.3 in certain of the countries in which group entities operate, local tax laws provide that earnings only be taxed in those jurisdictions when the earnings are transferred out of such jurisdictions. it is intended that these earnings be permanently reinvested in those countries. at 31 december 2015 cumulative earnings of approximately r537 million (2014: r376 million) would be subject to income taxes of approximately r161 million (2014: r113 million) if such earnings of foreign entities were transferred out of such jurisdictions in the form of dividends.
12.4 in the case of the company, there were no temporary differences associated with investments in subsidiaries and associate companies for which deferred tax liabilities have not been recognised (2014: nil).
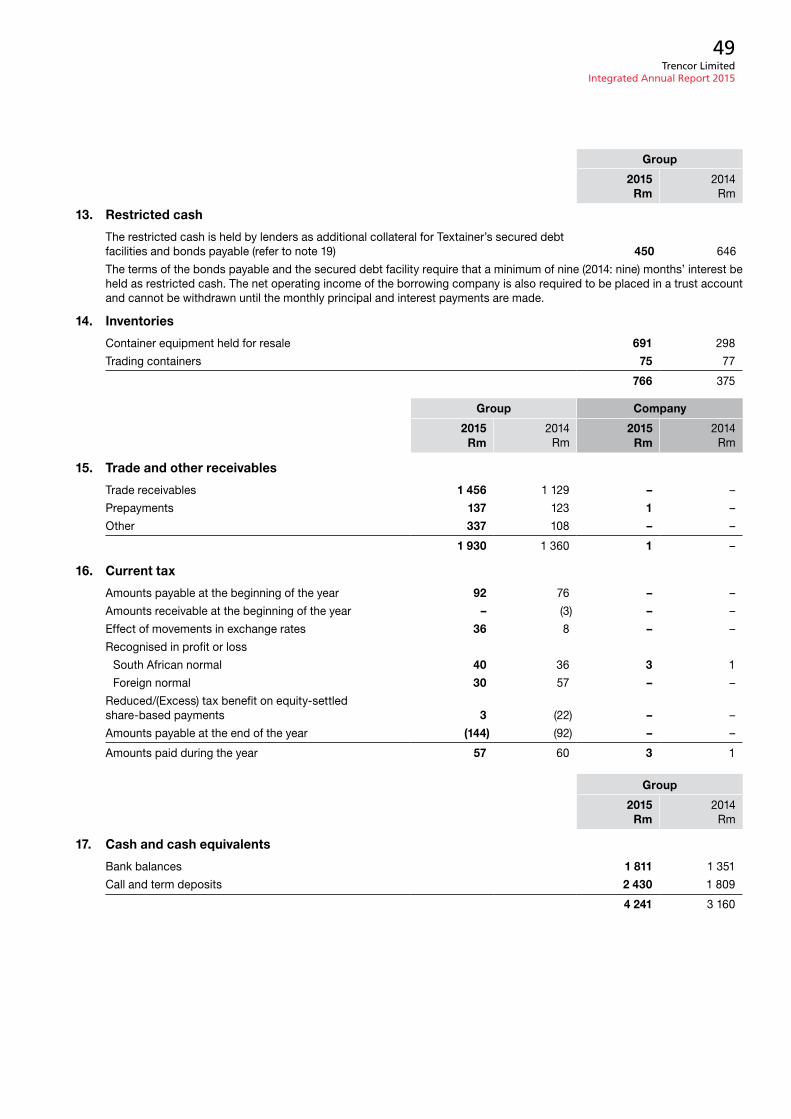
Trencor Limited Integrated Annual Report 2015
49
Group
2015Rm
2014rm
13. Restricted cash
The restricted cash is held by lenders as additional collateral for Textainer’s secured debt facilities and bonds payable (refer to note 19) 450 646
The terms of the bonds payable and the secured debt facility require that a minimum of nine (2014: nine) months’ interest be held as restricted cash. The net operating income of the borrowing company is also required to be placed in a trust account and cannot be withdrawn until the monthly principal and interest payments are made.
14. Inventories
container equipment held for resale 691 298
Trading containers 75 77
766 375
Group Company
2015Rm
2014rm
2015Rm
2014rm
15. Trade and other receivables
Trade receivables 1 456 1 129 – –
prepayments 137 123 1 –
other 337 108 – –
1 930 1 360 1 –
16. Current tax
amounts payable at the beginning of the year 92 76 – –
amounts receivable at the beginning of the year – (3) – –
effect of movements in exchange rates 36 8 – –
recognised in profit or loss
South african normal 40 36 3 1
Foreign normal 30 57 – –
reduced/(excess) tax benefit on equity-settled share-based payments 3 (22) – –
amounts payable at the end of the year (144) (92) – –
amounts paid during the year 57 60 3 1
Group
2015Rm
2014rm
17. Cash and cash equivalents
Bank balances 1 811 1 351
call and term deposits 2 430 1 809
4 241 3 160
Trencor Limited Integrated Annual Report 2015
50
Group Company
2015 2014 2015 2014
Rm rm Rm rm
18. Capital and reserves
Share capital
authorised
ordinary shares of 0,5 cent each
200 000 000 (2014: 200 000 000) 1 1 1 1
issued
ordinary shares of 0,5 cent each
177 068 011 (2014: 177 068 011) 1 1 1 1
18.1 Holders of these shares are entitled to dividends as declared from time to time and are entitled to one vote per share at general meetings of the company.
18.2 no authorisation has been sought from shareholders to place the unissued shares of the company under the control of the directors.
18.3 dividends
dividends declared and paid during the year are as follows:
Final dividend in respect of the financial year 2014 – 195 cents per share (2013: 158 cents per share) 345 279 345 279
interim dividend in respect of the financial year 2015 – 80 cents per share (2014: 72 cents per share) 142 128 142 128
487 407 487 407
a final dividend of 220 cents per share in respect of the financial year ended 31 december 2015 (2014: 195 cents per share) was declared by the board on 25 april 2016. dividend withholding tax at the rate of 15% is applicable to shareholders who are not exempt from this tax, which results in a net dividend of 187 cents per share to these shareholders.
18.4 reservesFair value reserve
The fair value reserve includes the cumulative net change in the fair value, other than impairments, of available-for-sale investments until the investment is derecognised.
Foreign currency translation reserve
The translation reserve comprises all foreign exchange differences arising from the translation of the financial statements of foreign operations.
Share-based payment reserve
The share-based payment reserve comprises the cumulative value of equity-settled share-based payments.
Gain/Loss in changes in ownership interests in subsidiaries
This reserve represents the cumulative net gain in changes in ownership interests in subsidiaries.
Trencor Limited Integrated Annual Report 2015
51
Group
repayment terms
currentinterest rate
% p.a
interestfixed or
indexed to
annualinstalment
rm
Foreign amount
2015 Rm
restated2014
rm2015
US$m2014
uS$m
19. Interest-bearing borrowingsSecured (refer to note 19.1)
Bonds:repayable in monthly instalments, final payment in September 2023 3,90 Fixed 480 232 262 3 607 3 025
repayable in monthly instalments, final payment in october 2024 3,27 Fixed 468 266 296 4 133 3 419
Term loan:partially repayable in 19 quarterly instalments of uS$7,9 million, and a final payment in april 2019 2,11
uS prime or LiBor 491 436 476 6 773 5 489
Debt facilities:Facility – repayments commencing September 2017, final repayment in September 2021 (previously shown as may 2019, should have been September 2021) 2,03 LiBor – 892 852 13 854 9 833
Facility – repayments commencing February 2018, final repayment in February 2020* 2,35 LiBor – 177 165 2 755 1 904
Revolving debt facilities:Facility repayable in full in September 2017 1,67
uS prime or LiBor – 574 685 8 914 7 899
Facility repayable in full in december 2018 (previously shown as april 2016, should have been december 2018) 2,08 LiBor – 130 126 2 011 1 454
Facility – no repayment within revolving period, final repayment estimated in november 2023* 2,54 LiBor
refer to note 19.2 165 170 2 554 1 962
Facility repayable in full in July 2020 1,57 LiBor – 160 – 2 485 –
Unsecured
Obligations under instalment sale agreements: repayable in quarterly instalments, final
payment estimated in december 2022 5,99 – 8,46 Fixedrefer to
note 19.7 19 34 287 398
repayable in quarterly instalments, final payment estimated in June 2025 5,15 Fixed
refer to note 19.7 36 37 562 433
Total 47 935 35 816Less unamortised debt issuance costs 358 279
47 577 35 537Less current portion included in current liabilities 1 571 3 164
46 006 32 373*Terms amended during the financial year.
Trencor Limited Integrated Annual Report 2015
52
19. Interest-bearing borrowings (continued)19.1 The secured loans are secured by way of a pledge against certain of the group entities’ property, plant and
equipment and net investment in finance leases as well as requirements by lenders that the group entities hold restricted cash as additional collateral for borrowings (refer to notes 4, 10 and 13 respectively).
19.2 The facility will convert to a six-year fully amortising note if the initial two-year revolving period is not extended by agreement between the banks and the relevant group entity.
19.3 debt issuance costs of r89 million (2014: r135 million) were capitalised during the year.
19.4 in terms of the memorandum of incorporation, the company’s borrowing powers are unlimited. The company’s borrowings are disclosed in note 8.
19.5 details of borrowing facilities are as follows:
Group
2015restated
2014
Rm rm
Total borrowing facilities 57 452 41 858
actual borrowings at the end of the year 47 935 35 816
unutilised facilities 9 517 6 042
19.6 certain loans have restrictive covenants including minimum net worth requirements, minimum working capital requirements and maintenance of minimum levels of profitability. The borrowing companies were in compliance with the covenants throughout the year.
19.7 repayable out of available free cash flow arising in Tac.
Group Company
2015 2014 2015 2014
Rm rm Rm rm
20. Trade and other payables
Trade payables 173 69 – –
accrued expenses 180 193 4 3
amounts due to container owners 154 109 – –
amounts due in respect of container acquisitions 660 731 – –
other 3 3 3 2
1 170 1 105 7 5
21. Deferred revenue
deferred revenue represents the fair value of the reduced management fee recognised in a business combination in 2012. The deferred revenue is amortised to management fees from date of acquisition to 1 January 2019, the beginning of the period in which an option is held to acquire the remaining shares in the entity subject to the business combination.
Group
2015 2014
Rm rm
Balance at the beginning of the year 37 38
recognised in profit or loss (4) (4)
effect of movements in exchange rates 12 3
Balance at the end of the year 45 37
analysed as:
non-current deferred revenue 40 33
current deferred revenue 5 4
45 37
Trencor Limited Integrated Annual Report 2015
53
Group Company
2015restated
2014 2015 2014
Rm rm Rm rm
22. Operating profit before net finance expenses/(income)
operating profit before net finance expenses/(income) is arrived at after taking into account:
Income
capital distribution from trust – – 419 324
compensation receivable from third party in respect of impairment of property, plant and equipment 98 – – –
net realised and unrealised exchange gains not included in revenue 12 – 12 –
Expenses
amortisation of intangible assets 60 43 – –
auditors’ remuneration 37 21 4 3
audit fee – current year 25 20 4 3
– under provision prior year 12 – – –
other services – 1 – –
directors’ remuneration and benefits 20 18 2 2
executive directors
Short-term employee benefits 13 13 – –
Share-based payments – equity-settled 2 1 – –
non-executive directors
remuneration 4 3 2 2
Share-based payments – equity-settled 1 1 – –
impairment losses incurred/(reversals) – financial assets 60 (47) – –
Finance leases – defaulting customer 37 – – –
Trade and other receivables – loss incurred/(recovered) 64 (19) – –
Trade and other receivables – loss reversed (41) (28) – –
Write-down of inventories 430 123 – –
operating leases – premises 23 19 – –
Share-based payments included in employee benefits expense – equity-settled 91 76 – –
Share-based payments to suppliers – equity-settled 9 10 – –
retirement benefit contributions included in employee benefits expense 8 6 – –
23. Net finance expenses/(income)
Finance expenses – incurred by Textainer and Tac 1 199 1 075 – –
interest expense 1 025 990 – –
realised and unrealised losses on derivative financial instruments 174 85 – –
Finance income
interest income
received on cash and cash equivalents (23) (13) – –
1 176 1 062 – –
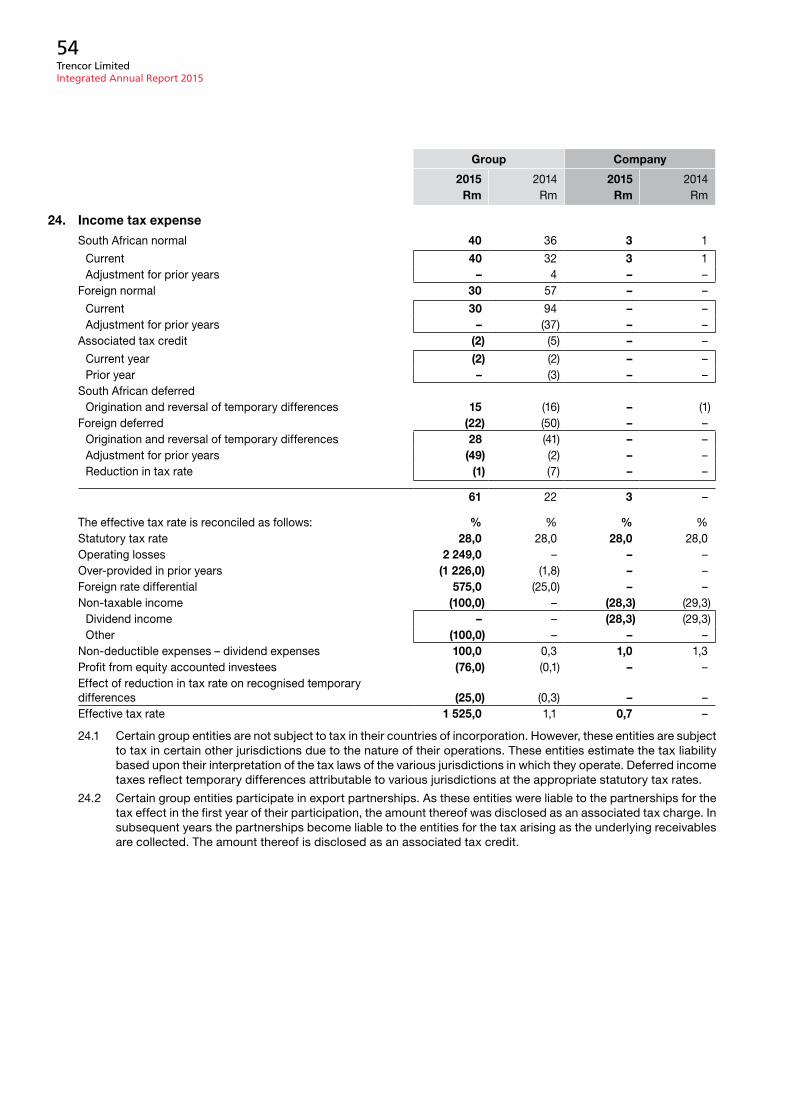
Trencor Limited Integrated Annual Report 2015
54
Group Company
2015 2014 2015 2014Rm rm Rm rm
24. Income tax expense
South african normal 40 36 3 1
current 40 32 3 1adjustment for prior years – 4 – –
Foreign normal 30 57 – –
current 30 94 – –adjustment for prior years – (37) – –
associated tax credit (2) (5) – –
current year (2) (2) – –prior year – (3) – –
South african deferredorigination and reversal of temporary differences 15 (16) – (1)
Foreign deferred (22) (50) – –origination and reversal of temporary differences 28 (41) – –adjustment for prior years (49) (2) – –reduction in tax rate (1) (7) – –
61 22 3 –
The effective tax rate is reconciled as follows: % % % %Statutory tax rate 28,0 28,0 28,0 28,0 operating losses 2 249,0 – – – over-provided in prior years (1 226,0) (1,8) – – Foreign rate differential 575,0 (25,0) – – non-taxable income (100,0) – (28,3) (29,3)
dividend income – – (28,3) (29,3)other (100,0) – – –
non-deductible expenses – dividend expenses 100,0 0,3 1,0 1,3 profit from equity accounted investees (76,0) (0,1) – – effect of reduction in tax rate on recognised temporarydifferences (25,0) (0,3) – – effective tax rate 1 525,0 1,1 0,7 –
24.1 certain group entities are not subject to tax in their countries of incorporation. However, these entities are subject to tax in certain other jurisdictions due to the nature of their operations. These entities estimate the tax liability based upon their interpretation of the tax laws of the various jurisdictions in which they operate. deferred income taxes reflect temporary differences attributable to various jurisdictions at the appropriate statutory tax rates.
24.2 certain group entities participate in export partnerships. as these entities were liable to the partnerships for the tax effect in the first year of their participation, the amount thereof was disclosed as an associated tax charge. in subsequent years the partnerships become liable to the entities for the tax arising as the underlying receivables are collected. The amount thereof is disclosed as an associated tax credit.
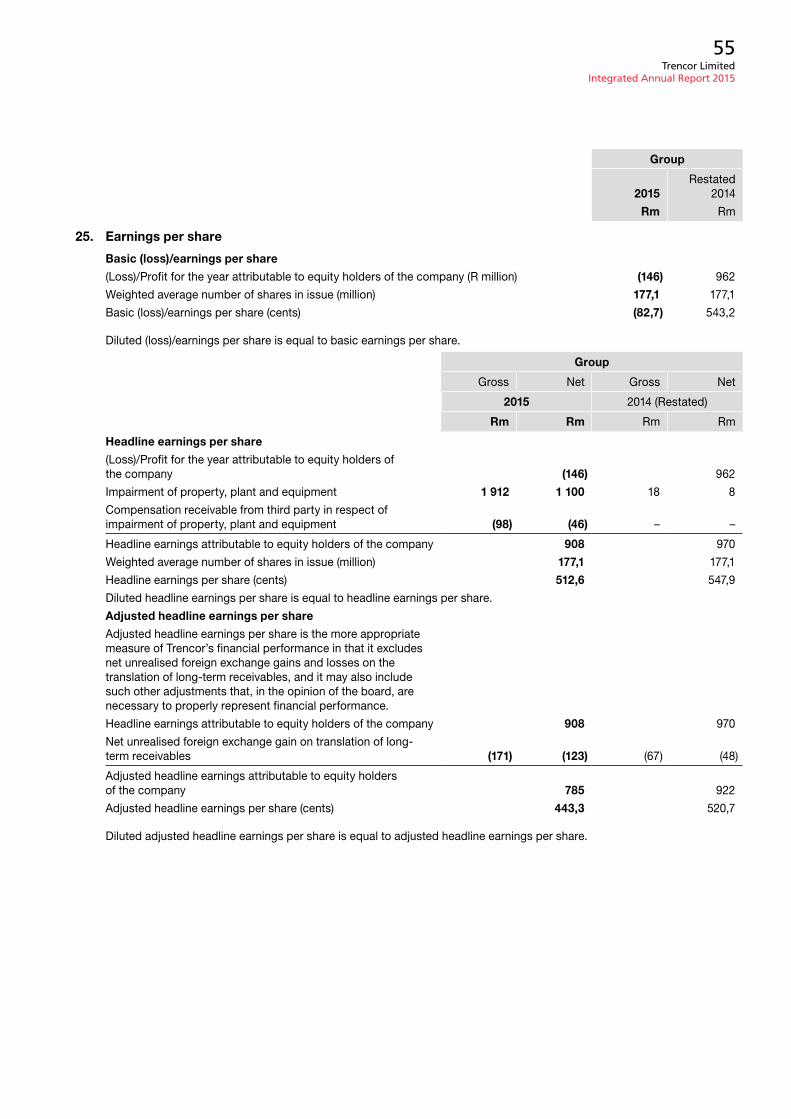
Trencor Limited Integrated Annual Report 2015
55
Group
2015restated
2014
Rm rm
25. Earnings per share
Basic (loss)/earnings per share
(Loss)/profit for the year attributable to equity holders of the company (r million) (146) 962
Weighted average number of shares in issue (million) 177,1 177,1
Basic (loss)/earnings per share (cents) (82,7) 543,2
diluted (loss)/earnings per share is equal to basic earnings per share.
Group
gross net gross net
2015 2014 (restated)
Rm Rm rm rm
Headline earnings per share
(Loss)/profit for the year attributable to equity holders of the company (146) 962
impairment of property, plant and equipment 1 912 1 100 18 8
compensation receivable from third party in respect of impairment of property, plant and equipment (98) (46) – –
Headline earnings attributable to equity holders of the company 908 970
Weighted average number of shares in issue (million) 177,1 177,1
Headline earnings per share (cents) 512,6 547,9
diluted headline earnings per share is equal to headline earnings per share.
Adjusted headline earnings per share
adjusted headline earnings per share is the more appropriate measure of Trencor’s financial performance in that it excludes net unrealised foreign exchange gains and losses on the translation of long-term receivables, and it may also include such other adjustments that, in the opinion of the board, are necessary to properly represent financial performance.
Headline earnings attributable to equity holders of the company 908 970
net unrealised foreign exchange gain on translation of long-term receivables (171) (123) (67) (48)
adjusted headline earnings attributable to equity holders of the company 785 922
adjusted headline earnings per share (cents) 443,3 520,7
diluted adjusted headline earnings per share is equal to adjusted headline earnings per share.
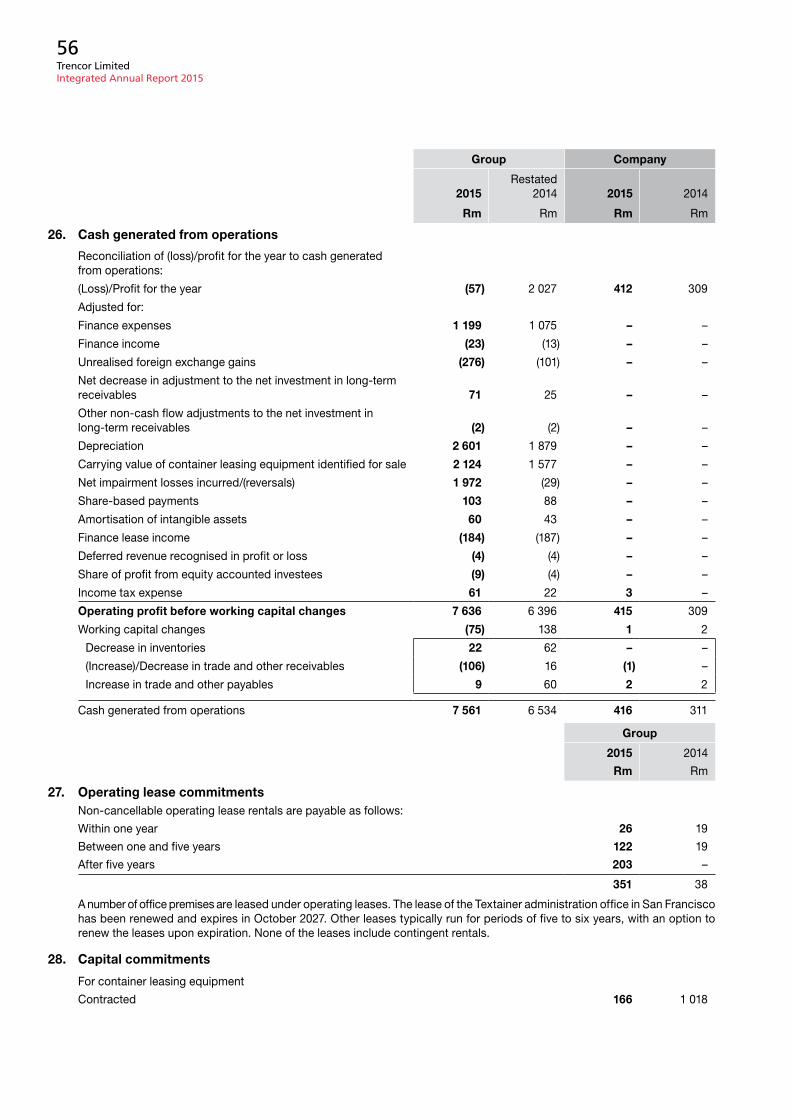
Trencor Limited Integrated Annual Report 2015
56
Group Company
2015restated
2014 2015 2014
Rm rm Rm rm
26. Cash generated from operations
reconciliation of (loss)/profit for the year to cash generated from operations:
(Loss)/profit for the year (57) 2 027 412 309
adjusted for:
Finance expenses 1 199 1 075 – –
Finance income (23) (13) – –
unrealised foreign exchange gains (276) (101) – –
net decrease in adjustment to the net investment in long-term receivables 71 25 – –
other non-cash flow adjustments to the net investment in long-term receivables (2) (2) – –
depreciation 2 601 1 879 – –
carrying value of container leasing equipment identified for sale 2 124 1 577 – –
net impairment losses incurred/(reversals) 1 972 (29) – –
Share-based payments 103 88 – –
amortisation of intangible assets 60 43 – –
Finance lease income (184) (187) – –
deferred revenue recognised in profit or loss (4) (4) – –
Share of profit from equity accounted investees (9) (4) – –
income tax expense 61 22 3 –
Operating profit before working capital changes 7 636 6 396 415 309
Working capital changes (75) 138 1 2
decrease in inventories 22 62 – –
(increase)/decrease in trade and other receivables (106) 16 (1) –
increase in trade and other payables 9 60 2 2
cash generated from operations 7 561 6 534 416 311
Group
2015 2014
Rm rm
27. Operating lease commitmentsnon-cancellable operating lease rentals are payable as follows:
Within one year 26 19
Between one and five years 122 19
after five years 203 –
351 38
a number of office premises are leased under operating leases. The lease of the Textainer administration office in San Francisco has been renewed and expires in october 2027. other leases typically run for periods of five to six years, with an option to renew the leases upon expiration. none of the leases include contingent rentals.
28. Capital commitments
For container leasing equipment
contracted 166 1 018
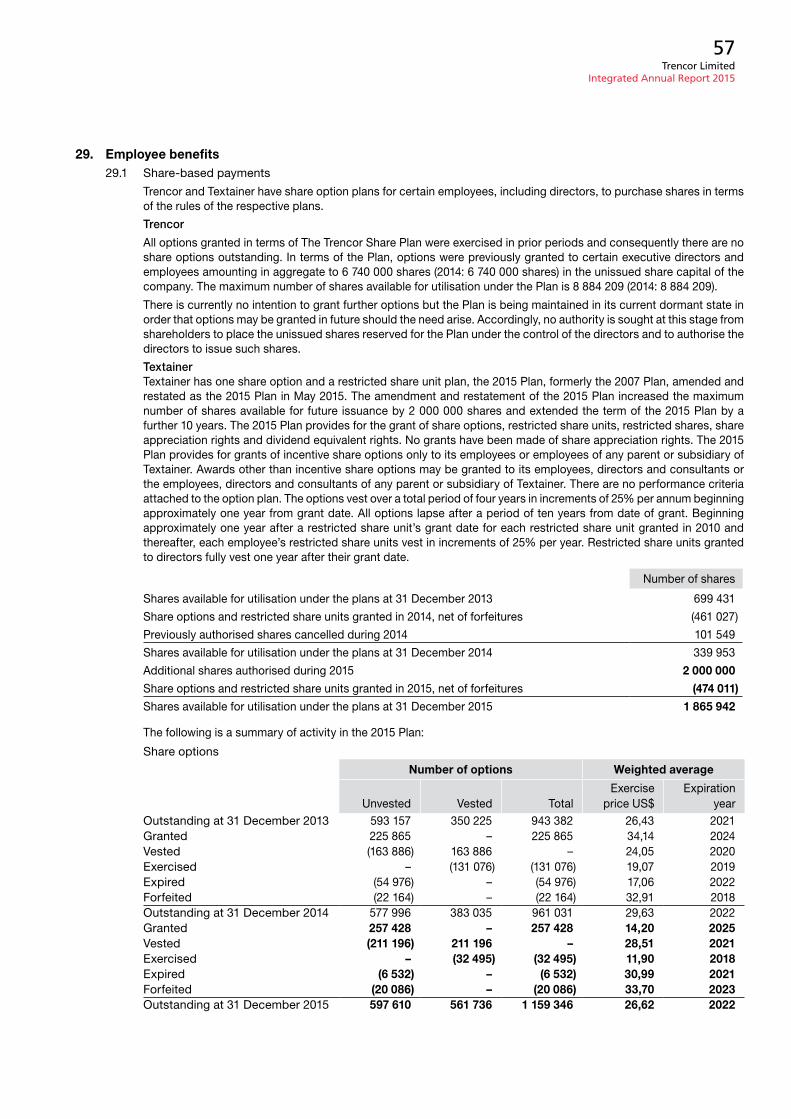
Trencor Limited Integrated Annual Report 2015
57
29. Employee benefits29.1 Share-based payments
Trencor and Textainer have share option plans for certain employees, including directors, to purchase shares in terms of the rules of the respective plans.
Trencor
all options granted in terms of The Trencor Share plan were exercised in prior periods and consequently there are no share options outstanding. in terms of the plan, options were previously granted to certain executive directors and employees amounting in aggregate to 6 740 000 shares (2014: 6 740 000 shares) in the unissued share capital of the company. The maximum number of shares available for utilisation under the plan is 8 884 209 (2014: 8 884 209).
There is currently no intention to grant further options but the plan is being maintained in its current dormant state in order that options may be granted in future should the need arise. accordingly, no authority is sought at this stage from shareholders to place the unissued shares reserved for the plan under the control of the directors and to authorise the directors to issue such shares.
TextainerTextainer has one share option and a restricted share unit plan, the 2015 plan, formerly the 2007 plan, amended and restated as the 2015 plan in may 2015. The amendment and restatement of the 2015 plan increased the maximum number of shares available for future issuance by 2 000 000 shares and extended the term of the 2015 plan by a further 10 years. The 2015 plan provides for the grant of share options, restricted share units, restricted shares, share appreciation rights and dividend equivalent rights. no grants have been made of share appreciation rights. The 2015 plan provides for grants of incentive share options only to its employees or employees of any parent or subsidiary of Textainer. awards other than incentive share options may be granted to its employees, directors and consultants or the employees, directors and consultants of any parent or subsidiary of Textainer. There are no performance criteria attached to the option plan. The options vest over a total period of four years in increments of 25% per annum beginning approximately one year from grant date. all options lapse after a period of ten years from date of grant. Beginning approximately one year after a restricted share unit’s grant date for each restricted share unit granted in 2010 and thereafter, each employee’s restricted share units vest in increments of 25% per year. restricted share units granted to directors fully vest one year after their grant date.
number of shares
Shares available for utilisation under the plans at 31 december 2013 699 431
Share options and restricted share units granted in 2014, net of forfeitures (461 027)
previously authorised shares cancelled during 2014 101 549
Shares available for utilisation under the plans at 31 december 2014 339 953
additional shares authorised during 2015 2 000 000
Share options and restricted share units granted in 2015, net of forfeitures (474 011)
Shares available for utilisation under the plans at 31 december 2015 1 865 942
The following is a summary of activity in the 2015 plan:
Share options
Number of options Weighted average
exercise expirationunvested Vested Total price uS$ year
outstanding at 31 december 2013 593 157 350 225 943 382 26,43 2021granted 225 865 – 225 865 34,14 2024Vested (163 886) 163 886 – 24,05 2020exercised – (131 076) (131 076) 19,07 2019expired (54 976) – (54 976) 17,06 2022Forfeited (22 164) – (22 164) 32,91 2018outstanding at 31 december 2014 577 996 383 035 961 031 29,63 2022granted 257 428 – 257 428 14,20 2025Vested (211 196) 211 196 – 28,51 2021exercised – (32 495) (32 495) 11,90 2018expired (6 532) – (6 532) 30,99 2021Forfeited (20 086) – (20 086) 33,70 2023outstanding at 31 december 2015 597 610 561 736 1 159 346 26,62 2022
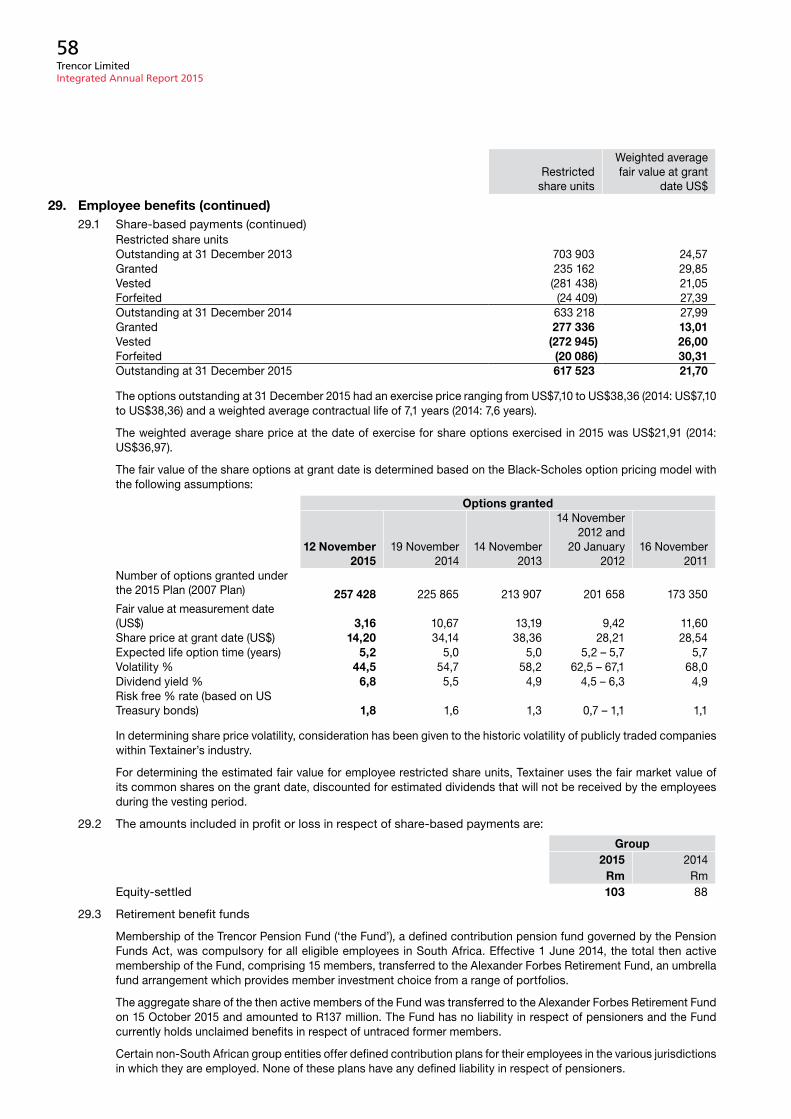
Trencor Limited Integrated Annual Report 2015
58
restricted share units
Weighted averagefair value at grant
date uS$
29. Employee benefits (continued)29.1 Share-based payments (continued)
restricted share unitsoutstanding at 31 december 2013 703 903 24,57granted 235 162 29,85Vested (281 438) 21,05Forfeited (24 409) 27,39outstanding at 31 december 2014 633 218 27,99granted 277 336 13,01Vested (272 945) 26,00Forfeited (20 086) 30,31outstanding at 31 december 2015 617 523 21,70
The options outstanding at 31 december 2015 had an exercise price ranging from uS$7,10 to uS$38,36 (2014: uS$7,10 to uS$38,36) and a weighted average contractual life of 7,1 years (2014: 7,6 years).
The weighted average share price at the date of exercise for share options exercised in 2015 was uS$21,91 (2014: uS$36,97).
The fair value of the share options at grant date is determined based on the Black-Scholes option pricing model with the following assumptions:
Options granted
12 November 2015
19 november 2014
14 november 2013
14 november 2012 and
20 January 2012
16 november2011
number of options granted under the 2015 plan (2007 plan) 257 428 225 865 213 907 201 658 173 350Fair value at measurement date (uS$) 3,16 10,67 13,19 9,42 11,60Share price at grant date (uS$) 14,20 34,14 38,36 28,21 28,54expected life option time (years) 5,2 5,0 5,0 5,2 – 5,7 5,7Volatility % 44,5 54,7 58,2 62,5 – 67,1 68,0dividend yield % 6,8 5,5 4,9 4,5 – 6,3 4,9risk free % rate (based on uS Treasury bonds) 1,8 1,6 1,3 0,7 – 1,1 1,1
in determining share price volatility, consideration has been given to the historic volatility of publicly traded companies within Textainer’s industry.
For determining the estimated fair value for employee restricted share units, Textainer uses the fair market value of its common shares on the grant date, discounted for estimated dividends that will not be received by the employees during the vesting period.
29.2 The amounts included in profit or loss in respect of share-based payments are:
Group2015 2014
Rm rmequity-settled 103 88
29.3 retirement benefit funds
membership of the Trencor pension Fund (‘the Fund’), a defined contribution pension fund governed by the pension Funds act, was compulsory for all eligible employees in South africa. effective 1 June 2014, the total then active membership of the Fund, comprising 15 members, transferred to the alexander Forbes retirement Fund, an umbrella fund arrangement which provides member investment choice from a range of portfolios.
The aggregate share of the then active members of the Fund was transferred to the alexander Forbes retirement Fund on 15 october 2015 and amounted to r137 million. The Fund has no liability in respect of pensioners and the Fund currently holds unclaimed benefits in respect of untraced former members.
certain non-South african group entities offer defined contribution plans for their employees in the various jurisdictions in which they are employed. none of these plans have any defined liability in respect of pensioners.
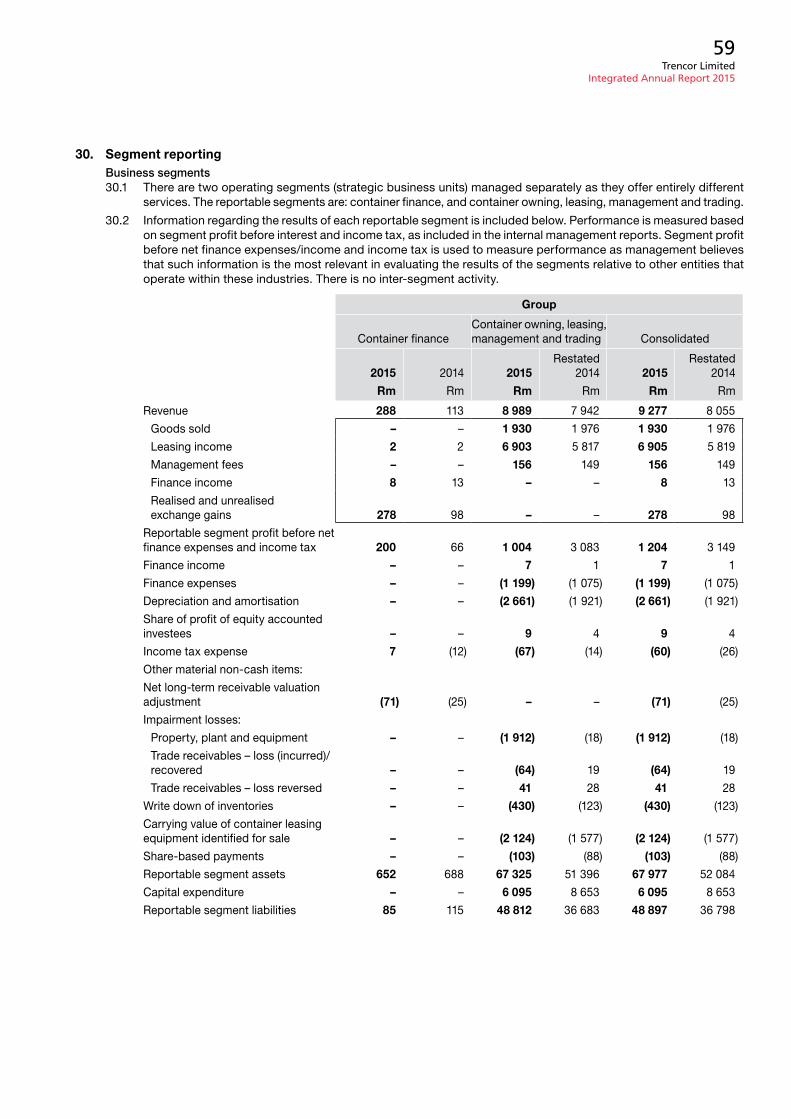
Trencor Limited Integrated Annual Report 2015
59
30. Segment reportingBusiness segments30.1 There are two operating segments (strategic business units) managed separately as they offer entirely different
services. The reportable segments are: container finance, and container owning, leasing, management and trading.
30.2 information regarding the results of each reportable segment is included below. performance is measured based on segment profit before interest and income tax, as included in the internal management reports. Segment profit before net finance expenses/income and income tax is used to measure performance as management believes that such information is the most relevant in evaluating the results of the segments relative to other entities that operate within these industries. There is no inter-segment activity.
Group
container financecontainer owning, leasing, management and trading consolidated
2015 2014 2015restated
2014 2015restated
2014
Rm rm Rm rm Rm rm
revenue 288 113 8 989 7 942 9 277 8 055
goods sold – – 1 930 1 976 1 930 1 976
Leasing income 2 2 6 903 5 817 6 905 5 819
management fees – – 156 149 156 149
Finance income 8 13 – – 8 13
realised and unrealised exchange gains 278 98 – – 278 98
reportable segment profit before net finance expenses and income tax 200 66 1 004 3 083 1 204 3 149
Finance income – – 7 1 7 1
Finance expenses – – (1 199) (1 075) (1 199) (1 075)
depreciation and amortisation – – (2 661) (1 921) (2 661) (1 921)
Share of profit of equity accounted investees – – 9 4 9 4
income tax expense 7 (12) (67) (14) (60) (26)
other material non-cash items:
net long-term receivable valuation adjustment (71) (25) – – (71) (25)
impairment losses:
property, plant and equipment – – (1 912) (18) (1 912) (18)
Trade receivables – loss (incurred)/recovered – – (64) 19 (64) 19
Trade receivables – loss reversed – – 41 28 41 28
Write down of inventories – – (430) (123) (430) (123)
carrying value of container leasing equipment identified for sale – – (2 124) (1 577) (2 124) (1 577)
Share-based payments – – (103) (88) (103) (88)
reportable segment assets 652 688 67 325 51 396 67 977 52 084
capital expenditure – – 6 095 8 653 6 095 8 653
reportable segment liabilities 85 115 48 812 36 683 48 897 36 798
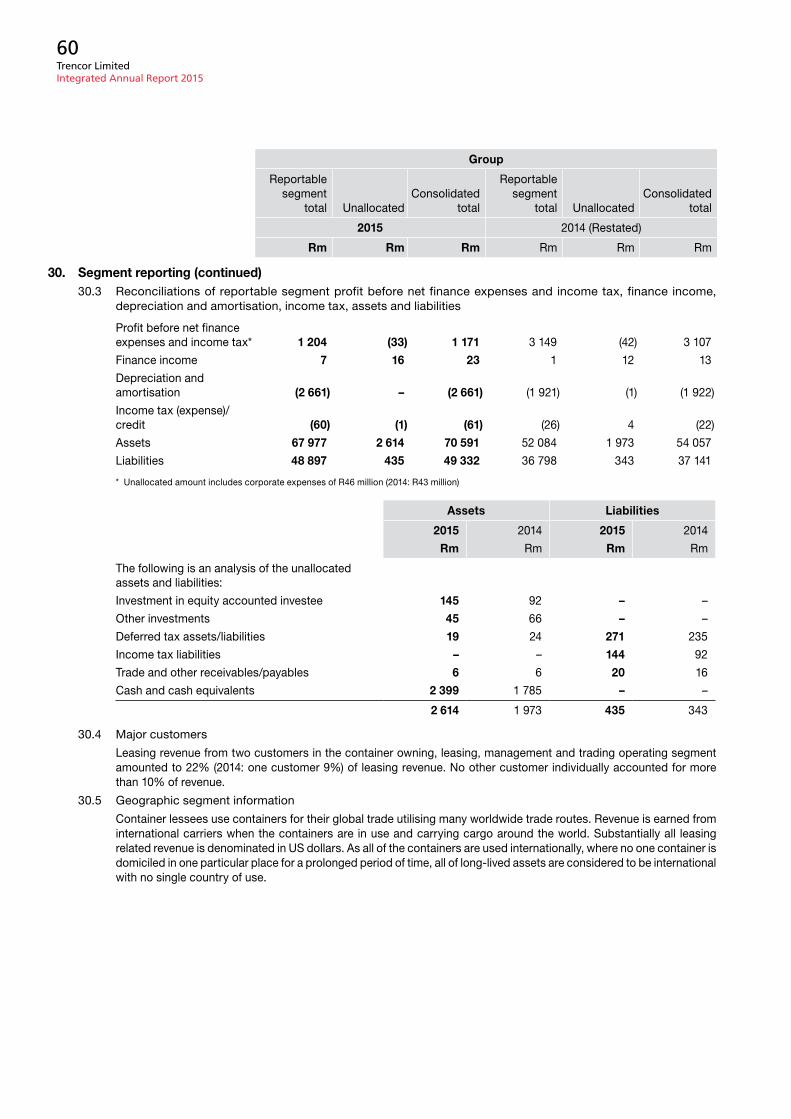
Trencor Limited Integrated Annual Report 2015
60
Group
reportablesegment
total unallocatedconsolidated
total
reportablesegment
total unallocatedconsolidated
total
2015 2014 (restated)
Rm Rm Rm rm rm rm
30. Segment reporting (continued)30.3 reconciliations of reportable segment profit before net finance expenses and income tax, finance income,
depreciation and amortisation, income tax, assets and liabilities
profit before net finance expenses and income tax* 1 204 (33) 1 171 3 149 (42) 3 107
Finance income 7 16 23 1 12 13
depreciation and amortisation (2 661) – (2 661) (1 921) (1) (1 922)
income tax (expense)/credit (60) (1) (61) (26) 4 (22)
assets 67 977 2 614 70 591 52 084 1 973 54 057
Liabilities 48 897 435 49 332 36 798 343 37 141
* unallocated amount includes corporate expenses of r46 million (2014: r43 million)
Assets Liabilities
2015 2014 2015 2014
Rm rm Rm rm
The following is an analysis of the unallocated assets and liabilities:
investment in equity accounted investee 145 92 – –
other investments 45 66 – –
deferred tax assets/liabilities 19 24 271 235
income tax liabilities – – 144 92
Trade and other receivables/payables 6 6 20 16
cash and cash equivalents 2 399 1 785 – –
2 614 1 973 435 343
30.4 major customers
Leasing revenue from two customers in the container owning, leasing, management and trading operating segment amounted to 22% (2014: one customer 9%) of leasing revenue. no other customer individually accounted for more than 10% of revenue.
30.5 geographic segment information
container lessees use containers for their global trade utilising many worldwide trade routes. revenue is earned from international carriers when the containers are in use and carrying cargo around the world. Substantially all leasing related revenue is denominated in uS dollars. as all of the containers are used internationally, where no one container is domiciled in one particular place for a prolonged period of time, all of long-lived assets are considered to be international with no single country of use.
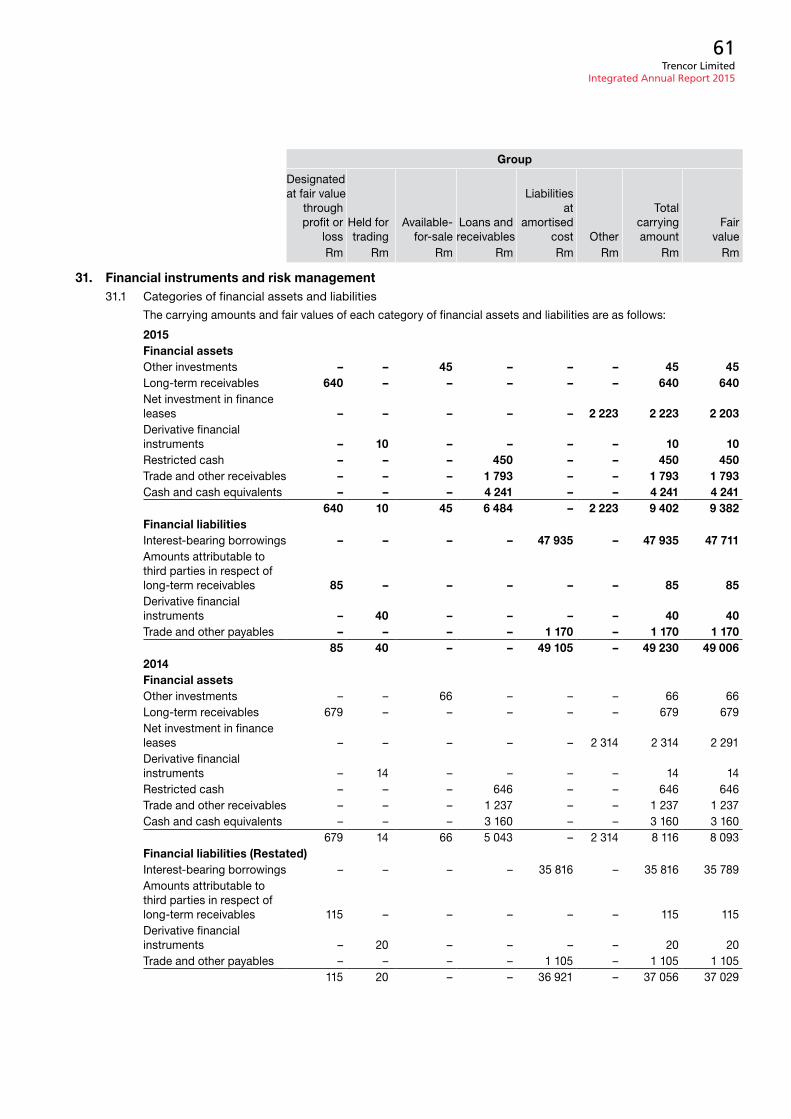
Trencor Limited Integrated Annual Report 2015
61
Group
designatedat fair value
throughprofit or
lossHeld fortrading
available-for-sale
Loans andreceivables
Liabilities at
amortised cost other
Totalcarryingamount
Fairvalue
rm rm rm rm rm rm rm rm
31. Financial instruments and risk management31.1 categories of financial assets and liabilities
The carrying amounts and fair values of each category of financial assets and liabilities are as follows:
2015Financial assetsother investments – – 45 – – – 45 45Long-term receivables 640 – – – – – 640 640net investment in finance leases – – – – – 2 223 2 223 2 203derivative financial instruments – 10 – – – – 10 10restricted cash – – – 450 – – 450 450Trade and other receivables – – – 1 793 – – 1 793 1 793cash and cash equivalents – – – 4 241 – – 4 241 4 241
640 10 45 6 484 – 2 223 9 402 9 382Financial liabilitiesinterest-bearing borrowings – – – – 47 935 – 47 935 47 711amounts attributable to third parties in respect of long-term receivables 85 – – – – – 85 85derivative financial instruments – 40 – – – – 40 40Trade and other payables – – – – 1 170 – 1 170 1 170
85 40 – – 49 105 – 49 230 49 0062014Financial assetsother investments – – 66 – – – 66 66Long-term receivables 679 – – – – – 679 679net investment in finance leases – – – – – 2 314 2 314 2 291derivative financial instruments – 14 – – – – 14 14restricted cash – – – 646 – – 646 646Trade and other receivables – – – 1 237 – – 1 237 1 237cash and cash equivalents – – – 3 160 – – 3 160 3 160
679 14 66 5 043 – 2 314 8 116 8 093Financial liabilities (Restated)interest-bearing borrowings – – – – 35 816 – 35 816 35 789amounts attributable to third parties in respect of long-term receivables 115 – – – – – 115 115derivative financial instruments – 20 – – – – 20 20Trade and other payables – – – – 1 105 – 1 105 1 105
115 20 – – 36 921 – 37 056 37 029
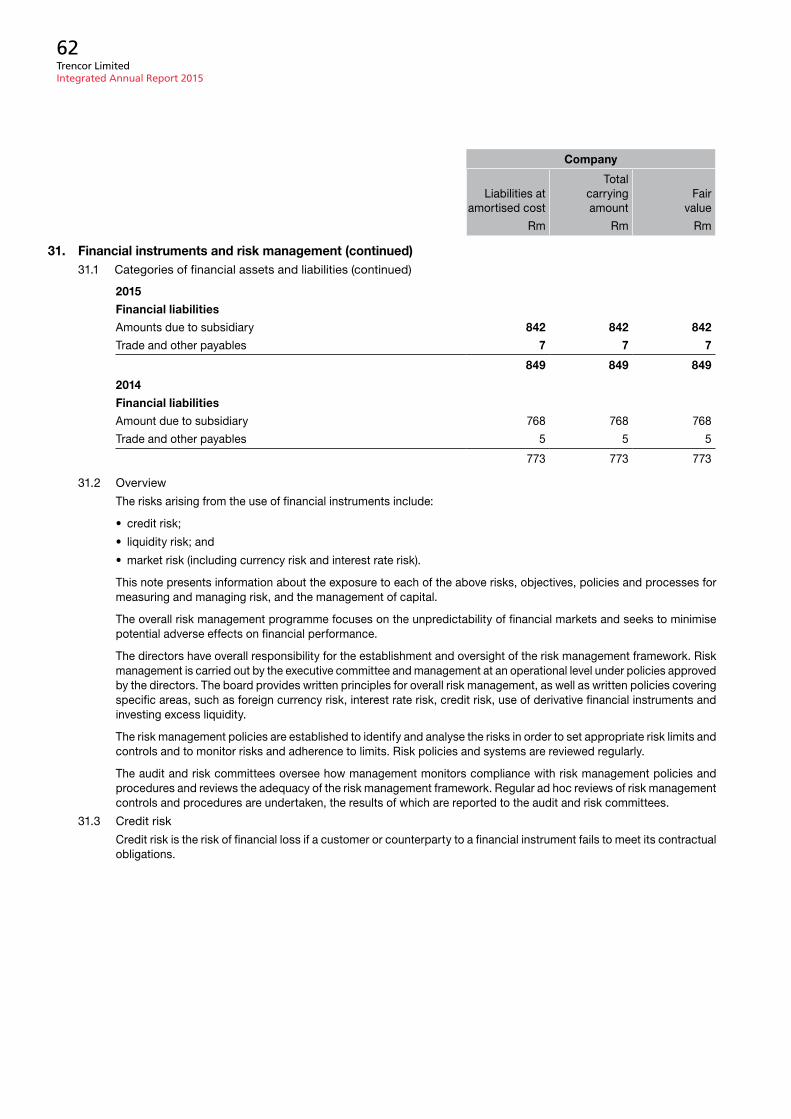
Trencor Limited Integrated Annual Report 2015
62
Company
Liabilities atamortised cost
Totalcarryingamount
Fairvalue
rm rm rm
31. Financial instruments and risk management (continued)31.1 categories of financial assets and liabilities (continued)
2015
Financial liabilities
amounts due to subsidiary 842 842 842
Trade and other payables 7 7 7
849 849 849
2014
Financial liabilities
amount due to subsidiary 768 768 768
Trade and other payables 5 5 5
773 773 773
31.2 overview
The risks arising from the use of financial instruments include:
• credit risk;
• liquidity risk; and
• market risk (including currency risk and interest rate risk).
This note presents information about the exposure to each of the above risks, objectives, policies and processes for measuring and managing risk, and the management of capital.
The overall risk management programme focuses on the unpredictability of financial markets and seeks to minimise potential adverse effects on financial performance.
The directors have overall responsibility for the establishment and oversight of the risk management framework. risk management is carried out by the executive committee and management at an operational level under policies approved by the directors. The board provides written principles for overall risk management, as well as written policies covering specific areas, such as foreign currency risk, interest rate risk, credit risk, use of derivative financial instruments and investing excess liquidity.
The risk management policies are established to identify and analyse the risks in order to set appropriate risk limits and controls and to monitor risks and adherence to limits. risk policies and systems are reviewed regularly.
The audit and risk committees oversee how management monitors compliance with risk management policies and procedures and reviews the adequacy of the risk management framework. regular ad hoc reviews of risk management controls and procedures are undertaken, the results of which are reported to the audit and risk committees.
31.3 credit risk
credit risk is the risk of financial loss if a customer or counterparty to a financial instrument fails to meet its contractual obligations.
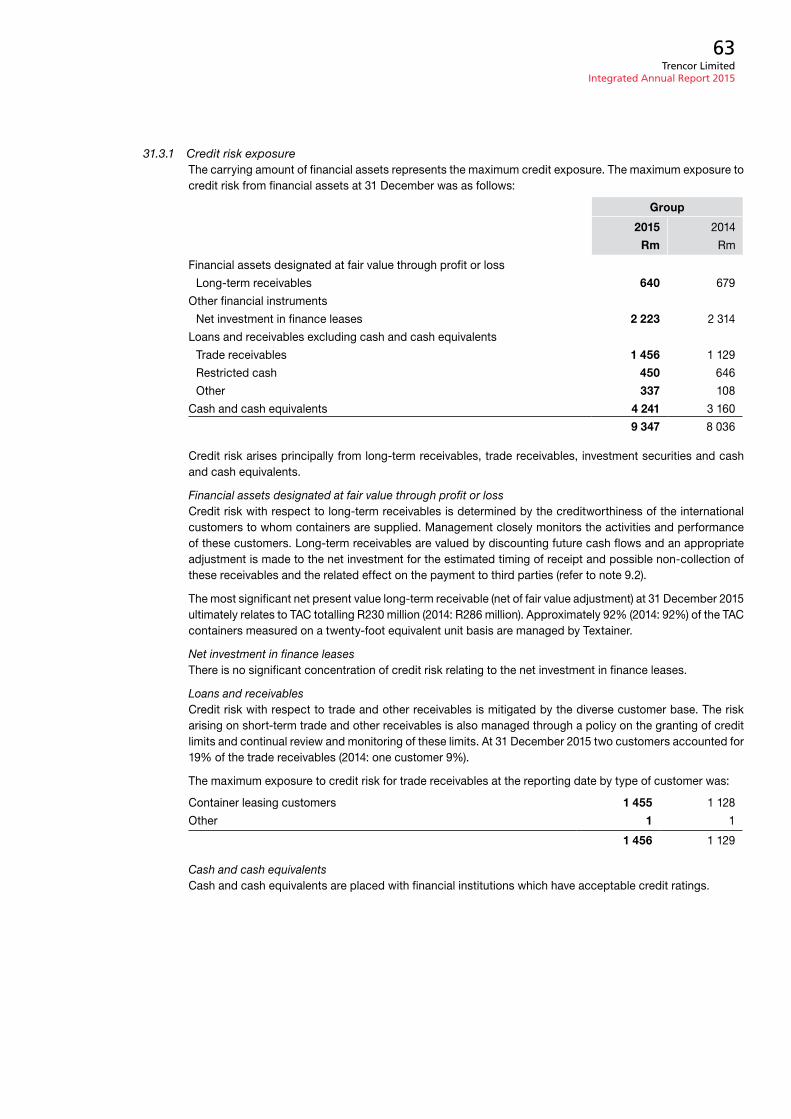
Trencor Limited Integrated Annual Report 2015
63
31.3.1 Credit risk exposureThe carrying amount of financial assets represents the maximum credit exposure. The maximum exposure to credit risk from financial assets at 31 december was as follows:
Group
2015 2014
Rm rm
Financial assets designated at fair value through profit or loss
Long-term receivables 640 679
other financial instruments
net investment in finance leases 2 223 2 314
Loans and receivables excluding cash and cash equivalents
Trade receivables 1 456 1 129
restricted cash 450 646
other 337 108
cash and cash equivalents 4 241 3 160
9 347 8 036
credit risk arises principally from long-term receivables, trade receivables, investment securities and cash and cash equivalents.
Financial assets designated at fair value through profit or losscredit risk with respect to long-term receivables is determined by the creditworthiness of the international customers to whom containers are supplied. management closely monitors the activities and performance of these customers. Long-term receivables are valued by discounting future cash flows and an appropriate adjustment is made to the net investment for the estimated timing of receipt and possible non-collection of these receivables and the related effect on the payment to third parties (refer to note 9.2).
The most significant net present value long-term receivable (net of fair value adjustment) at 31 december 2015 ultimately relates to Tac totalling r230 million (2014: r286 million). approximately 92% (2014: 92%) of the Tac containers measured on a twenty-foot equivalent unit basis are managed by Textainer.
Net investment in finance leases There is no significant concentration of credit risk relating to the net investment in finance leases.
Loans and receivablescredit risk with respect to trade and other receivables is mitigated by the diverse customer base. The risk arising on short-term trade and other receivables is also managed through a policy on the granting of credit limits and continual review and monitoring of these limits. at 31 december 2015 two customers accounted for 19% of the trade receivables (2014: one customer 9%).
The maximum exposure to credit risk for trade receivables at the reporting date by type of customer was:
container leasing customers 1 455 1 128
other 1 1
1 456 1 129
Cash and cash equivalentscash and cash equivalents are placed with financial institutions which have acceptable credit ratings.
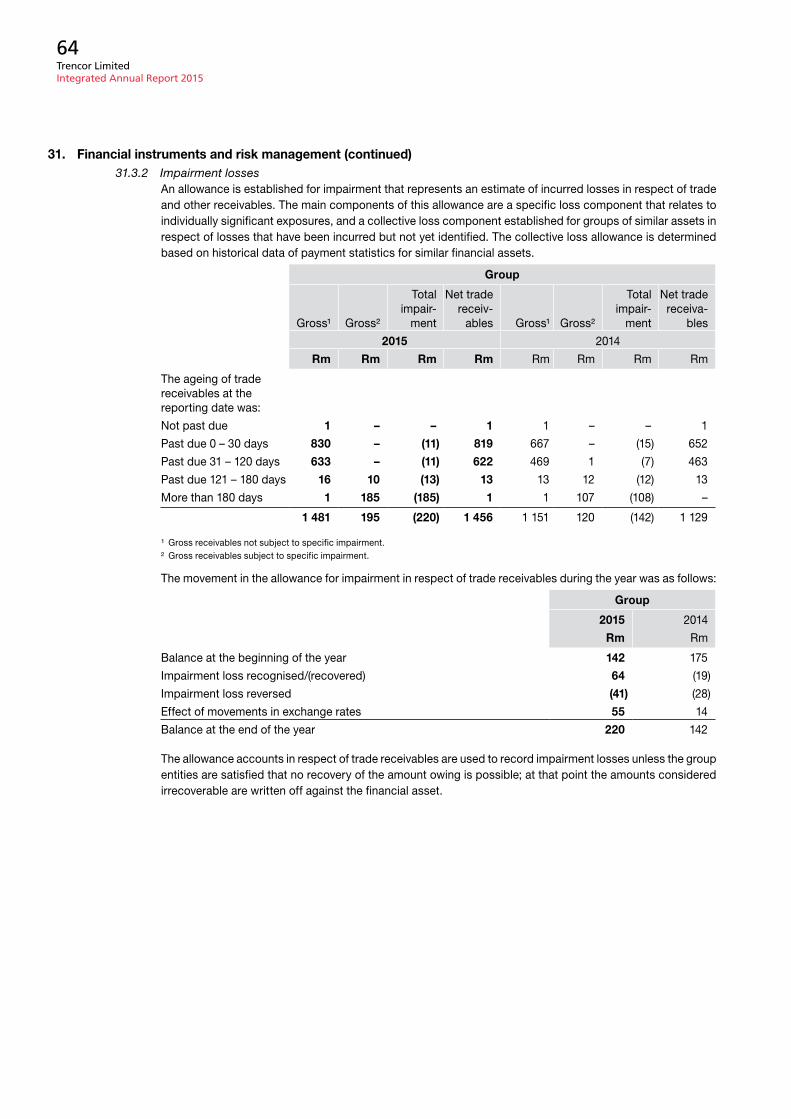
Trencor Limited Integrated Annual Report 2015
64
31. Financial instruments and risk management (continued)31.3.2 Impairment losses
an allowance is established for impairment that represents an estimate of incurred losses in respect of trade and other receivables. The main components of this allowance are a specific loss component that relates to individually significant exposures, and a collective loss component established for groups of similar assets in respect of losses that have been incurred but not yet identified. The collective loss allowance is determined based on historical data of payment statistics for similar financial assets.
Group
gross¹ gross²
Totalimpair-
ment
net tradereceiv-
ables gross¹ gross²
Totalimpair-
ment
net tradereceiva-
bles
2015 2014
Rm Rm Rm Rm rm rm rm rm
The ageing of trade receivables at the reporting date was:
not past due 1 – – 1 1 – – 1
past due 0 – 30 days 830 – (11) 819 667 – (15) 652
past due 31 – 120 days 633 – (11) 622 469 1 (7) 463
past due 121 – 180 days 16 10 (13) 13 13 12 (12) 13
more than 180 days 1 185 (185) 1 1 107 (108) –
1 481 195 (220) 1 456 1 151 120 (142) 1 129
¹ gross receivables not subject to specific impairment.² gross receivables subject to specific impairment.
The movement in the allowance for impairment in respect of trade receivables during the year was as follows:
Group
2015 2014
Rm rm
Balance at the beginning of the year 142 175
impairment loss recognised/(recovered) 64 (19)
impairment loss reversed (41) (28)
effect of movements in exchange rates 55 14
Balance at the end of the year 220 142
The allowance accounts in respect of trade receivables are used to record impairment losses unless the group entities are satisfied that no recovery of the amount owing is possible; at that point the amounts considered irrecoverable are written off against the financial asset.
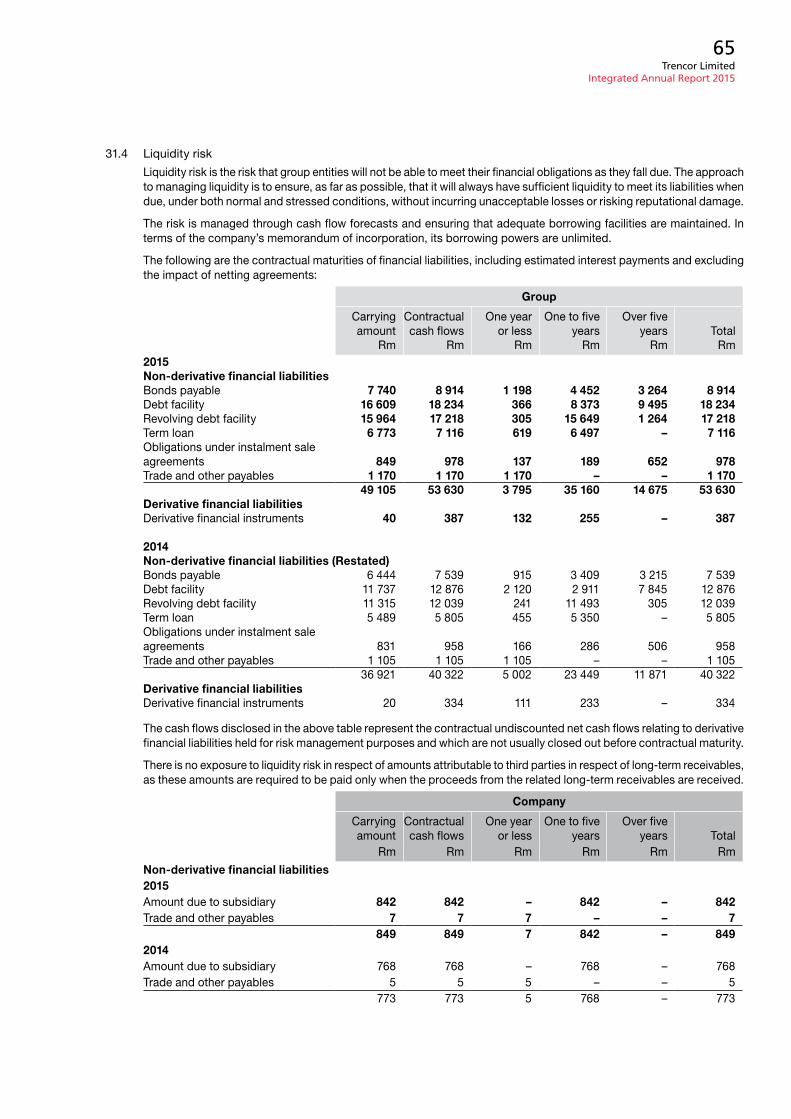
Trencor Limited Integrated Annual Report 2015
65
31.4 Liquidity risk
Liquidity risk is the risk that group entities will not be able to meet their financial obligations as they fall due. The approach to managing liquidity is to ensure, as far as possible, that it will always have sufficient liquidity to meet its liabilities when due, under both normal and stressed conditions, without incurring unacceptable losses or risking reputational damage.
The risk is managed through cash flow forecasts and ensuring that adequate borrowing facilities are maintained. in terms of the company’s memorandum of incorporation, its borrowing powers are unlimited.
The following are the contractual maturities of financial liabilities, including estimated interest payments and excluding the impact of netting agreements:
Group
carrying amount
contractual cash flows
one year or less
one to five years
over five years Total
rm rm rm rm rm rm2015Non-derivative financial liabilitiesBonds payable 7 740 8 914 1 198 4 452 3 264 8 914debt facility 16 609 18 234 366 8 373 9 495 18 234revolving debt facility 15 964 17 218 305 15 649 1 264 17 218Term loan 6 773 7 116 619 6 497 – 7 116obligations under instalment sale agreements 849 978 137 189 652 978Trade and other payables 1 170 1 170 1 170 – – 1 170
49 105 53 630 3 795 35 160 14 675 53 630Derivative financial liabilitiesderivative financial instruments 40 387 132 255 – 387
2014Non-derivative financial liabilities (Restated)Bonds payable 6 444 7 539 915 3 409 3 215 7 539debt facility 11 737 12 876 2 120 2 911 7 845 12 876revolving debt facility 11 315 12 039 241 11 493 305 12 039Term loan 5 489 5 805 455 5 350 – 5 805obligations under instalment sale agreements 831 958 166 286 506 958Trade and other payables 1 105 1 105 1 105 – – 1 105
36 921 40 322 5 002 23 449 11 871 40 322Derivative financial liabilitiesderivative financial instruments 20 334 111 233 – 334
The cash flows disclosed in the above table represent the contractual undiscounted net cash flows relating to derivative financial liabilities held for risk management purposes and which are not usually closed out before contractual maturity.
There is no exposure to liquidity risk in respect of amounts attributable to third parties in respect of long-term receivables, as these amounts are required to be paid only when the proceeds from the related long-term receivables are received.
Company
carrying amount
contractual cash flows
one year or less
one to five years
over five years Total
rm rm rm rm rm rm
Non-derivative financial liabilities2015amount due to subsidiary 842 842 – 842 – 842Trade and other payables 7 7 7 – – 7
849 849 7 842 – 8492014amount due to subsidiary 768 768 – 768 – 768Trade and other payables 5 5 5 – – 5
773 773 5 768 – 773
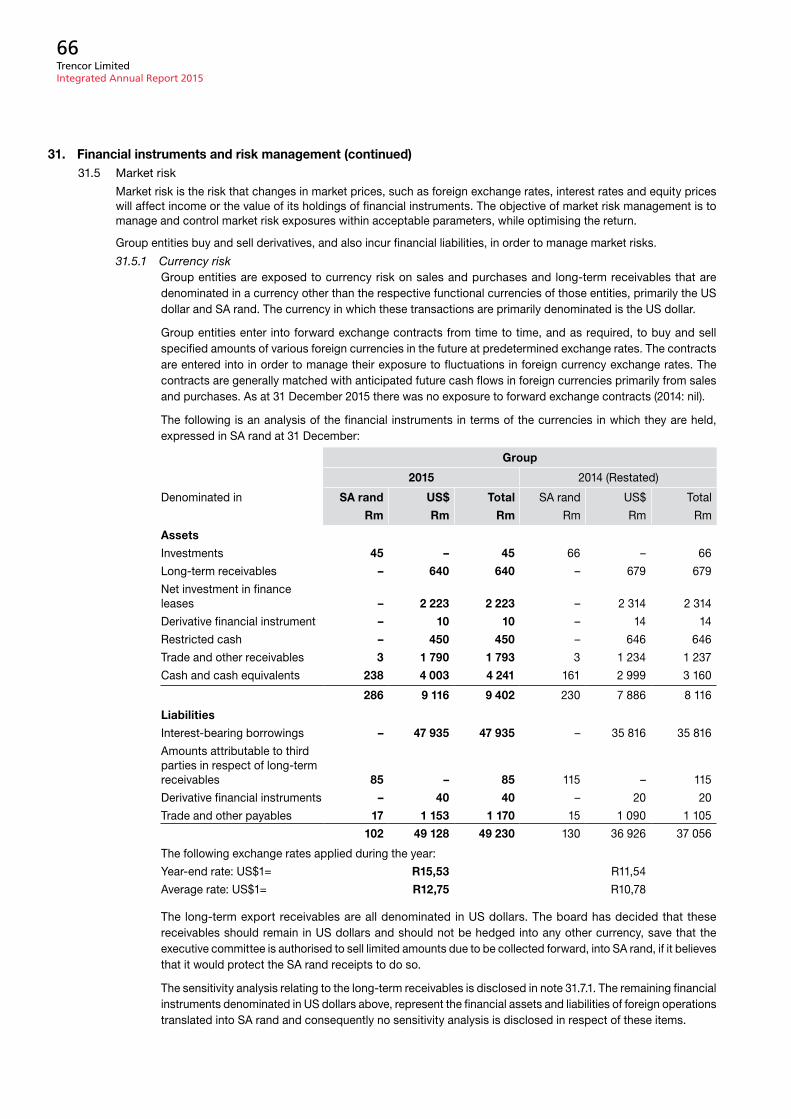
Trencor Limited Integrated Annual Report 2015
66
31. Financial instruments and risk management (continued)31.5 market risk
market risk is the risk that changes in market prices, such as foreign exchange rates, interest rates and equity prices will affect income or the value of its holdings of financial instruments. The objective of market risk management is to manage and control market risk exposures within acceptable parameters, while optimising the return.
group entities buy and sell derivatives, and also incur financial liabilities, in order to manage market risks.
31.5.1 Currency riskgroup entities are exposed to currency risk on sales and purchases and long-term receivables that are denominated in a currency other than the respective functional currencies of those entities, primarily the uS dollar and Sa rand. The currency in which these transactions are primarily denominated is the uS dollar.
group entities enter into forward exchange contracts from time to time, and as required, to buy and sell specified amounts of various foreign currencies in the future at predetermined exchange rates. The contracts are entered into in order to manage their exposure to fluctuations in foreign currency exchange rates. The contracts are generally matched with anticipated future cash flows in foreign currencies primarily from sales and purchases. as at 31 december 2015 there was no exposure to forward exchange contracts (2014: nil).
The following is an analysis of the financial instruments in terms of the currencies in which they are held, expressed in Sa rand at 31 december:
Group
2015 2014 (restated)
denominated in SA rand US$ Total Sa rand uS$ Total
Rm Rm Rm rm rm rm
Assets
investments 45 – 45 66 – 66
Long-term receivables – 640 640 – 679 679
net investment in finance leases – 2 223 2 223 – 2 314 2 314
derivative financial instrument – 10 10 – 14 14
restricted cash – 450 450 – 646 646
Trade and other receivables 3 1 790 1 793 3 1 234 1 237
cash and cash equivalents 238 4 003 4 241 161 2 999 3 160
286 9 116 9 402 230 7 886 8 116
Liabilities
interest-bearing borrowings – 47 935 47 935 – 35 816 35 816
amounts attributable to third parties in respect of long-term receivables 85 – 85 115 – 115
derivative financial instruments – 40 40 – 20 20
Trade and other payables 17 1 153 1 170 15 1 090 1 105
102 49 128 49 230 130 36 926 37 056
The following exchange rates applied during the year:
Year-end rate: uS$1= R15,53 r11,54
average rate: uS$1= R12,75 r10,78
The long-term export receivables are all denominated in uS dollars. The board has decided that these receivables should remain in uS dollars and should not be hedged into any other currency, save that the executive committee is authorised to sell limited amounts due to be collected forward, into Sa rand, if it believes that it would protect the Sa rand receipts to do so.
The sensitivity analysis relating to the long-term receivables is disclosed in note 31.7.1. The remaining financial instruments denominated in uS dollars above, represent the financial assets and liabilities of foreign operations translated into Sa rand and consequently no sensitivity analysis is disclosed in respect of these items.
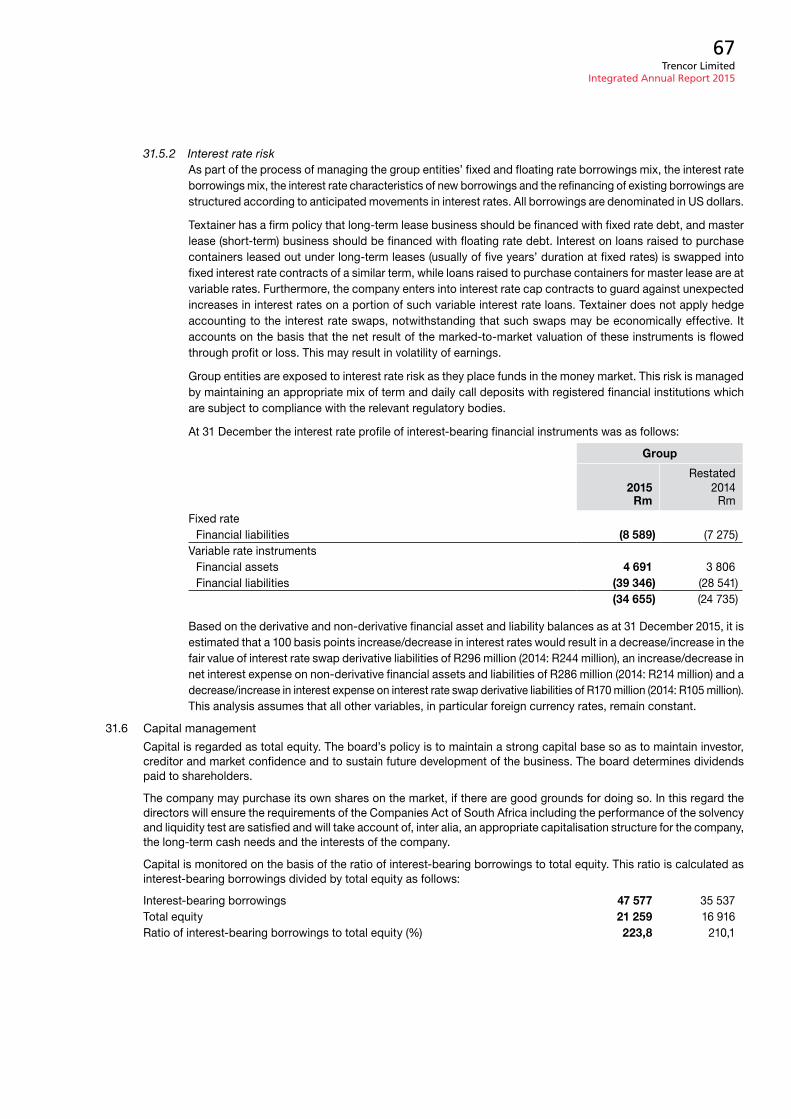
Trencor Limited Integrated Annual Report 2015
67
31.5.2 Interest rate riskas part of the process of managing the group entities’ fixed and floating rate borrowings mix, the interest rate borrowings mix, the interest rate characteristics of new borrowings and the refinancing of existing borrowings are structured according to anticipated movements in interest rates. all borrowings are denominated in uS dollars.
Textainer has a firm policy that long-term lease business should be financed with fixed rate debt, and master lease (short-term) business should be financed with floating rate debt. interest on loans raised to purchase containers leased out under long-term leases (usually of five years’ duration at fixed rates) is swapped into fixed interest rate contracts of a similar term, while loans raised to purchase containers for master lease are at variable rates. Furthermore, the company enters into interest rate cap contracts to guard against unexpected increases in interest rates on a portion of such variable interest rate loans. Textainer does not apply hedge accounting to the interest rate swaps, notwithstanding that such swaps may be economically effective. it accounts on the basis that the net result of the marked-to-market valuation of these instruments is flowed through profit or loss. This may result in volatility of earnings.
group entities are exposed to interest rate risk as they place funds in the money market. This risk is managed by maintaining an appropriate mix of term and daily call deposits with registered financial institutions which are subject to compliance with the relevant regulatory bodies.
at 31 december the interest rate profile of interest-bearing financial instruments was as follows:
Group
2015restated
2014Rm rm
Fixed rateFinancial liabilities (8 589) (7 275)
Variable rate instrumentsFinancial assets 4 691 3 806Financial liabilities (39 346) (28 541)
(34 655) (24 735)
Based on the derivative and non-derivative financial asset and liability balances as at 31 december 2015, it is estimated that a 100 basis points increase/decrease in interest rates would result in a decrease/increase in the fair value of interest rate swap derivative liabilities of r296 million (2014: r244 million), an increase/decrease in net interest expense on non-derivative financial assets and liabilities of r286 million (2014: r214 million) and a decrease/increase in interest expense on interest rate swap derivative liabilities of r170 million (2014: r105 million). This analysis assumes that all other variables, in particular foreign currency rates, remain constant.
31.6 capital management
capital is regarded as total equity. The board’s policy is to maintain a strong capital base so as to maintain investor, creditor and market confidence and to sustain future development of the business. The board determines dividends paid to shareholders.
The company may purchase its own shares on the market, if there are good grounds for doing so. in this regard the directors will ensure the requirements of the companies act of South africa including the performance of the solvency and liquidity test are satisfied and will take account of, inter alia, an appropriate capitalisation structure for the company, the long-term cash needs and the interests of the company.
capital is monitored on the basis of the ratio of interest-bearing borrowings to total equity. This ratio is calculated as interest-bearing borrowings divided by total equity as follows:
interest-bearing borrowings 47 577 35 537Total equity 21 259 16 916ratio of interest-bearing borrowings to total equity (%) 223,8 210,1
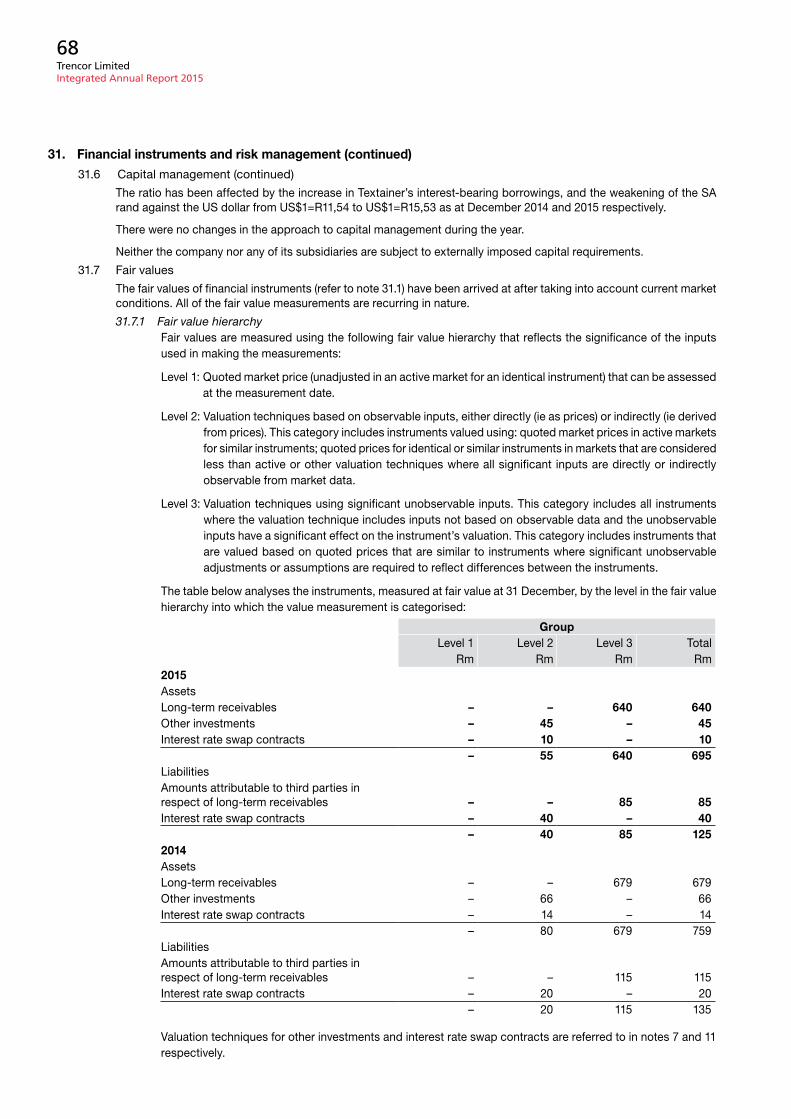
Trencor Limited Integrated Annual Report 2015
68
31. Financial instruments and risk management (continued)31.6 capital management (continued)
The ratio has been affected by the increase in Textainer’s interest-bearing borrowings, and the weakening of the Sa rand against the uS dollar from uS$1=r11,54 to uS$1=r15,53 as at december 2014 and 2015 respectively.
There were no changes in the approach to capital management during the year.
neither the company nor any of its subsidiaries are subject to externally imposed capital requirements.
31.7 Fair values
The fair values of financial instruments (refer to note 31.1) have been arrived at after taking into account current market conditions. all of the fair value measurements are recurring in nature.
31.7.1 Fair value hierarchyFair values are measured using the following fair value hierarchy that reflects the significance of the inputs used in making the measurements:
Level 1: Quoted market price (unadjusted in an active market for an identical instrument) that can be assessed at the measurement date.
Level 2: Valuation techniques based on observable inputs, either directly (ie as prices) or indirectly (ie derived from prices). This category includes instruments valued using: quoted market prices in active markets for similar instruments; quoted prices for identical or similar instruments in markets that are considered less than active or other valuation techniques where all significant inputs are directly or indirectly observable from market data.
Level 3: Valuation techniques using significant unobservable inputs. This category includes all instruments where the valuation technique includes inputs not based on observable data and the unobservable inputs have a significant effect on the instrument’s valuation. This category includes instruments that are valued based on quoted prices that are similar to instruments where significant unobservable adjustments or assumptions are required to reflect differences between the instruments.
The table below analyses the instruments, measured at fair value at 31 december, by the level in the fair value hierarchy into which the value measurement is categorised:
GroupLevel 1 Level 2 Level 3 Total
rm rm rm rm2015assetsLong-term receivables – – 640 640other investments – 45 – 45interest rate swap contracts – 10 – 10
– 55 640 695Liabilitiesamounts attributable to third parties in respect of long-term receivables – – 85 85interest rate swap contracts – 40 – 40
– 40 85 1252014assetsLong-term receivables – – 679 679other investments – 66 – 66interest rate swap contracts – 14 – 14
– 80 679 759Liabilitiesamounts attributable to third parties in respect of long-term receivables – – 115 115interest rate swap contracts – 20 – 20
– 20 115 135
Valuation techniques for other investments and interest rate swap contracts are referred to in notes 7 and 11 respectively.
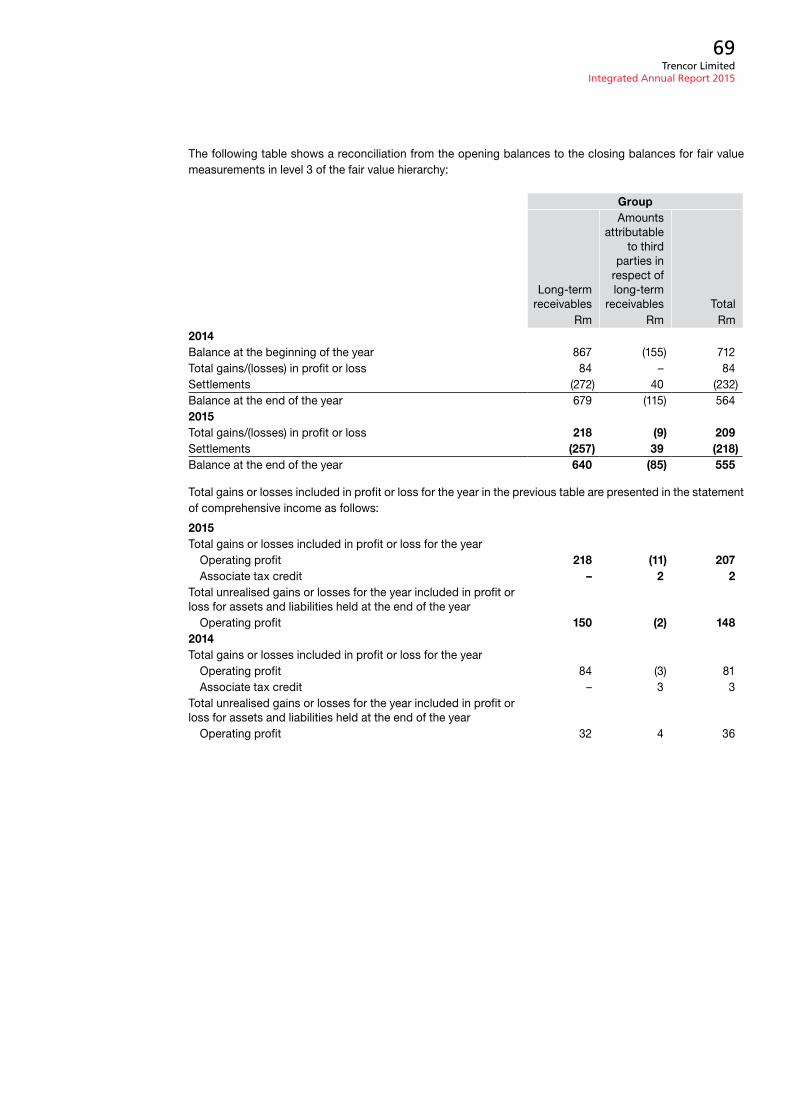
Trencor Limited Integrated Annual Report 2015
69
The following table shows a reconciliation from the opening balances to the closing balances for fair value measurements in level 3 of the fair value hierarchy:
Group
Long-term receivables
amounts attributable
to third parties in
respect of long-term
receivables Totalrm rm rm
2014Balance at the beginning of the year 867 (155) 712Total gains/(losses) in profit or loss 84 – 84Settlements (272) 40 (232)Balance at the end of the year 679 (115) 5642015Total gains/(losses) in profit or loss 218 (9) 209Settlements (257) 39 (218)Balance at the end of the year 640 (85) 555
Total gains or losses included in profit or loss for the year in the previous table are presented in the statement of comprehensive income as follows:
2015Total gains or losses included in profit or loss for the year
operating profit 218 (11) 207associate tax credit – 2 2
Total unrealised gains or losses for the year included in profit or loss for assets and liabilities held at the end of the year
operating profit 150 (2) 1482014Total gains or losses included in profit or loss for the year
operating profit 84 (3) 81associate tax credit – 3 3
Total unrealised gains or losses for the year included in profit or loss for assets and liabilities held at the end of the year
operating profit 32 4 36
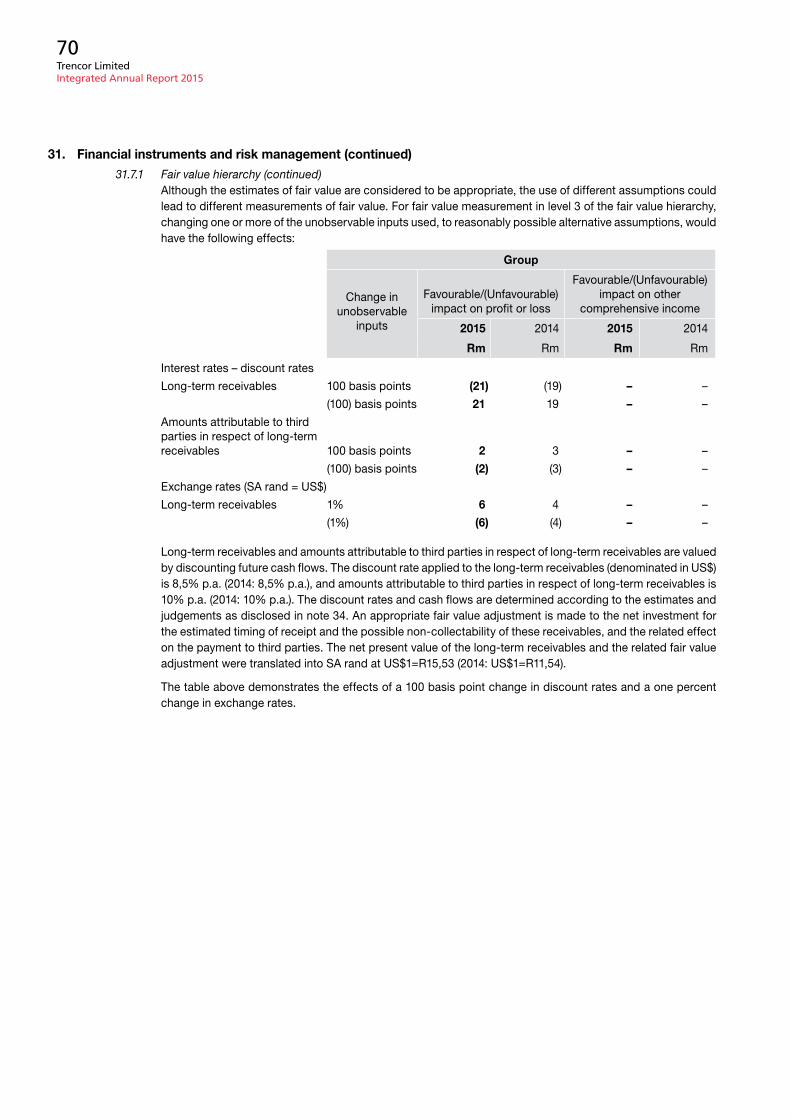
Trencor Limited Integrated Annual Report 2015
70
31. Financial instruments and risk management (continued)31.7.1 Fair value hierarchy (continued)
although the estimates of fair value are considered to be appropriate, the use of different assumptions could lead to different measurements of fair value. For fair value measurement in level 3 of the fair value hierarchy, changing one or more of the unobservable inputs used, to reasonably possible alternative assumptions, would have the following effects:
Group
change in unobservable
inputs
Favourable/(unfavourable) impact on profit or loss
Favourable/(unfavourable) impact on other
comprehensive income
2015 2014 2015 2014
Rm rm Rm rm
interest rates – discount rates
Long-term receivables 100 basis points (21) (19) – –
(100) basis points 21 19 – –
amounts attributable to third parties in respect of long-term receivables 100 basis points 2 3 – –
(100) basis points (2) (3) – –
exchange rates (Sa rand = uS$)
Long-term receivables 1% 6 4 – –
(1%) (6) (4) – –
Long-term receivables and amounts attributable to third parties in respect of long-term receivables are valued by discounting future cash flows. The discount rate applied to the long-term receivables (denominated in uS$) is 8,5% p.a. (2014: 8,5% p.a.), and amounts attributable to third parties in respect of long-term receivables is 10% p.a. (2014: 10% p.a.). The discount rates and cash flows are determined according to the estimates and judgements as disclosed in note 34. an appropriate fair value adjustment is made to the net investment for the estimated timing of receipt and the possible non-collectability of these receivables, and the related effect on the payment to third parties. The net present value of the long-term receivables and the related fair value adjustment were translated into Sa rand at uS$1=r15,53 (2014: uS$1=r11,54).
The table above demonstrates the effects of a 100 basis point change in discount rates and a one percent change in exchange rates.
Trencor Limited Integrated Annual Report 2015
71
32. Related parties32.1 identity of related parties
The company has related party relationships with its subsidiaries (refer directors’ report), associates and with key management personnel, including its directors and executive officers.
32.2 intra-group transactions and balances
amounts due by and to subsidiaries (refer to note 8).
capital distribution from trust (refer to notes 8 and 22).
administration fee paid to subsidiary r6 million (2014: r6 million).
32.3 Transactions with key management personnel
messrs e oblowitz and rJa Sparks are non-executive directors of certain South african listed companies, some of whose subsidiaries are partners in export partnerships with the group entities. no new export partnerships have been concluded with these companies since march 1999.
certain non-executive directors are also directors of other companies which have transactions with the group entities. The relevant directors do not believe they have the capacity to control or significantly influence the financial or operating policies of those companies. all material related party transactions are noted in these financial statements.
The number of shares held by the directors and their associates in the issued share capital of the company at 31 december 2015 and 2014 was as follows:
2015 direct indirect Total
c Jowell 159 831 5 262 929 5 422 760ni Jowell 47 832 5 665 218 5 713 050Je mcQueen 49 649 102 133 151 782dm nurek – 10 000 10 000e oblowitz 10 000 – 10 000rJa Sparks – 4 000 4 000H Wessels – 27 859 27 859
267 312 11 072 139 11 339 4512014c Jowell 159 831 5 262 929 5 422 760ni Jowell 47 832 5 579 018 5 626 850Je mcQueen 49 649 102 133 151 782dm nurek – 10 000 10 000e oblowitz 10 000 – 10 000rJa Sparks – 4 000 4 000H Wessels – 27 859 27 859
267 312 10 985 939 11 253 251
There have been no changes in the above interests between the financial year-end and the date of this report.
The key management personnel compensation included in employee benefits expense is as follows:
Group Company
2015 2014 2015 2014
Rm rm Rm rm
Short-term employee benefits 43 32 2 2
Share-based payments 34 28 – –
77 60 2 2
paid to:
directors 20 18 2 2
executive officers (Textainer) 57 42 – –
77 60 2 2
The number of executive officers for 2015 was 2 (2014: 2).
Trencor Limited Integrated Annual Report 2015
72
32. Related parties (continued)
The remuneration paid to the directors during the years ended 31 december 2015 and 2014 was as follows:
guaranteedremuneration
r’000
contributions to
incentivebonuses
r’000
Share-basedpayments*
r’000
Totalremuneration
r’000
medicalaid
r’000
retirementfunds r’000
2015
Non-executive directors
Je Hoelter 1 654 – – – 659 2 313
dm nurek 1 245 – – – 659 1 904
e oblowitz 356 – – – – 356
rJa Sparks 354 – – – – 354
H Wessels 323 – – – – 323
3 932 – – – 1 318 5 250
Executive directors
c Jowell 1 542 22 – 840 659 3 063
ni Jowell 3 202 43 – 2 100 659 6 004
Je mcQueen 3 334 43 266 478 659 4 780
Hr van der merwe 902 43 95 100 – 1 140
8 980 151 361 3 518 1 977 14 987
Aggregate remuneration 2015 12 912 151 361 3 518 3 295 20 237
2014
Non-executive directors
Je Hoelter 1 285 – – – 413 1 698
dm nurek 1 011 – – – 413 1 424
e oblowitz 331 – – – – 331
rJa Sparks 330 – – – – 330
H Wessels 271 – – – – 271
3 228 – – – 826 4 054
Executive directors
c Jowell 1 329 20 – 1 042 413 2 804
ni Jowell 2 881 28 – 2 606 413 5 928
Je mcQueen 3 022 39 254 593 413 4 321
Hr van der merwe 844 39 89 – – 972
8 076 126 343 4 241 1 239 14 025
Aggregate remuneration 2014 11 304 126 343 4 241 2 065 18 079
* award of shares by Textainer for services rendered as directors of Textainer.
33. Contingent liabilities, guarantees and other commitments
The company has warranted the performance and obligations of certain subsidiary companies in terms of a number of partnership agreements entered into with third parties. The partnerships were established for the purposes of purchasing and selling marine cargo containers. at 31 december 2015, the aggregate amount attributable to third parties in terms of these arrangements and payable to them over the remaining term of the underlying contracts was r126 million (2014: r165 million) (refer to note 9.4).
Trencor Limited Integrated Annual Report 2015
73
34. Accounting estimates and judgements
management determines the development, selection and disclosure of critical accounting policies and estimates and the application of these policies and estimates. certain critical judgements in applying these accounting policies are described below:
34.1 marine cargo containers34.1.1 Residual values
iFrS requires the reassessment of the residual values of containers, which are then used to determine the amount by which containers are depreciated, at least at each financial year-end. in accordance with iFrS, residual values are determined using current market conditions and are therefore likely to fluctuate over time as market prices fluctuate (ie will reflect market volatility). iFrS defines the residual value of a container as the estimated amount that would currently be obtained from the disposal of a container, after deducting the estimated costs of disposal, if the container were already of the age and in the condition expected at the end of its useful life. This requirement necessitated a reassessment of the residual values of the container fleets at 31 december 2015. This is in contrast to uS gaap (being the financial reporting framework for the statutory financial statements of Textainer and Tac) which takes a long-term view of the value to be realised on disposal of each container up to 12 to 14 years in the future (ie market fluctuations in price are not taken into account in the reassessment of residual values unless they persist for extended periods of time). management reviews residual values at each financial reporting date.
The resale values of containers can vary significantly depending on, among other factors, location at time of sale, the condition of the container, customer demand and overall market conditions. recent average sales prices for containers were considered by major asset type and the residual values were adjusted accordingly at year-end.
due to the fact that the resale prices of containers at end of useful life (ie residual value) represent a significant proportion of original cost (resale prices have shown to be 50-60% of original cost based on a 10 year historical average), the prospective depreciation charge is therefore highly sensitive to movements in residual values that are reassessed at each financial reporting date.
34.1.2 Impairmentimpairment exists when the estimated future discounted cash flows to be generated by a cash-generating unit are less than the net book value of that cash-generating unit. at each reporting date management of the relevant operating companies assesses whether there is evidence that the containers held for use in the leasing operation are impaired. Such evidence would include a decline in the results of operations or the container residual values. in estimating the future discounted cash flows to be generated by a cash-generating unit, management uses assumptions that are part of the long-term planning forecasts of the entities concerned. Some of the significant estimates and assumptions used to determine future expected cash flows were: expected future lease rates, expected utilisation, remaining useful lives, remaining on-hire periods for expired fixed term leases, direct container expenses and expected disposal prices of containers. in performing the impairment analysis assumptions used reflected the contractually stipulated per diem rates, with renewal based on current market rates.
at each reporting date, management reviews whether there are any indicators that the containers held in use are further impaired or whether a reversal of impairment is required. an impairment loss is reversed only if there is a change in the estimates used to determine the recoverable amount.
Trencor Limited Integrated Annual Report 2015
74
34. Accounting estimates and judgements (continued)34.2 Long-term receivables
34.2.1 Discount rateUS dollar cash streamsThe discount rate that is applied to reduce the future long-term dollar receivable stream to its net present value is determined by the board from time to time and reflects the applicable risk free rate (being the united States daily Treasury yield curve rate for the appropriate term ie seven years) adjusted for a specific risk premium. in determining the amount of the specific risk premium to be applied, the board takes cognisance of the then prevailing market conditions.
Rand cash streamsThe discount rate that is applied to reduce the future stream of rand amounts attributable to the company’s export partners in respect of the long-term receivables to its net present value is determined by the board from time to time and reflects the applicable risk free rate (being the Bond exchange of South africa yield curve rate for the appropriate term ie seven years) adjusted for an appropriate risk premium.
34.2.2 Fair value adjustmentin calculating the amount of the fair value adjustment to the value of the net investment in long-term receivables that arose from the sale of marine cargo containers, mainly through export partnerships, management considers both the collectability and the anticipated timing of the receipt of future instalments.
Forecasts of anticipated cash collections assist management in determining the necessity for and the amount of any fair value adjustment that may be required. These forecasts are based on estimates and judgements by management of, inter alia, the following variables for the remaining economic lives of the containers:
• new container prices
• estimated economic life of containers
• resale prices of used containers
• container lease rates
• container fleet utilisations
• prevailing interest rates
• past payment history
management believes that forecast and/or assumptions are based on competent industry knowledge and experience.
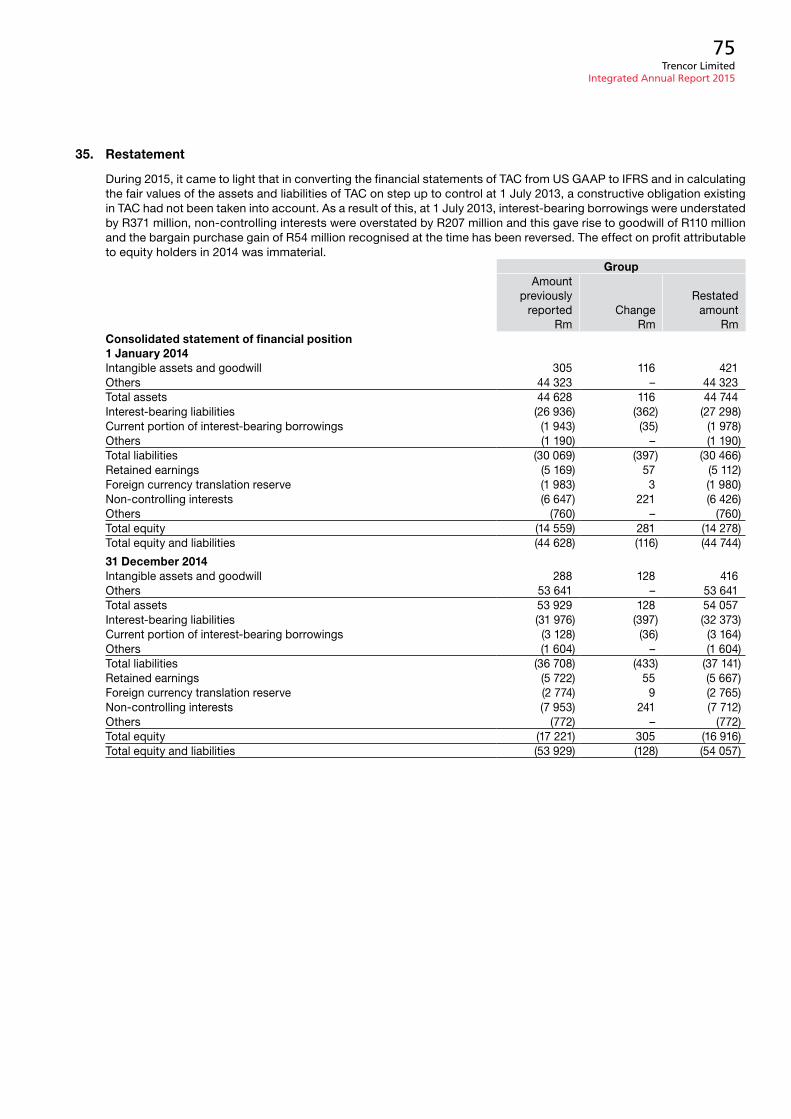
Trencor Limited Integrated Annual Report 2015
75
35. Restatement
during 2015, it came to light that in converting the financial statements of Tac from uS gaap to iFrS and in calculating the fair values of the assets and liabilities of Tac on step up to control at 1 July 2013, a constructive obligation existing in Tac had not been taken into account. as a result of this, at 1 July 2013, interest-bearing borrowings were understated by r371 million, non-controlling interests were overstated by r207 million and this gave rise to goodwill of r110 million and the bargain purchase gain of r54 million recognised at the time has been reversed. The effect on profit attributable to equity holders in 2014 was immaterial.
Groupamount
previously reported
rmchange
rm
restated amount
rmConsolidated statement of financial position 1 January 2014intangible assets and goodwill 305 116 421others 44 323 – 44 323Total assets 44 628 116 44 744interest-bearing liabilities (26 936) (362) (27 298)current portion of interest-bearing borrowings (1 943) (35) (1 978)others (1 190) – (1 190)Total liabilities (30 069) (397) (30 466)retained earnings (5 169) 57 (5 112)Foreign currency translation reserve (1 983) 3 (1 980)non-controlling interests (6 647) 221 (6 426)others (760) – (760)Total equity (14 559) 281 (14 278)Total equity and liabilities (44 628) (116) (44 744)
31 December 2014intangible assets and goodwill 288 128 416others 53 641 – 53 641Total assets 53 929 128 54 057interest-bearing liabilities (31 976) (397) (32 373)current portion of interest-bearing borrowings (3 128) (36) (3 164)others (1 604) – (1 604)Total liabilities (36 708) (433) (37 141)retained earnings (5 722) 55 (5 667)Foreign currency translation reserve (2 774) 9 (2 765)non-controlling interests (7 953) 241 (7 712)others (772) – (772)Total equity (17 221) 305 (16 916)Total equity and liabilities (53 929) (128) (54 057)
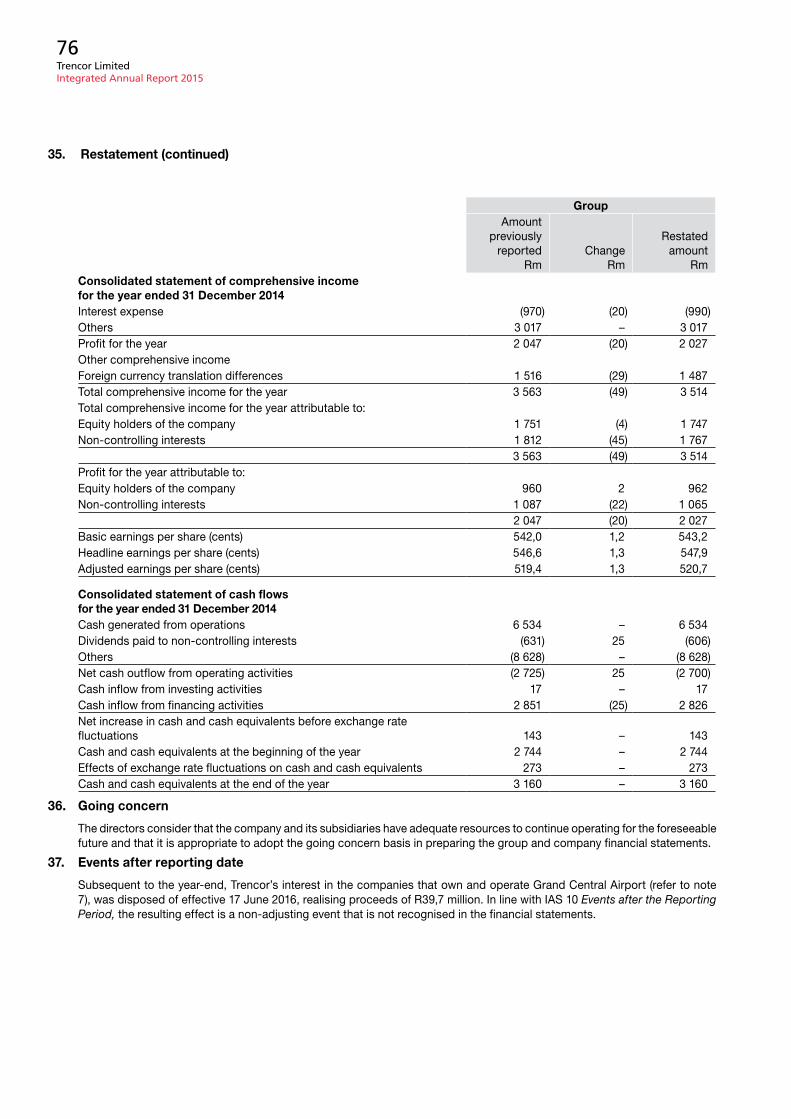
Trencor Limited Integrated Annual Report 2015
76
35. Restatement (continued)
Groupamount
previously reported
rmchange
rm
restated amount
rmConsolidated statement of comprehensive income for the year ended 31 December 2014interest expense (970) (20) (990)others 3 017 – 3 017profit for the year 2 047 (20) 2 027other comprehensive incomeForeign currency translation differences 1 516 (29) 1 487Total comprehensive income for the year 3 563 (49) 3 514Total comprehensive income for the year attributable to:equity holders of the company 1 751 (4) 1 747non-controlling interests 1 812 (45) 1 767
3 563 (49) 3 514profit for the year attributable to:equity holders of the company 960 2 962non-controlling interests 1 087 (22) 1 065
2 047 (20) 2 027Basic earnings per share (cents) 542,0 1,2 543,2Headline earnings per share (cents) 546,6 1,3 547,9adjusted earnings per share (cents) 519,4 1,3 520,7
Consolidated statement of cash flows for the year ended 31 December 2014cash generated from operations 6 534 – 6 534dividends paid to non-controlling interests (631) 25 (606)others (8 628) – (8 628)net cash outflow from operating activities (2 725) 25 (2 700)cash inflow from investing activities 17 – 17cash inflow from financing activities 2 851 (25) 2 826net increase in cash and cash equivalents before exchange rate fluctuations 143 – 143cash and cash equivalents at the beginning of the year 2 744 – 2 744effects of exchange rate fluctuations on cash and cash equivalents 273 – 273cash and cash equivalents at the end of the year 3 160 – 3 160
36. Going concern
The directors consider that the company and its subsidiaries have adequate resources to continue operating for the foreseeable future and that it is appropriate to adopt the going concern basis in preparing the group and company financial statements.
37. Events after reporting date
Subsequent to the year-end, Trencor’s interest in the companies that own and operate grand central airport (refer to note 7), was disposed of effective 17 June 2016, realising proceeds of r39,7 million. in line with iaS 10 Events after the Reporting Period, the resulting effect is a non-adjusting event that is not recognised in the financial statements.
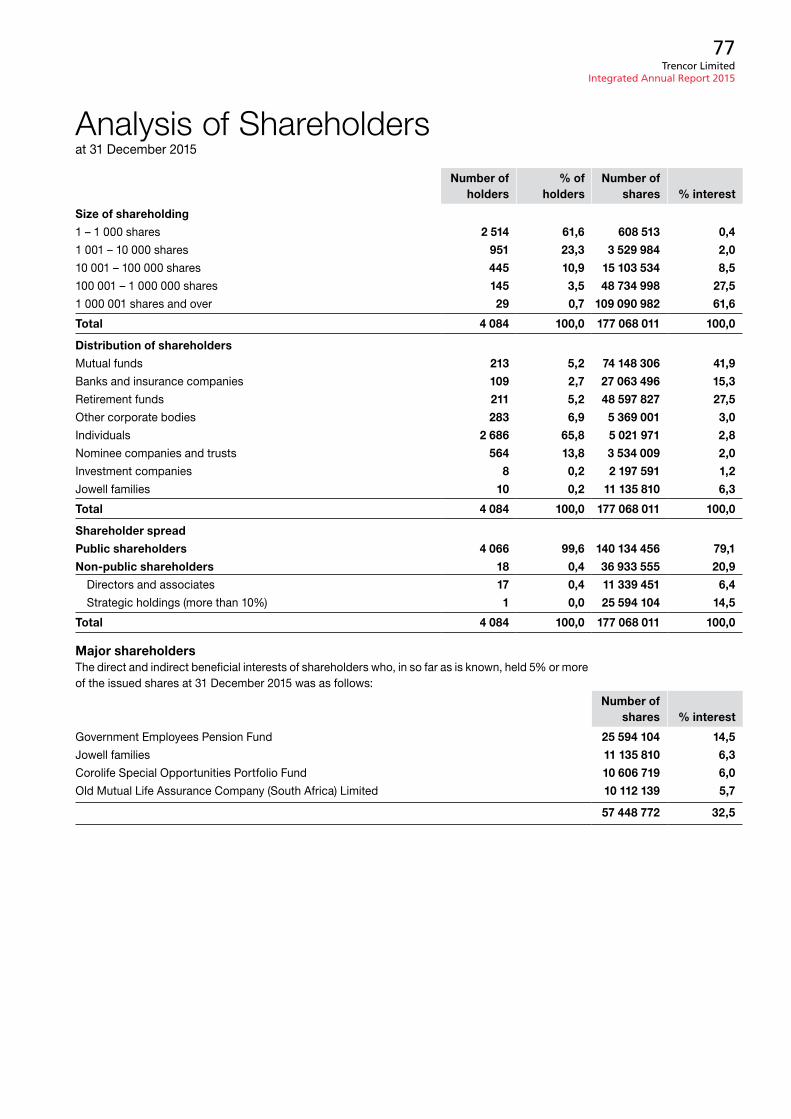
Trencor Limited Integrated Annual Report 2015
77
Number ofholders
% of holders
Number ofshares % interest
Size of shareholding
1 – 1 000 shares 2 514 61,6 608 513 0,4
1 001 – 10 000 shares 951 23,3 3 529 984 2,0
10 001 – 100 000 shares 445 10,9 15 103 534 8,5
100 001 – 1 000 000 shares 145 3,5 48 734 998 27,5
1 000 001 shares and over 29 0,7 109 090 982 61,6
Total 4 084 100,0 177 068 011 100,0
Distribution of shareholders
mutual funds 213 5,2 74 148 306 41,9
Banks and insurance companies 109 2,7 27 063 496 15,3
retirement funds 211 5,2 48 597 827 27,5
other corporate bodies 283 6,9 5 369 001 3,0
individuals 2 686 65,8 5 021 971 2,8
nominee companies and trusts 564 13,8 3 534 009 2,0
investment companies 8 0,2 2 197 591 1,2
Jowell families 10 0,2 11 135 810 6,3
Total 4 084 100,0 177 068 011 100,0
Shareholder spread
Public shareholders 4 066 99,6 140 134 456 79,1
Non-public shareholders 18 0,4 36 933 555 20,9
directors and associates 17 0,4 11 339 451 6,4
Strategic holdings (more than 10%) 1 0,0 25 594 104 14,5
Total 4 084 100,0 177 068 011 100,0
Major shareholdersThe direct and indirect beneficial interests of shareholders who, in so far as is known, held 5% or more of the issued shares at 31 december 2015 was as follows:
Number of shares % interest
government employees pension Fund 25 594 104 14,5
Jowell families 11 135 810 6,3
corolife Special opportunities portfolio Fund 10 606 719 6,0
old mutual Life assurance company (South africa) Limited 10 112 139 5,7
57 448 772 32,5
Analysis of Shareholdersat 31 december 2015
Trencor Limited Integrated Annual Report 2015
78
Directorate: Brief Résumésages at 31 december 2015
EXECuTIVENEIL IAN JOWELL (82)
Bcom LLB (ucT) mBa (columbia). chairman of the board and of the executive committee. He is the elder son of Trencor’s founder, Joe Jowell, and joined the company on 1 January 1956. He was appointed to the board on 30 december 1966 and, following the death of his father in 1973, as chairman. He was chairman of Textainer group Holdings Limited until his retirement from that board on 19 may 2016. He retires from all positions in the group at the 2016 annual general meeting.
CECIL JOWELL (80)
Bcom LLB (ucT). The younger son of the company’s founder, he joined Trencor on 1 november 1958 and was appointed as an executive director on 2 october 1962. He assumed a part-time executive role from 15 march 2002. He serves on the executive and social and ethics committees. He was a non-executive director of Textainer group Holdings Limited until his retirement from that board on 19 may 2016. He retires from all positions in the group at the 2016 annual general meeting.
JAMES (JIMMY) ERNEST MCquEEN (71)
Bcom (ucT) ca(Sa). appointed as chief executive officer effective 1 march 2016. He was previously in charge of finance and is a member of the executive, risk and social and ethics committees. He was appointed as an alternate director on 18 april 1984 and as a full director on 15 may 1996. prior to joining Trencor on 10 June 1976, he was an accountant in public practice. He is a non-executive director of Textainer group Holdings Limited.
RICARDO (RIC) ANTONIO SIENI (61)
Bcom (ucT) ca(Sa). appointed as financial director and member of the executive committee on 1 march 2016. He completed his articles at deloitte before joining Trencor on 1 october 1982 where he served as group accountant and later as financial manager.
HENDRIK (HENNIE) ROuX VAN DER MERWE (68)
Ba Law LLB (Stellenbosch) LLm (Tax) (Wits). He joined Trencor on 1 July 1997 and was appointed to the board on 20 may 1998 and as managing director on 4 april 2003. in april 2011 his role changed to that of a part-time executive director, and he remains a member of the executive committee. He initially practised as an attorney at law followed by various senior executive positions in the banking sector and was deputy chairman of Waco international Limited before transferring to Trencor. He serves on the boards of various listed and unlisted companies in a non-executive capacity and has resumed practising as an attorney at law.
NON-EXECuTIVEJAMES (JIM) EDWARD HOELTER (76)
BBus admin (Wisconsin) mBa (Harvard). appointed as a non-executive director on 2 december 2002. He joined Textainer group Holdings Limited in 1987 and was president and ceo of Textainer until his retirement in december 1998. He served as a non-executive director on its board until his retirement on 19 may 2016. He also serves on the boards and committees of various unlisted companies in the uSa. He is a member of Trencor’s risk committee.
INDEPENDENT NON-EXECuTIVEDAVID MORRIS NuREK (65)
dip Law (ucT) grad dip company Law (ucT). is an executive of investec Bank Limited. He was appointed as an alternate director of Trencor on 30 november 1992 and as a full director on 24 July 1995. He succeeds mr ni Jowell as chairman at the close of the 2016 annual general meeting. prior to joining investec in June 2000, he practised as an attorney at law with Sonnenberg Hoffmann galombik for 32 years. He is the lead non-executive director and chairman of the remuneration, nomination and social and ethics committees and a member of the risk and governance committees and serves on the boards of various listed and unlisted companies in a non-executive capacity. He is a non-executive director of Textainer group Holdings Limited.
EDWIN (EDDY) OBLOWITz (58)
Bcom (ucT) ca(Sa) cpa (isr). He was appointed as a non-executive director on 3 march 2004 and is chairman of the audit and risk committees. He was previously an international partner of andersens in South africa and now serves as the executive chairman of the Stonehage Fleming group’s operations in South africa. He is a director of various listed and unlisted companies in a non-executive capacity and serves as a trustee of various trusts.
RODERICK (RODDY) JOHN ALWYN SPARKS (56)
Bcom Hons (ucT) ca(Sa) mBa (ucT). appointed as a non-executive director on 27 July 2009 and is a member of the audit, risk and nomination committees and chairman of the governance committee. He was previously managing director of old mutual South africa and old mutual Life assurance company (Sa) and chairperson of old mutual unit Trust managers, old mutual Specialised Finance and old mutual asset managers (Sa). He is a director of various listed and unlisted companies in a non-executive capacity and chairs the advisory board of the ucT college of accounting.
HERMAN WESSELS (71)
Bcom ca(Sa). appointed as a non-executive director on 1 april 2011. He serves on the audit, risk, nomination and governance committees. He is a financial consultant having previously been a partner of pricewaterhousecoopers in South africa. He is a director of various listed and unlisted companies in a non-executive capacity.
Trencor Limited Integrated Annual Report 2015
79
Trencor Limited(incorporated in the republic of South africa)(registration number 1955/002869/06)Share code: TreiSin: Zae000007506
notice is hereby given that the sixtieth annual general meeting of shareholders of Trencor Limited (‘Trencor’ or ‘the company’) will be held at 13th Floor, The Towers South, Heerengracht, cape Town on Friday, 5 august 2016 at 15:00.
RECORD DATES
in terms of section 59 of the companies act, no 71 of 2008, as amended (‘companies act’) the record date for shareholders to be recorded in the register of members of the company in order to receive this notice of the annual general meeting is Friday, 24 June 2016. The record date for shareholders to be recorded in the register of members of the company in order to be able to attend, participate and vote at the annual general meeting is Friday, 29 July 2016, and the last day to trade in the company’s shares in order to be recorded in the register of members of the company in order to be able to attend, participate and vote at the annual general meeting is Tuesday, 26 July 2016.
ELECTRONIC PARTICIPATION IN THE ANNuAL GENERAL MEETING
The company intends to make provision for shareholders of the company, or their proxies, to participate in the annual general meeting by way of teleconference call.
Should you wish to participate in the annual general meeting by such means, you, or your proxy, will be required to contact [email protected] at least 48 hours (excluding Saturdays, Sundays and public holidays) before the annual general meeting. Voting will not be possible via such facility and shareholders wishing to exercise their voting rights are required to be represented at the meeting in person, by proxy or by letter of representation.
each of the ordinary and special resolutions set out below may be proposed and passed, with or without modification or amendment, at the annual general meeting or at any postponement or adjournment of the annual general meeting.
The purpose of the annual general meeting is for the following business to be transacted and for the following ordinary and special resolutions to be proposed:
1. To present and consider the audited annual financial statements, the directors’ report and the report by the chairman of the audit committee of the company and the Trencor group for the year ended 31 december 2015.
in terms of the companies act, the audited financial statements will be presented to the shareholders together with the directors’ report and the report by the chairman of the audit committee. The audited annual financial statements, the directors’ report and the report by the chairman of the audit committee of the company and its subsidiaries, are
set out on pages 25 to 76 of the document of which this notice of annual general meeting forms part (the integrated annual report).
2. in terms of the company’s memorandum of incorporation messrs ni Jowell, e oblowitz and rJa Sparks retire by rotation at the forthcoming annual general meeting and mr ra Sieni, who was appointed as a director effective 1 march 2016, also retires. mr ni Jowell retires from the board at the meeting and is not available for re-election. The other retiring directors are eligible and offer themselves for re-election.
Brief résumés of the directors of the company are presented on page 78 of the integrated annual report.
accordingly, shareholders are requested to consider and, if deemed fit, to re-elect the directors named above by way of passing the separate ordinary resolutions set out below:
Ordinary resolution number 1.1appointment of mr e oblowitz as director
“resolved that mr e oblowitz be and is hereby elected as a director of the company.”
Ordinary resolution number 1.2appointment of mr rJa Sparks as director
“resolved that mr rJa Sparks be and is hereby elected as a director of the company.”
Ordinary resolution number 1.3appointment of mr ra Sieni as director
“resolved that mr ra Sieni be and is hereby elected as a director of the company.”
Explanatory note:The board has recommended the election of messrs e oblowitz, rJa Sparks and ra Sieni as directors of the company. The election of each director who retires by rotation is required at the company’s annual general meeting. The election will be conducted by a series of votes, each of which is on the candidacy of a single individual to fill a single vacancy, as required under section 68(2) of the companies act.
The minimum percentage of voting rights that is required for these resolutions to be adopted is 50% plus one of the voting rights to be cast on the resolution.
3. To table the remuneration policy of the company (as set out on pages 15 and 16 of the integrated annual report) for consideration and submit same for a non-binding advisory vote by the shareholders.
Advisory vote:“resolved that the remuneration policy of the company, as set out on pages 15 and 16 of the integrated annual report of which this notice of annual general meeting forms part, be and is hereby endorsed through a non-binding advisory vote as recommended in terms of the King code on governance for South africa 2009.”
Notice to Shareholders
Trencor Limited Integrated Annual Report 2015
80
Explanatory note:
in terms of principle 2.27 of the King code on governance for South africa 2009, the company’s remuneration policy should be tabled to the shareholders of the company for a non-binding advisory vote at the annual general meeting. accordingly, the shareholders are requested to endorse the company’s remuneration policy by way of a non-binding advisory vote in the same manner as an ordinary resolution.
as this is not a matter that is required to be resolved or approved by shareholders, no minimum voting threshold is required. nevertheless, to signify approval, the minimum percentage of voting rights that is required in favour of the remuneration policy is 50% plus one of the voting rights to be cast.
4. To reappoint Kpmg inc as independent auditor of the company for the ensuing year.
Ordinary resolution number 2:“resolved that Kpmg inc is hereby reappointed as the auditor of the company for the ensuing year.”
Explanatory note:in compliance with section 90(1) of the companies act, a public company must each year at its annual general meeting appoint an auditor.
note that the audit committee has recommended the reappointment of Kpmg inc as auditors of the company. Section 94(9) of the companies act entitles a company to appoint an auditor at its annual general meeting, other than one nominated by the audit committee, but if such an auditor is appointed, the appointment is valid only if the audit committee is satisfied that the proposed auditor is independent of the company.
The minimum percentage of voting rights that is required for this resolution to be adopted is 50% plus one of the voting rights to be cast on the resolution.
5. To appoint an audit committee to conduct the duties and responsibilities as outlined in section 94(7) of the companies act.
Ordinary resolution number 3.1:appointment of mr e oblowitz as a member of the audit committee
“resolved that mr e oblowitz be and is hereby elected as a member of the audit committee of the company, subject to his re-election as a director of the company in terms of ordinary resolution number 1.1.”
Ordinary resolution number 3.2:appointment of mr rJa Sparks as a member of the audit committee
“resolved that mr rJa Sparks be and is hereby elected as a member of the audit committee of the company, subject to his re-election as a director of the company in terms of ordinary resolution number 1.2.”
Ordinary resolution number 3.3:appointment of mr H Wessels as a member of the audit committee
“resolved that mr H Wessels be and is hereby elected as a member of the audit committee of the company.”
Explanatory note:in terms of the companies act, the audit committee is not a committee of the board but a committee elected by the shareholders at each annual general meeting.
Section 94(2) of the companies act requires a public company, at each annual general meeting, to elect an audit committee.
Section 94(4)(a) of the companies act requires, among other things, that each member of the audit committee must be a director of the company. Brief résumés of the directors are presented on page 78 of the integrated annual report.
The minimum percentage of voting rights that is required for these resolutions to be adopted is 50% plus one of the voting rights to be cast on the resolution.
6. To provide financial assistance to related or inter-related companies and others.
Special resolution number 1:“resolved that in terms of and subject to the provisions of section 45 of the companies act, the shareholders of the company hereby approve, as a general approval, the provision by the company (subject to the requirements of the company’s memorandum of incorporation, the companies act and the Listings requirements of the JSe Limited from time to time), at any time and from time to time, during the period of two years commencing on the date of passing of this special resolution, of any direct or indirect financial assistance contemplated in the companies act to any one or more related or inter-related companies or corporations of the company on such terms and conditions as the board of directors of the company, or any one or more persons authorised by the board of directors of the company from time to time for such purpose, deems fit.”
Explanatory note:The reason for special resolution number 1 is to obtain approval from the shareholders so as to enable the company to provide financial assistance, when the need arises, in accordance with the provisions of section 45 of the companies act. The effect of special resolution number 1 is that the company will have the necessary authority to provide such financial assistance to any one or more related or inter-related companies or corporations of the company as contemplated in special resolution number 1 as and when required to do so. The board of the company undertakes that, in so far as the companies act requires, it will not adopt a resolution to authorise such financial assistance, unless the directors are satisfied that (i) immediately after
Trencor Limited Integrated Annual Report 2015
81
providing such financial assistance, the company will satisfy the solvency and liquidity test as referred to in section 45(3)(b)(i) of the companies act, and that (ii) the terms under which such financial assistance is to be given are fair and reasonable to the company as referred to in section 45(3)(b)(ii) of the companies act.
The minimum percentage of voting rights that is required for this resolution to be adopted is 75% of the voting rights to be cast on the resolution.
7. To resolve as a special resolution that the non-executive directors’ annual remuneration, in their capacity only as directors of the company, from 1 July 2016 until the next annual general meeting of the company be approved.
Special resolution number 2:“resolved that the non-executive directors’ annual remuneration, in their capacities only as directors of the company, from 1 July 2016 until the next annual general meeting of the company be paid in accordance with the following:
For services as:chairman of the board r715 500Basic remuneration as director r238 500chairman of the audit/risk committee r156 000member of the audit committee/risk committee r 85 500member of the governance committee r 22 500member of the remuneration committee r 22 500member of the nomination committee r 22 500member of the social and ethics committee r 22 500in the case of mr Je Hoelter uS$53 500”
Explanatory note:in terms of sections 66(8) and (9) of the companies act, remuneration may only be paid to directors for their service as directors in accordance with a special resolution approved by the shareholders within the previous two years.
it is noted that the remuneration payable to non-executive directors in their capacities as such and for their services as directors, as set out in the above special resolution, reflects an increase of 7% compared to the remuneration in respect of the 12 months to 30 June 2016.
it is noted that the remuneration referred to in this resolution is only in respect of remuneration payable to non-executive directors of the company in their capacities as such and does not include salaries and other benefits payable to directors in other capacities.
The minimum percentage of voting rights that is required for this resolution to be adopted is at least 75% of the voting rights to be cast on the resolution.
8. To consider and, if deemed fit, to pass, with or without modification, the following special resolution:
Special resolution number 3:“resolved that the company hereby approves, as a general approval contemplated in section 48 of the companies act, no 71 of 2008, as amended (‘companies act’), the acquisition by the company or any of its subsidiaries from time to time of the issued shares of the company, upon such terms and conditions and in such amounts as the directors of the company may from time to time determine, but subject to the memorandum of incorporation of the company, the provisions of the companies act and the Listings requirements of the JSe Limited (‘JSe Listings requirements’) as presently constituted and which may be amended from time to time, and provided that:
1. any such acquisition of shares shall be effected through the order book operated by the JSe trading system and done without any prior understanding or arrangement between the company and the counterparty (reported trades are prohibited);
2. any such repurchase of shares is authorised by the company’s memorandum of incorporation;
3. at any point in time, the company may only appoint one agent to effect any repurchase(s) on its behalf;
4. this general authority shall only be valid until the company’s next annual general meeting, provided that it shall not extend beyond fifteen months from the date of passing of this special resolution;
5. the board of directors pass a resolution authorising the repurchase, confirming that the company passes the solvency and liquidity test and that from the time that the test is done there are no material changes to the financial position of the Trencor group;
6. a paid press announcement containing full details of the acquisitions will be published as soon as the company and/or its subsidiaries has/have acquired shares constituting, on a cumulative basis, 3% of the number of shares of that class in issue at the time of granting of this general authority, and for each 3% in aggregate of the initial number of that class acquired thereafter;
7. acquisitions by the company and its subsidiaries of shares in the share capital of the company may not, in the aggregate, exceed in any one financial year 20% (or 10% where such acquisitions relate to the acquisition by a subsidiary) of the company’s issued share capital of any class as at the beginning of the financial year;
8. in determining the price at which the company’s shares are acquired by the company or its subsidiaries in terms of this general authority, the maximum price at which such shares may be acquired may not be greater than 10% above the weighted average of the market price at which such shares are traded on the JSe, as determined over the five business days immediately preceding the date of the acquisition of such shares by the company or its subsidiaries;
Trencor Limited Integrated Annual Report 2015
82
9. the company or its subsidiaries are not acquiring shares during a prohibited period as defined in the JSe Listings requirements unless they have in place a repurchase programme where the dates and quantities of shares to be traded during the relevant period are fixed (not subject to any variation) has been submitted to the JSe in writing prior to the commencement of the prohibited period. The company shall instruct an independent third party, which makes its investment decisions in relation to the company’s securities independently of, and uninfluenced by, the company, prior to the commencement of the prohibited period to execute the repurchase programme submitted to the JSe; and
10. any acquisitions are subject to exchange control approval at that point in time.”
Explanatory note:The reason for this special resolution is to grant the company a general authority in terms of the companies act for the acquisition by the company or any of its subsidiaries of shares issued by the company, which authority shall be valid until the earlier of the next annual general meeting of the company or the variation or revocation of such general authority by special resolution by any subsequent general meeting of the company, provided that the general authority shall not extend beyond fifteen months from the date of this annual general meeting. The effect of the passing of this special resolution will be to authorise the company or any of its subsidiaries to acquire shares issued by the company. if relevant in the circumstances, compliance with section 48(8)(b) of the companies act will be required if the company is to acquire more than 5% of its shares.
The directors are of the opinion that it would be in the best interests of the company to extend the current authority for the repurchase of shares by the company or its subsidiaries, allowing the company or any of its subsidiaries to be in a position to repurchase or purchase, as the case may be, the shares issued by the company through the order book of the JSe, should the market conditions and price, as well as the financial position of the company, justify such action, as determined by the directors.
repurchases or purchases, as the case may be, will only be made after careful consideration, where the directors consider that such repurchase or purchase, as the case may be, will be in the best interests of the company and its shareholders.
The minimum percentage of voting rights that is required for this resolution to be adopted is 75% of the voting rights to be cast on the resolution.
STATEMENT BY THE BOARD OF DIRECTORS OF THE COMPANY REGARDING SPECIAL RESOLuTION NuMBER 3
pursuant to and in terms of the JSe Listings requirements, the board of directors of the company hereby states that:
a) the intention of the directors of the company is to utilise the general authority to acquire shares in the company if at some future date the cash resources of the company are in excess of its requirements or there are other good grounds for doing so. in this regard the directors will take account of, inter alia, an appropriate capitalisation structure for the company, the long-term cash needs of the company, and the interests of the company;
b) in determining the method by which the company intends to repurchase its shares, the maximum number of shares to be acquired and the date on which such acquisition will take place, the directors of the company will only make the acquisition if at the time of the acquisition they are of the opinion that:
• the company and the group will be able to pay their debts as they become due in the ordinary course of business for the next twelve months after the date of the general repurchase;
• the assets of the company and the group, fairly valued in accordance with international Financial reporting Standards and recognised and measured in accordance with the accounting policies used in the latest audited financial statements will be in excess of the liabilities of the company and the group for the next twelve months after the date of the general repurchase;
• the issued share capital and reserves of the company and the group will be adequate for ordinary business purposes of the company or any acquiring subsidiary for the next twelve months after the date of the general repurchase; and
• the working capital available to the company and the group will be sufficient for ordinary business purposes for the next twelve months after the date of the general repurchase.
OTHER DISCLOSuRES IN TERMS OF SECTION 11.26 OF THE JSE LISTINGS REquIREMENTS
The integrated annual report to which this notice of this annual general meeting is attached provides details of:
• the major shareholders of the company on page 77; and
• the share capital of the company in note 18 on page 50, and an analysis of the shareholders (including beneficial shareholders who hold 5% or more of the issued share capital of the company and of which the company is aware, but who are not registered shareholders) on page 77.
There have been no material changes to the company and the group’s financial or trading position (other than as disclosed in the accompanying integrated annual report).
Trencor Limited Integrated Annual Report 2015
83
The directors, whose names are given on page 2 of the integrated annual report, collectively and individually accept full responsibility for the accuracy of the information given and certify that to the best of their knowledge and belief there are no facts that have been omitted which would make any statement false or misleading, and that all reasonable enquiries to ascertain such facts have been made and that the annual report and this notice contains all information required by law and the JSe Listings requirements.
9. To present and consider the report of the social and ethics committee of the company as set out on page 17 of the document of which this notice of annual general meeting forms part (the integrated annual report).
10. To transact such other business as may be transacted at an annual general meeting.
GENERAL INSTRuCTIONS AND INFORMATION
all shareholders are encouraged to attend, speak and vote at the annual general meeting. on a show of hands, every shareholder of the company present in person or represented shall have one vote only. on a poll, every shareholder present in person, by proxy or represented shall have one vote for every share held.
if you hold certificated shares (ie have not dematerialised your shares in the company) or are registered as an own name dematerialised shareholder (ie have specifically instructed your central Security depository participant (‘cSdp’) to hold your shares in your own name on the company’s sub-register), then:
• you may attend and vote at the annual general meeting; alternatively
• you may appoint a proxy (who need not also be a shareholder of the company) to represent you at the annual general meeting by completing the attached form of proxy and, for administrative reasons, returning it to the office of the company’s transfer secretaries not less than 24 hours before the time appointed for the holding of the meeting (excluding Saturdays, Sundays and public holidays). please note that your proxy may delegate his/her authority to act on your behalf to another person, subject to the restrictions set out in the attached form of proxy as stipulated in section 58(3)(b) of the companies act. please also note that the attached form of proxy may be delivered to the company at any time before the annual general meeting and must be so delivered before your proxy may exercise any of your rights as a shareholder at the annual general meeting.
please note that if you are the owner of dematerialised shares (ie have replaced the paper share certificates representing the shares with electronic records of ownership under the JSe’s electronic settlement system, Strate Limited (‘Strate’), held through a cSdp or broker and are not registered as an ‘own name’
dematerialised shareholder you are not a registered shareholder of the company, but appear on the sub-register of the company held by your cSdp. accordingly, in these circumstances subject to the mandate between yourself and your cSdp or broker, as the case may be:
• if you wish to attend the annual general meeting you must contact your cSdp or broker, as the case may be, and obtain the relevant letter of representation from them; alternatively
• if you are unable to attend the annual general meeting but wish to be represented at the meeting, you must contact your cSdp or broker, as the case may be, and furnish them with your voting instructions in respect of the annual general meeting and/or request them to appoint a proxy. You must not complete the attached form of proxy. The instructions must be provided in accordance with the mandate between yourself and your cSdp or broker, as the case may be, within the time period required by them.
cSdps, brokers or their nominees, as the case may be, recorded in the company’s sub-register as holders of dematerialised shares held on behalf of an investor/beneficial owner in terms of Strate should, when authorised in terms of their mandate or instructed to do so by the owner on behalf of whom they hold dematerialised shares in the company, vote by either appointing a duly authorised representative to attend and vote at the annual general meeting or by completing the attached form of proxy in accordance with the instructions thereon and returning it to the company’s transfer secretaries not less than 24 hours before the time appointed for the holding of the meeting (excluding Saturdays, Sundays and public holidays).
Shareholders of the company that are companies, that wish to participate in the annual general meeting, may authorise any person to act as its representative at the annual general meeting.
Section 63(1) of the companies act requires that a person wishing to participate in the annual general meeting (including any representative or proxy) must provide satisfactory identification (such as valid identity documents, driver’s licences or passports) before they may attend or participate at such meeting.
By order of the board
Trencor Services proprietary Limited
Secretariesper: gW norval
cape Town20 June 2016

Trencor Limited Integrated Annual Report 2015
84
Notes
Trencor Limited Integrated Annual Report 2015
85
Trencor Limited(incorporated in the republic of South africa)(registration number 1955/002869/06)(‘the company’)Share code: Tre iSin: Zae000007506
For use at the annual general meeting of shareholders of the company to be held at 13th Floor, The Towers South, Heerengracht, cape Town on Friday, 5 august 2016 at 15:00.
not to be used by beneficial owners of shares who have dematerialised their shares (‘dematerialised shares’) through a central Securities depository participant (‘cSdp’) or broker, as the case may be, unless they are recorded on the sub-register as ‘own name’ dematerialised shareholders (‘own name dematerialised shareholders’). generally, you will not be an own name dematerialised shareholder unless you have specifically requested the cSdp to record you as the holder of the shares in your own name in the company’s sub-register.
only for use by certificated, own name dematerialised shareholders and cSdps or brokers (or their nominees) registered in the company’s sub-register as the holder of dematerialised shares.
each shareholder entitled to attend and vote at the meeting is entitled to appoint one or more proxies (none of whom need be a shareholder of the company) to attend, speak and vote in place of that shareholder at the annual general meeting and any adjournment or postponement thereof.
please note the following:
• the appointment of your proxy may be suspended at any time and to the extent that you choose to act directly and in person in the exercise of your rights as a shareholder at the annual general meeting;
• the appointment of the proxy is revocable; and
• you may revoke the proxy appointment by (i) cancelling it in writing, or making a later inconsistent appointment of a proxy; and (ii) delivering a copy of the revocation instrument to the proxy, and to the company.
please note that any shareholder of the company that is a company may authorise any person to act as its representative at the annual general meeting. please also note that section 63(1) of the companies act, no 71 of 2008, as amended, (‘companies act’) requires that persons wishing to participate in the annual general meeting (including the aforementioned representative) provide satisfactory identification before they may attend or participate at such meeting.
note that voting will be performed by way of a poll so that each shareholder present or represented by way of proxy will be entitled to vote the number of shares held or represented by them.
my/our proxy may delegate to another person his/her authority to act on my/our behalf at the annual general meeting, provided that my/our proxy:
• may only delegate his/her authority to act on my/our behalf at the annual general meeting to a director of the company;
• must provide written notification to the transfer secretaries of the company, namely computershare investor Services proprietary Limited of the delegation by my/our proxy of his/her authority to act on my/our behalf at the annual general meeting by no later than 15:00 on Thursday, 4 august 2016, being 24 hours (excluding Saturdays, Sundays and public holidays) before the annual general meeting to be held at 15:00 on Friday, 5 august 2016; and
• must provide to his/her delegate a copy of his/her authority to act on my/our behalf at the annual general meeting.
refer to notes on page 87.
To be returned to:
The Transfer Secretaries of Trencor Limited, namelycomputershare investor Services proprietary Limited70 marshall Street Johannesburg 2001p o Box 61051 marshalltown 2107
as soon as possible to be received, for administrative reasons, not later than 24 hours before the meeting.
Form of Proxy
i/we (full names)
of (address)
Telephone: Work Home mobile
being a shareholder(s) of the company, holding shares in the company
hereby appoint (refer note 1):
or failing him/her
or failing him/her
or failing him/her the chairperson of the annual general meeting as my/our proxy to act for me/us on my/our behalf at the aforementioned annual general meeting of shareholders of the company and at any adjournment or postponement thereof in accordance with the following instructions:
insert an ‘X’ in the relevant spaces according to how you wish your votes to be cast. if you wish to cast less than all the votes in respect of the shares held by you, insert the number of votes in respect of which you desire to vote (refer to note 2). unless otherwise instructed my/our proxy can vote as he/she deems fit.
Trencor Limited Integrated Annual Report 2015
86
For against abstain
election of directors:
ordinary resolution number 1.1: election of e oblowitz as director.
ordinary resolution number 1.2: election of rJa Sparks as director.
ordinary resolution number 1.3: election of ra Sieni as director.
non-binding advisory vote: endorsement of the remuneration policy of the company.
ordinary resolution number 2: reappointment of Kpmg inc as independent auditor.
To appoint an audit committee with the following members:
ordinary resolution number 3.1: election of e oblowitz as audit committee member.
ordinary resolution number 3.2: election of rJa Sparks as audit committee member.
ordinary resolution number 3.3: election of H Wessels as audit committee member.
Special resolution number 1: To approve and authorise the provision of financial assistance, as contemplated in section 45 of the companies act, by the company to related or inter-related companies.
Special resolution number 2: To approve the non-executive directors’ remuneration, in their capacities as directors only, from 1 July 2016 until the next annual general meeting.
Special resolution number 3: To approve the granting of a general authority to the company or its subsidiaries to acquire the issued shares of the company upon such terms and conditions and in such amounts as the directors may from time to time determine.
Signed at on this day of 2016
Signature assisted by (where applicable) signature
name of signatory name of assistant
capacity capacity
(authority of signatory to be attached if applicable – refer to note 6)
Summary of shareholders’ rights in respect of proxy appointments as contained in section 58 of the Companies Act
please note that in terms of section 58 of the companies act:
• this proxy form must be dated and signed by the shareholder appointing the proxy;
• you may appoint an individual as a proxy, including an individual who is not a shareholder of the company, to participate in and speak and vote at a shareholders meeting on your behalf and may appoint more than one proxy to exercise voting rights attached to different securities held by you;
• your proxy may delegate his/her authority to act on your behalf to another person, subject to any restriction set out in this proxy form;
• this proxy form must be delivered to the company, or to the transfer secretaries of the company, namely computershare investor Services proprietary Limited, before your proxy exercises any of your rights as a shareholder at the annual general meeting;
• the appointment of your proxy or proxies will be suspended at any time and to the extent that you choose to act directly and in person in the exercise of any of your rights as a shareholder at the annual general meeting;
• the appointment of your proxy is revocable unless you expressly state otherwise in this proxy form;
• as the appointment of your proxy is revocable, you may revoke the proxy appointment by (i) cancelling it in writing, or making a later inconsistent appointment of a proxy and (ii) delivering a copy of the revocation instrument to the proxy, and to the company. please note the revocation of a proxy appointment constitutes a complete and final cancellation of your proxy’s authority to act on your behalf as of the later of the date stated in the revocation instrument, if any, or the date on which the revocation instrument was delivered to the company and the proxy as aforesaid;
• if this proxy form has been delivered to the company, as long as that appointment remains in effect, any notice that is required by the companies act or the company’s memorandum of incorporation be delivered by the company to you will be delivered by the company to you or your proxy or proxies, if you have directed the company to do so, in writing and paid any reasonable fee charged by the company for doing so;
• your proxy is entitled to exercise, or abstain from exercising, any voting right of yours at the annual general meeting, but only as directed by you on this proxy form; and
• the appointment of your proxy remains valid only until the end of the annual general meeting or any adjournment or postponement thereof or for a period of six months, whichever is shortest, unless it is revoked by you before then on the basis set out above.
Please also read the notes opposite.
Form of Proxy (continued)
Trencor Limited Integrated Annual Report 2015
87
1. a certificated or own name dematerialised shareholder or nominee of a cSdp or broker registered as a shareholder in the company’s sub-register may insert the name of a proxy or the names of two alternative proxies of the shareholder’s choice in the space(s) provided, with or without deleting ‘the chairperson of the annual general meeting’, but any such deletion must be initialled by the shareholder. The person whose name stands first on the proxy form and who is present at the annual general meeting will be entitled to act as proxy to the exclusion of those whose names follow thereafter. if no proxy is inserted in the spaces provided, then the chairperson shall be deemed to be appointed as the proxy.
2. a shareholder’s instructions to the proxy must be indicated in the appropriate box provided. if there is no clear indication as to the voting instructions to the proxy, the proxy will be deemed to be authorised to vote or to abstain from voting at the annual general meeting as he/she deems fit in respect of all the shareholder’s votes exercisable thereat. a shareholder or his/her proxy is not obliged to use all the votes exercisable by the shareholder, but the total of the votes cast or abstained may not exceed the total of the votes exercisable by the shareholder.
3. proxy forms should be lodged with the company’s transfer secretaries, computershare investor Services proprietary Limited, 70 marshall Street, Johannesburg, 2001 or posted to computershare investor Services proprietary Limited, po Box 61051, marshalltown, 2107. Forms of proxy should, for administrative reasons, be received or lodged by no later than 24 hours (excluding Saturdays, Sundays and public holidays) before the annual general meeting (ie 15:00 on Thursday, 4 august 2016).
4. The completion and lodging of this proxy form will not preclude the relevant shareholder from attending the annual general meeting and speaking and voting in person thereat to the exclusion of any proxy appointed in terms thereof.
5. Where there are joint holders of shares, the vote of the senior joint holder who tenders a vote, as determined by the order in which the names stand in the register of shareholders, will be accepted.
6. documentary evidence establishing the authority of a person signing this proxy form in a representative capacity must be attached to this proxy form unless previously recorded by the company’s transfer secretaries or waived by the chairperson of the annual general meeting. cSdps or brokers registered as shareholders in the company’s sub-register voting on instructions from owners of shares registered in the company’s sub-sub-register, are requested that they identify the owner in the sub-sub-register on whose behalf they are voting and return a copy of the instruction from such owner to the company’s transfer secretaries together with this form of proxy.
7. any alteration or correction made to this proxy form must be initialled by the signatory/ies, but may not be accepted by the chairperson.
8. a minor must be assisted by his/her parent or guardian unless the relevant documents establishing his/her legal capacity are produced or have been registered by the company’s transfer secretaries.
9. certificated shareholders which are a company or body corporate may by resolution of their directors, or other properly authorised body, in terms of section 57 of the companies act, authorise any person to act as their representative.
10. The chairperson of the annual general meeting may, in his/her discretion, accept or reject any form of proxy which is completed other than in accordance with these notes.
11. if required, additional forms of proxy are available from the company’s transfer secretaries or the registered office of the company.
12. if you are the owner of dematerialised shares held through a cSdp or broker (or its nominee) and are not an own name dematerialised shareholder, then you are not a shareholder of the company, but appear as the holder of a beneficial interest on the relevant sub-register of the company held by your cSdp. accordingly, in these circumstances, do noT complete this proxy form. Subject to the mandate between yourself and your cSdp or broker:
• if you wish to attend the annual general meeting you must contact your cSdp or broker, as the case may be, and obtain the relevant letter of representation from them; alternatively
• if you are unable to attend the annual general meeting but wish to be represented at the meeting, you must contact your cSdp or broker, as the case may be, and furnish them with your voting instructions in respect of the annual general meeting and/or request them to appoint a proxy. You must not complete the attached form of proxy. Your instructions must be provided in accordance with the mandate between yourself and your cSdp or broker, as the case may be.
cSdps, brokers or their nominees, as the case may be, recorded in the company’s sub-register as holders of dematerialised shares held on behalf of an investor/beneficial owner in terms of Strate should, when authorised in terms of their mandate or instructed to do by the person on behalf of whom they hold the dematerialised shares, vote by either appointing a duly authorised representative to attend and vote at the annual general meeting or by completing the attached form of proxy in accordance with the instructions thereon and returning it to the company’s transfer secretaries to be received, for administrative reasons, not less than 24 hours prior to the time appointed for the holding of the meeting (excluding Saturdays, Sundays and public holidays).
Notes to the Form of Proxy
Trencor Limited Integrated Annual Report 2015
88
Corporate InformationCompany registrationTrencor Limitedincorporated in the republic of South africa on 28 September 1955registration number 1955/002869/06
Year listed1955
Registered office and postal address13th Floor The Towers SouthHeerengrachtcape Town 8001Tel: 021 421 7310 Fax: 021 419 3692 international: +27 21 421 7310
SecretaryTrencor Services proprietary Limited
Internet addresswww.trencor.net
[email protected]@trencor.net
Transfer secretariescomputershare investor Services proprietary Limited70 marshall StreetJohannesburg 2001(po Box 61051 marshalltown 2107)Tel: 011 370 5000 Fax: 011 688 7721call centre: 0861 100950 (within rSa)or +27 11 370 5000 (outside rSa)www.computershare.com
AuditorKpmg incmSc House1 mediterranean StreetForeshorecape Town 8001(po Box 4609 cape Town 8000)
Designated auditorgm pickering
Attorneysedward nathan Sonnenbergs inc
Sponsorsrand merchant Bank (a division of Firstrand Bank Limited)
Industry Classification Benchmarkindustry: industrialSupersector: industrial goods and servicesSector: industrial transportationSubsector: Transportation services
Market name: Trencor
JSE share code: Tre
ISIN: Zae000007506
Diary5 august 2016 annual general meeting31 december Financial year-endannouncements February/march: reviewed annual results
may: annual financial statementsaugust/September: interim report
dividends march and September: dividend paid
Tre
nc
or
LimiTe
d | In
te
gr
ate
d a
nn
ua
l re
po
rt
2015
Trencor LimiTed | inTegraTed annuaL reporT 2015