Embed Size (px)
Citation preview
TREND OF CAPITAL STRUCTURE FOR THECONSTRUCTION COMPANIES IN MALAYSIA
MERIAM SUHAILI
A Research Paper Submitted in Partial Fulfilmentof the Requirement For the Degree of
Corporate Master in Business Administration
Faculty of Economics and BusinessUniversiti Malaysia Sarawak
2003
APPROVAL PAGE
I certify that I have supervised and read this study and that in myopinion it conforms to acceptable standards of scholarly presentationand is fully adequate, in scope and quality, as a research paper for thedegree of Corporate Master in Business Administration.
Name : Encik Mohamad JaisSupervisorU N I M A S
This research paper was submitted to the Faculty of Economics andBusiness, UNIMAS and is accepted as partial fulfillment of therequirements for the degree of Corporate Master in BusinessAdministration.
Name : Associate Professor Dr. Shazali Abu MansorDean, Faculty of Economics and BusinessU N I M A S
i

DECLARATION AND COPYRIGHT
Name : Meriam Suhaaili
Matric No : 01-02-0633
1 hereby declare that this research is the result of my owninvestigations, except where otherwise stated. Other sources areacknowledged by footnotes giving explicit references and abibliography is appended.
Signature :
Date :
0 Copyright by MERIAM SUHAILI andUniversiti Malaysia Sarawak
2 0 0 3i i

DEDICATION
This dissertation is dedicated to
my son, brothers, sisters and friends
with love.
.1 1 1

ACKNOWLEDGEMENT
This study was accomplished with the help andassistance of many people. First and foremost, I would like tothank my supervisor, Encik Mohamad Jais , for advising andguiding me in producing this project paper.
My sincere thanks also go to all my lecturers(UNIMAS) and friends for participating in this research.
I would also like to thank all other parties, who haveextended their assistance in one way or another. Thank you.
iv
2) LITERATURE REVIEW
One of the early empirical studies on the influence of the industry on capitalstructure was by Schwartz and Aronson (1967). They found that companiesbelonging to the same industry classification generally had similar financialand companies from different industry classes generally displayed differentfinancial structures. They also concluded that there was persistent differencein financial structure of the industry classes overtime and relative stabilityin these structural differences in spite of changes in the level of taxed andthe structure of the economy.
Scott and Martin (1975) found that the financial structure were not, in fact,identical across a wide array of industries in the US firms. However,Bradelly (1984) found that there were significant differences in the meanleverage ratio of companies across industries.
In Canada, The studies made by Belkaoui (1975) showed that debt ratio didnot vary significantly by industry. The study made on the European byAggarwal (198 1) indicates that industry by itself was a significant factor inexplaining capital structure. Naidu (1984) found that industry influence on afirm’s capital structure was significant in Malaysia but not in Hong Kong,Philippine and India. Studies on Australia and South African by Naidu(1986) found that the levels of aggregate leverage were significantlydifferent between industry groups in Australia and not in South Africa.
In Malaysia there is study made on the existence of industry effect in capitalstructure. Studies made by Annuar and Shamher (1993) on the capitalstructure of companies in Malaysia using a sample of 60 companies fromfive sectors that were continuously listed from 1975 to 1989.

The studies reveal that apart from the finance sector, there was significantdifference in the leverage ratio within each sector as well as betweensectors. Tho (1993 and 1994) examine the financial structure of 122 listedcompanies from 1986 to 1990. The result is that there were significantdifferences in the financial structure between industries. And (1994)examine the capital structure of 101 listed companies from 1972 to 1991.
Mansor (1995) studies on the financial of the companies listed in KLSEfrom 1980 to 1993 by analyzing the pattern of short-term liabilities, longterm liabilities, common stock, preferred stock and retained earning. Hefound that if short-term liabilities were not considered, the average commonequity, including retained earning, for the 14 years period constituted about88 percent of the companies long term capital. This meant that only 12percent of the capital were raised by long-term borrowing.
Muhammad (1998) in his recent studies on the differences in the debt andequity levels across 10 industries for a sample of 97 KLSE listed companiesfrom 1986 to 1995. Financial Leverage is measured by using Total Debt toEquity, Total Debt to Total Asset and Command Equity to Total Asset ;Ratio. His one-way ANOVA and Kruskal-Wallis H-Statistic test showed ~significant relationship of industry effects with respect to the tree-leverage ~ratio used.
Pomerleano (1998) make a comparative study on several Asian countries inthe wake of financial crisis of 1997-1998 with the objective to determinethe performance of corporation in Hong Kong, Indonesia, Korea, Malaysia,Philippine, Taiwan and Thailand. The result indicates that Asian companiesexperience erosion of profit margins and poor financial performance asshows by declining and low return in equity as well as low return capitalemployed. His results showed that Malaysia’s Total Debt-Equity Ratio haddoubled over the 1992- 1996 period from 3 1 percent to 62 percent.
6

Claessens et al. (2000) in his study compared the growth and financialpattern of corporation in 9 East-Asian countries with the United State andGermany. The comparison was made over 9 years from 1988 to 1996. Theyfound that Malaysia’s average real Return On Asset for the nine year periodwas 6.3 percent and this was less than Indonesia, Philippines, Thailand andTaiwan but higher than Hong Kong, Japan, Korea, Singapore, Germany andUnited States.
The Malaysian’s average Total Debt Ratio of 0.908 was quite low comparedto other Asian countries. However, this ratio had continuously been risingevery year from only 0.610 in 1991 to 1.176 in 1996. Claessens et. al alsomeasures Long Term Debt as a share of Total Debt and found thatMalaysian’s ratio was only 29.2 percent. Thus, Long Term Debt accountedfor less than a third of all loans in Malaysia.
Mansor Isa and Kam Jin Ken (2001) examine the capital structure publiclisted companies in Malaysia over time and across industries, and the effectof leverage on firms’ performance. The sample over all companies thatcontinuously listed on the KLSE from 1990 to 1999.
The study finds that leverage, is significantly different across industrygroups during the period of study. The share of Long Term Debt in totalfinancing differed across industries but was genearlly stable over time forsome sectors but show noticeable increase for other sectors. There is also atendency towards increased usage of Long Term Debt over the period ofstudy. The study also finds that leverage has a positive impact on financialperformance, especially the profitability measures of the company.


A more appropriate definition of financial leverage is provided bythe ratio of Debt (both short term and long term) to Total Assets. Inthis study, the financial leverage is measured by the ratio of Debt toTotal Asset or Debt to Equity using book value.
In determining the Debt to Equity Ratio, owners’ equity ismeasured as an annual average of the product of the number ofshares outstanding and the year-end share price. In determining theDebt to Asset Ratio, the total asset figure is obtained as reported inthe financial statements of the respective firms. The average ratiofor each year is estimated by taking a simple average of the ratioover 7-year period for each firm.
3.2) MEASURES OF FINANCIAL PERFORMANCE
Performance comes in different perspective, such as shareholderwealth, profitability, productivity and so on. It can be measured byusing financial ratio such as Return on Asset, Return on Equity,Economic Value Added (EVA) and Tobin’s Q or adjusted marketreturn. Overall, firm performance can be determined on how well afirm uses its resources to generate return.
Tobin’s Q has become increasingly common as an academicsmeasure of performance by using stock market valuation to assesseconomic profits. It has been used in number of studies such asMerck et al. (1988); MC Connell and Servaes (1990); Hermalin andWeisbach (1991); Aagrawal and Knoeber (1996); Bhagaat andBlaack (1999) and Mat-Nor et. al. (1999). Basically, Tobin’s Qcombines both market and accounting information by using ratiomarket vakue (MV/BV).
10

Tobin’s Q can be defined as ratio of firm’s market value to thereplacement cost of its asset which reflects the value of a firm’sintangible asset as well as the value of its physical tangible assets.The replacement value of the firm’s assets has three maincomponents that are, the market value of capital stock, the marketvalue of the inventories and other intangible assets and share heldin other firms. Unfortunately, accurate replacement costs aredifficult to obtain.
Mansor Isa and Kam Jin-Kan (2001) has using Economic ValueAdded (EVA) to measure the company’s performance on theirstudy on Capital Structure and Financcial Performance AmongListed Companies in Malaysia. EVA was developed by SternStewart and Co. to measure a business’s “true profit”. The basicformula for EVA (Brigham et al. 1999) is as follows:-
EVA = Net Operating Profit Before Taxes - After Tax Dollar CostOf Capital
= EBIT (1 - Tc) - (OC) (1 -Tc)Kd
Whereby EBIT (1 - Tc) is Net Operating Profit After Taxes(NOPAT) and (OC) (1 - Tc)Kd is the After Tax Dollar Cost ofCapital. The most important different between EVA fromaccounting profit is that the dollar cost of capital is deducted fromthe accounting profit.
However, despite the usefulness of both Tobin’s Q and EVA modelin measuring the companies performance, the availability of timelyaccurate data is critically limited. Both of the model requiredcareful definition and involves complex calculations.
1 1
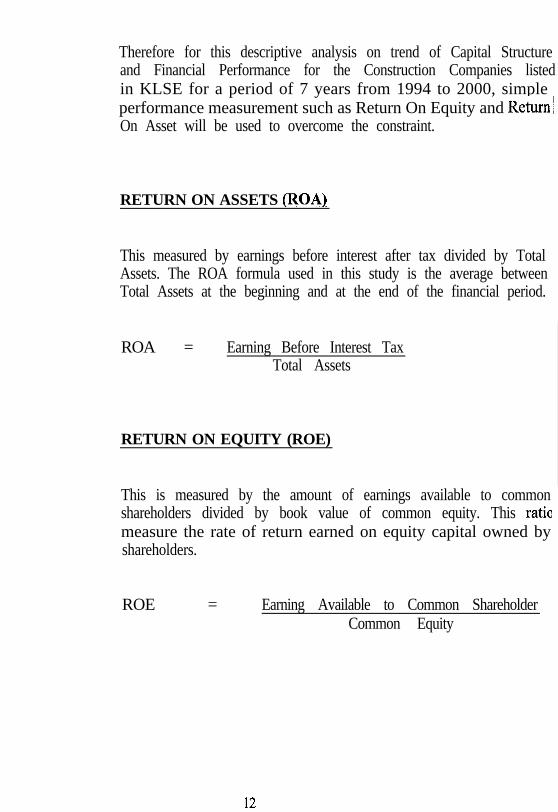
Therefore for this descriptive analysis on trend of Capital Structureand Financial Performance for the Construction Companies listedin KLSE for a period of 7 years from 1994 to 2000, simple ~performance measurement such as Return On Equity and ReturnsOn Asset will be used to overcome the constraint.
RETURN ON ASSETS (ROA)
This measured by earnings before interest after tax divided by Total ~Assets. The ROA formula used in this study is the average between ~Total Assets at the beginning and at the end of the financial period. !
ROA = Earning Before Interest TaxTotal Assets
RETURN ON EQUITY (ROE)
This is measured by the amount of earnings available to commonshareholders divided by book value of common equity. This raticmeasure the rate of return earned on equity capital owned byshareholders.
ROE = Earning Available to Common ShareholderCommon Equity
12

3.3 TANGIBILITY
This is measured by the amount of Fixed Asset to Total Assets bybook value. This ratio measures the tangibility of the company. Thegreater the proportional of tangible assets on the balance sheet, themore willing should lender supply loan.
Tangibility = Fixed AssetTotal Asset
3.4) THE FACTORS INFLUENCE THE LEVERAGE
According to Harris and Raviv (1991), the consensus is thatleverage increases with Fixed Asset, Non-debt tax shield,investment opportunities and firm size and decrease withvolatility, advertising expenditure, the probability of bankruptcy,probability and uniqueness of the products.
For this study we will focus on 3 of the abovementioned factors;tangibility of asset (the ratio of Fixed Asset to Total Asset), thePrice Book Value and profitability. We limit ourselves to thesethree factors for two reasons. First, these factors have shown upmost consistently as being correlated with leverage in previousstudy (see Bradley, Jarrell, and Kim (1984), Long and Malitz(1985), and Harris and Raviv (1991)). Second, the data severelylimits our ability to develop proxies for the other factors.
Theories of Capital Structure suggest how some of the factorsmight be correlated with leverage. If a large fraction of a firm’sassets are tangible, then assets should be served as collateral,diminishing the risk of the lender suffering the agency costs ofdebt (like risk shifting). Assets should also retain more value inliquidation. Therefore, the greater the proportion of tangible assetson the balance sheet (Fixed Asset over Total Assets) the morewilling should lenders be to supply loans, and leverage should behigher.
There are again conflicting theoretical predictions on the effects ofprofitability on leverage. Myers and Majluf (1984) predict anegative relationship, because firms will prefer to finance withinternal funds rather than debt. Jensen (1986) predicts a positiveone if the market for corporate control is effective and forces firmto commit to paying out cash by levering up. If it is ineffective,managers of profitable firms prefer to avoid the disciplinary roleof debt, which would lead to a negative correlation betweenprofitability and debt. On the supply side suppliers should be morewilling to lend to firms with current cashflow.
14
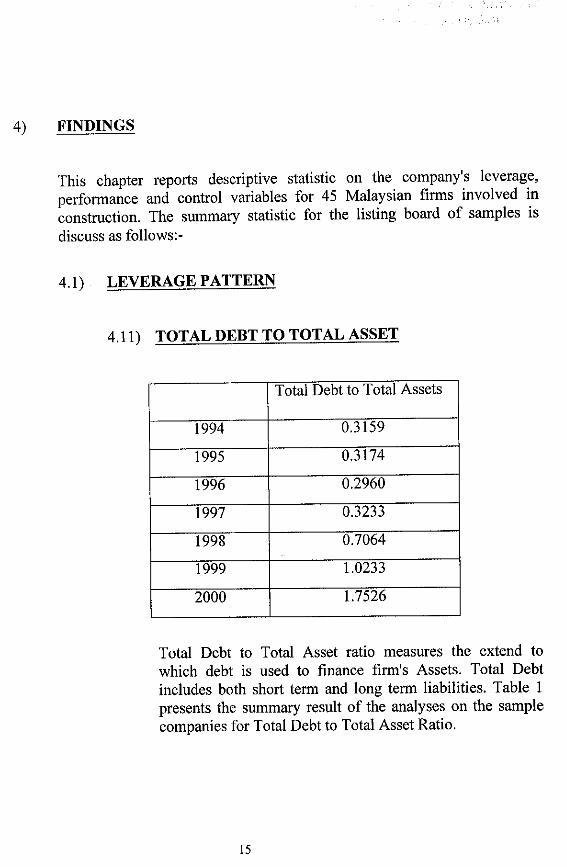
The table shows the average Total Debt to Total Asset Ratiodecreased substantially from 0.3159 and .3174 in 1994 and1995 respectively to 0.296 in year 1996. This means that inyear 1994 and 1995 the Total Asset is financed only by 0.3of Debt and the balance is by equity.
The annual increase is notable in the years of the crisiswhen the ratio rises from 0.3233 in 1997 to 1.023 in year1999 and further to 1.75 in year 2000. This finding isconsistent with Pomerleano (1998), Claessen et al (2000)and Mansor Isa andKam Jin-Ken (2001), who found thatleverage in Malaysia increased prior to the crisis. Thismight be caused by the difficulty of some companies torepay their debts. In construction companies, the increase inleverage ratio might be also effected by slow payment fromthe proceeds of the contract either from the government orthe contractee which also resulting in default of paymentand increase in Total Debts. Thus increase the leverageratio.
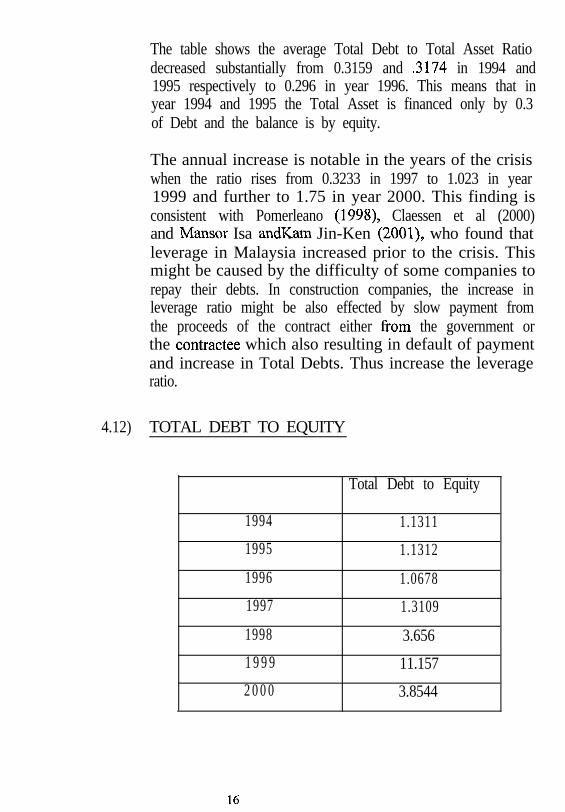
4.12) TOTAL DEBT TO EQUITY
Total Debt to Equity
1994 1.1311
1995 1.1312
1996 1.0678
1997 1.3109
1998 3.656
1 9 9 9 11.157
2 0 0 0 3.8544
16


The relationship between Tangibility (Fixed over TotalAssets) and Leverage (Total Debt to Total Asset) arepresented by Table 3. The above table shows that thetangibility does not influence the leverage in constructioncompany.
These findings are inconsistent with Raghuram G. Rajaanand Luigh Zingales whose found that Tangibility is alwayspositively correlated with leverage in all countries. Therationale underlying the factor is that tangible assets areeasy to be used as collateral thus they reduce the agencycost of debt.
However, the companies with close relationship withcreditors need to provide less collateral. The relationshipsubstitutes for physical collateral. Moreover, for theconstruction companies, the project awarded can beassigned to the creditors, instead of taking charge over theFixed Asset. Thus explained the inconsistent finding for theconstruction companies.
4.14) PRICE TO BOOK VALUE AND LEVERAGE
Debt to Asset Price toBook Value
1994 0.3159 7.1111995 0.3174 3.6281996 0.2960 3.7891997 0.3233 2.3071998 0.7064 6.898
1999 1.0233 3.4232000 1.7526 2.036
18