Embed Size (px)
Citation preview
Trends in Book-Tax Income and Balance Sheet Differences
Lillian Mills* Kaye Newberry**
William B. Trautman***
May 20, 2002
This paper was presented at the 2002 IRS Research Conference
*, ** Assistant and Associate Professors, respectively, at the University of Arizona *** Senior Economist, Internal Revenue Service LMSB:SRPP
We especially appreciate the excellent and tireless efforts of Mike Dodd and Donald Lee, LMSB Research East Senior Program Analysts, in preparing data for this project. We have benefited from discussions with members of the Internal Revenue Service, LMSB, Research East, including Charles Beauchain and Bunn Martin. We also wish to thank Charles Boynton, Fred Cox, David Harris, Fred Naimoli, Thomas Petska and participants in the 2002 IRS Research Conference for helpful comments. All opinions are our own and do not represent those of the Internal Revenue Service. Data in this paper are protected by a data non-disclosure agreement under the Internal Revenue Code and all statistics are presented in the aggregate.
Trends in Book-Tax Income and Balance Sheet Differences ABSTRACT We use Compustat and tax return data to describe trends from 1991-1998 in differences between book and tax measures of income and balance sheet amounts. Our primary findings confirm that book-tax income differences are growing throughout the 1990s. Extending prior work, we partition the sample to describe the differences by industry, global character and profitability. Secondly, we compare Compustat financial statement assets and liabilities to the book balance sheet reported on the tax return and find that the tax return amounts exceed the financial statement amounts in the aggregate. We plan to investigate suggested explanations for this excess, including differences in book versus tax consolidation reporting and off-balance sheet activity. Key words: Book-tax differences, consolidation, off-balance sheet JEL classifications: H25, H26, M4
Introduction
As a result of growing interest from Treasury in corporate tax shelters, as well as IRS
interest in incorporating financial reporting data into the tax administration process, LMSB
Research East is conducting a firm-level study of book-tax differences and compliance risks.1
Recent government and academic studies report a growing aggregate gap between book
income and taxable income. The U.S. Treasury (1999) suggested that part of this gap may
result from corporations’ growing use of tax shelters, consistent with concerns raised by some
academics (Bankman 1999) and various members of Congress.2 However, other authors
caution that the increasing use of non-qualified stock option plans (which generate tax
deductions but not book expenses) may be responsible for a large portion of the perceived
growing book-tax gap (Manzon and Plesko, 2002, Hanlon and Shevlin, 2002, Desai, 2002).
Further, book-tax consolidation differences, particularly for multinational corporations, could
generate much of the gap (Mills and Newberry 2000, Manzon and Plesko 2002).
Prior research suggests that book-tax differences relate to firms’ tax and financial
reporting incentives, as well as to mechanical differences caused by known differences between
accounting standards and tax laws. Controlling for simple causes of book-tax differences such
as depreciation and foreign repatriation, Mills (1998) finds that tax deficiencies are higher the
1 We define book-tax differences generally as pre-tax book income less taxable income, or book assets (or liabilities) less assets (or liabilities) on the tax return. As we discuss later, since there are many ways to define book income or taxable income, specific definitions are a research design choice. When we refer to differences between book income and taxable income, we call these book-tax income differences. We also measure differences between book and tax measures of assets and liabilities for the first time, and we describe these differences as book-tax balance sheet differences. 2 Representative Lloyd Doggett D-TX, sponsored both the Abusive Tax Shelter Shutdown Act of 1999, HR 2255, introduced in the House, 06/17/99, and the Abusive Tax Shelter Shutdown Act of 2001, HR 2520, introduced in the House, 07/17/01. While both bills were referred to the House Ways and Means committee,
2
more book income exceeds taxable income. Mills and Newberry (2001) learn that public firms
(with greater financial reporting pressures) have larger absolute book-tax differences than
private firms: more positive when public firms are profitable and more negative when public
firms are unprofitable. Current research by Manzon and Plesko (2002) and others highlight the
need to carefully investigate sources of book-tax differences to separate explained from
unexplained effects.
We compare financial statement data to tax return data.3 We merge Statistics of Income
(Form 1120) data with Compustat financial statement data from 1990 through 1999. This paper
summarizes some of the main issues and provides descriptive evidence from the aggregate
book-tax comparisons, based on a panel of 1,579 firms from 1991 to 1998.
Our primary findings confirm results in prior studies that book-tax income differences
are growing throughout the 1990s. Extending prior work, we partition the sample to describe
the differences by industry, global character and profitability. Secondly, we compare Compustat
financial statement assets and liabilities to the book balance sheet reported on the tax return. To
our surprise, the tax return assets and liabilities exceed the financial statement assets and
liabilities. This phenomenon is strikingly large by the end of the sample period: $1.9 trillion of
assets and $900 billion of liabilities are not reported on the Compustat financial statement
compared to the book balance sheet on the tax return.4 We have anecdotal evidence that some
neither bill was passed. Finally, the Tax Haven and Abusive Tax Shelter Reform Act of 2002 S. 2339, is in the Senate Finance Committee as of May 2002. 3 We are aware of a concurrent project by the Office of Tax Analysis, U.S. Department of Treasury to match Statistics of Income data with Compustat data, and we look forward to further discussions with the SOI_CS (Compustat) Matched File Project Team. 4 This difference could be even larger if the balance sheet on the tax return excludes the gross assets and liabilities of controlled foreign corporations that are separately reported on Forms 5471. We are perfecting these data and inquiring about common reporting practice.
3
companies are not as careful in preparing the consolidated balance sheet for the tax return as
they are for their public financial statements, possibly resulting in double-counting of assets and
liabilities on the tax return. In addition, based on preliminary discussions with IRS personnel, we
also understand that part of this difference could be related to off-balance sheet financing
resulting from structured transactions or special purpose entities. We intend to explore all
explanations in future research.
Financial versus tax reporting rules and incentives
Financial accounting standards and tax laws frequently provide specific, and often
different, rules for how to report income for book and tax purposes, even though both income
reports are based on the same underlying fundamental transactions. Some book-tax reporting
differences may be viewed as mechanical because they relate to clear differences in rules.
Examples of material book-tax differences generated by clear differences in rules are
depreciation, stock options and consolidation. We discuss the latter two in detail because they
present particular measurement challenges.
Stock options
Hanlon and Shevlin (2002) provide a detailed discussion of the accounting treatment for
nonqualified stock options, and the difficulty such treatment presents in controlling for the book-
tax difference caused by stock option deductions. There is typically little book expense
recorded for stock options, but the company receives a tax deduction when the employee
exercises the option. The deduction is equal to the difference between the fair market value of
the stock and the option price at the date of exercise. The benefit for the deduction is not
4
recorded in tax expense, but is treated as an offset to the stock transaction in the stockholders’
equity account. Thus, both the difference between book income and taxable income and the
difference between tax expense on the books and tax on the return are similarly affected. Since
neither Compustat financial data nor the tax return delineate the stock option deduction,
constructing a large-sample control is difficult.
Manzon and Plesko (2002) avoid the difficulty by using financial statement data to
estimate taxable income before an option deduction. Thus, their comparison of book income to
derived taxable income is free of the stock option difference. Hanlon and Shevlin (2002)
conduct a small-sample study using hand-collected footnote data. Desai (2002) extrapolates
employee option exercises from Compustat’s Executive Compensation database (Execucomp),
which are available for 2000 firms since 1992. He compares these computations to a detailed
analysis of 150 firms and concludes that the estimates from Execucomp “are reliable estimates
for the aggregate levels of the impact of option exercises on the corporate tax base” (Desai,
16). We intend to use Execucomp to estimate the stock option deduction for our sample of
firms in future work.
Consolidation differences
Many U.S. corporations own part or all of other corporations. Financial reporting
standards and tax laws provide different rules for when related corporations should be
combined for reporting. The combined reporting is called consolidation, in which the individual
lines of income and expense are totaled across all consolidated entities, net of transactions
between related parties.
5
Financial consolidation is governed by Statement of Financial Accounting Standard No.
94, with numerous administrative interpretations by the Financial Accounting Standards Board.
Generally, the consolidated reporting group includes the parent corporation and all subsidiaries
(both domestic and foreign) in which the parent has more than 50% ownership. If the parent
corporation does not own 100% of the subsidiary, it subtracts from net income the portion of
the subsidiary’s earnings that is allocable to the minority shareholder interest. When a
corporation owns between 20 and 50 percent of another corporation, the parent’s financial
reports include its percentage interest in the net income of that entity as “net equity of
unconsolidated subsidiaries.” If the parent owns 20 percent or less of a corporation, then it only
includes the dividends of such corporation in book income.
These general rules have flexibility related to the control exercised by the parent.
Special Purpose Entities (SPEs) have recently received great publicity as a mechanism to avoid
financial consolidation.5 The corporation can benefit by excluding the assets and the associated
debt and equity of the SPE from the consolidated balance sheet, because such entities are
typically designed with higher leverage ratios. By keeping debt out of the consolidated balance
sheet, the company protects its credit rating. Further, SPE losses appear to remain outside the
consolidated income statement. Since we do not yet know whether companies typically treat
the SPEs as corporations or as partnerships for tax purposes (the check-the-box rules would
permit either treatment), we cannot definitively comment on the tax effect. However, if the SPE
is treated as a partnership, foreign SPE losses will be deductible on the U.S. consolidated tax
return and the high leverage typical of SPEs would generate large interest deductions.

6
Tax consolidation is governed by IRC Section 1501, under which affiliated groups may
elect to file a single consolidated return. Affiliated groups may consist of corporations that are
related through ownership of at least 80%. Only domestic corporations may be included in the
affiliated group. Corporations owned less than 80% are excluded completely from the
consolidated return and file their own separate returns.
Thus, several types of entity differences arise due to book-tax consolidation
differences.6 The following differences make financial statements more inclusive than tax returns:
1. The financial statement consolidates > 50% owned foreign subsidiaries that are excluded from the tax return.
2. The financial statement consolidates > 50 to < 80% domestic subsidiaries that are excluded from the tax return
3. For companies owned 20 to 50%, the financial statement includes the percentage ownership in the net equity of companies.
On the other hand, the tax return is more inclusive than the financial statement in the
following ways:
4. The consolidated tax return includes 100% of the income for all domestic subsidiaries owned at least 80%, with no reduction for minority interest.7
5. The tax return includes dividends from unconsolidated subsidiaries, reduced by the dividends received deduction for dividends from domestic corporations.
6. The tax return may include special purpose pass-through entities that are excluded from the financial statement.
Consistent with consolidation differences existing for foreign subsidiaries, Mills and
Newberry (2000) show that average book income reported on the tax return, Form 1120,
5 See Financial Executives International (2002) for a discussion of SPE guidelines. 6 See Dworin (1985) for an early discussion of consolidation differences. 7 We assume that U.S. parents elect to file a consolidated return with all of their 80% owned subsidiaries. While corporations may file separately, our experience with the Coordinated Industry Cases suggests that affiliated groups elect to file consolidated returns.

7
Schedule M-1, lines 1 plus 2, falls between Compustat worldwide consolidated pretax income
and Compustat U.S. pretax income. Their finding for large industrial firms is consistent with
some, but not all, foreign income being repatriated and included in taxable income. We hope to
use information on dividend schedules and Form 5471 related to controlled foreign corporations
to construct a proxy for the unrepatriated foreign earnings.
There are no easy solutions for detecting and measuring consolidation differences for
domestic subsidiaries. Our anecdotal understanding from agents in the large-case audit program
(Coordinated Industry Cases) is that very large taxpayers do not have many > 50 to < 80%
owned domestic subsidiaries. We are less sure whether this is equally true for the full large and
midsize business (LMSB) program. For minority interest differences, we can adjust for the items
disclosed in the financial statements, including minority interest and equity in net earnings or loss
of nonconsolidated subsidiaries.
A recent trend is the increasing use of check-the-box regulations to choose freely
whether an entity is a corporation or a pass-through entity (like a partnership) for tax purposes.
The book use of special purpose entities to exclude the income, losses, assets and liabilities of
pass-through entities will be difficult to identify. We do not yet know how to detect book-tax
differences due to differing classification of corporation versus pass-through status, and we
welcome suggestions on how to address this issue.
Book and tax incentives to manage reporting
We discuss above how certain known differences in accounting standards versus tax
laws generate book-tax differences. However, both accounting standards and tax laws permit
8
flexibility in reporting decisions. This flexibility means that book-tax differences could be viewed
as potential indicators of either opportunistic financial reporting or tax compliance risk.
Although financial reporting principles are designed to provide relevant and reliable
information to financial statement users, managers may prepare such reports opportunistically.
Financial reporting principles emphasize consistency over time within a firm, but they permit
considerable flexibility in the choice of methods and discretion in estimation, particularly when
the information is not deemed to be ‘material’, i.e. of sufficient magnitude to affect a user’s
decision.8 Independent auditors are necessary because managers may opportunistically use the
discretion granted by financial accounting principles. Typically, users are concerned that
managers will overstate income and assets.9
In contrast, the IRS must audit tax returns to detect and deter underreporting. Tax laws
exist primarily to raise government revenues. IRC Section 446(a) states that “taxable income
shall be computed under the method of accounting on the basis of which the taxpayer regularly
computes his income in keeping his books,” but IRC Section 446(b) permits the IRS to
disallow accounting methods that do not ‘clearly reflect income.’10 Tax law only requires
conformity with financial reporting in the case of last-in first-out (LIFO) inventory. Since firm
managers generally prefer to pay less tax (to increase cash flows) and report lower tax expense
(to increase reported financial earnings), potential underreporting represents a compliance risk.
8 See Manzon and Plesko (2002) for an extended discussion of the application of the Statements of Financial Accounting Concepts No. 1 and 2. 9 Managers may also face incentives to decrease book income opportunistically. For example, firms with higher income than projected may use discretionary accruals to smooth income downward, building reserves (called ‘cookie jar’ accounting by the SEC) to use in the future to manage earnings upward. Alternatively, firms in loss years may further decrease earnings (called taking a ‘big bath’), also creating additional reserves for future use.
9
Therefore, book-tax differences represent several factors: mechanistic differences due
to specific methods required by financial accounting principles and tax laws, differences due to
managers exercising discretion in financial reporting to manage (increase or smooth) book
income, and differences due to managers exercising flexibility in tax rules to manage (generally
decrease or defer) taxable income. The portion of book-tax difference that is specifically related
to decreasing taxable income may represent a compliance risk. For example, the Treasury white
paper (1999) points to the growing gap between book income and taxable income as possible
evidence of corporations’ increasing use of abusive tax shelters that decrease taxable income
relative to book income.
An extensive empirical literature investigates how conflicting incentives affect tax,
financial and regulatory reporting (see Shackelford and Shevlin 2001 for a review). While
researchers acknowledge the dual incentives in book accounting versus tax accounting inherent
in book-tax differences, some studies emphasize one system as the economic benchmark to
evaluate manipulation in the other system.
For example, some accounting studies imply that taxable income can be used as a
benchmark for high-quality earnings. Phillips et al. (2002) find that firms avoiding an earnings
decline or loss have higher deferred tax expense, consistent with using discretionary accruals to
achieve earnings targets. Joos et al. (2002) find that extreme values of deferred tax expense are
less useful in predicting future cash flows, consistent with deferred tax expense representing
subjectivity in accruals. Mills and Newberry (2001) partition their data by profitability to control
10 See Thor Power Tool Co. v. Commissioner, 79-1 USTC 9139 for a detailed discussion by the Supreme Court of financial accounting not governing tax treatment.
10
for tax incentives in order to study financial earnings management incentives. They find results
consistent with earnings management hypotheses concerning different incentives for public
versus private firms and firms’ use of financial leverage. Desai (2002) finds no evidence that
earnings management explains financial-based book-tax differences using tests that only
compare book-tax differences across firms with different smoothing patterns and across
industries.
Other authors emphasize how firms’ decisions regarding book and tax methods are
related to the perceived effect of book-tax differences on audit scrutiny. Using an experimental
survey design, Cloyd (1995) shows that managers (especially for privately-held firms) are more
likely to recommend conforming book accounting when they are claiming an aggressive tax
position. Cloyd et al. (1996) find that tax advisors are more willing to recommend an aggressive
tax position when the book treatment will be conforming. Using IRS data, Mills (1998) shows
that IRS revenue adjustments are higher the more book income exceeds taxable income. Mills
and Sansing (2000) model the game-theoretical behavior of the firm and the IRS when book-
tax differences imperfectly signal tax evasion.
In summary, while a body of academic literature associates book-tax differences with
both tax aggressiveness and financial earnings management, there is no comprehensive firm-level
analysis of the aggregate and components of such differences using both financial statement and
tax return data. The IRS has begun such a study. Its goals are to provide a richer data set to
audit teams, understand and reconcile differences where possible, and eventually incorporate
reporting differences in models for audit selection and workload identification.
11
Sample
To study aggregate and component book-tax differences and identify indicators of
compliance risk, LMSB Research East has constructed a dataset of public companies in the
Large and Mid-Size Business (LMSB) population. The dataset is comprised of income
statement and balance sheet information from Compustat and tax return information from the
Statistics of Income Division (SOI) of the IRS, merged by employer identification number (EIN)
and accounting period.11 The merged data cover fiscal years ending between 1990 and 1999.12
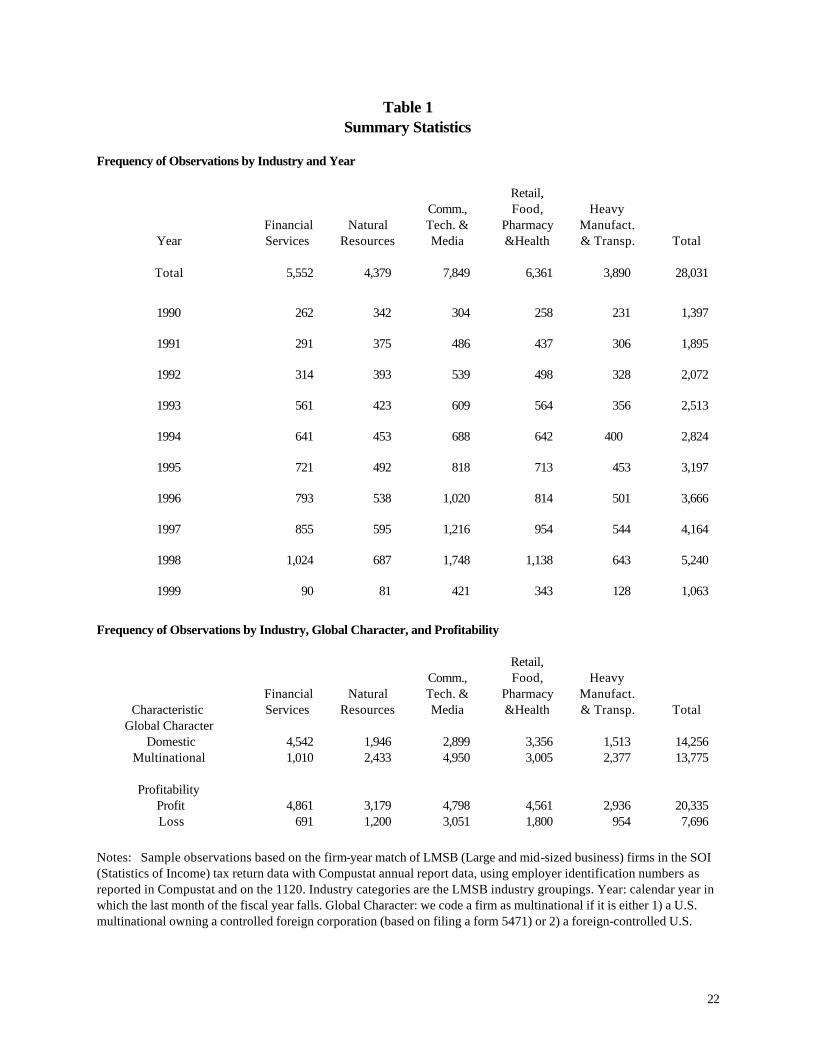
Table 1 presents aggregate statistics for the full sample. This dataset is comprised of
28,031 firm-year records for 6,191 companies. We partition the sample by industry using the
standard LMSB industry codes, by multinationality defining a company as a multinational if it has
any foreign subsidiaries or is a foreign-controlled corporation, and by profitability defining a
company as profitable if Line 28 from the tax return is positive. Nearly 50 percent of the
records are for multinational companies, and approximately 70 percent are profitable.
Since we wish to examine book-tax differences over time, we construct a panel of
1,579 companies for which Compustat and SOI data are available for each of the eight years
from 1991 to 1998. We constructed this panel because we wish to examine trends in book-tax
differences over time. As a result, the panel should not be interpreted as representative of
11 The book-to-tax income and balance sheet differences reported in this paper do not include the adjustment variables that SOI provides to correct the income, deduction, assets, and liabilities information reported by taxpayers on tax returns. While these adjustments would slightly reduce the differences reported in this paper, they should not significantly affect the results. 12 For the purposes of aggregation, we define the fiscal year as the calendar year in which the last month of the fiscal year falls. We eliminate any non-consolidated financial reports and other duplicate observations. We are also aware that mergers create some survivorship bias and that EINs may change over the sample period.
12
public LMSB companies. This panel provides the basis of the information presented in Tables 2
to 4 and Figures 1 to 7.
Financial statement / tax return comparisons
We construct several aggregate income and balance sheet book-tax differences. We
examine how these differences change over time in total and by industry, multinationality, and
profitability. The results provide a framework for future research, where we will focus on
measuring the components of these aggregate book-tax differences and identifying indicators of
compliance risk.
Book-tax income differences
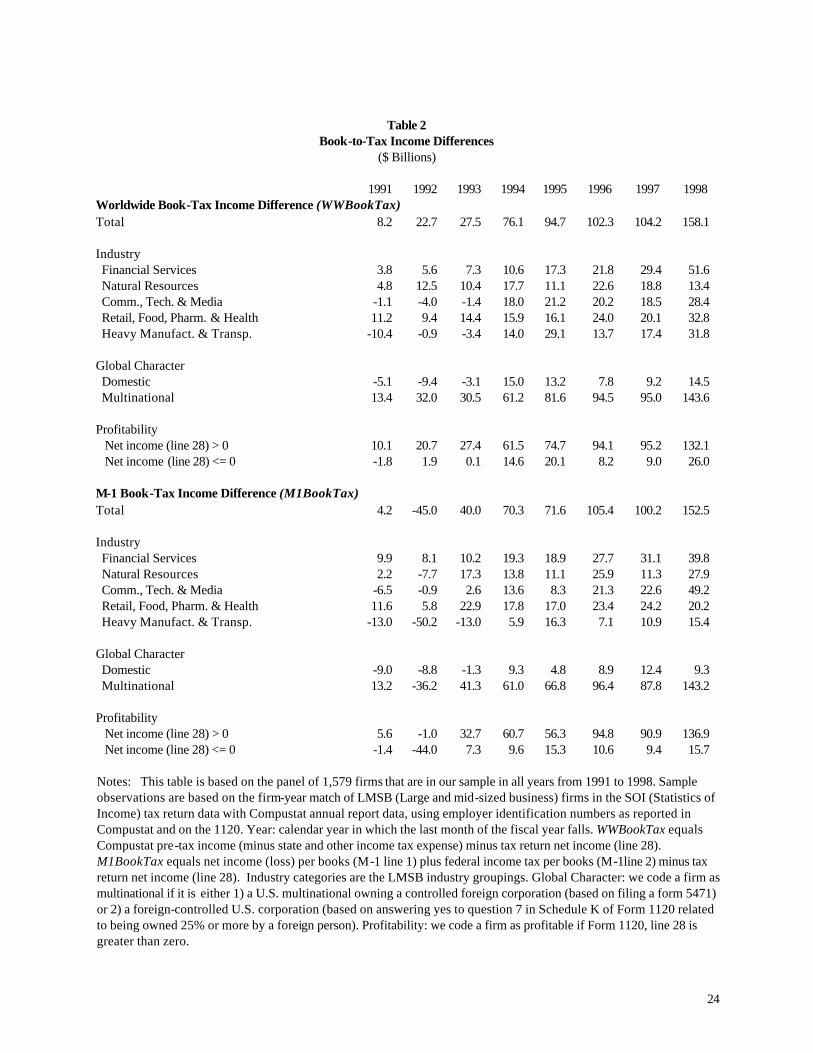
We examine two book-tax income differences. The first is the difference between
worldwide pre-tax income from Compustat (net of state and other income tax expenses) and
net taxable income before net operating loss and special deductions (Line 28 of Form 1120),
labeled WWBookTax. The second is the difference between income per books before federal
income tax (Line 1 plus Line 2 of Schedule M-1 of Form 1120) and the same net taxable
income measure as above, labeled M1BookTax.
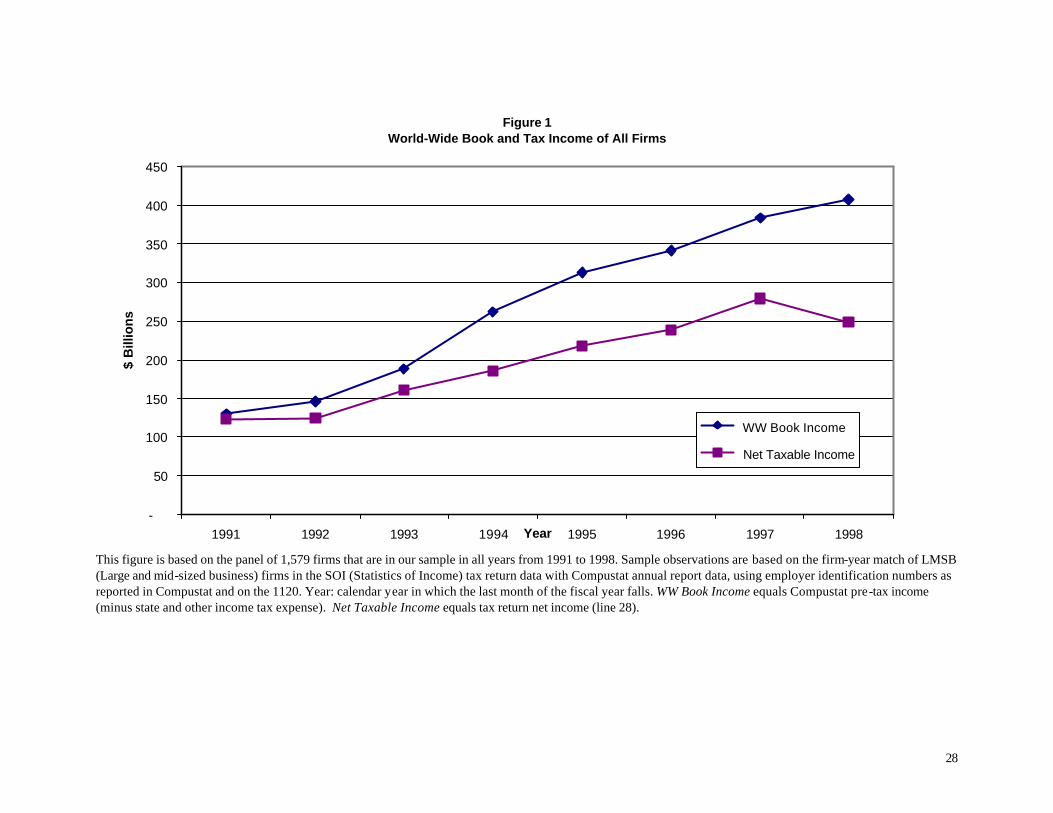
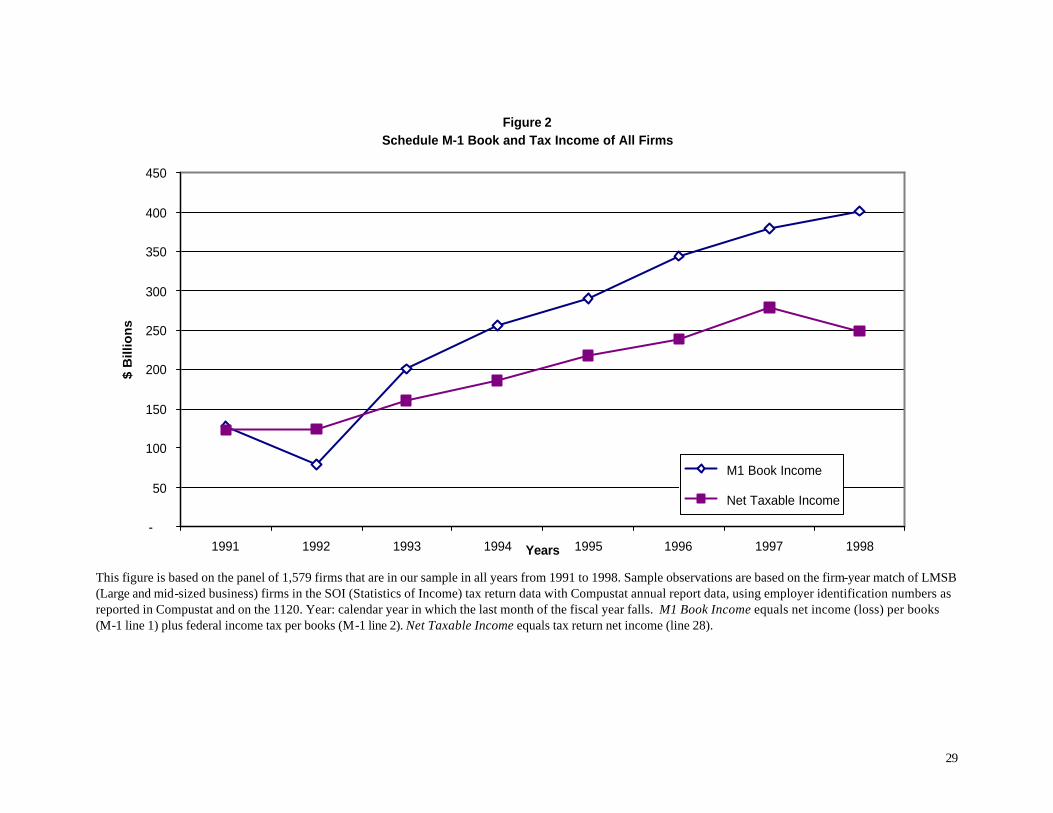
Table 2 describes the trends in WWBookTax (Panel A) and M1BookTax (Panel B)
differences. Both book-tax income differences increase significantly over the 1991 to 1998
period from less than $10 billion to over $150 billion. Since this measure may reflect increases
in income over the period, we separately graph worldwide book income and taxable income in
Figure 1 and M-1 book income and taxable income in Figure 2. These figures show that book
income and net taxable income are increasing over time with the difference between them
13
increasing. We speculate that the negative book-tax income difference in 1992 arises in part
due to Statement of Financial Accounting Standard No. 106 requiring firms to accrue other
post-retirement employment benefits (typically unfunded promises to pay medical costs to
current and future retirees).
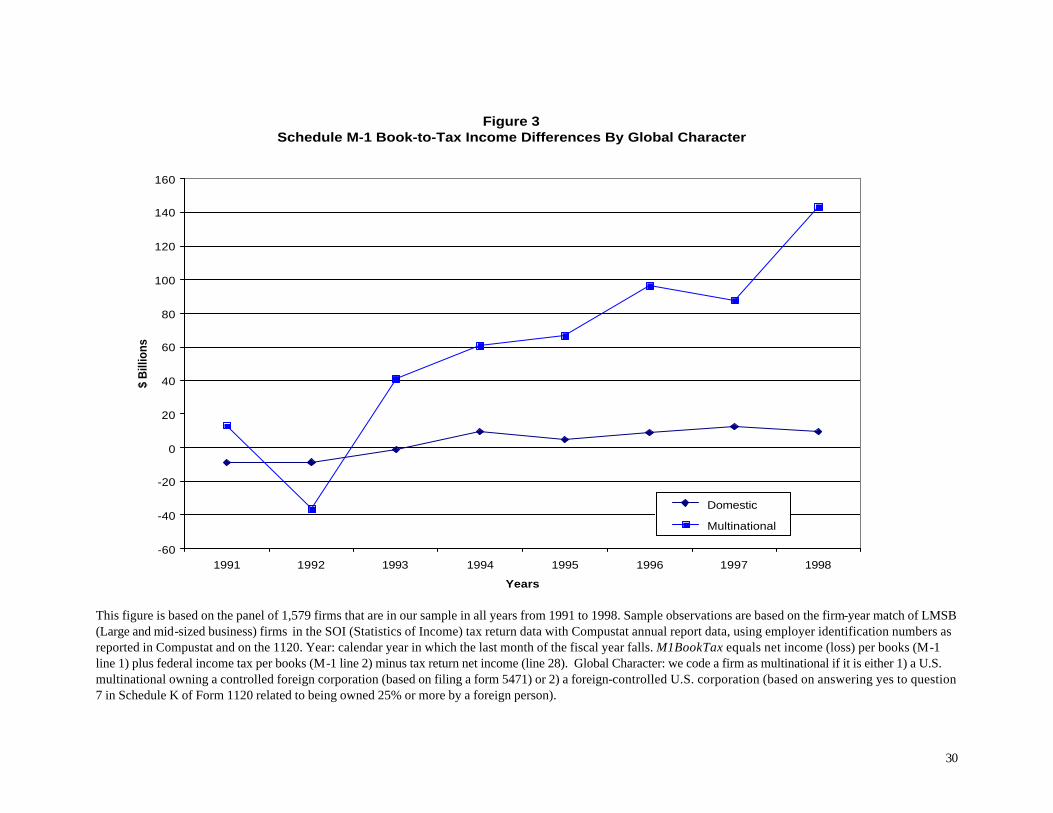
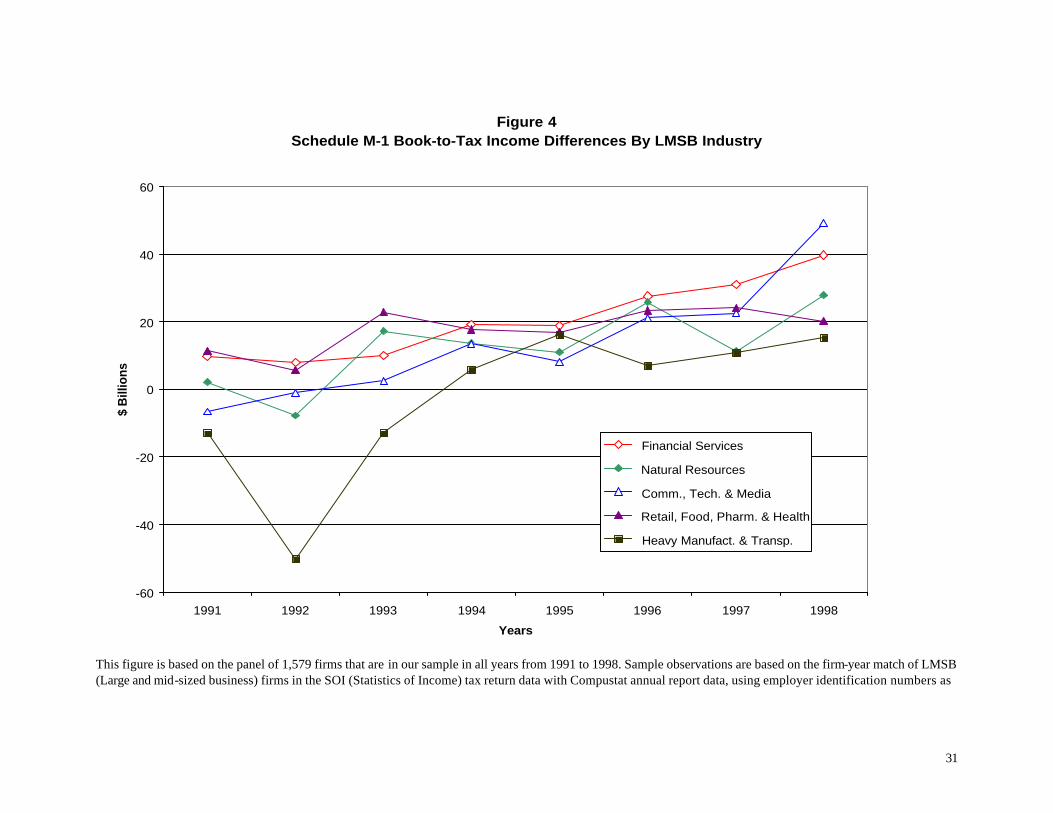
We partition the data by industry, multinationality and profitability as described above.
The results transcend all LMSB industries, domestic and multinational companies, and profit and
loss companies.13 The differences are most pronounced for multinational companies (see Figure
3), in the financial services and communications industries (see Figure 4) and in companies
showing positive net taxable income on their tax returns.
We will seek assistance from IRS personnel in the financial services industry group to
understand industry-specific differences. Common differences include the recording of loan loss
reserves and securities gains and losses differently for book and tax purposes.14 We also
expect that other book-tax differences previously discussed, such as stock options and
consolidation issues, contribute to the aggregate difference.
In addition, anecdotal information suggests that financial services firms have structured
transactions (or special purpose entities) that place assets and liabilities off the book balance
sheet, while either creating tax deductions or sheltering taxable income. While we have not
gained sufficient understanding to describe such transactions in detail, we are continuing our
conversations with IRS personnel who are experts in tax shelters, financial products and
13 See also Plesko (2002) for detailed tabulations of the M-1 total and component differences for 1996-1998. 14 IRC Section 475 provides a Mark to Market Accounting Method for Dealers in Securities for tax purposes. Statement of Financial Accounting Standards No. 115, Accounting for Certain Investments in Debt and Equity Securities generally governs accounting treatment. Securities held available for sale are marked to
14
financial services. Several material transactions involve leasing entities, wherein leasing
companies shelter lease income from taxation while building up cash in a related-party tax
haven. Other transactions include LILOs (lease-in, lease-out transactions), SLIPs (self-
liquidating income partnerships), and IRC Section 351 transactions, which transform tax-
deferred contingent liabilities into immediate capital losses. These transactions are not limited to
financial services firms, although that industry appears to generate material differences.
Our team includes several members with international examination experience, so we
expect to focus substantial attention on resolving the consolidation and repatriation issues that
contribute to the differences for multinational companies. Finally, the smaller differences for loss
firms are not surprising given Mills and Newberry’s (2001) evidence that public loss firms
engage in ‘big bath’ behavior to accrue additional non-deductible losses into loss years.
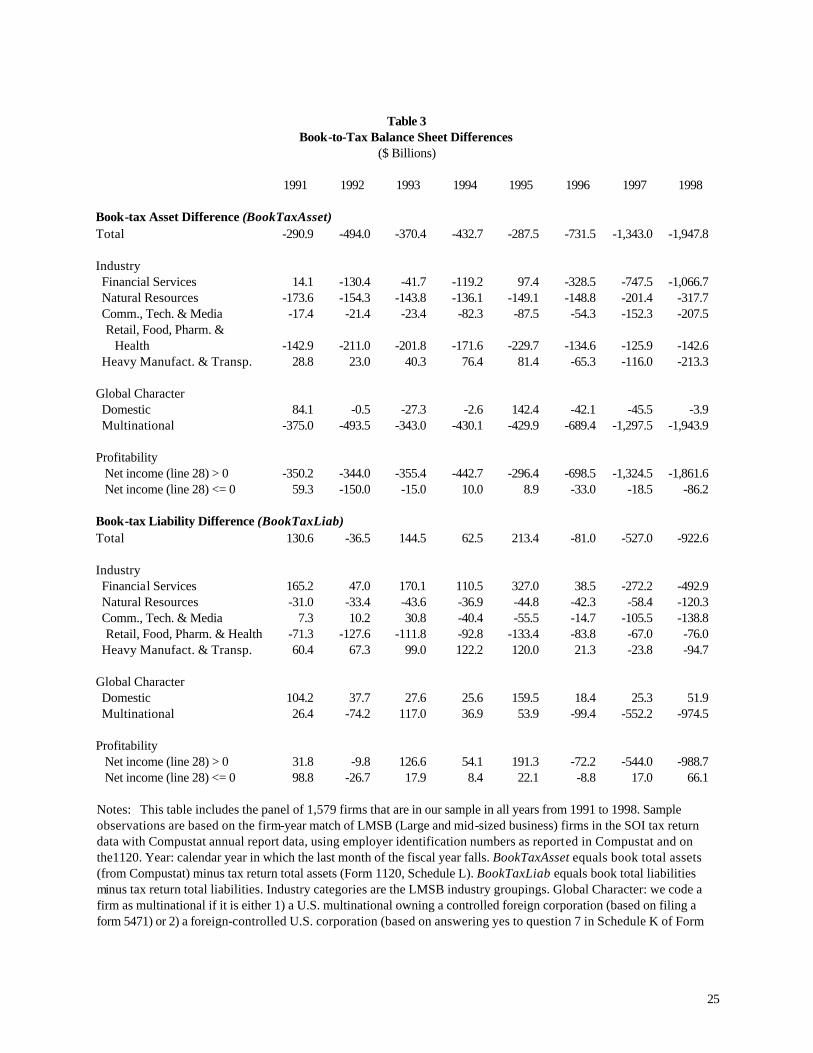
Book-tax balance sheet differences
We also examine two book-tax balance sheet differences. The first is the difference
between ending total assets from Compustat and ending total assets from Schedule L of Form
1120 (BookTaxAsset). The second is the difference between ending total liabilities from
Compustat and ending total liabilities from Schedule L of Form 1120 (BookTaxLiab). Table 3
presents these aggregate differences in total and by our partitions for industry, multinationality,
and profitability.
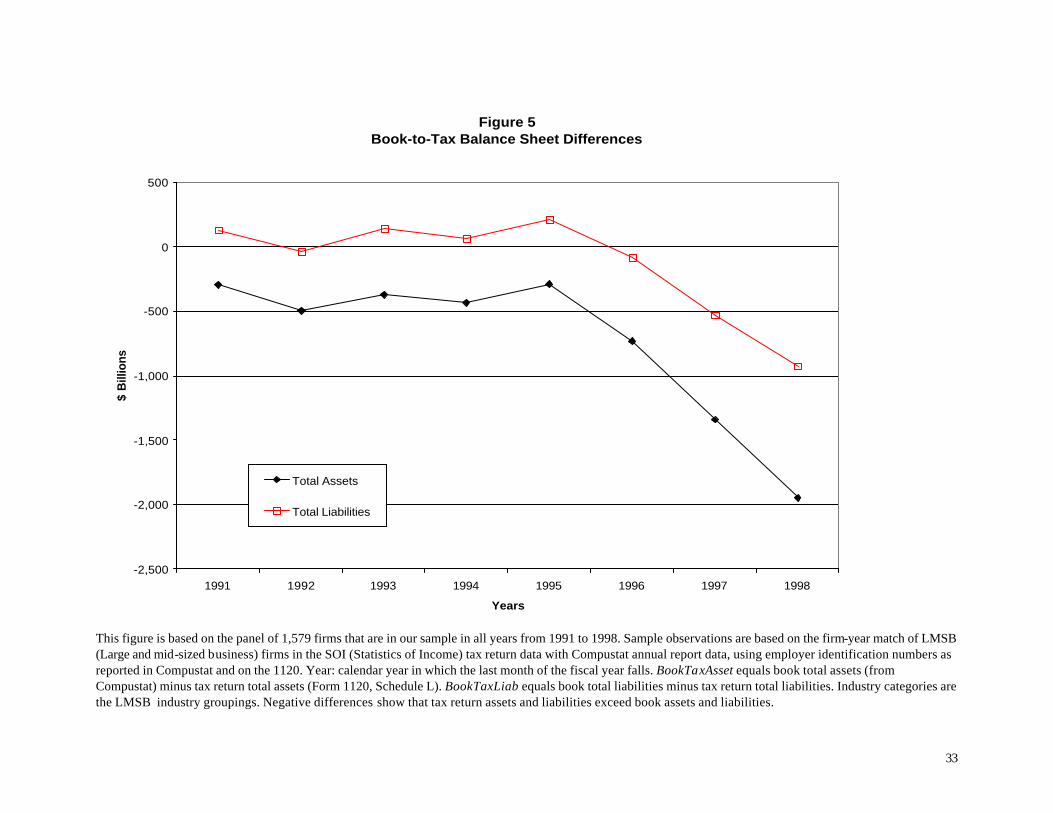
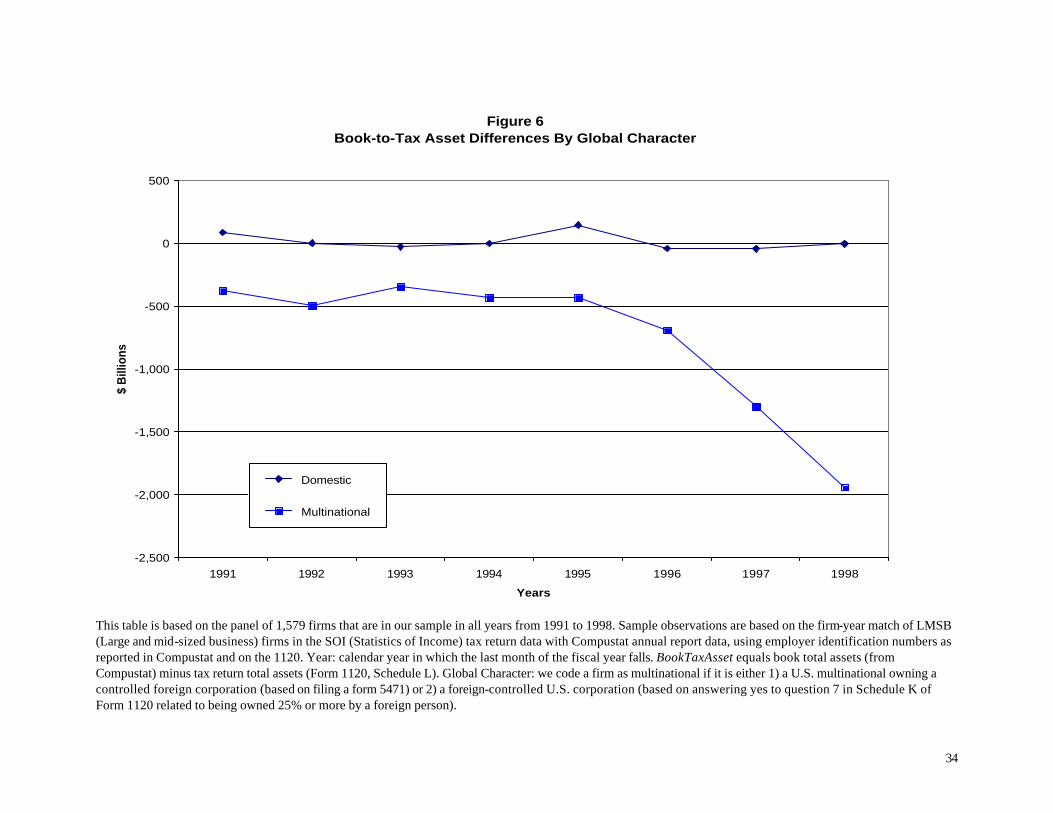
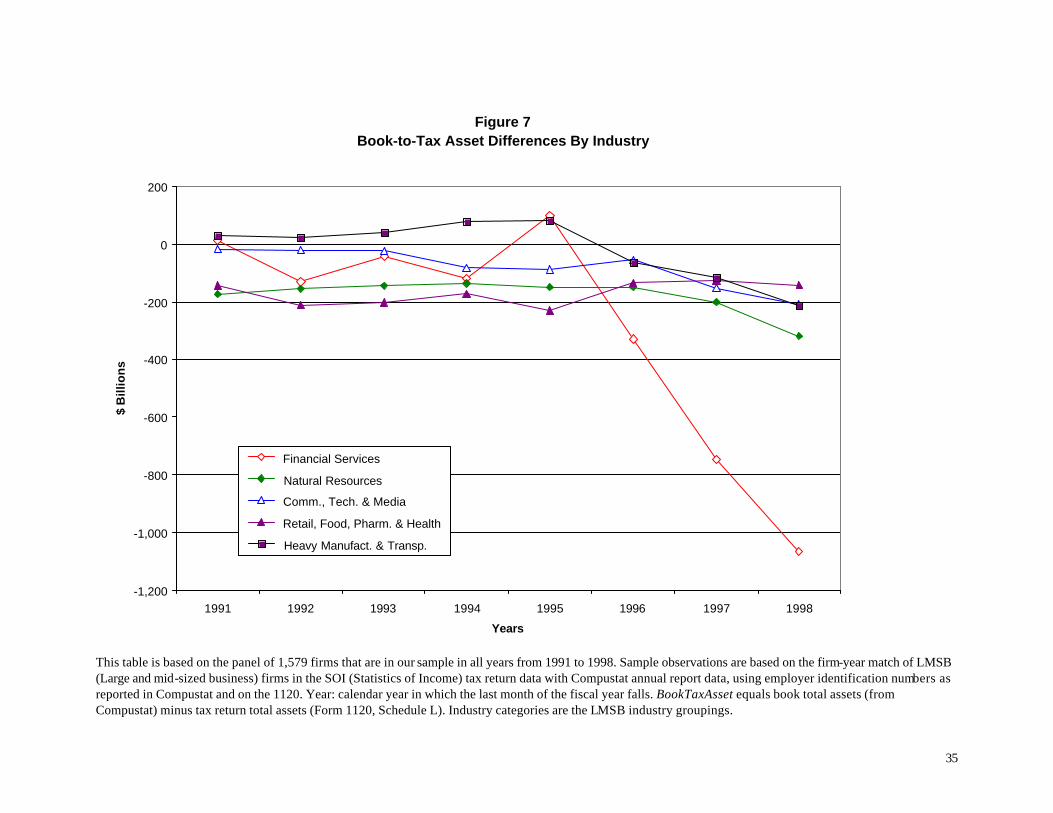
The results are similar to the book-tax income results in that the total differences grow
over time (see Figure 5), and the differences are increasing across all LMSB industries. The
market, but the unrealized gains or losses are booked to equity rather than to earnings. In contrast, unrealized gains or losses on trading securities are booked to earnings.
15
differences, and the growth in the differences, are largest among multinational companies (see
Figure 6) and in the financial services industry (see Figure 7).
We expected that the book balance sheets reported on firms’ financial statements and
their tax returns would be the same or, if they differed at all, the Compustat book assets would
exceed the tax return book assets. A finding of higher Compustat assets would be more
consistent with the financial and tax consolidation rules outlined above, and with firms’ reporting
of book income in excess of taxable income (see Table 2).
Instead, we find that book assets and liabilities are, in aggregate, less than assets and
liabilities reported on the tax return. In 1998, the last year of our panel, tax return assets
exceeded book assets by over $1.9 trillion, and tax return liabilities exceeded book liabilities by
over $0.9 trillion. The observation that nearly $2 trillion of assets (and nearly $1 trillion of
liabilities) appear to be off-balance sheet for book purposes is remarkable. We have made best
efforts to confirm these results. IRS personnel have visually examined both the 10-Ks and the
tax returns for the 50 largest firms in 1998, and have verified that our book-tax balance sheet
differences for these firms are correct.
We note that Forms 5471 report assets and liabilities for controlled foreign corporations
(CFCs). While we are still perfecting these data, the aggregate assets reported on Forms 5471
for our panel total in the trillions for 1998. At this time, we do not know to what extent the
assets and liabilities of the foreign subsidiaries are generally included in the Schedule L balance
sheet. If the Schedule L balance sheet only includes the cost basis or net equity of the foreign
subsidiaries, then the book-tax balance sheet differences could be even more negative than the
amounts shown in Table 3.

16
We acknowledge that there is unlikely to be one common answer for the difference. We
informally confirmed with two Big-5 CPA firms and one international tax director that the simple
imprecision of the Schedule L instructions ("The balance sheet should agree with the
corporation's books and records.") creates a great deal of latitude in taxpayers' interpretation.
Consistent with the prior practice experience of two of the authors, our contacts noted that
some taxpayers report only the assets and liabilities of entities included in the consolidated tax
return on Schedule L, and other taxpayers report the financial consolidated balance sheet from
the 10-K.
In untabulated results, we find that out of 1,029 multinationals in the panel in 1998, there
are 74 for which Compustat and tax return assets are equal, 145 for which they are within $1
million, and 307 for which they are within $10 million. These frequencies show that about half of
the sample reports nearly the same consolidated balance sheet on its tax return as it reports on
the financial statement 10-K.
Another explanation could be that some taxpayers fail to eliminate intercompany
transactions when combining assets and liabilities for the tax return Schedule L (see Boynton et
al. 2002). Such a simple combination would generally overstate assets and liabilities compared
to a consolidated balance sheet. We have also been told that for certain industries, transactions
that are reported net (offsetting assets and liabilities) for financial statements are reported gross
for regulatory purposes and thus possibly for tax return purposes. We have anecdotal evidence
that both of these explanations occur for some firms. We plan to investigate the extent to which
these differences could be due to these potential explanations.
17
Although taxpayers’ failing to eliminate intercompany transactions on Schedule L may
account for part of the difference, our conversations with IRS personnel expert in financial
products and abusive tax shelters suggest that part of the difference may arise due to special
purpose entities (SPEs) that are not consolidated on firms’ financial statements but may be
consolidated for tax purposes. We find firms’ growth in book income over taxable income
corresponds with their tax assets/liabilities exceeding book assets/liabilities. This reporting
pattern is consistent with parent corporations omitting the book losses, assets and liabilities of
SPEs from their consolidated financial accounts, but including these amounts on their
consolidated tax returns. We will focus our future research on a more complete understanding
of how differences in the financial and tax consolidation rules may contribute to the book-tax
income and balance sheet differences we observe.
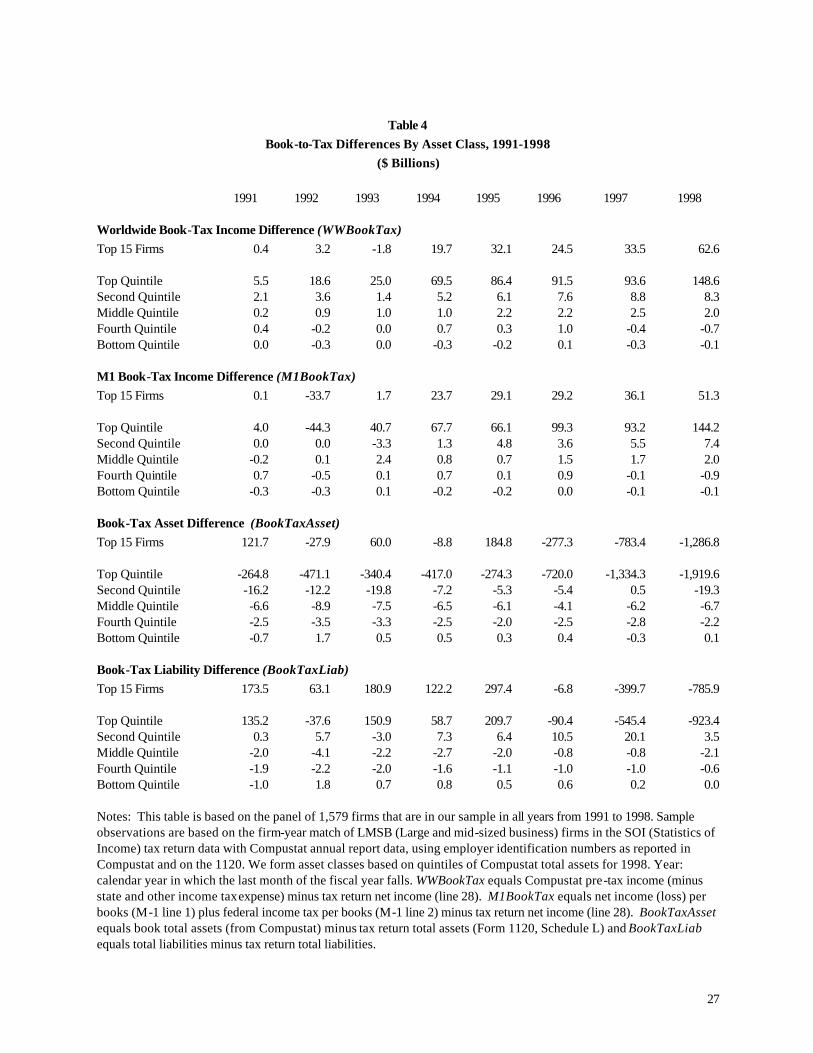
Book-tax differences by asset quintiles
We further investigate firms’ book-tax differences by quintiles of total assets. We sort
our panel of 1,579 firms by total assets reported in Compustat for 1998, group the firms into
classes by asset size, and sum the book-tax differences over these classes. The results
presented in Table 4 are consistent with the largest firms accounting for most of the book-tax
differences. Indeed, the top 20 percent of firms in terms of asset size account for virtually all of
the book-tax income and balance sheet differences in 1998.
The top 15 firms, each of whose assets exceeded $100 billion, account for over $50
billion of book-tax income differences. This represents almost one-third of the total book-tax
income difference for all firms in the panel for 1998. The top 15 firms also account for $1.2
trillion of the book-tax asset difference, representing more that 60% of the total difference for
18
1998.
Conclusions
We confirm prior indications (Treasury 1999, Manzon and Plesko 2002, Desai 2002)
that aggregate book-tax income differences grew throughout the 1990s. In addition, we
examine the growth in book-tax differences across several data partitions, including profit versus
loss firms, domestic versus multinational firms, and by industry.
We observe that book-tax income differences are most pronounced for firms with
multinational characteristics, indicating that we will need careful consolidation and repatriation
reconciliations before we can investigate compliance risk. Among our five industry groups, the
growth in book-tax income differences is largest in the financial services industry. As expected,
profitable firms have larger book-tax income differences than loss firms.
We also present balance sheet differences for the first time. On its face, this should not
be interesting because the instructions to the Form 1120 direct taxpayers to report their book
balance sheet on Schedule L. However, we find that the Schedule L reports more assets and
liabilities than the financial statement balance sheet on Compustat. The amount of the difference
has grown substantially at the end of our sample period, 1997 and 1998.
While we have just begun our efforts to reconcile these differences, our descriptive
results to date highlight directions for future analysis. We will particularly pursue consolidation
differences (including SPEs), industry-related differences and stock option differences. Our
preliminary discussions with IRS personnel concerning book-tax balance sheet differences
suggest that off-balance sheet transactions may deserve further scrutiny.

19
The non-uniformity of multinational consolidation accounting on tax returns could
impede the use of balance sheet differences to investigate off-balance sheet transactions. If so,
requiring more uniform and detailed disclosures of book-tax differences may assist tax enforcers
in their efforts to identify compliance risk. Canellos and Kleinbard (2002) argue that additional
disclosures of book-tax differences – if made public – could also benefit financial statement
users by increasing the transparency of financial reporting.
20
References
Bankman, J. 1999. The new market in corporate tax shelters. Tax Notes Today 83 (June 22),
1775-1795.
Boynton, C., P. Dobbins, P. DeFilippes, and M. Cooper. 2002. Consolidation issues in SOI 1997 Form 1120 book data compared to matched COMPUSTAT data. Office of Tax Analysis, U.S. Department of the Treasury, unpublished working paper (May).
Canellos, P. and E. Kleinbard. 2002. Disclosing book-tax differences. TaxNotes, August 12.
Cloyd, B. 1995. The effects of financial accounting conformity on recommendations of tax preparers. The Journal of the American Taxation Association 17 (Fall): 50-70.
Cloyd, B., J. Pratt, T. Stock. 1996. The use of financial accounting choice to support aggressive tax positions: Public and private firms. Journal of Accounting Research 34 (Spring): 23-43.
Desai, M. A. 2002. The corporate profit base, tax sheltering activity, and the changing nature of employee compensation. Working paper, NBER and Harvard University, Boston, MA.
Dworin, L., 1985, “On estimating corporate tax liabilities from financial statements.” Tax Notes, (December 2): 965-971.
Financial Executives International. 2002. Special Purpose Entities: understanding the guidelines. Issues Alert, January 2002, http://www.fei.org/rf/download/SPEIssuesAlert.pdf, April 26, 2002.
Hanlon, M. and T. Shevlin. 2002. Accounting for tax benefits of employee stock options and implications for research. Accounting Horizons 16 (March): 1-16.
Joos, P., J. Pratt, S. Young, 2002. Using deferred taxes to infer the quality of accruals. Working paper, Massachusetts Institute of Technology, Boston, MA.
Manzon, G., Jr. And G. Plesko. 2002. The relation between financial and tax reporting measures of income. Tax Law Review, April 29.
Mills, L. 1998. Book-tax differences and Internal Revenue Service adjustments. Journal of Accounting Research 36: 343-356.
Mills, L. and K. Newberry. 2001. The influence of tax and nontax costs on book-tax reporting differences: public and private firms. Journal of the American Taxation Association (Spring): 1-19.
21
Mills, L. and K. Newberry. 2000. Hide and seek: The search for transfer-pricing evidence using public and private data. National Tax Journal, proceedings of the National Tax Association 1999 92nd Annual Conference: 166-170.
Mills, L. and R. Sansing. 2000. Strategic tax and financial reporting decisions: Theory and evidence. Contemporary Accounting Research 17 (Spring): 85-106.
Phillips, J., M. Pincus, and S. Rego. 2002. Earnings management: new evidence based on deferred tax expense. University of Iowa working paper.
Plesko, G. 2002. Reconciling corporation book and tax net income, tax years 1996-1998. SOI Bulletin (Washington. D.C., US GPO), Spring 2002: 111-132.
Shackelford, D. and T. Shevlin. 2001. Empirical tax research in accounting. Journal of Accounting and Economics. (September) Vol. 31JAE
U.S. Department of the Treasury. 1999. The problem of corporate tax shelters: discussion, analysis and legislative proposals. (Washington, D.C.: U.S. Government Press).
22
Table 1 Summary Statistics
Frequency of Observations by Industry and Year
Year Financial Services
Natural Resources
Comm., Tech. & Media
Retail, Food,
Pharmacy &Health
Heavy Manufact. & Transp.
Total
Total 5,552 4,379 7,849 6,361 3,890 28,031
1990 262 342 304 258 231 1,397
1991 291 375 486 437 306 1,895
1992 314 393 539 498 328 2,072
1993 561 423 609 564 356 2,513
1994 641 453 688 642 400 2,824
1995 721 492 818 713 453 3,197
1996 793 538 1,020 814 501 3,666
1997 855 595 1,216 954 544 4,164
1998 1,024 687 1,748 1,138 643 5,240
1999 90 81 421 343 128 1,063
Frequency of Observations by Industry, Global Character, and Profitability
Characteristic Financial Services
Natural Resources
Comm., Tech. & Media
Retail, Food,
Pharmacy &Health
Heavy Manufact. & Transp.
Total Global Character
Domestic 4,542 1,946 2,899 3,356 1,513 14,256 Multinational 1,010 2,433 4,950 3,005 2,377 13,775
Profitability
Profit 4,861 3,179 4,798 4,561 2,936 20,335 Loss 691 1,200 3,051 1,800 954 7,696
Notes: Sample observations based on the firm-year match of LMSB (Large and mid-sized business) firms in the SOI (Statistics of Income) tax return data with Compustat annual report data, using employer identification numbers as reported in Compustat and on the 1120. Industry categories are the LMSB industry groupings. Year: calendar year in which the last month of the fiscal year falls. Global Character: we code a firm as multinational if it is either 1) a U.S. multinational owning a controlled foreign corporation (based on filing a form 5471) or 2) a foreign-controlled U.S.

23
corporation (based on answering yes to question 7 in Schedule K of Form 1120 related to being owned 25% or more by a foreign person). Profitability: we code a firm as profitable if Form 1120, line 28 is greater than zero.
24
Table 2
Book-to-Tax Income Differences ($ Billions)
1991 1992 1993 1994 1995 1996 1997 1998 Worldwide Book-Tax Income Difference (WWBookTax) Total 8.2 22.7 27.5 76.1 94.7 102.3 104.2 158.1 Industry Financial Services 3.8 5.6 7.3 10.6 17.3 21.8 29.4 51.6 Natural Resources 4.8 12.5 10.4 17.7 11.1 22.6 18.8 13.4 Comm., Tech. & Media -1.1 -4.0 -1.4 18.0 21.2 20.2 18.5 28.4 Retail, Food, Pharm. & Health 11.2 9.4 14.4 15.9 16.1 24.0 20.1 32.8 Heavy Manufact. & Transp. -10.4 -0.9 -3.4 14.0 29.1 13.7 17.4 31.8 Global Character Domestic -5.1 -9.4 -3.1 15.0 13.2 7.8 9.2 14.5 Multinational 13.4 32.0 30.5 61.2 81.6 94.5 95.0 143.6 Profitability Net income (line 28) > 0 10.1 20.7 27.4 61.5 74.7 94.1 95.2 132.1 Net income (line 28) <= 0 -1.8 1.9 0.1 14.6 20.1 8.2 9.0 26.0 M-1 Book-Tax Income Difference (M1BookTax) Total 4.2 -45.0 40.0 70.3 71.6 105.4 100.2 152.5 Industry Financial Services 9.9 8.1 10.2 19.3 18.9 27.7 31.1 39.8 Natural Resources 2.2 -7.7 17.3 13.8 11.1 25.9 11.3 27.9 Comm., Tech. & Media -6.5 -0.9 2.6 13.6 8.3 21.3 22.6 49.2 Retail, Food, Pharm. & Health 11.6 5.8 22.9 17.8 17.0 23.4 24.2 20.2 Heavy Manufact. & Transp. -13.0 -50.2 -13.0 5.9 16.3 7.1 10.9 15.4 Global Character Domestic -9.0 -8.8 -1.3 9.3 4.8 8.9 12.4 9.3 Multinational 13.2 -36.2 41.3 61.0 66.8 96.4 87.8 143.2 Profitability Net income (line 28) > 0 5.6 -1.0 32.7 60.7 56.3 94.8 90.9 136.9 Net income (line 28) <= 0 -1.4 -44.0 7.3 9.6 15.3 10.6 9.4 15.7 Notes: This table is based on the panel of 1,579 firms that are in our sample in all years from 1991 to 1998. Sample observations are based on the firm-year match of LMSB (Large and mid-sized business) firms in the SOI (Statistics of Income) tax return data with Compustat annual report data, using employer identification numbers as reported in Compustat and on the 1120. Year: calendar year in which the last month of the fiscal year falls. WWBookTax equals Compustat pre-tax income (minus state and other income tax expense) minus tax return net income (line 28). M1BookTax equals net income (loss) per books (M-1 line 1) plus federal income tax per books (M-1line 2) minus tax return net income (line 28). Industry categories are the LMSB industry groupings. Global Character: we code a firm as multinational if it is either 1) a U.S. multinational owning a controlled foreign corporation (based on filing a form 5471) or 2) a foreign-controlled U.S. corporation (based on answering yes to question 7 in Schedule K of Form 1120 related to being owned 25% or more by a foreign person). Profitability: we code a firm as profitable if Form 1120, line 28 is greater than zero.
25
Table 3
Book-to-Tax Balance Sheet Differences ($ Billions)
1991 1992 1993 1994 1995 1996 1997 1998 Book-tax Asset Difference (BookTaxAsset) Total -290.9 -494.0 -370.4 -432.7 -287.5 -731.5 -1,343.0 -1,947.8 Industry Financial Services 14.1 -130.4 -41.7 -119.2 97.4 -328.5 -747.5 -1,066.7 Natural Resources -173.6 -154.3 -143.8 -136.1 -149.1 -148.8 -201.4 -317.7 Comm., Tech. & Media -17.4 -21.4 -23.4 -82.3 -87.5 -54.3 -152.3 -207.5
Retail, Food, Pharm. & Health -142.9 -211.0 -201.8 -171.6 -229.7 -134.6 -125.9 -142.6
Heavy Manufact. & Transp. 28.8 23.0 40.3 76.4 81.4 -65.3 -116.0 -213.3 Global Character Domestic 84.1 -0.5 -27.3 -2.6 142.4 -42.1 -45.5 -3.9 Multinational -375.0 -493.5 -343.0 -430.1 -429.9 -689.4 -1,297.5 -1,943.9 Profitability Net income (line 28) > 0 -350.2 -344.0 -355.4 -442.7 -296.4 -698.5 -1,324.5 -1,861.6 Net income (line 28) <= 0 59.3 -150.0 -15.0 10.0 8.9 -33.0 -18.5 -86.2 Book-tax Liability Difference (BookTaxLiab) Total 130.6 -36.5 144.5 62.5 213.4 -81.0 -527.0 -922.6 Industry Financial Services 165.2 47.0 170.1 110.5 327.0 38.5 -272.2 -492.9 Natural Resources -31.0 -33.4 -43.6 -36.9 -44.8 -42.3 -58.4 -120.3 Comm., Tech. & Media 7.3 10.2 30.8 -40.4 -55.5 -14.7 -105.5 -138.8
Retail, Food, Pharm. & Health -71.3 -127.6 -111.8 -92.8 -133.4 -83.8 -67.0 -76.0 Heavy Manufact. & Transp. 60.4 67.3 99.0 122.2 120.0 21.3 -23.8 -94.7 Global Character Domestic 104.2 37.7 27.6 25.6 159.5 18.4 25.3 51.9 Multinational 26.4 -74.2 117.0 36.9 53.9 -99.4 -552.2 -974.5 Profitability Net income (line 28) > 0 31.8 -9.8 126.6 54.1 191.3 -72.2 -544.0 -988.7 Net income (line 28) <= 0 98.8 -26.7 17.9 8.4 22.1 -8.8 17.0 66.1 Notes: This table includes the panel of 1,579 firms that are in our sample in all years from 1991 to 1998. Sample observations are based on the firm-year match of LMSB (Large and mid-sized business) firms in the SOI tax return data with Compustat annual report data, using employer identification numbers as reported in Compustat and on the1120. Year: calendar year in which the last month of the fiscal year falls. BookTaxAsset equals book total assets (from Compustat) minus tax return total assets (Form 1120, Schedule L). BookTaxLiab equals book total liabilities minus tax return total liabilities. Industry categories are the LMSB industry groupings. Global Character: we code a firm as multinational if it is either 1) a U.S. multinational owning a controlled foreign corporation (based on filing a form 5471) or 2) a foreign-controlled U.S. corporation (based on answering yes to question 7 in Schedule K of Form

26
1120 related to being owned 25% or more by a foreign person). Profitability: we code a firm as profitable if tax return line 28 is > zero.
27
Table 4
Book-to-Tax Differences By Asset Class, 1991-1998 ($ Billions)
1991 1992 1993 1994 1995 1996 1997 1998
Worldwide Book-Tax Income Difference (WWBookTax) Top 15 Firms 0.4 3.2 -1.8 19.7 32.1 24.5 33.5 62.6
Top Quintile 5.5 18.6 25.0 69.5 86.4 91.5 93.6 148.6 Second Quintile 2.1 3.6 1.4 5.2 6.1 7.6 8.8 8.3 Middle Quintile 0.2 0.9 1.0 1.0 2.2 2.2 2.5 2.0 Fourth Quintile 0.4 -0.2 0.0 0.7 0.3 1.0 -0.4 -0.7 Bottom Quintile 0.0 -0.3 0.0 -0.3 -0.2 0.1 -0.3 -0.1
M1 Book-Tax Income Difference (M1BookTax) Top 15 Firms 0.1 -33.7 1.7 23.7 29.1 29.2 36.1 51.3
Top Quintile 4.0 -44.3 40.7 67.7 66.1 99.3 93.2 144.2 Second Quintile 0.0 0.0 -3.3 1.3 4.8 3.6 5.5 7.4 Middle Quintile -0.2 0.1 2.4 0.8 0.7 1.5 1.7 2.0 Fourth Quintile 0.7 -0.5 0.1 0.7 0.1 0.9 -0.1 -0.9 Bottom Quintile -0.3 -0.3 0.1 -0.2 -0.2 0.0 -0.1 -0.1
Book-Tax Asset Difference (BookTaxAsset) Top 15 Firms 121.7 -27.9 60.0 -8.8 184.8 -277.3 -783.4 -1,286.8
Top Quintile -264.8 -471.1 -340.4 -417.0 -274.3 -720.0 -1,334.3 -1,919.6 Second Quintile -16.2 -12.2 -19.8 -7.2 -5.3 -5.4 0.5 -19.3 Middle Quintile -6.6 -8.9 -7.5 -6.5 -6.1 -4.1 -6.2 -6.7 Fourth Quintile -2.5 -3.5 -3.3 -2.5 -2.0 -2.5 -2.8 -2.2 Bottom Quintile -0.7 1.7 0.5 0.5 0.3 0.4 -0.3 0.1
Book-Tax Liability Difference (BookTaxLiab) Top 15 Firms 173.5 63.1 180.9 122.2 297.4 -6.8 -399.7 -785.9
Top Quintile 135.2 -37.6 150.9 58.7 209.7 -90.4 -545.4 -923.4 Second Quintile 0.3 5.7 -3.0 7.3 6.4 10.5 20.1 3.5 Middle Quintile -2.0 -4.1 -2.2 -2.7 -2.0 -0.8 -0.8 -2.1 Fourth Quintile -1.9 -2.2 -2.0 -1.6 -1.1 -1.0 -1.0 -0.6 Bottom Quintile -1.0 1.8 0.7 0.8 0.5 0.6 0.2 0.0
Notes: This table is based on the panel of 1,579 firms that are in our sample in all years from 1991 to 1998. Sample observations are based on the firm-year match of LMSB (Large and mid-sized business) firms in the SOI (Statistics of Income) tax return data with Compustat annual report data, using employer identification numbers as reported in Compustat and on the 1120. We form asset classes based on quintiles of Compustat total assets for 1998. Year: calendar year in which the last month of the fiscal year falls. WWBookTax equals Compustat pre-tax income (minus state and other income tax expense) minus tax return net income (line 28). M1BookTax equals net income (loss) per books (M-1 line 1) plus federal income tax per books (M-1 line 2) minus tax return net income (line 28). BookTaxAsset equals book total assets (from Compustat) minus tax return total assets (Form 1120, Schedule L) and BookTaxLiab equals total liabilities minus tax return total liabilities.
28
Figure 1World-Wide Book and Tax Income of All Firms
-
50
100
150
200
250
300
350
400
450
1991 1992 1993 1994 1995 1996 1997 1998Year
$ B
illio
ns
WW Book Income
Net Taxable Income
This figure is based on the panel of 1,579 firms that are in our sample in all years from 1991 to 1998. Sample observations are based on the firm-year match of LMSB (Large and mid-sized business) firms in the SOI (Statistics of Income) tax return data with Compustat annual report data, using employer identification numbers as reported in Compustat and on the 1120. Year: calendar year in which the last month of the fiscal year falls. WW Book Income equals Compustat pre-tax income (minus state and other income tax expense). Net Taxable Income equals tax return net income (line 28).
29
Figure 2Schedule M-1 Book and Tax Income of All Firms
-
50
100
150
200
250
300
350
400
450
1991 1992 1993 1994 1995 1996 1997 1998Years
$ B
illio
ns
M1 Book Income
Net Taxable Income
This figure is based on the panel of 1,579 firms that are in our sample in all years from 1991 to 1998. Sample observations are based on the firm-year match of LMSB (Large and mid-sized business) firms in the SOI (Statistics of Income) tax return data with Compustat annual report data, using employer identification numbers as reported in Compustat and on the 1120. Year: calendar year in which the last month of the fiscal year falls. M1 Book Income equals net income (loss) per books (M-1 line 1) plus federal income tax per books (M-1 line 2). Net Taxable Income equals tax return net income (line 28).
30
Figure 3Schedule M-1 Book-to-Tax Income Differences By Global Character
-60
-40
-20
0
20
40
60
80
100
120
140
160
1991 1992 1993 1994 1995 1996 1997 1998
Years
$ B
illio
ns
Domestic
Multinational
This figure is based on the panel of 1,579 firms that are in our sample in all years from 1991 to 1998. Sample observations are based on the firm-year match of LMSB (Large and mid-sized business) firms in the SOI (Statistics of Income) tax return data with Compustat annual report data, using employer identification numbers as reported in Compustat and on the 1120. Year: calendar year in which the last month of the fiscal year falls. M1BookTax equals net income (loss) per books (M-1 line 1) plus federal income tax per books (M-1 line 2) minus tax return net income (line 28). Global Character: we code a firm as multinational if it is either 1) a U.S. multinational owning a controlled foreign corporation (based on filing a form 5471) or 2) a foreign-controlled U.S. corporation (based on answering yes to question 7 in Schedule K of Form 1120 related to being owned 25% or more by a foreign person).
31
Figure 4Schedule M-1 Book-to-Tax Income Differences By LMSB Industry
-60
-40
-20
0
20
40
60
1991 1992 1993 1994 1995 1996 1997 1998
Years
$ B
illio
ns
Financial Services
Natural Resources
Comm., Tech. & Media
Retail, Food, Pharm. & Health
Heavy Manufact. & Transp.
This figure is based on the panel of 1,579 firms that are in our sample in all years from 1991 to 1998. Sample observations are based on the firm-year match of LMSB (Large and mid-sized business) firms in the SOI (Statistics of Income) tax return data with Compustat annual report data, using employer identification numbers as
32
reported in Compustat and on the 1120. Year: calendar year in which the last month of the fiscal year falls. M1BookTax equals net income (loss) per books (M-1 line 1) plus federal income tax per books (M-1 line 2) minus tax return net income (line 28). Industry categories are the LMSB industry groupings.
33
Figure 5Book-to-Tax Balance Sheet Differences
-2,500
-2,000
-1,500
-1,000
-500
0
500
1991 1992 1993 1994 1995 1996 1997 1998
Years
$ B
illio
ns
Total Assets
Total Liabilities
This figure is based on the panel of 1,579 firms that are in our sample in all years from 1991 to 1998. Sample observations are based on the firm-year match of LMSB (Large and mid-sized business) firms in the SOI (Statistics of Income) tax return data with Compustat annual report data, using employer identification numbers as reported in Compustat and on the 1120. Year: calendar year in which the last month of the fiscal year falls. BookTaxAsset equals book total assets (from Compustat) minus tax return total assets (Form 1120, Schedule L). BookTaxLiab equals book total liabilities minus tax return total liabilities. Industry categories are the LMSB industry groupings. Negative differences show that tax return assets and liabilities exceed book assets and liabilities.
34
Figure 6Book-to-Tax Asset Differences By Global Character
-2,500
-2,000
-1,500
-1,000
-500
0
500
1991 1992 1993 1994 1995 1996 1997 1998
Years
$ B
illio
ns
Domestic
Multinational
This table is based on the panel of 1,579 firms that are in our sample in all years from 1991 to 1998. Sample observations are based on the firm-year match of LMSB (Large and mid-sized business) firms in the SOI (Statistics of Income) tax return data with Compustat annual report data, using employer identification numbers as reported in Compustat and on the 1120. Year: calendar year in which the last month of the fiscal year falls. BookTaxAsset equals book total assets (from Compustat) minus tax return total assets (Form 1120, Schedule L). Global Character: we code a firm as multinational if it is either 1) a U.S. multinational owning a controlled foreign corporation (based on filing a form 5471) or 2) a foreign-controlled U.S. corporation (based on answering yes to question 7 in Schedule K of Form 1120 related to being owned 25% or more by a foreign person).
35
Figure 7Book-to-Tax Asset Differences By Industry
-1,200
-1,000
-800
-600
-400
-200
0
200
1991 1992 1993 1994 1995 1996 1997 1998
Years
$ B
illio
ns
Financial Services
Natural Resources
Comm., Tech. & Media
Retail, Food, Pharm. & Health
Heavy Manufact. & Transp.
This table is based on the panel of 1,579 firms that are in our sample in all years from 1991 to 1998. Sample observations are based on the firm-year match of LMSB (Large and mid-sized business) firms in the SOI (Statistics of Income) tax return data with Compustat annual report data, using employer identification numbers as reported in Compustat and on the 1120. Year: calendar year in which the last month of the fiscal year falls. BookTaxAsset equals book total assets (from Compustat) minus tax return total assets (Form 1120, Schedule L). Industry categories are the LMSB industry groupings.