Embed Size (px)
Citation preview

September 15, 2008, to be released September 19, 2008
Report to the Health Care Access Bureau of the Massachusetts Division of Insurance
Trends in Health Claims for
Fully-Insured, Health
Maintenance Organizations in
Massachusetts, 2002-2006
Beth Fritchen, F.S.A., M.A.A.A. Kurt Giesa, F.S.A., M.A.A.A. Charlie Lauters

Trends in MA Health Insurance Costs, 2002 – 2006 Massachusetts Division of Insurance
i
Oliver Wyman has relied on a significant amount of claims and membership data submitted by the major Massachusetts health plans in performing our analysis. We at Oliver Wyman have not audited this data, but have reviewed it for reasonableness. To the extent this data is incomplete or inaccurate our findings may need to be revised. Oliver Wyman prepared this report for the sole use of the Health Care Access Bureau (HCAB) of the Massachusetts Division of Insurance. Distribution to parties other than the HCAB does not constitute advice by us to those parties. This report should not be distributed to other parties unless it is distributed in its entirety. The reliance on any aspects of this report by parties other than HCAB is not authorized by us and is done at their own risk.]

Trends in MA Health Insurance Costs, 2002 – 2006 Massachusetts Division of Insurance
ii
Contents
1. Executive Summary.......................................................................................................1 � Introduction..............................................................................................................1 � Major Findings.........................................................................................................2
2. Overall Market Trends...................................................................................................4 � Overall Trends in Medical and Pharmacy Claims per Insured Member .................4 � Membership Trends .................................................................................................7 � Member Cost Sharing ..............................................................................................8 � Relative Risk of the Population ...............................................................................9
3. Analysis of Trends in Medical Claims.........................................................................10 � Inpatient Hospital Services ....................................................................................10 � Outpatient Hospital Services..................................................................................15 � Physician Services .................................................................................................18 � Other Services........................................................................................................26
4. Analysis of Trends in Outpatient Prescription Drug Claims .......................................28 � Brand-Name vs. Generic Drugs.............................................................................28 � Mail Order vs. Retail..............................................................................................30 � Drugs by Therapeutic Class ...................................................................................31
Appendix A � List of Participating Carriers..................................................................................33
Appendix B � Methodology and Process......................................................................................34
Appendix C � Medical Claims Trends ..........................................................................................37

Trends in MA Health Insurance Costs, 2002 – 2006 Massachusetts Division of Insurance
1
1
Executive Summary
Introduction Nationwide, and in every state, policymakers, employers, and individuals are struggling to find ways to deal with access to health care services and the escalating cost of health care and health insurance. In 2006, in an effort to expand access to affordable health insurance, the Massachusetts legislature passed, and the Governor signed, a comprehensive health reform law1 mandating that residents of the Commonwealth maintain an adequate level of health coverage – called minimum creditable coverage – or face significant tax penalties. Now that all residents of the Commonwealth have access to and are required to maintain health insurance coverage, the escalating cost of health care and health insurance coverage is particularly pressing. Recognizing that between 87 and 89 cents of each premium dollar that Massachusetts’ Health Maintenance Organizations (“HMOs”) collect goes to pay medical claims expenses2, the Division of Insurance’s Health Care Access Bureau (“HCAB”) engaged Oliver Wyman Actuarial Consulting, Inc. (“Oliver Wyman”) to produce a study of historical trends in the cost of medical and pharmacy claims in order to understand the factors that are driving increases in the cost of health care and health insurance. Oliver Wyman collected and analyzed claims data with dates of service from January 1, 2002 through December 31, 2006. The data included the medical and pharmacy claims for over 2 million people annually who were residents of the Commonwealth and who were covered under fully-insured, group medical programs offered by HMOs operating in the Commonwealth. This represents over 80% of individuals covered by fully-insured health programs in the Commonwealth.
1 Chapter 58 of the Acts of 2006, 2 “Health Care in Massachusetts: Key Indicators,” June 2008, page 14, at http://www.mass.gov/Eeohhs2/docs/dhcfp/r/pubs/08/key_indicators_0608.pdf

Trends in MA Health Insurance Costs, 2002 – 2006 Massachusetts Division of Insurance
2
Oliver Wyman used the data to analyze overall health care cost trends for these HMOs’ insured business, and reviewed the claims information in detail in an effort to understand the key drivers of these historical trends. Specifically, Oliver Wyman reviewed changes in utilization of health care services over time, changes in the unit cost of the services provided, changes in the nature of the services provided, changes in patient cost sharing (e.g., the share of the cost of care that the patient paid for out-of-pocket, not including the patient’s contribution to the premium), and the overall risk profile of the population covered.
Major Findings3 � Between 2002 and 2006, the total cost for medical services per insured member per
month increased by 55%, from $154 to $239. We show this graphically in the following figure.
Hospital Inpatient23%
Hospital Outpatient27%
Professional Services46%
Miscellaneous Services4%
Hospital Inpatient21%
Hospital Outpatient32%
Professional Services43%
Miscellaneous Services4%
Hospital Inpatient23%
Hospital Outpatient31%
Professional Services43%
Miscellaneous Services4%
2002Total PMPM
$154
2006Total PMPM
$239
2004Total PMPM
$191
* PMPM = Per Member Per Month
� There were almost 2.0 million Massachusetts residents in insured HMO plans by the
end of 2006. However, total membership decreased by approximately 4% from 2002 to 2006 (the study period). Note that this does not mean that the total number of
3 Note that unless otherwise stated, when referring to trends in this report, the reference is to the total change in the cost for a category of service per insured member. This change could be the result of increases in the number of services delivered per member, changes in the type of services delivered within a category (e.g., more generic prescriptions under the category of prescription drugs), or changes in the cost per unit of service.

Trends in MA Health Insurance Costs, 2002 – 2006 Massachusetts Division of Insurance
3
people with health coverage has declined, as some of the membership may have switched to insured preferred provider plans or employer-funded self-insured plans. Indeed, the number of Commonwealth residents with health insurance remained essentially unchanged during the study period.4
� The relative health or “risk level” (including demographics) of the population covered
through fully-insured HMO programs has been stable over the study period. In other words, the increases in costs that are the subject of this report are not related to changes in the morbidity level of the population.
� In 2006, persons covered under insured HMO plans were paying a higher percentage
of the cost of health care services than they were in 2002. On average, in 2002 member cost-sharing (copayment, coinsurance, and deductibles) represented 8% of total costs.). By 2006, this figure had risen to almost 9% of total costs.
� Over the study period, total medical claim costs per insured HMO member increased
at an average annual rate of 11.6%. � The cost of inpatient hospital services per member increased by an average annual
rate of 9.2% (which is below the trend in overall medical service costs in this study) between 2002 and 2006. The utilization of inpatient hospital services remained essentially flat over the study period, and hospital inpatient cost increases accounted for the majority of the overall change in cost per member.
� The average cost of outpatient hospital services increased by 15.9% per year during
the study period. The average annual trends for radiology and laboratory services provided in an outpatient hospital setting, and the cost per member increased at average annual rates of 18.4% and 19.6%, respectively.
� The cost of physician services increased by an average rate of approximately 10% per
year. Part of this increase is due to a movement to higher level, more complex office visits being provided to the covered population.
� During the study period, the cost of pharmacy services and supplies per insured HMO
member increased at an average annual rate of 10.4%. � Generic prescription drug utilization increased dramatically over the study period. In
2002, approximately 50% of the prescriptions filled were generic drugs. This increased to 65% in 2006. Moving to generic drugs has helped in reducing the overall increases in per member pharmacy costs.
4 “Health Care in Massachusetts: Key Indicators,” June 2008, page 28, at http://www.mass.gov/Eeohhs2/docs/dhcfp/r/pubs/08/key_indicators_0608.pdf

Trends in MA Health Insurance Costs, 2002 – 2006 Massachusetts Division of Insurance
4
2
Overall Market Trends
Overall Trends in Medical and Pharmacy Claims per Insured Member In analyzing the trends in health insurance claims, Oliver Wyman normalized all reported information by converting actual utilization and cost into “per member per month” statistics, or “PMPM” statistics. Total utilization and cost data have been divided by reported insured membership by month – called member months – to derive the PMPMs which form the basis of comparing trends across the period between 2002 and 2006.
Medical Claim Trends PMPM5
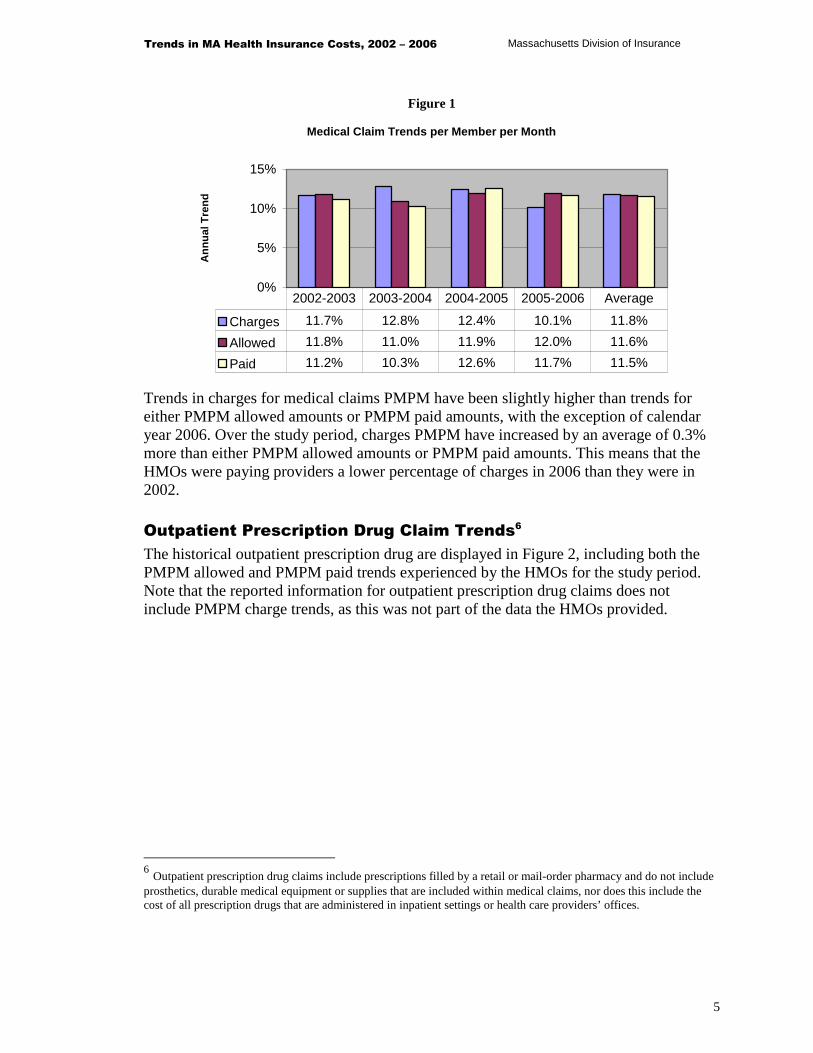
The overall historical trends in medical claims from calendar years 2002 to 2006, across all HMOs in Massachusetts, combined, are shown in Figure 1, below. There are three sets of presented trends:
(1) charges - what the health care provider bills for the service, (2) allowed amounts – what the health care provider has contractually accepted as payment for a service, and (3) paid dollars – what the HMO actually pays for the service which is net of the cost-sharing to be collected from the covered member.
Since the allowed amount is the best estimate of the actual cost of providing insured health care services, trends will be based on the allowed amount, unless otherwise specified.
5 In this report, the phrase “medical claims” is meant to include all health claims for services covered by the insurance carrier other than outpatient prescription drugs. As such, it includes services and supplies provided by or arranged by medical doctors, nurse practitioners, certified nurse midwives, mental health providers, chiropractors, podiatrists, therapists, or other covered health providers. This also includes the cost of all prescription drugs that are administered in inpatient settings or health provider’s offices.
Trends in MA Health Insurance Costs, 2002 – 2006 Massachusetts Division of Insurance
5
Figure 1
Medical Claim Trends per Member per Month
0%
5%
10%
15%
An
nu
al T
ren
d
Charges 11.7% 12.8% 12.4% 10.1% 11.8%
Allowed 11.8% 11.0% 11.9% 12.0% 11.6%
Paid 11.2% 10.3% 12.6% 11.7% 11.5%
2002-2003 2003-2004 2004-2005 2005-2006 Average
Trends in charges for medical claims PMPM have been slightly higher than trends for either PMPM allowed amounts or PMPM paid amounts, with the exception of calendar year 2006. Over the study period, charges PMPM have increased by an average of 0.3% more than either PMPM allowed amounts or PMPM paid amounts. This means that the HMOs were paying providers a lower percentage of charges in 2006 than they were in 2002.
Outpatient Prescription Drug Claim Trends6
The historical outpatient prescription drug are displayed in Figure 2, including both the PMPM allowed and PMPM paid trends experienced by the HMOs for the study period. Note that the reported information for outpatient prescription drug claims does not include PMPM charge trends, as this was not part of the data the HMOs provided.
6 Outpatient prescription drug claims include prescriptions filled by a retail or mail-order pharmacy and do not include prosthetics, durable medical equipment or supplies that are included within medical claims, nor does this include the cost of all prescription drugs that are administered in inpatient settings or health care providers’ offices.

Trends in MA Health Insurance Costs, 2002 – 2006 Massachusetts Division of Insurance
6
Figure 2
Pharmacy Claim Trends per Member per Month
0%
5%
10%
15%
20%
An
nu
al T
ren
d
Allowed 16.7% 12.5% 5.2% 7.4% 10.4%
Paid 14.8% 11.7% 5.2% 8.6% 10.0%
2002-2003 2003-2004 2004-2005 2005-2006 Average
Although outpatient prescription drug costs continued to increase during the study period, the rate of increase has generally been decreasing. This is consistent with the pattern Oliver Wyman has observed nationally. However, the single digit trends in the 2004-2005 and 2005-2006 time periods are lower than trends Oliver Wyman has observed nationwide. In general, national trends remain in the low double digits.
Combined Medical and Outpatient Prescription Drug Claim Trends
Trends in claims for medical services and outpatient prescription drugs, combined are displayed in Figure 3. Because the outpatient prescription drug data does not include charges, Figure 3 is shows trends in PMPM allowed amounts and PMPM paid amounts.
Figure 3
Total (Medical and Pharmacy) Claim Trends PMPM
0%
5%
10%
15%
An
nu
al T
ren
d
Allowed 12.5% 11.4% 10.4% 10.8% 11.3%
Paid 11.9% 10.5% 11.2% 11.2% 11.2%
2002-2003 2003-2004 2004-2005 2005-2006 Average

Trends in MA Health Insurance Costs, 2002 – 2006 Massachusetts Division of Insurance
7
The overall health trends in Massachusetts from 2003 to 2006 have remained relatively flat in the range of 11% to 13%. These trends are consistent with, though slightly below, trends Oliver Wyman has observed nationally. Chart 1 includes the overall medical, pharmacy and combined allowed costs on a per member per month (PMPM) basis. As noted in this chart, over the study period, total PMPM allowed amounts have increased from slightly less than $200 in 2002 to just under $300 PMPM in 2006.
Chart 1
Medical and Pharmacy Costs PMPM
$0
$50
$100
$150
$200
$250
$300
$350
2002 2003 2004 2005 2006
Pharmacy PMPMs Medical PMPMs Total PMPMs
Membership Trends Membership trends in the HMO market in Massachusetts have also been reviewed over the study period. In general, overall enrollment in fully-insured HMO programs is declining. On average, the decline is approximately 4% per year. This is consistent with HMO enrollment trends nationally. Figure 4 depicts the HMO enrollment figures and trends.

Trends in MA Health Insurance Costs, 2002 – 2006 Massachusetts Division of Insurance
8
Figure 4
Fully Insured HMO Members in Group Programs
-
500,000
1,000,000
1,500,000
2,000,000
2,500,000
Insu
red
Mem
ber
s
-8.0%-7.0%-6.0%-5.0%-4.0%-3.0%-2.0%-1.0%0.0%
Mem
ber
ship
Tre
nd
s
Members 1,911,6 1,848,0 1,764,1 1,640,5 1,599,7
Trend -3.3% -4.5% -7.0% -2.5%
2002 2003 2004 2005 2006
The membership analysis is for the fully-insured, group business in closed network plans7 and excludes other coverages (e.g., Medicare, Medicaid, and preferred provider plan business). While the reported enrollment in these charts has declined over the study period, this does not necessarily mean that the number of people with health coverage has declined, as they may be obtaining coverage through other, non-insured arrangements, or through non-HMOs in the market.
Member Cost Sharing In addition to the claims information, the carriers also provided information on member cost sharing during the study period which has been summarized in Figure 5.
7 In closed network plans, all services are provided or arranged through the plan’s contracted network of providers. Covered persons can only get services outside the network of providers in case of emergency, when a medically necessary covered service cannot be provided by an in-network provider, or when otherwise approved by the health plan.

Trends in MA Health Insurance Costs, 2002 – 2006 Massachusetts Division of Insurance
9
Figure 5
Member Cost Sharing as a Percent of Allowed Amounts
0.0%
5.0%
10.0%
15.0%
20.0%
25.0%
30.0%
Medical 4.1% 4.7% 5.1% 5.3% 5.3%
Pharmacy 23.2% 24.3% 24.2% 24.2% 23.5%
Total 7.9% 8.7% 9.1% 9.0% 8.7%
2002 2003 2004 2005 2006
There are several interesting results with respect to member cost-sharing.
� Insured HMO closed network plan members in Massachusetts are paying a larger proportion of the medical and pharmacy claims in 2006 than they were paying in 2002. This is consistent with what is occurring nationally, though less dramatic in magnitude, and is due primarily to the growth in member cost sharing between 2002 and 2004 for medical expenses.
� The level of member cost-sharing for pharmacy has remained relatively constant over
the study period, but the level of cost sharing is significantly higher for pharmacy claims than for medical claims. This is also consistent with national trends.
Relative Risk of the Population In order to make sure that the reported trends over the study period are based on changes in the costs of health care services and the utilization of those services, rather than on changes in the overall health or morbidity of the covered population, Oliver Wyman reviewed the relative risk of the fully-insured, group HMO population in Massachusetts. For this analysis, Oliver Wyman used the risk adjuster that Medicare uses in reimbursing Medicare Advantage contractors, the Medicare HCC 70 model, adjusted to reflect the population under age 65. While the risk for any given carrier changes somewhat over the study period, across the covered population the relative risk of the population does not change with time. Therefore, while the health costs are increasing due to changes in the utilization of services and the cost of those services, it does not appear that increasing morbidity loads are contributing in any way to the trends Oliver Wyman is reporting here.

Trends in MA Health Insurance Costs, 2002 – 2006 Massachusetts Division of Insurance
10
3
Analysis of Trends in Medical Claims
In this section, Oliver Wyman analyzes trends in medical claims in more detail. This analysis is designed to highlight the underlying causes of the overall trends exhibited in Massachusetts. Appendix C contains the utilization, cost, and PMPM trends for each line item in the cost model. In what follows, Oliver Wyman has focused its attention on the key service categories underlying trends by type of service: inpatient hospital services, outpatient hospital services, physician services, and other services.
Inpatient Hospital Services In Figure 6, Oliver Wyman shows trends in inpatient hospital services. The trend in the PMPM cost can be split into two pieces, a utilization trend, and a cost per service trend. In Figure 6, the utilization trend shown is the annual change in the number of inpatient hospital admissions per 1,000 insured members, and the annual change in the cost trend is the cost per admission.
Figure 6
Trends in Inpatient Hospital Costs per Member Per Month
-5.0%
0.0%
5.0%
10.0%
15.0%
Utilization -0.1% -0.6% -1.0% -0.9% -0.7%
$/Service 11.8% 7.7% 10.3% 10.0% 9.9%
PMPM Costs 11.7% 7.0% 9.2% 9.0% 9.2%
2002-2003 2003-2004 2004-2005 2005-2006 Average

Trends in MA Health Insurance Costs, 2002 – 2006 Massachusetts Division of Insurance
11
Figure 6 shows that the utilization of inpatient hospital services was decreasing over the study period at an average rate of 0.7% per year, while the cost per admission was increasing at 9.9% per year. While the number of admissions has decreased over the period, the average length of stay (ALOS) per admission has increased, as can be seen in Figure 7.
Figure 7
Average Length of Stay per Admission in Days
-
1.00
2.00
3.00
4.00
5.00
ALOS (Days) 4.17 4.28 4.37 4.47 4.49
2002 2003 2004 2005 2006
In Massachusetts, over the study period, the combination of a declining admission rate and an increasing length of stay per admission results in a slight positive trend in the number of inpatient days per 1,000 insured members, as shown in Figure 8.

Trends in MA Health Insurance Costs, 2002 – 2006 Massachusetts Division of Insurance
12
Figure 8
Trends in Inpatient Hospital Days per Covered Member
-2.0%
-1.0%
0.0%
1.0%
2.0%
3.0%
ALOS 2.6% 2.1% 2.3% 0.4% 1.9%
Admits -0.1% -1.2% -0.9% -0.8% -0.8%
Days 2.5% 0.8% 1.3% -0.3% 1.1%
2002-2003 2003-2004 2004-2005 2005-2006 Average
Hospitals use the coding convention called diagnosis-related groups (“DRG”) to classify hospital admissions into about 500 different groups. Each DRG is assigned a “weight” indicating the relative resources required to deliver the services associated with that DRG. Using this weighting system, Oliver Wyman was able to establish the relative intensity of services for each year. Table 1 shows the relative intensity of services by type of inpatient stay.
Table 1 Trends in Average DRG Weight per Admission
2002-2003 2003-2004 2004-2005 2005-2006 AverageUtilization Trend -2.7% -4.7% 5.4% -6.6% -2.2%
The mix of services provided by hospitals during the study show a decrease in intensity. In spite of generally less intensive service being received, the average length of stay in hospitals has increased over the study period. Patients are staying in hospitals longer for less intensive care8. Further analysis by type of admission also provides interesting results and highlights some of the factors underlying the historical trends in inpatient hospital claims, particularly the change in the mix of hospital admissions over the five-year study period. The following table shows the trends for the key types of inpatient hospital admissions (medical/surgical, maternity, and mental health). The statistics for the other, less-often
8 Some carriers were not able to provide DRG codes for all inpatient hospital claims due to limitations with their
reporting systems. This may skew the results, but we do not believe it is material. In addition, if an insurance carrier is not reimbursing hospitals using a DRG code, there may be miscoding of DRGs, since they are not used in the actual reimbursement.

Trends in MA Health Insurance Costs, 2002 – 2006 Massachusetts Division of Insurance
13
utilized types of admissions can be found in the appendix of this report which contains all categories of inpatient hospital stay trends.
Table 2 Inpatient Hospital Trends by Type of Admission
Category 2002-2003 2003-2004 2004-2005 2005-2006 AverageMedical/Surgical Admissions
Admissions per 1,000 0.9% -0.9% 1.0% -1.8% -0.2%Cost per Service 12.0% 8.3% 9.3% 11.7% 10.3%PMPM 13.0% 7.3% 10.4% 9.6% 10.1%
Maternity StaysAdmissions per 1,000 1.0% 0.2% -2.7% -1.9% -0.8%Cost per Service 6.1% 5.9% 6.5% 5.5% 6.0%PMPM 7.2% 6.2% 3.7% 3.4% 5.1%
Mental Health StaysAdmissions per 1,000 7.1% 0.6% 4.0% -2.4% 2.3%Cost per Service -0.2% 7.5% 4.3% 6.7% 4.5%PMPM 6.9% 8.1% 8.5% 4.0% 6.9%
While the utilization of medical/surgical and maternity inpatient care has been relatively constant, PMPM costs rose due to increases in the average cost per stay. Mental health PMPM costs have risen less rapidly than those for medical/surgical or maternity admissions, and the increase in mental health PMPM costs is due to both increases in costs per stay, as well as increasing utilization.
Top 10 Types of Admissions by DRG
The analysis below shows the trend in the PMPM for the top ten DRGs, based on total spending during the study period9.
9 A few of the carriers, representing less than 5% of overall HMO membership, were not able to provide DRG information along with their inpatient claims. Data from these HMOs is not included in this analysis.

Trends in MA Health Insurance Costs, 2002 – 2006 Massachusetts Division of Insurance
14
Table 3 Trends in per Member per Month Costs for Top 10 DRGs
DRG Description 2002-2003 2003-2004 2004-2005 2005-2006 Average
373 Vaginal Delivery 5.6% 1.7% -1.2% 5.3% 2.8%
371 Cesarean Section 9.2% 15.8% 5.4% 8.0% 9.5%
483 Tracheostomy 43.9% -22.8% -14.3% 16.9% 2.7%
430 Psychoses 5.4% 9.8% 9.2% -1.1% 5.7%
209 Major Joint & Limb Reattachment (Lower Extremities) 2.8% 18.9% 22.8% 5.9% 12.3%
372 Vaginal Delivery w/ complications 0.4% 6.7% 0.3% 4.7% 3.0%
359 Uterine & Adnexa Proc. -1.1% 7.3% 5.3% 2.2% 2.3%
148 Small & Large Bowel Procedures 29.2% 26.1% -15.8% -37.2% -3.7%
629 Neonate 16.6% 14.5% 5.3% 10.0% 11.5%
288 OR Procedures for Obesity 7.7% 14.6% 11.8% 14.3% 12.1%
Maternity-related stays account for four of the top ten DRG stays in the Massachusetts market. This is consistent with other medical claims data we at Oliver Wyman have observed. One interesting result from this data is the trend associated with normal deliveries and cesarean deliveries. The overall trends for cesarean deliveries over the study period are significantly higher than the trends associated with normal deliveries. In 2002, Cesarean sections represented 27% of the maternity deliveries and 35% of all inpatient hospital maternity costs. By 2006, Cesarean sections grew to 33% of all maternity deliveries and 42% of all inpatient maternity costs. The tables below show the resulting cost and utilization trends for normal deliveries and Cesarean sections.
Table 4 Trends in Deliveries
2002-2003 2003-2004 2004-2005 2005-2006 Average
Normal Delivery TrendsCost per Service 3.6% 4.2% 5.2% 7.9% 5.2%Utilization per 1,000 -0.1% -1.0% -5.4% -2.9% -2.4%
Cesarean Section TrendsCost per Service 2.7% 7.8% 1.3% 8.9% 5.2%Utilization per 1,000 6.8% 8.5% 3.7% -0.4% 4.6%

Trends in MA Health Insurance Costs, 2002 – 2006 Massachusetts Division of Insurance
15
The overall average cost per service trends for normal and cesarean deliveries are identical. The difference is the utilization; normal deliveries experienced a negative utilization trend while cesarean deliveries had a positive trend over the study period.
Outpatient Hospital Services This report does not present the utilization and average cost statistics for outpatient hospital services because utilization information is not always consistently reported among the types of service within the overall category of outpatient services, or among the HMOs. For example, one HMO may report outpatient surgery using time as the measure where another may report the number of persons served. However, in some of the more detailed analyses that follow, where lab services are covered on their own, Oliver Wyman is able to show utilization and average cost trends, since the units are consistent within the sub-categories of outpatient hospital services.
Figure 9
Trends in Outpatient Hospital Costs Per Member Per Month
0.0%
5.0%
10.0%
15.0%
20.0%
25.0%
PMPM Trend 20.4% 15.7% 13.8% 13.7% 15.9%
2002-2003 2003-2004 2004-2005 2005-2006 Average
In general, annual increases in outpatient hospital costs declined over the period. They are higher than the corresponding increases in inpatient hospital trends. The charts below show the key components of trends in the cost of selected outpatient hospital services. The trends for all outpatient hospital services can be found in the appendix of this report.
Trends in MA Health Insurance Costs, 2002 – 2006 Massachusetts Division of Insurance
16
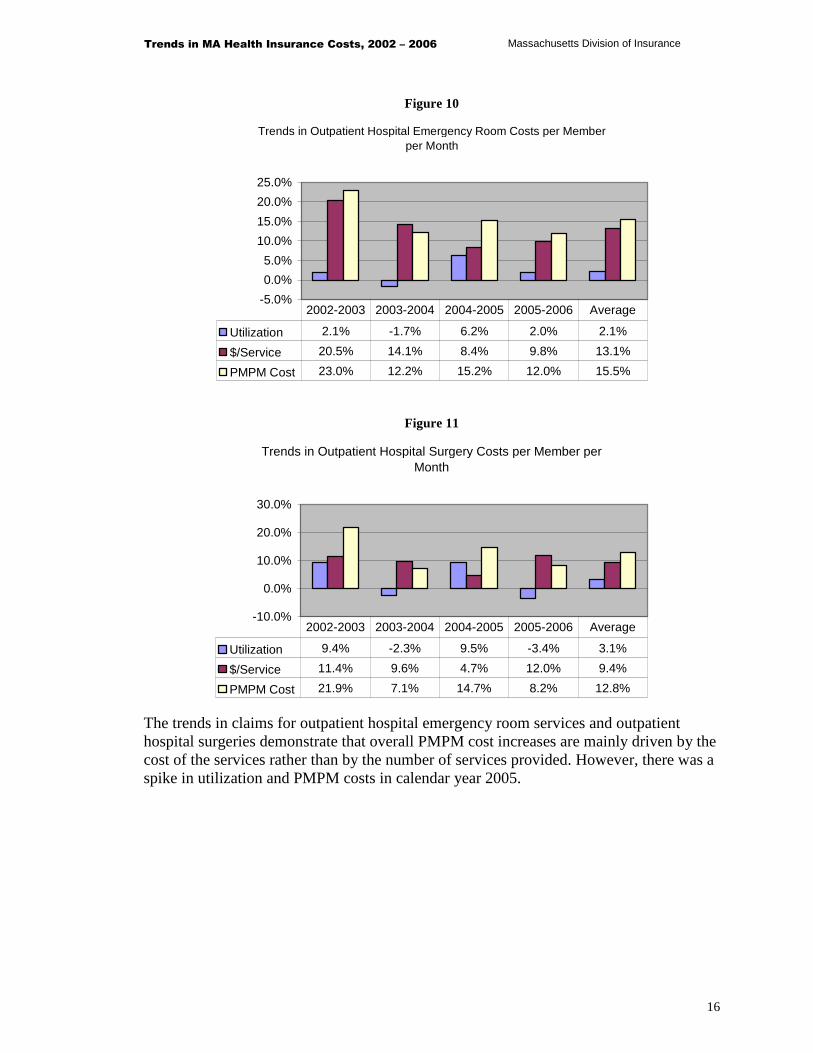
Figure 10
Trends in Outpatient Hospital Emergency Room Costs per Member per Month
-5.0%
0.0%
5.0%
10.0%
15.0%
20.0%
25.0%
Utilization 2.1% -1.7% 6.2% 2.0% 2.1%
$/Service 20.5% 14.1% 8.4% 9.8% 13.1%
PMPM Cost 23.0% 12.2% 15.2% 12.0% 15.5%
2002-2003 2003-2004 2004-2005 2005-2006 Average
Figure 11
Trends in Outpatient Hospital Surgery Costs per Member per Month
-10.0%
0.0%
10.0%
20.0%
30.0%
Utilization 9.4% -2.3% 9.5% -3.4% 3.1%
$/Service 11.4% 9.6% 4.7% 12.0% 9.4%
PMPM Cost 21.9% 7.1% 14.7% 8.2% 12.8%
2002-2003 2003-2004 2004-2005 2005-2006 Average
The trends in claims for outpatient hospital emergency room services and outpatient hospital surgeries demonstrate that overall PMPM cost increases are mainly driven by the cost of the services rather than by the number of services provided. However, there was a spike in utilization and PMPM costs in calendar year 2005.

Trends in MA Health Insurance Costs, 2002 – 2006 Massachusetts Division of Insurance
17
Figure 12
Trends in Outpatient Hospital Radiology Costs per Member per Month
-40.0%-20.0%
0.0%20.0%40.0%60.0%80.0%
Utilization 9.2% 31.2% 11.0% 61.3% 26.5%
$/Service 6.3% -6.2% 5.6% -27.2% -6.4%
PMPM Cost 16.1% 23.1% 17.2% 17.3% 18.4%
2002-2003 2003-2004 2004-2005 2005-2006 Average
The overall trends in PMPM costs for outpatient hospital radiology services remained relatively level during the study period. However, there are significant variations in the trends in the cost per service and utilization. We at Oliver Wyman suspect that this may be due, at least in part, to changes in the way the HMOs are reporting services.
Figure 13
Trends in Outpatient Hospital Laboratory Costs per Member per Month
0.0%
10.0%
20.0%
30.0%
Utilization 11.5% 17.1% 3.9% 19.2% 12.8%
$/Service 11.2% 7.6% 4.6% 1.3% 6.1%
PMPM Cost 24.0% 25.9% 8.7% 20.7% 19.6%
2002-2003 2003-2004 2004-2005 2005-2006 Average
As was the case with outpatient hospital radiology, the overall cost PMPM for laboratory services increased at a rapid rate over the study period.
Trends in MA Health Insurance Costs, 2002 – 2006 Massachusetts Division of Insurance
18
Imaging Analysis
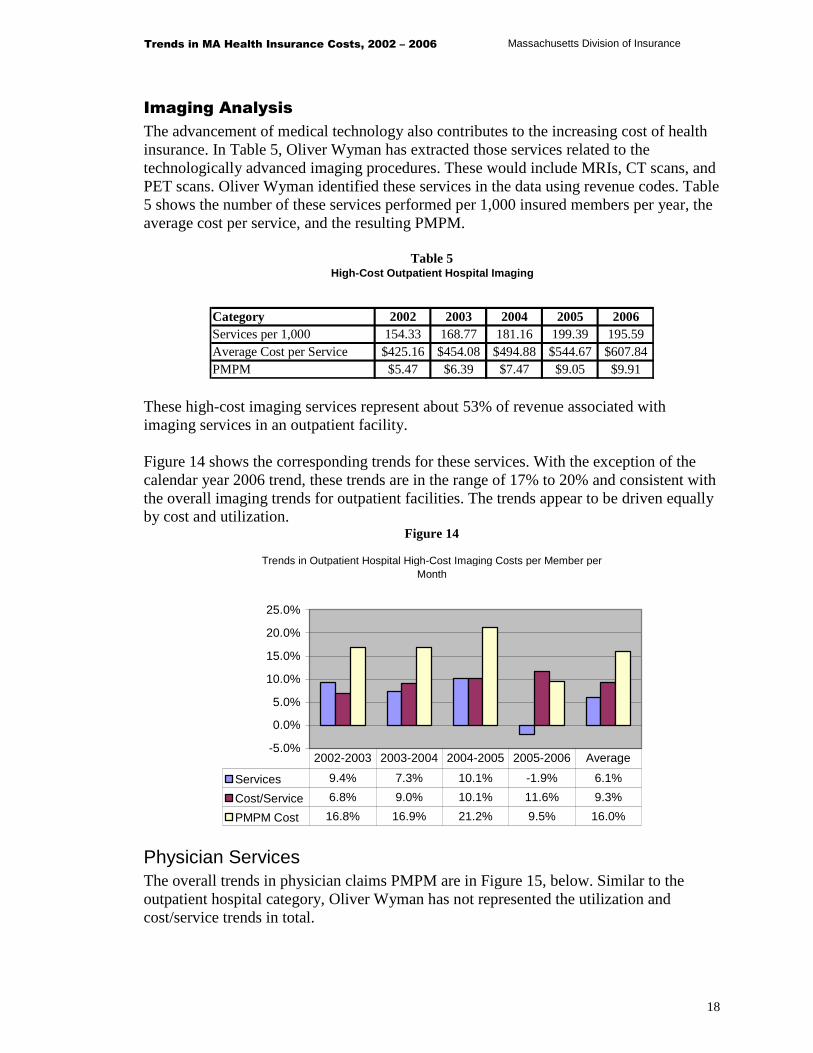
The advancement of medical technology also contributes to the increasing cost of health insurance. In Table 5, Oliver Wyman has extracted those services related to the technologically advanced imaging procedures. These would include MRIs, CT scans, and PET scans. Oliver Wyman identified these services in the data using revenue codes. Table 5 shows the number of these services performed per 1,000 insured members per year, the average cost per service, and the resulting PMPM.
Table 5 High-Cost Outpatient Hospital Imaging
Category 2002 2003 2004 2005 2006Services per 1,000 154.33 168.77 181.16 199.39 195.59Average Cost per Service $425.16 $454.08 $494.88 $544.67 $607.84 PMPM $5.47 $6.39 $7.47 $9.05 $9.91
These high-cost imaging services represent about 53% of revenue associated with imaging services in an outpatient facility. Figure 14 shows the corresponding trends for these services. With the exception of the calendar year 2006 trend, these trends are in the range of 17% to 20% and consistent with the overall imaging trends for outpatient facilities. The trends appear to be driven equally by cost and utilization.
Figure 14
Trends in Outpatient Hospital High-Cost Imaging Costs per Member per Month
-5.0%
0.0%
5.0%
10.0%
15.0%
20.0%
25.0%
Services 9.4% 7.3% 10.1% -1.9% 6.1%
Cost/Service 6.8% 9.0% 10.1% 11.6% 9.3%
PMPM Cost 16.8% 16.9% 21.2% 9.5% 16.0%
2002-2003 2003-2004 2004-2005 2005-2006 Average
Physician Services The overall trends in physician claims PMPM are in Figure 15, below. Similar to the outpatient hospital category, Oliver Wyman has not represented the utilization and cost/service trends in total.

Trends in MA Health Insurance Costs, 2002 – 2006 Massachusetts Division of Insurance
19
Figure 15
Trends in Physician Costs per Member per Month
0.0%
2.0%
4.0%
6.0%
8.0%
10.0%
12.0%
14.0%
PMPM Trend 6.7% 9.3% 12.2% 11.9% 10.0%
2002-2003 2003-2004 2004-2005 2005-2006 Average
The trend in the cost of physician services PMPM continues to increase over the study period. In calendar years 2005 and 2006, the trends in physician claims are consistent with the overall trends for medical claims. In order to provide some insight into the reasons underlying the PMPM trends, Oliver Wyman has reviewed trends at the type-of-service level. The graphs below show the trends by type of service for the major components of the physician costs. The trends for all components of physician costs can be found in Appendix C of this report.
Office Visits
Office visits represent the single largest category of service across all physicians, representing almost 20% of the total cost of physician services. Figure 16 displays the utilization, cost, and PMPM trends related to office visits. It is clear from Figure 16 that the key driver of trend for this category is the trend in the cost per service

Trends in MA Health Insurance Costs, 2002 – 2006 Massachusetts Division of Insurance
20
Figure 16
Trends in the Cost of Physician Office Visits per Member per Month
-5.0%
0.0%
5.0%
10.0%
15.0%
Utilization 2.0% -1.2% 1.4% 1.5% 0.9%
$/Service 7.2% 6.5% 9.5% 10.2% 8.4%
PMPM Cost 9.3% 5.2% 11.0% 11.8% 9.3%
2002-2003 2003-2004 2004-2005 2005-2006 Average
Physicians use a set of standard billing codes for categorizing and billing the services they perform. These codes are referred to as the Common Procedural Terminology, 4th edition (CPT-4) codes. When choosing from among the CPT-4 codes for office visits, health care providers or their staffs have to make a judgment about the complexity of the service provided when selecting the appropriate code. In Figure 16, the trend in the PMPM is made up of two components – the trend in the cost per service, and the trend in the number of services. The trend in the cost per service can be further split into a trend in the intensity, or complexity, of services, and the trend in the cost per unit of service. Table 6 presents the distribution of office visits for ten CPT-4 codes representing office visits. Visits billed using CPT-4 codes 99201 (new patient) and 99211 (established patient) are associated with the least complex and least resource-intensive visits. Visits billed according to CPT-4 code 99205 (new patient) and 99215 (established patient) are associated with the most complex and most resource intensive visits.
Table 6 Change in Distribution of Physician Office Visits
Category 2002 2006 Change99201/99211 2.4% 1.8% -25.0%99202/99212 14.3% 10.5% -26.6%99203/99213 62.1% 61.3% -1.3%99204/99214 18.5% 23.8% 28.6%99205/99215 2.7% 2.6% -3.7%Total 100.0% 100.0%
Over the study period, there has been an increase in the complexity of office visits being coded on submitted bills. The proportion of visits billed at the least complex and least

Trends in MA Health Insurance Costs, 2002 – 2006 Massachusetts Division of Insurance
21
resource-intensive code levels (99201/99211 and 99202/99212) declined from 16.7% in 2002 to 12.3% in 2006, and the proportion of visits billed at the most complex and most resource-intensive codes (99204/99214 and 99205/99215) increased from 21.2% in 2002 to 26.4% in 2006. This shift in the billing of visits from the least complex and least resource-intensive codes to the most complex and most resource-intensive codes accounts for approximately 2 to 3 percentage points of the overall average increase in the PMPM cost of health care visits. Finally, Oliver Wyman analyzed the number of office visits billed by primary care physicians and specialty physicians. In calendar year 2002, approximately 30% of the office visits were billed by specialty physicians. This percentage was essentially unchanged at 31% in 2006.
Physician Inpatient Hospital Visits
As is the case with a majority of services, the primary driver of trend in the PMPM cost of inpatient hospital visits is the average cost per service, which increased at an average annual rate of 11.8% over the study period.
Figure 17
Trends in Physician Inpatient Hospital Visit Cost per Member per Month
-5.0%
0.0%
5.0%
10.0%
15.0%
20.0%
Utilization 2.5% -1.2% -0.6% -3.8% -0.8%
$/Service 7.0% 11.2% 14.4% 15.0% 11.8%
PMPM Cost 9.7% 9.9% 13.6% 10.6% 10.9%
2002-2003 2003-2004 2004-2005 2005-2006 Average
Preventive Services
Preventive services include routine physical and well child exams. The overall PMPM trend for these services is 8.7% during the study period, roughly consistent with PMPM trends for physician services. Figure 18 summarizes the trends for these services.

Trends in MA Health Insurance Costs, 2002 – 2006 Massachusetts Division of Insurance
22
Figure 18
Trends in Physician Preventive Visit Costs per Member per Month
0.0%
2.0%
4.0%
6.0%
8.0%
10.0%
12.0%
Utilization 4.1% 10.1% 9.1% 4.4% 6.9%
$/Service 0.2% 0.3% 0.4% 6.1% 1.7%
PMPM Cost 4.4% 10.4% 9.5% 10.8% 8.7%
2002-2003 2003-2004 2004-2005 2005-2006 Average
Chiropractic Services
The trends for chiropractic services are much higher than those for overall physician services, with an overall average trend in the cost PMPM of 21.2%. This high trend is the result of both high trends in the cost per service, and in the number of services being paid for through health plans. These trends are shown in Figure 19, below.
Figure 19
Trends in Chiropractic Service Costs per Member per Month
0.0%
10.0%
20.0%
30.0%
40.0%
Utilization 11.1% 16.1% 10.1% 5.5% 10.7%
$/Service 1.7% 13.4% 17.7% 6.0% 9.5%
PMPM Costs 13.1% 31.7% 29.6% 11.8% 21.2%
2002-2003 2003-2004 2004-2005 2005-2006 Average
Laboratory and Pathology Services
The physician portion of laboratory and pathology trends range from 8% to 13% over the period of 2003 through 2006. This is much lower than the lab trends exhibited by outpatient facilities, where the cost PMPM increased in excess of 20%. The data are summarized in Figure 20 below.

Trends in MA Health Insurance Costs, 2002 – 2006 Massachusetts Division of Insurance
23
Figure 20
Trends in Laboratory and Pathology Costs per Member per Month
0.0%
2.0%
4.0%
6.0%
8.0%
10.0%
12.0%
14.0%
Utilization 8.0% 0.6% 2.7% 1.7% 3.2%
$/Service 2.5% 9.7% 10.1% 6.8% 7.2%
PMPM Cost 10.7% 10.4% 13.1% 8.6% 10.7%
2002-2003 2003-2004 2004-2005 2005-2006 Average
Radiology Services
The physician PMPM cost of radiology services has increased on an annual basis by between 10% and 14% over the study period. As with laboratory and pathology services, the physician trend for radiology services is significantly lower than the outpatient hospital costs for, which increased by over 20% on an annual basis. However, unlike laboratory and pathology, increases in utilization are primarily responsible for increases in the cost of these services.
Figure 21
Trends in Radiology Costs per Member per Month
-5.0%
0.0%
5.0%
10.0%
15.0%
Utilization 7.7% 12.1% 14.1% 9.9% 10.9%
$/Service 5.8% 1.0% -2.2% 0.2% 1.2%
PMPM Cost 13.9% 13.2% 11.7% 10.2% 12.2%
2002-2003 2003-2004 2004-2005 2005-2006 Average

Trends in MA Health Insurance Costs, 2002 – 2006 Massachusetts Division of Insurance
24
Mental Health Services
The overall trend for mental health services on a PMPM basis ranged from 4% to 18% during the study period. While utilization and the cost per service for mental health services fluctuated considerably during this period, utilization increased by an average 11.4% annually, while the cost per service actually decreased, as shown in Figure 22.
Figure 22
Trends Physician Mental Health Costs per Member per Month
-10.0%
0.0%
10.0%
20.0%
30.0%
Utilization 2.6% 14.6% 22.2% 7.1% 11.4%
$/Service 1.2% -2.9% -3.2% 3.2% -0.5%
PMPM Cost 3.7% 11.3% 18.3% 10.6% 10.9%
2002-2003 2003-2004 2004-2005 2005-2006 Average
Hearing Exams, Hearing Aids, and Vision Services
PMPM trends for hearing exams, hearing aids, and vision services averaged 17.4% during the study period, well above the total trends for this category. Both cost and utilization are contributing to the high PMPM trends. Figure 23 illustrates these trends.

Trends in MA Health Insurance Costs, 2002 – 2006 Massachusetts Division of Insurance
25
Figure 23
Trends in Hearing and Vision Costs per Member per Month
-5.0%
0.0%
5.0%
10.0%
15.0%
20.0%
25.0%
Utilization 8.0% 9.1% 10.7% 12.8% 10.1%
$/Service -0.2% 8.7% 10.8% 5.0% 6.0%
PMPM Cost 7.8% 18.6% 22.7% 18.4% 16.7%
2002-2003 2003-2004 2004-2005 2005-2006 Average
Top Physician CPT-4 Codes
The table below shows the top ten CPT-4 codes based on total revenue over the period and the resulting trends in the PMPMs associated with these codes. Evaluation and management codes are the most frequently used codes by physicians, with office visit codes as the top two codes. In addition, other evaluation and management codes among the top ten CPT-4 codes include preventive service codes and consultations. The normal delivery code for maternity is also one of the top codes. The trends for these codes are higher than trends associated with the total physician services.
Table 7
Trends in Cost of Physician Services per Member per Month -- Top 10 CPT-4 Codes
CPT-4 2002-2003 2003-2004 2004-2005 2005-200699213 – office visit, Level 3 8.6% 3.3% 8.4% 10.0%99214 – office visit, Level 4 20.5% 14.6% 17.6% 18.4%90806 - psychotherapy 4.6% 10.7% 18.1% 11.2%99396 – preventive visit age 40-64 8.7% 12.1% 11.6% 13.4%59400 – vaginal delivery 5.3% 10.7% 5.5% 9.8%99243 – consultation 10.3% 13.4% 16.5% 15.7%99244 – consultation 8.4% 11.8% 16.7% 18.6%88305 – surgical pathology 4.5% 14.2% 20.7% 10.7%99395 – preventive visit age 18-39 3.7% 9.5% 8.0% 10.6%98940 – chiropractic visit -0.3% 38.4% 46.5% 8.5%Top 10 Total 9.5% 9.4% 13.2% 12.9%Total Physician Trend 6.80% 8.90% 11.50% 11.80%

Trends in MA Health Insurance Costs, 2002 – 2006 Massachusetts Division of Insurance
26
Other Services The remaining services grouped under the “Other Services” heading reviewed in the cost model are services such as ambulance, durable medical equipment, prosthetics and other ancillary services. In general, these costs represent a small portion of the total health care dollar, usually less than 5%. While the PMPM trends for these services are generally higher than for other categories of service, the dollars associated with these services are small. Figure 24 shows the total overall trends for these services. Since the units are not consistent, the utilization and cost trends are not shown in total. However, Appendix C shows all of the utilization and cost trends for each line.
Figure 24
Trends in Other Service Costs per Member per Month
0.0%
2.0%
4.0%
6.0%
8.0%
10.0%
12.0%
14.0%
16.0%
18.0%
20.0%
PMPM Trend 12.2% 18.0% 9.0% 15.4% 13.6%
2002-2003 2003-2004 2004-2005 2005-2006 Average
For the two largest components of this category of services, Oliver Wyman has provided more detailed trends for both the cost and utilization components.
Ambulance Services
The trends for ambulance services range from 9% to 17% in total. The average cost per service is the key driver for ambulance trends. The information is shown in Figure 25.

Trends in MA Health Insurance Costs, 2002 – 2006 Massachusetts Division of Insurance
27
Figure 25
Trends the Cost of Ambulance Service per Member per Month
-5.0%
0.0%
5.0%
10.0%
15.0%
20.0%
Utilization 6.9% 1.9% 3.8% -2.9% 2.4%
$/Service 9.4% 8.0% 5.6% 12.5% 8.8%
PMPM Cost 17.0% 10.0% 9.6% 9.3% 11.4%
2002-2003 2003-2004 2004-2005 2005-2006 Average
Drugs Supplied in an Outpatient Setting or Physician’s Office
Drugs supplied in an outpatient hospital setting or a physician’s office are included in this service category. This would include, among other things, injectables, and drugs for chemotherapy. This category exhibits very high utilization trends and very low, generally negative, cost trends. The overall PMPM trends for this category range from 2% to 22% during the study period, averaging 12.8%. Part of what may be occurring with the measurement of the cost and utilization trends could be due to changes in the way these services are reported.
Figure 26
Trends in the Cost of Other Drugs per Member per Month
-40.0%
-20.0%
0.0%
20.0%
40.0%
60.0%
80.0%
Utilization 50.7% 8.6% 36.3% 58.0% 37.0%
$/Service -28.6% 10.7% -25.0% -23.1% -17.8%
PMPM Cost 7.5% 20.3% 2.3% 21.5% 12.6%
2002-2003 2003-2004 2004-2005 2005-2006 Average

Trends in MA Health Insurance Costs, 2002 – 2006 Massachusetts Division of Insurance
28
4
Analysis of Trends in Outpatient Prescription Drug
Claims
As expected, there are significant variations in costs per script between brand-name drugs and generic drugs. In order to control costs, many HMO have been encouraging the use of generic drugs. The following tables show the trends in usage and costs of the various drugs utilized in Massachusetts.
Brand-Name vs. Generic Drugs Figure 27 shows that in 2002, roughly half of prescriptions were for brand-name drugs, and half were for generic drugs. By 2006, this had change to the point where less than 35% of prescriptions filled were for brand-name drugs and almost two-thirds were for generic drugs.
Figure 27
Change over Time in Brand/Generic Prescriptions
0.0%
10.0%
20.0%
30.0%
40.0%
50.0%
60.0%
70.0%
Per
cen
tag
e o
f T
ota
l Pre
scri
pti
on
s
Brand 49.5% 45.7% 43.0% 39.3% 34.6%
Generic 50.5% 54.3% 57.0% 60.7% 65.4%
2002 2003 2004 2005 2006
Trends in MA Health Insurance Costs, 2002 – 2006 Massachusetts Division of Insurance
29
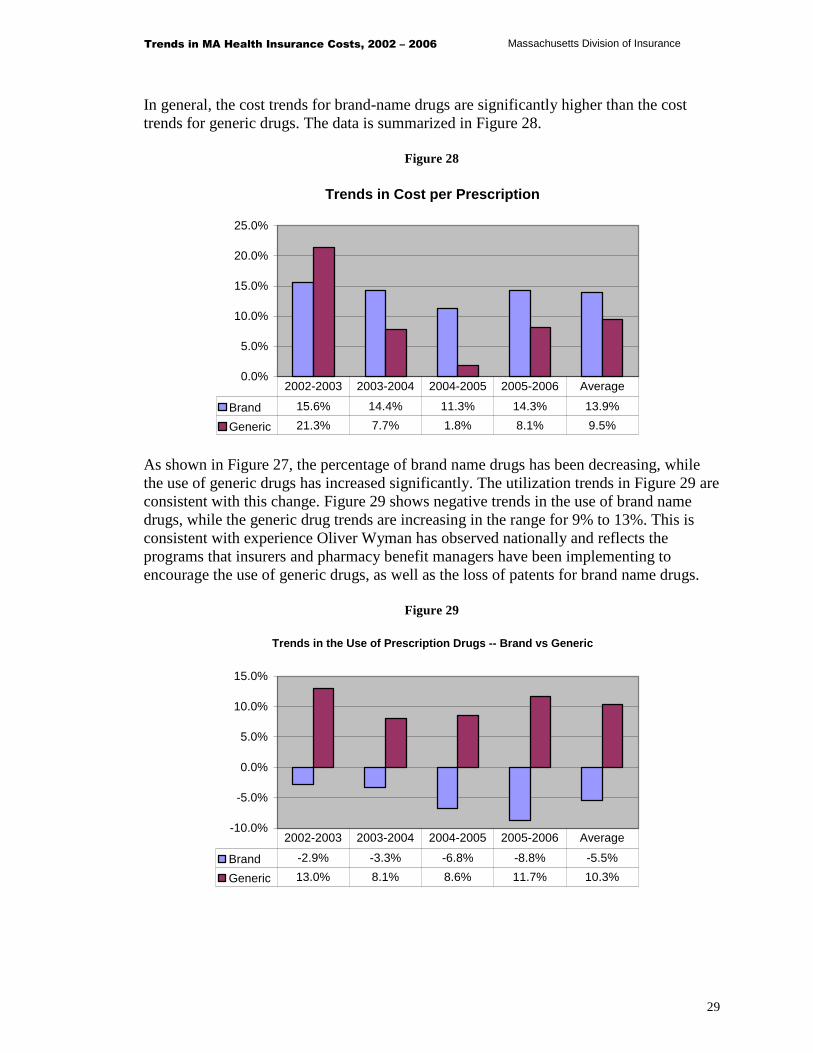
In general, the cost trends for brand-name drugs are significantly higher than the cost trends for generic drugs. The data is summarized in Figure 28.
Figure 28
Trends in Cost per Prescription
0.0%
5.0%
10.0%
15.0%
20.0%
25.0%
Brand 15.6% 14.4% 11.3% 14.3% 13.9%
Generic 21.3% 7.7% 1.8% 8.1% 9.5%
2002-2003 2003-2004 2004-2005 2005-2006 Average
As shown in Figure 27, the percentage of brand name drugs has been decreasing, while the use of generic drugs has increased significantly. The utilization trends in Figure 29 are consistent with this change. Figure 29 shows negative trends in the use of brand name drugs, while the generic drug trends are increasing in the range for 9% to 13%. This is consistent with experience Oliver Wyman has observed nationally and reflects the programs that insurers and pharmacy benefit managers have been implementing to encourage the use of generic drugs, as well as the loss of patents for brand name drugs.
Figure 29
Trends in the Use of Prescription Drugs -- Brand vs Generic
-10.0%
-5.0%
0.0%
5.0%
10.0%
15.0%
Brand -2.9% -3.3% -6.8% -8.8% -5.5%
Generic 13.0% 8.1% 8.6% 11.7% 10.3%
2002-2003 2003-2004 2004-2005 2005-2006 Average

Trends in MA Health Insurance Costs, 2002 – 2006 Massachusetts Division of Insurance
30
Even though the utilization trend for brand-name drugs has been negative, the overall PMPM trend for brand-name drugs is still positive due to the increases in the cost per prescription. However, the brand-name PMPM trends are much lower than the overall generic drug PMPM trends. The information is shown in Figure 30.
Figure 30
Trends in the Cost Prescription Drugs per Member per Month
0.0%
10.0%
20.0%
30.0%
40.0%
Brand 12.3% 10.6% 3.7% 4.2% 7.6%
Generic 37.1% 16.4% 10.5% 20.8% 20.8%
Total 16.7% 11.8% 5.2% 8.0% 10.4%
2002-2003 2003-2004 2004-2005 2005-2006 Average
Mail Order vs. Retail There can also be significant savings to an HMO by using a mail order pharmacy. Again, many HMOs have tried to encourage the use of mail order drugs through lower copays per script for mail order and other means. The tables below show the trends, usage and costs associated with mail-order and retail filled prescriptions.
Table 8 Percentage of Utilization by Location
Filling Location 2002 2003 2004 2005 2006Retail 93% 92% 91% 90% 88%Mail Order 7% 8% 9% 10% 12%
There has been a gradual increase in the number of prescriptions filled by mail order over the study period. The percentage of prescriptions has increased from 7% of all scripts in 2002 to 12% of all scripts in 2006.
Table 9 Cost per Script Trends by Location
Filling Location 2002-2003 2003-2004 2004-2005 2005-2006 AverageRetail 14.4% 13.9% 2.6% 8.2% 9.6%Mail Order 8.1% 14.5% 9.8% 7.7% 10.0%

Trends in MA Health Insurance Costs, 2002 – 2006 Massachusetts Division of Insurance
31
Over the study period, there does not appear to be any significant difference in the cost trends between mail-order and retail prescription drug costs over the period. The trends in the overall PMPM costs are significantly higher for mail-order scripts than retail. This is the result of the shift in utilization to mail-order drugs.
Figure 31
Trends in the Cost of Prescription Drugs per Member per Month
0.00%
10.00%
20.00%
30.00%
40.00%
50.00%
Retail 16.30% 17.40% 7.30% 10.40% 12.8%
Mail Order 35.10% 40.50% 30.00% 22.50% 31.9%
2002-2003 2003-2004 2004-2005 2005-2006 Average
Drugs by Therapeutic Class Oliver Wyman has also analyzed the drugs filled by therapeutic class over the five year experience period. The data shown in Table 10 are the trends for the therapeutic classes with the highest expenditures.

Trends in MA Health Insurance Costs, 2002 – 2006 Massachusetts Division of Insurance
32
Table 10 Trends in the Cost of the Top 10 Therapeutic Drug Classes Per Member per Month
Top 10 2002-2003 2003-2004 2004-2005 2005-2006 AverageAntidepressants 16.4% 9.1% -11.2% 0.1% 3.1%
Statins (cholesterol lowering drugs) 18.4% 21.8% 14.4% 6.5% 15.1%
Proton Pump Inhibitors (gastric acid reducing drugs) 5.2% 51.6% 10.1% -1.3% 14.7%
Misc. Anticonvulsants 33.3% 23.7% 10.0% 13.6% 19.8%
Contraceptives 12.1% 7.6% -0.8% 1.8% 5.0%
Opiate Agonists (Morphine, Oxycontin, etc.) 19.4% 17.2% 1.5% -6.3% 7.4%
Tranquilizers 32.9% 29.2% 15.0% 11.4% 21.8%
Antineoplastic Agents (cancer drugs) 17.2% 9.5% 14.4% 15.0% 14.0%
Nonsteroid Anti Inflammatories 10.8% 6.6% -34.7% -5.2% -7.5%
Sympathomimetic Adrenal Agents (drugs that mimic effects of adrenaline – common drug is Albuterol) 35.8% 10.2% -5.3% -52.7% -9.5%
The trends for the top ten therapeutic classes as a whole show no discernable pattern over the five year period. For example, the largest therapeutic class over the period, antidepressants, has an overall trend significantly lower than the overall pharmacy trends experienced during the study period. The cholesterol lowering drugs (HMG-COA Reductase Inhibitors) have become a very popular prescription drug over the last few years. The experience shows very large trends for calendar years 2003 and 2004 with much lower trends in the recent years. These lower trends are most likely due to some of the brand-name drugs losing their patents and generic equivalents becoming available.

Trends in MA Health Insurance Costs, 2002 – 2006 Massachusetts Division of Insurance
33
Appendix A
List of Participating Carriers Aetna Health, Inc. Blue Cross Blue Shield of Massachusetts HMO Blue, Inc. CIGNA Healthcare of Massachusetts, Inc. ConnectiCare of Massachusetts, Inc. Fallon Community Health Plan, Inc. Harvard Pilgrim Health Care, Inc. Health New England, Inc. Neighborhood Health Plan, Inc. Tufts Associated Health Maintenance Organization, Inc. (d/b/a/ Tufts Health Plan) United HealthCare of New England, Inc.
Trends in MA Health Insurance Costs, 2002 – 2006 Massachusetts Division of Insurance
34
Appendix B
Methodology and Process Oliver Wyman developed a data request letter that was reviewed by HCAB and forwarded to all HMOs operating in the fully-insured Massachusetts market. This data request letter specified the form and content for databases containing both claims and membership data. Oliver Wyman requested that the HMOs deliver their data by November 1, 2007. Most of the carriers were able to provide data by this date. Oliver Wyman’s initial analysis of the data revealed issues with several of the datasets provided. After further investigation by Oliver Wyman and the HMOs, some of the datasets were re-run and sent to Oliver Wyman. Oliver Wyman received the final data for all plans by January 23, 2008. Oliver Wyman analyzed the data for each company separately. The initial step of this project was to generate a summary by the major component of the medical claims files (e.g., inpatient hospital, outpatient hospital, physician and other services, and pharmacy). Oliver Wyman compared these summaries to other data sources, provided by the HCAB, and reviewed the summaries for reasonableness. In addition, at Oliver Wyman’s request, each company provided a reconciliation that demonstrated that the data provided were consistent with what is reported on the HMO’s financial statements. Once Oliver Wyman determined the datasets to be reasonable, Oliver Wyman analyzed and segregated the data examining trends in utilization, cost per service, and the overall cost. Oliver Wyman then developed medical cost models in order to analyze detailed aspects of the data such as the trends in the number and cost of lab services, radiology services, office visits, etc.
Data Characteristics
Oliver Wyman received medical and pharmacy claims data associated with the fully-insured business of the ten licensed HMOs actively operating in the Massachusetts market (see Appendix A). These HMOs are responsible for providing the vast majority of insured

Trends in MA Health Insurance Costs, 2002 – 2006 Massachusetts Division of Insurance
35
health coverage in Massachusetts throughout the study period. The data provided were for fully-insured groups covered in “closed network” plans for Massachusetts residents in those plans only. The total combined data for calendar years 2002 through 2006 represents 276.6 million claim records and more than $25.8 billion in health claims. This data also represents over 106 million member months of exposure. Oliver Wyman requested, and generally received, separate claims files for inpatient hospital, outpatient hospital, physician and other providers, and pharmacy claims. In addition, Oliver Wyman asked that the data not include duplicate records or claims for services that were not covered under insured health contracts. The carriers provided claim records that included the amount billed by the provider, the allowed amount determined by the HMO (e.g., billed amounts less contractual write downs prior to deductions for member cost-sharing), the amounts paid by the HMO, and the cost-sharing amounts paid by the member. The member cost-sharing reflects amounts related to actual claims (e.g., the copayment for a specific service or the amount applied to a plan deductible), and does not reflect the employee’s contribution toward the premium paid by the employer group. In addition to claims processed through the carriers’ claims systems, Oliver Wyman also received data showing payments for health care services that were handled outside of the claims system. For example, carriers were asked to provide Oliver Wyman with a summary of all other payment arrangements that are not based on fee-for-service payments (e.g., any contracted capitation payments, withhold amounts, settlement amounts) that would not be reflected in the claims system data. Many of the carriers track capitated encounters in the claims system. Where a carrier was able to value a capitated service or encounter, this information was included in the claims database. For the paid amount, Oliver Wyman used the actual capitation payments. Some carriers did not track the capitation through the claims system. In these cases, the amounts paid to capitated provides are included in our analysis of overall trends, but not in the cost models found in Appendix C, as the data the carriers provided with respect to these capitated payments did not allow us to assign a category of service, or the number of services. While Oliver Wyman was unable to use this data in the cost models in Appendix C, it should be noted that these payments reflect a very small portion of the total medical and pharmacy claims. In fact, these claims represent less than 0.5% of the total value of claims.
Data Adjustments to Improve Accuracy of the Analysis
Although there are standard billing and diagnostic codes for classifying claims, these codes are not uniformly captured or used across the reporting companies. As an example, inpatient hospital claims are frequently classified using a coding system referred to as Diagnostic Related Group, or DRGs. Similarly, physician claims are usually captured and

Trends in MA Health Insurance Costs, 2002 – 2006 Massachusetts Division of Insurance
36
reported using a convention referred to as the Common Procedural Terminology, 4th edition (CPT-4) codes. Where, in the course of its analysis, Oliver Wyman found that claims files did not include the uniform reporting codes, Oliver Wyman reviewed the reported information to determine how best to use the reported information. The following is a brief summary of the major data issues that arose during this project. � Several carriers were not able to provide DRG codes for inpatient hospital claims.
Instead, these carriers used revenue codes or other identifiers, to segregate the inpatient hospital data by type of admission (e.g., medical versus surgical admissions). In some cases, there were inpatient hospital claims that Oliver Wyman was unable to segregate in this fashion. In the process of assigning these claims, Oliver Wyman reviewed the distribution of the claims assigned to determine whether it appeared that the missing claims related to a specific type of service. If certain admissions were completely missing or severely under-reported relative to the other carriers’ experience, Oliver Wyman assigned these claims to those categories. Otherwise, these claims were allocated across all admission types.
� One carrier discovered issues with its data from calendar years 2002 and 2003, where
data had been archived and needed to be retrieved. It appears that there were problems with the retrieval process and a significant portion of the data was missing. Due to the relatively small size of the carrier, Oliver Wyman decided that this company’s 2002 and 2003 data would not be used in the detailed analysis.
� Another carrier was unable to provide data using the types of identifiers requested,
including DRG, CPT-4 and/or revenue codes. Due to the relatively small size of this carrier, this carrier’s data were only used when analyzing broad categories, such as inpatient hospital, physician, etc., rather than in the detailed analysis of the subcomponents of the major categories.
� One other carrier was unable to separate skilled nursing facility (SNF) claims from
other inpatient services. In order to compensate for the missing identifiers, Oliver Wyman assumed that the distribution of SNF claims for this carrier would be the same as for all other carriers in the Massachusetts market.

Trends in MA Health Insurance Costs, 2002 – 2006 Massachusetts Division of Insurance
37
Appendix C
Medical Claims Trends Please note that the information for one carrier is not included in the cost model summaries. The data provided by that carrier did not contain sufficient detail to separate the claims into the categories required. Another carrier’s data was only used in calendar years 2004 – 2006. This carrier had problems retrieving archived data. Due to the size of the carriers in question, we at Oliver Wyman chose to exclude them from the detailed analysis rather than delay the project. Our analysis shows the overall impact of this exclusion was minimal. In addition, the information shown in these cost models does not contain claims paid by carriers that were paid outside the claims system. At this time, we at Oliver Wyman were unable to allocate the capitation amounts to the various cost model categories.

Trends in MA Health Insurance Costs, 2002 – 2006 Massachusetts Division of Insurance
38
PMPM Trends
2002 2006Allowed AllowedPMPM PMPM '03/'02 '04/'03 '05/'04 '06/'05 Average
Hospital Services Provided on an Inpatient Basis
Medical/Surgical 29.79$ 43.74$ 13.0% 7.3% 10.4% 9.6% 10.1%Maternity 4.54 5.54 7.2% 6.2% 3.7% 3.4% 5.1%SNF 0.60 0.50 -11.3% -4.8% -3.3% 1.2% -4.7%Mental Health 0.84 1.10 6.9% 8.1% 8.5% 4.0% 6.9%Substance Abuse 0.26 0.38 0.3% 3.2% -14.4% 65.7% 10.1%
Total Hospital Inpatient 36.04$ 51.26$ 11.7% 7.0% 9.2% 9.0% 9.2%
Hospital Services Provided on an Outpatient Basis
Lab/Pathology - Facility 5.10$ 10.46$ 24.0% 25.9% 8.7% 20.7% 19.6%Radiology - Facility 10.21 20.06 16.1% 23.1% 17.2% 17.3% 18.4%
Total Lab/Pathology and Radiology 15.31$ 30.52$ 18.7% 24.1% 14.2% 18.5% 18.8%
Home Care PT/OT/ST - Facility 1.20$ 2.59$ 14.0% 23.1% 24.6% 23.0% 21.1%Emergency Room - Facility 6.07 10.80 23.0% 12.2% 15.2% 12.0% 15.5%Surgery - Facility 14.14 22.90 21.9% 7.1% 14.7% 8.2% 12.8%Maternity - Facility 0.42 0.71 10.8% 12.5% -0.6% 37.8% 14.3%Mental Health - Facility 0.55 0.89 10.5% 11.0% 8.7% 21.3% 12.8%Substance Abuse - Facility 0.18 0.14 5.8% -1.2% -21.8% -3.0% -5.7%Clinic - Facility 1.03 1.91 13.1% 16.4% 13.7% 23.6% 16.6%Other - Facility 3.15 5.35 26.0% 20.0% 5.7% 6.3% 14.1%
Other Outpatient Hospital 26.74$ 45.28$ 21.4% 11.0% 13.5% 10.8% 14.1%
Total Hospital Outpatient 42.05$ 75.80$ 20.4% 15.7% 13.8% 13.7% 15.9%
Professional Health Care Services
Total Lab/Pathology 5.18$ 7.78$ 10.7% 10.4% 13.1% 8.6% 10.7%Total Radiology 5.53 8.78 13.9% 13.2% 11.7% 10.2% 12.2%
Total Lab/Pathology and Radiology 10.72$ 16.55 12.3% 11.9% 12.3% 9.4% 11.5%
Hospital Visits 1.74$ 2.64$ 9.7% 9.9% 13.6% 10.6% 10.9%Inpatient - Surgery 2.30 2.96 4.7% 2.0% 10.1% 9.3% 6.5%Outpatient - Surgery 7.36 10.98 9.7% 8.0% 10.8% 13.7% 10.5%Other - Surgery 0.19 0.24 -0.4% 8.0% -4.7% 21.5% 5.6%Anesthesia 3.82 5.46 -6.6% 10.0% 19.5% 16.3% 9.3%Office Visits - Primary 9.00 12.88 9.7% 5.3% 11.5% 11.0% 9.4%Office Visits - Specialist 4.03 5.74 8.5% 5.0% 10.0% 13.8% 9.3%Preventive Visits - Primary 4.91 7.37 6.0% 12.9% 12.1% 12.0% 10.7%Preventive Visits - Specialist 0.69 0.45 -7.2% -9.5% -17.5% -4.9% -9.9%Emergency Room Visit 1.94 3.06 7.8% 8.5% 15.6% 16.6% 12.1%Consultation 3.43 5.23 6.5% 9.9% 14.5% 13.8% 11.1%Cardiovascular 2.49 3.38 8.7% 10.0% 5.2% 8.0% 8.0%Immunizations 0.44 0.89 16.7% 2.1% 38.2% 24.3% 19.6%Maternity 3.77 4.84 -0.7% 9.1% 7.2% 10.6% 6.5%Allergy 0.55 0.83 9.5% 11.9% 7.4% 13.5% 10.5%Dialysis 0.17 0.10 -4.0% -27.6% -7.8% -7.5% -12.2%Chiropractic 0.80 1.72 13.1% 31.7% 29.6% 11.8% 21.2%Mental Health 3.14 4.73 3.7% 11.3% 18.3% 10.6% 10.9%PT/OT/ST 1.09 1.98 13.5% 25.8% 14.8% 11.0% 16.1%Dental 0.56 0.93 6.3% 14.8% 23.5% 9.6% 13.4%Hearing Exams, Hearing Aids, & Vision 1.51 2.80 7.8% 18.6% 22.7% 18.4% 16.7%Other Medicine 1.82 2.56 4.8% 4.4% 3.9% 24.0% 9.0%Other Professional 3.92 4.69 -2.4% 8.1% 7.1% 6.0% 4.6%
Other Professional Services 59.66$ 86.47$ 5.7% 8.8% 12.1% 12.4% 9.7%
Total Professional Services 70.38$ 103.02$ 6.7% 9.3% 12.2% 11.9% 10.0%
Miscellaneous Services
Ambulance 1.46$ 2.25$ 17.0% 10.0% 9.6% 9.3% 11.4%Durable Medical Equipment 0.85 1.54 15.8% 25.1% 12.3% 11.0% 16.0%Prosthetics 0.43 0.58 4.9% 12.4% 12.5% 3.6% 8.3%Major Medical (Supplies) 0.26 0.76 30.1% 27.0% 43.2% 24.5% 31.0%Other Drugs ("J" HCPCS) 2.49 4.00 7.5% 20.3% 2.3% 21.5% 12.6%
Total Miscellaneous Services 5.49$ 9.14$ 12.2% 18.0% 9.0% 15.4% 13.6%
Total 153.95$ 239.23$ 11.8% 11.0% 11.9% 12.0% 11.6%
PMPM Trends

Trends in MA Health Insurance Costs, 2002 – 2006 Massachusetts Division of Insurance
39
Utilization Trends
2002 2006Allowed AllowedUtil/1000 Util/1000 '03/'02 '04/'03 '05/'04 '06/'05 Average
Hospital Services Provided on an Inpatient Basis
Medical/Surgical 50.0 49.6 0.9% -0.9% 1.0% -1.8% -0.2%Maternity 13.1 12.7 1.0% 0.2% -2.7% -1.9% -0.8%SNF 2.6 1.8 -29.2% -1.1% 3.0% -6.7% -9.4%Mental Health 2.5 2.7 7.1% 0.6% 4.0% -2.4% 2.3%Substance Abuse 2.0 1.7 -4.2% 0.2% -51.7% 77.3% -4.8%
Total Hospital Inpatient 70.3 68.4 -0.1% -0.6% -1.0% -0.9% -0.7%
Hospital Services Provided on an Outpatient Basis
Lab/Pathology - Facility 2,510.4 4,059.4 11.5% 17.1% 3.9% 19.2% 12.8%Radiology - Facility 1,162.7 2,979.4 9.2% 31.2% 11.0% 61.3% 26.5%
Total Lab/Pathology and Radiology 3,673.1 7,038.8 10.8% 21.5% 6.3% 34.0% 17.7%
Home Care PT/OT/ST - Facility 154.9 217.9 6.6% 11.6% 9.0% 8.4% 8.9%Emergency Room - Facility 193.8 210.7 2.1% -1.7% 6.2% 2.0% 2.1%Surgery - Facility 223.3 252.5 9.4% -2.3% 9.5% -3.4% 3.1%Maternity - Facility 11.4 15.3 3.9% 4.5% -5.6% 31.1% 7.7%Mental Health - Facility 80.6 68.4 5.1% -7.7% -24.0% 15.1% -4.0%Substance Abuse - Facility 24.9 13.4 14.1% 0.0% 0.0% 0.0% -14.3%Clinic - Facility 109.3 182.4 7.1% 6.9% 16.4% 25.3% 13.7%Other - Facility 491.2 1,357.5 37.0% 35.6% 8.4% 37.3% 28.9%
Other Outpatient Hospital 1,289.4 2,318.1 18.1% 16.1% 7.1% 22.4% 15.8%
Professional Health Care Services
Total Lab/Pathology 3,434.7 3,898.7 8.0% 0.6% 2.7% 1.7% 3.2%Total Radiology 888.4 1,344.9 7.7% 12.1% 14.1% 9.9% 10.9%
Total Lab/Pathology and Radiology 4,323.1 5,243.6 7.9% 2.9% 5.3% 3.7% 4.9%
Hospital Visits 266.4 257.9 2.5% -1.2% -0.6% -3.8% -0.8%Inpatient - Surgery 45.8 42.2 -3.3% -2.7% -0.3% -1.9% -2.1%Outpatient - Surgery 677.6 923.9 13.1% 8.3% 8.1% 2.9% 8.1%Other - Surgery 71.8 85.7 2.8% -7.4% 19.6% 4.8% 4.5%Anesthesia 698.3 780.1 -4.5% 3.1% 16.0% -2.3% 2.8%Office Visits - Primary 1,771.7 1,840.4 1.7% -1.8% 2.4% 1.5% 1.0%Office Visits - Specialist 788.6 813.4 2.5% 0.2% -0.9% 1.3% 0.8%Preventive Visits - Primary 551.6 818.7 5.6% 16.1% 13.5% 6.6% 10.4%Preventive Visits - Specialist 142.3 87.5 -1.6% -14.8% -16.2% -12.5% -11.4%Emergency Room Visit 282.4 302.2 3.6% -2.0% 0.9% 4.5% 1.7%Consultation 196.7 273.7 5.4% 12.3% 10.9% 6.0% 8.6%Cardiovascular 350.6 518.6 13.2% 14.2% 8.5% 5.5% 10.3%Immunizations 476.0 543.6 9.9% -7.2% 11.3% 0.6% 3.4%Maternity 244.9 311.7 -0.2% 11.8% 4.0% 9.6% 6.2%Allergy 640.2 861.7 11.6% 9.0% 4.1% 6.2% 7.7%Dialysis 22.5 8.3 -6.6% -35.7% -21.0% -21.9% -22.0%Chiropractic 534.4 801.1 11.1% 16.1% 10.1% 5.5% 10.7%Mental Health 414.8 638.4 2.6% 14.6% 22.2% 7.1% 11.4%PT/OT/ST 254.1 995.0 37.8% 103.5% 22.4% 14.1% 40.7%Dental 81.6 87.9 -2.4% 6.6% 8.7% -4.6% 1.9%Hearing Exams, Hearing Aids, & Vision 274.7 404.1 8.0% 9.1% 10.7% 12.8% 10.1%Other Medicine 411.2 318.2 -16.6% 21.1% -1.1% -22.5% -6.2%Other Professional 1,043.2 1,237.8 -7.1% 4.1% 40.1% -12.4% 4.4%
Other Professional Services 10,241.2 12,952.0 3.7% 8.5% 10.7% 1.5% 6.0%
Miscellaneous Services
Ambulance 97.2 106.7 6.9% 1.9% 3.8% -2.9% 2.4%Durable Medical Equipment 558.1 666.2 15.1% 50.1% 3.2% -33.0% 4.5%Prosthetics 39.1 40.7 25.8% -0.7% 9.7% -24.2% 1.0%Major Medical (Supplies) 1,193.1 1,642.5 16.5% -0.1% 22.0% -3.0% 8.3%Other Drugs ("J" HCPCS) 1,030.7 3,635.4 50.7% 8.6% 36.3% 58.0% 37.0%
Utilization per 1,000 Members Trends

Cost per Service Trends1
2002 2006Average Average
Cost/Service Cost/Service '03/'02 '04/'03 '05/'04 '06/'05 Average
Hospital Services Provided on an Inpatient Basis
Medical/Surgical 7,151.46$ 10,591.19$ 12.0% 8.3% 9.3% 11.7% 10.3%Maternity 4,151.68 5,239.95 6.1% 5.9% 6.5% 5.5% 6.0%SNF 2,746.12 3,367.86 25.2% -3.8% -6.2% 8.5% 5.2%Mental Health 4,113.60 4,908.28 -0.2% 7.5% 4.3% 6.7% 4.5%Substance Abuse 1,523.78 2,721.16 4.7% 3.0% 77.1% -6.5% 15.6%
Total Hospital Inpatient 6,156.18$ 8,994.78$ 11.8% 7.7% 10.3% 10.0% 9.9%
Hospital Services Provided on an Outpatient Basis
Lab/Pathology - Facility 24.40$ 30.92$ 11.2% 7.6% 4.6% 1.3% 6.1%Radiology - Facility 105.38 80.80 6.3% -6.2% 5.6% -27.2% -6.4%
Total Lab/Pathology and Radiology 50.03$ 52.03$ 7.2% 2.1% 7.4% -11.6% 1.0%
Home Care PT/OT/ST - Facility 93.21$ 142.60$ 6.9% 10.3% 14.3% 13.4% 11.2%Emergency Room - Facility 376.12 615.31 20.5% 14.1% 8.4% 9.8% 13.1%Surgery - Facility 759.69 1,088.26 11.4% 9.6% 4.7% 12.0% 9.4%Maternity - Facility 437.18 555.97 6.7% 7.7% 5.3% 5.1% 6.2%Mental Health - Facility 81.62 155.61 5.2% 20.3% 43.0% 5.4% 17.5%Substance Abuse - Facility 84.70 124.52 -7.3% 0.0% 0.0% 0.0% 0.0%Clinic - Facility 113.05 125.36 5.7% 8.9% -2.4% -1.3% 2.6%Other - Facility 77.02 47.31 -8.0% -11.5% -2.5% -22.6% -11.5%
Other Outpatient Hospital 248.82$ 234.41$ 2.8% -4.5% 6.0% -9.6% -1.5%
Professional Health Care Services
Total Lab/Pathology 18.10$ 23.93$ 2.5% 9.7% 10.1% 6.8% 7.2%Total Radiology 74.75 78.31 5.8% 1.0% -2.2% 0.2% 1.2%
Total Lab/Pathology and Radiology 29.74$ 37.88$ 4.1% 8.7% 6.7% 5.5% 6.2%
Hospital Visits 78.59$ 122.98$ 7.0% 11.2% 14.4% 15.0% 11.8%Inpatient - Surgery 602.06 841.46 8.3% 4.9% 10.4% 11.5% 8.7%Outpatient - Surgery 130.35 142.63 -3.1% -0.2% 2.5% 10.4% 2.3%Other - Surgery 31.73 33.11 -3.1% 16.6% -20.4% 15.9% 1.1%Anesthesia 65.66 83.92 -2.2% 6.7% 3.0% 19.0% 6.3%Office Visits - Primary 60.98 83.95 7.9% 7.3% 8.8% 9.3% 8.3%Office Visits - Specialist 61.29 84.70 5.8% 4.7% 11.0% 12.3% 8.4%Preventive Visits - Primary 106.78 108.08 0.3% -2.7% -1.2% 5.0% 0.3%Preventive Visits - Specialist 58.06 62.13 -5.7% 6.1% -1.6% 8.7% 1.7%Emergency Room Visit 82.40 121.49 4.1% 10.7% 14.6% 11.6% 10.2%Consultation 209.36 229.42 1.0% -2.1% 3.2% 7.4% 2.3%Cardiovascular 85.07 78.12 -4.0% -3.7% -3.1% 2.4% -2.1%Immunizations 11.00 19.69 6.1% 10.0% 24.2% 23.5% 15.7%Maternity 184.54 186.23 -0.6% -2.4% 3.1% 0.9% 0.2%Allergy 10.40 11.53 -1.9% 2.6% 3.2% 6.8% 2.6%Dialysis 92.39 147.83 2.9% 12.5% 16.7% 18.5% 12.5%Chiropractic 17.94 25.82 1.7% 13.4% 17.7% 6.0% 9.5%Mental Health 90.71 88.98 1.2% -2.9% -3.2% 3.2% -0.5%PT/OT/ST 51.34 23.85 -17.6% -38.2% -6.2% -2.7% -17.4%Dental 82.97 127.09 8.9% 7.7% 13.6% 14.9% 11.2%Hearing Exams, Hearing Aids, & Vision 65.96 83.26 -0.2% 8.7% 10.8% 5.0% 6.0%Other Medicine 53.04 96.66 25.7% -13.8% 5.0% 60.1% 16.2%Other Professional 45.06 45.51 5.1% 3.8% -23.6% 21.1% 0.2%
Other Professional Services 69.91$ 80.12$ 2.0% 0.3% 1.3% 10.7% 3.5%
Miscellaneous Services
Ambulance 180.16$ 252.88$ 9.4% 8.0% 5.6% 12.5% 8.8%Durable Medical Equipment 18.35 27.79 0.7% -16.6% 8.9% 65.8% 10.9%Prosthetics 130.36 172.45 -16.6% 13.2% 2.5% 36.7% 7.2%Major Medical (Supplies) 2.60 5.55 11.7% 27.2% 17.3% 28.4% 20.9%Other Drugs ("J" HCPCS) 29.00 13.21 -28.6% 10.7% -25.0% -23.1% -17.8%
Average Cost/Service Trends
(1) The cost per service trends shown here are measuring changes in average cost of all services within a category. Therefore, these trends include the effect of changes in the mix of services within a category. Negative trends may result from a relative increase the utilization of a lower cost item or service, and not an actual decrease in the cost of all items or services within a category.

411 East Wisconsin Avenue, Suite 1600 Milwaukee, WI 53202-4419 1 414 223 7989