Embed Size (px)
Citation preview

Trends in Higher Education Funding, Enrollment, and Student Costs
JOINT LEGISLATIVE AUDIT AND REVIEW COMMISSION
REPORT TO THE GOVERNOR AND THE GENERAL ASSEMBLY OF VIRGINIA
JUNE 2013
HOUSE DOCUMENT NO. 8COMMONWEALTH OF VIRGINIARICHMOND

ChairDelegate John M. O’Bannon IIIVice-ChairSenator John C. Watkins
Delegate David B. AlboSenator Charles J. ColganDelegate M. Kirkland CoxSenator Janet D. HowellDelegate Johnny S. JoannouDelegate S. Chris JonesDelegate James P. Massie IIISenator Thomas K. Norment, Jr.Delegate Robert D. Orrock, Sr.Delegate Lacey E. PutneyDelegate Lionell Spruill, Sr.Senator Walter A. StoschMartha S. Mavredes, Auditor of Public Accounts
DirectorGlen S. Tittermary
Members of the Joint Legislative Audit and Review Commission
JLARC Staff for This ReportJustin Brown, Project Leader Drew Dickinson Laura Parker Greg Rest
Report No. 441This report is available on the JLARC website at http://jlarc.virginia.gov Copyright 2013, Commonwealth of Virginia
July 19, 2013
The Honorable John M. O'Bannon III Chair Joint Legislative Audit and Review Commission General Assembly Building Richmond, Virginia 23219
Dear Delegate O’Bannon:
House Joint Resolution 108 (2012) directed the Joint Legislative Audit and Review Commission (JLARC) to study the cost efficiency of the Commonwealth’s institutions of higher education and to identify opportunities to reduce the cost of public higher education in Virginia. This is the first report in a series of reports under HJR 108 that will be released during 2013 and 2014. This report includes context that will be relevant to topics addressed in the subsequent JLARC reports on key topics, such as faculty activities and non-academic student fees and costs.
The final report was briefed to the Commission and authorized for printing on June 10, 2013. On behalf of the Commission staff, I would like to thank the Secretary of Education and the State Council of Higher Education for Virginia for their assistance during this review. I would also like to acknowledge the staff at Virginia’s 15 public higher education institutions, who have been very accommodating to our research teams.
Sincerely,
Glen S. Tittermary Director
GST/ehs


Table of Contents
JLARC Report Summary i
1 Virginia’s 15 Public Four-Year Higher Education Institutions Vary Widely and Have Substantial Autonomy
1
Virginia Has 15 Public Higher Education Institutions With Varying Degree Offerings, Student Populations, Selectivity, and Prices
2
Virginia Has a Decentralized System in Which Most Authority for Higher Education Resides With Boards of Visitors
5
Higher Education Restructuring Act of 2005 Further Expanded Institutional Autonomy
10
JLARC Series on Higher Education 12
2 Most Spending Is Not on Instruction; Auxiliary Enterprises Drive Spending Increases
13
Spending and Staffing for Activities Other Than Direct Instruction Has Averaged About Two-Thirds of Total
13
Spending on Auxiliary Enterprises Has Been Largest Contributor to Spending Increases at Virginia Institutions
16
3 States Have Shifted More of the Financial Burden of Higher Education to Students
19
Virginia Provides a Declining Portion of Total Revenue and Less Than National Average
19
Students at Virginia Institutions Provide a Larger Percentage of Revenue Through Tuition and Fees
24

4 Virginia Has Increased Enrollment More and Graduated Students Faster Than Nationwide
27
Enrollment in Higher Education Institutions Has Increased Nationally and in Virginia
27
A Higher Proportion of Students in Virginia Graduate Faster Than at Institutions Nationwide
30
5 Price of Higher Education Has Increased Substantially in Virginia and Nationwide
35
Recent State Policy Has Afforded Institutions More Autonomy to Increase Tuition and Fees
35
Tuition and Fees Have Increased Substantially, Though Slightly Less in Virginia Than Nationwide
37
Charges for Student Housing and Meal Plans Have Also Increased
40
6 Higher Education Now Consumes More Income, Necessitating Increased Borrowing and Other Aid
45
Tuition and Fees Have Substantially Outpaced Average Income
45
Greater Percentage of Students Borrow or Receive Other Aid and They Receive Substantially More in Aid
47
Increasing Loans and Other Aid Likely Facilitated Enrollment Growth Despite Increasing Tuition
50
Increased Student Borrowing Is Major Concern 52
Appendixes
A: Study Mandate 53
B: Research Activities and Methods 55
C: Virginia Institutions Compared to Carnegie Classification Averages
57
D: Enrollment Trends at Virginia’s Public Four-Year Institutions
64
E: Agency Responses 69

Acronyms
Christopher Newport University CNU College of William and Mary CWM George Mason University GMU James Madison University JMU Longwood University LU National Center for Education Statistics NCES Norfolk State University NSU Old Dominion University ODU Radford University RU State Council of Higher Education for Virginia SCHEV University of Mary Washington UMW University of Virginia UVA University of Virginia – Wise UVA-Wise U.S. Department of Education U.S. DOE Virginia Commonwealth University VCU Virginia Military Institute VMI Virginia State University VSU Virginia Tech VT


JLARC Report Summary i
House Joint Resolution 108 (2012) directs the Joint Legislative Audit and Review Commission (JLARC) to study the cost efficiency of the Commonwealth’s institutions of higher education and to identify opportunities to reduce the cost of public higher education in Virginia. The resolution identifies 14 items related to the cost and operations of public four-year higher education institutions in Virginia. Given the scope of this review, JLARC staff will release a series of reports under HJR 108 during 2013 and 2014. This first report in the series includes context that will be relevant to topics addressed in the subsequent JLARC reports on key topics, such as faculty activities and non-academic student fees and costs.
Virginia’s 15 Public Four-year Higher Education Institutions Vary Widely
Virginia has 15 four-year public higher education institutions. Col-lectively, these 15 institutions offer a wide range of educational experiences for students. For example, Virginia’s colleges and uni-versities collectively offer more than 1,400 academic programs across dozens of subjects culminating in bachelor’s degrees, mas-ter’s degrees, doctorates, and certificates.
JLARC Report Summary: Trends in Higher Education Funding, Enrollment, and Student Costs
• Most spending at public four-year higher education institutions in Virginia and nationally is on activities other than direct instruction. Spending on student housing, dining, and intercollegiate athletics—through auxiliary enterprises—has been the largest driver of spending increases at Virginia institutions. (Chapter 2)
• State funding as a percentage of total revenue at institutions in Virginia and na-tionally has declined. In Virginia, State general funding per student (adjusted for inflation) declined 22 percent between 1991-92 and 2011-12. (Chapter 3)
• The price of higher education has increased substantially over the last two dec-ades, though slightly less in Virginia than nationally. In Virginia, tuition and fees plus charges for student housing and dining increased, on average, 150 per-cent between 1992-93 and 2011-12. (Chapter 5)
• Average annual income increased far less than the price of higher education, ne-cessitating a large increase in the percentage of students who borrow and the amount they borrow. The average annual student loan amount in Virginia al-most tripled between 1992-93 and 2011-12 to nearly $10,000. (Chapter 6)
Key
Fin
ding
s

ii JLARC Report Summary
In 2012, there were more than 200,000 students at Virginia’s 15 public institutions. These students included undergraduate, grad-uate, and professional students. They also included full-time and part-time; in-state and out-of-state; and those who live on and off campus. Virginia’s public institutions also include highly selective institutions and those that are not as selective.
Virginia’s public institutions also have a wide range of tuition and fees. For example, in-state tuition and fees in 2012-13 ranged from just under $3,400 to more than $9,200. Similarly, other mandatory fees ranged from about $1,600 to nearly $4,900.
Most Spending Is on Activities Other Than Direct Instruction and Largest Driver of Spending Increase in Virginia Has Been Auxiliary Enterprises
During the last two decades, total spending by Virginia’s 15 public higher education institutions increased from $2.6 billion to nearly $6 billion, a 130 percent increase. As total spending increased, the proportion of spending on instruction (consisting of instructional staff salaries and benefits, and educational facility operations and maintenance) has remained relatively steady at about one-third. This has also generally been the case nationally during the same time period. The remaining two-thirds of institutional spending is on functions such as research, student services, academic and in-stitutional support, and auxiliary enterprises such as student housing, dining, and intercollegiate athletics.
During the last decade, total spending per student (in inflation-adjusted dollars) increased about two percent at Virginia’s six re-search institutions, and about 11 percent at Virginia’s other nine institutions. Spending on auxiliary enterprises funded by students was the largest driver of spending increases. Auxiliary enterprise spending per student, after inflation, increased $821 at Virginia’s six research institutions and $906 at the other nine institutions.
Virginia Institutions Derive Less of Their Total Revenue From the State Than National Average
Virginia’s public four-year higher education institutions collect, on average, more total revenue per student than the nationwide aver-age. This was the case in 1991 and was still the case in 2011. In 1991, Virginia’s 15 public four-year higher education institutions collected, on average, $16,229 in revenue per student, which was substantially more than the national average of $10,952. By 2011, total revenue per student had increased in Virginia to more than $35,000, while the national average had risen to about $27,000.
The State’s portion of this higher total revenue, however, has de-clined during the last two decades and is lower than the average
In-state tuition and fees in 2012-13 ranged from just under $3,400 to more than $9,200.

JLARC Report Summary iii
for institutions nationwide and in the Southeast. Virginia’s 15 in-stitutions received, on average, 15 percent of their total revenue from State appropriations in 2011, down from 27 percent in 1991. Nationwide, institutions received 20 percent of their total revenue from state appropriations in 2011, down from 39 percent in 1991.
State General Funding Per Student Has Declined by One-Fifth in Inflation-Adjusted Dollars
During the last two decades, enrollment growth and inflation have eroded the value of general fund support to Virginia’s 15 public four-year higher education institutions (figure). During the 1991-92 academic year, Virginia’s institutions received, on average, $4,332 in State appropriations per full-time equivalent (FTE) stu-dent. By the 2011-12 academic year, this amount had dropped 22 percent in inflation-adjusted dollars to $3,382. However, in infla-tion-adjusted dollars, total revenue per FTE student still grew about 40 percent.
State Appropriations to Virginia’s 15 Public Four-year Higher Education Institutions Declined by One-Fifth in Inflation-Adjusted, Per FTE Student Dollars (1991 to 2011)
Source: JLARC staff analysis of information reported by institutions to the National Center for Educational Statistics.
Other revenue State appropriations
Infla
tion-
adju
sted
, per
full-
time
equi
vale
nt
stud
ent-a
djus
ted,
dol
lars
$
0
5,000
10,000
15,000
20,000
25,000
1991 2011
iv JLARC Report Summary
Public Higher Education Institutions Now Raise More Revenue Through Charges to Students
The reduction in the percentage of total revenue derived from states has coincided with increased reliance on tuition and fees provided by students. Virginia’s institutions derived, on average, 23 percent of their total revenue from tuition and fees in 2011, up from 16 percent in 1991. This increase is similar to what occurred nationwide and among public four-year institutions in the South-east. Consequently, students are now funding more of their educa-tional experience through tuition and fees, and payments for services such as housing and dining.
Virginia’s institutions have historically relied slightly more on rev-enue from auxiliary enterprises funded by students, such as hous-ing and dining, than other institutions. This was the case in 1991 and was still the case in 2011. Virginia’s institutions derived, on average, 14 percent of their total revenue from auxiliary enterpris-es in 2011, the same proportion as in 1991. During this time peri-od, revenue from auxiliary enterprises at public four-year institutions in the Southeast and nationally has fluctuated be-tween 10 and 12 percent of total revenue.
Virginia Institutions Have Increased Enrollment More and Graduated Students Faster Than National Average
The number of students enrolled at higher education institutions has increased nationally, and to an even greater extent in Virginia, during the last 20 years. However, largely because of the faster growth in private four-year and public two-year enrollment, public four-year institutions now educate a slightly smaller percentage of all higher education students. In Virginia, private institution en-rollment has grown substantially since 1991, and by 2011 more than one-fifth of all higher education students in Virginia attended a private four-year institution.
Virginia’s 15 public four-year institutions graduated, on average, 46 percent of their students in four years and 63 percent in six years during the 2011-12 academic year. These graduation rates were considerably better than the rate nationally and among pub-lic four-year institutions in the Southeast. Several Virginia institu-tions also graduated a substantially higher percentage than a statistical model would predict based on certain student and school characteristics.
Price of Attending Virginia Institutions Increased Less Than National Average, but Is Generally Higher in Virginia
Between the 1991-92 and the 2011-12 academic years, tuition and fees nationwide at public four-year institutions increased 256 per-
Students are now funding more of their educational experience through tuition and fees, and payments for services such as housing and dining.

JLARC Report Summary v
cent—even more than the cost of hospital services. Tuition and fees at Virginia’s institutions increased slightly less, 217 percent, during this time period and averaged $9,452 for the 2011-12 aca-demic year. However, Virginia’s 15 public four-year higher educa-tion institutions, on average, increased their tuition and fees more on a percentage basis than other institutions in the same Carnegie classification. Virginia’s institutions also charge more in tuition and fees, on average, than the average of other public institutions in the same Carnegie classification.
Other student charges, in particular housing and dining, have also increased nationally and in Virginia, but less than tuition and fees. Average charges for these services have risen far more than aver-age rent and meal costs during the last two decades. Student fees for on-campus housing across Virginia’s institutions increased 134 percent between 1992 and 2011, and averaged about $4,800 for the 2011-12 academic year. Student fees for on-campus meal plans in-creased by 107 percent in Virginia during the same time period, and averaged about $3,700 for the 2011-12 academic year.
In 1992, Virginia’s public institutions charged, on average, $7,165 for tuition and fees, room, and board. By 2011, these major compo-nents of the cost of attendance averaged nearly $18,000—an in-crease of about 150 percent. However, these charges increased less on a percentage basis in Virginia than across public four-year in-stitutions in the Southeast and nationwide. Despite this smaller percentage increase, these combined charges at Virginia’s 15 pub-lic institutions increased more in nominal dollars. Virginia’s 15 public institutions still charge more, on average, for these major components of higher education than public institutions nation-wide.
Tuition and Fee Increases Nationally and in Virginia Substantially Outpaced Increases in Income
Average annual income nationwide increased 86 percent between 1991 and 2011, to about $54,000. However, because tuition and fees increased three times as much during the same time period, tuition and fees now consume a higher portion of this average an-nual income. Average tuition and fees in Virginia consumed ten percent of average annual income in 1991, and this portion had grown to 17 percent by 2011.
The above trend is similar when viewed in terms of income of those who have graduated with a four-year degree. In 2001, the average worker with a bachelor’s degree made about $42,900 annually. By 2011, this had increased 23 percent to about $52,700. In contrast, average tuition and fees in Virginia increased 170 percent during
Over twenty years, the cost of tuition and fees nationwide increased more than the cost of hospital services.

vi JLARC Report Summary
this time period—seven times more than the average income of col-lege graduates.
More Virginia Students Borrow to Attend Institutions of Higher Education, and Borrow Increasingly Larger Amounts
The above disparity between the price of higher education and in-come has necessitated a substantial increase in the number of stu-dents who borrow to pay for their higher education. In 1991-92, about 30 percent of students at Virginia’s 15 public four-year high-er education institutions used student loans. By 2011-12, more than half the students in Virginia borrowed to cover at least some of the cost of higher education.
As more students used student loans, the amount of the average loan also increased substantially across Virginia’s 15 public insti-tutions. In the 1992-93 academic year, the average student using loans borrowed $3,318 to attend one year at a Virginia institu-tions. By the 2011-12 academic year, the average student using loans borrowed $9,893 per year, or $6,575 more than in 1992-93 (figure). Of this increase, inflation only accounted for about $2,000, less than one-third of the total increase. The average loan amount jumped considerably as the most recent recession took hold. Be-tween 2008 and 2009, the average loan amount increased nearly $1,000, an increase of 13 percent.
Average Annual Student Loan Amount Has Nearly Tripled During Last 20 Years (1992-93 to 2011-12)
Source: JLARC staff analysis of information collected by the State Council of Higher Education for Virginia.
0
1,000
2,000
3,000
4,000
5,000
6,000
7,000
8,000
9,000
10,000
Ave
rage
am
ount
bor
row
ed, a
nnua
lly
$ $9,893
$3,318
1992-93 2011-12
Inflation
Average tuition and fees in Virginia increased seven times more than the average income of college graduates.

1 Chapter 1: Virginia’s 15 Public Four-Year Higher Education Institutions Vary Widely and Have Substantial Autonomy
House Joint Resolution 108 (2012) directs the Joint Legislative Audit and Review Commission (JLARC) to study the cost efficiency of the Commonwealth’s institutions of higher education and to iden-tify opportunities to reduce the cost of public higher education in Virginia. The resolution identifies 14 items related to the cost and operations of public four-year higher education institutions in Vir-ginia. The overarching intent of the resolution is to, amid substan-tial increases in tuition and fees, assess the major drivers of cost at Virginia’s 15 public higher education institutions (Appendix A).
Given the scope of this review, JLARC staff will release a series of reports under HJR 108 during 2013 and 2014. This first report in the series provides context that will be relevant to topics addressed in the subsequent JLARC reports on key topics such as faculty ac-tivities and non-academic student fees and costs. This context is primarily provided in the form of historical trends nationally, and in Virginia, about aspects of higher education that are related to cost and efficiency of higher education, including
• institutional spending, staffing, and revenue; • student enrollment and graduation rates; • tuition and fees, and fees for student housing and dining; and • how tuition and fees have changed relative to income and the
effect on student borrowing and other financial aid.
Cha
pter
1
Virginia’s 15 Public Four-Year Higher Education Institutions Vary Widely and Have Substantial Autonomy
Virginia has 15 public four-year higher education institutions. Collectively, these institutions educate a wide range of full-time and part-time students, and in-state and out-of-state students. These institutions also offer a wide range of academic programs and degrees. Virginia has colleges and universities that are highly selec-tive and some that are less selective, as well as some that charge comparatively higher and lower tuition and fees. The General Assembly has chosen to delegate considerable authority to each institution’s board of visitors. The Code of Virginia designates these boards as the stewards of each institution and empowers them to hire and fire presidents, set tuition and fees, and make the majority of decisions re-lated to the academic and non-academic aspects of the institution. Compared to oth-er states, Virginia takes a decentralized approach to higher education. In recent years, the General Assembly has delegated even more autonomy to Virginia’s insti-tutions, primarily through the Higher Education Restructuring Act of 2005.
In S
umm
ary

2 Chapter 1: Virginia’s 15 Public Four-Year Higher Education Institutions Vary Widely and Have Substantial Autonomy
VIRGINIA HAS 15 PUBLIC HIGHER EDUCATION INSTITUTIONS WITH VARYING DEGREE OFFERINGS, STUDENT POPULATIONS, SELECTIVITY, AND PRICES
Virginia has 15 four-year public higher education institutions. Col-lectively, these 15 schools offer a wide range of educational experi-ences for students. They are located in urban, suburban and small town settings throughout the State (Figure 1). They range in age from the College of William and Mary (CWM) chartered in 1693 to Christopher Newport University (CNU), which became an inde-pendent university in 1992 after being a two-year branch of CWM. They include two historically black universities, Virginia State University (VSU) and Norfolk State University (NSU). They also include the Virginia Military Institute (VMI), which offers higher education in a military environment.
Figure 1: Virginia’s 15 Public Four-Year Institutions Are Located Throughout the State
Source: JLARC staff.
Virginia Public Four-Year Higher Education Institutions Offer a Wide Array of Programs and Degrees
Virginia’s public four-year institutions collectively offer more than 1,400 academic programs across dozens of subjects culminating in bachelor’s degrees, master’s degrees, doctorates, and certificates. There are programs offered by most Virginia colleges and universi-ties, such as biology, chemistry, economics, English, history, math-ematics, nursing, physics, psychology, and sociology. There are al-so programs offered by only one or several, such as dance or physical education.
• CNU
• CWM
• GMU
• JMU
• Longwood
• NSU• ODU• Radford
• UMW
• UVA
• UVA-Wise
• VCU
• VMI
• VSU• Va Tech
3 Chapter 1: Virginia’s 15 Public Four-Year Higher Education Institutions Vary Widely and Have Substantial Autonomy
George Mason University (GMU) offers the most degree programs: 261. Nine of the 15 institutions offer certificates in various pro-gram areas. The University of Virginia (UVA), GMU, and CWM each have law schools that award juris doctor (JD) degrees. Virgin-ia Commonwealth University (VCU) and UVA both have medical schools that award medical doctor degrees (MD). Eight schools award PhDs and seven do not.
Virginia’s Institutions Have Widely Varying Percentages of Full-Time, In-State, On-Campus, and Undergraduate Students
In 2011-12, there were more than 200,000 students at Virginia’s 15 public four-year institutions. These students included undergradu-ate, graduate, and professional students, such as those JDs or MDs. They included full-time and part-time; in-state and out-of-state; and those who live on and off campus.
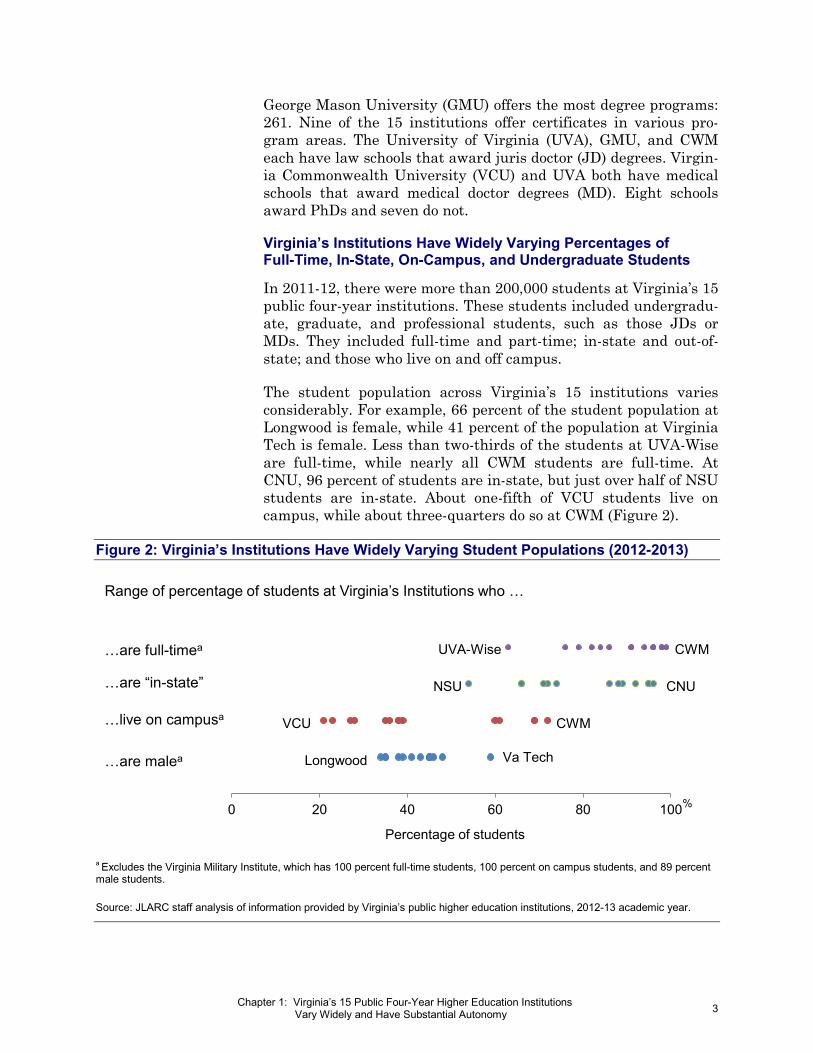
The student population across Virginia’s 15 institutions varies considerably. For example, 66 percent of the student population at Longwood is female, while 41 percent of the population at Virginia Tech is female. Less than two-thirds of the students at UVA-Wise are full-time, while nearly all CWM students are full-time. At CNU, 96 percent of students are in-state, but just over half of NSU students are in-state. About one-fifth of VCU students live on campus, while about three-quarters do so at CWM (Figure 2).
Figure 2: Virginia’s Institutions Have Widely Varying Student Populations (2012-2013)
a Excludes the Virginia Military Institute, which has 100 percent full-time students, 100 percent on campus students, and 89 percent male students.
Source: JLARC staff analysis of information provided by Virginia’s public higher education institutions, 2012-13 academic year.
0 20 40 60 80 100
Percentage of students
Range of percentage of students at Virginia’s Institutions who …
…are full-timea
…are “in-state”
…live on campusa
…are malea
UVA-Wise CWM
NSU CNU
VCU CWM
Longwood Va Tech
%

4 Chapter 1: Virginia’s 15 Public Four-Year Higher Education Institutions Vary Widely and Have Substantial Autonomy
In 2012-13, VCU had the most undergraduate students, at nearly 24,000. VMI had the fewest undergraduate students, at just under 1,700. George Mason had the most graduate students, at more than 12,000, while CNU has the fewest graduate students at about 140. Two institutions report no graduate students: VMI and UVA-Wise. Chapter 4 includes more detailed information on enrollment trends.
Selectivity of Virginia Institutions Varies
In 2011-12, there were nearly 160,000 applications submitted to Virginia’s public four-year institutions. Of the applicants, about 92,000, or 58 percent, were offered admission. Ultimately, about 32,000, or 34 percent, of these individuals chose to enroll at one of Virginia’s 15 colleges or universities.
Virginia’s institutions include highly selective institutions and those that are not as selective. For example, institutions such as UVA and CWM offered admission to 33 and 35 percent, respective-ly, of those who applied. In contrast, institutions such as Radford University (RU), UVA-Wise, and the University of Mary Washing-ton (UMW) offered admission to 80, 77, and 76 percent of those who applied, respectively.
Virginia’s public higher education institutions also enroll students with a wide range of scores on standardized tests, such as the SAT. For example, in 2011-12, the 75th percentile SAT scores of enrolled students ranged from 1460 on the reading and math portions to 930. This span of 530 points suggests a relatively wide range of opportunity for students who attain comparatively higher and low-er scores.
Virginia’s Institutions Charge Widely Varying Tuition and Fees and Wide Range of Students Take Out Loans and Receive Other Financial Aid
While the cost of attending four-year public colleges and universi-ties has increased (discussed in Chapter 5), Virginia’s institutions have a wide range of tuition and fees. For example, annual in-state tuition and fees in 2012-13 ranged from just under $3,400 to more than $9,200. Similarly, mandatory non-education and general (non-E&G) fees range from about $1,600 to nearly $4,900 (exclud-ing VMI, which has additional and higher mandatory fees, such as a military activities fee).
Virginia’s institutions also vary substantially in how many of their students receive student loans and/or grants (discussed in Chapter 6). For example, 29 percent of UVA students are using student loans, while nearly 87 percent of VSU students are taking out loans to attend school. More broadly, about 55 percent of CWM’s
Tuition and fees Throughout this report, the term “tuition and fees” will be used to refer to the tuition and mandatory education and general (E&G) fees charged by institutions, as well as mandatory non-E&G fees.
In-State and Out-of-State Tuition
All Virginia institutions charge out-of-state students higher tuition and fees than in-state students. Virginia policy requires Virginia institutions to charge out-of-state students at least 100 percent of the cost of their education. Most charge considerably more.

5 Chapter 1: Virginia’s 15 Public Four-Year Higher Education Institutions Vary Widely and Have Substantial Autonomy
student population is either using student loans or receiving a grant of some kind. In contrast, 96 percent of NSU students are taking out loans or receiving a grant to assist with the cost of higher education (Figure 3).
Figure 3: Virginia Schools Have Widely Differing Percentages of Students Taking Out Loans or Receiving Grants; Some Have Very High Percentages
Source: JLARC staff analysis of information provided by Virginia’s public colleges and universities, 2012, and information reported to the National Center for Education Statistics for 2011.
VIRGINIA HAS DECENTRALIZED SYSTEM IN WHICH MOST AUTHORITY FOR HIGHER EDUCATION RESIDES WITH BOARDS OF VISITORS
Virginia’s system to govern its 15 public four-year higher educa-tion institutions includes four key entities. The boards of visitors at each institution have the most direct authority over operations and financing. The Governor and General Assembly appoint or confirm the boards of visitors, affect certain funding through the budget, and can influence institutional operations or funding through either executive orders or legislation. The Virginia State Council of Higher Education for Virginia (SCHEV) serves as the statewide coordinating board.
General Assembly Has Authority to Create Institutions, Prescribe Governance Approach, Appropriate Funds, and Pass Legislation
The Constitution of Virginia does not require the General Assem-bly to provide its citizens with higher education, nor does it require it to fund higher education institutions. This is in contrast to pub-lic elementary and secondary education, which has quality and funding requirements included in Virginia’s constitution. This is also in contrast to other major areas of State funding, such as
0 20 40 60 80 100
Percentage of students
Range of percentage of students at Virginia Institutions who …
… usestudent loans
… receive loans or grants NSUCWM
VSUUVA
%
The Constitution of Virginia does not require the General Assembly to fund higher education institutions.
6 Chapter 1: Virginia’s 15 Public Four-Year Higher Education Institutions Vary Widely and Have Substantial Autonomy
transportation and Medicaid, which are subject to specific federal requirements the State must meet.
Article 8, Section 9 of the Constitution of Virginia gives the Gen-eral Assembly authority to create post-secondary educational insti-tutions, stating that the General Assembly
may provide for the establishment, maintenance, and oper-ation of any educational institutions which are desirable for the intellectual, cultural, and occupational development of the people of this Commonwealth.
Article 8, Section 9 also gives the General Assembly the authority to prescribe through the Code of Virginia how these institutions will be governed, stating,
The governance of such institutions, and the status and powers of their boards of visitors or other governing bodies, shall be as provided by law.
Within this broad constitutional authority, the General Assembly has delegated the authority for most decisions to each institution’s board of visitors through the Code of Virginia. Historically, the General Assembly has not made substantial statutory changes that affect this delegation of authority.
The Code of Virginia stipulates that the Governor’s appointments to the boards of visitors are subject to General Assembly confirma-tion. The General Assembly may also exert influence on Virginia’s public higher education institutions through the Appropriation Act. Although the Code of Virginia authorizes boards of visitors to set tuition and fees, the Appropriation Act has stronger legal au-thority than a board decision. Through this provision, the General Assembly has used its authority to set limits on tuition increases during certain time periods. Chapter 5 provides some specific ex-amples of these legislative actions.
Governor Indirectly Influences Public Higher Education Through Board Appointments and Executive Orders
The Governor exerts influence over Virginia’s public four-year higher education institutions primarily through his appointment power. As board members’ terms expire, the Governor appoints new members after a review by the Virginia Commission on High-er Education Board Appointments. The Governor also appoints the Secretary of Education and members of SCHEV. All of the Gover-nor’s nominations are subject to confirmation by the General As-sembly.
7 Chapter 1: Virginia’s 15 Public Four-Year Higher Education Institutions Vary Widely and Have Substantial Autonomy
The Governor may exert influence by issuing executive orders re-garding higher education policy and governance. In 2010, for ex-ample, the Governor issued Executive Order No. 9, which estab-lished the Governor’s Commission on Higher Education Reform, Innovation, and Investment. This 30-member commission was es-tablished to develop a statewide higher education strategy for graduation rates and to address financial aid, workforce training, and higher education innovation.
The Governor may also influence each public four-year higher edu-cation institution through his proposed budget. Through the budg-et, the Governor may propose financial incentives to universities in return for achieving certain goals, such as those established by the Virginia Higher Education Opportunity Act of 2011. All legislation involving higher education, such as legislation adding seats to in-stitutions’ boards of visitors or limiting tuition increases, must also be signed or vetoed by the Governor.
Institutions’ Boards of Visitors Make Most Decisions Affecting Public Four-Year Higher Education in Virginia
The Code of Virginia grants boards of visitors the most direct au-thority at each institution and empowers them with direct stew-ardship of their respective institutions. Among other responsibili-ties, boards of visitors hire, evaluate, and dismiss presidents; approve budgets; set tuition and fees, admission and graduation requirements, and staffing standards; and provide strategic direc-tion (Table 1).
For Virginia’s 15 public four-year institutions, there are 14 boards—with the UVA board of visitors serving as the steward for both UVA and UVA-Wise. Each board has between 12 and 17 members. For certain boards, the Code of Virginia stipulates broad qualifications and term limits for members. However, the Code generally allows the Governor and General Assembly considerable discretion as to whom they may appoint to each institution’s board of visitors.
SCHEV Is Virginia’s Higher Education Coordinating Board
The State Council of Higher Education for Virginia was estab-lished in 1956 as the State’s coordinating board for the system of over 100 public and private colleges and universities. SCHEV’s mission is to “promote the development and operation of an educa-tionally and economically sound, vigorous, progressive, and coordi-nated system of higher education.” The Council is composed of members who are appointed by the Governor and confirmed by the General Assembly. The Council is served by a director and a staff with 32 general fund positions.

8 Chapter 1: Virginia’s 15 Public Four-Year Higher Education Institutions Vary Widely and Have Substantial Autonomy
Table 1: Boards of Visitors in Virginia Have Primary Responsibility for Higher Education Entity Key Responsibilities Board of Visitors
• Serves as stewards of the institutions • Sets institutional policy goals and priorities • Selects and dismisses president of the institution • Establishes rules for the admission and conduct of students and graduation requirements • Establishes rules for the employment of instructors and all other employees • Ensures academic integrity at the institution, including reviewing the curriculum and faculty
productivity • Sets tuition and fees • Reviews and approves budget requests to the Governor and General Assembly for State
appropriations • Ensures institution is accountable for the effective and efficient use of State funds
Governor • Appoints all members to institutions’ boards of visitors and SCHEV • Establishes key goals to which institutions align their strategic plans • Prepares and submits a biennial budget • Issues executive orders
General Assembly
• Confirms Governor’s nominations for boards of visitors and SCHEV • Adopts a biennial budget • Enacts legislation pertaining to higher education
State Council of Higher Education for Virginia
• Develops a statewide strategic plan • Provides policy guidance and recommendations on legislation and budgets • Approves any changes to institutional missions, such as adding academic programs • Administers State financial aid programs • Maintains a data information system for higher education • Regulates private and out-of-state institutions operating in Virginia
Source: JLARC staff review of agency documentation and the Code of Virginia.
SCHEV is responsible for developing a statewide strategic plan that identifies a coordinated approach to State goals of higher edu-cation. SCHEV provides guidance and recommendations to the Governor and General Assembly about legislation, institutional budgets, and financial aid. It reviews and approves changes to an institution’s mission, including adding or eliminating academic programs. SCHEV develops and maintains an information system for higher education, and conducts certain analysis on the data it collects. SCHEV also administers the State’s financial aid pro-grams. Finally, SCHEV regulates private and out-of-state institu-tions operating in Virginia.
Institutions Have Many Other Stakeholders
Although the boards of visitors retain the most authority at each institution, the institutions still have many other stakeholders. There are organizations that certify academic programs, such as the Southern Association of Colleges and Schools, and other organ-izations such as the National Collegiate Athletics Association. The U.S. Department of Education has financial aid and reporting re-quirements. Additionally, each institution is located within a ju-risdiction and community of citizens that have a strong interest in the operations of the college or university within their boundaries.
9 Chapter 1: Virginia’s 15 Public Four-Year Higher Education Institutions Vary Widely and Have Substantial Autonomy
Other stakeholders include students and alumni, private donors of funding, and institutional staff and faculty.
Virginia Has a Comparatively Decentralized Approach to Public Higher Education Governance
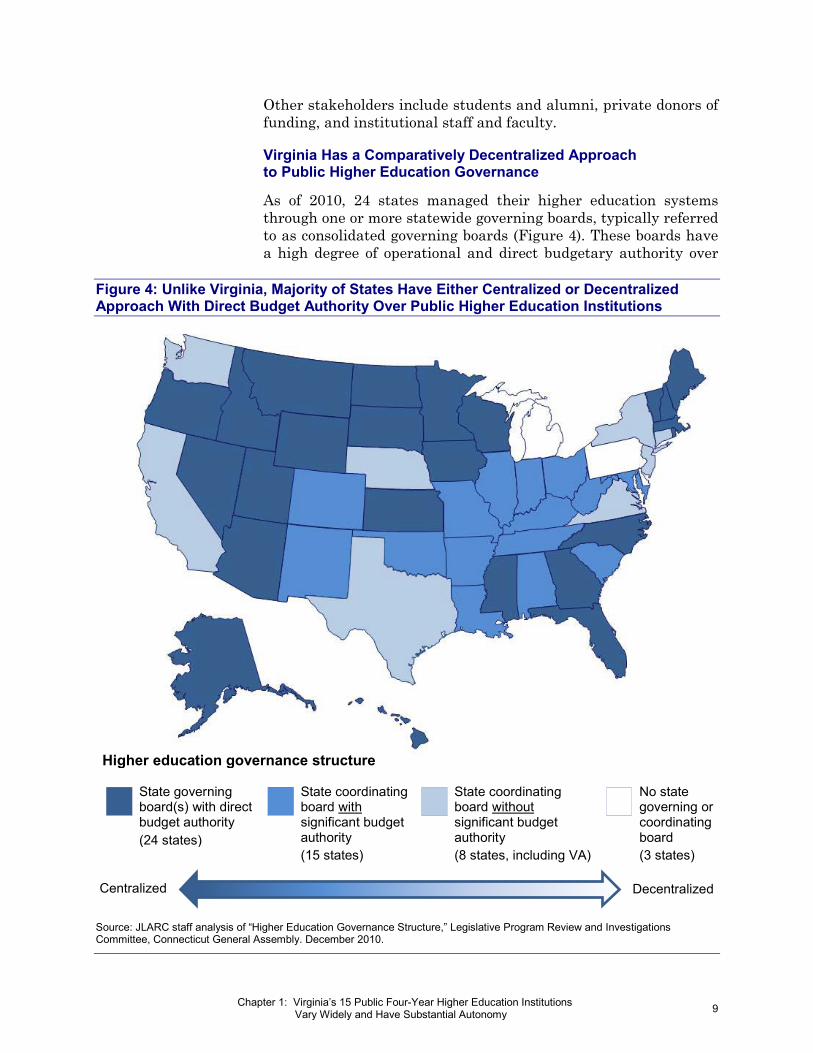
As of 2010, 24 states managed their higher education systems through one or more statewide governing boards, typically referred to as consolidated governing boards (Figure 4). These boards have a high degree of operational and direct budgetary authority over
Figure 4: Unlike Virginia, Majority of States Have Either Centralized or Decentralized Approach With Direct Budget Authority Over Public Higher Education Institutions
Source: JLARC staff analysis of “Higher Education Governance Structure,” Legislative Program Review and Investigations Committee, Connecticut General Assembly. December 2010.
Higher education governance structure
State governing board(s) with direct budget authority (24 states)
State coordinating board with significant budget authority (15 states)
State coordinating board without significant budget authority (8 states, including VA)
No state governing or coordinating board (3 states)
Decentralized Centralized

10 Chapter 1: Virginia’s 15 Public Four-Year Higher Education Institutions Vary Widely and Have Substantial Autonomy
each public institution in the state. Among other responsibilities, these statewide governing boards commonly have the authority to appoint, compensate, and evaluate system and institutional lead-ership; manage institutional planning and budgeting; and estab-lish faculty and other personnel policies at each university.
The remaining states take a more decentralized approach to high-er education through some form of coordinating board. As of 2010, 23 states had a statewide coordinating board for higher education. These boards have minimal operational authority, and varying de-grees of direct and indirect budgetary authority. These boards are typically responsible for activities such as statewide higher educa-tion strategic planning, collecting data from institutions, and li-censing non-public universities. In most cases, these coordinating boards do not make personnel policies or decisions.
Virginia is in the minority of states with coordinating boards that do not have direct budgetary authority. In these eight states, in-cluding Virginia, the coordinating board reviews and makes rec-ommendations about each institution’s budget and/or approves new academic programs, but does not have direct authority to change budget requests.
The remaining three states have even more limited operational and budgetary authority over their institutions. Michigan, in par-ticular, has no statewide board or agency. Uniquely, it is the insti-tutions themselves that are specified in the Michigan state consti-tution as having autonomy.
HIGHER EDUCATION RESTRUCTURING ACT OF 2005 FURTHER EXPANDED INSTITUTIONAL AUTONOMY
The Higher Education Restructuring Act of 2005 changed the rela-tionship between the State and its four-year public universities by expanding administrative and financial autonomy in return for in-stitutions’ commitment to meet specific State goals. These goals include
• providing access and maintaining affordability; • maintaining high academic standards; • improving student retention and graduation rates; • increasing expenditures for research and numbers of patents,
and licenses; and • meeting certain financial and administrative standards.
SCHEV has annually evaluated each institution’s progress to-wards these goals, and every other year reviewed each institution’s six-year plan and revised the performance measures and targets as
JLARC Reviews of Restructuring
JLARC has conducted two reviews of the Higher Education Restructuring Act of 2005.
The first, in 2008, found that UVA, CWM, and VT generally complied with their management agreements.
The second, in 2011, found that VCU was in substantial compliance with its management agreement.
Virginia is in the minority of states with coordinating boards that do not have direct budgetary authority.
11 Chapter 1: Virginia’s 15 Public Four-Year Higher Education Institutions Vary Widely and Have Substantial Autonomy
necessary. If SCHEV certifies that an institution has met its per-formance standards, an institution is eligible to receive certain fi-nancial incentives, such as interest accrued on tuition and fees and other non-general fund education and general funds that are de-posited in the State treasury. If the institution is not certified by SCHEV, it does not receive these incentives.
The 2005 Higher Education Restructuring Act also granted Virgin-ia’s public institutions the ability to receive three different levels of autonomy. Level I entails some degree of increased operational au-tonomy in areas including procurement, leases, personnel, and capital outlay (though, in practicality, this level of autonomy is not substantially different from before this status was granted).
Level II allows institutions to seek autonomy in three areas: in-formation technology, procurement, and capital outlay. This addi-tional operational autonomy may be granted through a memoran-dum of understanding with the appropriate cabinet secretary. There are currently six level II institutions: GMU, James Madison University (JMU), Old Dominion University (ODU), RU, VMI, and Longwood.
Level III requires a negotiated management agreement that con-fers high levels of autonomy on boards of visitors and requires the boards to develop their own policies in six areas. These six areas are: (1) capital outlay, (2) leases, (3) information technology, (4) procurement, (5) human resources, and (6) finance and accounting. Level III is reserved for those institutions that have demonstrated advanced financial and administrative managerial competence, and have maintained a bond rating of at least AA- or its equivalent from one of the designated bond rating agencies. Currently, there are four level III institutions: UVA (including UVA-Wise), CWM, Virginia Tech (VT), and VCU.
The General Assembly also passed the Virginia Higher Education Opportunity Act of 2011. The Act has numerous stated objectives and purposes, including to award 100,000 additional undergradu-ate degrees in high demand fields by 2025. The Act includes vari-ous provisions related to funding, need-based financial aid, and in-centives. Certain provisions of the Act will build upon and/or supersede the institutional goals set forth in the 2005 Higher Edu-cation Restructuring Act. The 2011 Act also created the Higher Education Advisory Committee, which, among other responsibili-ties, will periodically assess whether Virginia’s higher education system is meeting its statewide objectives.

12 Chapter 1: Virginia’s 15 Public Four-Year Higher Education Institutions Vary Widely and Have Substantial Autonomy
JLARC SERIES ON HIGHER EDUCATION
JLARC staff will release five reports under HJR 108 during 2013 and 2014. In addition to this report on long-term trends in higher education, JLARC staff will release studies on
• auxiliary enterprises and other major non-academic student cost drivers (September 2013);
• instruction, research, and academic facilities (December 2013);
• administrative staffing, information technology, and pro-curement (2014); and
• strategies and practices to improve efficiency and reduce student costs (2014).
Certain topics in this report are addressed only at a high level, or not at all, because they will be covered in detail in forthcoming studies in the series.

13 Chapter 2: Most Spending Is Not on Instruction; Auxiliary Enterprises Drive Spending Increases
A key aspect of the cost-efficiency of higher education institutions is their spending patterns. HJR 108 identifies several areas of in-stitutional spending, in particular on various academic and non-academic functions, which will be assessed in more detail in sub-sequent JLARC staff reports in this series on higher education. This chapter illustrates, however, several long-term trends in higher education spending to provide context for these subsequent JLARC reports.
SPENDING AND STAFFING FOR ACTIVITIES OTHER THAN DIRECT INSTRUCTION HAS AVERAGED ABOUT TWO-THIRDS OF TOTAL
The overarching mission of higher education institutions is to edu-cate students. Institutions of higher education employ faculty and other staff, build and maintain capital infrastructure, and provide many other services that benefit students, staff, and the surround-ing community. This spending on the various academic and non-academic aspects of an institution will be a primary focus of the remaining JLARC reports in this series on higher education. How-ever, to provide context for these subsequent reports, some sum-mary information about spending and staffing is provided below.
Cha
pter
2
Most Spending Is Not on Instruction; Auxiliary Enterprises Drive Spending Increases
During the last two decades, total spending by Virginia’s 15 public higher education institutions increased from $2.6 billion to nearly $6 billion (130 percent increase). As total spending increased, the proportion of spending on direct instruction has remained relatively steady at about one-third. This has also generally been the case nationally during the same time period. The remaining two-thirds of institutional spending is on functions such as research, student services, academic and institutional support, and auxiliary enterprises that include student housing, dining, and intercollegiate athletics. During the last decade, total spending per student (accounting for inflation) increased about two percent at Virginia’s six research institutions, and about 11 percent at Virginia’s other nine institutions. Spending on auxiliary enterprises funded by students was the largest driver of these spending increases. Auxiliary enterprise spending per student, after inflation, increased $821 at Virginia’s six research institutions and $906 at the other nine non-research institutions.
In S
umm
ary
14 Chapter 2: Most Spending Is Not on Instruction; Auxiliary Enterprises Drive Spending Increases
As Spending Has Increased, Most Spending Has Remained on Activities That Are Not Direct Instruction
In 1991, Virginia’s 15 public four-year higher education institu-tions spent a total of about $2.6 billion. By 2011, this had in-creased 130 percent to nearly $6 billion. During the last two dec-ades as this spending increased, the proportion of total spending on instruction and other activities has remained generally the same in Virginia and nationally. On average, instructional spend-ing at Virginia institutions has accounted for about one-third of to-tal spending. This is the case nationally as well.
According to the U.S. Department of Education, instructional spending is primarily comprised of two major components:
• Salaries and benefits for academic instruction, and other forms of instruction and education; and
• Operations and maintenance of facilities used for educational and general purposes.
Salaries and benefits for faculty are the largest component of in-structional spending.
The remaining two-thirds of spending has been on a variety of oth-er categories, such as research, academic and institutional support functions, and physical plant operations and maintenance. Some categories, in particular academic support, include some spending that is important to the ability to provide instruction. The largest category of other spending, however, is auxiliary services. These auxiliary services, or enterprises, include student housing, dining, intercollegiate athletics, and campus recreation, among others.
Which spending categories are used to derive total institutional spending can affect the percentage that each category comprises of the total. For example, removing hospital spending from UVA’s to-tal spending would lower the total spending amount, thereby in-creasing the percentage of spending on all other categories.
Majority of Virginia Institutions Spend a Smaller Portion of Total on Instruction Than Other Public Institutions in Same Carnegie Classification
Even though the overall proportion of spending on instruction across Virginia’s 15 public institutions has remained relatively constant over the years, each institution spends a different portion compared to other institutions in the same Carnegie classification. Virginia’s 15 public four-year higher education institutions fall in-to six different classifications developed by the Carnegie Founda-tion for the Advancement of Teaching. The classifications were de-veloped in 1970 and updated periodically (most recently in 2010)

15 Chapter 2: Most Spending Is Not on Instruction; Auxiliary Enterprises Drive Spending Increases
and are widely used in higher education to group similar institu-tions based on key characteristics, such as the amount of research conducted.
In 2011, 12 of Virginia’s public four-year higher education institu-tions spent a lower percentage of their total revenue on instruction than other public institutions in the same Carnegie classification (Table 2). The differences ranged from 12 percentage points less at NSU to 10 percentage points higher at VCU. Importantly, this does not necessarily mean, however, that these institutions spent less or more in total, or per student, on instruction.
Some of the differences between instructional spending as a per-centage of total spending can be explained by the higher portion of total spending on auxiliary services. The second largest category of spending at public four-year institutions nationally and in Virginia is typically on auxiliary services, which usually include housing, dining, intercollegiate athletics, and other functions that are in-tended to be largely self-funded by students. In most cases, Virgin-ia’s 15 colleges and universities spend a higher portion of their to-tal spending on auxiliary services than other institutions.
Table 2: Twelve Virginia Institutions Spent a Smaller Portion of Total Spending on Instruction Than Other Public Institutions in the Same Carnegie Classification (2011)
Instructional Spending as Percent of Total Spending Difference Virginia
Institution Carnegie Classification
Average NSUc 28% 41% -12% LUd 30 38 -8 UMWc 33 41 -8 UVA-Wisef 30 35 -4 VMIf 30 35 -4 JMUc 36 41 -4 CNUe 34 38 -4 VTa 28 31 -3 UVAa 30 31 -1 VSUe 37 38 -1 CWMb 34 35 -1 RUc 40 41 -1 ODUb 42 35 +7 GMUb 44 35 +9 VCUa 41 31 +10
a Very high research; b High research; c Masters, large; d Masters, medium; e Masters, small; f Baccalaureate, arts and sciences. Hospital spending at UVA not included. Note: Numbers may not add due to rounding. Source: JLARC staff analysis of information provided by institutions to the NCES, U.S. DOE.
Appendix C includes the major spending categories and percent-ages for each Virginia institution by Carnegie classification.
Most recent data available
Much of the data provided throughout this report compares Virginia’s institutions to others nationwide.
As of the drafting of this report, the most recent data available for both Virginia and national institutions from the U.S. Department of Education is for academic year 2011-12.

16 Chapter 2: Most Spending Is Not on Instruction; Auxiliary Enterprises Drive Spending Increases
About One-Third of Full-Time Higher Education Employees in Virginia and Nationwide Are Instructional, Research, or Service
As might be expected given the trends in instructional spending cited above, the proportion of staffing devoted to instruction, re-search, and service has remained relatively constant during the last ten years. Between 2002 and 2011, institutional employees categorized as instruction, research, or service-oriented comprised between 31 and 33 percent of total institutional staffing. This was the case nationwide and in Virginia, with Virginia’s institutions devoting 31.7 percent, on average, of their total full-time staffing to instruction, research, and public service.
Staff comprising the remainder of total full-time employees are classified as administrative, managerial, and professional and non-professional support. While the proportions of these staff have fluctuated somewhat during the last ten years, they continue to to-tal about two-thirds of staffing. This was also generally the case nationwide and in Virginia.
SPENDING ON AUXILIARY ENTERPRISES HAS BEEN LARGEST CONTRIBUTOR TO SPENDING INCREASES AT VIRGINIA INSTITUTIONS
Between the 2001-02 and 2010-11 academic years, total spending at Virginia’s six research institutions (UVA, VCU, VT, CWM, GMU, and ODU) per student, adjusted for inflation, increased from $28,072 to $28,698, or $626 (two percent). During the same time period, total spending per student, adjusted for inflation, at Virginia’s other nine institutions increased from $18,579 to $20,642, or $2,064 (11 percent). The largest driver of increased spending at Virginia’s public four-year higher education institu-tions per student, adjusted for inflation, was auxiliary enterprises, such as housing, dining, and intercollegiate athletics.
As shown in Figure 5, spending at Virginia’s six research institu-tions on student financial aid and instruction declined in inflation-adjusted, per-student dollars. However, these declines were more than offset by inflation-adjusted increases in research, student services, and most notably, auxiliary enterprises. Auxiliary enter-prise spending increased, on average for these research institu-tions, $821 per student, adjusted for inflation.
As shown in Figure 6, the largest contributor to spending increases at Virginia’s other nine institutions was also auxiliary enterprises. Auxiliary enterprise spending increased, on average $906 per stu-dent, adjusted for inflation. In contrast to Virginia’s research uni-versities, instructional spending per student, adjusted for infla-tion, was the second largest contributor to the increase.
Instruction, Research, and Service
Instruction Classroom instruction, course preparation, and student advising and counseling
Research Departmental and externally-sponsored research and publication of research findings
Service Work supporting the institution (such as being a department chairperson), sharing expertise, or supporting the profession (such as serving on a journal peer review panel)

17 Chapter 2: Most Spending Is Not on Instruction; Auxiliary Enterprises Drive Spending Increases
Figure 5: Auxiliary Enterprises and Research Were the Largest Contributors of Spending Increases at Virginia’s Six Research Institutions (2001-02 to 2010-11)
Note: Figures shown are for UVA, VCU, VT, CWM, GMU, and ODU combined. Hospital spending at UVA not included. Source: JLARC staff analysis of information provided by institutions to the NCES, U.S. DOE.
Figure 6: Auxiliary Enterprises and Instruction Were the Largest Contributors to Spending Increases at Virginia’s Nine Other Institutions (2001-02 to 2010-11)
Note: Figures shown are for JMU, NSU, RU, UMW, LU, CNU, VSU, UVA-Wise, and VMI. Norfolk State University has been unable to produce auditable financial statements. Data used for NSU, therefore, is—unlike for other institutions—unaudited. Source: JLARC staff analysis of information provided by institutions to the NCES, U.S. DOE.
0
200
400
600
800
1,000
1,200
1,400
1,600
-270
+319
+307
-379
+821
+626-73-46-53
Increases Decreases Total$
Auxiliary enterprises
Research
Student services
Student financial
aid
InstructionPublic service
Other
Academicand
institutional support
TOTALCon
tribu
tion
to s
pend
ing
incr
ease
(p
er s
tude
nt, i
nfla
tion-
adju
sted
)
0
200
400
600
800
1000
1200
1400
1600
1800
2000
2200
2400+200
+514
+320
+239
+906
+2,064-35
-144
Increases Decreases Total
$
Auxiliary enterprises
Instruction
Institutionalsupport
Student services
Student aid
Academic support
TOTAL
+110Public service
Research
-46Other
Con
tribu
tion
to s
pend
ing
incr
ease
(p
er s
tude
nt, i
nfla
tion-
adju
sted
)
18 Chapter 2: Most Spending Is Not on Instruction; Auxiliary Enterprises Drive Spending Increases
Auxiliary enterprise spending will be addressed in more detail in the September 2013 JLARC report on higher education. Instruc-tional spending will be addressed in more detail in the December 2013 JLARC report on higher education.

19 Chapter 3: States Have Shifted More of the Financial Burden of Higher Education to Students
Part of the backdrop to understanding the cost-efficiency of higher education institutions is their revenue streams. Several of the con-cerns cited in HJR 108 relate to student costs. Costs to students are largely determined by (1) the total revenue institutions are able to collect and (2) the portion of this total revenue that can be obtained from students, government, and other sources.
VIRGINIA PROVIDES A DECLINING PORTION OF TOTAL REVENUE AND LESS THAN NATIONAL AVERAGE
Higher education institutions derive their revenue from an in-creasingly diverse set of funding sources. Major revenue sources for most institutions of higher education include tuition and fees, funding from governments, and funding from auxiliary enterpris-es, such as housing, dining, and athletics. Government funding for public higher education is provided primarily by state govern-ments, but also to a lesser degree by the federal and certain local governments. Other revenue sources include private gifts and en-dowment income.
Nationwide and in Virginia, Total Revenue Has Increased Far More Than State Funding
Nationwide, revenue at public four-year higher education institu-tions more than tripled between the 1991-92 and 2011-12 academic
Cha
pter
3
States Have Shifted More of the Financial Burden of Higher Education to Students
The last 20 years has seen a shift in responsibility for funding higher education. Public higher education is being funded less by state governments and more by students, through tuition and fees and payments for housing, dining, intercolle-giate athletics, and other activities. Nationwide and in Virginia, institutional rev-enue has increased substantially, while state support also increased, but far less on a percentage basis. Virginia has historically provided a smaller portion of total revenue to its public institutions than the national average, and this continues to be the case. In 1991, Virginia provided 27 percent, on average, of total revenue for its 15 public four-year institutions. By 2011, State support had declined to about 15 percent of total revenue. General fund revenue provided per student, adjusted for inflation, declined more than 20 percent between 1991 and 2011 from $4,332 to $3,382. This reduction in State support has coincided with students providing a higher portion of institutional revenue through tuition and fees, as well as other charges and fees to support auxiliary enterprises. Virginia’s public four-year higher education institutions derived, on average, 23 percent of their total reve-nue from tuition and fees paid by student in 2011, up from 16 percent in 1991.
In S
umm
ary
20 Chapter 3: States Have Shifted More of the Financial Burden of Higher Education to Students
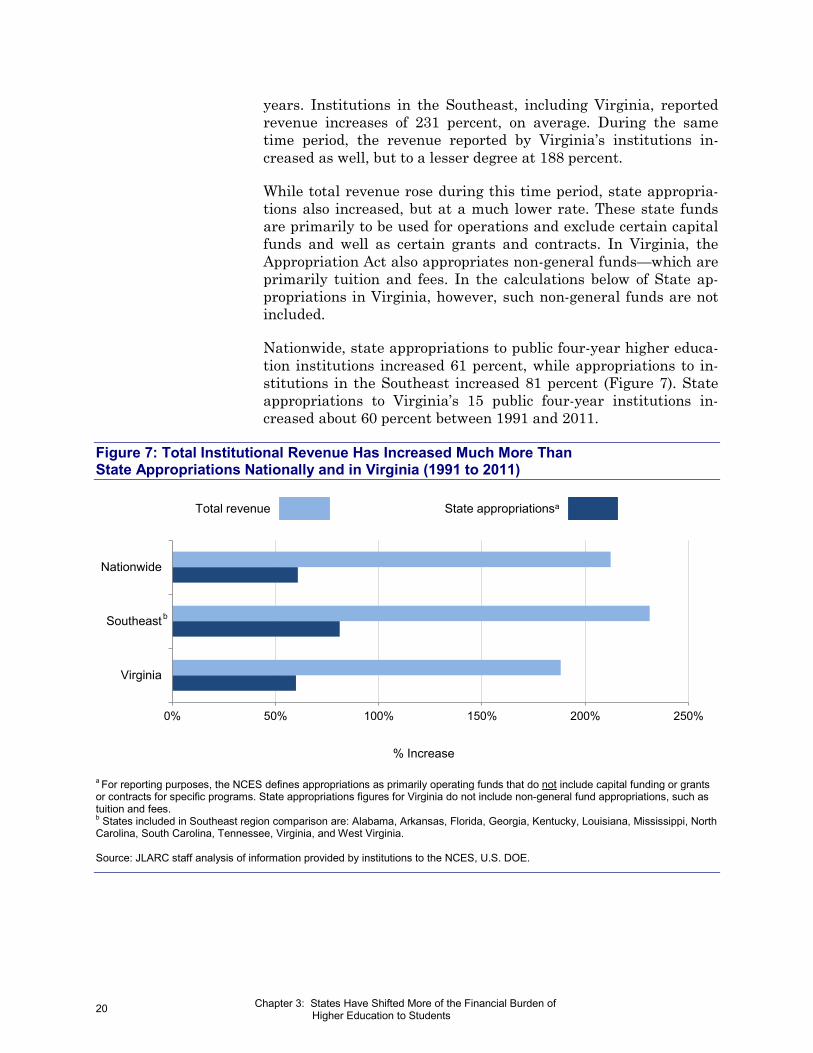
years. Institutions in the Southeast, including Virginia, reported revenue increases of 231 percent, on average. During the same time period, the revenue reported by Virginia’s institutions in-creased as well, but to a lesser degree at 188 percent.
While total revenue rose during this time period, state appropria-tions also increased, but at a much lower rate. These state funds are primarily to be used for operations and exclude certain capital funds and well as certain grants and contracts. In Virginia, the Appropriation Act also appropriates non-general funds—which are primarily tuition and fees. In the calculations below of State ap-propriations in Virginia, however, such non-general funds are not included.
Nationwide, state appropriations to public four-year higher educa-tion institutions increased 61 percent, while appropriations to in-stitutions in the Southeast increased 81 percent (Figure 7). State appropriations to Virginia’s 15 public four-year institutions in-creased about 60 percent between 1991 and 2011.
Figure 7: Total Institutional Revenue Has Increased Much More Than State Appropriations Nationally and in Virginia (1991 to 2011)
a For reporting purposes, the NCES defines appropriations as primarily operating funds that do not include capital funding or grants or contracts for specific programs. State appropriations figures for Virginia do not include non-general fund appropriations, such as tuition and fees. b States included in Southeast region comparison are: Alabama, Arkansas, Florida, Georgia, Kentucky, Louisiana, Mississippi, North Carolina, South Carolina, Tennessee, Virginia, and West Virginia. Source: JLARC staff analysis of information provided by institutions to the NCES, U.S. DOE.
0% 50% 100% 150% 200% 250%
Virginia
Southeast
Nationwide
% Increase
Total revenue State appropriationsa
b

21 Chapter 3: States Have Shifted More of the Financial Burden of Higher Education to Students
Virginia Institutions Collect More Revenue From Students and Less From the State Compared to the National Average
Virginia’s public four-year higher education institutions collect, on average, more total revenue per student than the national average. This was the case in 1991 and was still the case in 2011. In 1991, Virginia’s 15 public four-year higher education institutions collect-ed, on average, $16,229 in revenue per student, which was sub-stantially more than the national average of $10,952. By 2011, to-tal revenue per student had increased in Virginia to more than $35,000, while the national average had risen to about $27,000.
The State’s portion of total revenue, however, has declined during the last two decades and is lower than the average for institutions nationwide and in the Southeast. Virginia’s 15 institutions re-ceived, on average, 15 percent of their total revenue from State ap-propriations in 2011, down from 27 percent in 1991. Nationwide, institutions received 20 percent of their total revenue from state appropriations in 2011, down from 39 percent in 1991 (Figure 8).
Figure 8: Virginia Institutions Derive Less of Their Total Revenue From State Appropriations Than Nationwide and Southeast Institutions (1991 and 2011)
Source: JLARC staff analysis of information reported by institutions to the NCES, U.S. DOE.
When measured on a per-student basis, Virginia provides a sub-stantially smaller portion of total revenue to its public four-year institutions than North Carolina, which, in 2011, provided nearly 40 percent of total revenue for its public four-year institutions.
0
10
20
30
40
50
60
70
80
90
100
1991 2011
Per
cent
of T
otal
Rev
enue
Der
ived
Fro
m
Sta
te A
ppro
pria
tions
Nationwide Southeast Virginia
%

22 Chapter 3: States Have Shifted More of the Financial Burden of Higher Education to Students
Virginia provides slightly less on a percentage basis than Mary-land and West Virginia.
Additionally, nine Virginia institutions received State appropria-tions in 2011 that were a lower percentage of their total revenue than other public institutions in the same Carnegie classification (Table 3). The differences ranged from 15 percentage points lower at VMI to six percentage points higher at ODU. Appendix C in-cludes the major revenue categories and percentages for each Vir-ginia institution by Carnegie classification.
Which revenue sources are used to derive total institutional reve-nue can affect the percentage that each source comprises of the to-tal. For example, removing hospital revenue from UVA’s total rev-enue increases the percentage of total revenue from State appropriations from five to seven percent. More broadly, removing hospital revenue from UVA, and removing auxiliary enterprise revenue from all institutions, further increases the percentage of total revenue from the State. The 15 percent of total revenue de-rived through State appropriations cited above for Virginia’s insti-tutions increases to 21 percent when removing hospital and auxil-iary service revenue.
Table 3: Nine Virginia Institutions Receive a Smaller Portion of Total Revenue from the State Than Other Public Institutions in the Same Carnegie Classification (2011)
State Revenue as Percentage of Total Revenue Difference Virginia
Institution Carnegie Classification
Average VMIf 17% 32% -15% JMUc 18 30 -12 UVAa 7 19 -12 GMUb 14 23 -9 CWMb 14 23 -8 UMWc 24 30 -6 CNUe 24 29 -4 LUd 26 29 -3 UVA-Wisef 31 32 -1 VSUe 30 29 +1 RUc 31 30 +2 VTa 21 19 +2 NSUc 33 30 +3 VCUa 22 19 +3 ODUb 29 23 +6
a Very high research; b High research; c Masters, large; d Masters, medium; e Masters, small; f Baccalaureate, arts and sciences. Hospital revenue at UVA not included. Note: Numbers may not add due to rounding. Source: JLARC staff analysis of information provided by institutions to the NCES, U.S. DOE.
Virginia provides a substantially smaller portion of total revenue to its public four-year institutions than North Carolina.

23 Chapter 3: States Have Shifted More of the Financial Burden of Higher Education to Students
Tuition and Fees Have Increased Substantially More Than General Fund Appropriations
Between 1994 and 2013, general fund and non-general fund ap-propriations (which include tuition and fees paid by students) in-creased by 186 percent from $2.049 billion to $5.86 billion. The general fund appropriations increased by about 71 percent during the same time period, while the non-general fund portion more than tripled. The growth in general funds for higher education since 1994 has been less than half the increase in the consumer price index, which increased 186 percent. The growth in higher education general funds has also increased far less than total gen-eral funds.
This disproportionate growth in non-general funds—primarily tui-tion and fees—has significantly lowered the percentage of total ap-propriations institutions receive in general funds (Figure 9). In 1994, general funds represented about one-third of total appropria-tions to Virginia’s 15 public four-year institutions. By 2013, be-cause this general funding grew less substantially than non-general funds, it represented about 18 percent.
Figure 9: General Funds Now Represent Less Than One-Fifth of Total Appropriations for Virginia’s 15 Public Four-Year Higher Education Institutions (1994 and 2013)
Source: JLARC staff analysis of Appropriation Acts.
General Funds Per Student Have Declined, Especially When Adjusted for Inflation
During the last ten years, general funds per in-state full-time equivalent (FTE) student have fallen slightly from $6,174 in 2003-04 to $6,022 in 2012-13. General funding per in-state FTE student has declined nearly 25 percent from its pre-recession high of $7,932.
$0 $1,000,000,000 $2,000,000,000 $3,000,000,000 $4,000,000,000 $5,000,000,000 $6,000,000,000
1994
2013
31% 69%
18% 82%
General funds Non-general funds

24 Chapter 3: States Have Shifted More of the Financial Burden of Higher Education to Students
During the last two decades, this trend is more pronounced when measured in inflation-adjusted dollars provided per FTE student (both in-state and out-of-state combined). During the 1991-92 aca-demic year, Virginia’s institutions received, on average, $4,332 in State appropriations per FTE student. By the 2011-12 academic year, this amount had dropped 22 percent in inflation-adjusted dollars to $3,382 (Figure 10). In inflation-adjusted dollars, total revenue per FTE student still grew about 40 percent.
Figure 10: State Appropriations to Virginia’s 15 Public Four-Year Institutions Declined by One-Fifth in Inflation-Adjusted, Per FTE Student Dollars (1991 and 2011)
Source: JLARC staff analysis of information reported by institutions to the NCES, U.S. DOE.
STUDENTS AT VIRGINIA INSTITUTIONS PROVIDE A LARGER PERCENTAGE OF REVENUE THROUGH TUITION AND FEES
The reduction in the percentage of total revenue derived from states has coincided with increased reliance on tuition and fees provided by students. Higher education has shifted to become funded increasingly by students through tuition and fees and payments for housing, dining, intercollegiate athletics, and other services funded through auxiliary enterprises.
Other revenue State appropriations
Infla
tion-
adju
sted
, per
full-
time
equi
vale
nt
stud
ent-a
djus
ted,
dol
lars
$
0
5,000
10,000
15,000
20,000
25,000
1991 2011
25 Chapter 3: States Have Shifted More of the Financial Burden of Higher Education to Students
Nationwide and in Virginia, Tuition and Fees Now Comprise a Larger Percentage of Total Revenue
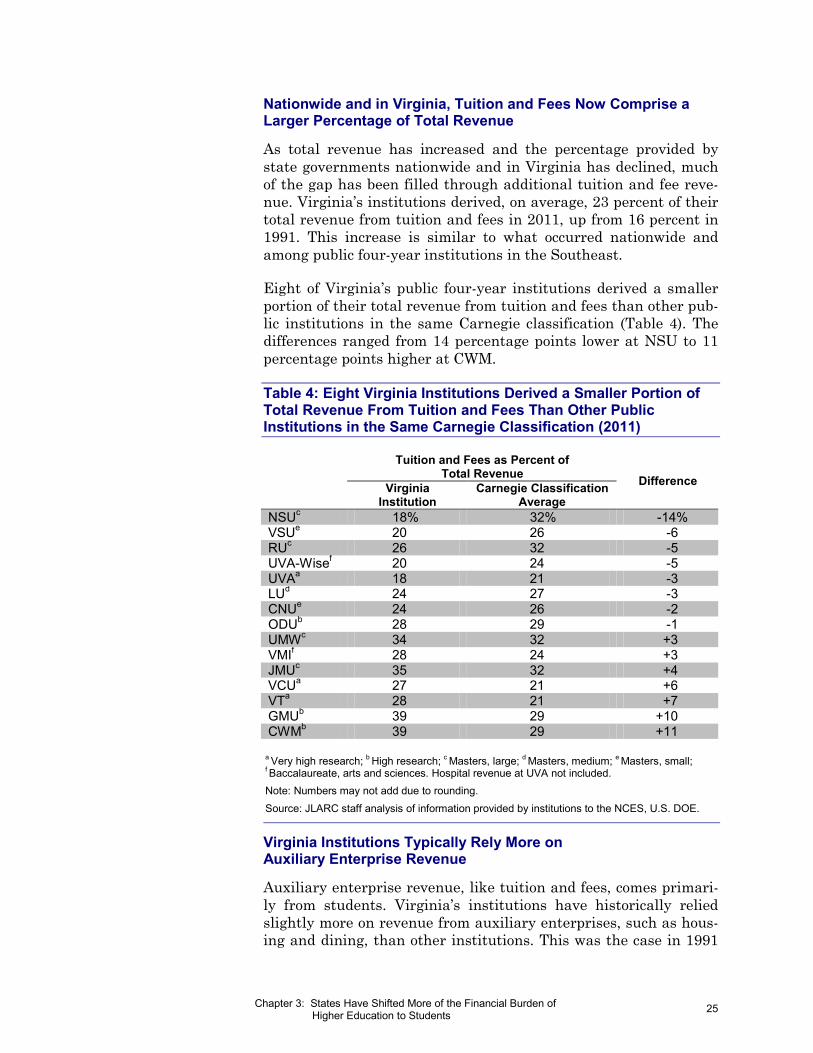
As total revenue has increased and the percentage provided by state governments nationwide and in Virginia has declined, much of the gap has been filled through additional tuition and fee reve-nue. Virginia’s institutions derived, on average, 23 percent of their total revenue from tuition and fees in 2011, up from 16 percent in 1991. This increase is similar to what occurred nationwide and among public four-year institutions in the Southeast.
Eight of Virginia’s public four-year institutions derived a smaller portion of their total revenue from tuition and fees than other pub-lic institutions in the same Carnegie classification (Table 4). The differences ranged from 14 percentage points lower at NSU to 11 percentage points higher at CWM.
Table 4: Eight Virginia Institutions Derived a Smaller Portion of Total Revenue From Tuition and Fees Than Other Public Institutions in the Same Carnegie Classification (2011)
Tuition and Fees as Percent of Total Revenue Difference Virginia
Institution Carnegie Classification
Average NSUc 18% 32% -14% VSUe 20 26 -6 RUc 26 32 -5 UVA-Wisef 20 24 -5 UVAa 18 21 -3 LUd 24 27 -3 CNUe 24 26 -2 ODUb 28 29 -1 UMWc 34 32 +3 VMIf 28 24 +3 JMUc 35 32 +4 VCUa 27 21 +6 VTa 28 21 +7 GMUb 39 29 +10 CWMb 39 29 +11
a Very high research; b High research; c Masters, large; d Masters, medium; e Masters, small; f Baccalaureate, arts and sciences. Hospital revenue at UVA not included. Note: Numbers may not add due to rounding. Source: JLARC staff analysis of information provided by institutions to the NCES, U.S. DOE.
Virginia Institutions Typically Rely More on Auxiliary Enterprise Revenue
Auxiliary enterprise revenue, like tuition and fees, comes primari-ly from students. Virginia’s institutions have historically relied slightly more on revenue from auxiliary enterprises, such as hous-ing and dining, than other institutions. This was the case in 1991

26 Chapter 3: States Have Shifted More of the Financial Burden of Higher Education to Students
and was still the case in 2011. Virginia’s institutions derived, on average, 14 percent of their total revenue from auxiliary enterpris-es in 2011, the same proportion as in 1991. During this time peri-od, revenue from auxiliary enterprises at public four-year institu-tions in the Southeast and nationally has fluctuated between 10 and 12 percent of total revenue.
This slightly higher reliance on auxiliary enterprise revenue is more prevalent when comparing Virginia public four-year institu-tions to other public institutions in the same Carnegie classifica-tion. Of the 15 Virginia public four-year institutions, 14 derived a larger portion of their total revenue from auxiliary enterprises than others in the same Carnegie classification (Table 5). The only exception was the University of Virginia.
Table 5: Fourteen Virginia Institutions Derived a Larger Portion of Revenue from Auxiliary Enterprises Than Other Public Institutions in the Same Carnegie Classification (2011)
Auxiliary Enterprises as Percent of Total Revenue Difference Virginia
Institution Carnegie Classification
Average UVAa 5% 10% -5% UVA-Wisef 16 15 +1 VCUa 11 10 +1 VSUe 19 14 +5 VMIf 22 15 +7 VTa 17 10 +7 NSUc 19 12 +8 GMUb 20 11 +9 CWMb 24 11 +13 ODUb 24 11 +13 RUc 29 12 +17 UMWc 32 12 +21 JMUc 34 12 +23 LUd 39 12 +26 CNUe 42 14 +29
a Very high research; b High research; c Masters, large; d Masters, medium; e Masters, small; f Baccalaureate, arts and sciences. Hospital revenue at UVA not included. Note: Numbers may not add due to rounding. Source: JLARC staff analysis of information provided by institutions to the NCES, U.S. DOE.

27 Chapter 4: Virginia Has Increased Enrollment More and Graduated Students Faster than Nationwide
As noted in Chapter 1, the State has a variety of initiatives ad-dressing the ability of students to enroll in and graduate from a higher education institution. This is at least partly because of the importance of higher education for State economic development and how much more income those with higher education make during their careers. For example, according to the U.S. Bureau of Labor Statistics, a worker with a high school diploma made about $32,600 in 2012. A worker with some college credit or an associ-ate’s degree made about 15 percent more. A worker with a bache-lor’s degree made 63 percent more, which equates to more than $53,000 annually. A worker with an advanced degree made, on av-erage, twice as much per week than a worker with a high school diploma.
ENROLLMENT IN HIGHER EDUCATION INSTITUTIONS HAS INCREASED NATIONWIDE AND IN VIRGINIA
The potential for higher income and increased employment options is why the number of people with access to some form of higher education is a key social and economic policy issue. This higher education may be in the form of an associate’s degree from a public two-year institution or taking courses at a public or private four-
Cha
pter
4
Virginia Has Increased Enrollment More and Graduated Students Faster than Nationwide
Between 1991 and 2011, full-time undergraduate enrollment at Virginia’s 15 pub-lic higher education institutions increased about 40 percent. Much of this growth was concentrated at several institutions. More broadly, the number of students enrolled at higher education institutions has increased nationally, and to an even greater extent in Virginia, during the last 20 years. However, largely because of the faster growth in private four-year and public two-year enrollment, public four-year institutions now educate a slightly smaller percentage of all higher education students. In Virginia, private institution enrollment has grown substantially since 1991, and by 2011 more than one-fifth of all higher education students in Virginia attended a private four-year institution. Virginia’s 15 public four-year institutions graduated, on average, 46 percent of their students in four years and 63 percent in six years during the 2011-12 academic year. These graduation rates were consid-erably better than the rate nationwide and among public four-year institutions in the Southeast. Virginia institutions also graduated a higher percentage than a sta-tistical model would predict based on certain student and school characteristics.
In S
umm
ary

28 Chapter 4: Virginia Has Increased Enrollment More and Graduated Students Faster than Nationwide
year institution. It may also be earning a bachelor’s, master’s, or professional degree (such as a juris doctor or medical doctorate), or a doctorate.
Enrollment Has Grown at Virginia’s Public Institutions, Concentrated Among a Few Schools
Since 1991, the number of full-time undergraduate students en-rolled at Virginia’s 15 public four-year institutions has increased from nearly 104,000 to about 145,000. This 40 percent increase represents a general trend of increasing enrollment at nearly all schools. Enrollment at VCU, JMU, and GMU increased the most at 84, 78, and 68 percent, respectively. In contrast, enrollment at NSU declined by one-fifth and RU’s enrollment was about the same as it was in 1991 (Figure 11).
This growth was primarily concentrated at four schools. More than one-fifth of the total growth in undergraduate, full-time enrollment across Virginia’s 15 institutions was at VCU. JMU accounted for 18 percent, GMU accounted for 16 percent, and ODU accounted for 12 percent. The other 11 institutions combined for the remaining minority of the growth in enrollment.
Figure 11: Most Virginia Public Four-Year Institutions Increased Undergraduate and Graduate Enrollment (1991-92 to 2011-12)
Note: UVA-Wise and VMI did not report any full-time graduate or professional students. Source: JLARC staff analysis of data reported by institutions to the NCES, U.S. DOE.
Graduate and first professional degree enrollment at Virginia’s in-stitutions increased by nearly 50 percent during the same time pe-
# of
full-
time
stud
ents
1991-92
Undergraduate Graduate
2011-12
Undergraduate Graduate
0
5,000
10,000
15,000
20,000
25,000
30,000
29 Chapter 4: Virginia Has Increased Enrollment More and Graduated Students Faster than Nationwide
riod. Several schools with relatively few such students in 1991 saw substantial percentage increases by 2011, including UMW, CNU, and LU. UVA reported the most graduate or first professional stu-dents at more than 6,000 for the 2011-12 academic year.
Appendix D includes more detail on changes in undergraduate and graduate enrollment for both full-time and part-time students.
Virginia’s Higher Education Enrollment Has Grown More Than Enrollment Nationwide
Enrollment in higher education institutions has increased during the last 20 years. Nationwide in 1991, there were nearly 13.7 mil-lion students enrolled at either public or private four-year institu-tions, or public two-year institutions of higher education. By 2011, this had increased by 36 percent to more than 18.6 million stu-dents. This number of students enrolled increased about twice as fast as the national population of 18 to 24-year-olds. This suggests that a higher percentage of young adults are enrolled in higher ed-ucation than two decades ago.
Enrollment at Virginia institutions has increased as well, and to an even greater extent than nationwide. In Virginia, there were about 350,000 students enrolled at either public or private four-year institutions or public two-year institutions of higher educa-tion in 1991. By 2011, this had increased by more than 50 percent to just under 530,000. This percentage increase was about two-thirds more than the increase in Virginia’s population during the same time period.
Virginia’s Public Four-Year Institutions Now Educate a Smaller Share of Total Higher Education Students
Within the increase in total higher education enrollment, the pro-portion of students being educated at public four-year institutions has actually declined. Nationwide, public four-year institutions educated about 45 percent of all students at either a four-year pub-lic or private or two-year public institution in 1991. By 2011, the public four-year institutions’ share had dropped to about 42 per-cent. This slight reduction is due to larger enrollment growth at private four-year and public two-year institutions (Figure 12).
A similar and more pronounced shift also occurred in Virginia. In 1991, Virginia’s public four-year institutions educated 47 percent of all students at either a four-year public or private or two-year public institution. By 2011, this had dropped to 40 percent, largely because of the substantial increase in enrollment at private four-year institutions (Figure 12). Much of this shift can be explained by the growth of private institutions, in particular Liberty Univer-sity and Regent University.
Higher Education Enrollment
JLARC staff compiled enrollment data on public four-year institutions, private four-year institutions, and public two-year institutions.
Enrollment data was not compiled for private two-year institutions, and other types of institutions that provide certifications but not four-year undergraduate degrees.
Much of the shift can be explained by the growth of private institutions, in particular Liberty University and Regent University.

30 Chapter 4: Virginia Has Increased Enrollment More and Graduated Students Faster than Nationwide
Figure 12: Public Four-Year Institutions Educate a Smaller Share of Students (1991 and 2011)
Source: JLARC staff analysis of data reported by institutions to the NCES, U.S. DOE.
A HIGHER PROPORTION OF STUDENTS IN VIRGINIA GRADUATE FASTER THAN AT INSTITUTIONS NATIONWIDE
Though workers with some higher education typically earn more than those without, those who graduate with a four-year degree earn more than those with only some college credit. In addition, many employers require a four-year degree in one’s chosen disci-pline to obtain employment. While enrollment in an institution of higher education is a start, the objective is to fulfill the require-ments and obtain a degree. Moreover, the fewer semesters re-quired to obtain the degree, the less it will cost and the sooner an individual can transition from a student paying or borrowing mon-ey, to an employee earning money.
A Substantially Higher Percentage of Students at Virginia’s Public Four-Year Institutions Graduate—and Graduate More Quickly—Than Nationwide
A common measure of graduation rates is the percentage of stu-dents who graduated in either four, five, or six years from the se-
47%
14%
39% 40%
22%
38%
45%
19%
36%42%
20%
38%
1991 2011
Nationwide
Virginia
Public 4-year Private 4-year Public 2-year
The fewer semesters required to obtain the degree, the less it will cost.

31 Chapter 4: Virginia Has Increased Enrollment More and Graduated Students Faster than Nationwide
mester they first enrolled at an institution. In terms of graduating within four years, about one-quarter of undergraduate students who enrolled at higher education institutions nationwide graduat-ed four years later in 2011. This represents a 16 percent increase since this data was first reported nationally in 2004. About 41 per-cent graduated in five years (enrolled in 2006), while 46 percent graduated in six years (enrolled in 2005). Of the students nation-wide in 2010-11 who had not completed degrees and graduated, 73 percent returned for the 2011-12 academic year.
A higher percentage of students at Virginia’s public four-year higher education institutions graduated compared to the national average. Furthermore, a higher percentage of students graduated in fewer years (Figure 13). In 2011, about 46 percent of students, on average, at Virginia’s public four-year institutions graduated in four years, up from less than 40 percent in 2004. Nearly 60 percent of students graduated in five years, and 63 percent graduated in six years. Nearly 83 percent of Virginia students in 2010-11 re-turned for the 2011-12 academic year.
Figure 13: Virginia Public Four-Year Institutions Have a Higher Graduation Rate Than Institutions in the Southeast and Nationwide (2011-12)
Note: Undergraduate students only. Source: JLARC staff analysis of data reported by institutions to the NCES, U.S. DOE.
Several Virginia Public Four-Year Institutions Do Better Than Predicted When Considering Student and Institutional Factors
A number of factors are associated nationally with whether a stu-dent who enrolls actually obtains a degree. Chief among these are two measures related to the students an institution admits (stu-dent financial status and SAT score), and two measures related to
% of students that graduate
%
Four years Five years Six years
0 10 20 30 40 50 60 70 80 90 100
Nationwide
Southeast
Virginia
Higher Education Opportunity Act of 2011
This act includes as its purpose to increase the percentage of students who enroll at a Virginia institution and obtain a degree. The act sets a goal of an additional 100,000 graduates by 2025.

32 Chapter 4: Virginia Has Increased Enrollment More and Graduated Students Faster than Nationwide
the institution itself (instructional spending per student and the percentage of students who are full-time). Nationally over the last few years, these four characteristics could be used to predict with high statistical certainty the percentage of students who would graduate from an institution.
Six of Virginia’s public four-year institutions had graduation rates that were substantially higher than what would be expected using the national model (Figure 14). JMU, in particular, was predicted to graduate about 70 percent of its students in six years, yet in ac-tuality it graduated 81 percent—11 percentage points higher. Sim-ilarly, UVA and GMU had graduation rates that were 10 and 9 percentage points, respectively, higher than what the JLARC mod-el predicted. Eight of the 15 had graduation rates that were about what would be expected, while only one had graduation rates that were lower than would be expected.
Figure 14: Six Virginia Institutions Had Graduation Rates Substantially Higher Than Predicted When Considering Key Student and Institutional Characteristics
Note: Six year graduation rates of undergraduate students only. Source: JLARC staff analysis of data reported by institutions to the NCES, U.S. DOE.
Certain schools may have seemingly low graduation rates, but giv-en the characteristics of their student body and institution, gradu-ate more students than the national model predicts. VSU is the best example of this among Virginia schools. The JLARC model
11
10
9
9
6
6
0
10
20
30
40
50
60
70
80
90
100
JMU UVA GMU VT VSU CWM
Per
cent
age
of s
tude
nts
grad
uatin
g w
ithin
6ye
ars
Expected (based on statistical model) Above expected
%
%
Statistical Model of Expected Graduation Rates
JLARC staff developed a highly predictive model (r2 = 0.78) of graduation rates nationwide. The model was then run for Virginia’s 15 public schools, which allowed for comparison between the predicted and actual graduation rates in Virginia. Appendix B provides more detail on this model.

33 Chapter 4: Virginia Has Increased Enrollment More and Graduated Students Faster than Nationwide
predicts that VSU would graduate 34 percent of its students in six years, yet in actuality 40 percent of VSU students graduated with-in this time frame. This represents six percentage points above what would be predicted—which is equivalent to 18 percent better.
Graduating in Fewer Years Can Reduce the Total Cost of Obtaining a Degree
Faster graduation time reduces the cost of higher education. The fewer semesters a student takes to graduate, the lower the total cost of their higher education. This can be illustrated using the av-erage tuition and fees and graduation rates nationwide and in Vir-ginia. Virginia’s 15 public four-year institutions have higher average tuition and fees than the national average (discussed in more detail in Chapter 5). In contrast, the majority of students graduate by their fifth year in Virginia, but not until their seventh year na-tionally. A student in Virginia paying higher than average tuition and fees each year, but only for five years, will actually pay about $3,500 less to obtain his or her degree than another student paying the lower national average tuition for seven years (Figure 15).
Figure 15: The Average Student in Virginia Pays More Each Year, But Graduates in Fewer Years—Which Can Result in a Lower Total Cost to Obtain a Degree
Note: Assumes tuition and fees remain constant each year. Source: JLARC staff analysis of data reported by institutions to the NCES, U.S. DOE.
Though many factors affect the ability of a student to graduate, students are graduating more quickly, on average, as costs have continued to rise. This suggests that students may be trying to
0
10,000
20,000
30,000
40,000
50,000
60,000
Virginia National
$50,939
Cum
ulat
ive
Cos
t of A
nnua
l Tu
ition
and
Fee
s
$47,260
$
Year 1 Year 1
Year 2Year 2
Year 3
Year 3
Year 4
Year 4
Year 5
Year 5
Year 6
Year 7

34 Chapter 4: Virginia Has Increased Enrollment More and Graduated Students Faster than Nationwide
complete their degrees more quickly as a way to control costs. In recent years, graduation rates within both four and six years steadily increased as the economic recession took hold. In fact, the percentage of full-time students graduating within four and six years has increased at 11 of Virginia’s 15 public four-year institu-tions since 2008.

35 Chapter 5: Cost of Higher Education Has Substantially Increased Nationwide and in Virginia
Tuition and fees are a major source of revenue for higher education institutions. In addition to paying tuition and fees, many students also pay to occupy student housing and purchase dining plans. The growth in these charges to students is one of the primary concerns cited in HJR 108’s direction to assess the cost-efficiency of Virgin-ia’s 15 public four-year higher education institutions.
The price of higher education is comprised of several major compo-nents. Students pay tuition and fees to attend. Certain fees are categorized as educational and general (E&G) and often included with tuition, while other fees are categorized as non-E&G. These non-E&G fees are also mandatory and typically pay for functions such as intercollegiate athletics, student recreation, and institu-tional debt-service repayments. Many students also rent housing through the school they attend, as well as purchase dining plans. The charges for student housing and dining are not included in tu-ition and fees.
RECENT STATE POLICY HAS AFFORDED INSTITUTIONS MORE AUTONOMY TO INCREASE TUITION AND FEES
The authority to set tuition and fees—both E&G and non-E&G—rests with the board of visitors at each Virginia institution. Over the years, the General Assembly and Governor have each attempt-ed to influence the tuition and fee setting process. For example,
Cha
pter
5
Price of Higher Education Has Increased Substantially in Virginia and Nationwide
Amid substantial increases in tuition and fees nationally and in Virginia, the boards of visitors at Virginia’s institutions have gained greater autonomy. Between the 1991-92 and the 2011-12 academic years, tuition and fees nationwide at public four-year institutions increased 256 percent—even more than the cost of hospital ser-vices. Tuition and fees at Virginia’s institutions increased slightly less, 217 percent, during this time period and averaged $9,452 for the 2011-12 academic year. Virgin-ia’s 15 institutions, on average, increased their tuition and fees more on a percent-age basis than other institutions in the same Carnegie classification. Virginia’s in-stitutions also charge more in tuition and fees, on average, than other public institutions in the same Carnegie classification. Other student charges, in particular housing and dining, have also increased nationally and in Virginia, but less than tuition and fees. However, average fees for these services have risen far more than average rent and meal costs during the last two decades. The total price of tuition and fees, housing, and dining is higher in Virginia than the national average, aver-aging nearly $18,000 in 2011-12.
In S
umm
ary
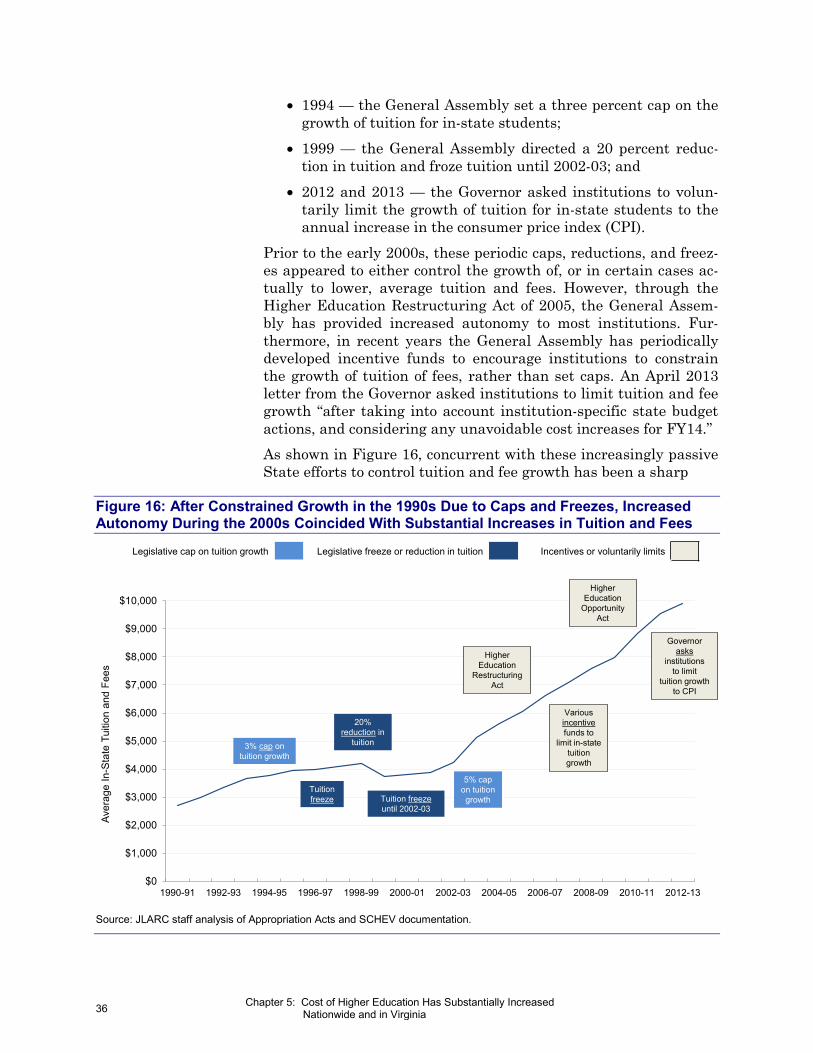
36 Chapter 5: Cost of Higher Education Has Substantially Increased Nationwide and in Virginia
• 1994 — the General Assembly set a three percent cap on the growth of tuition for in-state students;
• 1999 — the General Assembly directed a 20 percent reduc-tion in tuition and froze tuition until 2002-03; and
• 2012 and 2013 — the Governor asked institutions to volun-tarily limit the growth of tuition for in-state students to the annual increase in the consumer price index (CPI).
Prior to the early 2000s, these periodic caps, reductions, and freez-es appeared to either control the growth of, or in certain cases ac-tually to lower, average tuition and fees. However, through the Higher Education Restructuring Act of 2005, the General Assem-bly has provided increased autonomy to most institutions. Fur-thermore, in recent years the General Assembly has periodically developed incentive funds to encourage institutions to constrain the growth of tuition of fees, rather than set caps. An April 2013 letter from the Governor asked institutions to limit tuition and fee growth “after taking into account institution-specific state budget actions, and considering any unavoidable cost increases for FY14.” As shown in Figure 16, concurrent with these increasingly passive State efforts to control tuition and fee growth has been a sharp
Figure 16: After Constrained Growth in the 1990s Due to Caps and Freezes, Increased Autonomy During the 2000s Coincided With Substantial Increases in Tuition and Fees
Source: JLARC staff analysis of Appropriation Acts and SCHEV documentation.
$0
$1,000
$2,000
$3,000
$4,000
$5,000
$6,000
$7,000
$8,000
$9,000
$10,000
1990-91 1992-93 1994-95 1996-97 1998-99 2000-01 2002-03 2004-05 2006-07 2008-09 2010-11 2012-13
3% cap on tuition growth
Tuition freeze
20% reduction in
tuition
5% cap on tuition growth
Various incentivefunds to
limit in-state tuition growth
Governorasks
institutionsto limit
tuition growth to CPI
Higher Education
Restructuring Act
Aver
age
In-S
tate
Tui
tion
and
Fees
Higher Education
Opportunity Act
Tuition freezeuntil 2002-03
Legislative cap on tuition growth Legislative freeze or reduction in tuition Incentives or voluntarily limits

37 Chapter 5: Cost of Higher Education Has Substantially Increased Nationwide and in Virginia
increase in average tuition and fees at Virginia’s institutions. Be-tween 1991 and 2001, average tuition and fees increased about 40 percent amid several tuition caps, freezes, and reductions mandat-ed by the General Assembly. In contrast, tuition and fees increased more than 150 percent between 2002 and 2012, an era character-ized largely by the increasing autonomy of many higher education institutions.
TUITION AND FEES HAVE INCREASED SUBSTANTIALLY, THOUGH SLIGHTLY LESS IN VIRGINIA THAN NATIONWIDE
Comparing the increase in tuition and fees over time between public and private institutions, and among those in Virginia, the Southeast, and nationwide, provides a useful benchmark for comparison. The increase in tuition and fees can also be compared to other goods and services during the same time period. Compar-ing tuition and fees at Virginia’s schools to other institutions in the same Carnegie classification is also instructive.
Tuition and Fees Nationwide at Public Institutions Increased More Than at Private Schools and More Than Most Other Goods and Services
Tuition and fees nationwide at public four-year institutions have increased substantially over the last 20 years. In 1991, the average public four-year institution charged in-state students $2,029 per year. By 2011, average tuition and fees nationally was $7,227—an increase of 256 percent.
This increase in tuition and fees at public four-year institutions was more than their counterpart schools. For example, private four-year institutions increased their tuition and fees, on average, by 203 percent between 1991 and 2011. This increase at private four-year institutions was about 20 percent less than the increase at public four-year schools (though private institutions generally charge higher tuition and fees). Public four-year institutions also increased their tuition and fees more than public two-year institu-tions, which raised their tuition by 191 percent during the same time period.
The increase in tuition and fees at public four-year higher educa-tion institutions between 1991 and 2011 was also greater than the increase in many other goods and services. For example, the aver-age price of a new car increased just 12 percent during the same time period. The basket of goods and services used to measure the CPI increased 64 percent between 1991 and 2011. Even though hospital services increased at a substantial rate—222 percent—the increase in the cost of these services was still less than for tuition and fees at public four-year schools (Figure 17).

38 Chapter 5: Cost of Higher Education Has Substantially Increased Nationwide and in Virginia
Figure 17: Nationwide, Public Four-Year Tuition and Fees Increased More Than Private Four-Year and Public Two-Year Tuition and Fees, and More Than Many Goods and Services (1991 to 2011)
Source: JLARC staff analysis of information provided by institutions to the NCES, U.S. DOE.
Tuition and Fees at Virginia Institutions Have Also Increased, But Less Than in the Southeast and Nationwide
Tuition and mandatory fees at Virginia’s public four-year higher education institutions have also increased substantially over the last 20 years. In 1991, Virginia institutions charged in-state stu-dents an average of $2,982 per year. By 2011, Virginia institutions charged an average of $9,452—an increase of 217 percent. While these dollar amounts are greater than average tuition and fees na-tionally and among institutions in the Southeast, tuition and fees at Virginia’s public institutions has increased about 15 percent less than the national average (Figure 18).
This 217 percent increase in tuition and fees at Virginia’s public four-year higher education institutions was also slightly higher than the 211 percent increase at private four-year institutions in Virginia. The increase, in contrast, was less than the 256 percent increase in tuition and fees across Virginia’s public two-year insti-tutions.
% Increase
0% 50% 100% 150% 200% 250% 300%
Hospital services
Gasoline
Consumer price index
New vehicles
Public 4-year tuition & fees
Private 4-year tuition & fees
Public 2-year tuition & fees

39 Chapter 5: Cost of Higher Education Has Substantially Increased Nationwide and in Virginia
Figure 18: Tuition and Fees at Virginia Public Four-Year Institutions Increased Less Than at Public Four-Year Institutions in the Southeast and Nationwide (1991 to 2011)
Source: JLARC staff analysis of information provided by institutions to the NCES, U.S. DOE.
Most Virginia Schools Increased Tuition and Fees More Than Others in Same Carnegie Classification, and Majority Now Charge More Than Other Public Institutions
Perhaps a more relevant comparison is how Virginia’s 15 public institutions have increased their tuition and fees relative to other institutions in the same Carnegie classification. All but two of Vir-ginia’s 15 institutions increased their tuition more on a percentage basis than the others in the same Carnegie classification between 2001-02 and 2011-12. Only ODU and JMU increased their tuition at a lower rate than the average of other institutions in their Car-negie classification.
Eleven of Virginia’s institutions now charge more in tuition than the average of other public institutions in the same Carnegie clas-sification. The remaining four charge less, most notably ODU, which charges $1,849 less in tuition and fees than the average. All 15 of Virginia’s public four-year schools charge substantially less—and in almost all cases the difference is at least $10,000—in tui-tion and fees than the average of private institutions in the same Carnegie classification (Table 7).
Appendix C includes the tuition and fee dollar amounts and in-creases for each of Virginia’s 15 public four-year higher education institutions and the public and private institutions in the same Carnegie classifications.
0% 50% 100% 150% 200% 250% 300%
Public 4-year
Private 4-year
Public 2-year
Public 4-year
Private 4-year
Public 2-year
Public 4-year
Private 4-year
Public 2-year
% Increase in Tuition and Fees
Nationwide
Southeast
Virginia

40 Chapter 5: Cost of Higher Education Has Substantially Increased Nationwide and in Virginia
Table 7: Only Four of Virginia’s Public Four-Year Schools Charge Lower Tuition and Fees Than Other Public Institutions in the Same Carnegie Classification (2011-12)
Difference Between Published
In-State Tuition and Fees and … Public Carnegie
Classification Average Private Carnegie
Classification Average ODUb +$1,849 +$27,534 UVA-Wisef +681 +23,215 NSUc +356 +17,394 VCUa +13 +31,835 VSUe -194 +12,349 GMUb -851 +24,834 VTa -979 +30,843 RUc -1,264 +15,774 JMUc -1,392 +15,646 UMWc -1,870 +15,168 UVAa -2,256 +29,566 CNUe -3,188 +9,355 LUd -3,712 +11,671 CWMb -4,717 +20,968 VMIf -4,782 +17,752
a Very high research; b High research; c Masters, large; d Masters, medium; e Masters, small; f Baccalaureate, arts and sciences. Source: JLARC staff analysis of information provided by institutions to the NCES, U.S. DOE.
CHARGES FOR STUDENT HOUSING AND MEAL PLANS HAVE ALSO INCREASED
In addition to tuition and fees, charges for room (or on-campus housing) and board (or on-campus meal plans) are two other major costs of attending college for many students. Many institutions al-low part-time students or upperclassmen to choose their own off-campus housing or dining. However, most public four-year institu-tions require at least full-time freshmen to live on campus and purchase an on-campus meal plan.
Charges for Housing and Meal Plans Nationwide Have Increased More Than Rent and Meals Out, But Less Than Tuition and Fees
Full-time freshmen at many of the nation’s higher education insti-tutions pay not only tuition and mandatory fees, but also pay to live in on-campus housing and eat at on-campus dining facilities. Consequently, for many students, charges for housing and dining are a de-facto required expenditure just like tuition and fees. The required nature of these costs for at least some students makes it important to understand how they have changed over time along with tuition and fees.
Nationwide, the combined price for tuition and fees, room, and board rose substantially between 1992 and 2011. In 1992, these
Including Housing and Dining in Price of Higher Education
This chapter addresses three major components of the price of higher education. The first component, tuition and fees, is charged to all students (absent grants or scholarships). The second and third components, housing and dining, are optional for the majority of students at most schools.
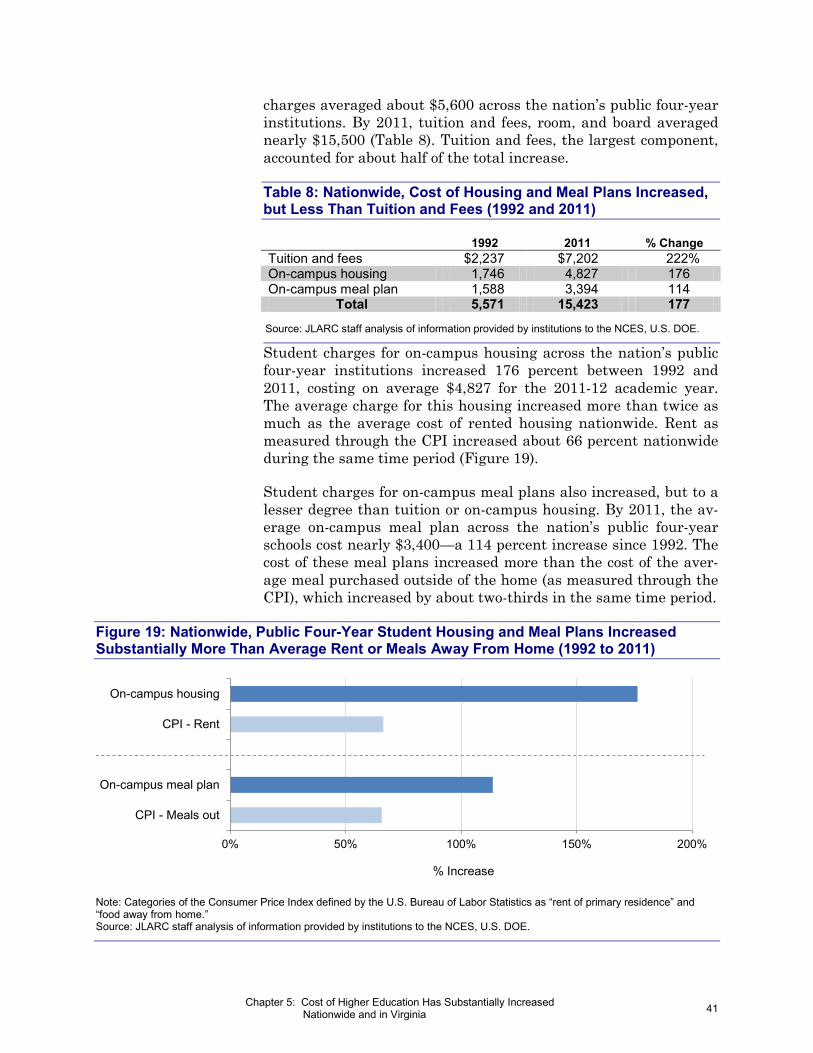
41 Chapter 5: Cost of Higher Education Has Substantially Increased Nationwide and in Virginia
charges averaged about $5,600 across the nation’s public four-year institutions. By 2011, tuition and fees, room, and board averaged nearly $15,500 (Table 8). Tuition and fees, the largest component, accounted for about half of the total increase.
Table 8: Nationwide, Cost of Housing and Meal Plans Increased, but Less Than Tuition and Fees (1992 and 2011) 1992 2011 % Change Tuition and fees $2,237 $7,202 222% On-campus housing 1,746 4,827 176 On-campus meal plan 1,588 3,394 114
Total 5,571 15,423 177
Source: JLARC staff analysis of information provided by institutions to the NCES, U.S. DOE.
Student charges for on-campus housing across the nation’s public four-year institutions increased 176 percent between 1992 and 2011, costing on average $4,827 for the 2011-12 academic year. The average charge for this housing increased more than twice as much as the average cost of rented housing nationwide. Rent as measured through the CPI increased about 66 percent nationwide during the same time period (Figure 19).
Student charges for on-campus meal plans also increased, but to a lesser degree than tuition or on-campus housing. By 2011, the av-erage on-campus meal plan across the nation’s public four-year schools cost nearly $3,400—a 114 percent increase since 1992. The cost of these meal plans increased more than the cost of the aver-age meal purchased outside of the home (as measured through the CPI), which increased by about two-thirds in the same time period.
Figure 19: Nationwide, Public Four-Year Student Housing and Meal Plans Increased Substantially More Than Average Rent or Meals Away From Home (1992 to 2011)
Note: Categories of the Consumer Price Index defined by the U.S. Bureau of Labor Statistics as “rent of primary residence” and “food away from home.” Source: JLARC staff analysis of information provided by institutions to the NCES, U.S. DOE.
% Increase
0% 50% 100% 150% 200%
CPI - Meals out
On-campus meal plan
CPI - Rent
On-campus housing

42 Chapter 5: Cost of Higher Education Has Substantially Increased Nationwide and in Virginia
This increase in the price of the average meal plan has coincided, however, with a slight increase in the average number of meals provided through the typical meal plan. In 1992, the average meal plan across the nation’s public four-year institutions allowed stu-dents about 18 meals per week. In 2011, the average meal plan of-fered 19 meals per week, or one more meal per week than in 1992.
Charges for Housing and Meal Plans at Virginia Institutions Increased Less Than Nationally, but Total Price in Virginia Is Still Higher
The total price of tuition and fees, room, and board in Virginia also rose substantially between 1992 and 2011. In 1992, Virginia’s pub-lic four-year higher education institutions charged, on average $7,165 for these major components of higher education. By 2011, tuition and fees, room, and board averaged nearly $18,000. How-ever, these charges increased less on a percentage basis than across public four-year institutions in the Southeast and nation-wide. Despite this smaller percentage increase, these combined charges at Virginia’s 15 public institutions increased more in nom-inal dollars than at schools in the Southeast and nationwide.
Student charges for on-campus housing across Virginia’s institu-tions increased 134 percent between 1992 and 2011, averaging about $4,800 for the 2011-12 academic year. This increase was less on a percentage basis and in nominal dollars than at institutions in the Southeast and nationwide. Charges for on-campus meal plans increased by 107 percent in Virginia during the same time period, averaging about $3,700 for the 2011-12 academic year. This increase was about the same on a percentage basis, and slightly higher in nominal dollars, than in the Southeast and nationwide. The average meal plan across Virginia’s 15 public four-year insti-tutions allowed students about 19 meals per week, which was about the same as it was in 1992-93 and now comparable to what is provided by other schools in the Southeast and nationwide.
Despite these smaller percentage increases in housing and dining charges in Virginia when compared to institutions in the South-east and nationwide, Virginia’s 15 institutions still charge a higher total price to students (Figure 20). This is primarily due to two fac-tors:
• Virginia’s 15 public four-year institutions charged more in to-tal than the national average in 1992-93; and
• Tuition and fees in Virginia increased more than $6,000 be-tween 1992-93 and 2011-12 and represented 53 percent of the total cost of higher education in 2011-12.

43 Chapter 5: Cost of Higher Education Has Substantially Increased Nationwide and in Virginia
More detailed information and analysis of housing and dining at Virginia’s 15 colleges and universities will be included in the sec-ond JLARC report in this series on higher education to be released in September 2013.
Figure 20: Virginia’s Public Institutions Still Charge a Higher Price, on Average, Than Institutions in the Southeast and Nationwide (1992-93 and 2011-12)
Source: JLARC staff analysis of information provided by institutions to the NCES, U.S. DOE.
Tuition & fees On-campus housing On-campus meal plan
1992-93 2011-12
0
4,000
8,000
12,000
16,000
20,000
Virginia Southeast Nationwide Virginia Southeast Nationwide
$

44

45 Chapter 6: Higher Education Now Consumes More Income, Necessitating Increased Borrowing and Other Aid
The increase in tuition and fees, housing, and dining cited in Chapter 5 has had a variety of impacts. As these charges have ris-en, students and those who contribute toward paying for their edu-cation have expressed a variety of concerns. Chief among these concerns are whether (1) there is sufficient income to pay for high-er education, (2) the price inhibits enrollment and access, and (3) there have been increases in student use of borrowing and availa-bility of grants, scholarships, and other forms of financial aid. These effects of the increase in cost to students are a primary con-cern cited in HJR 108’s direction to assess the cost-efficiency of Virginia’s 15 public four-year higher education institutions.
TUITION AND FEES HAVE SUBSTANTIALLY OUTPACED AVERAGE INCOME
Section 23-38.88B of the Code of Virginia stipulates that “each such institution shall commit to the Governor and the General As-sembly to ensure that higher education remains affordable.” There are many indicators of the affordability of attending an institution of higher education. Some of these measure the net cost of higher education by family income, while others uses various indices to track affordability over time. Affordability can also be measured by comparing average annual income to the annual cost of higher ed-ucation. This has the effect of “assuming away” the role of student borrowing, non-loan aid, and other subsidies. Though perhaps
Cha
pter
6
Higher Education Now Consumes More Income, Necessitating Increased Borrowing and Other Aid
Average annual income nationwide increased 86 percent between 1991 and 2011 to about $54,000. However, because tuition and fees increased three times as much during the same time period, tuition and fees now consume a higher portion of this average annual income. Average tuition and fees in Virginia consumed ten percent of average annual income in 1991, and this portion had grown to 17 percent by 2011. This difference between the price of higher education and available income has ne-cessitated a substantial increase in the number of students who borrow to pay for their education. In 1991, about 30 percent of students at Virginia’s 15 institutions used student loans. By 2011, more than half the students in Virginia borrowed to attend a Virginia school. The average amount borrowed per year has also increased considerably, most notably during the recent recession. The average student in Vir-ginia who borrowed took loans worth $9,893 during the 2011-12 academic year. This increase in borrowing and other forms of student aid, such as institutional grants, equaled about two-thirds of the increase in the total price of attendance in Virginia during the last ten years.
In S
umm
ary
Affordability Certification
SCHEV has conducted certifications of the Restructuring Act requirement that institutions remain affordable.
In its certifications, SCHEV (i) compares graduation rates of students receiving need-based aid to those of students receiving no need-based aid; (ii) the average debt of in-state students with established financial need; and (iii) the percentage of in-state students with established financial need who borrow.

46 Chapter 6: Higher Education Now Consumes More Income, Necessitating Increased Borrowing and Other Aid
oversimplified, this approach provides insight into how the rela-tionship between income and the cost of higher education has changed over time.
Using tuition and fees as a percentage of average income, it ap-pears that higher education is less affordable now than previously. The amount of loans and other aid available has increased over time (discussed in next section), which has mitigated the impact of tuition and fee increases. However, the average consumer must now devote a much higher portion of his or her annual income to pay for school.
In 1991, the average consumer reported about $29,000 in income from wages and salary, self-employment income, or investment in-come. The national average tuition and fees at a public, four-year higher education in that year was about $2,000 and the Virginia average was nearly $3,000. The average consumer would have de-voted about seven percent of his or her income to paying the na-tional average tuition and fees, and about ten percent at Virginia’s institutions.
By 2011, the average consumer reported about $54,000 in income, an increase of 86 percent since 1991. By this time, the national av-erage tuition and fees had risen 256 percent to more than $7,200 per year. Tuition and fees at Virginia’s schools had risen slightly less on a percentage basis—217 percent—but totaled $9,452 per year. The average consumer devoted 13 percent of income to pay the national average, and 17 percent in Virginia (Figure 21).
Figure 21: Average Virginia Tuition and Fees Comprise a Substantially Higher Portion of Average Consumer Income (1991 and 2011)
Source: JLARC staff analysis of Consumer Expenditure Survey data, U.S. Bureau of Labor Statistics; and tuition and fee data re-ported by institutions to the U.S. DOE.
1991
$0 $10,000 $20,000 $30,000 $40,000 $50,000 $60,000
2011
10% 90%
17% 83%
Average Virginia tuition and fees Remaining average income

47 Chapter 6: Higher Education Now Consumes More Income, Necessitating Increased Borrowing and Other Aid
Another measure related to income and the cost of higher educa-tion is the percentage of annual, per capita disposable income con-sumed by annual tuition and fees, room, and board. In 1991, these charges in Virginia equaled, on average, 36 percent of disposal in-come. By 2012, these charges consumed more than 45 percent of disposal income.
The above trend is similar when viewed in terms of income of those who have graduated with a four-year degree. In 2001, the average worker with a bachelor’s degree earned about $42,900 annually. By 2011, this had increased 23 percent to about $52,700. In con-trast, average tuition and fees in Virginia increased 170 percent during this time period—seven times more than the increase in average income of college graduates.
GREATER PERCENTAGE OF STUDENTS BORROW OR RECEIVE OTHER AID AND THEY RECEIVE SUBSTANTIALLY MORE IN AID
One major impact of increasing tuition and fees faster than income is the growth in student loans and other forms of financial aid. A variety of loan options are available to students, which allow them to pay for the cost of higher education using borrowed funds which must be repaid with interest over time. There are also a variety of types of other aid, including grants from the federal and state gov-ernments, as well as institutions.
More Than Half of Undergraduates in Virginia Now Borrow for Higher Education, Up From 30 Percent Two Decades Ago
Student loans, like most other debt, allow students access to bor-rowed funds that must be repaid over a pre-specified duration. Students typically are not required to make payments on these loans while they are attending school. But usually within several months of graduation, lenders expect payment to begin on the loan. Student loans may have lower interest rates than other loans, but because of the long-term repayment structure, many students end up repaying substantially more than the amount they originally borrowed.
In the 1992-93 academic year, more than 35,000 undergraduate students at Virginia’s 15 public four-year institutions borrowed funds using student loans. These students represented about 30 percent of the more than 120,000 undergraduates enrolled. By the 2002-03 academic year, more than 60,000 undergraduate students used student loans, an increase of nearly three-quarters. Because total enrollment grew less during the prior decade, nearly 45 per-cent of students were borrowing funds using student loans.
During the next ten years, the number and percentage of total un-dergraduate students borrowing funds using student loans contin-
Tuition and fees in Virginia increased 170 percent—seven times more than the average income of college graduates.

48 Chapter 6: Higher Education Now Consumes More Income, Necessitating Increased Borrowing and Other Aid
ued to rise steadily. During the 2011-12 academic year, more than 85,000 undergraduate students used student loans, an increase of about 42 percent from 2002-03. These students represented more than half of the total undergraduates at Virginia’s 15 public, four-year higher education institutions.
Value of Average Annual Student Loan in Virginia Nearly Tripled During Last 20 Years to Almost $10,000
As more students used student loans, the amount of the average loan increased substantially across Virginia’s public four-year higher education institutions. In the 1992-93 academic year, the average student using loans borrowed $3,318 to attend a Virginia school. By the 2011-12 academic year, the average student using loans borrowed $9,893, or $6,575 more than in 1992-93 (Figure 22). Of this increase, inflation only accounted for about $2,000, less than one-third of the total increase. The average loan amount rose considerably as the most recent recession took hold. Between 2008 and 2009, the average loan amount increased nearly $1,000, an in-crease of 13 percent.
Figure 22: Average Annual Amount Borrowed Has Increased 198 Percent (1992-93 to 2011-12)
Source: JLARC staff analysis of information collected by SCHEV.
The effect of this increase in annual borrowing is more apparent when viewed over the duration of the time a student is earning his or her degree. A first-year student who began in the 1992-93 aca-demic year and finished his or her degree in four years would have had, on average, a total debt load of $17,415. In contrast, a first-
0
1,000
2,000
3,000
4,000
5,000
6,000
7,000
8,000
9,000
10,000
Ave
rage
am
ount
bor
row
ed, a
nnua
lly
$ $9,893
$3,318
1992-93 2011-12
Inflation
49 Chapter 6: Higher Education Now Consumes More Income, Necessitating Increased Borrowing and Other Aid
year student who began in the 2008-09 academic year would be re-quired to repay more than double that amount: $37,725.
Student Aid Through Grants, Scholarships, and Other Programs Also Grew Substantially—But Less Than Student Loans
In addition to loans, certain students may be offered grants or scholarships to offset the cost of attendance. While some of these may have certain conditions, such as maintaining a particular grade-point average, they do not have to be repaid. Consequently, unlike loans, these types of aid are a true reduction in the price of attendance to the individual student. Certain students also have the opportunity to participate in “work-study” programs through which they perform work on campus in exchange for a reduction in tuition and fees.
In the 1992-93 academic year, about 57,000 grants, scholarships, work study opportunities, or some other form of aid (other than a loan) were provided to students at Virginia’s institutions. A stu-dent received, on average, $2,631 in this type of aid in 1992-93. By the 2002-03 academic year, grant, scholarship, and work-study aid was given to about 79,000 students, an increase of about 39 per-cent. A student received, on average, $3,458 during that year.
During the next ten years, this aid at Virginia public institutions continued to grow steadily until the 2009-10 academic year. Amid the recession, though, the average amount of this aid dropped by five percent in 2009-10. Although the average amount declined, the number of students receiving at least one form of this aid in-creased substantially. By the 2011-12 academic year, there were more than 126,000 grants, scholarships, work-study opportunities, or some other form of non-loan aid provided to students. The aver-age amount of this aid was more than $5,800.
Despite this growth, the average student loan amount still grew more in dollar terms during the last decade. During the 2002-03 academic year, the average student loan was about $2,500 more than the average amount of grant, scholarship, and work-study aid. By the 2011-12 academic year, the average loan amount was more than $4,000 higher.
A JLARC report on higher education strategies and practices to be released in 2014 will more fully address the “net price” relation-ship between tuition and fees, student borrowing, other forms of aid, and various “high tuition / high aid” approaches.
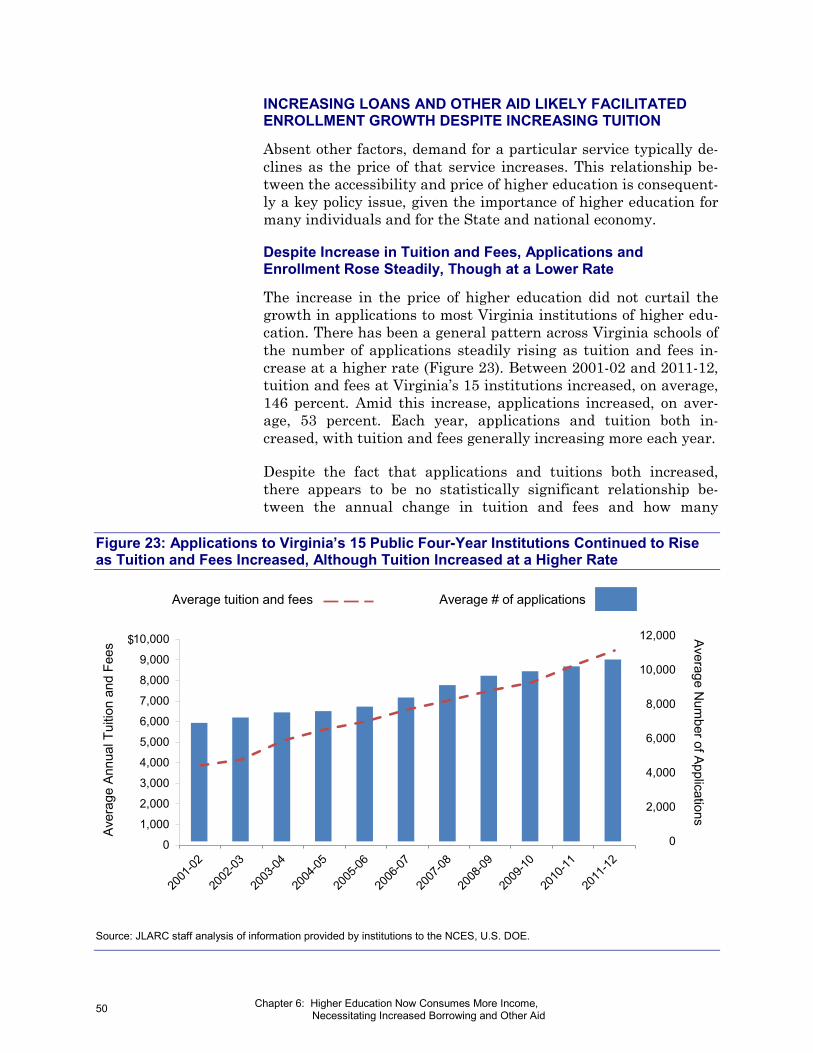
50 Chapter 6: Higher Education Now Consumes More Income, Necessitating Increased Borrowing and Other Aid
INCREASING LOANS AND OTHER AID LIKELY FACILITATED ENROLLMENT GROWTH DESPITE INCREASING TUITION
Absent other factors, demand for a particular service typically de-clines as the price of that service increases. This relationship be-tween the accessibility and price of higher education is consequent-ly a key policy issue, given the importance of higher education for many individuals and for the State and national economy.
Despite Increase in Tuition and Fees, Applications and Enrollment Rose Steadily, Though at a Lower Rate
The increase in the price of higher education did not curtail the growth in applications to most Virginia institutions of higher edu-cation. There has been a general pattern across Virginia schools of the number of applications steadily rising as tuition and fees in-crease at a higher rate (Figure 23). Between 2001-02 and 2011-12, tuition and fees at Virginia’s 15 institutions increased, on average, 146 percent. Amid this increase, applications increased, on aver-age, 53 percent. Each year, applications and tuition both in-creased, with tuition and fees generally increasing more each year.
Despite the fact that applications and tuitions both increased, there appears to be no statistically significant relationship be-tween the annual change in tuition and fees and how many
Figure 23: Applications to Virginia’s 15 Public Four-Year Institutions Continued to Rise as Tuition and Fees Increased, Although Tuition Increased at a Higher Rate
Source: JLARC staff analysis of information provided by institutions to the NCES, U.S. DOE.
Aver
age
Annu
al T
uitio
n an
d Fe
es
0
1,000
2,000
3,000
4,000
5,000
6,000
7,000
8,000
9,000
10,000 Average Num
ber of Applications
$
0
2,000
4,000
6,000
8,000
10,000
12,000
Average tuition and fees Average # of applications
51 Chapter 6: Higher Education Now Consumes More Income, Necessitating Increased Borrowing and Other Aid
students apply to (or enroll in) Virginia’s colleges and universities. Between 2001 and 2011, there was no clear relationship between an institution’s selectivity and increased tuition at Virginia insti-tutions. It would seem that more selective institutions could in-crease tuition and fees more readily because of the higher demand to attend, based on the number of students who are not admitted each year. But this does not appear to be the case. The most selec-tive school between 2001 and 2011, CWM, only increased its tui-tion at the fourth highest rate in Virginia. Similarly, the second most selective school, UVA, increased its tuition at the sixth high-est rate. Alternatively, RU, which was the second least selective school during the time period, increased its tuition at the third highest rate.
There is, however, a general pattern of the more selective Virginia institutions charging higher tuition. During the 2011-12 academic year, the State’s three most selective institutions, CWM, UVA, and VMI, also charged the highest tuition and fees. In contrast, the three least selective institutions did not charge the lowest tuition and fees.
Combined Increase in Loans and Other Aid Equals About Two-Thirds of Increase in Average Price of Attendance
There are many factors, such as population growth and the in-creasing importance of a four-year degree, that have likely facili-tated increasing enrollment despite rising costs. One factor that has likely allowed applications and enrollment to continue to rise amid increasing tuition is the availability of student loans and other types of student aid. Without access to such financial assis-tance, it is likely that many students would have been unable to afford to pay increasingly higher tuition and fees.
However, the annual change in the published total price of attend-ing a Virginia public four-year institution (including tuition and fees, room, and board) does not have a clear or consistent relation-ship with grants and loans. Because of this lack of a relationship, concluding with statistical certainty that increased use of loans and grants explain this increase is not possible. Furthermore, there also is not a clear relationship at each Virginia school.
Despite this lack of statistical relationship, the increase in the amount of the average student loan and other aid from 2002 to 2011 equals about two-thirds of the increase in the total published price of attending Virginia’s 15 institutions. Between 2002-03 and 2011-12, the average student loans and other aid increased by $6,224. This increase equals about 67 percent of the $9,295 in-crease in the total average price of attending a Virginia institution during the same time period (Table 9).
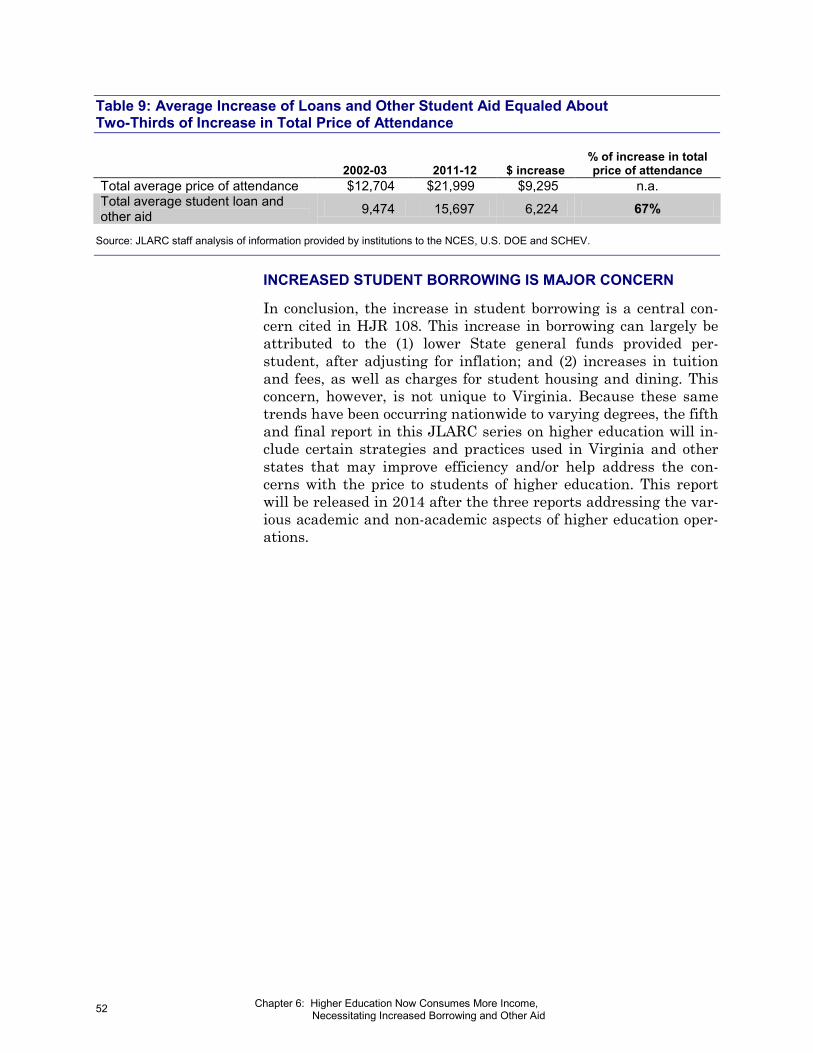
52 Chapter 6: Higher Education Now Consumes More Income, Necessitating Increased Borrowing and Other Aid
Table 9: Average Increase of Loans and Other Student Aid Equaled About Two-Thirds of Increase in Total Price of Attendance
2002-03 2011-12 $ increase % of increase in total price of attendance
Total average price of attendance $12,704 $21,999 $9,295 n.a. Total average student loan and other aid 9,474 15,697 6,224 67%
Source: JLARC staff analysis of information provided by institutions to the NCES, U.S. DOE and SCHEV.
INCREASED STUDENT BORROWING IS MAJOR CONCERN
In conclusion, the increase in student borrowing is a central con-cern cited in HJR 108. This increase in borrowing can largely be attributed to the (1) lower State general funds provided per-student, after adjusting for inflation; and (2) increases in tuition and fees, as well as charges for student housing and dining. This concern, however, is not unique to Virginia. Because these same trends have been occurring nationwide to varying degrees, the fifth and final report in this JLARC series on higher education will in-clude certain strategies and practices used in Virginia and other states that may improve efficiency and/or help address the con-cerns with the price to students of higher education. This report will be released in 2014 after the three reports addressing the var-ious academic and non-academic aspects of higher education oper-ations.

Appendix A: Study Mandate 53
HOUSE JOINT RESOLUTION NO. 108
Directing the Joint Legislative Audit and Review Commission to study the cost efficiency of the Commonwealth’s institutions of higher education and to identify opportunities to reduce the cost of public higher education in Virginia. Report.
Agreed to by the House of Delegates, February 10, 2012 Agreed to by the Senate, February 28, 2012
WHEREAS, “Preparing for the Top Jobs of the 21st Century: The Virginia Higher Educa-tion Opportunity Act of 2011” has set a goal of awarding 100,000 more degrees over the next 15 years; and
WHEREAS, the State Council of Higher Education for Virginia has reported that the aver-age increase for in-state undergraduate tuition and mandatory fees from the 2009-2010 school year to the 2010-2011 school year was 13.1 percent at four-year institutions; and
WHEREAS, the Joint Legislative Audit and Review Commission has reported in its 2011 Review of State Spending that tuition revenue for Virginia’s public colleges and universities increased 110 percent between 2002 and 2009, while inflation increased only 23 percent during that period; and
WHEREAS, the Joint Legislative Audit and Review Commission has reported that Virgin-ia’s average annual in-state tuition and fees at public four-year institutions of higher edu-cation was $8,814 in 2010, ranking as the fourteenth highest average in the nation; and
WHEREAS, the increasing costs of higher education have forced many students to incur significant debt in order to complete their degrees, with the Institute for College Access and Success reporting that the average student debt for Virginia public institutions of higher education is $19,918, and that 57 percent of students have debt related to their higher edu-cation; and
WHEREAS, the increasing costs of higher education and the growing debt burden for stu-dents may limit access to educational opportunities, adversely affect growth in other sectors of Virginia’s economy, and be an obstacle to the goal to award 100,000 more degrees over the next 15 years; and
WHEREAS, in December 2009 the Joint Legislative Audit and Review Commission author-ized its staff to complete a study of the cost efficiency of higher education in Virginia, but, because of workload demands from joint study resolutions adopted by the General Assem-bly, such a study could not be completed; now, therefore, be it
App
endi
x
A Study Mandate

54 Appendix A: Study Mandate
RESOLVED by the House of Delegates, the Senate concurring, That the Joint Legislative Audit and Review Commission be directed to study the cost efficiency of the Common-wealth’s institutions of higher education and to identify opportunities to reduce the cost of public higher education in Virginia.
In conducting its study, the Joint Legislative Audit and Review Commission (JLARC) shall consider (i) teaching loads and productivity of faculty; (ii) the impact of faculty research on tuition and other costs; (iii) incentives created by existing faculty compensation models; (iv) design and utilization of facilities; (v) operation of enterprise activities; (vi) the use of tech-nology for academic programs and administrative functions; (vii) administrative staffing and costs; (viii) scholarships and other student aid programs; (ix) the use of outsourcing and public-private partnerships; (x) the use of cooperative procurement; (xi) the impact of non-academic activities and programs on tuition and fees; (xii) sources of revenue and income, and how these sources are allocated toward academic, administrative, and other costs; (xiii) opportunities to reduce the cost of public higher education in Virginia; and (xiv) such other related matters as it may deem appropriate.
Technical assistance shall be provided to the Joint Legislative Audit and Review Commis-sion by the State Council for Higher Education for Virginia and all state-supported institu-tions of higher education. All agencies of the Commonwealth shall provide assistance to JLARC for this study, upon request.
The Joint Legislative Audit and Review Commission shall complete its meetings for the first year by November 30, 2013, and for the second year by November 30, 2014, and the Chairman shall submit to the Division of Legislative Automated Systems an executive summary of its findings and recommendations no later than the first day of the next Regu-lar Session of the General Assembly for each year. Each executive summary shall state whether JLARC intends to submit to the General Assembly and the Governor a report of its findings and recommendations for publication as a House or Senate document. The execu-tive summaries and reports shall be submitted as provided in the procedures of the Division of Legislative Automated Systems for the processing of legislative documents and reports and shall be posted on the General Assembly’s website.

Appendix B: Research Activities and Methods 55
JLARC staff conducted the following research activities during this review:
• reviews of the research literature on higher education and documentation including the Constitution of Virginia, the Code of Virginia, and Appropriations Acts;
• interviews with staff at the State Council of Higher Educa-tion in Virginia (SCHEV) and staff at Virginia’s public four-year institutions; and
• quantitative analysis of (i) data provided by SCHEV, (ii) ap-propriations to public higher education in Virginia, and (iii) data reported by higher education institutions nationwide and in Virginia to the U.S. Department of Education’s Na-tional Center for Education Statistics (NCES).
DOCUMENTATION REVIEW
JLARC staff reviewed a variety of documentation and literature about higher education trends nationally and in Virginia. This in-cluded information published in academic journals and by policy institutes and organizations. Staff reviewed a variety of reports, assessments, and policy documents related to higher education in Virginia.
Staff also reviewed portions of the Constitution of Virginia and Code of Virginia that pertained to higher education funding and operational responsibility statewide and for each institution. Ap-propriation Acts between 1992 and 2013 were reviewed to identify certain legislative initiatives related to higher education.
INTERVIEWS
As part of JLARC staff’s overall review of higher education under HJR 108, staff interviewed a variety of key stakeholders about higher education in Virginia. These included academic experts in higher education finance and operations, as well as current practi-tioners at most of Virginia’s 15 public four-year higher education institutions. JLARC staff also interviewed staff at SCHEV and the Virginia Department of Planning and Budget.
App
endi
x
B Research Activities and Methods

56 Appendix B: Research Activities and Methods
DATA COLLECTION AND ANALYSIS
JLARC staff did not conduct any primary data collection for this report. Staff relied on several major sources of existing data about higher education enrollment, funding, spending, and staffing in Virginia and nationally. The majority of the data presented in this report was originally collected by NCES from institutions of higher education. The information is publicly available on the NCES web-site, and JLARC staff downloaded this information to then conduct descriptive and comparative analysis.
Staff also collected and analyzed data on tuition and fees and fi-nancial aid from SCHEV. Virginia Appropriation Acts were used to derive general fund and non-general fund appropriations to higher education. Data from the U.S. Census Bureau and Bureau of Labor Statistics was also used to identify trends in average income and prices.
Finally, staff used NCES data and regression analysis to develop a national model (including all public four-year institutions in the U.S.) to predict graduation rates using four variables:
• student financial status (percentage of undergraduate stu-dents receiving Pell grants),
• freshmen class average entering SAT score, • instructional spending per student, and • percentage of students who attend full-time.
Each of the above four variables had a strong correlation with six-year graduation rates. Collectively, the four variables yielded a model that was highly predictive (r2 = 0.78) of the graduation rate for a given institution nationally. Three years of NCES data was available from the NCES database.
For the 15 Virginia public four-year higher education institutions, there was general consistency using the model in the difference be-tween predicted and actual graduation rates across those three years. Staff then compared institutions’ actual graduation rates with their expected graduation rates based on the model. The dif-ference between predicted and actual was considered substantial if it was more than the 75th or less than the 25th percentile.

Appendix C: Virginia Institutions Compared to Carnegie Classification Averages 57
This appendix is designed to provide context for how each of Vir-ginia’s public four-year schools compares to other institutions na-tionally in the same Carnegie classification in three key areas: tui-tion and fees, revenue by major source, and spending by certain category. The figures in this appendix are presented by Carnegie classification. All data used to develop the figures is from infor-mation provided by institutions to the U.S. Department of Educa-tion’s National Center for Education Statistics. Certain data may differ from other available sources because of data definitions and/or data collection and reporting time frames.
The first table shows tuition and fees in 2001, 2011, and the per-centage change during the intervening time period. This data is shown for the Virginia institution and the average across the pub-lic and private institutions in the same Carnegie classification.
The second graph shows institutional revenue by major source in FY2001 and 2011. The data is shown for the Virginia institution, then for the public institution average in the same Carnegie classi-fication. These revenue categories were chosen because they reflect the majority of revenue at most institutions. However, certain in-stitutions have other large sources of revenue, resulting in a com-paratively large percentage of revenue in the “other” category. Revenue sources are shown as a percentage of annual operating and non-operating revenues. Because private institutions have dif-fering revenue structures, no revenue data is presented for these private institutions.
The third and final graph in each figure shows institutional spend-ing by major source in FY2001 and 2011. The major sources shown are instruction, research, academic support, institutional support, auxiliary enterprises, and other spending. The rationale for select-ing these spending categories and presentation of only public insti-tutions is the same as noted above for institutional revenue.
App
endi
x
C
Virginia Institutions Compared to Carnegie Classification Averages
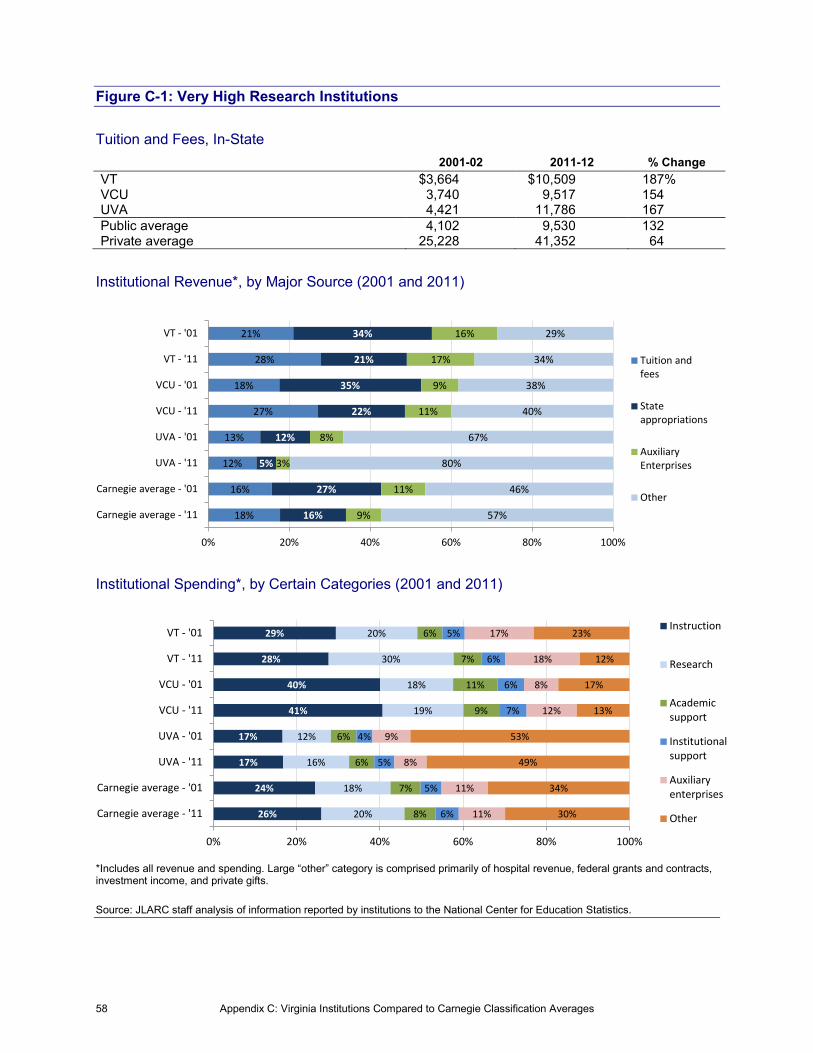
58 Appendix C: Virginia Institutions Compared to Carnegie Classification Averages
Figure C-1: Very High Research Institutions
Tuition and Fees, In-State 2001-02 2011-12 % Change VT $3,664 $10,509 187% VCU 3,740 9,517 154 UVA 4,421 11,786 167 Public average 4,102 9,530 132 Private average 25,228 41,352 64
Institutional Revenue*, by Major Source (2001 and 2011)
Institutional Spending*, by Certain Categories (2001 and 2011)
*Includes all revenue and spending. Large “other” category is comprised primarily of hospital revenue, federal grants and contracts, investment income, and private gifts. Source: JLARC staff analysis of information reported by institutions to the National Center for Education Statistics.
26%
24%
17%
17%
41%
40%
28%
29%
20%
18%
16%
12%
19%
18%
30%
20%
8%
7%
6%
6%
9%
11%
7%
6%
6%
5%
5%
4%
7%
6%
6%
5%
11%
11%
8%
9%
12%
8%
18%
17%
30%
34%
49%
53%
13%
17%
12%
23%
0% 20% 40% 60% 80% 100%
Carnegie average - '11
Carnegie average - '01
UVA - '11
UVA - '01
VCU - '11
VCU - '01
VT - '11
VT - '01 Instruction
Research
Academicsupport
Institutionalsupport
Auxiliaryenterprises
Other
18%
16%
12%
13%
27%
18%
28%
21%
16%
27%
5%
12%
22%
35%
21%
34%
9%
11%
3%
8%
11%
9%
17%
16%
57%
46%
80%
67%
40%
38%
34%
29%
0% 20% 40% 60% 80% 100%
Carnegie average - '11
Carnegie average - '01
UVA - '11
UVA - '01
VCU - '11
VCU - '01
VT - '11
VT - '01
Tuition andfees
Stateappropriations
AuxiliaryEnterprises
Other

Appendix C: Virginia Institutions Compared to Carnegie Classification Averages 59
Figure C-2: High Research Institutions
Tuition and Fees, In-State 2001-02 2011-12 % Change CWM $4,863 $13,132 170% GMU 3,792 9,266 144 ODU 3,248 6,566 102 Public average 3,992 8,415 111 Private average 19,271 34,100 77
Institutional Revenue, by Major Source (2001 and 2011)
Institutional Spending, by Certain Categories (2001 and 2011)
Source: JLARC staff analysis of information reported by institutions to the National Center for Education Statistics.
35%
31%
42%
39%
44%
37%
34%
33%
14%
14%
2%
2%
12%
10%
9%
8%
10%
10%
13%
13%
9%
7%
10%
9%
8%
7%
9%
9%
7%
9%
8%
6%
13%
13%
23%
13%
17%
21%
32%
28%
20%
25%
11%
24%
12%
16%
8%
16%
0% 20% 40% 60% 80% 100%
Carnegie average - '11
Carnegie average - '01
ODU - '11
ODU - '01
GMU - '11
GMU - '01
CWM - '11
CWM - '01 Instruction
Research
Academicsupport
Institutionalsupport
Auxiliaryenterprises
Other
29%
24%
28%
27%
39%
24%
39%
29%
23%
34%
29%
42%
14%
35%
14%
27%
11%
12%
24%
16%
20%
20%
24%
25%
38%
29%
18%
15%
26%
21%
23%
19%
0% 20% 40% 60% 80% 100%
Carnegie average - '11
Carnegie average - '01
ODU - '11
ODU - '01
GMU - '11
GMU - '01
CWM - '11
CWM - '01
Tuition andfees
Stateappropriations
AuxiliaryEnterprises
Other

60 Appendix C: Virginia Institutions Compared to Carnegie Classification Averages
Figure C-3: Masters, Large Institutions
Tuition and Fees, In-State 2001-02 2011-12 % Change JMU $4,094 $8,448 106% UMW 3,340 8,926 167 NSU 2,916 6,700 130 RU 3,069 8,320 171 Public average 3,328 7,056 112 Private average 14,764 24,094 63
Institutional Revenue*, by Major Source (2001 and 2011)
*According to the Virginia Auditor of Public Accounts, NSU has been unable to produce auditable financial statements for 2011. Data shown, therefore, has not been independently audited and verified.
Institutional Spending*, by Certain Categories (2001 and 2011)
*According to the Virginia Auditor of Public Accounts, NSU has been unable to produce auditable financial statements for 2011. Data shown, therefore, has not been independently audited and verified.
Source: JLARC staff analysis of information reported by institutions to the National Center for Education Statistics.
32%
26%
26%
20%
18%
19%
34%
33%
35%
23%
30%
40%
31%
38%
33%
41%
24%
33%
18%
29%
12%
12%
29%
31%
19%
20%
32%
28%
34%
38%
27%
21%
13%
12%
29%
21%
10%
6%
13%
10%
0% 20% 40% 60% 80% 100%
Carnegie average - '11
Carnegie average - '01
RU - '11
RU - '01
NSU - '11
NSU - '01
UMW - '11
UMW - '01
JMU - '11
JMU - '01
Tuition andfees
Stateappropriations
AuxiliaryEnterprises
Other
41%
34%
40%
33%
28%
27%
33%
32%
36%
30%
2%
2%
0%
1%
8%
4%
0%
1%
2%
1%
10%
9%
7%
9%
13%
9%
11%
7%
10%
9%
12%
10%
11%
9%
10%
11%
11%
8%
7%
6%
12%
13%
32%
31%
19%
21%
36%
34%
34%
38%
23%
32%
10%
17%
22%
29%
9%
19%
10%
17%
0% 20% 40% 60% 80% 100%
Carnegie average - '11
Carnegie average - '01
RU - '11
RU - '01
NSU - '11
NSU - '01
UMW - '11
UMW - '01
JMU - '11
JMU - '01 Instruction
Research
Academicsupport
Institutionalsupport
Auxiliaryenterprises
Other

Appendix C: Virginia Institutions Compared to Carnegie Classification Averages 61
Figure C-4: Masters, Medium Institutions
Tuition and Fees, In-State 2001-02 2011-12 % Change LU $4,226 $10,530 149% Public average 3,188 6,818 114 Private average 13,440 22,201 65
Institutional Revenue, by Major Source (2001 and 2011)
Institutional Spending, by Certain Categories (2001 and 2011)
Source: JLARC staff analysis of information reported by institutions to the National Center for Education Statistics.
27%
25%
24%
16%
29%
41%
26%
34%
12%
13%
39%
35%
31%
21%
11%
14%
0% 20% 40% 60% 80% 100%
Carnegie average - '11
Carnegie average - '01
LU - '11
LU - '01Tuition andfees
Stateappropriations
AuxiliaryEnterprises
Other
38%
33%
30%
26%
4%
3%
0%
0%
9%
8%
8%
9%
11%
9%
11%
11%
15%
13%
38%
33%
23%
33%
14%
22%
0% 20% 40% 60% 80% 100%
Carnegie average - '11
Carnegie average - '01
LU - '11
LU - '01
Instruction
Research
Academicsupport
Institutionalsupport
Auxiliaryenterprises
Other

62 Appendix C: Virginia Institutions Compared to Carnegie Classification Averages
Figure C-5: Masters, Small Institutions
Tuition and Fees, In-State 2001-02 2011-12 % Change CNU $3,192 $10,084 216% VSU 3,312 7,090 114 Public average 3,451 6,896 100 Private average 12,042 19,439 61
Institutional Revenue, by Major Source (2001 and 2011)
Institutional Spending, by Certain Categories (2001 and 2011)
Source: JLARC staff analysis of information reported by institutions to the National Center for Education Statistics.
26%
25%
20%
15%
24%
18%
29%
34%
30%
30%
24%
40%
14%
14%
19%
19%
42%
27%
32%
27%
31%
37%
9%
15%
0% 20% 40% 60% 80% 100%
Carnegie average - '11
Carnegie average - '01
VSU - '11
VSU - '01
CNU - '11
CNU - '01
Tuition andfees
Stateappropriations
AuxiliaryEnterprises
Other
38%
30%
37%
24%
34%
33%
3%
2%
5%
4%
2%
4%
10%
8%
5%
5%
7%
9%
15%
12%
12%
10%
9%
9%
14%
14%
28%
23%
39%
22%
20%
34%
14%
34%
9%
23%
0% 20% 40% 60% 80% 100%
Carnegie average - '11
Carnegie average - '01
VSU - '11
VSU - '01
CNU - '11
CNU - '01Instruction
Research
Academicsupport
Institutionalsupport
Auxiliaryenterprises
Other

Appendix C: Virginia Institutions Compared to Carnegie Classification Averages 63
Figure C-6: Baccalaureate, Arts and Sciences Institutions
Tuition and Fees, In-State 2001-02 2011-12 % Change UVA-Wise $3,470 $7,721 123% VMI 6,294 13,184 109 Public average 4,180 8,402 101 Private average 17,981 30,936 72
Institutional Revenue, by Major Source (2001 and 2011
Institutional Spending, by Certain Categories (2001 and 2011)
Source: JLARC staff analysis of information reported by institutions to the National Center for Education Statistics.
35%
29%
30%
24%
30%
28%
2%
2%
0%
0%
0%
1%
10%
8%
12%
8%
10%
9%
15%
11%
10%
9%
13%
11%
18%
13%
34%
27%
24%
18%
20%
37%
13%
32%
23%
33%
0% 20% 40% 60% 80% 100%
Carnegie average - '11
Carnegie average - '01
VMI - '11
VMI - '01
UVA-Wise - '11
UVA-Wise - '01Instruction
Research
Academicsupport
Institutionalsupport
Auxiliaryenterprises
Other
24%
27%
28%
24%
20%
15%
32%
38%
17%
29%
31%
51%
15%
13%
22%
21%
16%
17%
29%
23%
33%
26%
34%
17%
0% 20% 40% 60% 80% 100%
Carnegie average - '11
Carnegie average - '01
VMI - '11
VMI - '01
UVA-Wise - '11
UVA-Wise - '01
Tuition andfees
Stateappropriations
AuxiliaryEnterprises
Other
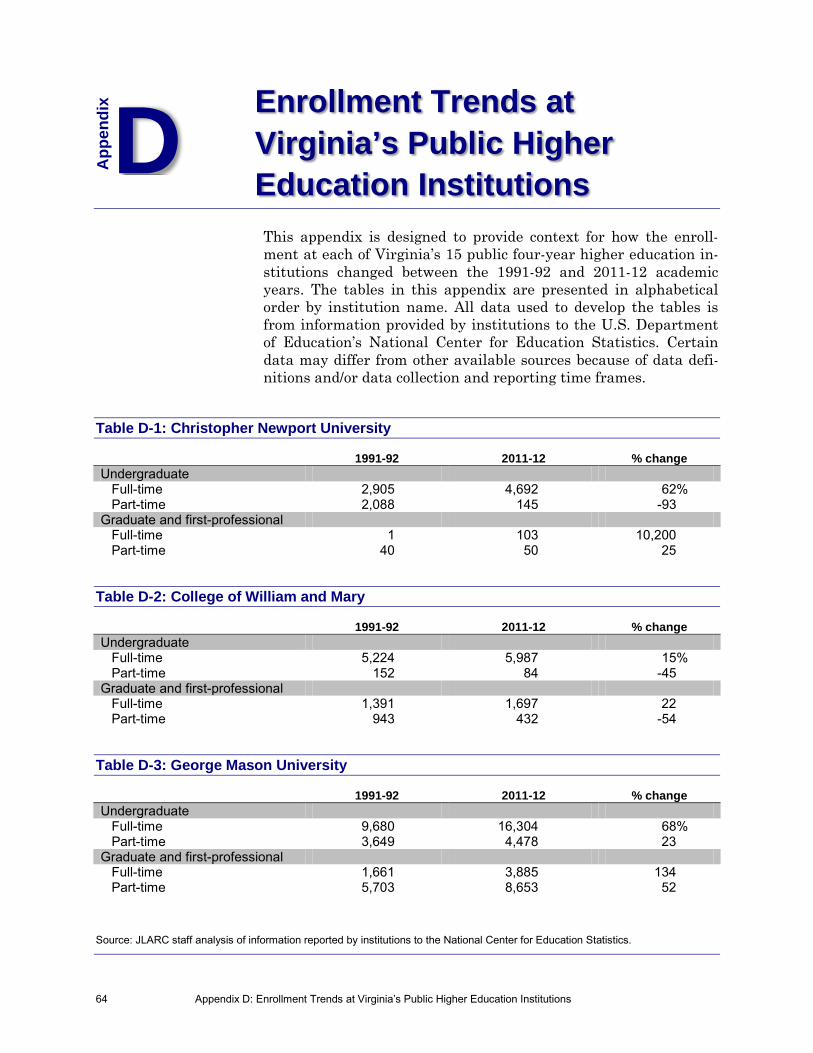
64 Appendix D: Enrollment Trends at Virginia’s Public Higher Education Institutions
This appendix is designed to provide context for how the enroll-ment at each of Virginia’s 15 public four-year higher education in-stitutions changed between the 1991-92 and 2011-12 academic years. The tables in this appendix are presented in alphabetical order by institution name. All data used to develop the tables is from information provided by institutions to the U.S. Department of Education’s National Center for Education Statistics. Certain data may differ from other available sources because of data defi-nitions and/or data collection and reporting time frames.
Table D-1: Christopher Newport University
1991-92 2011-12 % change Undergraduate Full-time 2,905 4,692 62% Part-time 2,088 145 -93 Graduate and first-professional Full-time 1 103 10,200 Part-time 40 50 25
Table D-2: College of William and Mary
1991-92 2011-12 % change Undergraduate Full-time 5,224 5,987 15% Part-time 152 84 -45 Graduate and first-professional Full-time 1,391 1,697 22 Part-time 943 432 -54
Table D-3: George Mason University
1991-92 2011-12 % change Undergraduate Full-time 9,680 16,304 68% Part-time 3,649 4,478 23 Graduate and first-professional Full-time 1,661 3,885 134 Part-time 5,703 8,653 52
Source: JLARC staff analysis of information reported by institutions to the National Center for Education Statistics.
App
endi
x
D Enrollment Trends at Virginia’s Public Higher Education Institutions

Appendix D: Enrollment Trends at Virginia’s Public Higher Education Institutions 65
Table D-4: James Madison University 1991-92 2011-12 % change Undergraduate Full-time 9,594 17,086 78% Part-time 749 814 9 Graduate and first-professional Full-time 388 1,080 178 Part-time 746 742 -1
Table D-5: Longwood University 1991-92 2011-12 % change Undergraduate Full-time 2,825 4,017 42% Part-time 148 220 49 Graduate and first-professional Full-time 37 131 254 Part-time 295 492 67
Table D-6: Norfolk State University 1991-92 2011-12 % change Undergraduate Full-time 6,436 5,005 -22% Part-time 964 1,259 31 Graduate and first-professional Full-time 197 469 138 Part-time 701 358 -49
Table D-7: Old Dominion University 1991-92 2011-12 % change Undergraduate Full-time 9,625 14,725 53% Part-time 1,999 4,642 132 Graduate and first-professional Full-time 1,112 1,891 70 Part-time 3,950 3,495 -12
Source: JLARC staff analysis of information reported by institutions to the National Center for Education Statistics.

66 Appendix D: Enrollment Trends at Virginia’s Public Higher Education Institutions
Table D-8: Radford University 1991-92 2011-12 % change Undergraduate Full-time 8,136 8,023 -1% Part-time 458 327 -29 Graduate and first-professional Full-time 368 542 47 Part-time 534 478 -10
Table D-9: University of Mary Washington 1991-92 2011-12 % change Undergraduate Full-time 3,007 3,846 28% Part-time 709 618 -13 Graduate and first-professional Full-time 1 145 14,400 Part-time 62 561 805
Table D-10: University of Virginia 1991-92 2011-12 % change Undergraduate Full-time 11,148 14,842 33% Part-time 1,313 920 -30 Graduate and first-professional Full-time 5,622 6,108 9 Part-time 3,258 2,427 -26
Table D-11: University of Virginia-Wise 1991-92 2011-12 % change Undergraduate Full-time 1,116 1,518 36% Part-time 562 549 -2 Graduate and first-professional Full-time 0 0 -- Part-time 0 0 --
Source: JLARC staff analysis of information reported by institutions to the National Center for Education Statistics.

Appendix D: Enrollment Trends at Virginia’s Public Higher Education Institutions 67
Table D-12: Virginia Commonwealth University 1991-92 2011-12 % change Undergraduate Full-time 10,646 19,628 84% Part-time 4,926 3,870 -21 Graduate and first-professional Full-time 2,955 5,155 74 Part-time 3,081 2,974 -3
Table D-13: Virginia Military Institute 1991-92 2011-12 % change Undergraduate Full-time 1,281 1,605 25% Part-time 0 0 -- Graduate and first-professional Full-time 0 0 -- Part-time 0 0 --
Table D-14: Virginia State University 1991-92 2011-12 % change Undergraduate Full-time 3,517 4,971 41% Part-time 412 330 -20 Graduate and first-professional Full-time 110 294 167 Part-time 550 295 -46
Table D-15: Virginia Tech 1991-92 2011-12 % change Undergraduate Full-time 18,690 23,176 24% Part-time 641 524 -18 Graduate and first-professional Full-time 3,810 4,763 25 Part-time 3,116 2,473 -21
Source: JLARC staff analysis of information reported by institutions to the National Center for Education Statistics.

68

Appendix E: Agency Responses 69
As part of an extensive validation process, State agencies and oth-er entities involved in a JLARC assessment are given the oppor-tunity to comment on an exposure draft of the report. JLARC staff provided an exposure draft of this report to the Secretary of Edu-cation and State Council of Higher Education for Virginia (SCHEV) staff. Appropriate technical corrections resulting from their comments have been made in this version of the report. This appendix includes letters received from the Secretary of Education and the Director of SCHEV.
App
endi
x
E Agency Responses

Patrick Henry Building ●1111 East Broad Street ● Richmond, Virginia 23219 ● (804) 786-1151
Office of the Governor
June 3, 2013
Mr. Glen S. Tittermary
Director, Joint Legislative Audit and Review Commission
Suite 1100, General Assembly Building, Capitol Square
Richmond, VA 23219
Dear Mr. Tittermary,
Thank you for the opportunity to review a draft of the report Trends in Higher Education
Funding, Enrollment, and Student Costs. I’m sorry that I’m not able to attend today’s meeting and
share in more detail the work Governor McDonnell has pursued during his Administration. Virginia is
very fortunate to have a diverse group of high quality public institutions of higher education with
strong leadership from our governor, presidents and Boards of Visitors. I also want to recognize the
leadership of Majority Leader Kirk Cox, Senator Tommy Norment and Senator Walter Stosch. These
legislators have been great partners for the governor and higher education, with all three serving on the
Higher Education Commission and Delegate Cox and Senator Norment serving on Higher Education
Advisory Committee as well as sponsoring the Top Jobs legislation.
Since taking office, Governor McDonnell has made higher education a top priority through the
work of the Commission on Higher Education Reform, Innovation and Investment, the Virginia Higher
Education Opportunity Act of 2011 and the Higher Education Advisory Committee. Two major
components of this work include reform-based investment and greater access. As outlined in the Top
Jobs (TJ21) legislation, we have set a roadmap for achieving an additional 100,000 new degrees by
2025 by increasing enrollment of Virginia students, improving graduation and retention rates and
assisting students with some college credit to complete degrees. We are focusing additional degree
attainment in high-demand, high-income fields, like STEM and healthcare, which are the keys to a 21st
Century economy, providing financial aid resources aimed at middle and low-income families, and
encouraging institutions to be more efficient and innovation in their delivery of higher education
services. Some ways that our institutions are accomplishing these efficiencies include year-round use
of facilities, technology-enhanced instruction, resource sharing, creating new innovative and
economical degree paths and continuing restructuring and managerial reforms.
Our institutions have risen to the challenges and opportunities of meeting the goals of the Top
Jobs legislation by holding down tuition, controlling costs, focusing on improving graduation rates,
enhancing campus facility usage, increasing operational efficiency, and implementing other TJ21
COMMONWEALTH of VIRGINIA
Laura W. Fornash
Secretary of Education
70 Appendix E: Agency Responses

Page 2
Patrick Henry Building ●1111 East Broad Street ● Richmond, Virginia 23219 ● (804) 786-1151
goals. They reallocated more than what was required by the Appropriations Act in FY ’12 to the key
objectives of TJ21, while enrollment is projected to increase by 22,000 students over academic years
2009-10 to 2013-14. The number of associate and bachelor’s degree awards will increase by 5,000
from academic year 2009-10 to 2013-14, ahead of pace to reach our 100,000 goal. None of these
successes would have been possible without the leadership of our presidents, and that of their faculty
and staff, along with the General Assembly, the Virginia Business Higher Education Council, and the
Grow By Degrees coalition.
With the support of the General Assembly, we were able to invest an additional $47 million in
higher education for the upcoming fiscal year, on top of the $350 million in new money that has
already been requested and had approved over the past 3 years. With these dollars, we are reinvesting
in Virginia’s higher education system that saw a large reduction in funding during the economic
recession. These new investments, plus significant efficiencies at our institutions, are creating greater
access and affordability in higher education.
Even with these major initiatives, our work is not done. We are continuing our work through
the Higher Education Advisory Committee and the governor’s recent Executive Directive relating to
responsibilities and duties of the State Council of Higher Education for Virginia. This summer, the
Higher Education Advisory Committee will look at efficiencies in higher education by studying best
practices in the Commonwealth and across the country. Further, I will participate in discussions with
SCHEV and their Council on ways that they can best support the goals and objectives outlines in TJ21
as outlined in Executive Directive #6.
I would like to offer my support to the comments and technical amendments offered by
SCHEV Executive Director Peter Blake, specifically, the comparison between instructional spending
and auxiliary enterprises. I concur that you should compare spending for the entire Educational and
General Programs (E&G) program area to the Auxiliary Enterprises program area as all of the support
programs with the E&G areas are vital to our higher education institutions.
Thank you again for the opportunity to provide feedback on the report Trends in Higher
Education Funding, Enrollment, and Student Costs. I look forward to reviewing the remaining reports
outlined in House Joint Resolution 108.
Sincerely,
Laura W. Fornash
Appendix E: Agency Responses 71

72 Appendix E: Agency Responses
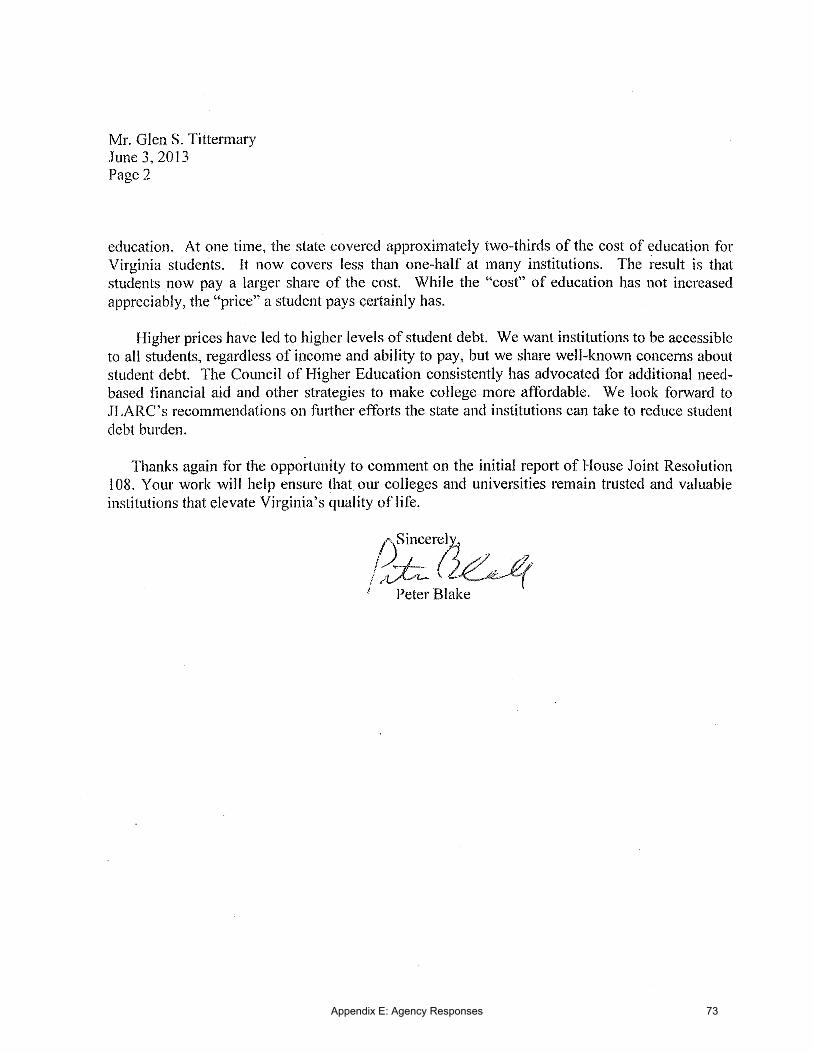
Appendix E: Agency Responses 73


JLARC Staff
Lauren W. Axselle Erik Beecroft Jamie S. Bitz
Justin C. Brown Andrew B. Dickinson
Christopher J. Duncombe Kathleen DuVall
Bridget E. Farmer Kathryn A. Francis
Nicole K. Gaffen Harold E. Greer III
Mark R. Gribbin Nia N. Harrison
Betsy M. Jackson Borna Kazerooni Paula C. Lambert
Joseph M. McMahon Ellen J. Miller
Nathalie Molliet-Ribet Laura C. Parker Gregory J. Rest
David A. Reynolds Kimberly A. Sarte Anna B. Seymour
Elizabeth H. Singer Walter L. Smiley Tracey R. Smith
Glen S. Tittermary Christine D. Wolfe Sandra S. Wright

Recent JLARC Reports
427. Review of Employee Misclassification in Virginia 428. VRS Semi-Annual Investment Report No. 38: July 2012 429. Dedicated Revenue Sources for Land Conservation in Virginia 430. Review of Year-Round Schools 432. Review of State Spending: 2012 Update 434. Technical Report: Cost of Competing Adjustment for School Divisions in Northern Virginia 435. State Spending on the Standards of Quality: FY 2012 436. Biennial VRS Status and Semi-Annual Investment Report: December 2012 437. Special Report: Review of Recent Reports on the Virginia Port Authority's Operations 438. Virginia Compared to the Other States: 2013 Edition 439. Evaluation of Senate Bill 81: Mandated Coverage for General Anesthesia and Hospitalization for
Pediatric Dental Procedures 440. Evaluation of House Bill 1174: Mandated Offer of Insurance Plans Not Covering Induced Abortions
Outside of Certain Exceptions
These reports are available on the JLARC website at http://jlarc.virginia.gov


Joint Legislative Audit and Review Commission201 North 9th Street• General Assembly Building • Suite 1100 • Richmond, Virginia 23219804-786-1258 • Fax 804-371-0101 • http://jlarc.virginia.gov