Embed Size (px)
Citation preview

8/8/2019 Trends in India Corporate
http://slidepdf.com/reader/full/trends-in-india-corporate 1/12
Asia
Curre
ntIssues
Author
Rachna Saxena+44 207 [email protected]
EditorMaria Laura Lanzeni
Technical AssistantBettina Giesel
Deutsche Bank ResearchFrankfurt am MainGermanyInternet:www.dbresearch.comE-mail [email protected] Fax: +49 69 910-31877
Managing DirectorNorbert Walter
Corporate investment has been a significant source of economic
growth over the past several years. In the past decade, there has been
tremendous growth in overall investment levels in India, from less than 25% of
GDP in 2000 to over 35% by 2006. A significant part of this investment drive has
come from the corporate sector. Over the past five years, corporate investment as
a share of India’s GDP grew by 9 percentage points. Given the links between a
country’s investment levels and its overall economic growth, corporate financingand investment are crucial components of India’s future growth potential. This
paper focuses on the various sources of corporate financing that are used to fund
this corporate investment.
The global financial crisis has hit several sources of corporate
financing. Foreign financing of Indian corporations has increased over the past
five years. This includes external commercial borrowings, foreign direct
investment, credit from foreign banks, and foreign institutional investors that have
participated in domestic equity markets. As foreign investors have been hit by the
crisis, they have pulled back from the Indian market and turned risk averse. While
the second half of 2009 has seen a rebound in foreign inflows, it still could take
until 2010 before capital flows fully recover.
SMEs are most at risk from the financing slowdown. Given their lack of
significant retained earnings and corporate savings, SMEs are generally
considered to be most at risk from the financing slowdown. External financing is
not just supplementary capital used to fund growth and expansion plans, but
rather essential funds that SMEs use to refinance existing debt and to sustain day-
to-day operations.
Equity markets and foreign direct investment could be the most
promising sources of financing over the next year. Even if Indian markets
correct moderately from the currently high levels, we think domestic equity will be
an important source of corporate financing over the next 12 months – both throughthe primary and secondary market. In addition, the recovery in global equity
markets means that GDR and ADR issuance will offer good financing opportunities
as well. The expected rebound in the Indian economy and gradual implementation
of FDI reforms will enable direct investment to grow strongly once again. Finally,
there is potential in external commercial borrowings (ECBs) as interest rates go
down in credit markets. However, foreign lenders’ willingness and ability to lend to
smaller companies may be limited.
Note: A shorter version of this article appears in the Indian Journal of Capital Market.
Trends in India's corporatefinancingOctober 27, 2009

8/8/2019 Trends in India Corporate
http://slidepdf.com/reader/full/trends-in-india-corporate 2/12

8/8/2019 Trends in India Corporate
http://slidepdf.com/reader/full/trends-in-india-corporate 3/12
Trends in India's corporate financing
October 27, 2009 3
Introduction
While considerable amounts of firm financing come from internalsources such as retained earnings, sources of external capitalremain highly important. These include bank credit, equity markets,corporate bond markets, external commercial borrowings, foreigndirect investment, and private equity. As the global crisis took holdover the past two years, many of these financing sources dried upand slowed corporate investment and growth. Liquidity conditionsand the stock market have improved since the lows in the secondhalf of 2008 and the early part of this year, but obtaining funds maystill remain challenging for many corporations in India. This articleseeks to provide an overview of the various sources of financing inIndia, looking at the trends for the last several years as well theoutlook over the next year.
Financing from internal sources is important for largefirms
The Reserve Bank of India (RBI) categorises internal sources offunds as paid-up capital, reserves and surplus, and provisions(which includes dividends). Approximately 40% of corporatefinancing for public and private limited companies comes frominternal sources. Charts 1 and 2 highlight the most recent figures.Delving further into the available data, research has found that forlarge firms involved in either the manufacturing or servicesindustries, internal resources account for 67% and 47% of all fundsrespectively. However, the picture changes significantly for smalland medium enterprises. These firms often do not have significantsavings and internal sources average only 10% of total funds.1 Earlier studies covering the period 1994-2003 also found suggestive
evidence that smaller firms face stronger credit constraints vs. theirlarger counterparts.
2Thus, small and medium firms can be
considered among the most vulnerable to the drying up of externalfinancing sources. We examine these sources more closely in thefollowing sections.
Banking system remains essential
Bank credit generally forms a part of external funding for manycompanies. In public limited companies, bank borrowings accountedfor 32% of external financing and 20% of total financing according tothe 2007-2008 RBI survey of company financing. In private limitedcompanies, bank borrowings accounted for 28% of externalfinancing and 17% of total company financing in the 2007-2008financial year. Chart 3 on the left shows the sector-wide deploymentof bank credit. Some of the constraints on greater bank lending arethe regulatory hurdles, such as the high statutory liquidityrequirement (which forces banks to keep deposits in governmentsecurities) and the priority sector lending requirement (whichmandates some banks to have almost 40% of their adjusted bankcredit directed to priority sectors).
3Thus, many Indian companies
have turned to other sources of external finance. As the Indianeconomy boomed from 2005 through 2007, the growth of domesticbank credit to the commercial sector gradually declined (seechart 4). While several factors account for this trend, it could bepartially attributed to the fact that companies were pursuing other
1Allen et al. (2007).
2Love (2005).
3RBI. Master Circular. Lending to the Priority Sector. July 2009.
Internalsources,36.9%
Externalpaid-upcapital,17.1%
Borro-wings,28.3%
Tradedues &other
liabilities,17.7%
Source: RBI
Financing for public limitedcompanies
2007-2008
1
Internalsources,40.0%
External
paid-upcapital,17.1%
Borro-wings,19.9%
Tradedues &other
liabilities,22.5%
Others,0.5%
Financing for private
2007-2008
Source: RBI
limited companies
2
0%
20%
40%
60%
80%
100%
2 0 0 4 - 0 5
2 0 0 5 - 0 6
2 0 0 6 - 0 7
2 0 0 7 - 0 8
2 0 0 8 - 0 9
Other sectors
Wholesale trade
Medium & Large Industry
Priority sector
Source: RBI
Note: Non-food credit
% of total credit
Sector-wide gross bankcredit
3

8/8/2019 Trends in India Corporate
http://slidepdf.com/reader/full/trends-in-india-corporate 4/12
Current Issues
4 October 27, 2009
sources of financing, particularly in the equity market which wasgrowing significantly during this period. This assertion can bebacked by the evidence that capital funds rose as a percentageshare of total funding during this time.
When Lehman Brothers collapsed in September 2008, there was a
sharp and quick increase in corporate bank credit over the nextmonth as other sources of financing quickly dried up. However,since that point, bank credit to the commercial sector has continuedto fall steeply (see chart 4). Some of this fall can be attributed to aslowdown in demand as companies have had to re-evaluateinvestment and growth plans amidst the global and domesticslowdown and the costs of funding from banks have remained high.On the supply side, despite the loose monetary policy,encouragement from policymakers, and liquidity injections from theRBI, banks have remained reluctant to lend. As they facedprofitability pressures and increased provisioning for non-performingloans, most banks made only moderate cuts to their lending rates.Banks have remained concerned about deteriorating asset quality,
particularly for smaller firms or industries that are seen as havingpoor growth prospects.
There is market optimism that bank lending will bottom out in thenext 1-2 months and begin to pick up again over the next severalquarters. The ongoing rise in banking stocks (see chart 5) highlightsthis sentiment. Banks are likely to look at equity marketperformance, quarterly profits, and macroeconomic indicators whenevaluating which firms or industries are worthy of new credit. Wemaintain the view that as Indian equity markets continue to makegains and there are definitive signs of economic growth, credit to thecorporate sector will begin to increase. The Q3 (calendar year) GDPresults and corporate earnings results will be important to watch as
well as more frequent indicators such as price-equity (P/E) ratios,industrial production, retail sales, etc. In addition, recapitalisation ofpublic-sector banks will give these banks more space to increaselending as well. However, even with the strong turnaround inmarkets and bank recapitalisations over the next year, we think banklending may not return to earlier growth levels for the next severalmonths. In addition, banks could remain industry-selective andchoose low-risk sectors over the next year, particularly as worrieslinger over asset bubbles rising once again in sectors such as realestate.
Domestic equity markets are increasingly popularmethods of financing
India’s domestic equity markets have boomed over the past fiveyears, with market capitalisation increasing from less than USD 300bn to over USD 1 tr during this time frame. The growth in the markethas been fuelled by both domestic and foreign investors. Domesticinvestors have enjoyed a thriving economy in the past five years.Although the majority of households still keep their savings in bondsand fixed deposits, many are increasingly turning towards equityinvestments through mutual funds. Foreign investors such as foreigninstitutional investors (FIIs) and non-resident Indians (NRIs) havealso increased their levels of investment as there has beenliberalisation of investment caps and participation in derivativesmarkets that allows them to hedge risks. At the end of 2008, therewere 1,591 registered foreign institutional investors in India, an
0
5
10
15
20
25
30
35
40
00 01 02 03 04 05 06 07 08 09
Bank credit to thecommercial sector % change yoy
Source: RBI 4
2,500
3,500
4,500
5,500
6,500
7,500
8,500
9,500
10,500
11,500
Jan 09 Apr 09 Jul 09 Oct 09
Source: Bloomberg
Banking stocks on the riseWeighted average of leading bank stocks
5

8/8/2019 Trends in India Corporate
http://slidepdf.com/reader/full/trends-in-india-corporate 5/12
Trends in India's corporate financing
October 27, 2009 5
increase of slightly over 50% since 2006.4
The surge in investorinterest has created large amounts of capital availability for thecorporate sector.
In the primary market, private-sector issuances have beenoutpacing issuances by the public sector for the past several years
(see chart 6). A diverse array of companies from the entertainmentto finance industries has raised capital through the primary market.Banks, financial institutions, construction, and infrastructurecompanies were the most frequent issuers in recent years. Whilethe number of IPOs has declined from the peaks seen in the mid-90s when the markets first began to take off, IPOs in the pastseveral years have been generating ever increasing amounts ofcapital. In 2008, the amount of capital raised averaged close to INR500 crore per IPO vs. a mean IPO size of less than INR 10 crore inthe mid-1990s.5 6 In 2006, India’s IPO market made the list as one of the 10 biggest IPO markets in the world.
7In 2008, the Reliance
Power IPO became the biggest IPO in India’s history. The almostUSD 3 bn offering was oversubscribed by approximately 10 times.
In the secondary market, price-equity (P/E) ratios climbedsignificantly as the market grew. For companies already listed on themarket, this enabled them to gather higher returns on subsequentofferings of shares.
When the global crisis hit from mid-2008, the market felldramatically. Between January 2008 and the Sensex low in March2009, the market declined 60% and P/E ratios dropped over 45%over the same time period. As can be seen from chart 9, much ofthis fall was led by foreign investors exiting the market as concerns
grew over India’s corporate earnings and its general economicoutlook. Anecdotally, it appears many investors chose to either
repatriate their earnings or keep them in “safe” assets such asgovernment bonds. The fall was also exacerbated by domesticinvestors who took money out of the market as job losses mountedand the ongoing market decline began to hurt household wealthlevels. Due to this decline, many companies delayed equity-raising
plans in H2 2008 and H1 2009. India’s 40 IPOs in 2008 generatedless than USD 5 bn, an over 60% drop in the number of deals and a45% decline in funds raised compared with 2007.
8
Between April and July 2009, only five IPOs took place vs. 15 duringthe same period last year. In the first half of this year, only 6companies filed draft offer documents with the Securities and
4
Ministry of Finance.5SEBI Handbook of Statistics.
6A crore is equivalent to 10 million rupees.
7www.livemint.com
8Ernst & Young. Global IPO trends report 2009.
0
20
40
60
80
100
2 0 0 1 / 0 2
2 0 0 2 / 0 3
2 0 0 3 / 0 4
2 0 0 4 / 0 5
2 0 0 5 / 0 6
2 0 0 6 / 0 7
2 0 0 7 / 0 8
Private sector Public sector
Source: SEBI
Sector-wise mobilisationon primary market% of total market
6
0
5,000
10,000
15,000
20,000
25,000
0
5
10
15
20
25
30
Jan 08 Jul 08 Jan 09 Jul 09
P/E ratio (left)
Sensex (right)
Markets hit after Lehman
Source: Bloomberg 8
-4
-2
0
2
4
6
8
7,000
9,000
11,000
13,000
15,000
17,000
19,000
21,000
06 07 08 09
FII Investment, USD bn (right)
SENSEX index (left)
Sources: Bloomberg, SEBI
FII flows drive market
9
Resource mobilisation through primary market
Rs. Crore
2005 2006 2007 2008P
Debt 66 389 594 0
Equity 30.325 32.672 58.722 49.485
IPOs 9.918 24.779 33.912 18.393
Private placement 83.812 1,17,407 1,84,855 1,75,061
P: Provisio nal
Source: M inistry of Finance Economic Survey 7
8/8/2019 Trends in India Corporate
http://slidepdf.com/reader/full/trends-in-india-corporate 6/12
Current Issues
6 October 27, 2009
Exchange Board of India (SEBI) for any public issues vs. over 40 inthe same period last year.
The market has recovered from earlier lows, and FIIs’ netinvestment in equity markets in 2009 turned positive beginning inApril. The Sensex has risen over 75% from the beginning of the year
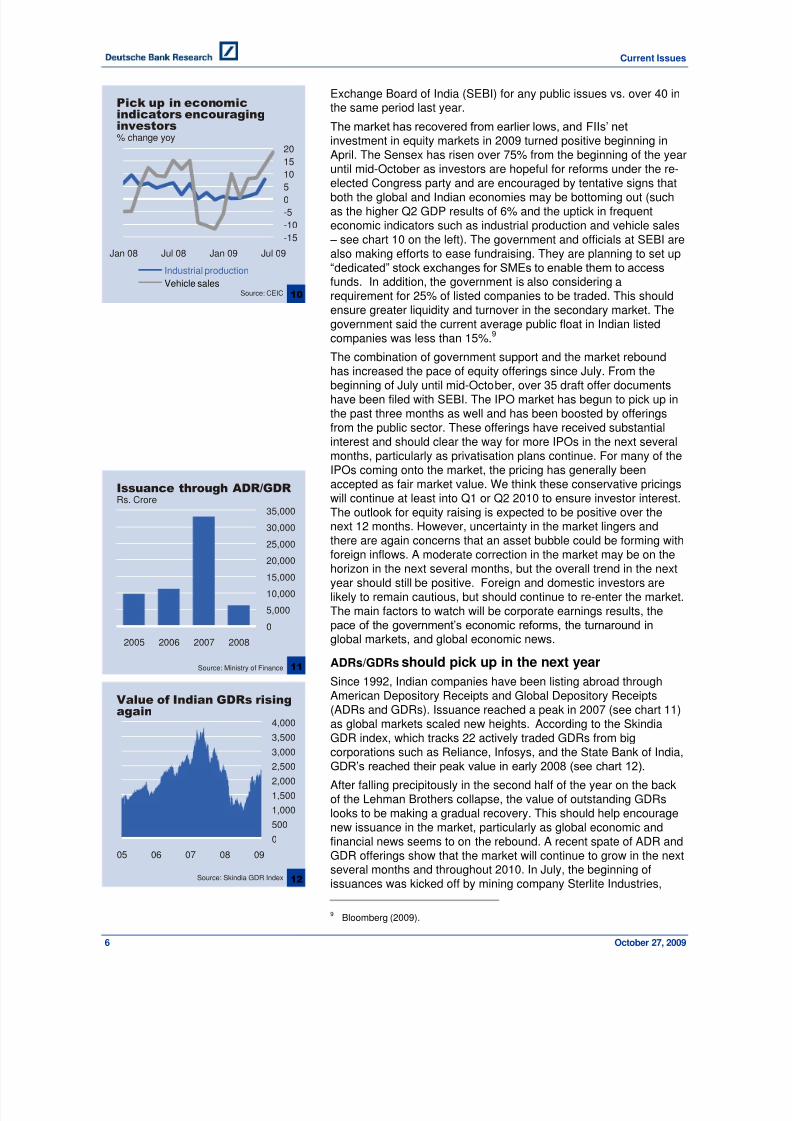
until mid-October as investors are hopeful for reforms under the re-elected Congress party and are encouraged by tentative signs thatboth the global and Indian economies may be bottoming out (suchas the higher Q2 GDP results of 6% and the uptick in frequenteconomic indicators such as industrial production and vehicle sales
– see chart 10 on the left). The government and officials at SEBI arealso making efforts to ease fundraising. They are planning to set up
“dedicated” stock exchanges for SMEs to enable them to accessfunds. In addition, the government is also considering arequirement for 25% of listed companies to be traded. This shouldensure greater liquidity and turnover in the secondary market. Thegovernment said the current average public float in Indian listedcompanies was less than 15%.
9
The combination of government support and the market reboundhas increased the pace of equity offerings since July. From thebeginning of July until mid-October, over 35 draft offer documentshave been filed with SEBI. The IPO market has begun to pick up inthe past three months as well and has been boosted by offeringsfrom the public sector. These offerings have received substantialinterest and should clear the way for more IPOs in the next severalmonths, particularly as privatisation plans continue. For many of theIPOs coming onto the market, the pricing has generally beenaccepted as fair market value. We think these conservative pricingswill continue at least into Q1 or Q2 2010 to ensure investor interest.The outlook for equity raising is expected to be positive over the
next 12 months. However, uncertainty in the market lingers andthere are again concerns that an asset bubble could be forming withforeign inflows. A moderate correction in the market may be on thehorizon in the next several months, but the overall trend in the nextyear should still be positive. Foreign and domestic investors arelikely to remain cautious, but should continue to re-enter the market.The main factors to watch will be corporate earnings results, the
pace of the government’s economic reforms, the turnaround inglobal markets, and global economic news.
ADRs/GDRs should pick up in the next year
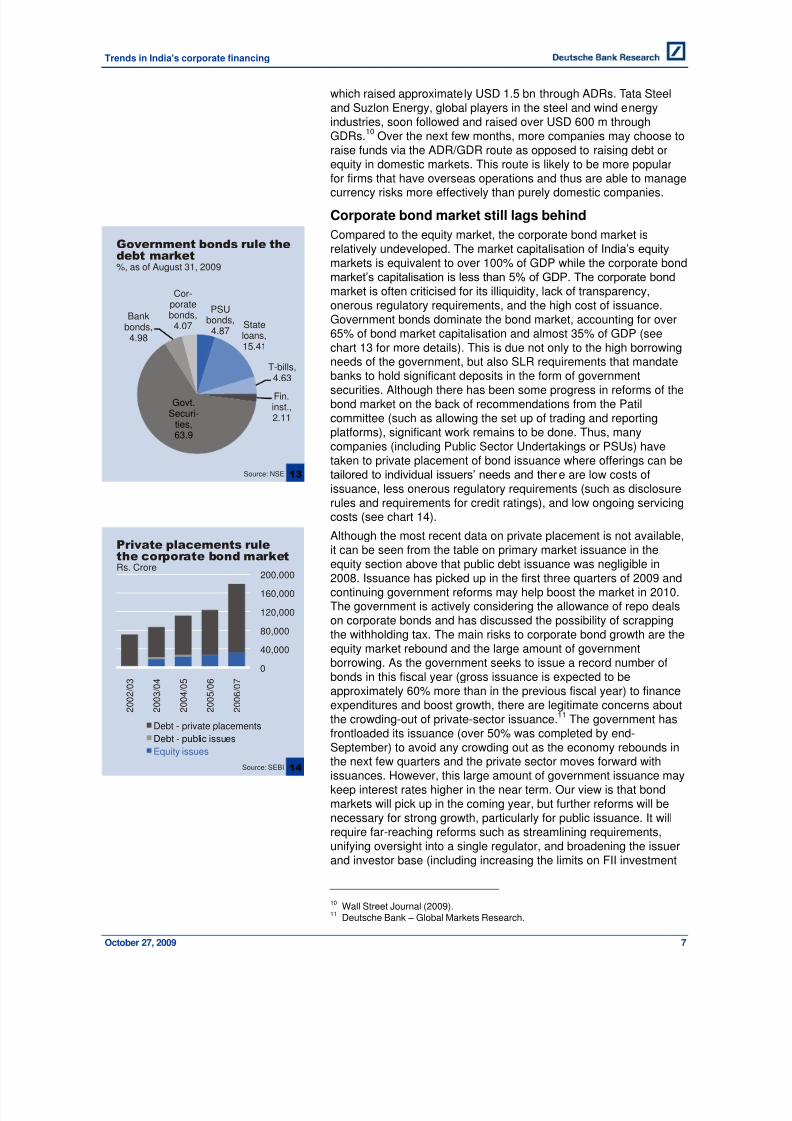
Since 1992, Indian companies have been listing abroad through
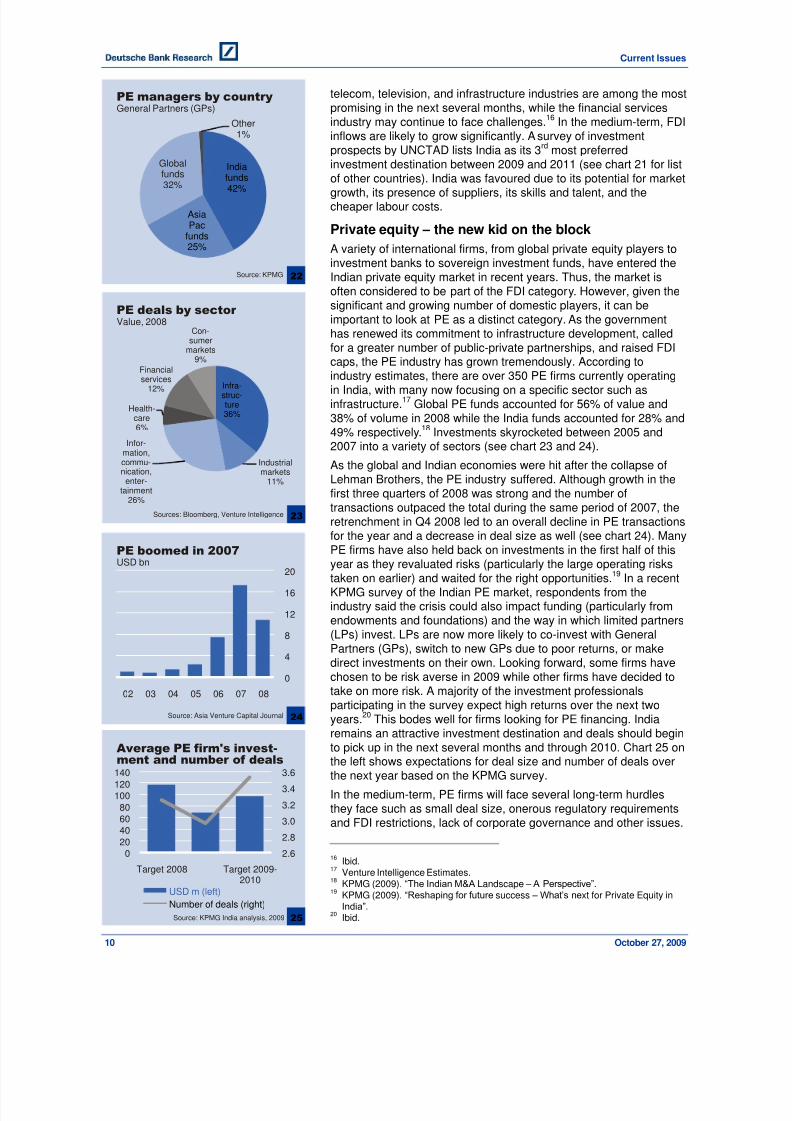
American Depository Receipts and Global Depository Receipts(ADRs and GDRs). Issuance reached a peak in 2007 (see chart 11)as global markets scaled new heights. According to the SkindiaGDR index, which tracks 22 actively traded GDRs from bigcorporations such as Reliance, Infosys, and the State Bank of India,
GDR’s reached their peak value in early 2008 (see chart 12).
After falling precipitously in the second half of the year on the backof the Lehman Brothers collapse, the value of outstanding GDRslooks to be making a gradual recovery. This should help encouragenew issuance in the market, particularly as global economic andfinancial news seems to on the rebound. A recent spate of ADR andGDR offerings show that the market will continue to grow in the next
several months and throughout 2010. In July, the beginning ofissuances was kicked off by mining company Sterlite Industries,
9Bloomberg (2009).
-15
-10
-5
0
510
15
20
Jan 08 Jul 08 Jan 09 Jul 09
Industrial production
Vehicle sales
Pick up in economicindicators encouraginginvestors% change yoy
Source: CEIC 10
0
5,000
10,000
15,000
20,000
25,000
30,000
35,000
2005 2006 2007 2008
Issuance through ADR/GDRRs. Crore
Source: Ministry of Finance 11
0
500
1,000
1,500
2,000
2,500
3,000
3,500
4,000
05 06 07 08 09
Value of Indian GDRs risingagain
Source: Skindia GDR Index 12
8/8/2019 Trends in India Corporate
http://slidepdf.com/reader/full/trends-in-india-corporate 7/12
Trends in India's corporate financing
October 27, 2009 7
which raised approximately USD 1.5 bn through ADRs. Tata Steeland Suzlon Energy, global players in the steel and wind energyindustries, soon followed and raised over USD 600 m throughGDRs.
10Over the next few months, more companies may choose to
raise funds via the ADR/GDR route as opposed to raising debt orequity in domestic markets. This route is likely to be more popular
for firms that have overseas operations and thus are able to managecurrency risks more effectively than purely domestic companies.
Corporate bond market still lags behind
Compared to the equity market, the corporate bond market isrelatively undeveloped. The market capitalisation of India’s equitymarkets is equivalent to over 100% of GDP while the corporate bond
market’s capitalisation is less than 5% of GDP. The corporate bondmarket is often criticised for its illiquidity, lack of transparency,onerous regulatory requirements, and the high cost of issuance.Government bonds dominate the bond market, accounting for over65% of bond market capitalisation and almost 35% of GDP (see
chart 13 for more details). This is due not only to the high borrowingneeds of the government, but also SLR requirements that mandatebanks to hold significant deposits in the form of governmentsecurities. Although there has been some progress in reforms of thebond market on the back of recommendations from the Patilcommittee (such as allowing the set up of trading and reportingplatforms), significant work remains to be done. Thus, manycompanies (including Public Sector Undertakings or PSUs) havetaken to private placement of bond issuance where offerings can be
tailored to individual issuers’ needs and ther e are low costs ofissuance, less onerous regulatory requirements (such as disclosurerules and requirements for credit ratings), and low ongoing servicingcosts (see chart 14).
Although the most recent data on private placement is not available,it can be seen from the table on primary market issuance in theequity section above that public debt issuance was negligible in2008. Issuance has picked up in the first three quarters of 2009 andcontinuing government reforms may help boost the market in 2010.The government is actively considering the allowance of repo dealson corporate bonds and has discussed the possibility of scrappingthe withholding tax. The main risks to corporate bond growth are theequity market rebound and the large amount of governmentborrowing. As the government seeks to issue a record number ofbonds in this fiscal year (gross issuance is expected to beapproximately 60% more than in the previous fiscal year) to financeexpenditures and boost growth, there are legitimate concerns aboutthe crowding-out of private-sector issuance.
11The government has
frontloaded its issuance (over 50% was completed by end-September) to avoid any crowding out as the economy rebounds inthe next few quarters and the private sector moves forward withissuances. However, this large amount of government issuance maykeep interest rates higher in the near term. Our view is that bondmarkets will pick up in the coming year, but further reforms will benecessary for strong growth, particularly for public issuance. It willrequire far-reaching reforms such as streamlining requirements,unifying oversight into a single regulator, and broadening the issuerand investor base (including increasing the limits on FII investment
10Wall Street Journal (2009).
11Deutsche Bank – Global Markets Research.
PSUbonds,4.87
Stateloans,
15.41
T-bills,4.63
Fin.inst.,2.11
Govt.Securi-
ties,63.9
Bankbonds,4.98
Cor-poratebonds,4.07
Source: NSE
Government bonds rule the
%, as of August 31, 2009debt market
13
0
40,000
80,000
120,000
160,000
200,000
2 0 0
2 / 0 3
2 0 0
3 / 0 4
2 0 0
4 / 0 5
2 0 0
5 / 0 6
2 0 0
6 / 0 7
Debt - private placements
Debt - public issues
Equity issues
Source: SEBI
Private placements rulethe corporate bond marketRs. Crore
14

8/8/2019 Trends in India Corporate
http://slidepdf.com/reader/full/trends-in-india-corporate 8/12
Current Issues
8 October 27, 2009
further) before the market can truly compete with equity markets asa source of financing.
External commercial borrowings may remain low in2009, but should gain momentum in the months ahead
External commercial borrowings (or ECBs) are commercial loans
taken from non-resident lenders. They have been an importantsource of financing for Indian corporations beyond the capitalmarkets as companies can take advantage of lower interest ratesabroad and often receive loans with longer maturities. Borrowingscan be undertaken either under the automatic or approval route.Total outstanding ECB debt almost trebled between 2004 and 2008,
rising to USD 62 bn or 27.8% of India’s total external debt by theend of fiscal year 2007/2008 (see chart 15).
12The growth has been
fuelled not only by increasing investment needs and availableforeign capital, but also by the gradual relaxing of regulations.Ceilings for both ECB debt levels and for interest rates related to thedebt were increased several times over the past several years and
sectoral restrictions on ECB use were relaxed.Despite this, fundraising through the ECB route was hit significantlyby the global crisis and the slowdown in international liquidity. Aslending rates spiked, borrowings declined sharply. At the end offiscal year 2008/2009 in March, the total amount of outstandingECBs had grown less than 1% over the previous year. This wasdespite liberalisation efforts that took place throughout the year.After accounting for interest rate and currency risks, it was often stillcheaper to borrow in domestic markets – either through corporatebonds or through domestic bank lending.
However, the rise in external borrowings in June and July maysignal a rebound on the horizon (see chart 16). This may be due to
the decline in the LIBOR (which many investors attach a spreadpremium to in order to determine lending rates) and the 5Y CDSspreads of major Indian corporations such as ICICI which hadspiked during H2 2008 (see chart 17). Despite the positive figures inthe recent data, there is still some cautiousness on the prospects forECBs. Bankers have indicated that current deals are mostly bilateraland there are very few syndicated loans that have involved multiplelenders. This trend of bilateral lending could continue over the nextseveral months. In addition, there is inherent investor cautiousnesspost-crisis, as well as increasingly strict requirements that domestic
governments have placed on foreign banks’ capital levels andprovisions that detract from funds available for lending. A recent
Institute of International Finance report on emerging market capitalflows highlighted that access to external financing for many smallerand lower-rated companies remains severely curtailed.
13The
government could also intervene if foreign inflows became toostrong and put pressure on the rupee. If so, then officials couldtighten restrictions on ECBs once again – as in 2007. We areoptimistic that ECBs will continue to gradually grow over the nextseveral months, but it may be easier for larger firms to obtainfinancing through this route than smaller, untested firms.
12RBI. India’s External Debt as at the end of March 2009.
13IIF (2009).
0
10
20
30
40
50
60
70
2 0 0 0 / 0 1
2 0 0 1 / 0 2
2 0 0 2 / 0 3
2 0 0 3 / 0 4
2 0 0 4 / 0 5
2 0 0 5 / 0 6
2 0 0 6 / 0 7
2 0 0 7 / 0 8
2 0 0 8 / 0 9
Outstanding ECB debtUSD bn
Source: RBI 15
0.0
0.5
1.0
1.5
2.0
2.5
3.0
Sep 08 Dec 08 Mar 09 Jun 09
New external borrowings
USD bn
Source: RBI
in June and July
16
0
1
2
3
4
5
6
0200400600800
1,0001,2001,4001,6001,800
Jan 08 Jul 08 Jan 09 Jul 09
ICICI 5Y CDS (left)
3M LIBOR (right)
Source: Bloomberg
Rates and CDS spreadshave declined
17

8/8/2019 Trends in India Corporate
http://slidepdf.com/reader/full/trends-in-india-corporate 9/12
Trends in India's corporate financing
October 27, 2009 9
Foreign direct investment holds strong potential in thenext year
Foreign direct investment in India has increased significantly in thepast several years as regulations have been streamlined andcorporate growth in India has taken off. Foreign direct investment
ceilings have gradually been increased in various sectors over thepast five years. In the past year alone, the mining, petroleum, civilaviation and several other industries have had their respective FDIceilings raised. In addition to increasing these caps, the authoritieshave also sought to streamline and clarify regulations (i.e. ondownstream investments). Between March 2007 and March 2009,total direct investment liabilities in India grew by a factor of 1.6, fromUSD 77 bn to almost USD 125 bn.
14According to data from the
Department of Industrial Policy and Promotion (DIPP), the majorityof the inflows are from Singapore, the US, and the UK. A largenumber of investments also come through Mauritius given theadvantages of the Indo-Mauritian tax treaty. The services sector(both financial and non-financial), computer, real estate, and
telecom sectors have traditionally received the highest amount ofFDI in recent years (see charts 18 and 19 on the left for moredetails).
The global crisis, muted earnings results for many Indiancorporations, and the Mumbai terrorist attacks in November 2008drove down investment in the past several quarters. In addition, theSatyam accounting incident in January 2009 increased risk aversionas well. Although data from different sources vary slightly (givendifferent definitions), they all show the impact from the crisis. Data
from India’s DIPP for the first 6 months of this year show that inflowsare approximately 40% lower than the same period last year.According to UNCTAD data (see in chart 20), FDI flows for H1 2009
vs. H1 2008 are down approximately 55%. Dealogic data indicatesthat inbound cross-border M&A activity fell 27% yoy in H1 2009 aswell. Deal cycles for M&A transactions have also increased giventhe mismatch of valuation expectations between buyer and sellerand the greater levels of due diligence being carried out in theaftermath of the Satyam incident.
15
FDI flows have begun to pick up again since July (over 50% yoygrowth in both July and August). We anticipate FDI inflows tocontinue to grow (though with some fluctuation and perhaps not atthese very high levels) throughout 2009 and 2010 as there is astronger rebound in the Indian economy and the turnaround inglobal markets pushes foreign investors to look for opportunities
once again. Also, companies that have been hard-hit by the crisismay strip non-essential segments of their business and offer themfor sale to foreign investors. The next several months may seesmaller deal sizes as investors look for niche opportunities thatmaximize potential and minimize risk. Although the government isworking to reduce administrative bottlenecks, FDI restrictions inlucrative sectors such as insurance and retail remain in place.Swedish furniture giant IKEA dropped its USD 1 bn plan for retailoutlets in India earlier this summer due to FDI restrictions of 51% insingle brand retail. A removal of these restrictions (unlikely in theshort-term) would create a large jump of inflows. According to arecent KPMG report on the outlook of the mergers and acquisitions
(M&A) industry (including cross-border M&A), the pharmaceuticals,
14RBI – International Investment Position of India at end the end of March 2009.
15KPMG (2009). “The Indian M&A Landscape – A Perspective”.
Mauri-tius,44%
Singa-pore,9%
USA,7%
Nether-lands,
4%
Japan,3%
UK, 6%
Others,27%
FDI inflows by country
Source: DIPP
% of total
18
Ser-vices
sector,23%
Com-puter
software/ hard-ware,10%
Tele-com, 8%
Cons-truction,
6%
Realestate,
7%Auto-
mobile,4%
Power,4%
Others,38%
Source: DIPP
FDI inflows by sector % of total
19
0
2
4
6
8
10
12
14
16
Q12008
Q22008
Q32008
Q42008
Q12009
Source: UNCTAD World Investment Report 2009
FDI inflows hit by crisisUSD bn
20
0 20 40 60
China
Unites States
India
Brazil
Russia
UK
Source: UNCTAD
India is top investmentchoice% of respondents that selected country aspreferred investment destination
21
8/8/2019 Trends in India Corporate
http://slidepdf.com/reader/full/trends-in-india-corporate 10/12
Current Issues
10 October 27, 2009
telecom, television, and infrastructure industries are among the mostpromising in the next several months, while the financial servicesindustry may continue to face challenges.
16In the medium-term, FDI
inflows are likely to grow significantly. A survey of investmentprospects by UNCTAD lists India as its 3
rdmost preferred
investment destination between 2009 and 2011 (see chart 21 for list
of other countries). India was favoured due to its potential for marketgrowth, its presence of suppliers, its skills and talent, and thecheaper labour costs.
Private equity – the new kid on the block
A variety of international firms, from global private equity players toinvestment banks to sovereign investment funds, have entered theIndian private equity market in recent years. Thus, the market isoften considered to be part of the FDI category. However, given thesignificant and growing number of domestic players, it can beimportant to look at PE as a distinct category. As the governmenthas renewed its commitment to infrastructure development, called
for a greater number of public-private partnerships, and raised FDIcaps, the PE industry has grown tremendously. According toindustry estimates, there are over 350 PE firms currently operatingin India, with many now focusing on a specific sector such asinfrastructure.
17Global PE funds accounted for 56% of value and
38% of volume in 2008 while the India funds accounted for 28% and49% respectively.
18Investments skyrocketed between 2005 and
2007 into a variety of sectors (see chart 23 and 24).
As the global and Indian economies were hit after the collapse ofLehman Brothers, the PE industry suffered. Although growth in thefirst three quarters of 2008 was strong and the number oftransactions outpaced the total during the same period of 2007, the
retrenchment in Q4 2008 led to an overall decline in PE transactionsfor the year and a decrease in deal size as well (see chart 24). ManyPE firms have also held back on investments in the first half of thisyear as they revaluated risks (particularly the large operating riskstaken on earlier) and waited for the right opportunities.
19In a recent
KPMG survey of the Indian PE market, respondents from theindustry said the crisis could also impact funding (particularly fromendowments and foundations) and the way in which limited partners(LPs) invest. LPs are now more likely to co-invest with GeneralPartners (GPs), switch to new GPs due to poor returns, or makedirect investments on their own. Looking forward, some firms havechosen to be risk averse in 2009 while other firms have decided totake on more risk. A majority of the investment professionalsparticipating in the survey expect high returns over the next twoyears.
20This bodes well for firms looking for PE financing. India
remains an attractive investment destination and deals should beginto pick up in the next several months and through 2010. Chart 25 onthe left shows expectations for deal size and number of deals overthe next year based on the KPMG survey.
In the medium-term, PE firms will face several long-term hurdlesthey face such as small deal size, onerous regulatory requirementsand FDI restrictions, lack of corporate governance and other issues.
16Ibid.
17
Venture Intelligence Estimates.18KPMG (2009). “The Indian M&A Landscape – A Perspective”.
19KPMG (2009). “Reshaping for future success – What’s next for Private Equity inIndia”.
20Ibid.
India
funds42%
AsiaPac
funds25%
Global
funds32%
Other1%
Source: KPMG
PE managers by countryGeneral Partners (GPs)
22
Infra-struc-ture36%
Industrialmarkets
11%
Infor-mation,commu-nication,enter-
tainment26%
Health-care6%
Financialservices
12%
Con-sumer
markets9%
PE deals by sector Value, 2008
Sources: Bloomberg, Venture Intelligence 23
0
4
8
12
16
20
02 03 04 05 06 07 08
PE boomed in 2007
Source: Asia Venture Capital Journal
USD bn
24
2.6
2.8
3.0
3.2
3.4
3.6
0
20
40
60
80
100
120
140
Target 2008 Target 2009-2010
USD m (left)
Number of deals (right)
Source: KPMG India analysis, 2009
Average PE firm's invest-ment and number of deals
25

8/8/2019 Trends in India Corporate
http://slidepdf.com/reader/full/trends-in-india-corporate 11/12
Trends in India's corporate financing
October 27, 2009 11
These challenges will need to be addressed in the medium-term toensure that PE can continue to grow as a source of corporatefinancing.
Conclusion
The various sources of corporate financing highlighted in this papershow great potential for augmenting corporate investment goingforward. Although many of these financing streams have beensuffering from the global crisis, we are beginning to see aresurgence of capital flows. The environment will remain challengingin the rest of 2009, but we believe that flows will become strongerover the next several months and throughout 2010. The pace of theturnaround will depend on market reforms and the trajectory in boththe global and the Indian economy. Domestic and global equitymarkets, external commercial borrowings, and foreign directinvestment hold the most promise. Once financing picks up pace,
investment levels will rise again and can help sustain highereconomic growth in India.
Rachna Saxena (+44 207 547-6258, [email protected])

8/8/2019 Trends in India Corporate
http://slidepdf.com/reader/full/trends-in-india-corporate 12/12
Current Issues
© Copyright 2009. Deutsche Bank AG, DB Research, D-60262 Frankfurt am Main, Germany. All rights reserved. When quoting please cite “Deutsche BankResearch”.The above information does not constitute the provision of investment, legal or tax advice. Any views expressed reflect the current views of the author, which donot necessarily correspond to the opinions of Deutsche Bank AG or its affiliates. Opinions expressed may change without notice. Opinions expressed may differfrom views set out in other documents, including research, published by Deutsche Bank. The above information is provided for informational purposes only andwithout any obligation, whether contractual or otherwise. No warranty or representation is made as to the correctness, completeness and accuracy of theinformation given or the assessments made.In Germany this information is approved and/or communicated by Deutsche Bank AG Frankfurt, authorised by Bundesanstalt für Finanzdienstleistungsaufsicht.In the United Kingdom this information is approved and/or communicated by Deutsche Bank AG London, a member of the London Stock Exchange regulated bythe Financial Services Authority for the conduct of investment business in the UK. This information is distributed in Hong Kong by Deutsche Bank AG, HongKong Branch, in Korea by Deutsche Securities Korea Co. and in Singapore by Deutsche Bank AG, Singapore Branch. In Japan this information is approvedand/or distributed by Deutsche Securities Limited, Tokyo Branch. In Australia, retail clients should obtain a copy of a Product Disclosure Statement (PDS)relating to any financial product referred to in this report and consider the PDS before making any decision about whether to acquire the product.Printed by: HST Offsetdruck Schadt & Tetzlaff GbR, Dieburg
ISSN Print: 1612-314X / ISSN Internet and e-mail: 1612-3158
Bibliography
Allen, Franklin, Rajesh Chakrabarti, Sankar De, Jun Qian, andMeijun Qian (2007). “Financing firms in India.” Wharton Financial
Institutions Center.“Capital Flows to Emerging Market Economies.” October 2009.
Institute of International Finance.
Handbook of Statistics on the Indian Securities Market 2008.November 2008. Securities and Exchange Board of India.
“India among 10 largest IPO markets in 2006.” June 2007. Livemint.
“India policy may trigger $39 billion of share sales.” August 14,2009. Bloomberg.
International Investment Position of India (IIP) as at the end ofMarch 2009. July 10, 2009. Reserve Bank of India.
“Investment exits or sell-offs by PE firms declines in 2009.” April 13,2009. Economic Times. Online Edition.
Love, Inessa and Maria Soledad Martinez Peria (2005). “Firmfinancing in India: recent trends and factors.” World Bank PolicyResearch Working Paper.
Monthly Debt Update. June 2008. National Stock Exchange of India.
Reserve Bank of India – Bulletin. July 2009. Reserve Bank of India.
“Reshaping for future success – What’s next for Private Equity inIndia” (2009). KPMG.
“Shifting landscape – Are you ready?” Global IPO trends report2009. Ernst & Young.
“Tata Steel, Suzlon raise over $600 mn through GDR sale.” July 22, 2009. Wall Street Journal.
“The Indian M&A Landscape: A Perspective.” (2009). KPMG.
Other statistics from Bloomberg, the Ministry of Finance, RBI, SEBI,NSE, BSE, IMF, Central Statistical Organization, and VentureIntelligence.