Embed Size (px)
Citation preview

International Journal of Advanced Research in ISSN: 2278-6236
Management and Social Sciences Impact Factor: 7.065
Vol. 7 | No. 8 | August 2018 www.garph.co.uk IJARMSS | 66
TRENDS IN NON-PERFORMING ASSETS OF PUBLIC SECTOR BANKS
Dr. K. Alamelu, Professor, Department of Bank Management, Alagappa University, Karaikudi
Salini R Chandran, Ph.D. Research Scholar, Department of Bank Management, Alagappa
University, Karaikudi
Abstract: The present study is carried out with the major objective of analysing the trends in
NPAs of Public sector banks by using secondary data collected from website of Reserve Bank
of India under the reports on Trends and Progress of Banking in India for a period of 16
years. The collected data were analysed using statistical tools such as percentages, growth
rates, correlation and regression. The analysis found that PSBs had witnessed marginal fall in
the share of standard assets by 0.6 per cent, substandard assets by 0.1 per cent and loss
assets by 0.4 per cent. NPA of PSBs had increased by a whopping 12.11 times during 2002-
17. PSBs share in total NPA of the system had increased by 6.9 per cent during the period of
study. Among all the bank groups PSBs alone had recorded a rise in the GNPA ratio during
the study period. In order to ascertain the extent of relationship between gross NPAs of
different bank groups, Karl Pearson’s co-efficient of correlation is calculated. It is found that
a positive correlation exists between the Gross NPAs of PSBs and SCBs and the extent of
relationships is 0.984. The regression analysis points out that NPA of SBI group and other
Nationalised Banks have a significant positive impact on the level of gross NPA of all banks in
India.
Keywords: NPA, Loan Assets, Advance and Gross NPA, Public Sector Banks
INTRODUCTION
A bank is an institution which deals in money and credit. Thus, bank is an intermediary
which handles other people's money both for their advantage and to its own profit. But
bank is not merely a trader in money but also an important manufacturer of money. In
other words, a bank is a factory of credit. The primary function of every bank is to accept
deposits and lending money. Among the primary functions, lending of money to public
creates lots of risk to the banker. The default in repayment of money by the customer leads
to the formation of Non- Performing Assets (NPA) in Banks. A Non-Performing Asset (NPA) is
a loan or advance for which the principal or interest payment remained overdue for a period
of ninety days. Based on the period of NPA, it is classified as substandard assets, doubtful
International Journal of Advanced Research in ISSN: 2278-6236
Management and Social Sciences Impact Factor: 7.065
Vol. 7 | No. 8 | August 2018 www.garph.co.uk IJARMSS | 67
assets and loss assets. The level of NPAs is an indicator of the efficiency of banker’s credit
risk management and efficiency of resource allocation to productive sectors. The Reserve
Bank of India, in its annual reports related to banks pointed out that the NPAs still pose a
significant threat to the banking sector. An NPA account not only reduces profitability of
banks by provisioning in the profit and loss account, but their carrying cost is also increased
which results in excess and avoidable management attention. Apart from this, a high level of
NPA also puts strain on a bank’s net worth because banks are under pressure to maintain a
desired level of Capital Adequacy and in the absence of comfortable profit level. Banks
eventually look towards their internal financial strength to fulfil the norms thereby slowly
eroding the net worth. Hence there need more concentration on NPAs of Banks in order to
improve its efficiency in operation and also to increase its profitability.
STATEMENT OF THE PROBLEM
Credit creation is an important function of commercial banks. The credits are created from
the deposits made by the customers of banks. But the risk involved in the delivery of credit
is the non-repayment of money by customers. The practice o non repayment leads to the
formation of NPA in the banks. NPA affect the operational efficiency, there by create an
adverse impact on the profitability, liquidity and solvency of banks (Michael, et al
2006)1.Consequences of NPA are manifold such as reduction in interest income, increased
provisions, strained profitability, inability to meet rising cost, stresses on Net Interest
Margin (NIM) bringing down competitiveness, gradual depletion of capital and obstacles in
capital augmentation (Batra, 2003)2. The problems of asset quality could be contagious
because the down side impact of loan losses can quickly spread to earnings, capital and
liquidity. They will be insidious too since it will be difficult to recognize the problem
instantly. Further these problems will make the weak banks as prey, which are more easily
assailable with a lean capital base to absorb unexpected losses3.
Improper management of NPA may lead to bank failures. Empirical evidence denotes that
globally bank failures and deteriorating asset quality of banks are inter linked (Chijorgia,
2000 and Dash, et al, 2010)4.. As a consequence, banking crises may follow, which may bloat
as financial crises. In other words though financial crises tend to arise primarily due to poor
macroeconomic fundamentals, decline in asset quality may be a vital cause (Bovio and Love,
2002)5. The issue assumed much significance after the emergence of the Sub Prime Crisis of

International Journal of Advanced Research in ISSN: 2278-6236
Management and Social Sciences Impact Factor: 7.065
Vol. 7 | No. 8 | August 2018 www.garph.co.uk IJARMSS | 68
2008, marked by the failure of reputed banks in USA and the subsequent bail outs. In the
Indian context too, empirical evidence points out that asset quality is a major determinant
of credit, apart from deposits and rate of interest (RBI, RCF, 2006-08)6.
Banks are playing a stellar role in the Indian financial system with a market share 63 per
cent of total financial assets in the economy (D.Subbaro 2013)7 . In the post reform period,
the credit allocation process of banks has been changed much, with greater role for market
forces as against micro management of credit in earlier years. Profile of
borrowers/products of credit and pricing of credit have also been transformed much. With
more freedom in operations and entry of new players both from the banking and non
banking segments, competitiveness of Indian banks have improved a lot.
In order to keep a close watch on the financial health of the banks and to identify the
problems if any at an early stage, the RBI launched a Structured Intervention System called
as Prompt Corrective Action (PCA) in 2003. It focused on three indicators viz., Capital to Risk
Assets Ratio (Capital adequacy) Net NPA to Net Advances (Asset quality) and Return on
Assets (Profitability). An analysis of PCA exercises conducted by the RBI reveals that
Capital to Risk Asset Ratio of Banks rose to 12.8 per cent in 2005 from 10.05 in 1997.
From 0.67 per cent, the return on assets increased to 0.91per cent during 1997-
2005.
Asset quality had improved as the Net NPA ratio had fallen from 8.1 per cent in 1997
to 2 per cent in 2005 (Ghosh, Arpita)8.
The improvement in performance continued till the global financial crisis of 2008 with the
capital adequacy ratio, return on assets and Net NPA ratio improving to 13 per cent, 1 per
cent, and 1.01 per cent respectively.
In the period immediately following the global financial crises, Indian banks exhibited
remarkable resilience as against the serious impairment in the asset quality suffered by
banks in advanced and emerging economies (RBI, 2011-12)9 But in recent years, particularly
since 2012, asset quality of Indian Bank is worser than its counter parts in other countries as
put forth by Table. 1
Financial Stability Reports of RBI released during December 2011 and 2013 reported that
risk dimensions of all Banks Stability Indicators had shown continuous vulnerabilities in the
International Journal of Advanced Research in ISSN: 2278-6236
Management and Social Sciences Impact Factor: 7.065
Vol. 7 | No. 8 | August 2018 www.garph.co.uk IJARMSS | 69
aftermath of the urgent need to address the problem of rising NPAs; the daunting task being
resolving the problems arising out of billowing NPA of PSBs.
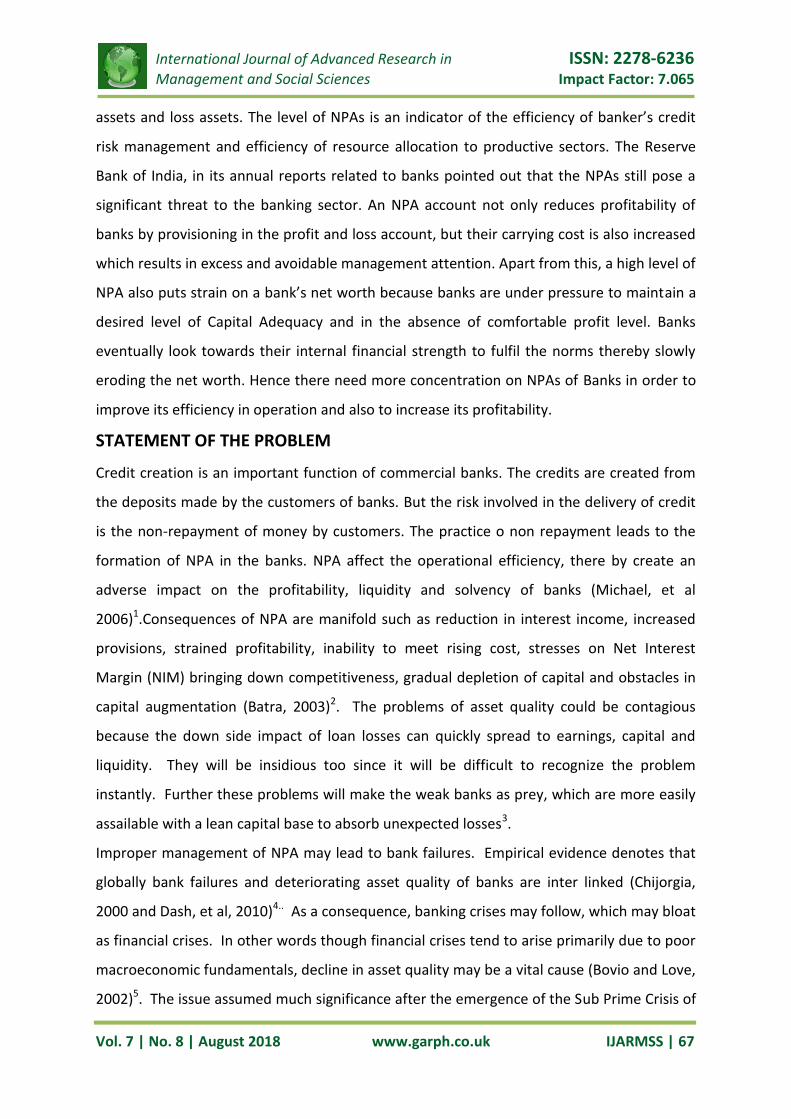
The problems of deteriorating asset quality, especially of PSBs have attracted lot of media
attention too. Moody’s Investors service downgraded its outlook on the financial
credentials of SBI, the market leader of the Sector from stable to Negative (Economic times
2013)10
Table 1 Ratio of Bank Non-Performing Loans to Total Loans (%)
Country 2010 2011 2012 2013 2014 2015
Advanced Economies
Australia 2.1 2.0 1.8 1.5 1.1 1.0
Canada 1.2 0.8 0.7 0.6 0.5 0.5
France 3.8 4.3 4.3 4.5 4.2 4.0
Germany 3.2 3.0 2.9 2.7 2.3 -
Greece 9.1 14.4 23.3 31.9 33.8 34.7
Italy 10.0 11.7 13.7 16.5 18.0 18.0
Japan 2.5 2.4 2.4 2.3 1.9 1.6
Spain 4.7 6.0 7.5 9.4 8.5 6.3
United Kingdom 4.0 4.0 3.6 3.1 1.8 1.4
United States 4.4 3.8 3.3 2.5 1.9 1.5
Emerging and Developing Economies
Brazil 3.1 3.5 3.4 2.9 2.9 3.3
China 1.1 1.0 1.0 1.0 1.1 1.5
India 2.4 2.7 3.4 4.0 4.3 5.9
Russia 8.2 6.6 6.0 6.0 6.7 8.3
South Africa 5.8 4.7 4.0 3.6 3.2 3.1
Source: Financial Stability Tables, April 2016 Database, IMF
Higher NPA level of PSBs have also made its deposits and bonds as ineligible investments
not fulfilling the criteria for safety as per the guidelines of Employers’ Provident Fund
Organization (EPFO). As a result, the PSBs had lost an opportunity of funds inflow from
EPFO to the tune of Rs. 50,000/- crore.
Hence the present study focus on the “Trends in Non Performing Assets of Public Sector
Banks”
OBJECTIVES OF THE STUDY
To identify the trends in NPA level of Public Sector Banks
To compare the trend in the NPA of PSBs with that of its counterparts
To analyse the composition of loan assets of PSBs.

International Journal of Advanced Research in ISSN: 2278-6236
Management and Social Sciences Impact Factor: 7.065
Vol. 7 | No. 8 | August 2018 www.garph.co.uk IJARMSS | 70
METHODOLOGY
The study is based on secondary data collected from the website of Reserve Bank of India
under report on Trends and Progress of Banking in India for a period of 16 years from 2002
to 2017. The collected data are analysed using statistical tools such as percentages, growth
rates, correlation and regression.
DATA INTERPRETATION AND DISCUSSION
This part of the study deals with discussion of results and its interpretation.
Gross NPA of PSBs during 2002-2017
Gross non-performing assets are a term used by financial institutions to refer to the sum of
all the unpaid loans which are classified as non-performing loans. The gross NPA includes
sub standard assets, doubtful assets and loss assets. The following Table deals with the
Gross NPA of Public Sector Banks from 2002 to 2017.
Table 2 Gross NPA of PSBs
Year Gross NPA (Amount
In Rs. billion)
Incremental Gross NPA
Growth rate (in per cent)
Gross NPA as percentage of
Gross Advances
Gross NPA as percentage of Total Assets
2002 565 18.0 3.3 11.1 4.9
2003 541 -24 -4.2 9.4 4.2
2004 515 -26 -4.7 7.8 3.5
2005 484 -31 -6.1 5.5 2.7
2006 414 -70 -14.5 3.6 2.1
2007 390 -24 -5.8 2.7 1.6
2008 405 15 3.8 2.2 1.3
2009 450 45 11.1 2.0 1.2
2010 599 150 33.3 2.2 1.3
2011 746 147 24.5 2.2 1.4
2012 1125 379 50.8 2.9 1.9
2013 1645 520 46.2 3.6 2.4
2014 2273 628 38.2 4.4 2.9
2015 2785 512 22.5 5.0 3.2
2016 5400 2615 93.9 9.3 -
2017 6847 1447 26.8 11.7 -
Average 1574 3934 19.9 5.4 2.5
Source: Reports on Trend and Progress of Banking in India, RBI, various years
An analysis of the trend points out that NPA of PSBs had increased by a whopping 12.11
times during 2002-17. Their average volume of Gross NPA stood at Rs, 1574 billion. In 2002,
PSBs had accumulated NPA for Rs. 565 billion representing 11.1 per cent of total advances

International Journal of Advanced Research in ISSN: 2278-6236
Management and Social Sciences Impact Factor: 7.065
Vol. 7 | No. 8 | August 2018 www.garph.co.uk IJARMSS | 71
and 4.9 per cent of total assets. In the subsequent years, volume of NPAs of PSBs had
dipped and reached the level of 390 billion in 2007. This reduction may be ascribed to a
series of reform measures introduced in the banking system. Banks were offered a menu of
options to manage the problem of NPA. These included increased usage of Debt Recovery
Tribunals,Lok Adalats, Asset Reconstruction Companies, Corporate Debt Restructuring and
the SARFAESI Act, 2001.Moreover banks were granted freedom to buy or sell NPA.But the
NPA of PSBs had registered a reverse trend since 2008. From Rs. 390 billion in 2007, the
amount of NPA magnified many times and reached to Rs. 6847 billion in 2017. The rise in
the level of NPAwas very steep since 2012 and size of NPA of PSBs had been very large from
2015 onwards. Such alarming figures of NPA can be associated with factors such as spill over
effects of global recession, sluggish domestic economy and poor performance of the
corporate borrowers.
Share of PSBs in the total GNPA of the system
Table 3 Share of PSBs in the total GNPA of the system
Year
PSBs OPSBs NPSBs FBs All
Banks
GN
PA
(R
s in
bill
ion
)
Per
ce
nt
to
To
tal G
NP
As
GN
PA
(R
s in
b
illio
n)
Per
ce
nt
to
Tota
l GN
PA
s
GN
PA
(R
s in
b
illio
n)
Per
ce
nt
to
Tota
l GN
PA
s
GN
PA
(R
s in
b
illio
n)
Per
ce
nt
to
To
tal G
NP
As
GN
PA
(R
s in
bill
ion
2002 565 79.6 46 6.5 70 9.9 28 3.9 710
2003 541 75.4 43 6.2 75 14.2 29 4.2 688
2004 515 79.4 44 6.8 60 9.2 30 4.6 649
2005 484 81.1 42 7.2 46 7.8 23 4.0 587
2006 414 80.8 37 7.3 40 7.9 21 4.0 512
2007 390 76.6 30 5.9 63 12.5 24 4.9 505
2008 405 71.1 26 4.6 104 18.7 31 5.6 565
2009 450 64.5 31 4.5 139 20.3 73 10.7 693
2010 599 70.8 36 4.3 140 16.5 71 8.4 847
2011 746 76.3 37 3.8 145 14.8 51 5.2 979
2012 1125 82.6 42 3.0 143 10.1 63 4.4 1421
2013 1645 84.8 52 2.8 156 8.0 80 4.3 1932
2014 2273 86.2 60 2.2 183 6.93 116 4.3 2634
2015 2785 86.1 92 2.8 245 7.19 108 3.3 3233
2016 5400 88.2 118 1.9 440 7.19 158 2.5 6116
2017 6847 86.5 932* NA NA 11.8 136 1.7 7918
Average 1574 79.4 104 4.7 137 11.43 65 4.8 1874
Source: Reports on Trend and Progress of Banking in India, RBI, various years

International Journal of Advanced Research in ISSN: 2278-6236
Management and Social Sciences Impact Factor: 7.065
Vol. 7 | No. 8 | August 2018 www.garph.co.uk IJARMSS | 72
PSBs share a heavy burden of NPA among different bank groups. Its share in total NPA of
the system had increased by 6.9 per cent during the period of study .Its average share is
identified at 79.4 per cent during 2002-2017. PSBs’ share of GNPA in the total GNPAs of the
system had exceeded 80 per cent in half of the study period (8 years); it was more than 70
per cent in all years of the study period except in 2009.During 2004-2009 (comprising of
mostly pre crisis years) the share of GNPA of PSBs had fallen by 16.6 per cent.Old Private
Sector Banks (OPSBs) too witnessed a fall in their share of GNPA during 2004-2009 by 2.77
per cent.Conversely the share of GNPAs of New Private Sector Banks (NPSBs).and foreign
banks had increased by 12.5 per cent and 6.7 per cent respectively during 2004-2009.During
2010-2017, PSBs registered substantial increase in their share of GNPA (15.7 per cent) while
the other three segments managed to decrease their shares of GNPA.
Gross NPA Ratios of PSBs Vs other segments of the industry
Table 4 Gross NPA of PSBs Vs other segments of the industry
Year All Banks
(in percent) PSBs
(in per cent) PVSBs
(in percent) FBs
(in per cent)
2002 10.4 11.1 10 5.5
2003 9.1 9.4 9.5 5.3
2004 7.2 7.8 6.3 4.8
2005 4.9 5.4 4.5 3.0
2006 3.3 3.7 3.1 2.1
2007 2.5 2.7 2.5 1.9
2008 2.3 2.2 2.4 1.9
2009 2.3 2.0 2.8 4.3
2010 2.4 2.2 2.6 4.3
2011 2.3 2.2 2.2 2.5
2012 2.8 3.0 1.9 2.7
2013 3.2 3.6 1.9 3.0
2014 3.8 4.4 1.8 3.9
2015 4.3 5.0 2 3.2
2016 7.5 9.3 1.4 4.2
2017 9.3 11.7 2.2 3.9
Average 4.9 5.4 3.6 3.5
Source: Reports on Trend and Progress of Banking in India, RBI, various years
In accordance with the trend in the volume of gross NPA, the GNPA ratio of PSBs had abated
till 2009. During 2011-2017 its ratios were swelling i.e., from 2.2 per cent in 2011 to 11.7 per
cent 2017.Among all the bank groups PSBs alone had recorded a rise in the GNPA ratio
during the study period. GNPA ratio of ASCBs, Private Sector Bank and Foreign Banks had
International Journal of Advanced Research in ISSN: 2278-6236
Management and Social Sciences Impact Factor: 7.065
Vol. 7 | No. 8 | August 2018 www.garph.co.uk IJARMSS | 73
registered a fall of 1.1 per cent, 7.8 per cent and 1.6 per cent respectively. Similarly PSBs had
the highest average GNPA ratio of 5.4 per cent among all bank groups. The relevant figures
for ASCBs, PVSBs and Foreign Banks stood at 4.9 per cent, 3.6 per cent and 3.5 per cent
respectively.
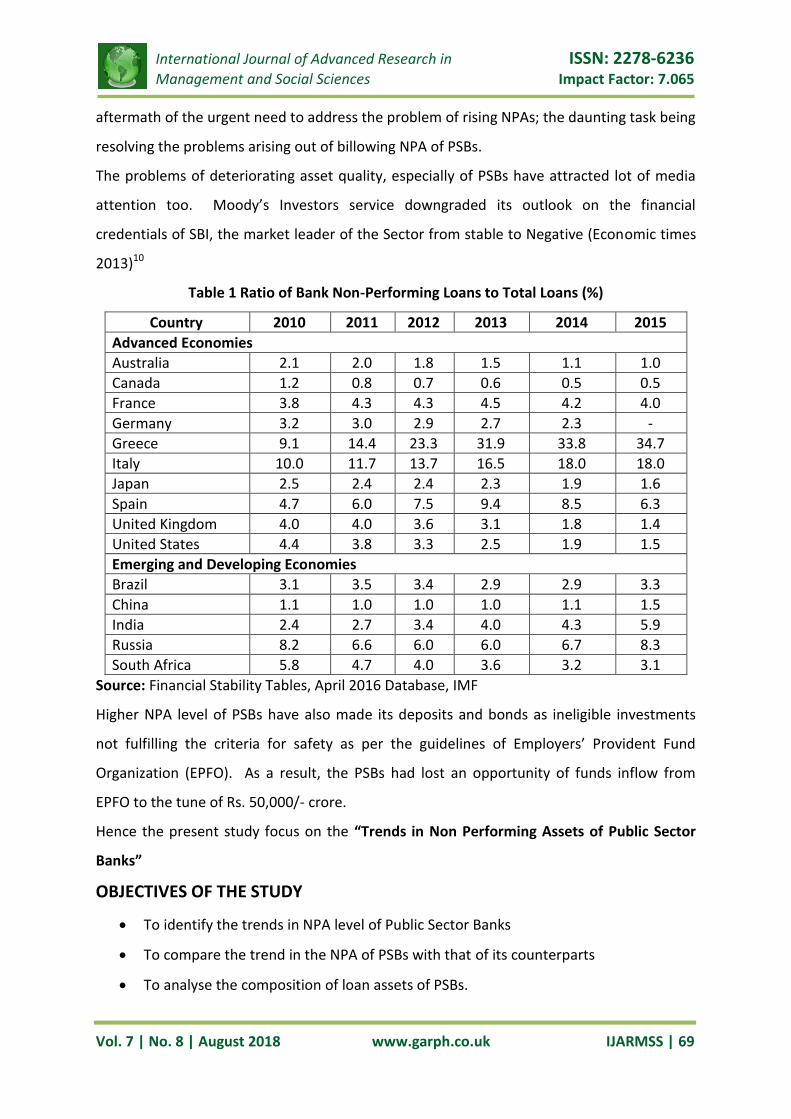
Overall growth rates of GNPA
Overall growth rates of GNPAs are compared with those of other segments during three
different phases as presented in Table 5
Table 5Overall growth rates of GNPA
Bank Groups 2002-2006 2007-09 2010-17
Public Sector Banks (-)36.5 13.3 91.3
Old Private Sector Banks (-)24.3 3.2 69.5
New Private Sector Banks (-)75 54.6 68.2
Foreign Banks (-)33 67.1 47.8
All Scheduled Commercial Banks 38.7 26.1 89.3
Source: Reports on Trend and Progress of Banking in India, RBI, various years
The Table reveals that during 2002-2007, GNPA of PSBs was reduced by 36.5 per cent. This
reduction in growth rate of GNPA of PSBs is the second best reduction, preceded by New
Private banks with a reduced growth rate of 75 per cent. In 2007-2009 (post crisis years)
PSBs were ahead of all segments except old private banks with an overall growth rate of
13.3 per cent. In the phase of 2010-2017, PSBs had suffered severe setback with their
additions to NPAs growing at 91.3 per cent, the highest among the various groups.
Test of Correlation for Gross NPAs
In order to ascertain the extent of relationship between gross NPAs of different bank
groups, Karl Pearson’s co-efficient of correlation is calculated. The test result is summarised
in the following Table.
Table 6 Correlation Coefficient (based on Gross NPA statistics 2000-01 to 2011-12)
Bank Groups Nationalized Public Foreign Private All Banks Sector Banks Sector SCBs Banks Banks
SBI &Associates 0.944* 0.985* 0.656** 0.688** 0.988*
Nationalized Banks 0.989* 0.456 0.517 0.944*
Public Sector Banks 0.554 0.604** 0.984*
Foreign Banks 0.885* 0.691**
Private Sector Banks 0.753*
Researchers’ own computation

International Journal of Advanced Research in ISSN: 2278-6236
Management and Social Sciences Impact Factor: 7.065
Vol. 7 | No. 8 | August 2018 www.garph.co.uk IJARMSS | 74
(*) denotes significance at 01 per cent.
(**) denotes significance at 05 per cent.
It could be inferred from the table that a positive correlation exists between the Gross NPAs
of PSBs and SCBs and the extent of relationships is 0.984.The positive correlation between
the GNPAs of SBI group and all SCBs is identified at 0.988.There exists a positive correlation
between the GNPAs of nationalised banks and ASCBs with the r being 0.988.The relationship
between different bank groups in terms of NPAs is influenced by the ownership of banks; a
significant correlation is noticed between SBI group and nationalised banks as well as
between private banks and foreign banks. But the correlation between public sector and
private sector banks does not show much significance.
Gross NPA – Regression Analysis
The correlation analysis has pointed out the extent of significance of relationship between
different bank groups. The researcher has formulated a regression equation for further
analysis. The equation views that the gross NPAs of SCBs is a function of gross NPAs of PSBs
(SBI group and Nationalised Banks). It is stated as under:
X ASCB = f (XSBI XNAT)
The Run of the regression equation was preceded by the multi co linearity test by using the
Tolerance and Variance Influence factor identified at 9.081 and 0.110 respectively. Results
are summarised in Table 7
Table 7 Linear Multiple Regression Coefficient with Dependent variable as Gross NPA of all
SCBs
Variables
XSBI 2.107*
XNAT 0.219
Constant 15.487*
Adjusted R Square 0.976
F Statistics 220.491*
Researchers’ own computation
(*) denotes significance at 01 per cent.
Table 7 points out that NPA of SBI group and other Nationalised Banks have a significant
positive impact on the level of gross NPA of all banks in India. The relationship between
gross NPA of SBI group and ASCBs is statistically significant i.e., Gross NPA of ASCBs
(dependent variable) depends up on the behaviour of gross NPA of SBI group (explanatory

International Journal of Advanced Research in ISSN: 2278-6236
Management and Social Sciences Impact Factor: 7.065
Vol. 7 | No. 8 | August 2018 www.garph.co.uk IJARMSS | 75
variable) to a statistically significant extent. Though there is a positive influence of the gross
NPA of Nationalised Banks on the level of gross NPA of ASCBs, such a relationship is found to
be statistically insignificant. Thus one can conclude that SBI being the market leader is a
strong force in the Indian banking system.
Net NPA of PSBs
Net NPA refers to the difference between the amount of gross NPA and the amount of
provision for NPA. It indicates the extent to which banks set aside a part of their profits
Table 8 Net NPA of PSBs
Source: Reports on Trend and Progress of Banking in India, RBI, various years
Net NPA of PSBs had grown by 13.7 times during the period of study. This is in tune with the
increase in the gross NPA of these banks by 12.1 times during the period. Net NPA ratio (Net
NPA expressed as a percent of net advances) of PSBs had increased during the study period.
It had gone up by 1.1per cent i.e., from 5.8 per cent to 6.9 per cent during 2002-
2017.Similarly Net NPA as a percentage of total assets of PSBs is on the increasing trend
during the study period, i.e., from 2.4 per cent it had moved to 3.5 per cent. These
movements in the different dimensions of Net NPApoint out the constraints faced by PSBs
in recovery of dues during the post crisis years.
Year Net NPA
(Amount Rs. In billion)
Incremental Net NPA
Growth Rate
(in per cent)
Net NPA as percentage of Net Advances
Net NPA as percentage of Total Assets
2002 280 -0.2 -0.1 5.8 2.4
2003 249 -30.8 -11.0 4.5 1.9
2004 193 -55.4 -22.3 3.1 1.3
2005 169 -24.3 -12.6 2.1 1.0
2006 146 -23.4 -13.8 1.3 0.7
2007 151 5.8 4.0 1.1 0.6
2008 178 26.9 17.8 1.0 0.6
2009 212 33.2 18.6 -0.9 0.6
2010 294 82.2 38.9 1.1 0.7
2011 360 66.3 22.6 1.2 0.7
2012 593 233 64.7 1.5 1.0
2013 900 307 51.8 2.0 1.3
2014 1304 404 44.9 2.6 1.6
2015 1600 296 22.7 2.9 1.8
2016 3204 1604 100.3 5.7 3.5
2017 3831 627 19.6 6.9 NA
Average 854 222 21.6 2.6 1.3
International Journal of Advanced Research in ISSN: 2278-6236
Management and Social Sciences Impact Factor: 7.065
Vol. 7 | No. 8 | August 2018 www.garph.co.uk IJARMSS | 76
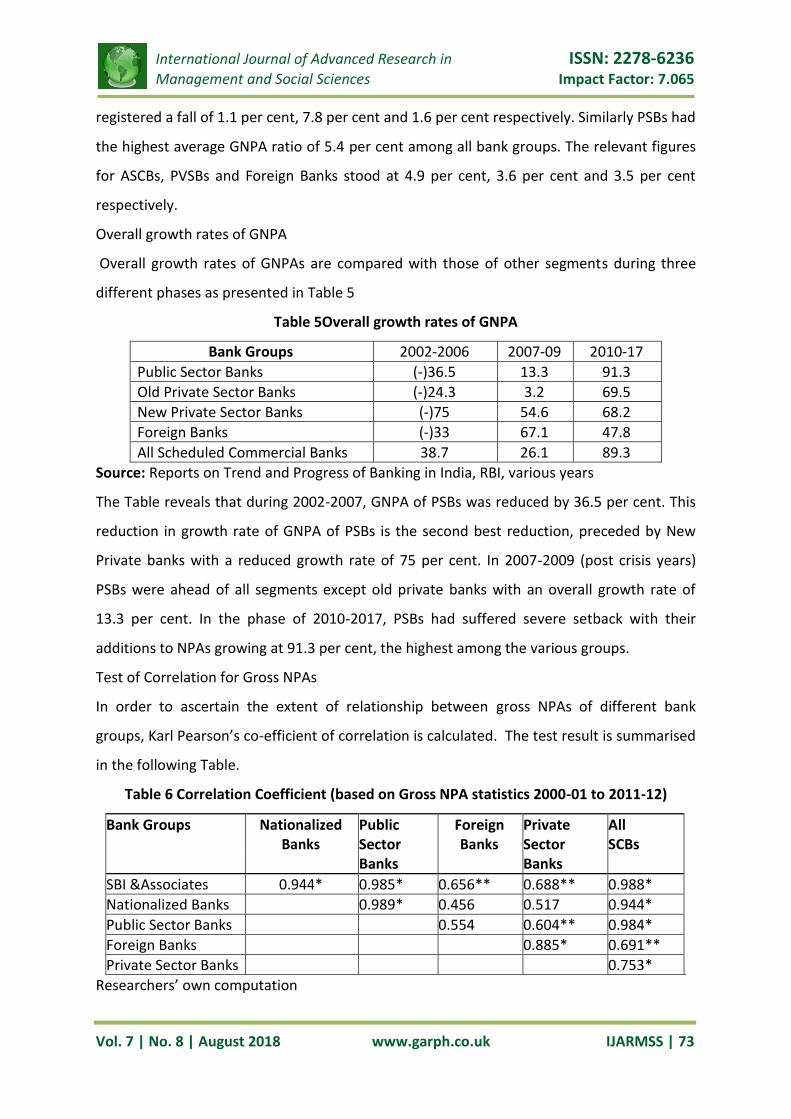
Net NPA of PSBs Vs Other segments of the industry
Table 9 compares the trends in the Net NPA ratio of PSBs with those of other bank groups
Table 9 Net NPAs of PSBs Vs Other segments of the industry
Year All Banks
(in percent) PSBs
(in percent) PVSBs
(in percent) FBs
(in percent)
2002 5.5 5.8 6.1 1.9
2003 4.4 4.5 5.1 1.8
2004 2.8 3.1 3.1 1.5
2005 2.0 2.1 2.1 0.9
2006 1.2 1.3 1.3 0.8
2007 1.0 1.1 1.0 0.7
2008 1.0 1.0 1.0 0.8
2009 1.1 -0.9 1.2 1.8
2010 1.1 1.1 1.0 1.8
2011 1.0 1.2 0.6 0.7
2012 1.3 1.5 0.5 0.6
2013 1.6 2.0 0.7 1.0
2014 2.1 2.6 0.7 1.1
2015 2.4 2.9 0.9 0.5
2016 4.4 5.7 1.4 0.8
2017 5.3 6.9 2.2 0.6
Average 2.4 2.6 1.8 1.1
Source: Reports on Trend and Progress of Banking in India, RBI, various years
Average Net NPA ratio is the highest for PSBs (2.6 per cent) followed by private banks (1,8
per cent) and Foreign Banks(1.1 per cent).Net NPA ratio of private sector banks and Foreign
Banks had shown downward trends during 2002-2016 as against the upward movement of
Net NPA ratio of PSBs. The other divergent trends among bank groups are:
During 2002-2006, NPA ratios of all segments move in tandem.
During 2010-2016, gap between Net NPA ratios of PSBs and other groups began to
widen.
Test of Correlation for Net NPA
Results of the test of correlation meant for assessing the extent of relationship between the
Net NPA of different bank group is summarised in Table 10
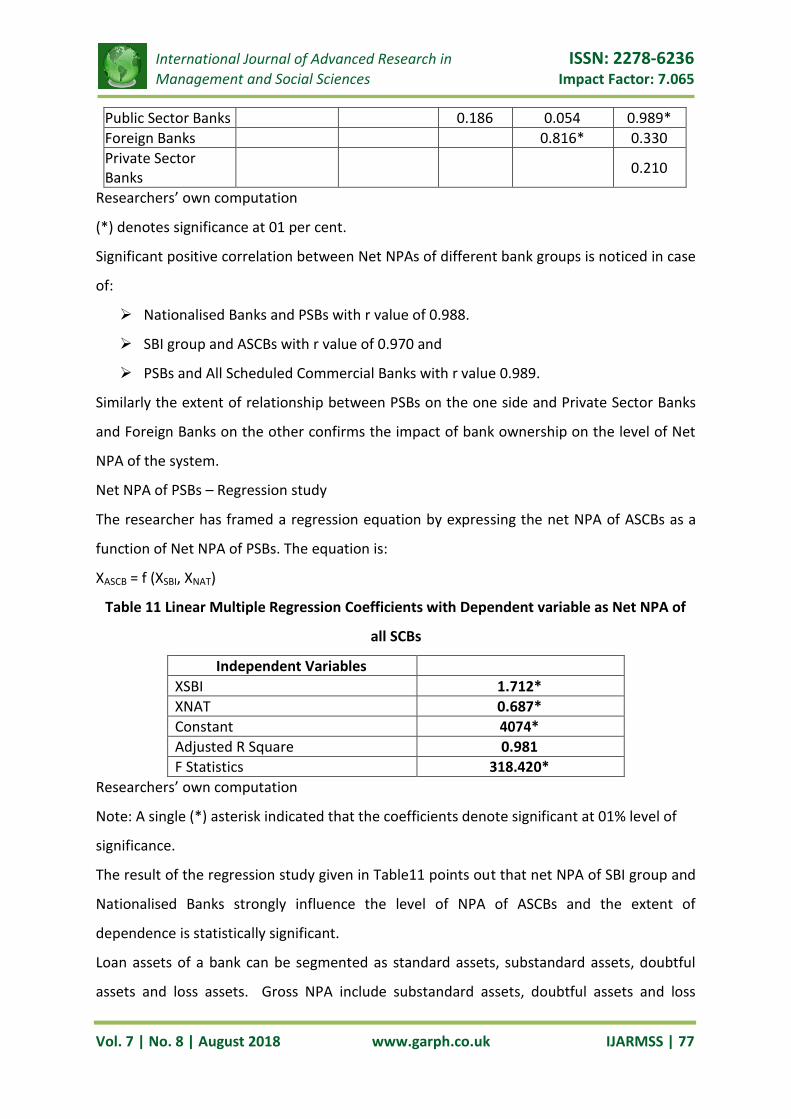
Table 10 Coefficient of Correlation - Net NPA Bank-Group wise
Bank Groups Nationalized
Bank Public Sector
Banks Foreign Banks
Private Sector Banks
All SCBs
SBI & Associates 0.879* 0.946* 0.438 0.238 0.970*
Nationalized Banks 0.988* 0.056 -0.049 0.957*
International Journal of Advanced Research in ISSN: 2278-6236
Management and Social Sciences Impact Factor: 7.065
Vol. 7 | No. 8 | August 2018 www.garph.co.uk IJARMSS | 77
Public Sector Banks 0.186 0.054 0.989*
Foreign Banks 0.816* 0.330
Private Sector Banks
0.210
Researchers’ own computation
(*) denotes significance at 01 per cent.
Significant positive correlation between Net NPAs of different bank groups is noticed in case
of:
Nationalised Banks and PSBs with r value of 0.988.
SBI group and ASCBs with r value of 0.970 and
PSBs and All Scheduled Commercial Banks with r value 0.989.
Similarly the extent of relationship between PSBs on the one side and Private Sector Banks
and Foreign Banks on the other confirms the impact of bank ownership on the level of Net
NPA of the system.
Net NPA of PSBs – Regression study
The researcher has framed a regression equation by expressing the net NPA of ASCBs as a
function of Net NPA of PSBs. The equation is:
XASCB = f (XSBI, XNAT)
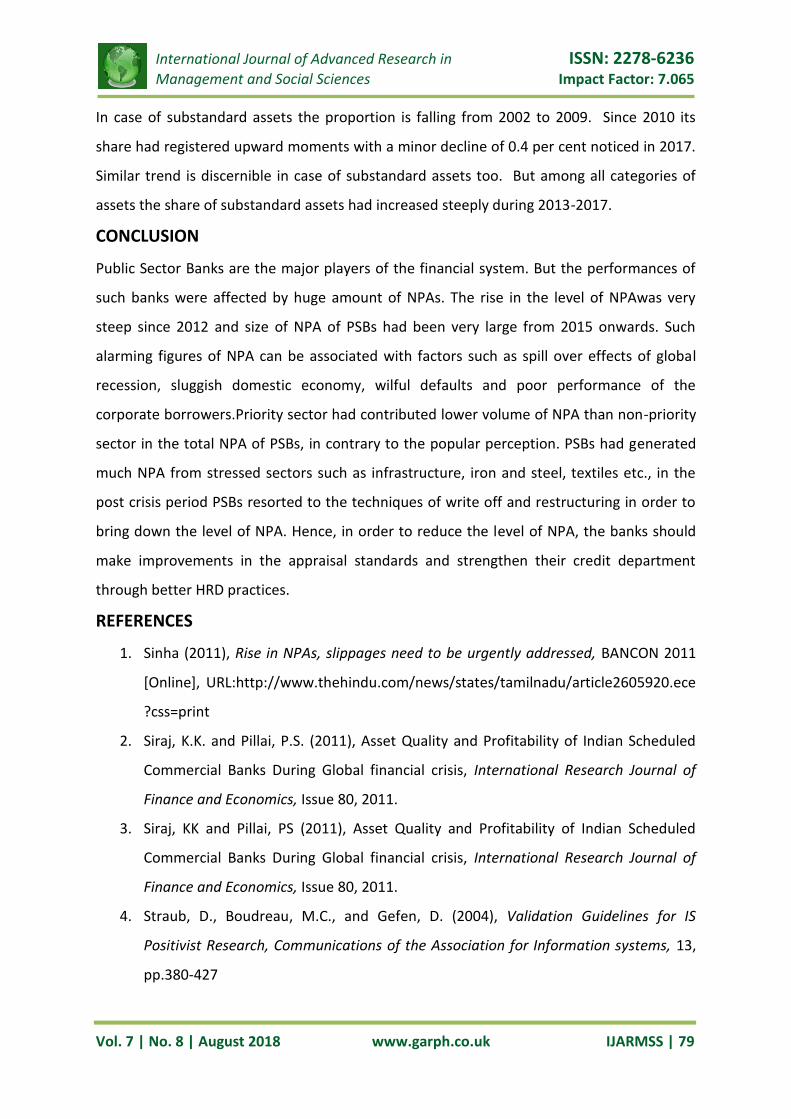
Table 11 Linear Multiple Regression Coefficients with Dependent variable as Net NPA of
all SCBs
Independent Variables
XSBI 1.712*
XNAT 0.687*
Constant 4074*
Adjusted R Square 0.981
F Statistics 318.420*
Researchers’ own computation
Note: A single (*) asterisk indicated that the coefficients denote significant at 01% level of
significance.
The result of the regression study given in Table11 points out that net NPA of SBI group and
Nationalised Banks strongly influence the level of NPA of ASCBs and the extent of
dependence is statistically significant.
Loan assets of a bank can be segmented as standard assets, substandard assets, doubtful
assets and loss assets. Gross NPA include substandard assets, doubtful assets and loss

International Journal of Advanced Research in ISSN: 2278-6236
Management and Social Sciences Impact Factor: 7.065
Vol. 7 | No. 8 | August 2018 www.garph.co.uk IJARMSS | 78
assets. In other words the difference between total advances and gross NPA can be called
as standard assets. Such classification of loan assets is an important yardstick for assessing
theloan quality of banks. Table 12 exhibit the classification of loan assets of PSBs during the
study period
Table 12 Classification of Loan Assets of PSBs (Rs. In Crore)
Source: Reports on Trend and Progress of Banking in India, RBI, various years
During the period of study PSBs had witnessed marginal fall in the share of standard assets
by 0.6 per cent, substandard assets by 0.1 per cent and loss assets by 0.4 per cent. In
contrast, the proportion of doubtful assets in the total loan assets of PSBs had increased by
1.8 per cent. The average share of standard assets stood at 94.7 per cent. Year wise trend in
the share of standard assets shows mixed movements. During the pre-crisis period of 2002–
2008, its share had risen to 97.8 per cent from 88.9 per cent. Even in the year of financial
crisis i.e., 2008-2009 its share had marginally scaled by 0.2 per cent. From 2010 onwards
there is a steady decrease in the share of standard assets and in 2017 its share had dropped
below 90 per cent.
Year
Standard Assets Sub-Standard
Assets Doubtful Assets Loss Assets
Amount Percent Amount Percent Amount Percent Amount Percent
2002 4529 88.9 157 3.1 336 6.6 70 1.4
2003 5237 90.6 149 2.6 323 5.6 68 1.2
2004 6104 92.2 169 2.6 287 4.3 58 0.9
2005 8379 94.6 110 1.2 308 3.5 59 0.7
2006 10926 96.4 113 1.0 246 2.2 55 0.5
2007 14262 97.4 143 1.0 198 1.4 48 0.3
2008 17786 97.8 173 1.0 192 1.1 40 0.2
2009 22378 98.0 203 0.9 206 0.9 41 0.2
2010 26735 97.8 288 1.1 254 0.9 58 0.2
2011 32718 97.8 350 1.1 332 1.0 65 0.2
2012 38255 97.0 623 1.6 490 1.2 60 0.2
2013 43957 96.4 815 1.8 761 1.7 68 0.2
2014 49887 95.6 958 1.8 1216 2.3 99 0.2
2015 53382 95.0 1054 1.9 1630 2.9 100 0.2
2016 52875 90.7 2005 3.4 3232 5.5 163 0.3
2017 51816 88.3 1731 3.0 4904 8.4 212 0.4
Average 54903 94.7 565 1.8 932 3.1 79 0.5
International Journal of Advanced Research in ISSN: 2278-6236
Management and Social Sciences Impact Factor: 7.065
Vol. 7 | No. 8 | August 2018 www.garph.co.uk IJARMSS | 79
In case of substandard assets the proportion is falling from 2002 to 2009. Since 2010 its
share had registered upward moments with a minor decline of 0.4 per cent noticed in 2017.
Similar trend is discernible in case of substandard assets too. But among all categories of
assets the share of substandard assets had increased steeply during 2013-2017.
CONCLUSION
Public Sector Banks are the major players of the financial system. But the performances of
such banks were affected by huge amount of NPAs. The rise in the level of NPAwas very
steep since 2012 and size of NPA of PSBs had been very large from 2015 onwards. Such
alarming figures of NPA can be associated with factors such as spill over effects of global
recession, sluggish domestic economy, wilful defaults and poor performance of the
corporate borrowers.Priority sector had contributed lower volume of NPA than non-priority
sector in the total NPA of PSBs, in contrary to the popular perception. PSBs had generated
much NPA from stressed sectors such as infrastructure, iron and steel, textiles etc., in the
post crisis period PSBs resorted to the techniques of write off and restructuring in order to
bring down the level of NPA. Hence, in order to reduce the level of NPA, the banks should
make improvements in the appraisal standards and strengthen their credit department
through better HRD practices.
REFERENCES
1. Sinha (2011), Rise in NPAs, slippages need to be urgently addressed, BANCON 2011
[Online], URL:http://www.thehindu.com/news/states/tamilnadu/article2605920.ece
?css=print
2. Siraj, K.K. and Pillai, P.S. (2011), Asset Quality and Profitability of Indian Scheduled
Commercial Banks During Global financial crisis, International Research Journal of
Finance and Economics, Issue 80, 2011.
3. Siraj, KK and Pillai, PS (2011), Asset Quality and Profitability of Indian Scheduled
Commercial Banks During Global financial crisis, International Research Journal of
Finance and Economics, Issue 80, 2011.
4. Straub, D., Boudreau, M.C., and Gefen, D. (2004), Validation Guidelines for IS
Positivist Research, Communications of the Association for Information systems, 13,
pp.380-427
International Journal of Advanced Research in ISSN: 2278-6236
Management and Social Sciences Impact Factor: 7.065
Vol. 7 | No. 8 | August 2018 www.garph.co.uk IJARMSS | 80
5. Swamy, V (2012), Impact of Macroeconomic and Endogenous factors on Non
Performing Bank Assets, The International Journal of Banking and Finance, Volume 9
(Number 1) 2012: pages 27-47
6. Uppal, RK (2009), Priority sector advances: Trends, issues and strategies,Journal of
Accounting and Taxation Vol.1 (5), pp. 079-089.
7. ET Bureau. 20 Jun 2014. NPAs render 24 PSBs Ineligible For Rs50,000 Crore EPFO
Investments. Economic Times.
8. Reserve Bank of India: Reports on Trends and Progress of Banking in India – Various
years
9. Rajaraman I. and G. Vasishtha, (2002): Non-Performing Loans of PSU Banks: Some
Panel Results, Economic and Political Weekly, Vol. 37, No. 5, Money, Banking and
Financial (Feb. 2-8, 2002), pp. 429-431+434-435: examined 27 Indian PSBs from
1999-2000 and found operating efficiency to be one the determinants of NPA but
they also found that operating efficiency cannot fully explain higher than average
NPAs.
10. ET Bureau. 20 Jun 2014. NPAs render 24 PSBs Ineligible For Rs50,000 Crore EPFO
Investments. Economic Times.


![Management of Non-Performing Assets [NPAs] in Credit …bird-cpec.in/wp-content/uploads/2018/02/1-Lead-Paper-NPA-National... · State Cooperatives Banks [StCBs] for NPA Management](https://img.pdfslide.net/doc/110x75/5fc581af48c20510b72d4648/management-of-non-performing-assets-npas-in-credit-bird-cpecinwp-contentuploads2018021-lead-paper-npa-national.jpg)