Embed Size (px)
Citation preview

EAST-WEST GATEWAYCouncil of Governments
Creating Solutions Across Jurisdictional Boundaries
Signs of Change?
February 2008
Trends in RegionalTraffic Volumes
Trends in Regional Traffic Volumes: Signs of Change?
Introduction
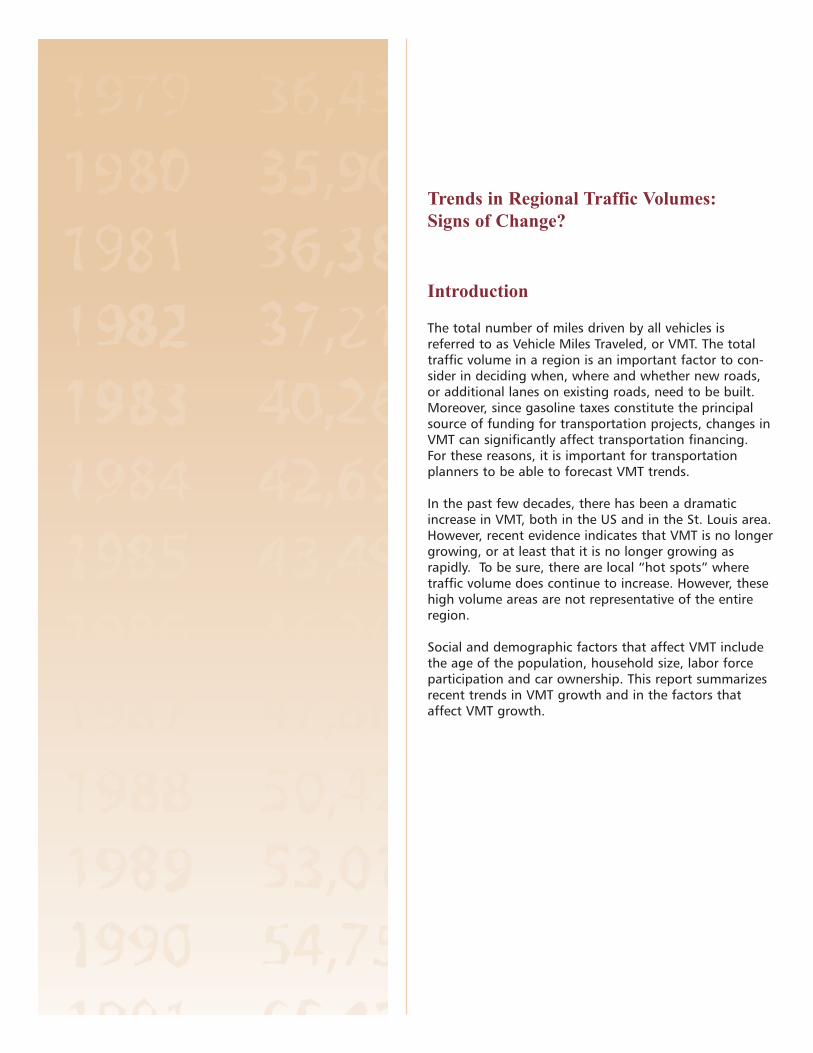
The total number of miles driven by all vehicles isreferred to as Vehicle Miles Traveled, or VMT. The totaltraffic volume in a region is an important factor to con-sider in deciding when, where and whether new roads,or additional lanes on existing roads, need to be built.Moreover, since gasoline taxes constitute the principalsource of funding for transportation projects, changes inVMT can significantly affect transportation financing.For these reasons, it is important for transportationplanners to be able to forecast VMT trends.
In the past few decades, there has been a dramaticincrease in VMT, both in the US and in the St. Louis area.However, recent evidence indicates that VMT is no longergrowing, or at least that it is no longer growing asrapidly. To be sure, there are local “hot spots” wheretraffic volume does continue to increase. However, thesehigh volume areas are not representative of the entireregion.
Social and demographic factors that affect VMT includethe age of the population, household size, labor forceparticipation and car ownership. This report summarizesrecent trends in VMT growth and in the factors thataffect VMT growth.
VMT Trends
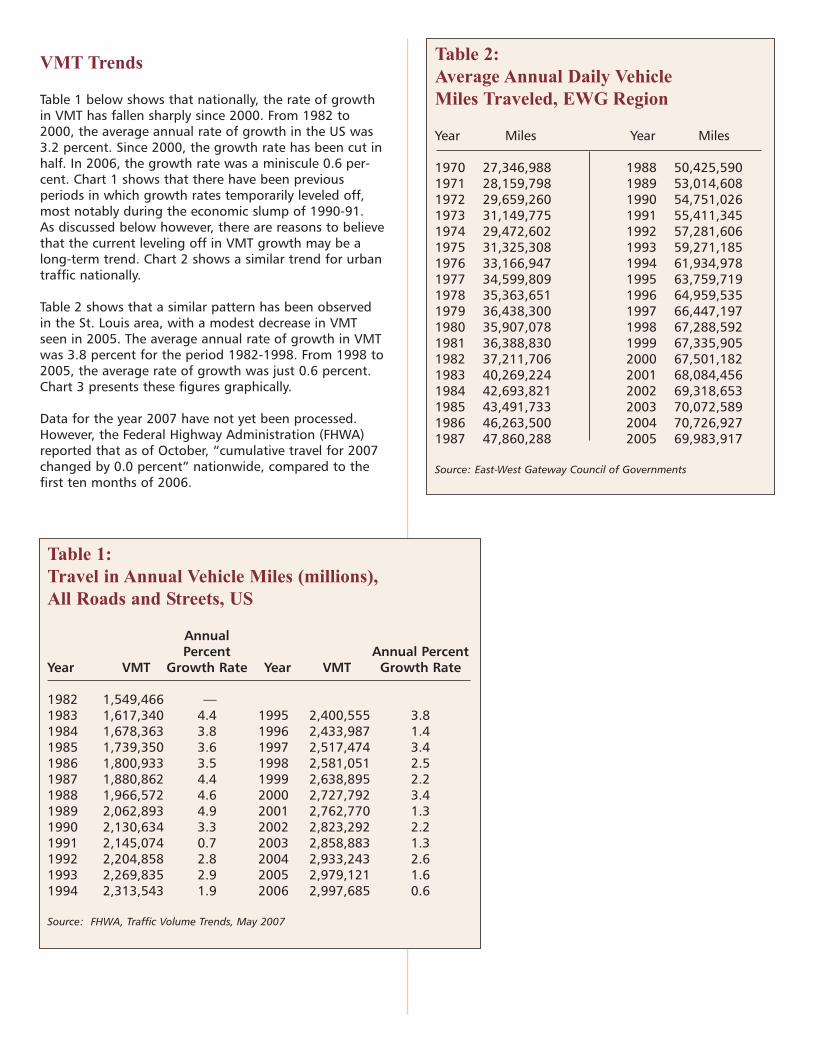
Table 1 below shows that nationally, the rate of growthin VMT has fallen sharply since 2000. From 1982 to2000, the average annual rate of growth in the US was3.2 percent. Since 2000, the growth rate has been cut inhalf. In 2006, the growth rate was a miniscule 0.6 per-cent. Chart 1 shows that there have been previousperiods in which growth rates temporarily leveled off,most notably during the economic slump of 1990-91.As discussed below however, there are reasons to believethat the current leveling off in VMT growth may be along-term trend. Chart 2 shows a similar trend for urbantraffic nationally.
Table 2 shows that a similar pattern has been observedin the St. Louis area, with a modest decrease in VMTseen in 2005. The average annual rate of growth in VMTwas 3.8 percent for the period 1982-1998. From 1998 to2005, the average rate of growth was just 0.6 percent.Chart 3 presents these figures graphically.
Data for the year 2007 have not yet been processed.However, the Federal Highway Administration (FHWA)reported that as of October, “cumulative travel for 2007changed by 0.0 percent” nationwide, compared to thefirst ten months of 2006.
Table 1: Travel in Annual Vehicle Miles (millions), All Roads and Streets, US
AnnualPercent Annual Percent
Year VMT Growth Rate Year VMT Growth Rate
1982 1,549,466 —1983 1,617,340 4.4 1995 2,400,555 3.81984 1,678,363 3.8 1996 2,433,987 1.41985 1,739,350 3.6 1997 2,517,474 3.41986 1,800,933 3.5 1998 2,581,051 2.51987 1,880,862 4.4 1999 2,638,895 2.21988 1,966,572 4.6 2000 2,727,792 3.41989 2,062,893 4.9 2001 2,762,770 1.31990 2,130,634 3.3 2002 2,823,292 2.21991 2,145,074 0.7 2003 2,858,883 1.31992 2,204,858 2.8 2004 2,933,243 2.61993 2,269,835 2.9 2005 2,979,121 1.61994 2,313,543 1.9 2006 2,997,685 0.6
Source: FHWA, Traffic Volume Trends, May 2007
Table 2: Average Annual Daily Vehicle Miles Traveled, EWG Region
Year Miles Year Miles
1970 27,346,988 1988 50,425,5901971 28,159,798 1989 53,014,6081972 29,659,260 1990 54,751,0261973 31,149,775 1991 55,411,3451974 29,472,602 1992 57,281,6061975 31,325,308 1993 59,271,1851976 33,166,947 1994 61,934,9781977 34,599,809 1995 63,759,7191978 35,363,651 1996 64,959,5351979 36,438,300 1997 66,447,1971980 35,907,078 1998 67,288,5921981 36,388,830 1999 67,335,9051982 37,211,706 2000 67,501,1821983 40,269,224 2001 68,084,4561984 42,693,821 2002 69,318,6531985 43,491,733 2003 70,072,5891986 46,263,500 2004 70,726,9271987 47,860,288 2005 69,983,917
Source: East-West Gateway Council of Governments

Factors Affecting VMT Growth
A 2006 study by Steven Polzin indicates that principaldeterminants of VMT include the age of the population,household composition, labor force participation andvehicle availability. The following tables and chartsexplain the relationship between these socio-economicvariables and VMT.
Chart 1:Vehicle Miles of Travel (millions)
Chart 2:Urban Vehicle Miles of Travel (millions)
Age: Persons between the age of 20 and 64, onaverage, drive more miles each year than do older oryounger motorists. Table 3 shows results from the 2001National Household Travel Survey (NHTS) conducted bythe U.S. Department of Transportation.
Source: Bureau of Transportation Statistics, National Transportation Statistics, 2006
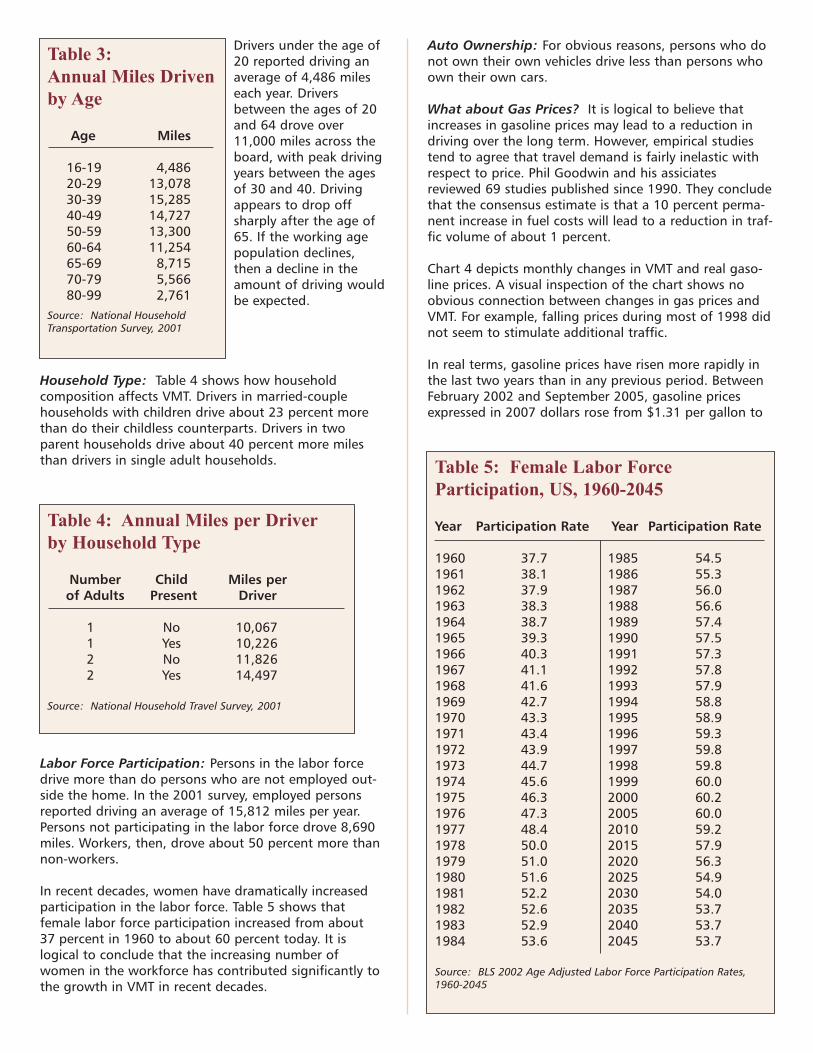
Drivers under the age of20 reported driving anaverage of 4,486 mileseach year. Driversbetween the ages of 20and 64 drove over11,000 miles across theboard, with peak drivingyears between the agesof 30 and 40. Drivingappears to drop offsharply after the age of65. If the working agepopulation declines,then a decline in theamount of driving wouldbe expected.
Household Type: Table 4 shows how householdcomposition affects VMT. Drivers in married-couplehouseholds with children drive about 23 percent morethan do their childless counterparts. Drivers in twoparent households drive about 40 percent more milesthan drivers in single adult households.
Labor Force Participation: Persons in the labor forcedrive more than do persons who are not employed out-side the home. In the 2001 survey, employed personsreported driving an average of 15,812 miles per year.Persons not participating in the labor force drove 8,690miles. Workers, then, drove about 50 percent more thannon-workers.
In recent decades, women have dramatically increasedparticipation in the labor force. Table 5 shows thatfemale labor force participation increased from about37 percent in 1960 to about 60 percent today. It islogical to conclude that the increasing number ofwomen in the workforce has contributed significantly tothe growth in VMT in recent decades.
Auto Ownership: For obvious reasons, persons who donot own their own vehicles drive less than persons whoown their own cars.
What about Gas Prices? It is logical to believe thatincreases in gasoline prices may lead to a reduction indriving over the long term. However, empirical studiestend to agree that travel demand is fairly inelastic withrespect to price. Phil Goodwin and his assiciatesreviewed 69 studies published since 1990. They concludethat the consensus estimate is that a 10 percent perma-nent increase in fuel costs will lead to a reduction in traf-fic volume of about 1 percent.
Chart 4 depicts monthly changes in VMT and real gaso-line prices. A visual inspection of the chart shows noobvious connection between changes in gas prices andVMT. For example, falling prices during most of 1998 didnot seem to stimulate additional traffic.
In real terms, gasoline prices have risen more rapidly inthe last two years than in any previous period. BetweenFebruary 2002 and September 2005, gasoline pricesexpressed in 2007 dollars rose from $1.31 per gallon to
Table 5: Female Labor ForceParticipation, US, 1960-2045
Year Participation Rate Year Participation Rate
1960 37.7 1985 54.51961 38.1 1986 55.31962 37.9 1987 56.01963 38.3 1988 56.61964 38.7 1989 57.41965 39.3 1990 57.51966 40.3 1991 57.31967 41.1 1992 57.81968 41.6 1993 57.91969 42.7 1994 58.81970 43.3 1995 58.91971 43.4 1996 59.31972 43.9 1997 59.81973 44.7 1998 59.81974 45.6 1999 60.01975 46.3 2000 60.21976 47.3 2005 60.01977 48.4 2010 59.21978 50.0 2015 57.91979 51.0 2020 56.31980 51.6 2025 54.91981 52.2 2030 54.01982 52.6 2035 53.71983 52.9 2040 53.71984 53.6 2045 53.7
Source: BLS 2002 Age Adjusted Labor Force Participation Rates,1960-2045
Table 4: Annual Miles per Driverby Household Type
Number Child Miles per of Adults Present Driver
1 No 10,0671 Yes 10,2262 No 11,8262 Yes 14,497
Source: National Household Travel Survey, 2001
Table 3: Annual Miles Driven by Age
Age Miles
16-19 4,48620-29 13,07830-39 15,28540-49 14,72750-59 13,30060-64 11,25465-69 8,71570-79 5,56680-99 2,761
Source: National HouseholdTransportation Survey, 2001
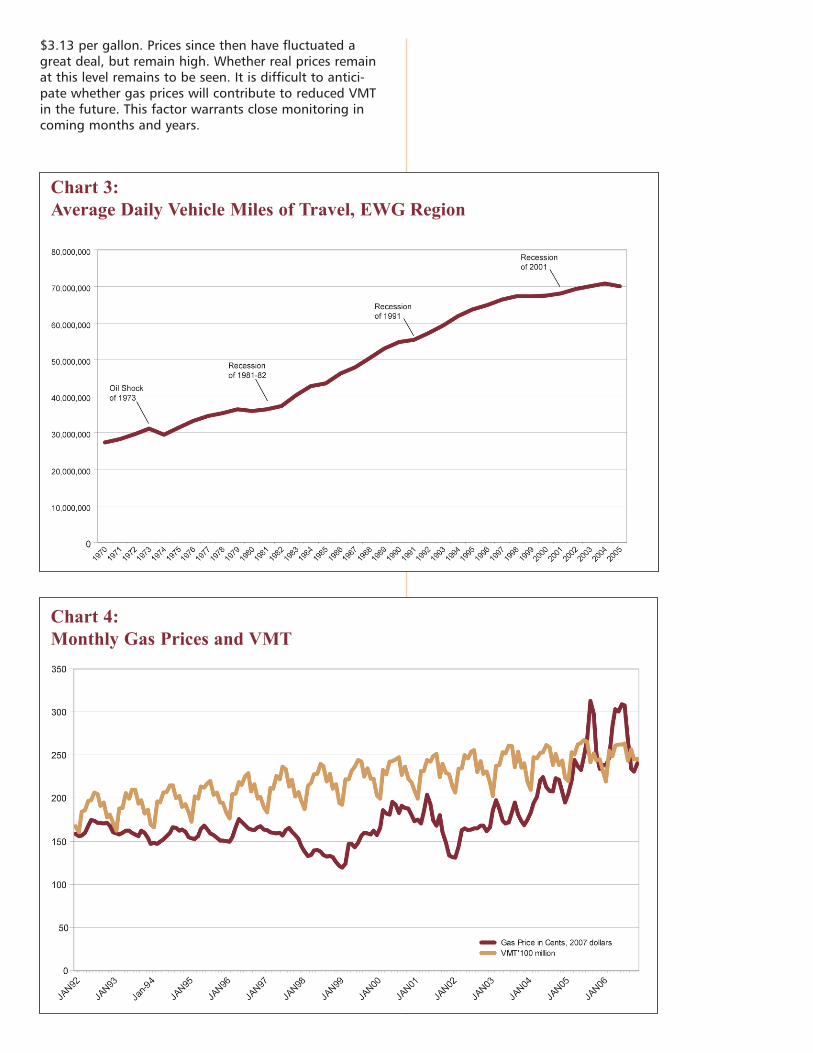
$3.13 per gallon. Prices since then have fluctuated agreat deal, but remain high. Whether real prices remainat this level remains to be seen. It is difficult to antici-pate whether gas prices will contribute to reduced VMTin the future. This factor warrants close monitoring incoming months and years.
Chart 4:Monthly Gas Prices and VMT
Chart 3:Average Daily Vehicle Miles of Travel, EWG Region
Demographic Trends
Each of the underlying factors cited above suggest thatthe decline in VMT growth may be a long-term trend inthe St. Louis region.
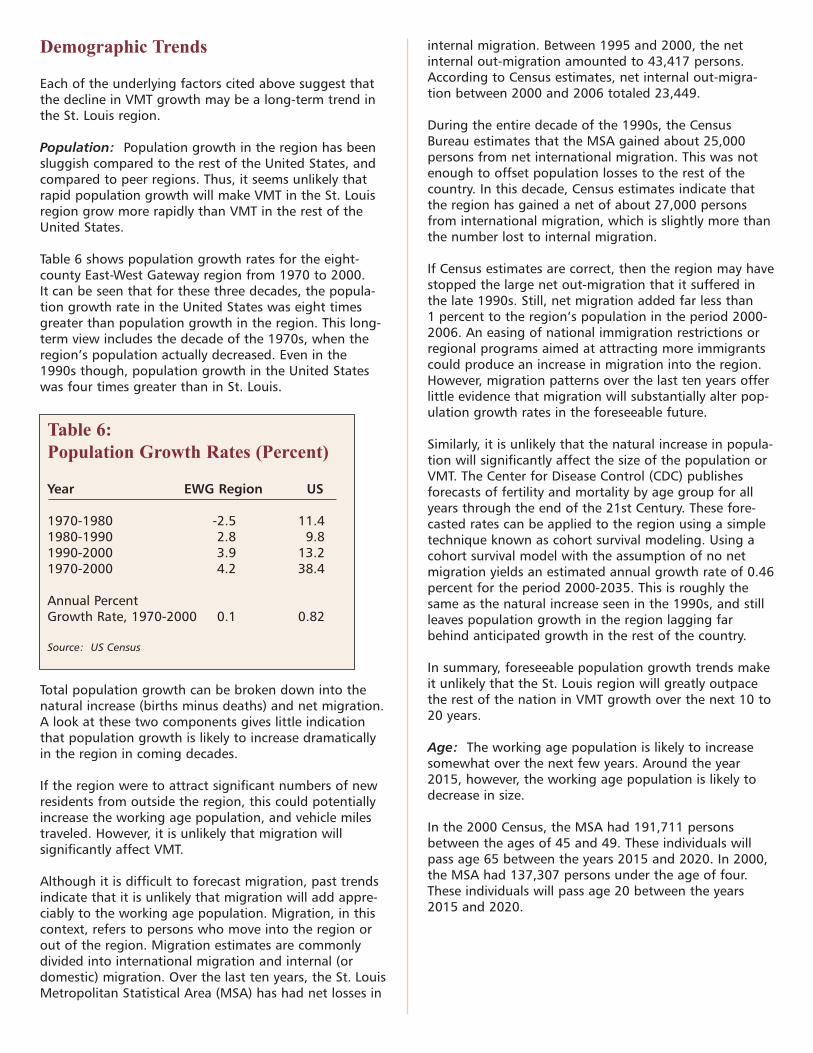
Population: Population growth in the region has beensluggish compared to the rest of the United States, andcompared to peer regions. Thus, it seems unlikely thatrapid population growth will make VMT in the St. Louisregion grow more rapidly than VMT in the rest of theUnited States.
Table 6 shows population growth rates for the eight-county East-West Gateway region from 1970 to 2000.It can be seen that for these three decades, the popula-tion growth rate in the United States was eight timesgreater than population growth in the region. This long-term view includes the decade of the 1970s, when theregion’s population actually decreased. Even in the1990s though, population growth in the United Stateswas four times greater than in St. Louis.
Total population growth can be broken down into thenatural increase (births minus deaths) and net migration.A look at these two components gives little indicationthat population growth is likely to increase dramaticallyin the region in coming decades.
If the region were to attract significant numbers of newresidents from outside the region, this could potentiallyincrease the working age population, and vehicle milestraveled. However, it is unlikely that migration willsignificantly affect VMT.
Although it is difficult to forecast migration, past trendsindicate that it is unlikely that migration will add appre-ciably to the working age population. Migration, in thiscontext, refers to persons who move into the region orout of the region. Migration estimates are commonlydivided into international migration and internal (ordomestic) migration. Over the last ten years, the St. LouisMetropolitan Statistical Area (MSA) has had net losses in
internal migration. Between 1995 and 2000, the netinternal out-migration amounted to 43,417 persons.According to Census estimates, net internal out-migra-tion between 2000 and 2006 totaled 23,449.
During the entire decade of the 1990s, the CensusBureau estimates that the MSA gained about 25,000persons from net international migration. This was notenough to offset population losses to the rest of thecountry. In this decade, Census estimates indicate thatthe region has gained a net of about 27,000 personsfrom international migration, which is slightly more thanthe number lost to internal migration.
If Census estimates are correct, then the region may havestopped the large net out-migration that it suffered inthe late 1990s. Still, net migration added far less than1 percent to the region’s population in the period 2000-2006. An easing of national immigration restrictions orregional programs aimed at attracting more immigrantscould produce an increase in migration into the region.However, migration patterns over the last ten years offerlittle evidence that migration will substantially alter pop-ulation growth rates in the foreseeable future.
Similarly, it is unlikely that the natural increase in popula-tion will significantly affect the size of the population orVMT. The Center for Disease Control (CDC) publishesforecasts of fertility and mortality by age group for allyears through the end of the 21st Century. These fore-casted rates can be applied to the region using a simpletechnique known as cohort survival modeling. Using acohort survival model with the assumption of no netmigration yields an estimated annual growth rate of 0.46percent for the period 2000-2035. This is roughly thesame as the natural increase seen in the 1990s, and stillleaves population growth in the region lagging farbehind anticipated growth in the rest of the country.
In summary, foreseeable population growth trends makeit unlikely that the St. Louis region will greatly outpacethe rest of the nation in VMT growth over the next 10 to20 years.
Age: The working age population is likely to increasesomewhat over the next few years. Around the year2015, however, the working age population is likely todecrease in size.
In the 2000 Census, the MSA had 191,711 personsbetween the ages of 45 and 49. These individuals willpass age 65 between the years 2015 and 2020. In 2000,the MSA had 137,307 persons under the age of four.These individuals will pass age 20 between the years2015 and 2020.
Table 6: Population Growth Rates (Percent)
Year EWG Region US
1970-1980 -2.5 11.41980-1990 2.8 9.81990-2000 3.9 13.21970-2000 4.2 38.4
Annual Percent Growth Rate, 1970-2000 0.1 0.82
Source: US Census

Thus, between 2015 and 2020, more people will age outof the working age population than will enter the laborpool. (It should be noted that the 45-49 population hasa higher mortality rate than the 0-4 population, makingthe loss in working age population even greater.) Asnoted above, there is no evidence to indicate that theage distribution will be significantly affected by eitherlarge-scale in-migration or through growing fertilityrates.
Household Composition: The number of drivers in theregion is not expected to increase dramatically in comingdecades. However, the composition of households inwhich drivers live appears to be shifting in a directionthat may reduce the number of miles traveled.
Table 7 shows changes that the average household sizein the East-West Gateway region is falling. Also falling isthe absolute number of two-parent households. Thesetrends can be expected to moderate VMT growth in theregion.
Labor Force Participation: The female labor forceparticipation rate appears to have stopped increasing,and the U.S. Bureau of Labor Statistics forecasts thatfemale labor force participation will actually decline incoming decades. Since the explosive growth in femalelabor force participation has been a principal driver ofVMT growth over the last 30 years, the BLS forecastssuggest that VMT may not grow as robustly in theforeseeable future.
Table 5 shows BLS forecasts for female labor forceparticipation through the year 2045.
Table 7: Household Composition, East-West Gateway Region
Number ofAverage Married Couple
Household Households withYear Size Children
1990 2.64 234,0002000 2.56 226,0002006 2.48 210,000
Source: US Census, 1990 and 2000; American Community Survey, 2006
Table 8: Percentage of Occupied Housing UnitsWith No Available Vehicle
County 1970 2000
Madison 12.0 7.0Monroe 11.3 3.3St. Clair 19.2 10.4Franklin 12.9 5.9Jefferson 7.2 4.3St. Charles 6.5 3.6St. Louis County 6.6 6.4St. Louis City 18.1 25.2Region 18.0 9.2
Source: US Census
Auto Ownership: Auto ownership has become morecommon in recent years, even among low-income house-holds, and the growth in auto ownership has con-tributed to the growth in VMT. The Center for UrbanTransportation Research estimates that nationally, thepercentage of households without cars dropped fromover 20 percent in 1960 to about 9 percent in 2000,with almost no change between 1995 and 2000. Asimilar change occurred locally, with the percentage ofno-vehicle households dropping from about 18 percentin 1970 to about nine percent in 2000.
In a 2007 paper, Jeffrey Memmott argues that many ofthe remaining zero vehicle households consist of individ-uals who forego auto ownership for reasons of personalchoice, or because of medical issues. If this is true, thenthe percentage of zero vehicle households is unlikely todecrease as rapidly as it has in recent decades. Table 8shows how the number of households without vehiclesin St. Louis has fallen since 1970.
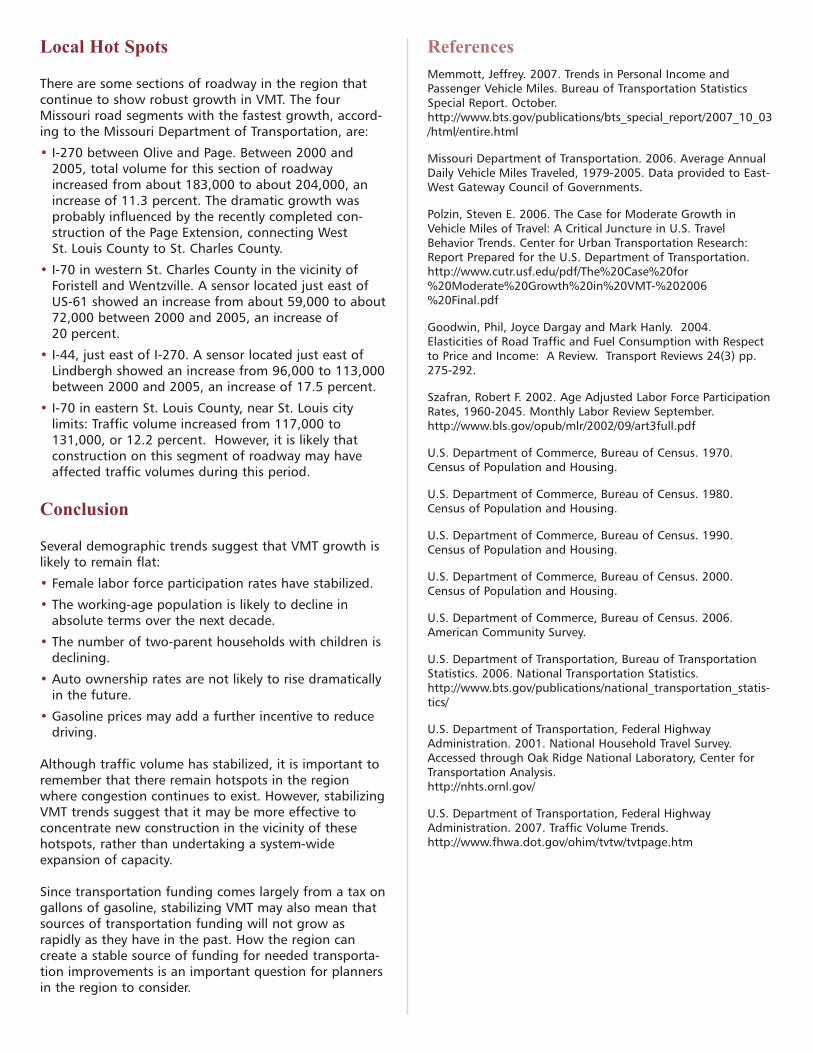
Local Hot Spots
There are some sections of roadway in the region thatcontinue to show robust growth in VMT. The fourMissouri road segments with the fastest growth, accord-ing to the Missouri Department of Transportation, are:
• I-270 between Olive and Page. Between 2000 and2005, total volume for this section of roadwayincreased from about 183,000 to about 204,000, anincrease of 11.3 percent. The dramatic growth wasprobably influenced by the recently completed con-struction of the Page Extension, connecting WestSt. Louis County to St. Charles County.
• I-70 in western St. Charles County in the vicinity ofForistell and Wentzville. A sensor located just east ofUS-61 showed an increase from about 59,000 to about72,000 between 2000 and 2005, an increase of20 percent.
• I-44, just east of I-270. A sensor located just east ofLindbergh showed an increase from 96,000 to 113,000between 2000 and 2005, an increase of 17.5 percent.
• I-70 in eastern St. Louis County, near St. Louis citylimits: Traffic volume increased from 117,000 to131,000, or 12.2 percent. However, it is likely thatconstruction on this segment of roadway may haveaffected traffic volumes during this period.
Conclusion
Several demographic trends suggest that VMT growth islikely to remain flat:
• Female labor force participation rates have stabilized.
• The working-age population is likely to decline inabsolute terms over the next decade.
• The number of two-parent households with children isdeclining.
• Auto ownership rates are not likely to rise dramaticallyin the future.
• Gasoline prices may add a further incentive to reducedriving.
Although traffic volume has stabilized, it is important toremember that there remain hotspots in the regionwhere congestion continues to exist. However, stabilizingVMT trends suggest that it may be more effective toconcentrate new construction in the vicinity of thesehotspots, rather than undertaking a system-wideexpansion of capacity.
Since transportation funding comes largely from a tax ongallons of gasoline, stabilizing VMT may also mean thatsources of transportation funding will not grow asrapidly as they have in the past. How the region cancreate a stable source of funding for needed transporta-tion improvements is an important question for plannersin the region to consider.
ReferencesMemmott, Jeffrey. 2007. Trends in Personal Income andPassenger Vehicle Miles. Bureau of Transportation StatisticsSpecial Report. October. http://www.bts.gov/publications/bts_special_report/2007_10_03/html/entire.html
Missouri Department of Transportation. 2006. Average AnnualDaily Vehicle Miles Traveled, 1979-2005. Data provided to East-West Gateway Council of Governments.
Polzin, Steven E. 2006. The Case for Moderate Growth inVehicle Miles of Travel: A Critical Juncture in U.S. TravelBehavior Trends. Center for Urban Transportation Research:Report Prepared for the U.S. Department of Transportation. http://www.cutr.usf.edu/pdf/The%20Case%20for%20Moderate%20Growth%20in%20VMT-%202006%20Final.pdf
Goodwin, Phil, Joyce Dargay and Mark Hanly. 2004.Elasticities of Road Traffic and Fuel Consumption with Respectto Price and Income: A Review. Transport Reviews 24(3) pp.275-292.
Szafran, Robert F. 2002. Age Adjusted Labor Force ParticipationRates, 1960-2045. Monthly Labor Review September. http://www.bls.gov/opub/mlr/2002/09/art3full.pdf
U.S. Department of Commerce, Bureau of Census. 1970.Census of Population and Housing.
U.S. Department of Commerce, Bureau of Census. 1980.Census of Population and Housing.
U.S. Department of Commerce, Bureau of Census. 1990.Census of Population and Housing.
U.S. Department of Commerce, Bureau of Census. 2000.Census of Population and Housing.
U.S. Department of Commerce, Bureau of Census. 2006.American Community Survey.
U.S. Department of Transportation, Bureau of TransportationStatistics. 2006. National Transportation Statistics.http://www.bts.gov/publications/national_transportation_statis-tics/
U.S. Department of Transportation, Federal HighwayAdministration. 2001. National Household Travel Survey.Accessed through Oak Ridge National Laboratory, Center forTransportation Analysis. http://nhts.ornl.gov/
U.S. Department of Transportation, Federal HighwayAdministration. 2007. Traffic Volume Trends. http://www.fhwa.dot.gov/ohim/tvtw/tvtpage.htm