Embed Size (px)
Citation preview
Visions in Leisure and Business Visions in Leisure and Business
Volume 16 Number 3 Article 3
1997
Trends in Taiwan's Tourism Market Trends in Taiwan's Tourism Market
Kuan-Chou Chen
Follow this and additional works at: https://scholarworks.bgsu.edu/visions
Recommended Citation Recommended Citation Chen, Kuan-Chou (1997) "Trends in Taiwan's Tourism Market," Visions in Leisure and Business: Vol. 16 : No. 3 , Article 3. Available at: https://scholarworks.bgsu.edu/visions/vol16/iss3/3
This Article is brought to you for free and open access by the Journals at ScholarWorks@BGSU. It has been accepted for inclusion in Visions in Leisure and Business by an authorized editor of ScholarWorks@BGSU.
TRENDS IN T AIW AN'S TOURISM MARKET
BY
DR. KUAN-CHOU CHEN, PRESIDENT
KCC CONSULTING 1200 HAPPY HOLLOW RD.
WEST LAFAYETTE, INDIANA 47906
ABSTRACT
In 1979, Taiwans government relaxed the outbound travel market. The situations of inbound and outbound travel market are gradually changing. The number of outbound travelers exceeded inbound travelers for the first time in 1989. With one of Asias highest economic growth rates, a huge accumulation of foreign exchange and appreciation on outbound travel, Taiwan has become a source of outbound tourists second in Asia only to Japan. From 1981 to 1995, the average growth rate of outbound travelers was 18% per year.
This study examines the recent trends in Taiwans inbound and outbound travel markets, analyses the structure of the travel market and offers a perspective for the future.
INTRODUCTION
Taiwan is situated in the Pacific Ocean about 100 miles off the southeastern coast of the Chinese mainland. Located about midway between Korea and Japan to the north and Hong Kong and the Philippines to the south, Taiwan is a natural gateway for travelers to and within Asia. Taiwan is about 234 miles long and 88 miles wide and
16
has an area of approximately 14,000 square miles.
Taiwan currently ranks among the top dozen trade countries in the world. In 1994, foreign trade earnings exceeded US$ 178 billion. Per capita GNP was US$ 11,604, ranking Taiwan 23rd in the world. Foreign exchange reserves equaled US$ 92.4 billion, which exceeded the reserves accumulated by any other country in the world. As its economy has grown, both inbound and outbound tourism for business and pleasure have increased. Taiwan is now the 9th largest tourist receiving country in Asia, and tourism is the 7th largest contributor to the country's foreign exchange earnings. At present, it attracts 1.8 million foreign tourists a year. They stay on average nearly a week and contribute gross expenditures to the economy equivalent to US$ 1. 7 billion annually.
Before 1989, the number of foreign travelers to Taiwan exceeded the number of Taiwanese traveling abroad. With one of Asia's highest economic growth rates, a huge accumulation of foreign exchange, and appreciation on outbound travel, Taiwan has become a source of outbound tourists second in Asia only to Japan. The number of outbound travelers exceeded inbound travelers for the first time in 1989. From 1981 to 1995, the average growth rate of
outbound travelers was 18% per year. Since 1987 the growth has increased even more rapidly and this remarkable rate of growth is expected to continue for the next few year.
This paper will investigate Taiwan tourism trends, including a secondary data situation analysis of its outbound and inbound travel markets. The objectives of this paper are to examine Taiwan's tourism industry and its impact over the next five to ten years. This effort will serve to create a comprehensive tourism development plan for tourism authorities and less ambitious marketing strategies for individual organizations.
THE INBOUND MARKET
In Table 1, over the period 1959-1995, inbound travel increased from 19,328 visits to 2,331,934 visits, a hundred-fold increase. The development of the inbound tourism market in Taiwan is divided into two stages. In the first stage (1950s-1970s), the people's standard of living had been low; the major national development policy was the focus of the development of agriculture, manufacturing, trade, and finance. Before 1960, less than 20,000 tourist arrivals per year were recorded. In 1964, the government of Japan permitted its people to travel abroad. Japan has become the largest inbound tourism market for Taiwan. Japanese tourists are attracted to Taiwan because of its nearby location, its similar culture and history, and its low costs. Especially, most Taiwanese are able to communicate with Japanese tourists in Japanese. Tourism from Japan made Taiwan's inbound tourism market grow rapidly. The period between 1959 and 1973 was one of strong and sustained growth, averaging 30.6% a year. Due to the serious global oil crisis in 1973, 1974 was the first year that recorded a decline.
17
In the mid 1970s, Taiwans inbound market moved into the second stage, because the economy was growing rapidly. The standard of living improved and infrastructure improvements increased as the result of the inbound travel trend. Taiwan exceeded one million tourist arrivals for the first time in 1976. Growth in arrivals took place each year during the early 1980s; the first decline after 1974's energy crisis-induced decline was not recorded until 1985. However, from 1980 to 1984, the annual growth rates were not as high as in previous years, averaging 2.5% a year. Although Taiwan exceeded 1.5 million tourist arrivals for the first time in 1984, it was a hard struggle to reach and maintain this level for the next year. The decline of 1985 was the result of long-term visa difficulties, insufficient investment in and development of tourist areas and attractions, declining ground handling service standards, a low level of overseas marketing activity, and fierce competition from neighboring countries ( 10). Since then, in order to keep the tourism industry growing and expand the economic benefits across the country, the government has sought to improve tourist facilities and develop attractions in all parts of the country. It also spent much more money on overseas marketing activities for promotions to attract visitors from the 1986 Asia Games and the 1988 Olympics (both held in nearby South Korea). Thus, from 1986 to 1988, there was again a high visitorarrival growth rate, averaging 10% a year. The number of foreign visitors to Taiwan reached a peak and broke the two million mark in 1989, but the growth rate was not as high as that in the previous three years.
In 1990, the number of inbound tourists was 1.9 million, down 3.5% from the previous year. This situation has sustained for four years (1990-1993). The major reasons for this decline was the global economic
recession. It reduced a lot of inbound travel, both leisure and business. Another reasons for these declines was the rapid appreciation of New Taiwanese (NT) dollars. Because of Taiwans rapid economic growth and increasing amounts of disposable personal income, NT became the "hot money" in the world. Since 1988, the exchange rates to the U.S. dollar has been up from NT $40.1 to about NT $27.5. When this deterrent is combined with limited international air routes and airline capacity and strong competitive pressure from neighboring countries, this rise made Taiwan a high-cost destination.
For the purpose of comparison of the major travel inbound markets, Table 2 and 3 ranks tourist generating countries according to the number of foreign visit arrivals in Taiwan in 1990 and 1994. The major inbound travel markets have been generated by Asian countries and the United States. In 1990, almost half of the market share came from Japan, with 47.4%, followed by the U.S.A. with 11.6%, Hong Kong with 10%, and South Korea with 7.8%. These four most important generators accounted for a total of 76.8% of all international visitor arrivals. Other important Asia origins were Singapore with 3.1 % and Malaysia with 2.6%. The main European generating countries were West Germany and the United Kingdom (U.K.). However, in 1994, the market structure has been changed. Although Japan supplied more than 914,325 visitors and still had the largest market share (39.2%) in 1994, Japanese v1s1tation declined by 8.2% between 1990 and 1994. U.S.A., Hong Kong and South Korea kept steady growth. As result of the fast growth of real estate and stock market, Taiwan's industry structure moved from manufacture industry toward service industry. A lack of work forces brought in a lot of foreign labors from nearby countries. Thus,
18
Thailand and Philippines became two rapid growth countries in Taiwans inbound travel market.
Table 4 displays visitors arrivals to Taiwan from main markets by residence in the past ten years. The growth rates of foreign visitor arrivals in Taiwan largely depend on the Japanese market Japan advocated its "Ten Million Program" to boost outbound travel to 10 million by 1992, but Taiwan's market share in Japanese outbound travel still fell. (Table 4) Visitor arrivals to Taiwan from main markets by residence 1986-1995 did not increase with this opportunity. The growth rates of visitor arrivals from Japan has also declined since 1987. In 1990, the Japanese began to sustain negative growth for four years. Until 1994, when it returned to normal growth rate.
Hong Kong is the source for the vast majority of overseas Chinese visitors to Taiwan. Since China eased its travel restrictions, many Hong Kong visitors have turned to travel in China. The Hong Kong market has produced continuous negative growth rates of visitor arrivals since 1987, averaging -6.6%. It returned positive growth rate in 1992, paused by China reclaiming control of Hong Kong in 1997. An immense wave of emigration began in Hong Kong in response to anxieties over the impending 1997 handover of sovereignty.
There has been remarkable growth rates of visitor arrivals from South Korea due to liberalization of its outbound travel. The gradual lifting of its long-standing outbound travel restrictions began in 1988, followed by their complete removal on January 1, 1989 ( 10). This explains why visitation from South Korea grew an amazing 104.5% in 1988, followed by an additional 51.2% increase in 1989. From 1986 to 1995, total
arrivals from South Korea increased from 34,743 to 146,012, a rise of 320%. During the 1992 and 1993, because South Korea formally establish diplomatic relations with China and ceased the diplomatic relations with Taiwan, the visitors from South Korea was dramatically dropped.
Although total numbers from the European market were small, this market has shown positive growth rates continuously since 1987, from 85,276 in 1986 to 144,717 in 1995, a rise of 69.7%.
Visitor arrivals from the main generating countries, listed according to purpose of visit in 1995 appear in Figure 1. The prominent purpose for Japanese was pleasure (69.7%; see Table 6). Pleasure played a greater role for Asian visitors: 33.3% for Hong Kong, 48.7% for South Korea, and 15% for Southeast Asian countries. The most common purpose of visits for arrivals from European countries was business, 63.8%. The main purpose of visits from the U.S.A. was business at 39.5%, followed by visits to relatives at 30.5%; pleasure was only 17.7%.
The percentages of visitors listed according to purpose of visit in 1990 and 1995 are given in Table 5 and Table 6. The tables show that the majority of visits were for the purpose of pleasure throughout this period. Comparing Table 5 and Table 6, the distribution of visitors by purpose has shown a drastic change of pattern. For all visitors, the trend in numbers for pleasure as
· a percentage of the total is downward,dropping from 53.7% to 40.3%, while thetrend in numbers for business as apercentage of the total is upward; thebusiness share has increased from 20.7% to28%. As the economy has grown rapidly,there is no question that business hasbecome a growing and important source of
19
visitors over this period. The purpose of visiting relatives has also increased from 7.2% to 10.3%. The actual proportion among this group was probably much higher, because many visitors were overseas Chinese who did not state their purpose of visit. Thus, there is an average of 14.5% a year in the unstated group.
THE OUTBOUND TRAVEL MARKET
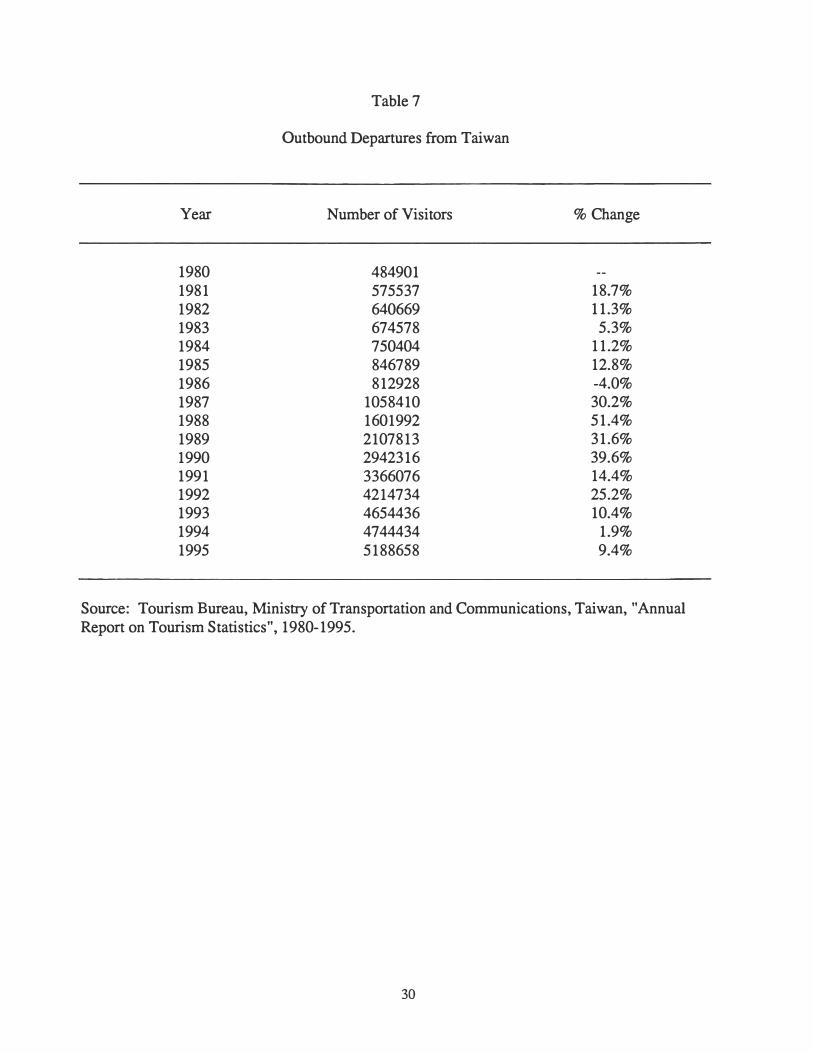
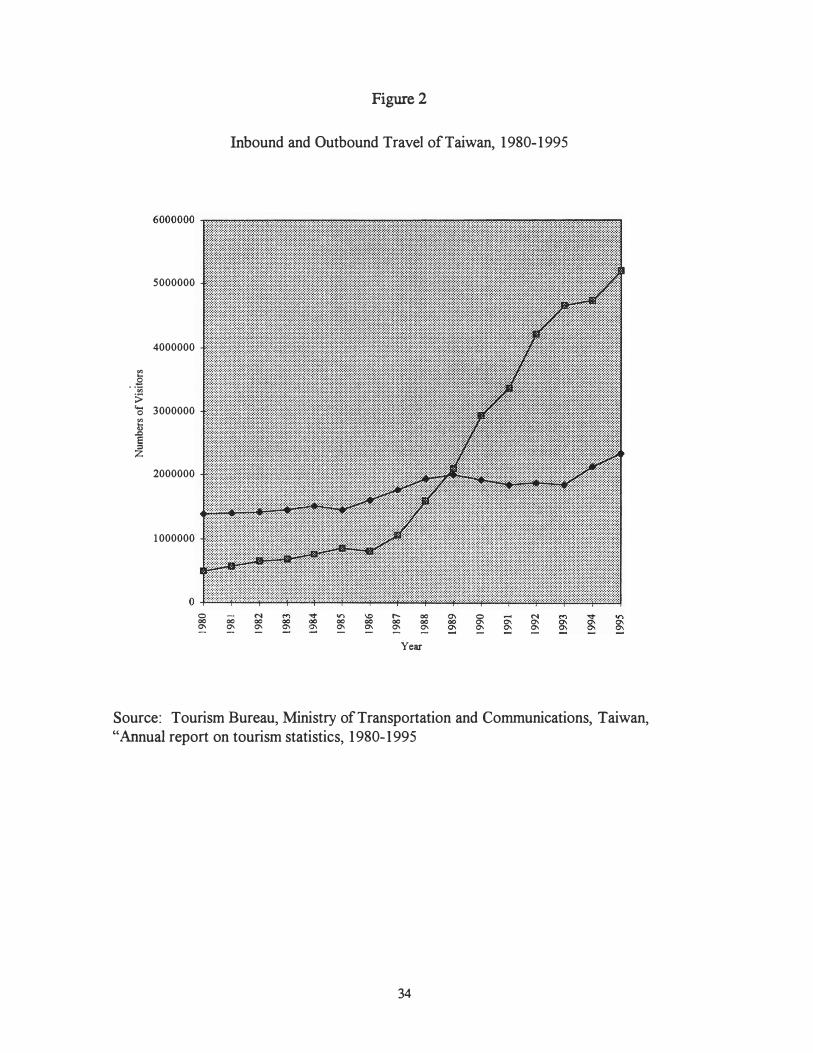
In 1979, the Taiwanese government relaxed its ban on overseas travel (8). In other words, the development of Taiwans outbound travel market comprises only 19 years. Since outbound travel was first opened up in 1979, Taiwan has become the largest tourism market . in Asia with the exception of Japan. Table 7 displays the outbound departures from Taiwan, 1980-1995. From 1980 to 1995, outbound departures increased from 484,901 to about 5,188,658, a rise of 970%, ten times the 1980 level. During the same period, with the exception of 1986, the annual growth rates of outbound departures increased much more than those of foreign visitor arrivals. Since the R.O.C. government lifted the restrictions on family visits to mainland China at the end of 1987, the number of outbound travelers from Taiwan has shown remarkable growth. Outbound travel increased by an amazing 51.2% in 1988 to a total of 1.6 million overseas travelers. Overseas trips continued to soar in 1989, up 31.6% to 2.1 million. The ratio of Taiwanese traveling abroad to the total population has exceeded 10% to become the highest in Asia, and growth is expected to continue at high rates. Figure 2 shows the comparison of inbound and outbound travel of Taiwan, 1980-1994. In 1989 the number of outbound travelers outpaced inbound travelers for the first time. In 1990 and 1991, the number of outbound travelers
continued to outnumber inbound visitors and grew at the high rates of 39.6% and 14.4%; at the same time, the number of inbound travelers declined by 3.5% and 4.1%.
Not only did the number of outbound travelers from Taiwan exceed those of inbound travelers, but the amount the Taiwanese tourists spent overseas was many times more than the amount spent by foreign visitors in Taiwan. Although there are no firm statistics on travel expenditures of Taiwanese abroad, according to the R.O.C. Tourism Bureau and Central Bank of Taiwan estimates, 1.1 million travelers from Taiwan spent more than US$ 3 billion overseas, about US$ 3,000 a person in 1987. During the same year, 1.8 million tourists to Taiwan spent only US$ 1.6 billion (Boydell, 1987). There is no doubt that Taiwan's tourism recorded a substantial deficit. The main reason is the appreciation of NT$ dollar. This makes it more expensive for foreign visitors to visit Taiwan but less expensive for Taiwanese to visit foreign · destinations. The spending power of Taiwanese tourists and the remarkable growth of outbound travel have attracted the attention of countries all over the world and have made Taiwan a tourist market that everyone is seeking to exploit. Efforts by countries to attract Taiwanese tourists include relaxed restncttons, publicity campaigns, and establishment of tourism offices in Taipei.
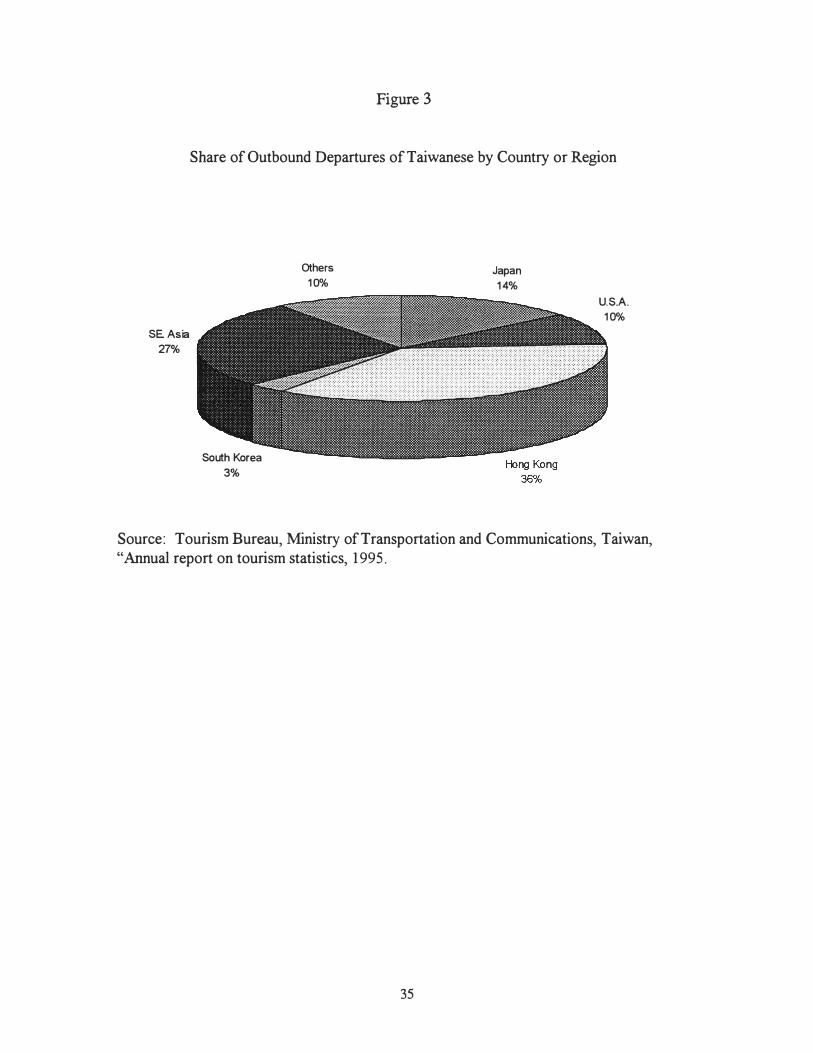
Major destinations visited by Taiwanese travelers were other Asian countries and the United States. Because of their nearby location, low cost, business investment and similar culture, the share of other Asian countries as overseas destinations has expanded against the share of other world destinations (see Figure 3). Table 8 shows that the top five overseas destinations of
20
travelers from Taiwan during the past nine years were Japan, Hong Kong, U.S.A., Korea, and Thailand. Japan used to be the most popular destination for Taiwanese travelers, but the market share of Japan has declined during the past nine years. Since the R.O.C. government relaxed restrictions on visiting friends and relatives to mainland China at the end of 1987, Hong Kong has taken over Japan's position. The growth rate of outbound departures to Hong Kong was an incredible 218.1 % in the single year 1988. Since then, Hong Kong has captured over a one-third market share of the total Taiwanese outbound travel market, averaging a 100.7% growth rate per year (see Table 9).
Because there were no direct air routes between Taiwan and mainland China, most Taiwanese visited mainland China via Hong Kong. Moreover, Hong Kong is a "shopping paradise" for Taiwanese travelers. Because of its low costs and visa relaxation, Thailand was the most popular destination among Southeast Asian countries and substituted for U.S.A. and Korea market shares in recent year. The average growth rate of Thailand as a travel destination for Taiwanese from 1987 to 1995 was 26.3%. Although the market share of the U.S. has declined yearly since 1986, Taiwanese travel to the U.S. has grown average 15.9% per year.
CONCLUSIONS
International travel is likely to be one of Taiwan's growth industries in the next decade. An economic boom, political democratization, increased leisure time, and
. fashion consciousness are encouraging more Taiwanese to take foreign trips. On the other hand, the appreciation of the New Taiwanese dollar and the problems of lack
of airline seats, visa restrictions, high hotel room rates, environmental pollution, traffic congestion, lack of facilities in resort areas, and a lack of promotion blunt the competitive edge of Taiwan's inbound travel industry.
In conclusion, with the currently strong New Taiwanese dollar and a continuing improving in disposable income, the rapid growth in outbound travel from Taiwan over the last few years is expected to continue. The development of Taiwan's international tourism market (both inbound and outbound) are based on the following situations: the international economy will recover gradually; international politics and military affairs will not change dramatically; Taiwan's government will continue international tourism development at current levels or increase moderately; Taiwan's domestic politics, economy, and consumer prices will remain stable; domestic tourism facilities will satisfy tourists' needs (e.g., supply will keep up with demand); infrastructure will keep up with tourism development.
The international tourism industry is destined to emerge as the largest industry of the world by the tum of this century because of modem society's heavy emphasis on leisure and outdoor recreation ( 1 ). For many countries today, tourism is the most important form of international trade. Despite the rapid growth of Taiwan's economy, Taiwan still accounts for a relatively small share of international tourism as a
21
recipient. Tourism receipts were only 4.5% of the total value of its exports and approximately 1.3% of its GNP in 1994. Thus, there remains great room for tourism development.
To cope with the appreciation of the New Taiwanese dollar and increasing pressure from international competition, Taiwan needs to adjust its marketing strategies. It needs to revise its usual undifferentiated marketing strategy and design a new target market strategy focusing on the highconsumption power group in order to overcome its diminishing competitiveness on price. It also needs to design new products with high quality and expand existing tourist attractions. rJie creation of more international events is another methcxi for rejuvenating the island's tourism industry. The Taipei Lantern Festival, which is held two weeks after the Chinese New Year, is a successful example.
In addition to such promotions, the government should adjust tourism policy easing visa restrictions and providing a favorable environment for tourism investment, operation, and development. For instance, Taiwans government allowed citizens of 12 nations to visit Taiwan for up to 14 days without visas. The measure became effective January 1, 1995, and applied to citizens of the U.K., France, Germany, Austria, the Netherlands, Belgium, Luxembourg, U.S.A., Japan, Canada, New Zealand and Australia.
REFERENCES
1. Z. U. Ahmed and F. B. Krohn, Reversing the United States' Declining Competitiveness in theMarketing of International Tourism: A Perspective on Future Policy, Journal of Travel Research27, 1990.
2. M. Boyden, Taiwan: Smoother Flight for Airlines, Journal of Commerce and Commercial,(Oct. 1 O}, p. 7 A, 1990.
3. M. Boyden, Taiwan: Government, Industry Move to Boost Tourism, Journal of Commerceand Commercial, (Oct. 1 O}, p. 6A, 1990.
4. M. Boyden, Taiwan: Tourism Making Comeback, Journal of Commerce and Commercial,{Oct. 10}, p. 2C, 1991.
5. C.-Y. Chao, International Tourism in Taiwan, Department of Park, Recreation and TourismResources, East Lansing, Michigan State University, 1990.
6. Government Information Office, A Brief Introduction to the Republic of China, Taipei,Government Information Office, 1995.
7. J. S. Hobson, Hong Kong: The Transition to 1997, Tourism Management, Vol. 16(1), pp.15-20, 1995.
8. C.-T. Huang, C.-Y. Yung, et al., Trends in Outbound Tourism from Taiwan, TourismManagement, pp. 223-228, 1996.
9. Y. D. Hwang, The Rise of a New World Economic Poser: Postwar Taiwan, GreenwoodPress, New York, New York, 1991.
10. International Tourism Reports Japan (1988), South Korea (1990), Taiwan (1986), London:The Economist Publications.
11. H. Nozawa, A Marketing Analysis of Japanese Outbound Travel, Tourism ManagementVol. 13(3), pp. 226-233, 1992.
12. B. Prideaux, Recent Developments in the Taiwanese Tourist Industry--Implications forAustralia, International Journal of Contemporary Hospitality Management, Vol. 8(1), pp. 10-15,1996.
13. L. K. Richter, The Politics of Tourism in Asia, University of Hawaii Press, Honolulu,Hawaii, 1989.
14. M. V. Roo, Researching the Taiwan Market: A Very Different Consumer, Marketing andResearch Today, Vol. 17(1), pp. 54-57, 1989.
22
15. The R.0.C. Tourism Bureau (1980-1994), Report on Tourism Statistics, Taipei: Taiwan,Ministry of Communications.
16. D. Wasserman, Asia/Pacific: Taiwan Takes a New Look at the Leisure Market, TravelWorld News, pp. 62-63, 1992.
17. S. R. Waters, The Fastest Growing Travel Markets in the World--East Asia, Travel IndustryWorld Yearbook, 35, 1991.
23
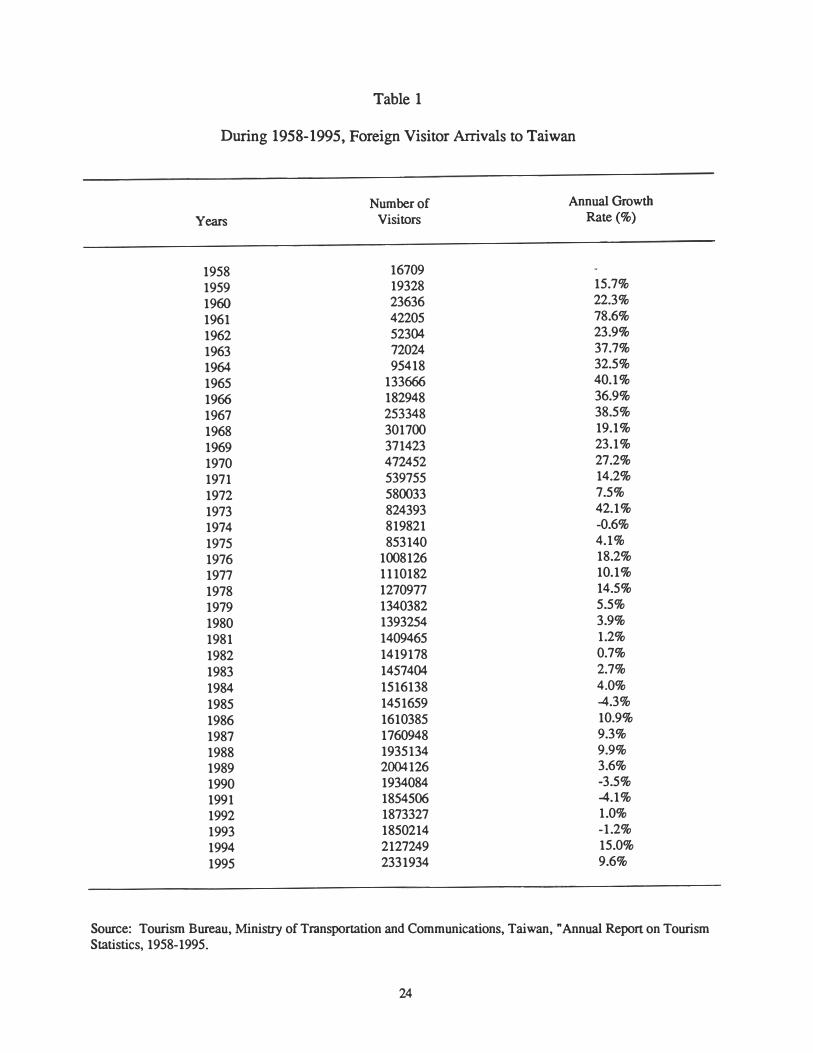
Table 1
During 1958-1995, Foreign Visitor Arrivals to Taiwan
Number of Annual Growth
Years Visitors Rate(%)
1958 16709
1959 19328 15.7%
1960 23636 22.3%
1961 42205 78.6%
1962 52304 23.9%
1963 72024 37.7%
1964 95418 32.5%
1965 133666 40.1%
1966 182948 36.9%
1967 253348 38.5%
1968 301700 19.1%
1969 371423 23.1%
1970 472452 27.2%
1971 539755 14.2%
1972 580033 7.5%
1973 824393 42.1%
1974 819821 -0.6%
1975 853140 4.1%
1976 1008126 18.2%
1977 1110182 10.1%
1978 1270977 14.5%
1979 1340382 5.5%
1980 1393254 3.9%
1981 1409465 1.2%
1982 1419178 0.7%
1983 1457404 2.7%
1984 1516138 4.0%
1985 1451659 -4.3%
1986 1610385 10.9%
1987 1760948 9.3%
1988 1935134 9.9%
1989 2004126 3.6%
1990 1934084 -3.5%
1991 1854506 -4.1%
1992 1873327 1.0%
1993 1850214 -1.2%
1994 2127249 15.0%
1995 2331934 9.6%
Source: Tourism Bureau, Ministry of Transportation and Communications, Taiwan, "Annual Report on Tourism Statistics, 1958-1995.
24
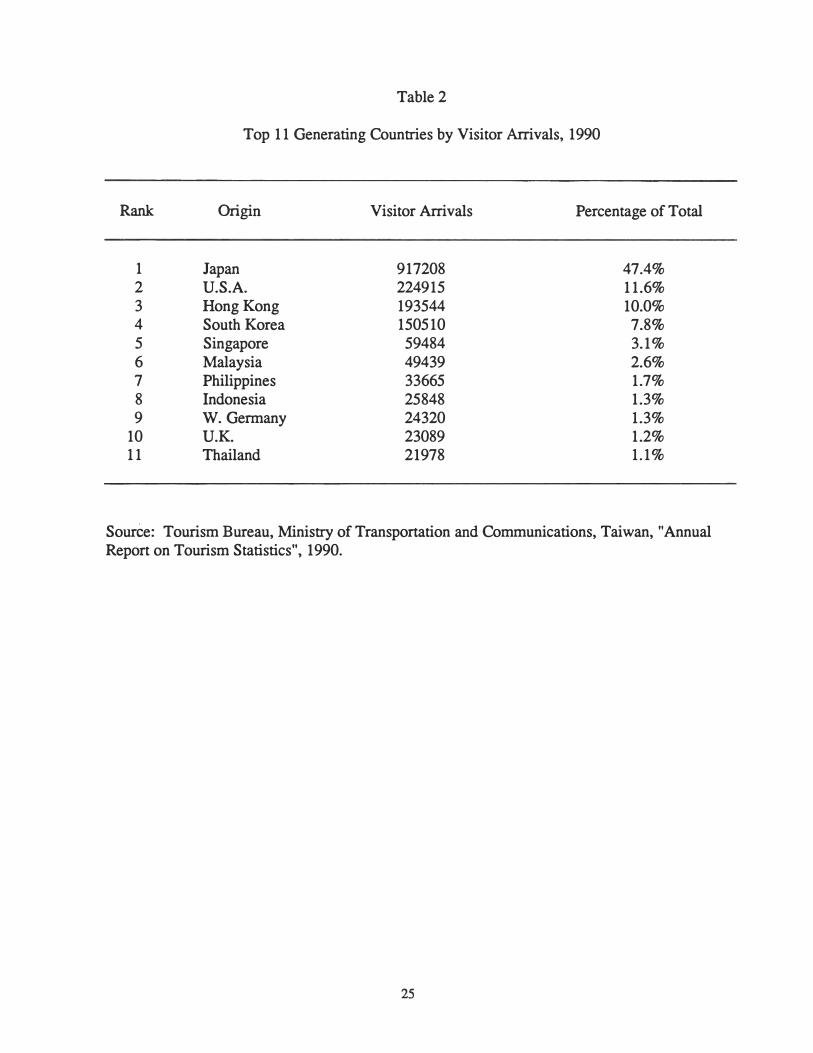
Table 2
Top 11 Generating Countries by Visitor Arrivals, 1990
Rank Origin Visitor Arrivals Percentage of Total
1 Japan 917208 47.4% 2 U.S.A. 224915 11.6% 3 Hong Kong 193544 10.0% 4 South Korea 150510 7.8% 5 Singapore 59484 3.1% 6 Malaysia 49439 2.6% 7 Philippines 33665 1.7% 8 Indonesia 25848 1.3% 9 W. Germany 24320 1.3%
10 U.K. 23089 1.2% 11 Thailand 21978 1.1%
Source: Tourism Bureau, Ministry of Transportation and Communications, Taiwan, "Annual Report on Tourism Statistics", 1990.
25

Table 3
Top 11 Generating Countries by Visitor Arrivals, 1995
Rank Origin Visitor Arrivals Percentage of Total
1 Japan 914325 39.2% 2 U.S.A. 290138 12.4% 3 Hong Kong 246747 10.6% 4 Thailand 147410 6.3% 5 South Korea 146012 6.3% 6 Philippines 96336 4.1% 7 Singapore 70564 3.0% 8 Malaysia 54112 2.3% 9 Indonesia 46486 2.0%
10 W. Germany 32944 1.4% 11 U.K. 28947 1.2%
Source: Tourism Bureau, Ministry of Transportation and Communications, Taiwan, "Annual Report on Tourism Statistics", 1995.
26
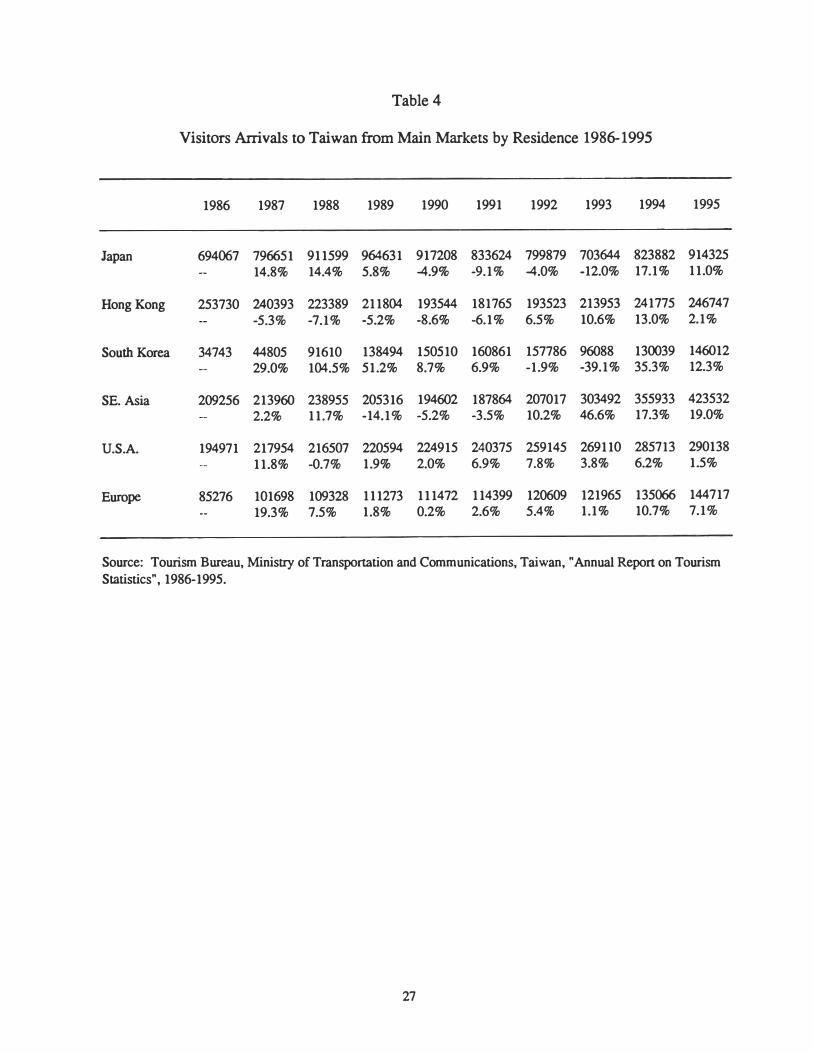
Table 4
Visitors Arrivals to Taiwan from Main Markets by Residence 1986-1995
1986 1987 1988 1989 1990 1991 1992 1993 1994 1995
Japan 694067 796651 911599 964631 917208 833624 799879 703644 823882 914325
14.8% 14.4% 5.8% -4.9% -9.1% -4.0% -12.0% 17.1% 11.0%
Hong Kong 253730 240393 223389 211804 193544 181765 193523 213953 241775 246747
-5.3% -7.1% -5.2% -8.6% -6.1% 6.5% 10.6% 13.0% 2.1%
South Korea 34743 44805 91610 138494 150510 160861 157786 96088 130039 146012
29.0% 104.5% 51.2% 8.7% 6.9% -1.9% -39.1% 35.3% 12.3%
SE. Asia 209256 213960 238955 205316 194602 187864 207017 303492 355933 423532
2.2% 11.7% -14.1% -5.2% -3.5% 10.2% 46.6% 17.3% 19.0%
U.S.A. 194971 217954 216507 220594 224915 240375 259145 269110 285713 290138
11.8% -0.7% 1.9% 2.0% 6.9% 7.8% 3.8% 6.2% 1.5%
Europe 85276 101698 109328 111273 111472 114399 120609 121965 135066 144717
19.3% 7.5% 1.8% 0.2% 2.6% 5.4% 1.1% 10.7% 7.1%
Source: Tourism Bureau, Ministry of Transportation and Communications, Taiwan, "Annual Report on Tourism
Statistics", 1986-1995.
27
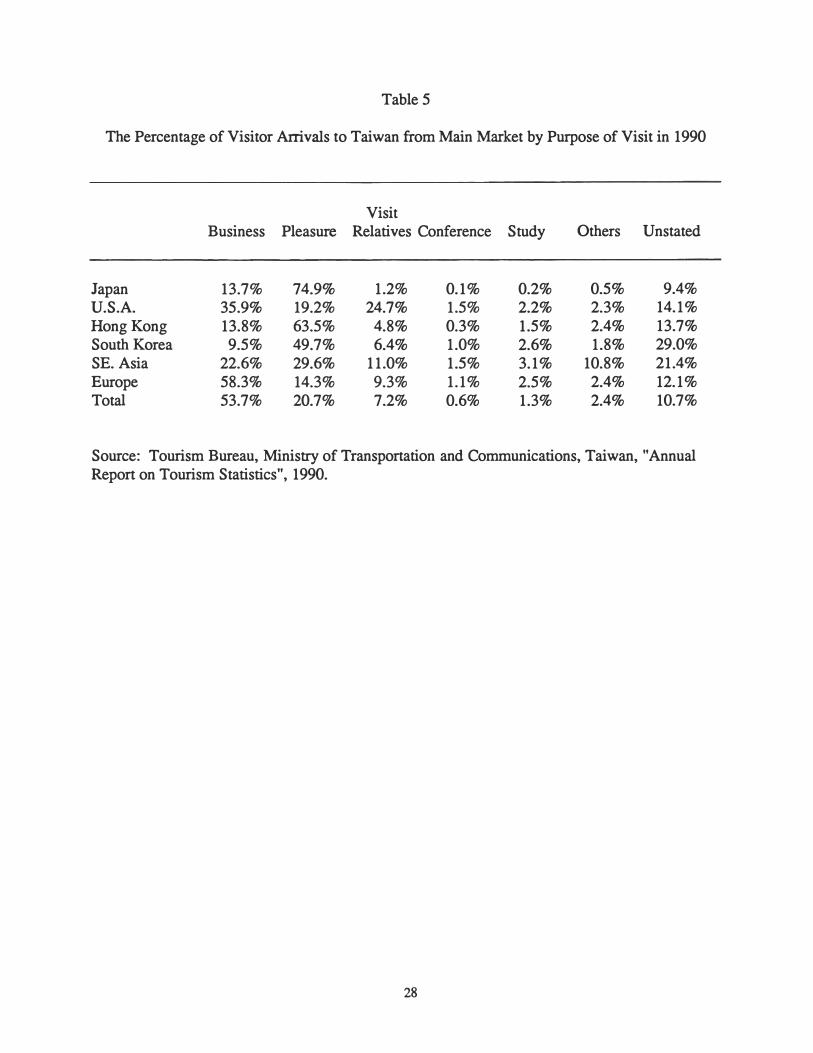
Table 5
The Percentage of Visitor Arrivals to Taiwan from Main Market by Purpose of Visit in 1990
Visit Business Pleasure Relatives Conference Study Others Unstated
Japan 13.7% 74.9% 1.2% 0.1% 0.2% 0.5% 9.4% U.S.A. 35.9% 19.2% 24.7% 1.5% 2.2% 2.3% 14.1% Hong Kong 13.8% 63.5% 4.8% 0.3% 1.5% 2.4% 13.7% South Korea 9.5% 49.7% 6.4% 1.0% 2.6% 1.8% 29.0% SE. Asia 22.6% 29.6% 11.0% 1.5% 3.1% 10.8% 21.4% Europe 58.3% 14.3% 9.3% 1.1% 2.5% 2.4% 12.1% Total 53.7% 20.7% 7.2% 0.6% 1.3% 2.4% 10.7%
Source: Tourism Bureau, Ministry of Transportation and Communications, Taiwan, "Annual Report on Tourism Statistics", 1990.
28
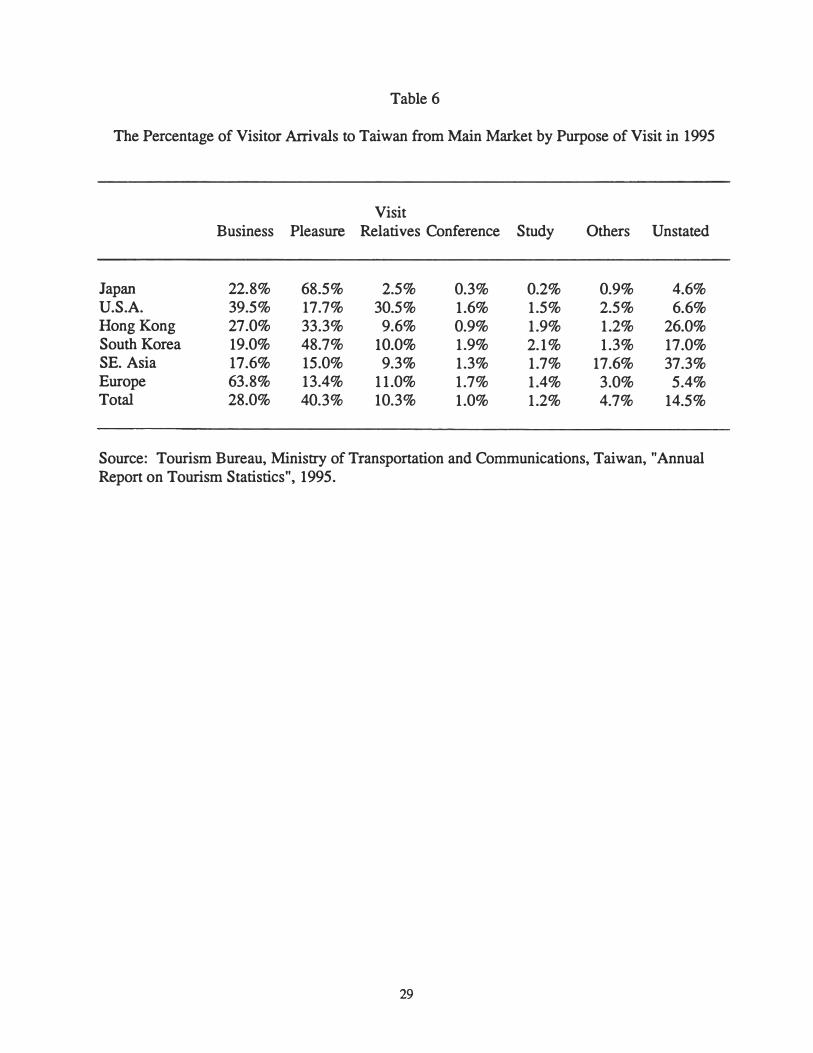
Table 6
The Percentage of Visitor Arrivals to Taiwan from Main Market by Purpose of Visit in 1995
Visit Business Pleasure Relatives Conference Study Others Unstated
Japan 22.8% 68.5% 2.5% 0.3% 0.2% 0.9% 4.6% U.S.A. 39.5% 17.7% 30.5% 1.6% 1.5% 2.5% 6.6% Hong Kong 27.0% 33.3% 9.6% 0.9% 1.9% 1.2% 26.0% South Korea 19.0% 48.7% 10.0% 1.9% 2.1% 1.3% 17.0% SE. Asia 17.6% 15.0% 9.3% 1.3% 1.7% 17.6% 37.3% Europe 63.8% 13.4% 11.0% 1.7% 1.4% 3.0% 5.4% Total 28.0% 40.3% 10.3% 1.0% 1.2% 4.7% 14.5%
Source: Tourism Bureau, Ministry of Transportation and Communications, Taiwan, "Annual Report on Tourism Statistics", 1995.
29
Year
1980 1981 1982 1983 1984 1985 1986 1987 1988 1989 1990 1991 1992 1993 1994 1995
Table 7
Outbound Departures from Taiwan
Number of Visitors
484901 575537 640669 674578 750404 846789 812928
1058410 1601992 2107813 2942316 3366076 4214734 4654436 4744434 5188658
% Change
18.7% 11.3% 5.3%
11.2% 12.8% -4.0%30.2%51.4%31.6%39.6%14.4%25.2%10.4%1.9% 9.4%
Source: Tourism Bureau, Ministry of Transportation and Communications, Taiwan, "Annual Report on Tourism Statistics", 1980-1995.
30
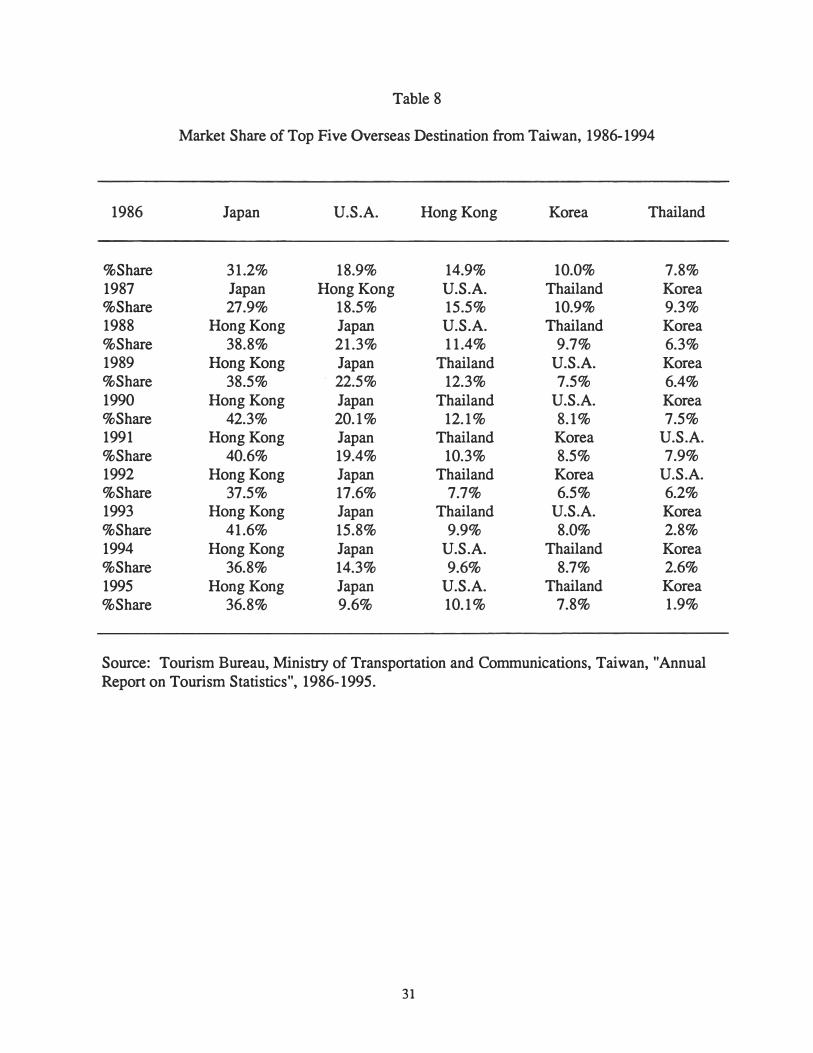
Table 8
Market Share of Top Five Overseas Destination from Taiwan, 1986-1994
1986 Japan U.S.A. Hong Kong Korea Thailand
%Share 31.2% 18.9% 14.9% 10.0% 7.8% 1987 Japan Hong Kong U.S.A. Thailand Korea %Share 27.9% 18.5% 15.5% 10.9% 9.3% 1988 Hong Kong Japan U.S.A. Thailand Korea %Share 38.8% 21.3% 11.4% 9.7% 6.3% 1989 Hong Kong Japan Thailand U.S.A. Korea %Share 38.5% · 22.5% 12.3% 7.5% 6.4% 1990 Hong Kong Japan Thailand U.S.A. Korea %Share 42.3% 20.1% 12.1% 8.1% 7.5% 1991 Hong Kong Japan Thailand Korea U.S.A. %Share 40.6% 19.4% 10.3% 8.5% 7.9% 1992 Hong Kong Japan Thailand Korea U.S.A. %Share 37.5% 17.6% 7.7% 6.5% 6.2% 1993 Hong Kong Japan Thailand U.S.A. Korea %Share 41.6% 15.8% 9.9% 8.0% 2.8% 1994 Hong Kong Japan U.S.A. Thailand Korea %Share 36.8% 14.3% 9.6% 8.7% 2.6% 1995 Hong Kong Japan U.S.A. Thailand Korea %Share 36.8% 9.6% 10.1% 7.8% 1.9%
Source: Tourism Bureau, Ministry of Transportation and Communications, Taiwan, "Annual Report on Tourism Statistics", 1986-1995.
31
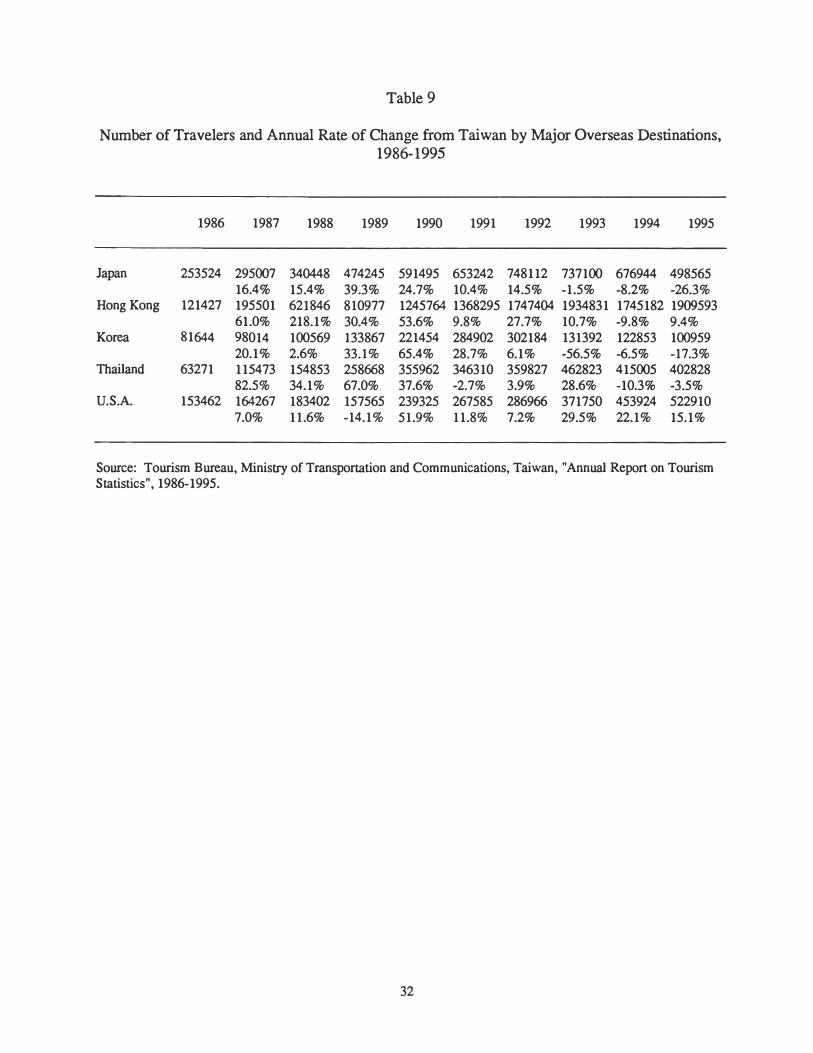
Table 9
Number of Travelers and Annual Rate of Change from Taiwan by Major Overseas Destinations, 1986-1995
1986 1987 1988 1989 1990 1991 1992 1993 1994 1995
Japan 253524 295007 340448 474245 591495 653242 748112 737100 676944 498565 16.4% 15.4% 39.3% 24.7% 10.4% 14.5% -1.5% -8.2% -26.3%
Hong Kong 121427 195501 621846 810977 1245764 1368295 1747404 1934831 1745182 1909593 61.0% 218.1% 30.4% 53.6% 9.8% 27.7% 10.7% -9.8% 9.4%
Korea 81644 98014 100569 133867 221454 284902 302184 131392 122853 100959 20.1% 2.6% 33.1% 65.4% 28.7% 6.1% -56.5% -6.5% -17.3%
Thailand 63271 115473 154853 258668 355962 346310 359827 462823 415005 402828 82.5% 34.1% 67.0% 37.6% -2.7% 3.9% 28.6% -10.3% -3.5%
U.S.A. 153462 164267 183402 157565 239325 267585 286966 371750 453924 522910 7.0% 11.6% -14.1% 51.9% 11.8% 7.2% 29.5% 22.1% 15.1%
Source: Tourism Bureau, Ministry of Transportation and Communications, Taiwan, "Annual Report on Tourism Statistics", 1986-1995.
32
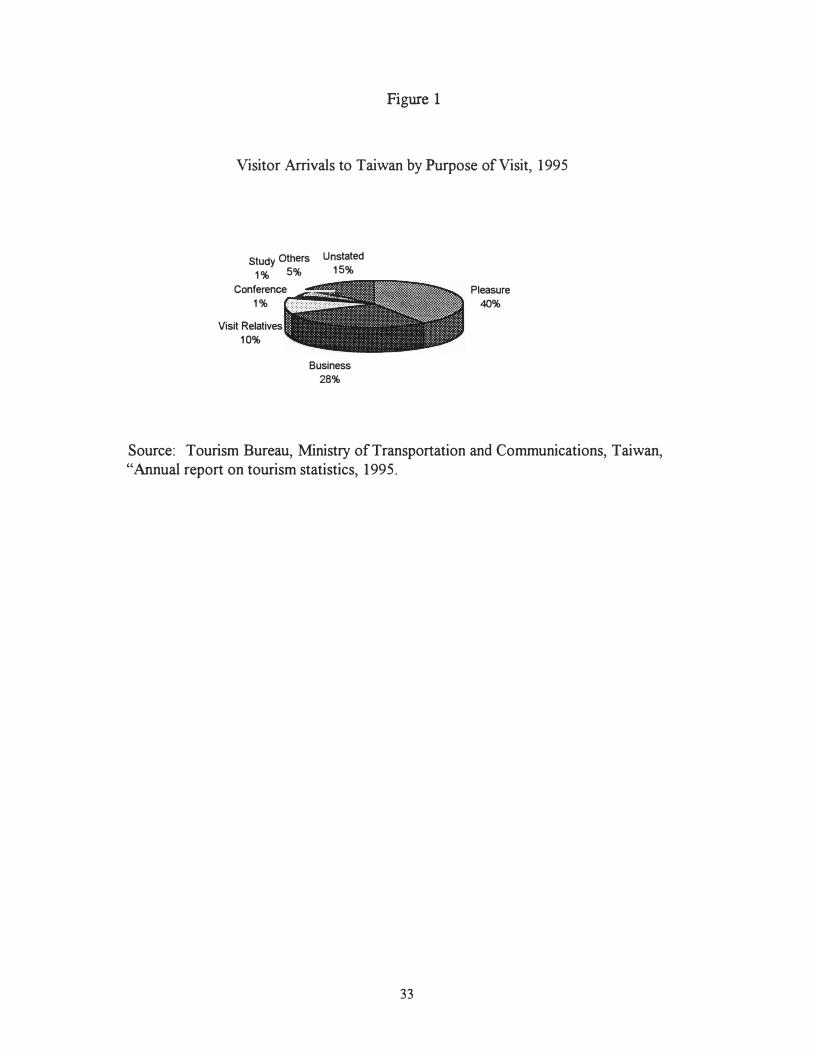
Figure 1
Visitor Arrivals to Taiwan by Purpose of Visit, 1995
Study Others Unstated
1% 5% 15%
Conference .J1111111Z:.�•
1%
Visit Relatives
10%
Business
28%
Pleasure
40%
Source: Tourism Bureau, Ministry of Transportation and Communications, Taiwan, "Annual report on tourism statistics, 1995.
33
<ll � . .@
� c.... 0
<ll
� .0
E ::s
z
5000000
4000000
3000000
2000000
1000000
0 00 °'
Figure 2
Inbound and Outbound Travel of Taiwan, 1980-1995
00 °'
N 00 °'
II') 00 °'
r--00 °'
00 00 °'
Year
0 °' °'
N °' °'
Source: Tourism Bureau, Ministry of Transportation and Communications, Taiwan, "Annual report on tourism statistics, 1980-1995
34
SE Asia
27%
Figure 3
Share of Outbound Departures of Taiwanese by Country or Region
South Korea
3%
Others
10% Japan
14%
U.S.A.
10%
Source: Tourism Bureau, Ministry of Transportation and Communications, Taiwan, "Annual report on tourism statistics, 1995.
35