Embed Size (px)
Citation preview
Trends in Terrestrial Carbon Sinks Trends in Terrestrial Carbon Sinks Driven by Hydroclimatic Change Driven by Hydroclimatic Change since 1948: Data-Driven Analysis since 1948: Data-Driven Analysis
using FLUXNETusing FLUXNET
Christopher Schwalm, Christopher Williams, Kevin Schaefer, Kusum Naithani, Jingfeng Xiao
Ameriflux Science Meeting & 3rd NACP All-Investigators Meeting 2011
January 31 – February 4, New Orleans, LA
• We ask– What are the carbon consequences of hydrologic
change?• We merge
– Global monitoring network (FLUXNET)– LUH time-varying land cover (IPCC AR5)– NCEP/NCAR Reanalysis
• We derive– Monthly time series (1948 – 2009)– 1° latitude/longitude resolution– Observationally-based estimates of carbon flux solely
attributable to hydrologic change
Outline
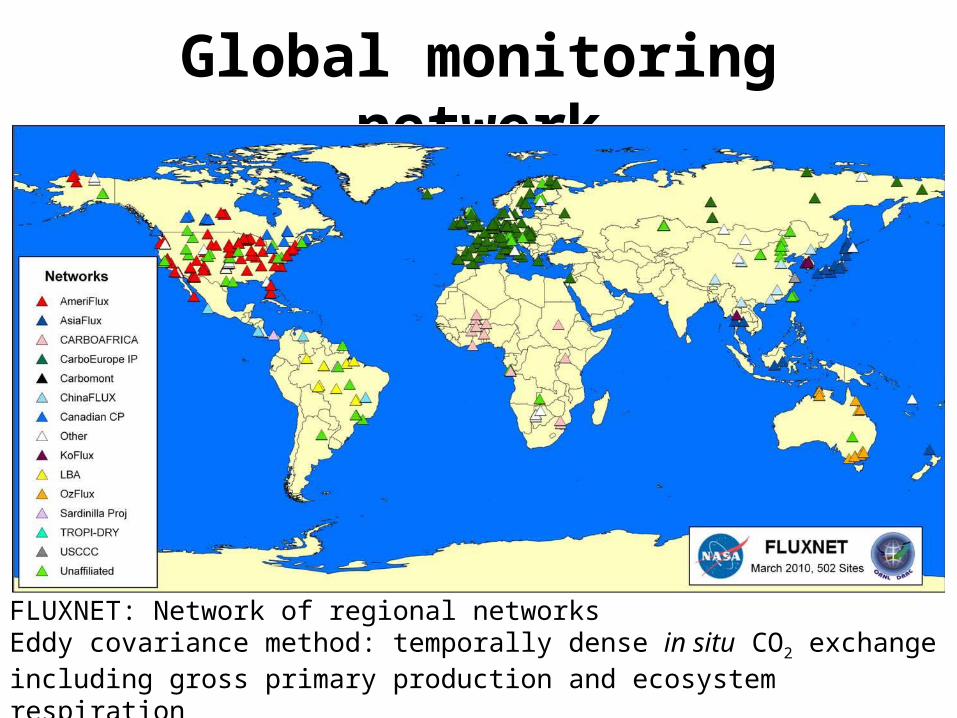
Global monitoring network
FLUXNET: Network of regional networksEddy covariance method: temporally dense in situ CO2 exchange including gross primary production and ecosystem respirationAncillary data: soil moisture, temperature, latent heat flux, LAI, etc.
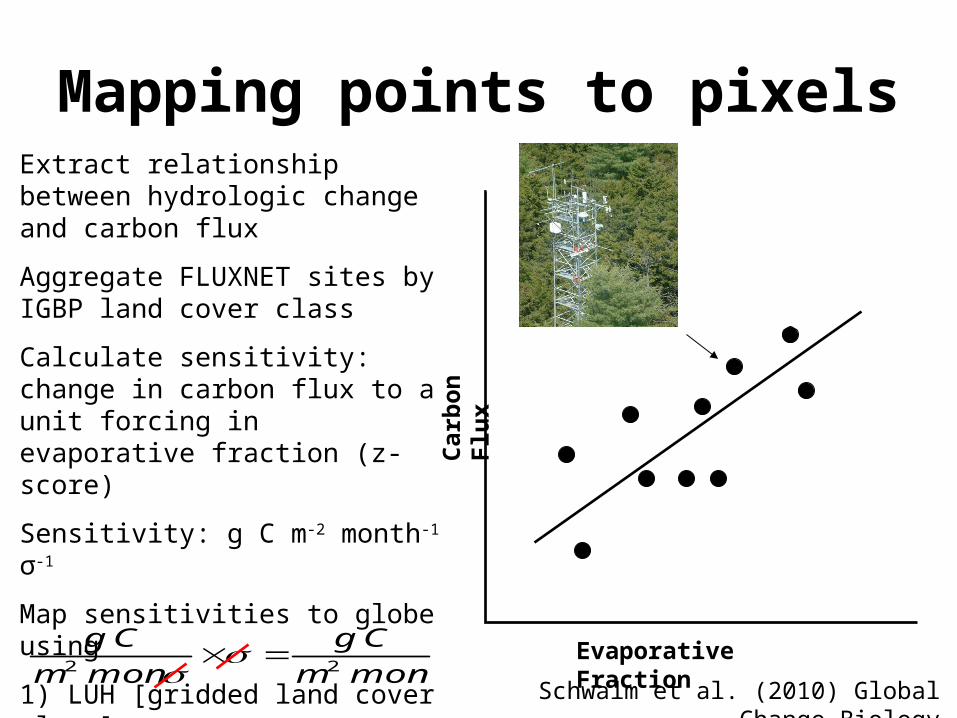
Mapping points to pixels
Evaporative Fraction
Carb
on F
lux
Extract relationship between hydrologic change and carbon flux
Aggregate FLUXNET sites by IGBP land cover class
Calculate sensitivity: change in carbon flux to a unit forcing in evaporative fraction (z-score)
Sensitivity: g C m-2 month-1 σ-1
Map sensitivities to globe using
1) LUH [gridded land cover class]
2) NCEP/NCAR Reanalysis [gridded EF]
Schwalm et al. (2010) Global Change Biology
22 monm
Cg
monm
Cg
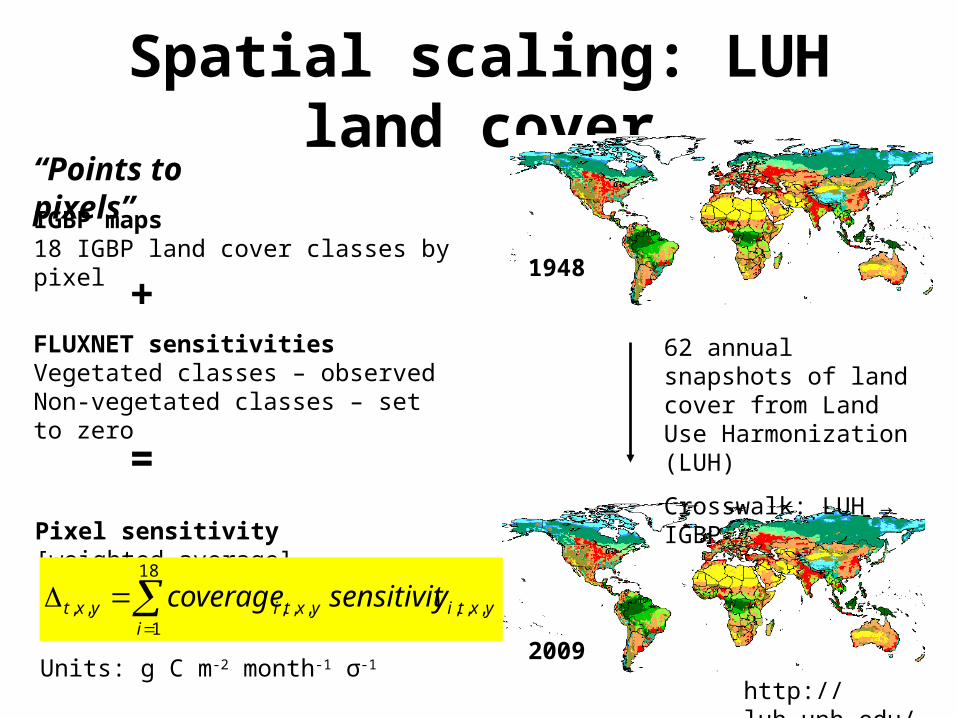
Spatial scaling: LUH land cover
1948
2009
62 annual snapshots of land cover from Land Use Harmonization (LUH)
Crosswalk: LUH → IGBP
http://luh.unh.edu/
IGBP maps18 IGBP land cover classes by pixel
FLUXNET sensitivitiesVegetated classes – observedNon-vegetated classes – set to zero
+
Pixel sensitivity [weighted average]
=
18
1,,,,,,,,
iyxtiyxtiyxt ysensitivitcoverage
Units: g C m-2 month-1 σ-1
“Points to pixels”

Temporal scaling: NCEP reanalysis
22 monm
Cg
monm
Cg
EF (σ)NEP sensitivity
(g C m-2 mon-1 σ-1 ) δNEP (g C m-2 mon-1 )
Example – Europe in June 1998
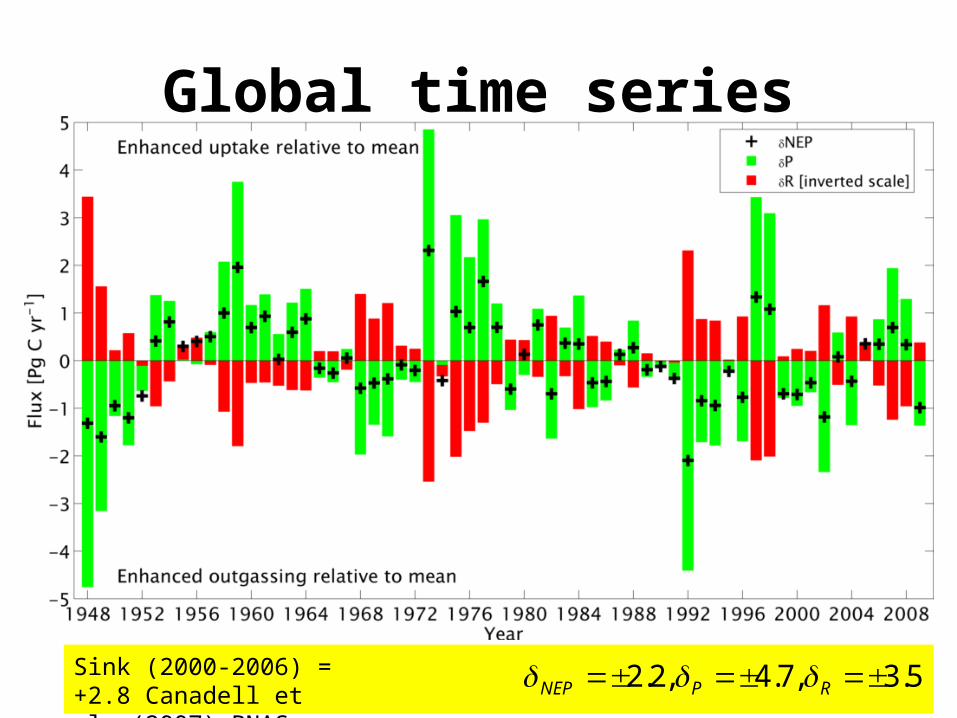
Global time series
5.3,7.4,2.2 RPNEP Sink (2000-2006) = +2.8 Canadell et al. (2007) PNAS
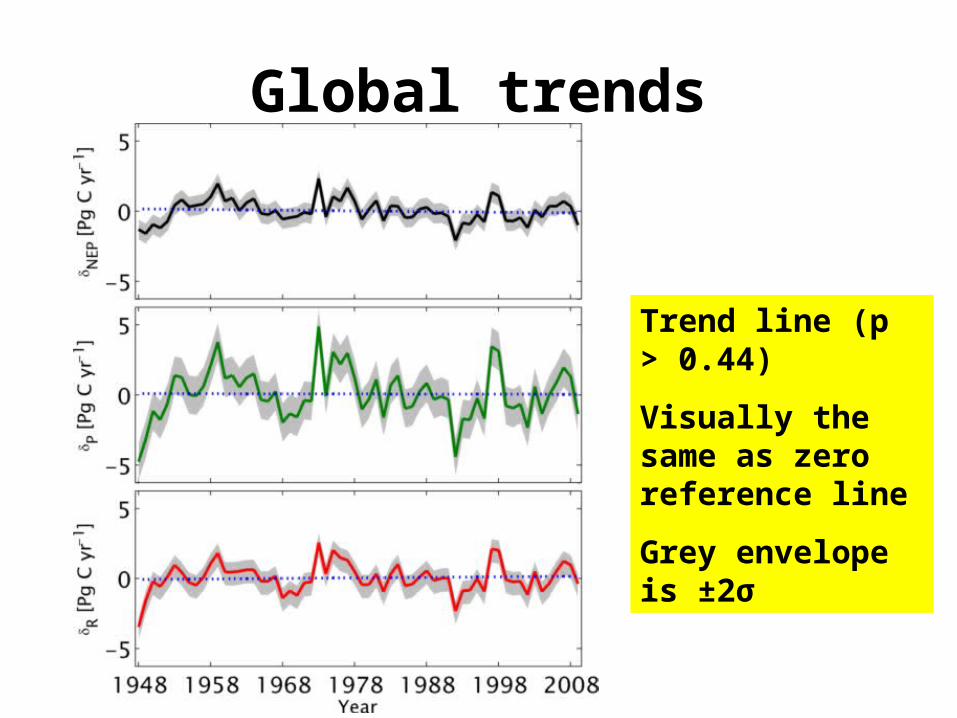
Global trends
Trend line (p > 0.44)
Visually the same as zero reference line
Grey envelope is ±2σ
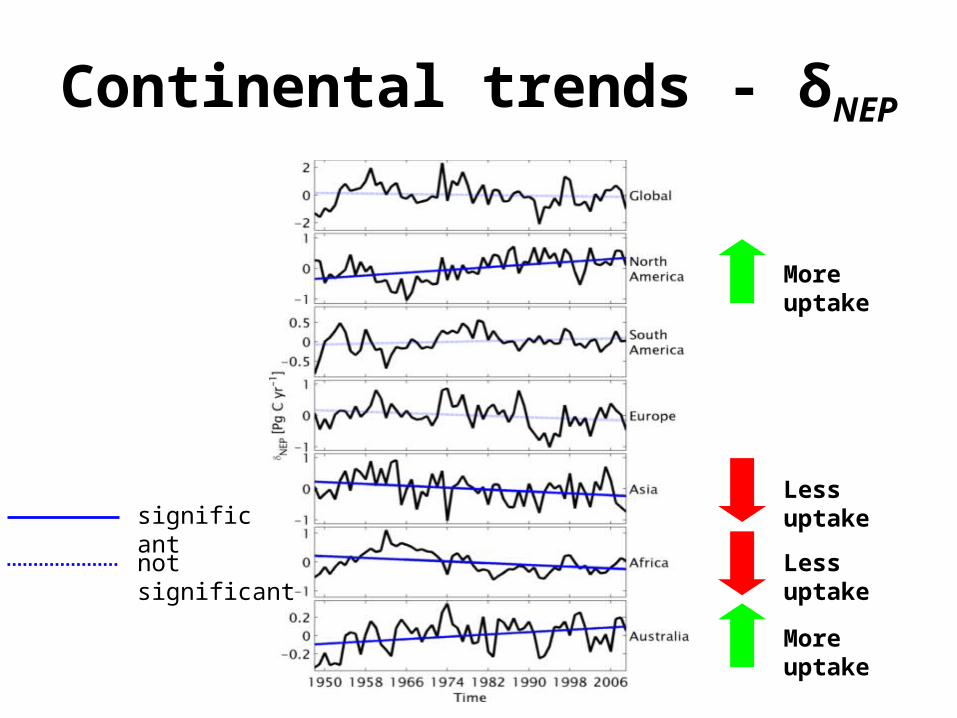
Continental trends - δNEP
significant
not significant
More uptake
More uptake
Less uptake
Less uptake
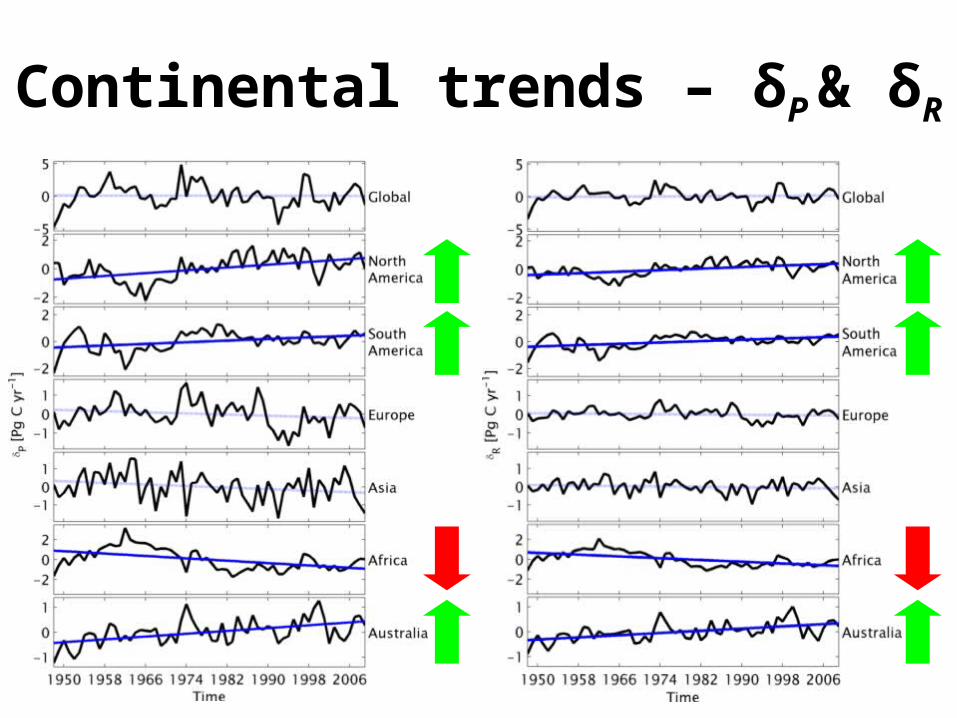
Continental trends – δP & δR
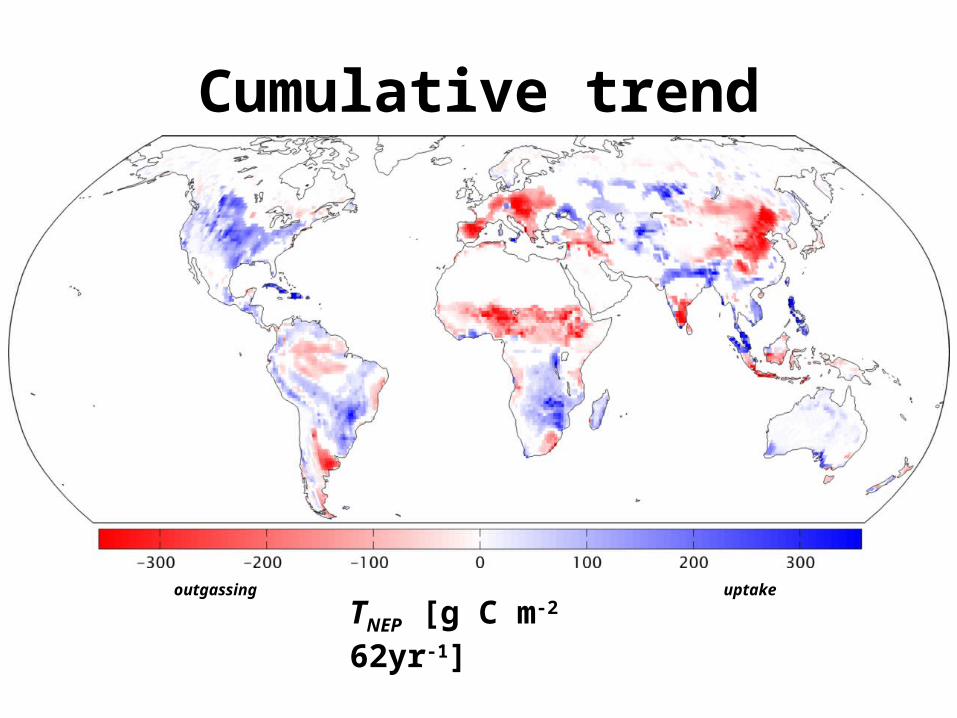
Cumulative trend
TNEP [g C m-2 62yr-1]outgassing uptake
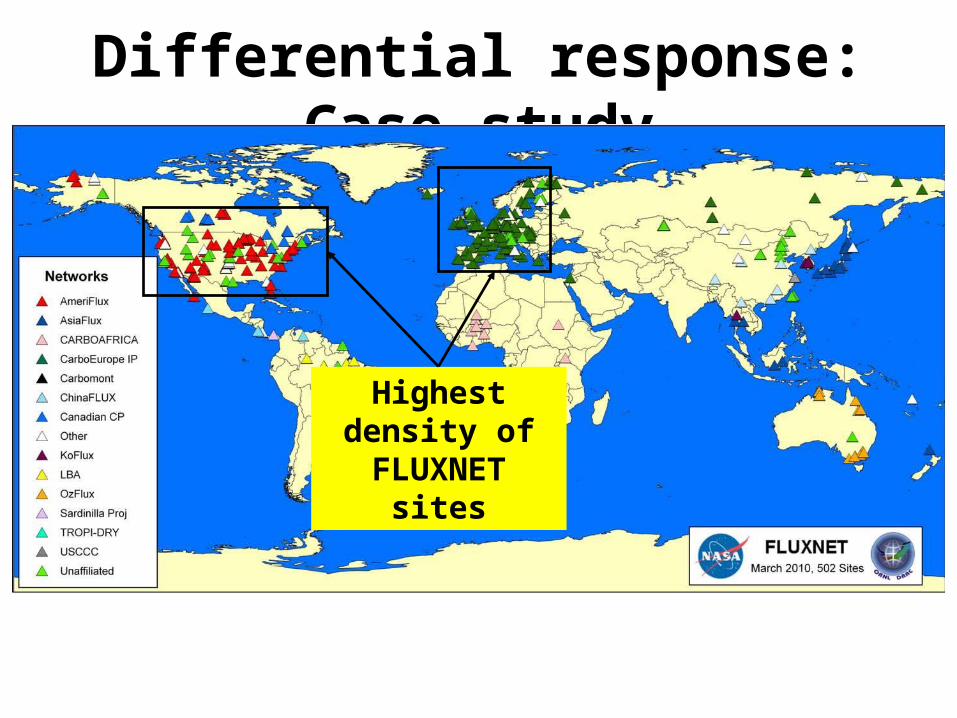
Differential response: Case study
Highest density of FLUXNET sites
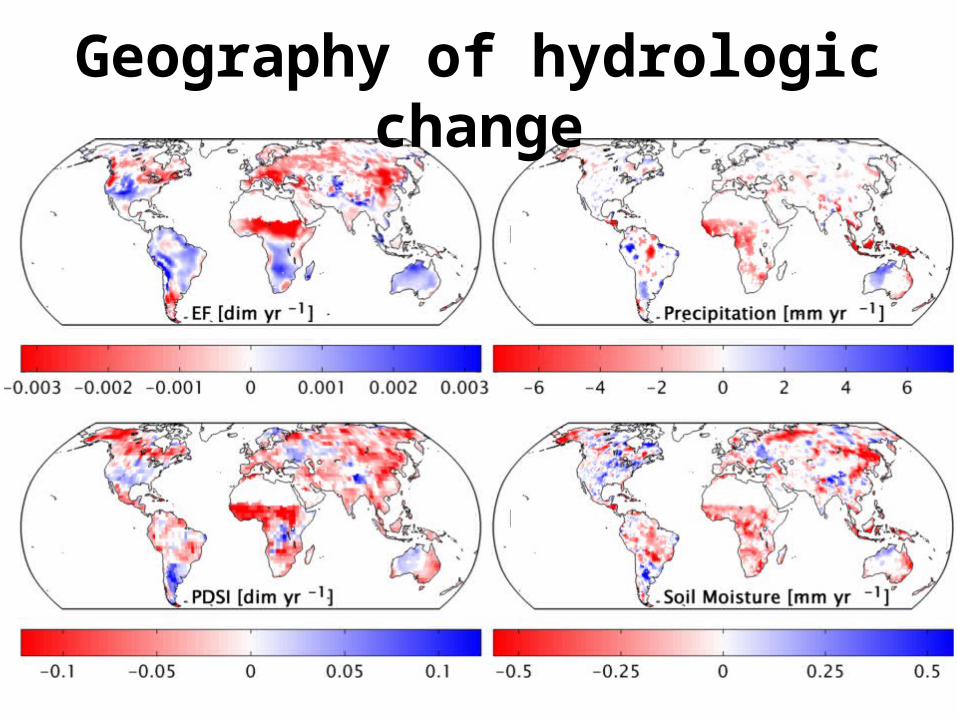
Geography of hydrologic change
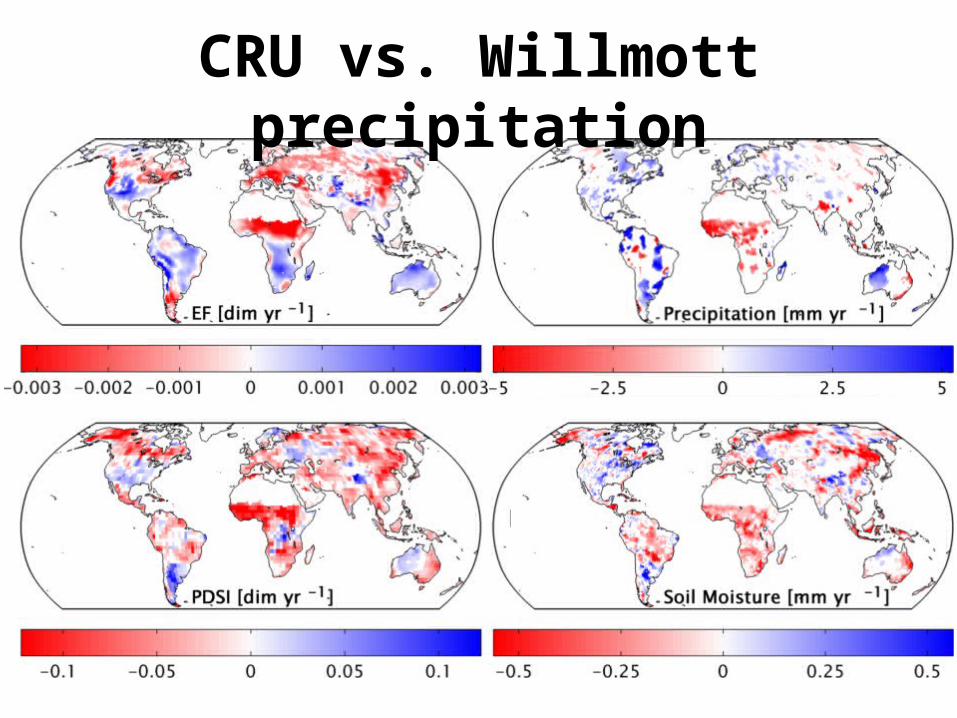
CRU vs. Willmott precipitation
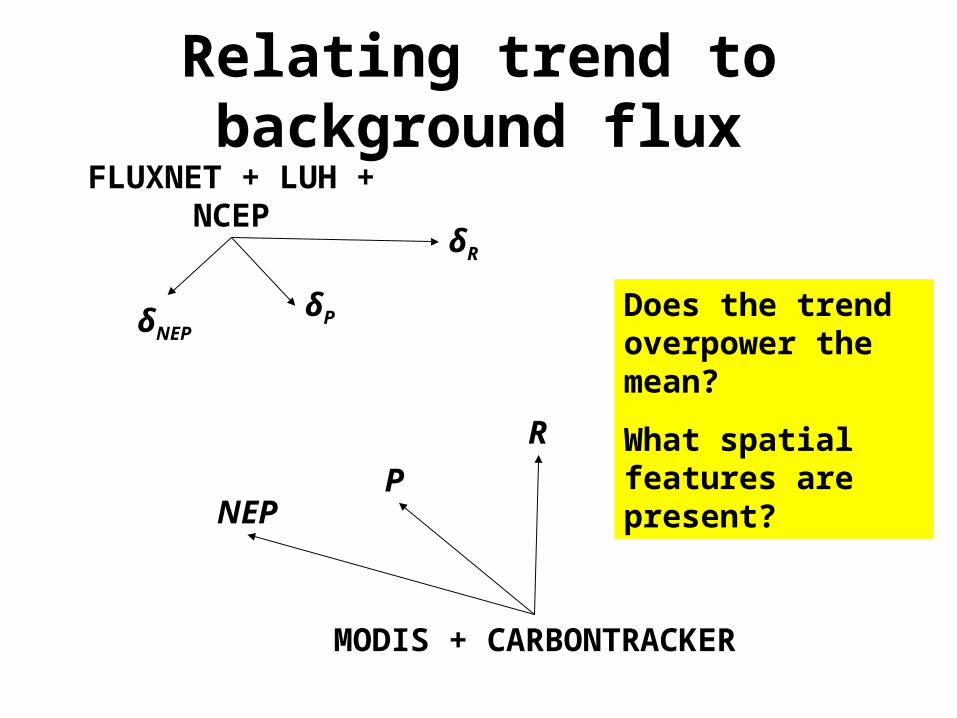
Relating trend to background fluxFLUXNET + LUH + NCEP
δNEPδP
δR
NEPP
R
MODIS + CARBONTRACKER
Does the trend overpower the mean?
What spatial features are present?
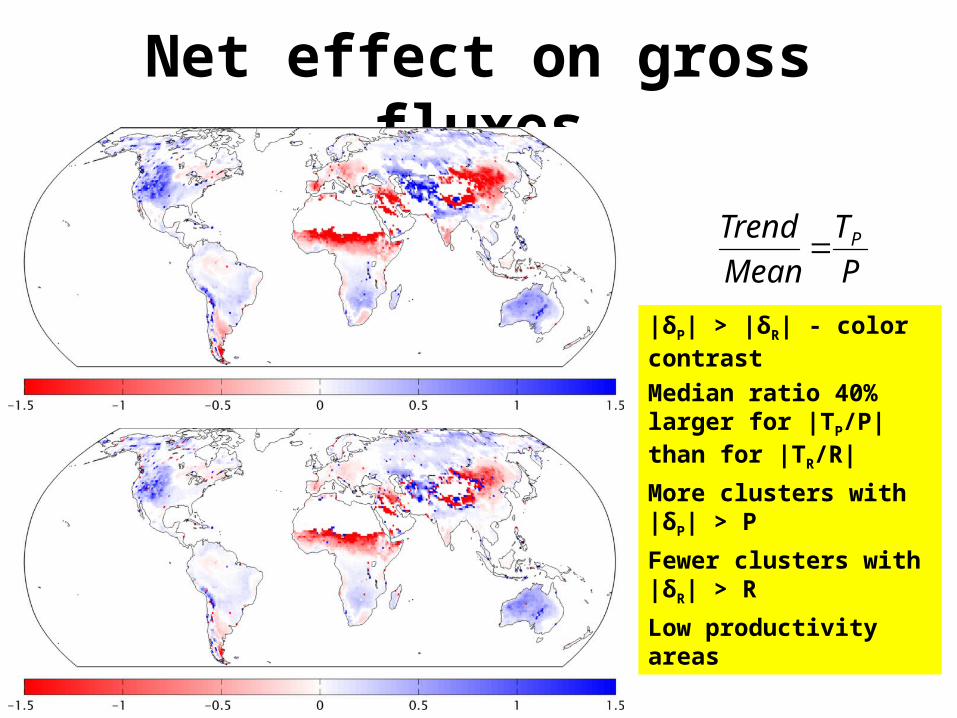
Net effect on gross fluxes
P
T
Mean
Trend P
R
T
Mean
Trend R
|δP| > |δR| - color contrast
Median ratio 40% larger for |TP/P| than for |TR/R|
More clusters with |δP| > P
Fewer clusters with |δR| > R
Low productivity areas
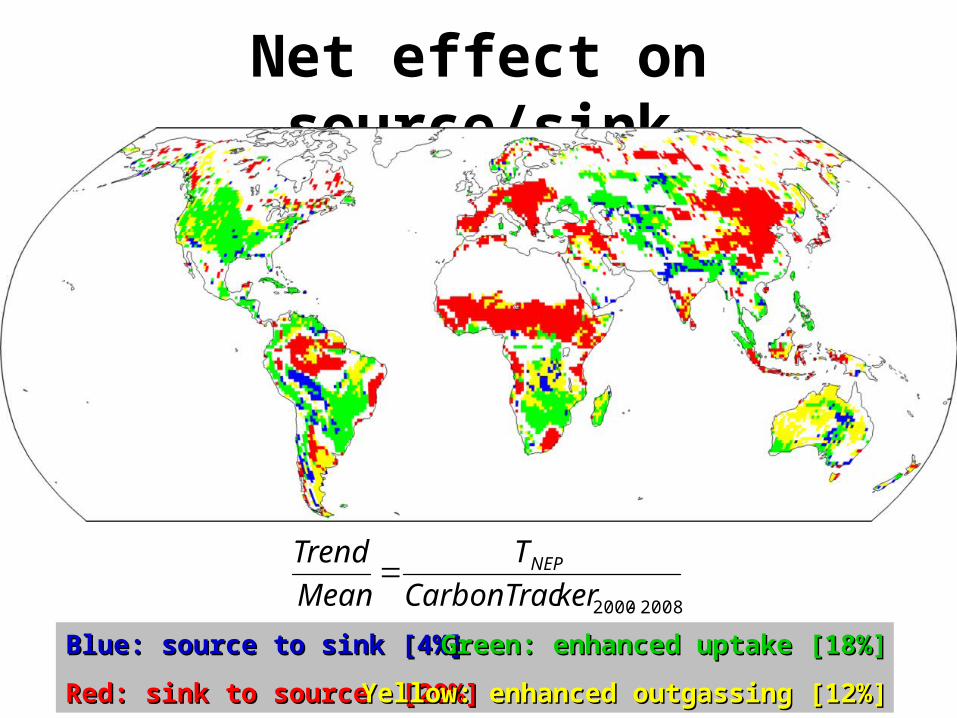
Net effect on source/sink
Blue: source to sink [4%]Blue: source to sink [4%]
Red: sink to source [20%]Red: sink to source [20%]
Green: enhanced uptake [18%]Green: enhanced uptake [18%]
Yellow: enhanced outgassing [12%]Yellow: enhanced outgassing [12%]
20082000
kerCarbonTrac
T
Mean
Trend NEP

Summary
• Observationally-based estimates of carbon cycling solely attributable to hydroclimatic variability
• Range in del equals or exceeds terrestrial carbon sink magnitude or gross fluxes.
• Hydroclimatic variability has acted to flip sources to sinks and vice versa (25%) over the 62-yr record → “key player”
i
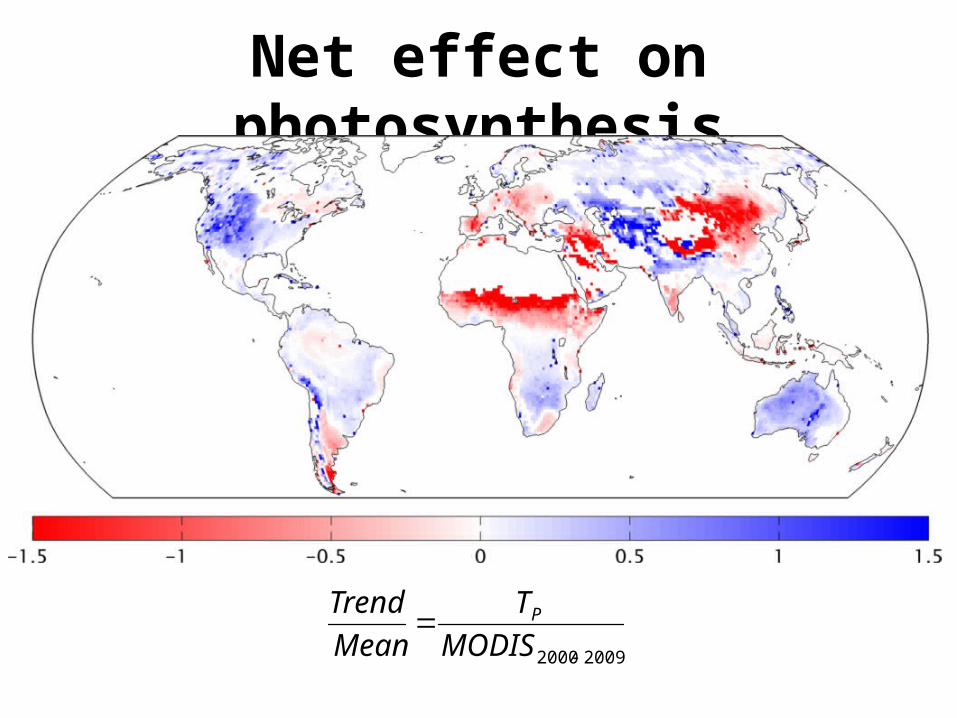
Net effect on photosynthesis
20092000
MODIS
T
Mean
Trend P
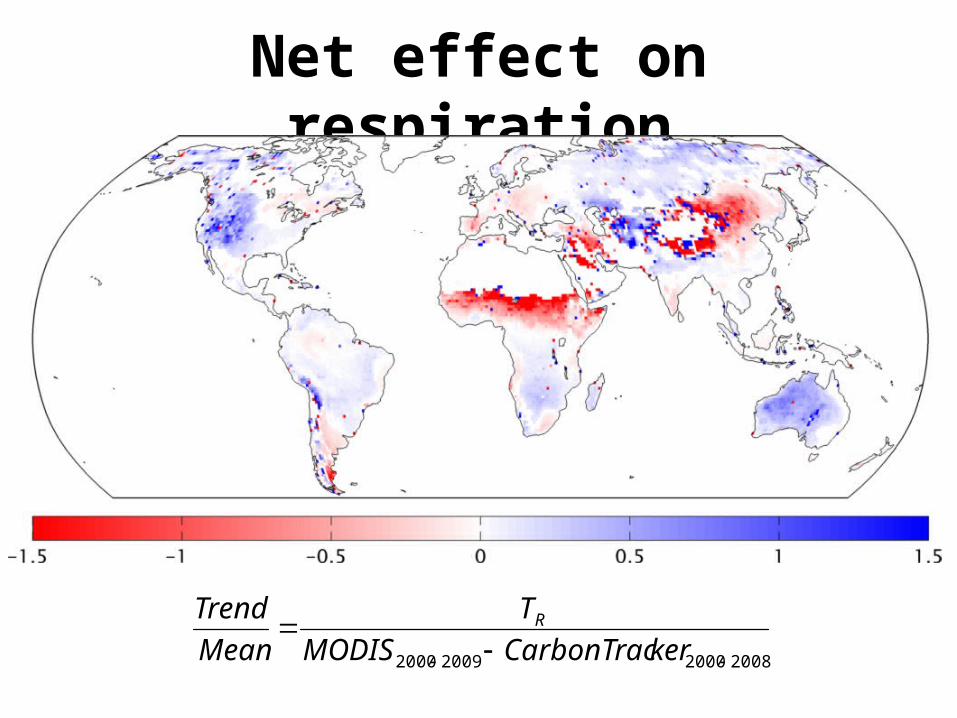
Net effect on respiration
2008200020092000
kerCarbonTracMODIS
T
Mean
Trend R
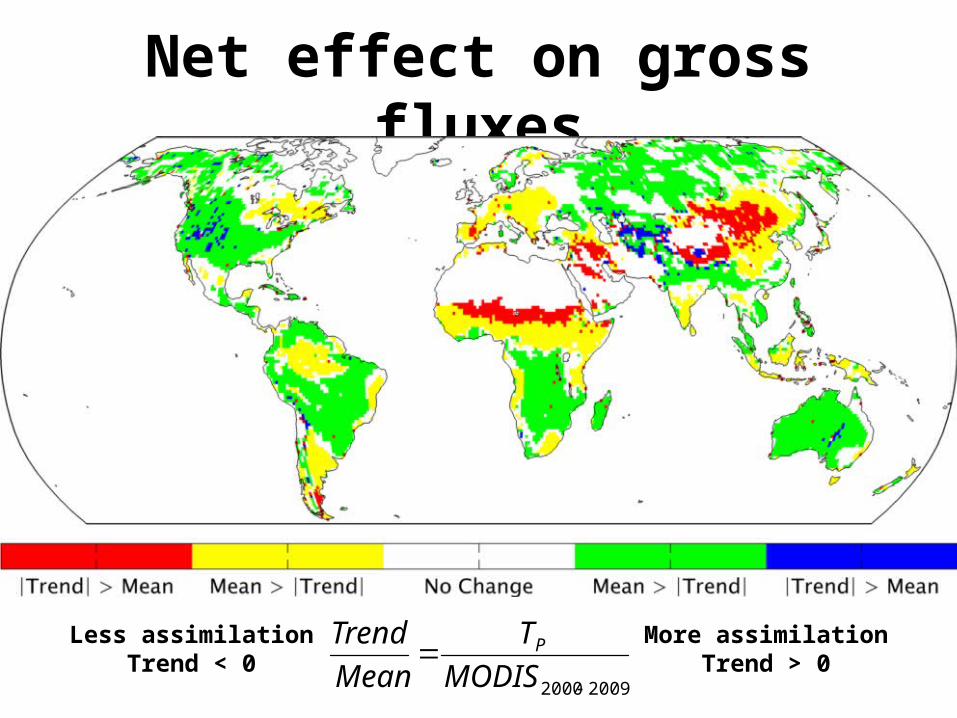
Net effect on gross fluxes
20092000
MODIS
T
Mean
Trend PLess assimilationTrend < 0
More assimilationTrend > 0


![Water transparency to UV radiation in montane lakes: consequences of climate-driven changes in terrestrial inputs [Craig Williamson]](https://img.pdfslide.net/doc/110x75/555563b5b4c90530208b54f8/water-transparency-to-uv-radiation-in-montane-lakes-consequences-of-climate-driven-changes-in-terrestrial-inputs-craig-williamson.jpg)


![Land Use/Cover Change Effects on Terrestrial Carbon Sources and Sinks Josep Canadell CSIRO, Canberra, Australia [pep.canadell@csiro.au]](https://img.pdfslide.net/doc/110x75/56649e415503460f94b33844/land-usecover-change-effects-on-terrestrial-carbon-sources-and-sinks-josep.jpg)


![A Topology-Aware Routing Protocol MANET with Multiple Sinks...Generally the routing protocols for MANETcan be classified as either table-driven or demand-driven [3]. In table-driven](https://img.pdfslide.net/doc/110x75/5ea1c81e9d3cf436a165714a/a-topology-aware-routing-protocol-manet-with-multiple-sinks-generally-the-routing.jpg)