Embed Size (px)
Citation preview
Trends of ESCO business
in Japan
Hidetoshi NakagamiJyukankyo Research Institute
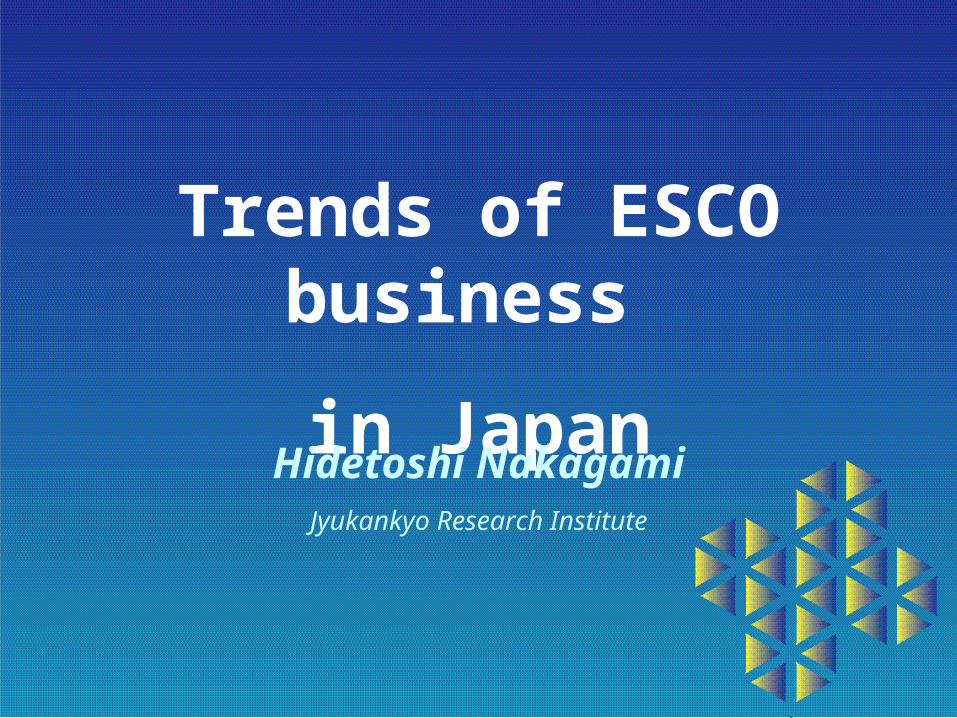
History of creating ESCO business (1)1996 MITI set up the Advisory Committee on ESCO Investiga
tion
1997 Kyoto Protocol from COP3
1997 Association for ESCO Business Introduction in Japan(ECCJ)
1998 the Committee on ESCO Business Demonstration(ECCJ)
the Committee to Investigate Measurement and Verification
Methods(ECCJ)
1998 MITI set up a system of subsidies for energy efficiency
retrofits
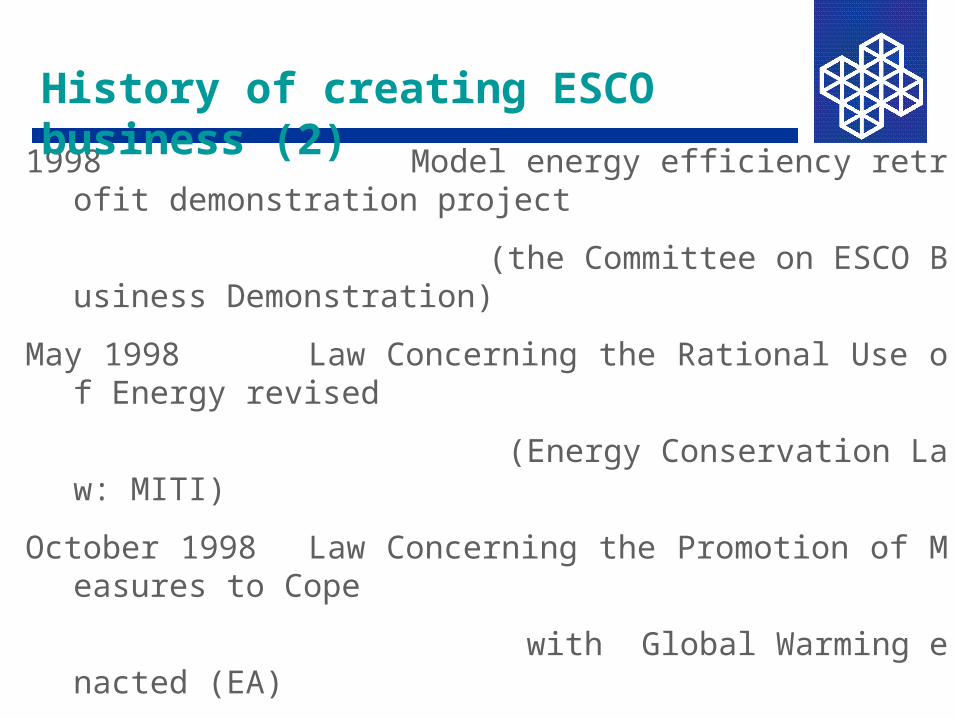
1998 Model energy efficiency retrofit demonstration project
(the Committee on ESCO Business Demonstration)
May 1998 Law Concerning the Rational Use of Energy revised
(Energy Conservation Law: MITI)
October 1998 Law Concerning the Promotion of Measures to Cope
with Global Warming enacted (EA)
June 1999 New Japanese Appliance Energy Efficiency
Standards enacted (A Top-Runner Approach:MITI)
July 1999 Law for Private Finance Initiative enacted(LPFI:EPA)
October 1999 JAESCO formed
History of creating ESCO business (2)
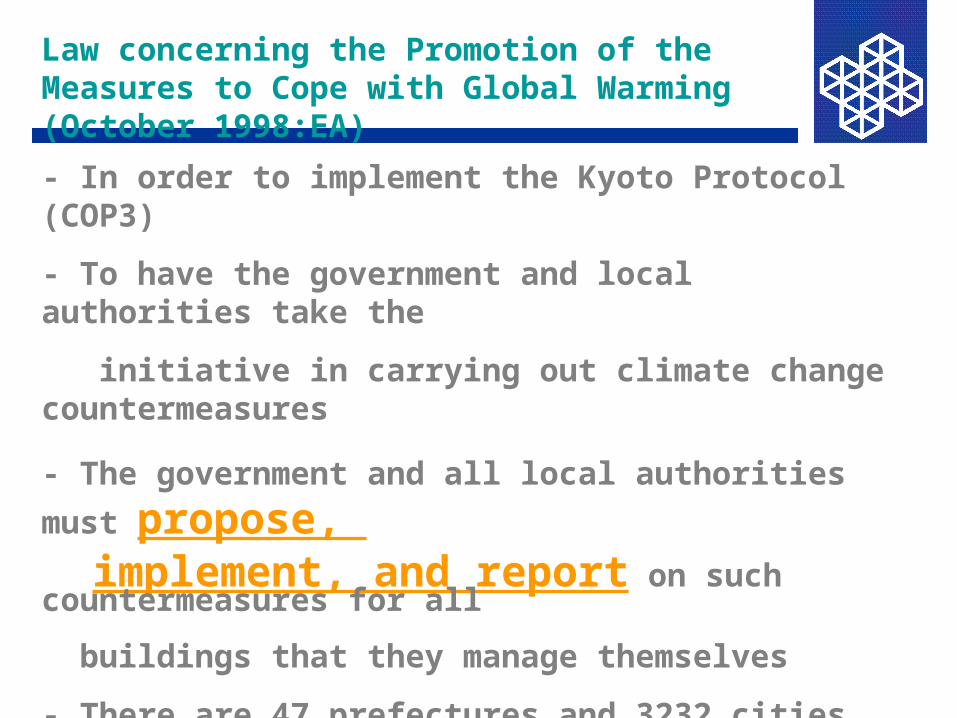
Law concerning the Promotion of the Measures to Cope with Global Warming (October 1998:EA)
- In order to implement the Kyoto Protocol (COP3)
- To have the government and local authorities take the
initiative in carrying out climate change countermeasures
- The government and all local authorities must propose, implement, and report on such countermeasures for all
buildings that they manage themselves
- There are 47 prefectures and 3232 cities, towns, or villages
- Largest ESCO market in future
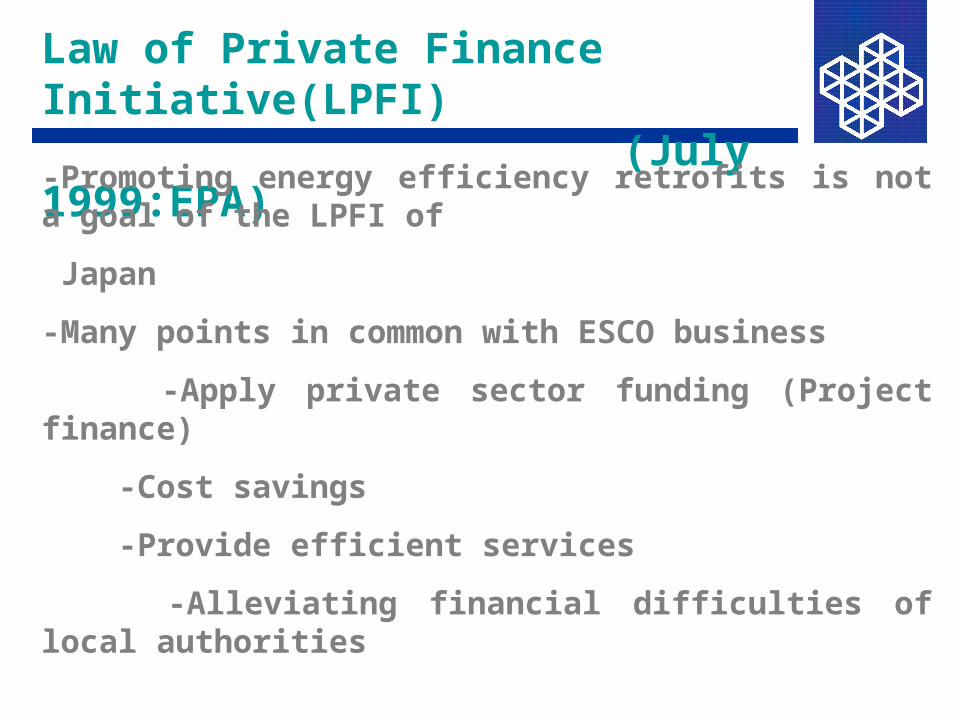
Law of Private Finance Initiative(LPFI) (July 1999:EPA) -Promoting energy efficiency retrofits is not a goal of the LPFI of
Japan
-Many points in common with ESCO business
-Apply private sector funding (Project finance)
-Cost savings
-Provide efficient services
-Alleviating financial difficulties of local authorities
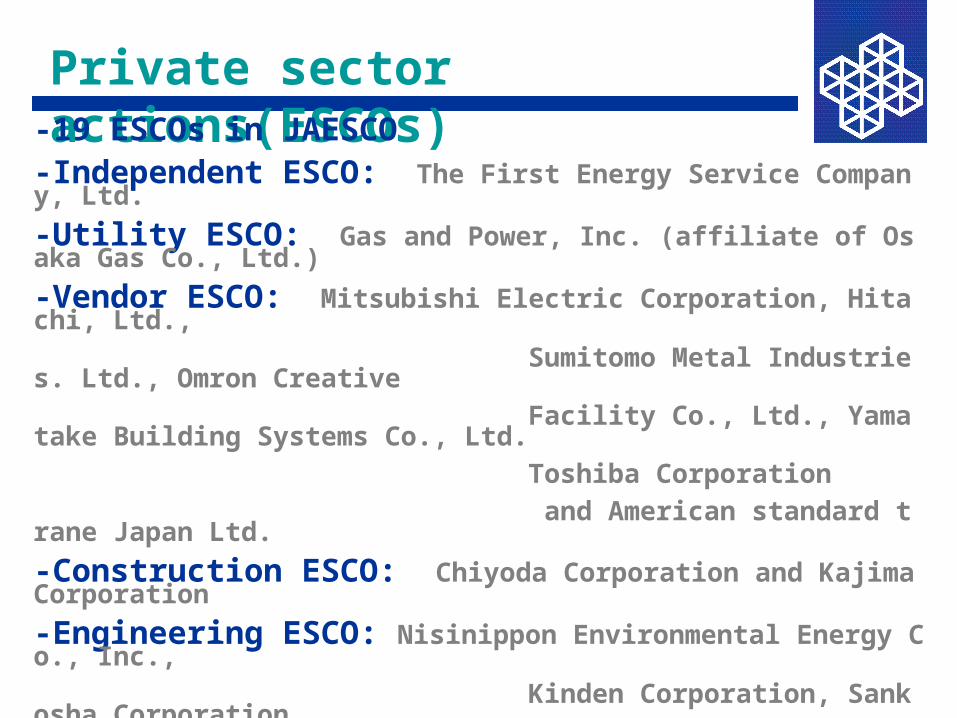
Private sector actions(ESCOs) -19 ESCOs in JAESCO
-Independent ESCO: The First Energy Service Company, Ltd.
-Utility ESCO: Gas and Power, Inc. (affiliate of Osaka Gas Co., Ltd.)
-Vendor ESCO: Mitsubishi Electric Corporation, Hitachi, Ltd.,
Sumitomo Metal Industries. Ltd., Omron Creative
Facility Co., Ltd., Yamatake Building Systems Co., Ltd.
Toshiba Corporation
and American standard trane Japan Ltd.
-Construction ESCO: Chiyoda Corporation and Kajima Corporation
-Engineering ESCO: Nisinippon Environmental Energy Co., Inc.,
Kinden Corporation, Sankosha Corporation,
Nippon Steel Engineering Osaka Co., Ltd.,
Toenec Corporation, ESCO Technologies Inc.,
West Japan Railway Technos Corporation
and Kansai Tech Corporation
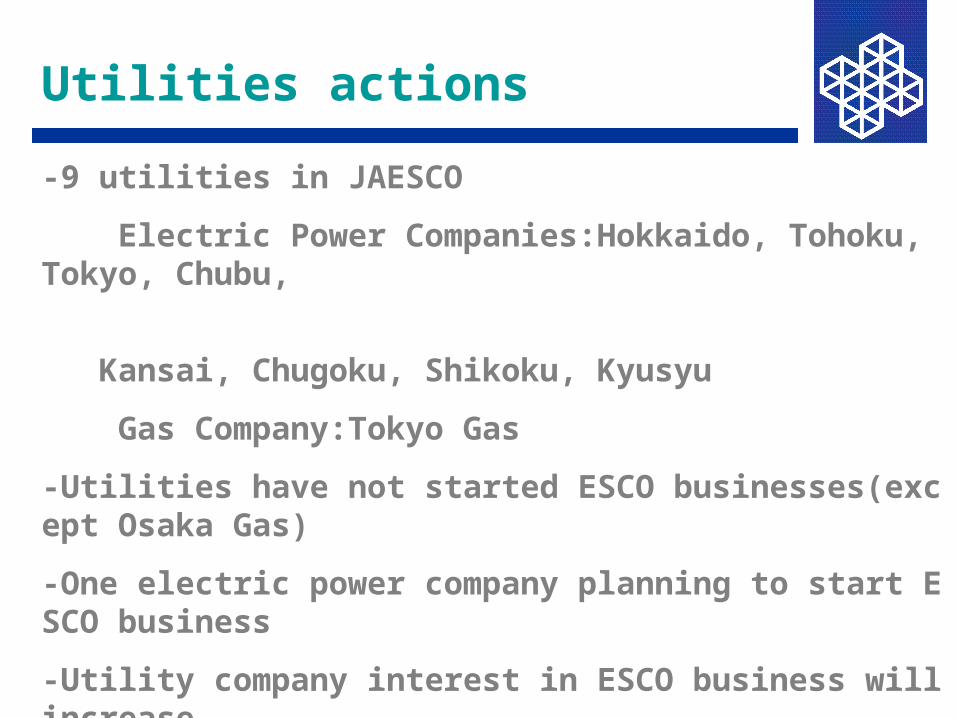
-9 utilities in JAESCO
Electric Power Companies:Hokkaido, Tohoku, Tokyo, Chubu,
Kansai, Chugoku, Shikoku, Kyusyu
Gas Company:Tokyo Gas
-Utilities have not started ESCO businesses(except Osaka Gas)
-One electric power company planning to start ESCO business
-Utility company interest in ESCO business will increase
-After they ascertain the current restructuring trends they will
decide whether they should commercialize or not
Utilities actions
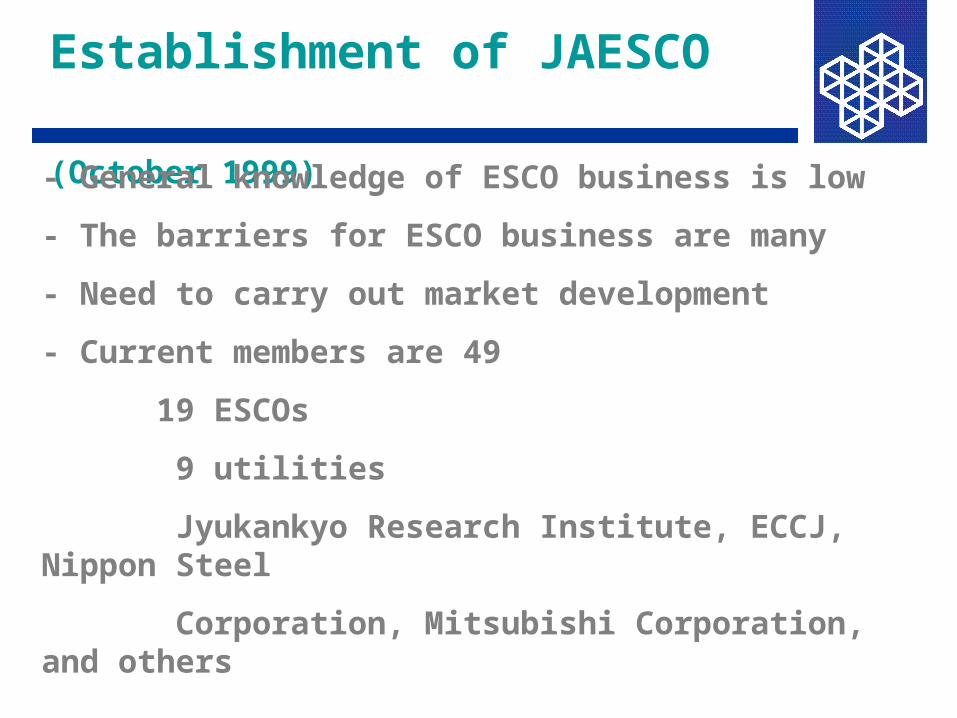
Establishment of JAESCO
(October 1999) - General knowledge of ESCO business is low
- The barriers for ESCO business are many
- Need to carry out market development
- Current members are 49
19 ESCOs
9 utilities
Jyukankyo Research Institute, ECCJ, Nippon Steel
Corporation, Mitsubishi Corporation, and others
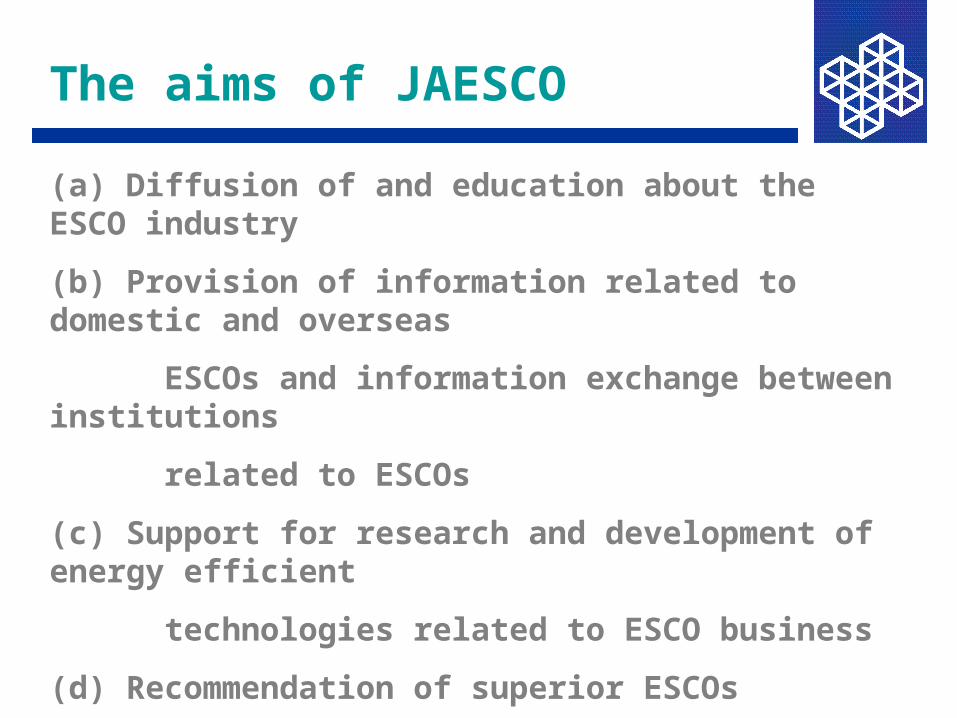
The aims of JAESCO
(a) Diffusion of and education about the ESCO industry
(b) Provision of information related to domestic and overseas
ESCOs and information exchange between institutions
related to ESCOs
(c) Support for research and development of energy efficient
technologies related to ESCO business
(d) Recommendation of superior ESCOs
(e) Implementation of mediation and amicable settlement of
disputes related to ESCO business
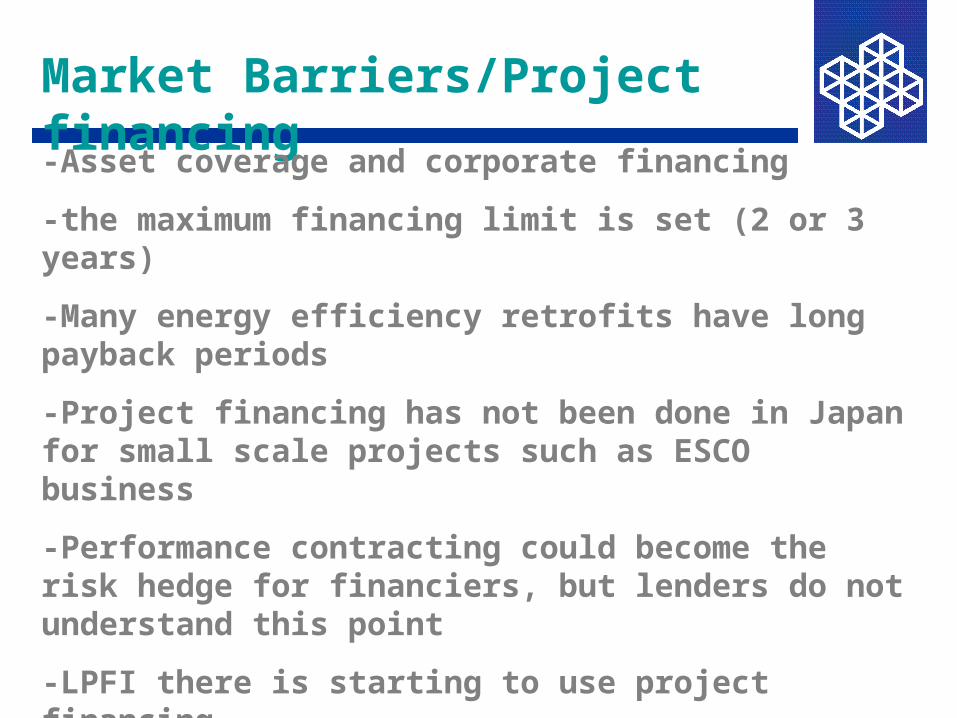
Market Barriers/Project financing
-Asset coverage and corporate financing
-the maximum financing limit is set (2 or 3 years)
-Many energy efficiency retrofits have long payback periods
-Project financing has not been done in Japan for small scale projects such as ESCO business
-Performance contracting could become the risk hedge for financiers, but lenders do not understand this point
-LPFI there is starting to use project financing
-Lenders are interested in ESCO business, provided that the risk hedge function of performance contracting
-It may become possible to apply project financing in Japan
Market barriers/application to local authorities-Local authorities are expected to be the largest future market
-Local authority budgets are only for a single fiscal year
-local authority award the planning and implementation to separate vendors
-the criterion for choice of vendors is only price
-vendor is determined based on being within the estimated price range by even proposal-type bidding
-long-term financing cannot be borrowed from the private sector
-several local authorities are already studying the possibility of performance contracting under the present system
Conclusions(1)
-Energy consumption by office buildings in Japan is 1,500 to 2,000 MJ/m2-year, costing about $30/m2-year
-Investment in energy efficiency retrofit profitable at about $50/m2
-Contract lengths of 7 to 10 years
-EEMs :lighting, space conditioning equipment and cogeneration
-Market :hotels, hospitals, and office buildings
-The biggest future market will be local authorities

Conclusions(2)
-MITI is expanding its program of subsidies for energy efficiency retrofits
-Environment Agency: the Law concerning the Promotion of the Measures to Cope with Global Warming
-JAESCO has been set up
-Private sector has taken notice of the future of ESCO business
-The role ESCO business will play in global climate change countermeasures is expected to expand

Thank you !
Association for
ESCO Business Introduction(1997)
- ECCJ formed the association in 1997
- 233 specialists
- Working Groups
- Institutional aspects
- Performance contracting
- M&VP
- Case studies
(industrial and commercial buildings)
Institutional aspects WG
- Introduction of project financing
- Application of flexible rules governing leasing
- Impediments accompanying the introduction of
performance contracting at the national government and
local administrative levels
- The need for government incentives such as broader
subsidies and low-interest loans
- The need to implement demonstration projects
- The need for an association of ESCOs
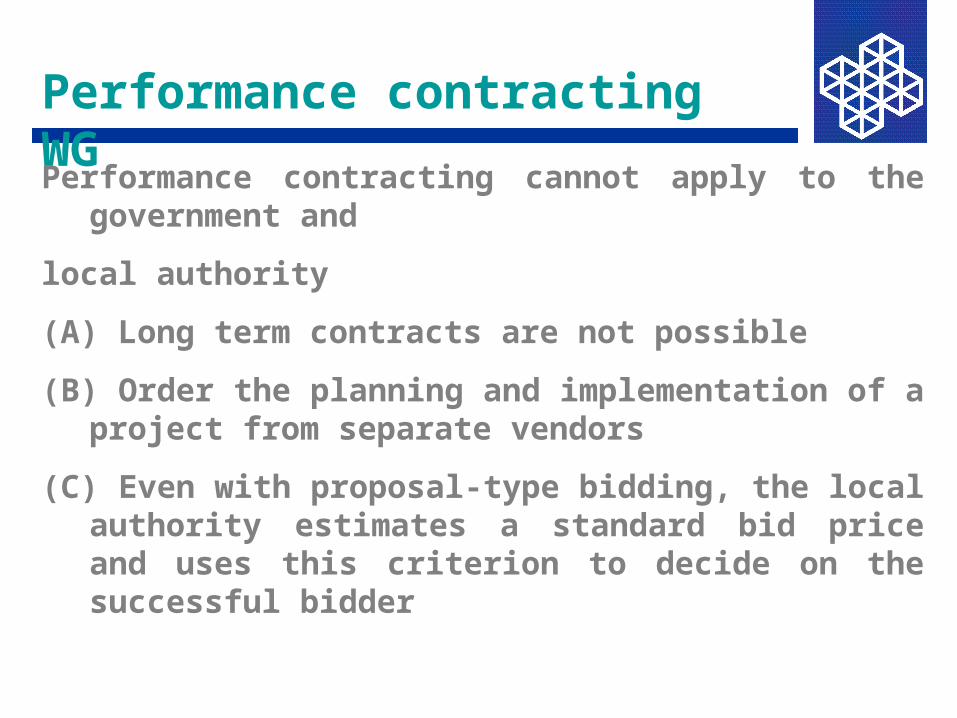
Performance contracting WGPerformance contracting cannot apply to the government and
local authority
(A) Long term contracts are not possible
(B) Order the planning and implementation of a project from separate vendors
(C) Even with proposal-type bidding, the local authority estimates a standard bid price and uses this criterion to decide on the successful bidder

Case studies WG
<Industrial sector WG>
- Surveyed for examples of 108 cases energy efficiency retrofits
- The average investment : 1.36 million dollars
- Simple payback period : 4.4 years
<Commercial buildings sector WG>
- 16 buildings walk-through audits
- The average annual energy use : 1,200 to 2,000 MJ/m2
- Annual outlays for lighting and fuel : $32 to $36/m2
- Energy savings : less than 10 %
- Simple payback period : about 6 years
ESCO demonstration projects - MITI subsidized one-third of the cost of a building energy
efficiency retrofit
- Four were chosen by the Committee on ESCO Business
Demonstration and model retrofits were done using ESCO
methods
- The goal was demonstrate effectiveness of ESCO business for
promotion of energy conservation
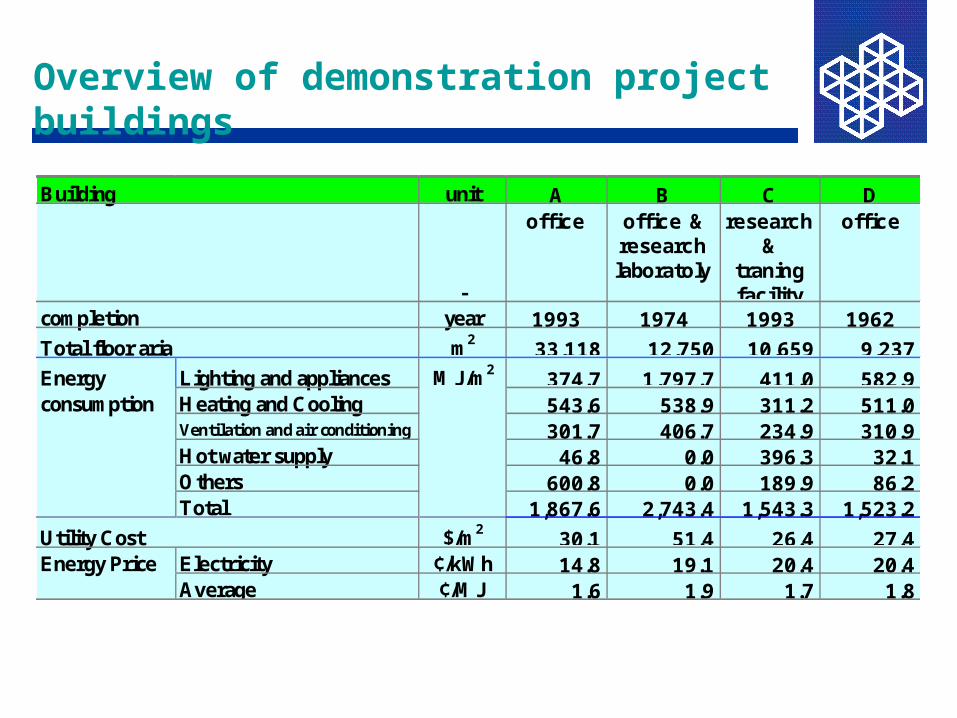
Overview of demonstration project buildings
Building unit A B C D
-
office office &researchlaboratoly
research&
traningfacility
office
completion year 1993 1974 1993 1962Total floor aria m2
33,118 12,750 10,659 9,237Energy Lighting and appliances MJ/m2
374.7 1,797.7 411.0 582.9consumption Heating and Cooling 543.6 538.9 311.2 511.0
Ventilation and air conditioning 301.7 406.7 234.9 310.9Hot water supply 46.8 0.0 396.3 32.1Others 600.8 0.0 189.9 86.2Total 1,867.6 2,743.4 1,543.3 1,523.2
Utility Cost $/m230.1 51.4 26.4 27.4
Energy Price Electricity ¢/kWh 14.8 19.1 20.4 20.4Average ¢/MJ 1.6 1.9 1.7 1.8
Baseline unit energy consumption
0 500 1000 1500 2000 2500 3000
D
C
B
A
Lighting and appliances
Heating and Cooling
Ventilation and air conditioning
Hot water supply
Others
(MJ/m2-year)
1,868
2,743
1,543
1,523
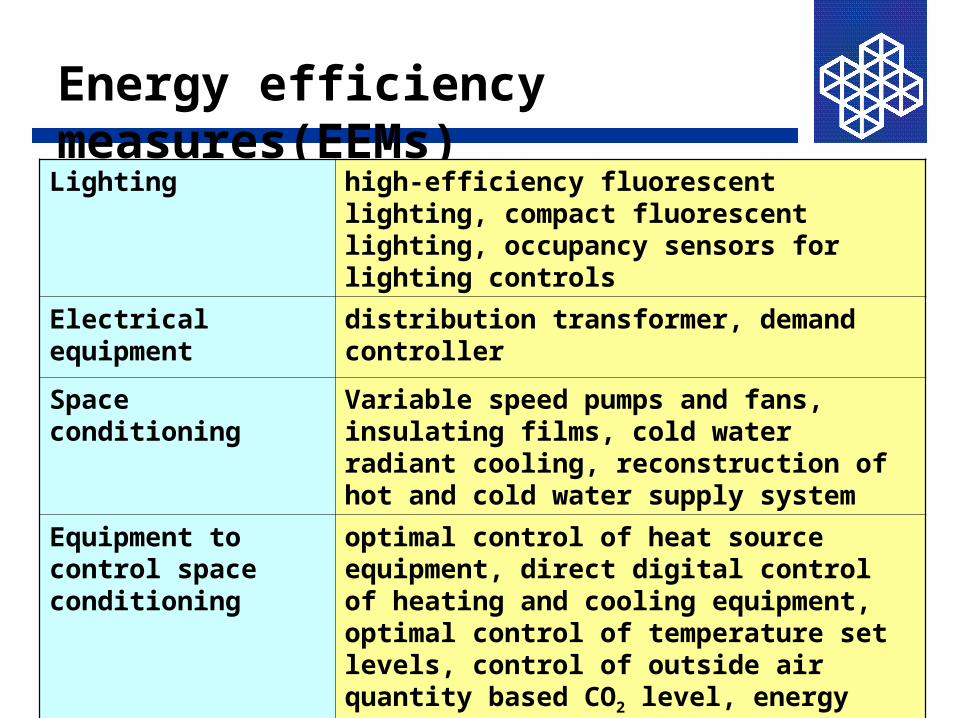
Energy efficiency measures(EEMs)
Lighting high-efficiency fluorescent lighting, compact fluorescent lighting, occupancy sensors for lighting controls
Electrical equipment distribution transformer, demand controller
Space conditioning Variable speed pumps and fans, insulating films, cold water radiant cooling, reconstruction of hot and cold water supply system
Equipment to control space conditioning
optimal control of heat source equipment, direct digital control of heating and cooling equipment, optimal control of temperature set levels, control of outside air quantity based CO2 level, energy management system
Cogeneration

Cost of Demonstration retrofits
Building A B C DConstruction Cost (1,000$) 683 932 509 1,170Construction Cost ($/m2) 20.6 73.1 47.7 126.7ESCO Service Charge ($/m2-year) 1.99 3.57 2.05 4.77M&V Cost ($/m2-year) 0.33 1.28 1.02 1.18Decrease in Utility Costs ($/m2-year) 3.49 8.08 9.94 9.69Decrease Cost by EMS($/m2-year) 0.27 0.71 0.85 --Simple Pay Back Periods (year) 5.9 9.0 4.8 13.1Decrease in Whole Building Energy Use (%)
13.8 15.4 22.8 20.8
Percentage of energy saved & SPP
0
2
4
6
8
10
12
14
0 5 10 15 20 25
Case study(Office)
Case study(Hosptal)
Building A
Building B
Building C
Building D
Sin
ple
pay
bac
k(y
ear)
Energy saving(%)

Minimum necessary contract length
Building A B C D
Base Case 10 17 7 >30
Subsidy Case 6 11 5 17
SPP 5.9 9.0 4.8 13.1
years

Total profit for 15 years
0
50,000
100,000
150,000
200,000
250,000
300,000
350,000
400,000
450,000
0.0 5.0 10.0 15.0 20.0Energy savings
(%)
Tota
l p
rofi
t fo
r 1
5 y
ears
$(
)
insulating films(6years)
+variable speed pumps and fans(7years)
+optimal control of heating sourceequipment(7years)
+renewal of electrical ransforme(8years)
+high-efficiency fluorescent lighting(11years)
+direct digital control(12years)
+cold water radiant cooling (14years)
+reconstruction of hot and coldwater supply sysytems(14years)
+energy management system(15years)
Building < B>
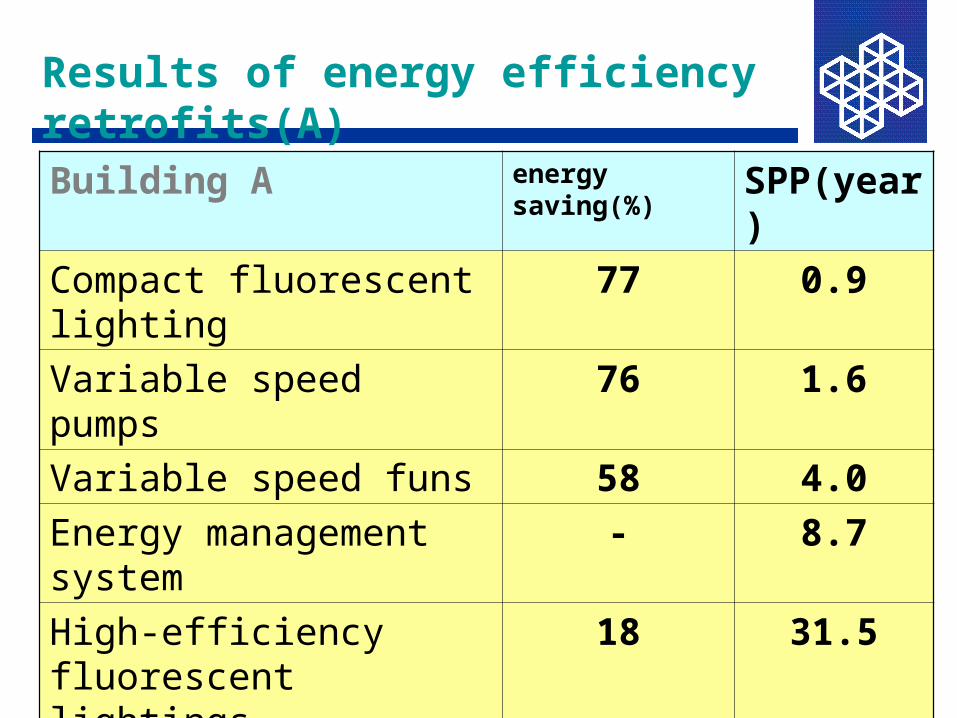
Results of energy efficiency retrofits(A)
Building A energy saving(%) SPP(year)
Compact fluorescent lighting 77 0.9
Variable speed pumps 76 1.6
Variable speed funs 58 4.0
Energy management system - 8.7
High-efficiency fluorescent lightings
18 31.5
Occupancy sensors for lighting controls
26 53.4
Whole building 14 5.9
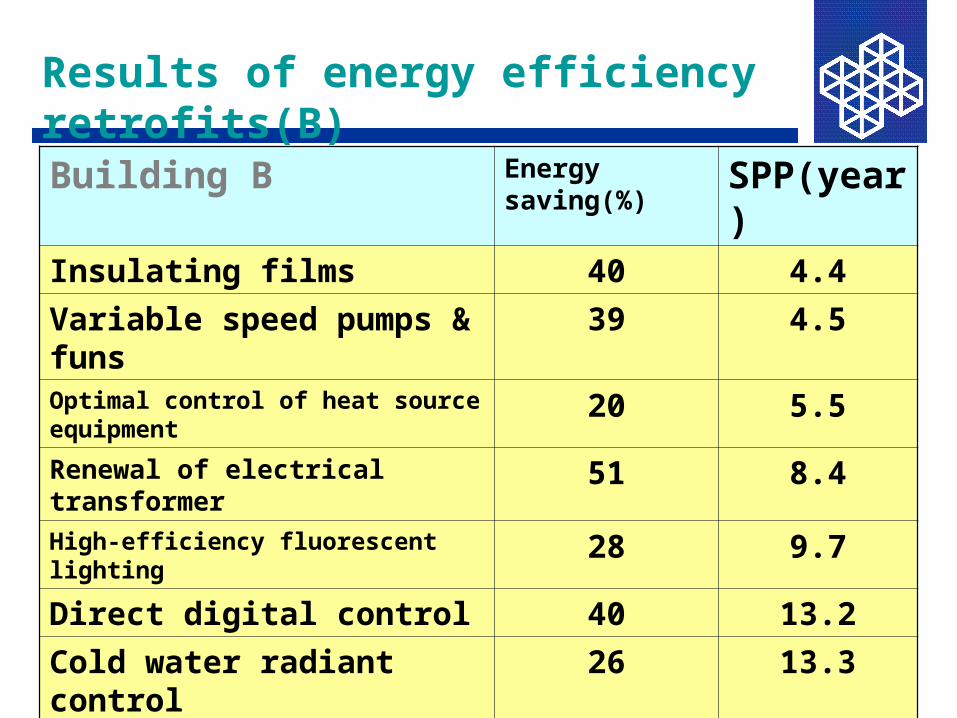
Results of energy efficiency retrofits(B)
Building B Energy saving(%)
SPP(year)
Insulating films 40 4.4
Variable speed pumps & funs 39 4.5Optimal control of heat source equipment 20 5.5Renewal of electrical transformer 51 8.4High-efficiency fluorescent lighting 28 9.7
Direct digital control 40 13.2
Cold water radiant control 26 13.3Reconstruction of hot and cold water supply system 4 14.3
Energy management system -- --
Whole building 15 9.0
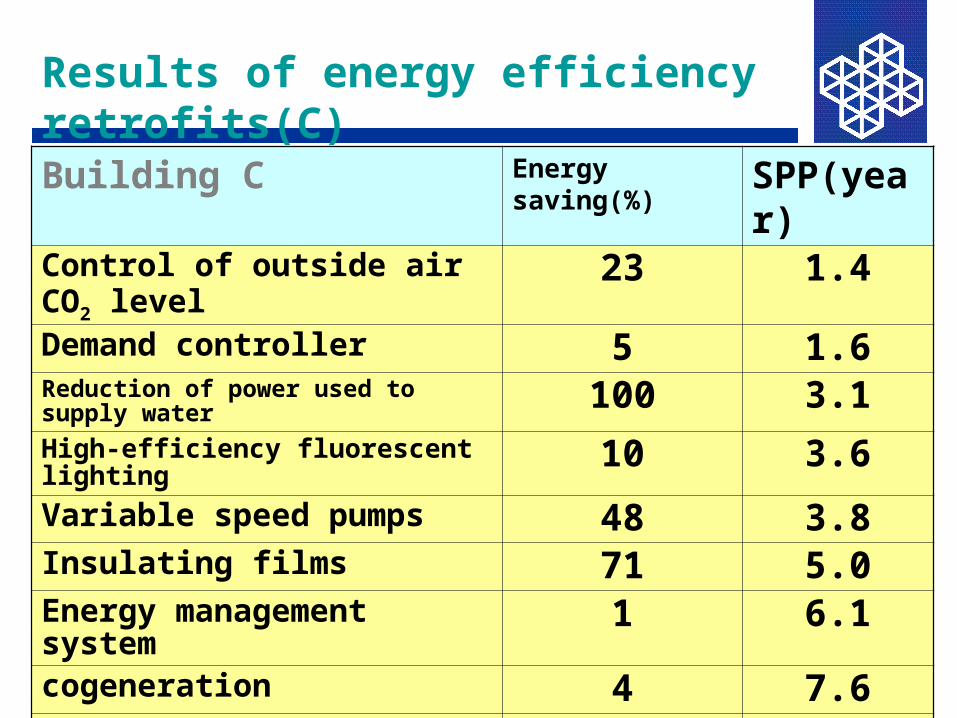
Results of energy efficiency retrofits(C)
Building C Energy saving(%) SPP(year)Control of outside air CO2 level 23 1.4Demand controller 5 1.6Reduction of power used to supply water 100 3.1High-efficiency fluorescent lighting 10 3.6Variable speed pumps 48 3.8Insulating films 71 5.0Energy management system 1 6.1cogeneration 4 7.6Control of electrical transformer 48 7.7Whole building 23 4.8
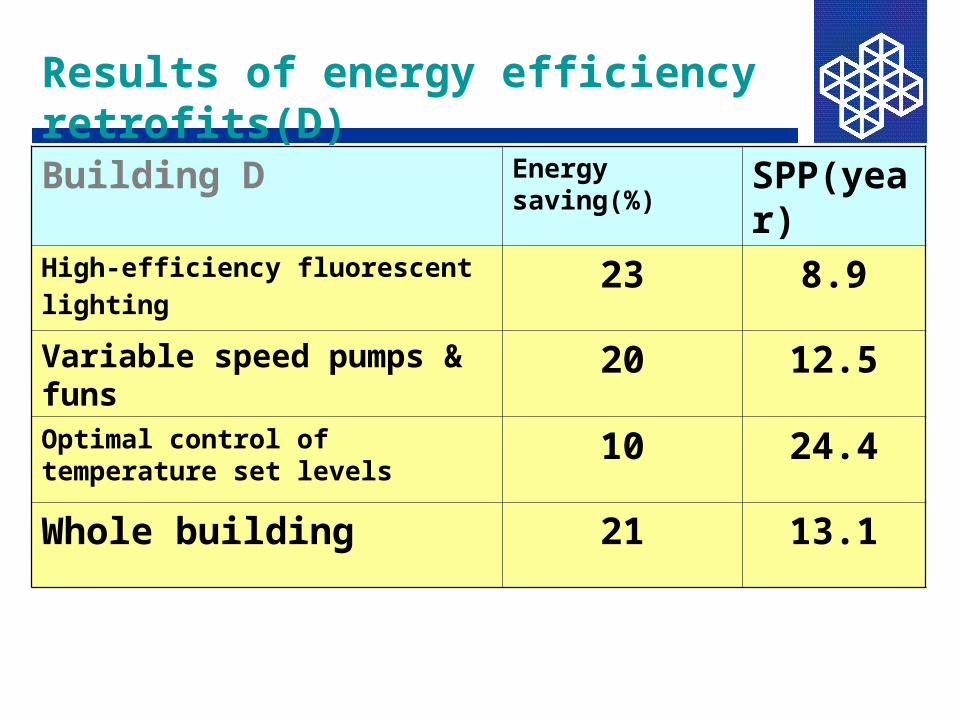
Results of energy efficiency retrofits(D)
Building D Energy saving(%) SPP(year)
High-efficiency fluorescent lighting 23 8.9
Variable speed pumps & funs 20 12.5
Optimal control of temperature set levels
10 24.4
Whole building 21 13.1
Curves of conserved energy(A)
0.0
0.1
0.2
0.3
0.4
0.5
0.6
0 1,000 2,000 3,000 4,000 5,000 6,000 7,000 8,000 9,000
cost
of
con
serv
ed e
ner
gy (
¢/M
J)
energy savings(GJ/year)
variable speed pumps
variable speed fans
energy management system
occupancy sensors for lighting controlshigh-efficiency fluorescent lighting
compact fluorescent lighting
Building A

Curves of conserved energy(B)
0.0
0.5
1.0
1.5
0 1,000 2,000 3,000 4,000 5,000 6,000
cost
of
con
serv
ed e
ner
gy (
¢/M
J)
energy savings(GJ/year)
optimal control of heat source equipment
insulating films
reconstruction of hot and coldwater supply system
variable speed pumps and fans
high- efficiency fluorescent lightingdirect digital control
renewal of electrical transformer
cold water radiant cooling
energy management system
Building B

Curves of conserved energy(C)
0.0
0.2
0.4
0.6
0.8
1.0
0 1,000 2,000 3,000 4,000
cost
of
con
serv
ed e
ner
gy (
¢/M
J)
energy savings(GJ/year)
control of outside air CO2 level
reduction of power used to supply water
variable speed pumps
demand controller
insulating films
control of electrical transformer
energy management system
high-efficiencyfluorescent lighting
cogenerationBuilding C

Curves of conserved energy(D)
0.0
0.5
1.0
1.5
2.0
2.5
3.0
0 1,000 2,000 3,000energy savings(GJ/year)
high-efficiency fluorescent lighting
optimal control of temperature set levels
variable speed pumps and fans
cost
of
con
serv
ed e
ner
gy (
¢/M
J) Building D

Energy efficiency measures(EEMs)
Option A High-efficiency fluorescent lighting
Compact fluorescent lighting
Occupancy sensors for lighting controls
Option B Variable speed pumps and funs
Renewal of electrical transformer
Optimal control of temperature set levels
Direct digital control
Optimal control of heat source equipment
Demand controller
Cogeneration
Energy management system
Option C Insulating films
Energy management system
Control of outside air CO2 level
Option D Insulating films
Renewal of air conditioning system
Renewal of heat source equipment


![Science & Technology - DTICTheoretical Studies on Transport Phenomena of Organic Superconductors [Hidetoshi Fukuyama] 2 Prediction of Limiting Mechanical and Electrical Properties](https://img.pdfslide.net/doc/110x75/5ecfaa80e8289810706c9369/science-technology-dtic-theoretical-studies-on-transport-phenomena-of-organic.jpg)