Embed Size (px)
Citation preview
1
Reference : Ko S Y, Spearpoint M J, Teo A. Trial evacuation of an industrial premises and evacuation model comparison. Fire Safety Journal, 42 (2), pp.91-105, 2007.
Trial Evacuation of an Industrial Premises and Evacuation Model Comparison
S Ko, ArupFire, Brisbane, Australia
M Spearpoint1, Department of Civil Engineering, University of Canterbury,
Christchurch, New Zealand
A Teo, ArupFire, Brisbane, Australia
ABSTRACT
This paper describes a trial evacuation from an industrial premises and compares the
results with two evacuation modelling programs. In the trial evacuation it was found that
most people appeared to respond immediately to the alarm however a small proportion of
the occupants exhibited significant delays in leaving the premises. A Monte Carlo
approach to evacuation modelling yielded reasonable results when compared to the trial
evacuation. Results from a commercially available evacuation simulation model were
found to give somewhat quicker flow rates than were observed in the trial.
1. INTRODUCTION
1.1 Trial evacuations
Under the New Zealand Fire Service Act, it is required that specified buildings have
evacuation schemes and trial evacuations at prescribed intervals are part of such
schemes [1]. Examples of buildings requiring evacuation schemes include those in which
more than 100 people gather and buildings used to store hazardous materials.
Trial evacuations and fire drills are intended to represent as closely as practical the
situation that the occupants would face if a fire were located in a remote area where the
only indication of fire would be the sound of the fire alarm signal. Trial evacuations have
1 Author to whom correspondence should be addressed.
E-mail: [email protected]
2
been studied in the literature and these have typically involved residential and office
occupancies [2] and educational occupancies [3, 4]. However, less work has been
directed toward industrial premises.
1.2 Evacuation Modelling
Fire engineers often use evacuation models to assess buildings and their ability to
provide sufficient time for the occupants to evacuate safely in the event of a fire or other
emergency. Sime [5] identified two different ways to model people moving around
buildings, in terms of movement of occupants or their behaviour. The first way of
modelling is called a ‘physical science’ or ‘ball-bearing’ model of human movement. The
second way of modelling is called a ‘social science’ or psychological model of human
reactions. People are assumed to be behaving irrationally in ‘physical science’ model
whereas people in ‘social science’ model are thinking and acting accordingly.
Gwynne et al [6] investigated the behavioural aspects required for evacuation modelling.
They have categorised four major factors that influenced evacuation performance and
suggested those to be represented within an evacuation model. The four broad areas
are: configuration of enclosure, environmental factors inside the structure, procedures
implemented within the enclosure, and most important of all, behaviour of the occupants.
The influence of an occupant’s personal attributes, such as physical, psychological and
sociological, will be affected by the other three broad areas. It concludes that a model
should consider the factors on which these decisions are based, rather than treating
occupants as instinctive entities as would be the case in a ‘ball-bearing’ model. In terms
of the methodologies of evacuation models, there are different approaches to the
evacuation analysis and different ways of representing the enclosure, the occupants and
their behaviour [7].
There are three types of approaches to the evacuation analysis, these are optimisation,
simulation and risk assessment. The optimisation model ignores the non-evacuation
activities as it assumes the occupants to evacuate in an efficient manner and an example
of this type of model is EVACNET+ [8]. The simulation model is an endeavour to embody
the behaviour and movement exhibited during evacuations to predict the decision-making
and escape routes. There are several simulation-type evacuation models including
BuildingEXODUS [9], EXIT89 [10] and EXITT [11]. The risk assessment model produces
a probability distribution of values from the repeated runs of each simulation and thus
provides statistical values for the evacuation times. The CRISP model [12] falls into the
risk assessment category.
3
There are two ways to represent a building space, using either a fine network approach
or a coarse network approach. The former represents a space as an extensive network of
nodes. Each node corresponds to a small area of the building space and allows a
detailed description to be implemented in an evacuation model. This approach is usually
an accurate representation of the building geometry and it often requires CAD drawings.
The second approach represents a space as a node and an arc to connect to the next
node. An arc represents the actual connection of the building space. Typically each node
is used to represent a distinct space in the building such as a room. However, it is
sometimes more appropriate to represent a space such as for a long corridor with more
than one node.
The building population can be represented in either a global or an individual perspective.
With the global perspective, the occupants are treated as a group, where each occupant
is identical and has no individual characteristics. With the individual perspective, each
occupant is assigned personal attributes, either randomly or by the user. Although the
course network and global building population approaches generally require less
computational effort, they may not take into account of the local physical and
psychological interactions of people.
In this study the results from the trial evacuation were compared to the simulated output
from two evacuation models with differing underlying approaches and capabilities. In
particular, an evacuation model that uses a Monte Carlo approach was compared with
the trial observations.
1.3 Simulex
Simulex [14] is a commercially available evacuation program capable of simulating the
evacuation of large populations from complex buildings. It allows the user to create a plan
layout that includes multiple floors connected by stairs directly from the commercially
available CAD programs. Simulex models a limited number of behavioural aspects such
as choice of exit and response time.
The user must place the final exits and links on the floor plan. Links are the boundaries of
any spaces such as staircases. Once the model finishes calculating the travel distances
throughout the whole building, which is the shortest distance nominated exits, and
defining the population, the user can start simulations. The version of the program used
in this study allows a maximum of 100 links, 100 staircases and 50 exits.
4
Response times can be specified for the occupants. There are three response time
distributions available to the user and they are the normal, triangular and uniform
distribution. Simulex essentially runs as a deterministic model if response times are not
included in simulations. Occupants can be added either one by one or as groups at any
location on the floor plans. In Simulex, an occupant is represented by three circles and
they are: the larger circle in the middle represents the torso and two smaller circles
represent the shoulders. The movement parameters allow the model to simulate a
realistic crowd movement. These features include normal unimpeded walking speed,
reduction of walking speed due to the proximity of other occupants, overtaking,
sidestepping and body twisting.
Simulex is a more sophisticated ball-bearing model that uses the fine network approach.
As a result, it can require a relatively large amount of time to complete its computations.
One of the best features in the model is a visual display of the evacuation. The user is
able to view the movement of any individuals at any location during the evacuation.
Therefore, the user is able to see the occupants overtaking, sidestepping and queuing
during the evacuation which helps to identify any bottleneck areas and problems
encountered during a simulation.
1.4 EvacuatioNZ
EvacuatioNZ is an evacuation model that is currently under development at the University
of Canterbury. It is a risk assessment model that incorporates the Monte Carlo approach
in producing probability distributions of evacuation times collected from repeated
simulations of a specified scenario. EvacuatioNZ uses a coarse network approach that
eases the representation of the building space but occupants are represented from an
individual perspective. The number of nodes, arcs and people is limited only by the
memory and processing capacity of the user’s computer.
The movement and queuing mechanics employed by EvacuatioNZ are based on the
equations published in the Fire Engineering Design Guide [15] with some modification so
that they can be appropriately implemented in the software. Research by Teo [13] carried
out validation processes that tested the model’s components and it was found that the
basic mechanisms of movement were working satisfactorily.
5
EvacuatioNZ requires the user to specify a range of input information that represents the
physical aspects of the building and those that define the behavioural aspects of the
occupants. The principal input files are:
• The “scenario” file describes the overall features necessary to execute
EvacuatioNZ. The user specifies the number of simulations required and the form
of the output results.
• The “simulation” file allows the user to set up the parameters for each individual
simulation. These parameters include the maximum simulation time, the time step,
maximum occupant density allowed in a node and details regarding the flow
calculation algorithm.
• The “map” file defines the building space as a collection of nodes and arcs. Nodes
that are defined by the user as “safe” are used to represent areas that terminate
an evacuation route. Arcs can be used to portray stairs or regions of level travel
and can also include restrictions such as doors.
• The user can specify the probability of different types of exit behaviour for the
occupants in the “exit behaviour” file. Exit behaviours correspond to the choice of
escape routes exhibited by the occupant during the evacuation. The types of exit
behaviours include the minimum number of nodes required to reach a “safe” node,
the minimum distance required to reach a “safe” node, preferred escape routes,
escape routes indicated by exit signs and the shortest travel distance to a
neighbouring node.
• The “person type” file defines the occupant characteristics of different types of
individuals in a population. Each person type is specified a maximum unimpeded
movement speed, an “exit behaviour” type and pre-evacuation response time.
There are currently only two types of pre-evacuation response distributions built in
the program, a normal distribution and a uniform distribution.
• The “populate” file is where the user specifies the number and type of occupants
in each node.
EvacuatioNZ provides several types of output files that record the node/arc usage, a
summary of the actions carried out by the building population at each time-step, a
detailed movement and behaviour log of each occupant and the total evacuation time for
each simulation.
6
2. TRIAL EVACUATION AT INDUSTRIAL PREMISES
2.1 Site description
The site comprised of offices, operational factories and warehouses. The offices were
mainly two-storey buildings and the other factories and warehouses were single storey
buildings. There were also a few empty buildings. Roads formed boundaries to the site.
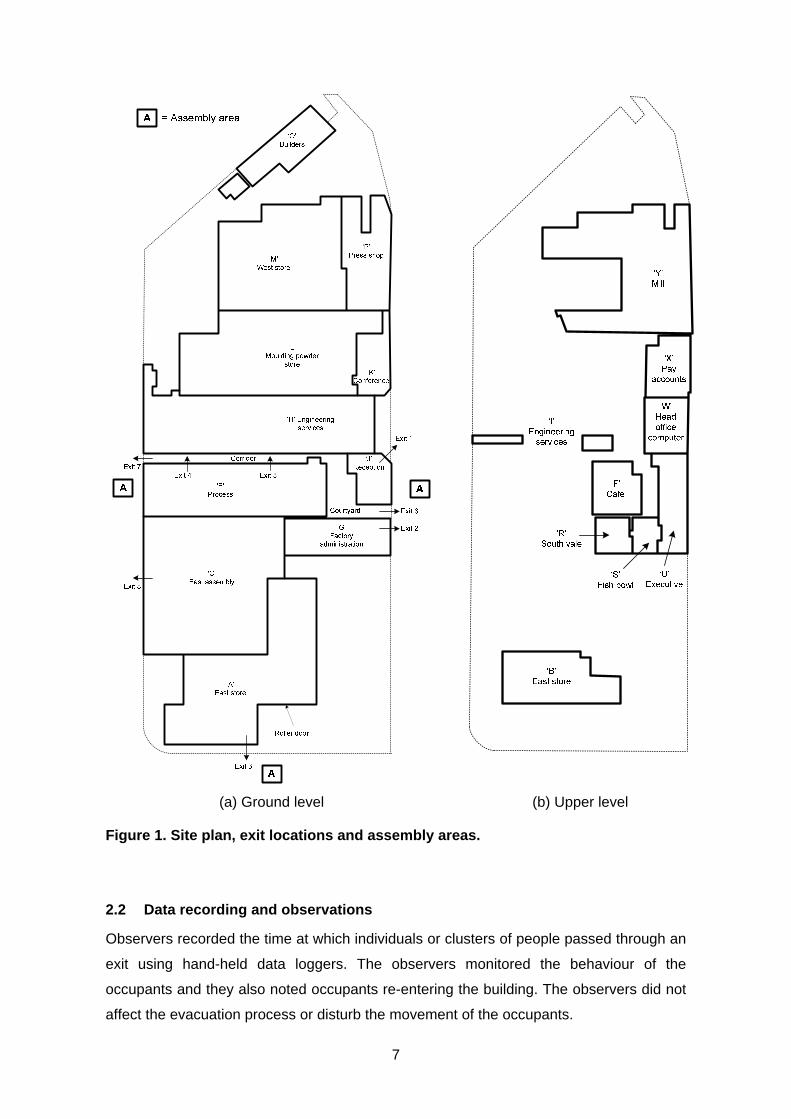
The areas of interest for this study are shown in Figure 1. Areas J, G and those
neighbouring areas on the first floor are offices, A is a storage unit, C and E are assembly
and processing areas, H and L are moulding areas. There are offices for customer
service at the front part of E, behind area J. Area F is an office area on the first floor that
can be accessed by internal and external stairs. The internal stair is connected to E and
the external stairs lead to the corridor between H and E. The open area between J and E
will be referred to as the courtyard and the areas between J and G, and E and H will be
referred to as the main access paths. The approximate dimension from the side edge of
A to L is 134 m and from J to E is 80 m.
At the time of the trial the occupants were all likely to be regular users of the buildings
and thus familiar with their layout. The trial was conducted at approximately 11am on a
fine spring day. Therefore, the evacuation was carried out when the building was at
typical capacity, the staff would be in their normal working environment and they were not
reluctant to leave the building due to inclement weather. Only those staff involved in
conducting the evacuation were aware that the trial was to take place. The fire alarm
sounders were operated for approximately 4½ minutes.
7
(a) Ground level (b) Upper level
Figure 1. Site plan, exit locations and assembly areas.
2.2 Data recording and observations
Observers recorded the time at which individuals or clusters of people passed through an
exit using hand-held data loggers. The observers monitored the behaviour of the
occupants and they also noted occupants re-entering the building. The observers did not
affect the evacuation process or disturb the movement of the occupants.
8
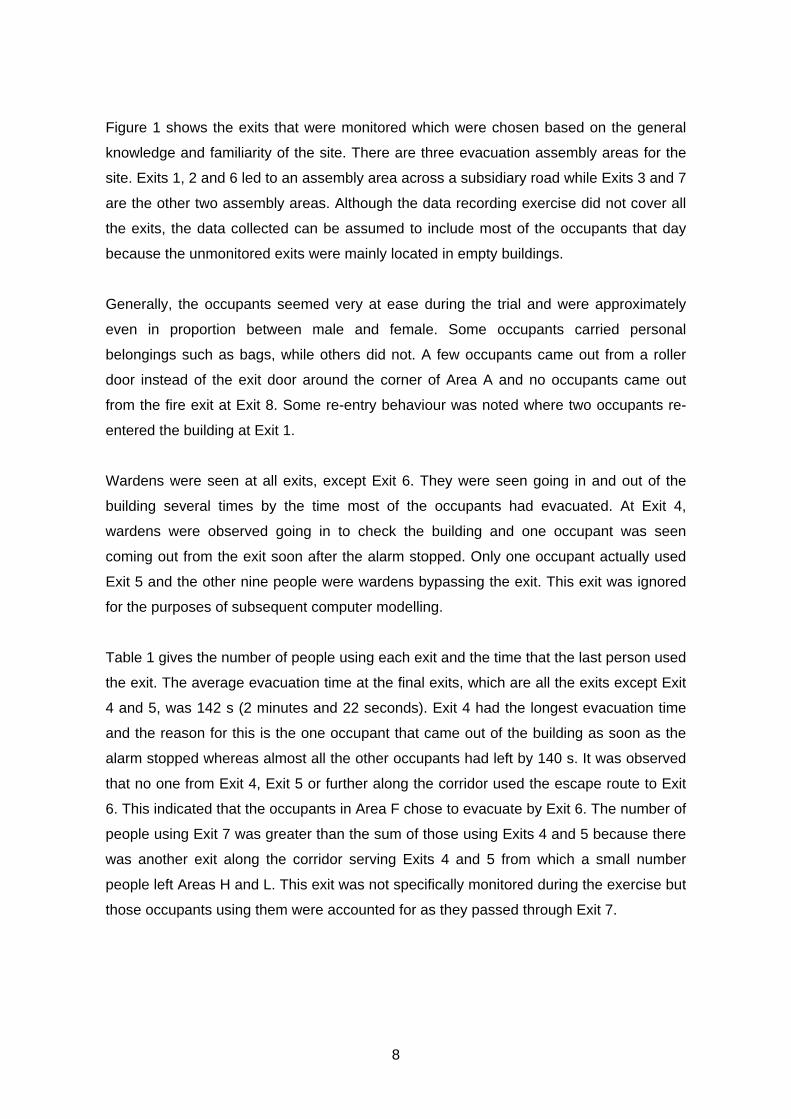
Figure 1 shows the exits that were monitored which were chosen based on the general
knowledge and familiarity of the site. There are three evacuation assembly areas for the
site. Exits 1, 2 and 6 led to an assembly area across a subsidiary road while Exits 3 and 7
are the other two assembly areas. Although the data recording exercise did not cover all
the exits, the data collected can be assumed to include most of the occupants that day
because the unmonitored exits were mainly located in empty buildings.
Generally, the occupants seemed very at ease during the trial and were approximately
even in proportion between male and female. Some occupants carried personal
belongings such as bags, while others did not. A few occupants came out from a roller
door instead of the exit door around the corner of Area A and no occupants came out
from the fire exit at Exit 8. Some re-entry behaviour was noted where two occupants re-
entered the building at Exit 1.
Wardens were seen at all exits, except Exit 6. They were seen going in and out of the
building several times by the time most of the occupants had evacuated. At Exit 4,
wardens were observed going in to check the building and one occupant was seen
coming out from the exit soon after the alarm stopped. Only one occupant actually used
Exit 5 and the other nine people were wardens bypassing the exit. This exit was ignored
for the purposes of subsequent computer modelling.
Table 1 gives the number of people using each exit and the time that the last person used
the exit. The average evacuation time at the final exits, which are all the exits except Exit
4 and 5, was 142 s (2 minutes and 22 seconds). Exit 4 had the longest evacuation time
and the reason for this is the one occupant that came out of the building as soon as the
alarm stopped whereas almost all the other occupants had left by 140 s. It was observed
that no one from Exit 4, Exit 5 or further along the corridor used the escape route to Exit
6. This indicated that the occupants in Area F chose to evacuate by Exit 6. The number of
people using Exit 7 was greater than the sum of those using Exits 4 and 5 because there
was another exit along the corridor serving Exits 4 and 5 from which a small number
people left Areas H and L. This exit was not specifically monitored during the exercise but
those occupants using them were accounted for as they passed through Exit 7.

9
Exit
number
Description Number
of people
Time to clear
exit, [s]
Exit 1 Main entrance at the Reception (Area J) and first
floor office (Area U)
28 217
Exit 2 Entrance to offices (Area G) 21 100
Exit 3 Exit for operational and storage area (A).
Evacuation assembly area
26 155
Exit 4 Main exit for the factory and the packaging area
(C and E)
92 257
Exit 5 Alternative exit to Area C and E 10 86
Exit 6 Evacuation assembly area 54 93
Exit 7 Evacuation assembly area 127 145
Exit 8 Fire door exit for the factory (Area C) 0 -
Table 1. Exit details and trial evacuation results.
A total of 256 occupants were monitored during the exercise. More detail regarding the
exercise and the subsequent modelling can be found in the work by Ko [16].
3. COMPUTER SIMULATIONS
3.1 Scenarios
Prior to attempting to model the whole evacuation of the premises, several exploratory
scenarios were modelled using both Simulex and EvacuatioNZ. Selected portions of the
building with different population flows were investigated and these are detailed
elsewhere [16].
Since only exits were monitored in the exercise, it was not possible to obtain actual pre-
evacuation times for the occupants but it appeared that most people reacted quickly to
the alarm. Initially the computer modelling analysis assumed that people reacted almost
immediately to the alarm to determine whether evacuation times would correspond to the
trial data. Subsequent changes were made to the pre-evacuation time to try to provide a
better match with the trial observations. In addition, the sensitivity to the EvacuatioNZ
model to the maximum unimpeded movement speed was examined.
10
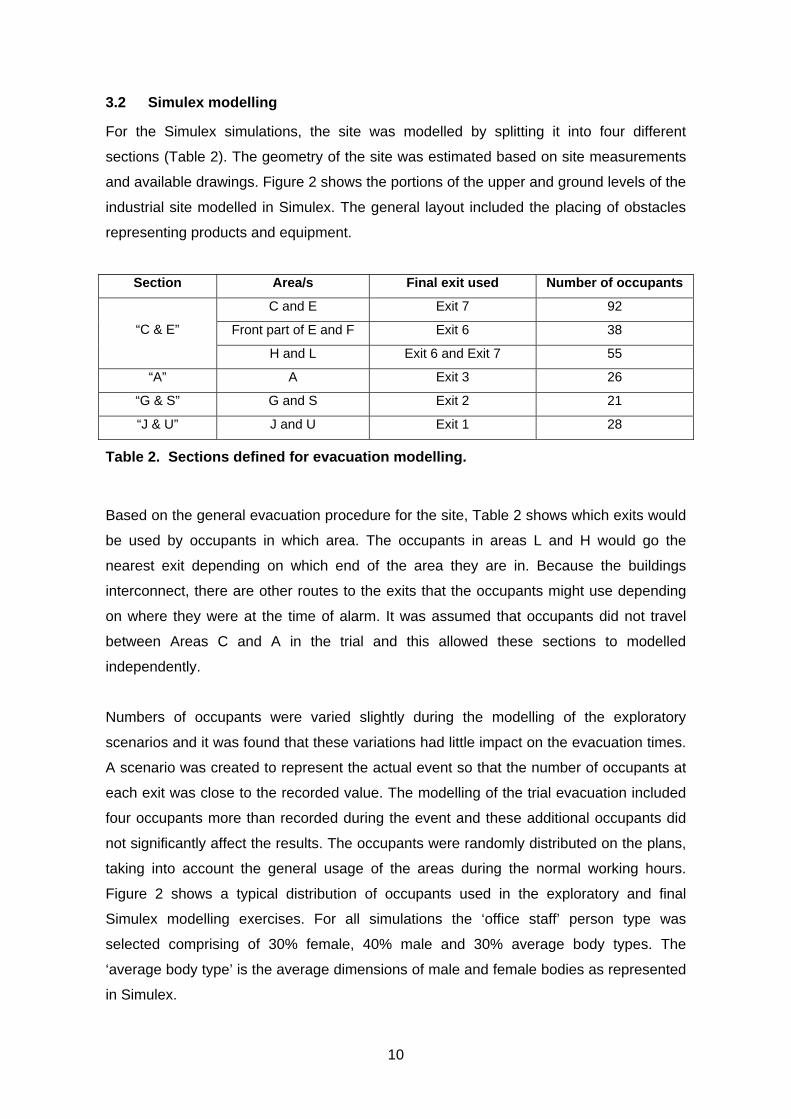
3.2 Simulex modelling
For the Simulex simulations, the site was modelled by splitting it into four different
sections (Table 2). The geometry of the site was estimated based on site measurements
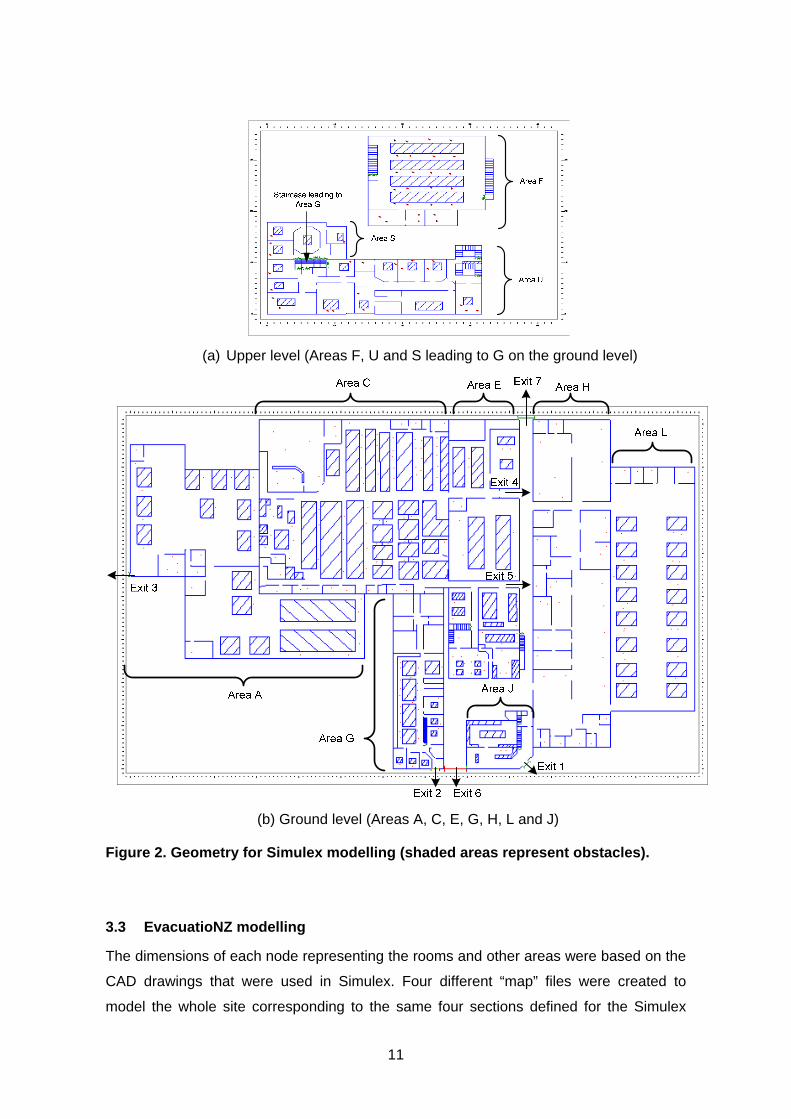
and available drawings. Figure 2 shows the portions of the upper and ground levels of the
industrial site modelled in Simulex. The general layout included the placing of obstacles
representing products and equipment.
Section Area/s Final exit used Number of occupants
C and E Exit 7 92
Front part of E and F Exit 6 38 “C & E”
H and L Exit 6 and Exit 7 55
“A” A Exit 3 26
“G & S” G and S Exit 2 21
“J & U” J and U Exit 1 28
Table 2. Sections defined for evacuation modelling.
Based on the general evacuation procedure for the site, Table 2 shows which exits would
be used by occupants in which area. The occupants in areas L and H would go the
nearest exit depending on which end of the area they are in. Because the buildings
interconnect, there are other routes to the exits that the occupants might use depending
on where they were at the time of alarm. It was assumed that occupants did not travel
between Areas C and A in the trial and this allowed these sections to modelled
independently.
Numbers of occupants were varied slightly during the modelling of the exploratory
scenarios and it was found that these variations had little impact on the evacuation times.
A scenario was created to represent the actual event so that the number of occupants at
each exit was close to the recorded value. The modelling of the trial evacuation included
four occupants more than recorded during the event and these additional occupants did
not significantly affect the results. The occupants were randomly distributed on the plans,
taking into account the general usage of the areas during the normal working hours.
Figure 2 shows a typical distribution of occupants used in the exploratory and final
Simulex modelling exercises. For all simulations the ‘office staff’ person type was
selected comprising of 30% female, 40% male and 30% average body types. The
‘average body type’ is the average dimensions of male and female bodies as represented
in Simulex.
11
(a) Upper level (Areas F, U and S leading to G on the ground level)
(b) Ground level (Areas A, C, E, G, H, L and J)
Figure 2. Geometry for Simulex modelling (shaded areas represent obstacles).
3.3 EvacuatioNZ modelling
The dimensions of each node representing the rooms and other areas were based on the
CAD drawings that were used in Simulex. Four different “map” files were created to
model the whole site corresponding to the same four sections defined for the Simulex
12
analysis (Table 2). The numbers of occupants in each area defined in the “population”
files were also the same as in the Simulex simulations. Together with each of the other
associated input files, these represented an overall evacuation of the premises and
simulated a scenario as close as possible to the Simulex simulation of the actual event.
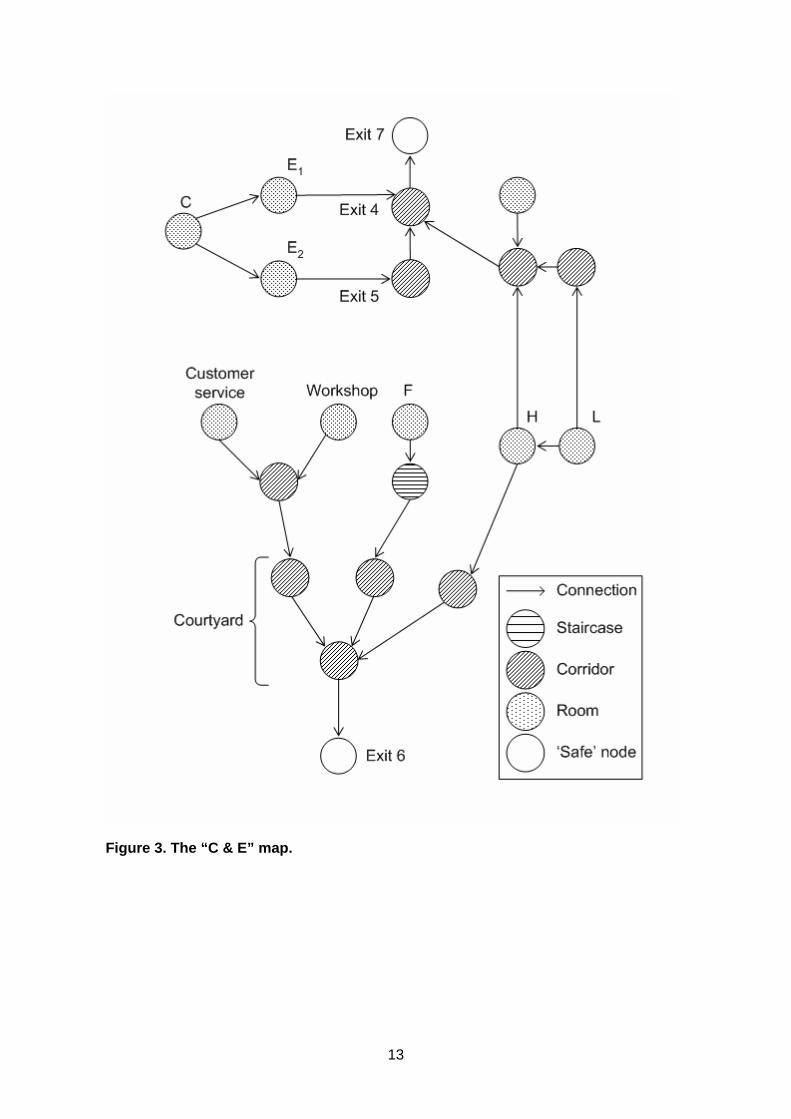
In most cases, the “map” files were simple to construct with the most complex being for
“C & E” (Figure 3). In this instance, Area E was modelled into three nodes: two nodes
represented two different areas that led to Exit 4 and 5 respectively and the third node
represented the front of E where the customer service is located. There are two
separated areas in H; a smaller area near Exit 7 and the remaining larger area. There is a
hallway between these two areas and leads to the main access path. Therefore, both H
and the hallway were modelled by two nodes. The courtyard was also modelled into
several nodes where occupants from other areas merged. There would be three sources;
they are from H, F and customer service. Each of these has separate paths before the
point where all of them merge.
As for the exit choice, the occupants in C were assigned with only one exit choice, which
was the “preferred route”. This was to simulate the scenario similar to the actual
evacuation and to match with the Simulex simulation. The occupants in H and L were
also assigned only with one exit choice, which is the “minimum nodes to safe” route. This
was because the occupants in those areas could have used either one of the exits. It was
found that the occupants in each area have the same number of nodes to a safe node
(Exit 6 or Exit 7); therefore, by using the “minimum nodes to safe” route, it would allow in
the occupants to have equal chance of using each exit. The maximum unimpeded travel
speed was set to 1.2 m/s for all occupants except when the effect of maximum
unimpeded travel speed was explicitly investigated.
The use of Monte Carlo techniques in the EvacuatioNZ model required convergence
testing be done before analysing any simulation results. It was important to determine the
number of iterations that were needed to give results close to a converging output. Three
random number seeds were used to determine the convergence and it was found that
500 simulations gave convergence on the final mean evacuation time.
13
Figure 3. The “C & E” map.
14
4. RESULTS AND ANALYSIS
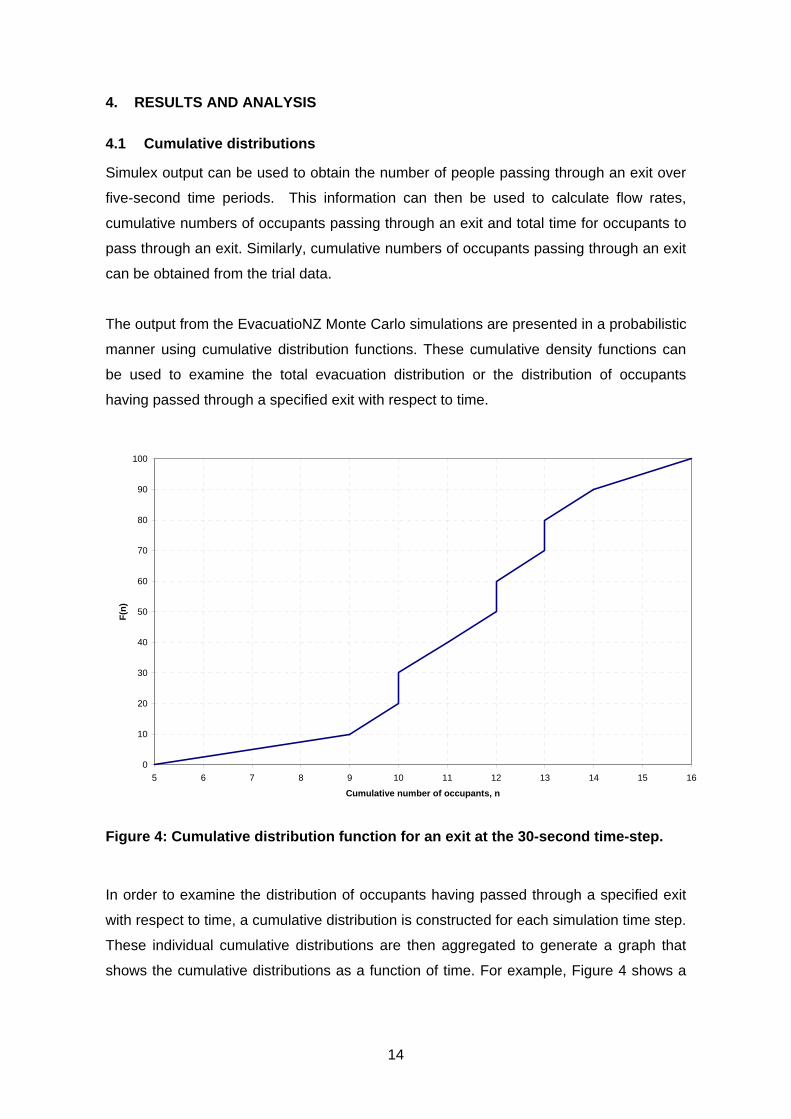
4.1 Cumulative distributions
Simulex output can be used to obtain the number of people passing through an exit over
five-second time periods. This information can then be used to calculate flow rates,
cumulative numbers of occupants passing through an exit and total time for occupants to
pass through an exit. Similarly, cumulative numbers of occupants passing through an exit
can be obtained from the trial data.
The output from the EvacuatioNZ Monte Carlo simulations are presented in a probabilistic
manner using cumulative distribution functions. These cumulative density functions can
be used to examine the total evacuation distribution or the distribution of occupants
having passed through a specified exit with respect to time.
0
10
20
30
40
50
60
70
80
90
100
5 6 7 8 9 10 11 12 13 14 15 16
Cumulative number of occupants, n
F(n)
Figure 4: Cumulative distribution function for an exit at the 30-second time-step.
In order to examine the distribution of occupants having passed through a specified exit
with respect to time, a cumulative distribution is constructed for each simulation time step.
These individual cumulative distributions are then aggregated to generate a graph that
shows the cumulative distributions as a function of time. For example, Figure 4 shows a
15
cumulative distribution for an exit at the 30-second after alarm activation time-step where
F(n) is the probability that n or less occupants have passed through the monitored exit.
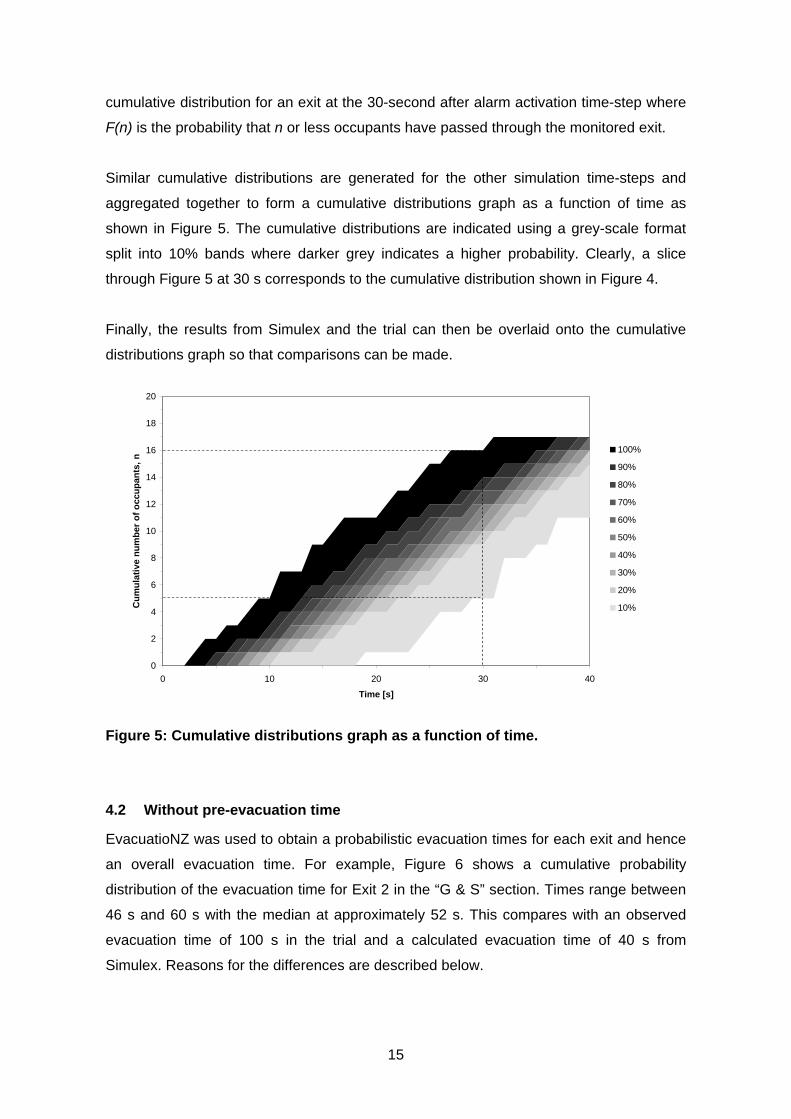
Similar cumulative distributions are generated for the other simulation time-steps and
aggregated together to form a cumulative distributions graph as a function of time as
shown in Figure 5. The cumulative distributions are indicated using a grey-scale format
split into 10% bands where darker grey indicates a higher probability. Clearly, a slice
through Figure 5 at 30 s corresponds to the cumulative distribution shown in Figure 4.
Finally, the results from Simulex and the trial can then be overlaid onto the cumulative
distributions graph so that comparisons can be made.
0
2
4
6
8
10
12
14
16
18
20
0 10 20 30 40
Time [s]
Cum
ulat
ive
num
ber o
f occ
upan
ts, n
100%
90%
80%
70%
60%
50%
40%
30%
20%
10%
Figure 5: Cumulative distributions graph as a function of time.
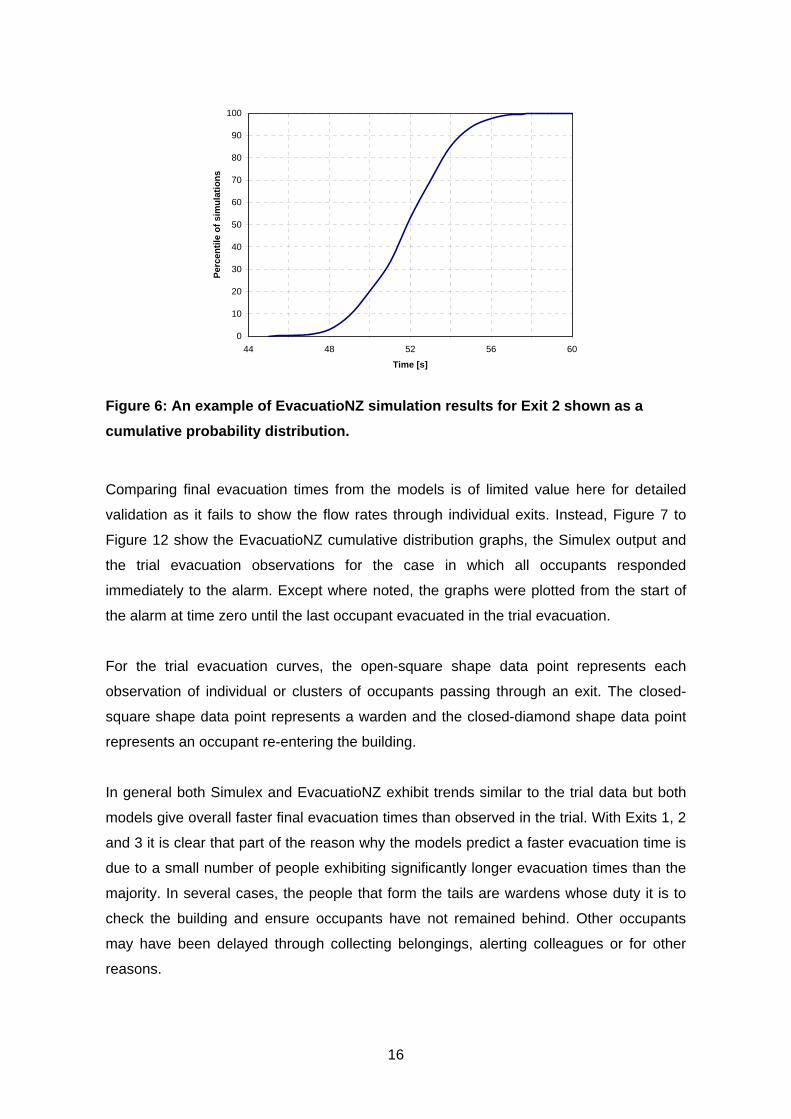
4.2 Without pre-evacuation time
EvacuatioNZ was used to obtain a probabilistic evacuation times for each exit and hence
an overall evacuation time. For example, Figure 6 shows a cumulative probability
distribution of the evacuation time for Exit 2 in the “G & S” section. Times range between
46 s and 60 s with the median at approximately 52 s. This compares with an observed
evacuation time of 100 s in the trial and a calculated evacuation time of 40 s from
Simulex. Reasons for the differences are described below.
16
0
10
20
30
40
50
60
70
80
90
100
44 48 52 56 60
Time [s]
Perc
entil
e of
sim
ulat
ions
Figure 6: An example of EvacuatioNZ simulation results for Exit 2 shown as a cumulative probability distribution.
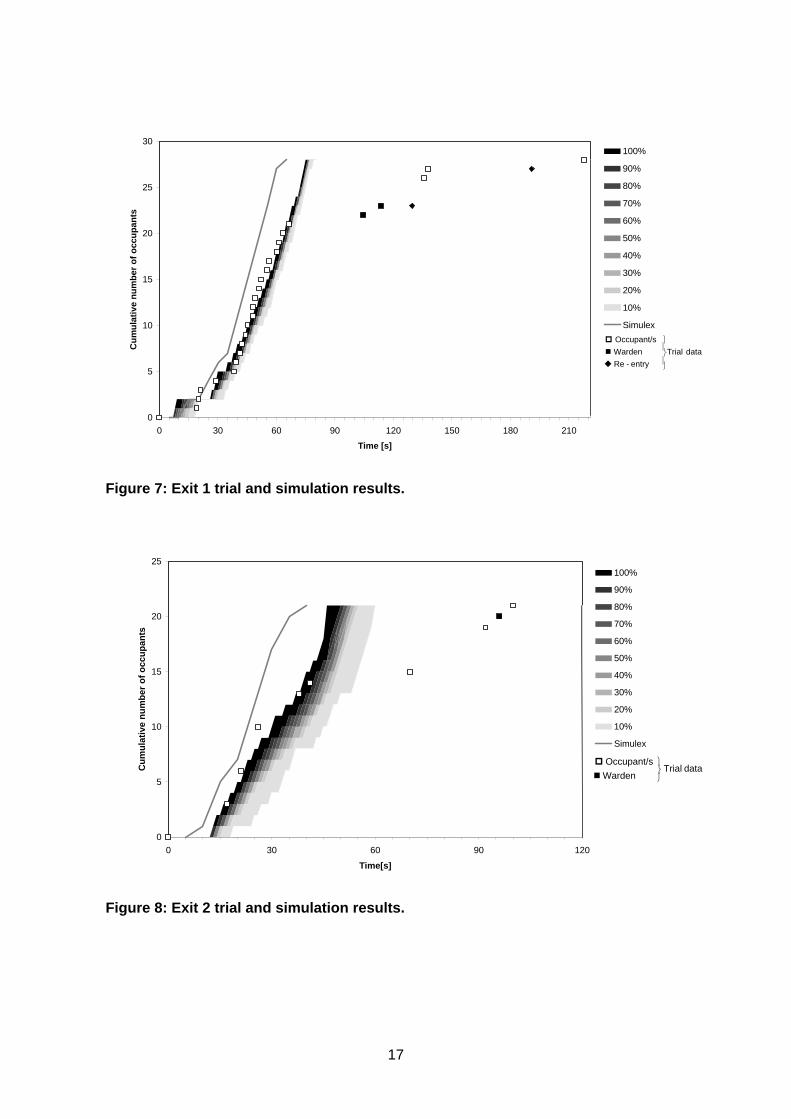
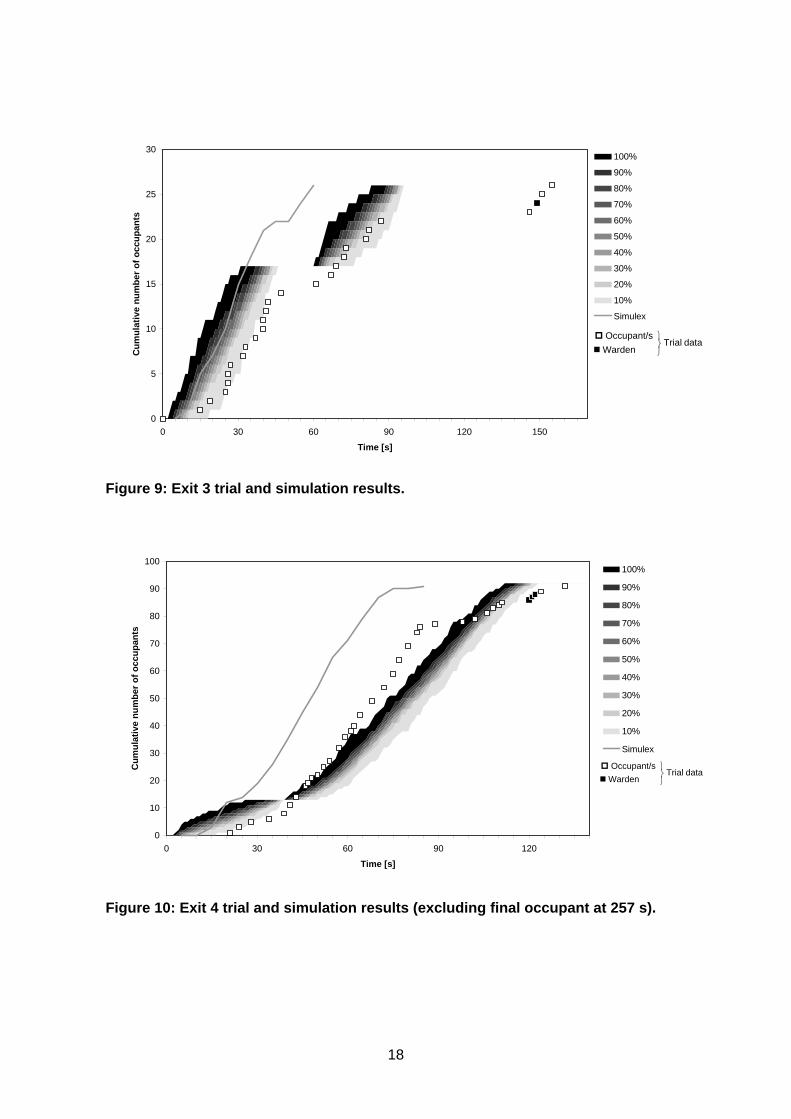
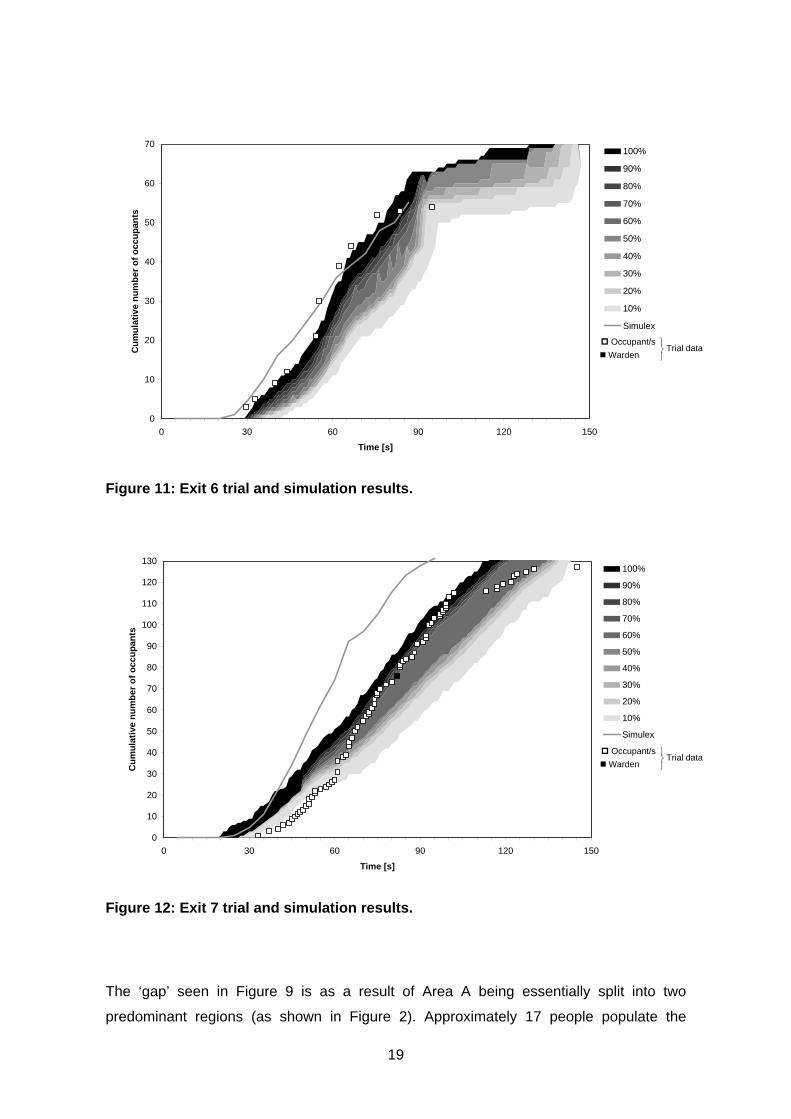
Comparing final evacuation times from the models is of limited value here for detailed
validation as it fails to show the flow rates through individual exits. Instead, Figure 7 to
Figure 12 show the EvacuatioNZ cumulative distribution graphs, the Simulex output and
the trial evacuation observations for the case in which all occupants responded
immediately to the alarm. Except where noted, the graphs were plotted from the start of
the alarm at time zero until the last occupant evacuated in the trial evacuation.
For the trial evacuation curves, the open-square shape data point represents each
observation of individual or clusters of occupants passing through an exit. The closed-
square shape data point represents a warden and the closed-diamond shape data point
represents an occupant re-entering the building.
In general both Simulex and EvacuatioNZ exhibit trends similar to the trial data but both
models give overall faster final evacuation times than observed in the trial. With Exits 1, 2
and 3 it is clear that part of the reason why the models predict a faster evacuation time is
due to a small number of people exhibiting significantly longer evacuation times than the
majority. In several cases, the people that form the tails are wardens whose duty it is to
check the building and ensure occupants have not remained behind. Other occupants
may have been delayed through collecting belongings, alerting colleagues or for other
reasons.
17
0
5
10
15
20
25
30
0 30 60 90 120 150 180 210
Time [s]
Cum
ulat
ive
num
ber o
f occ
upan
ts
100%
90%
80%
70%
60%
50%
40%
30%
20%
10%
Simulex
dataTrialentry -Re
Warden Occupant/s
⎪⎭
⎪⎬
⎫
Figure 7: Exit 1 trial and simulation results.
0
5
10
15
20
25
0 30 60 90 120
Time[s]
Cum
ulat
ive
num
ber o
f occ
upan
ts
100%
90%
80%
70%
60%
50%
40%
30%
20%
10%
Simulex
dataTrial Warden
Occupant/s
⎭⎬⎫
Figure 8: Exit 2 trial and simulation results.
18
0
5
10
15
20
25
30
0 30 60 90 120 150
Time [s]
Cum
ulat
ive
num
ber o
f occ
upan
ts
100%
90%
80%
70%
60%
50%
40%
30%
20%
10%
Simulex
dataTrial Warden
Occupant/s
⎭⎬⎫
Figure 9: Exit 3 trial and simulation results.
0
10
20
30
40
50
60
70
80
90
100
0 30 60 90 120
Time [s]
Cum
ulat
ive
num
ber o
f occ
upan
ts
100%
90%
80%
70%
60%
50%
40%
30%
20%
10%
Simulex
dataTrial Warden
Occupant/s
⎭⎬⎫
Figure 10: Exit 4 trial and simulation results (excluding final occupant at 257 s).
19
0
10
20
30
40
50
60
70
0 30 60 90 120 150
Time [s]
Cum
ulat
ive
num
ber o
f occ
upan
ts
100%
90%
80%
70%
60%
50%
40%
30%
20%
10%
Simulex
dataTrial Warden
Occupant/s
⎭⎬⎫
Figure 11: Exit 6 trial and simulation results.
0
10
20
30
40
50
60
70
80
90
100
110
120
130
0 30 60 90 120 150
Time [s]
Cum
ulat
ive
num
ber o
f occ
upan
ts
100%
90%
80%
70%
60%
50%
40%
30%
20%
10%
Simulex
dataTrial Warden
Occupant/s
⎭⎬⎫
Figure 12: Exit 7 trial and simulation results.
The ‘gap’ seen in Figure 9 is as a result of Area A being essentially split into two
predominant regions (as shown in Figure 2). Approximately 17 people populate the
20
region closest to Exit 3 and another 9 populate a region further away from Exit 3 which
only has a single door that leads on through to Exit 3. These two groups of people
effectively form two distinct populations such that the first group evacuate through Exit 3
in the first 30 s and the second group after 60 s. The result of the two populations is very
evident in the EvacuatioNZ simulations since the two regions were represented by two
connected nodes but much less evident where Simulex is concerned. The trial data
exhibits an apparent distinction between the two groups between 45 s and 60 s along
with those occupants that make up the tail of the evacuation after 145 s.
At around 40 s the EvacuatioNZ output for Exit 4 (Figure 10) shows no variability in the
simulation results i.e. 13 occupants had used the exit at around 40 s in 100 % of the
simulations. The reason for this is similar as that given for Exit 3 where in this case
people in Area E close to Exit 4 (node E1 in Figure 3) are somewhat separated from those
represented in Area C. Although the Exit 4 trial data is faster than the EvacuatioNZ
simulations during the middle stage of the evacuation, the downstream effect of this is not
evident at Exit 7 (Figure 12). The flow of occupants through Exit 7 includes those using
Exit 4 plus those using Exit 5 and also the additional occupants that exited from Areas H
and L but were not monitored in the trial. The amalgamation of these groups results in
simulation results that are comparable to the trial data.
Exit 6 (Figure 11) is the foremost instance in which Simulex gave slower simulated
evacuation times for some occupants than recorded in the trial evacuation. There appear
to be no particular reasons for these outcomes other than the result being a manifestation
of the modelling limitations and scenario description. Exit 1 (Figure 7) also exhibits a
similar difference during the early stages of the evacuation and again this is likely to be
an outcome of the modelling exercise.
4.3 With pre-evacuation time
The previous results indicate that, only a small proportion of the occupants have a
significant pre-evacuation time. The assumption that most of the occupants in the trial
responded almost immediately to the alarm is therefore reasonable. However, Exits 1, 2
and 3 in particular were observed to have occupants with significant pre-evacuation times.
EvacuatioNZ allows individuals or small groups of the population to exhibit different pre-
evacuation times. In order to discover whether EvacuatioNZ could show a better
correspondence with the trial observations, pre-determined pre-evacuation times were
assigned to specific occupants that caused the ‘tail’. These assigned pre-evacuation
21
times were pre-determined according to the trial data recorded at each exit and consisted
of a normal distribution with an arbitrary ±10 s variation in the mean.
For Exit 1, there were two distinct pre-evacuation times, when the wardens appeared
(about 120 s) and later when a couple of occupants left (about 200 s). Therefore, by
taking into account the travel time, which was assumed as the time between when the
alarm sounded and when the first occupant left (about 20 s), the pre-evacuation time
used were 100 s and 180 s respectively. Similarly, for Exits 2 and 3, the pre-evacuation
times were 80 s and 60 s respectively. It is noted that these times were only specified to a
small proportion of the occupants (about 2 to 5 occupants) corresponding to the
observations from the trial.
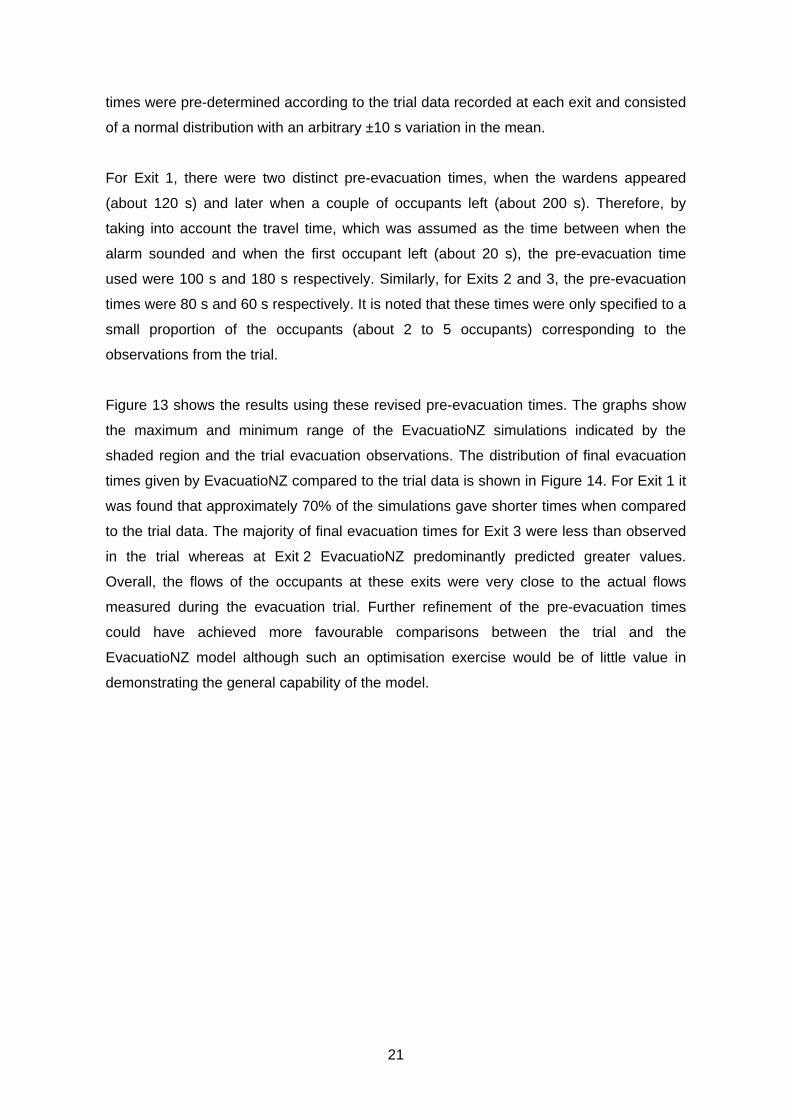
Figure 13 shows the results using these revised pre-evacuation times. The graphs show
the maximum and minimum range of the EvacuatioNZ simulations indicated by the
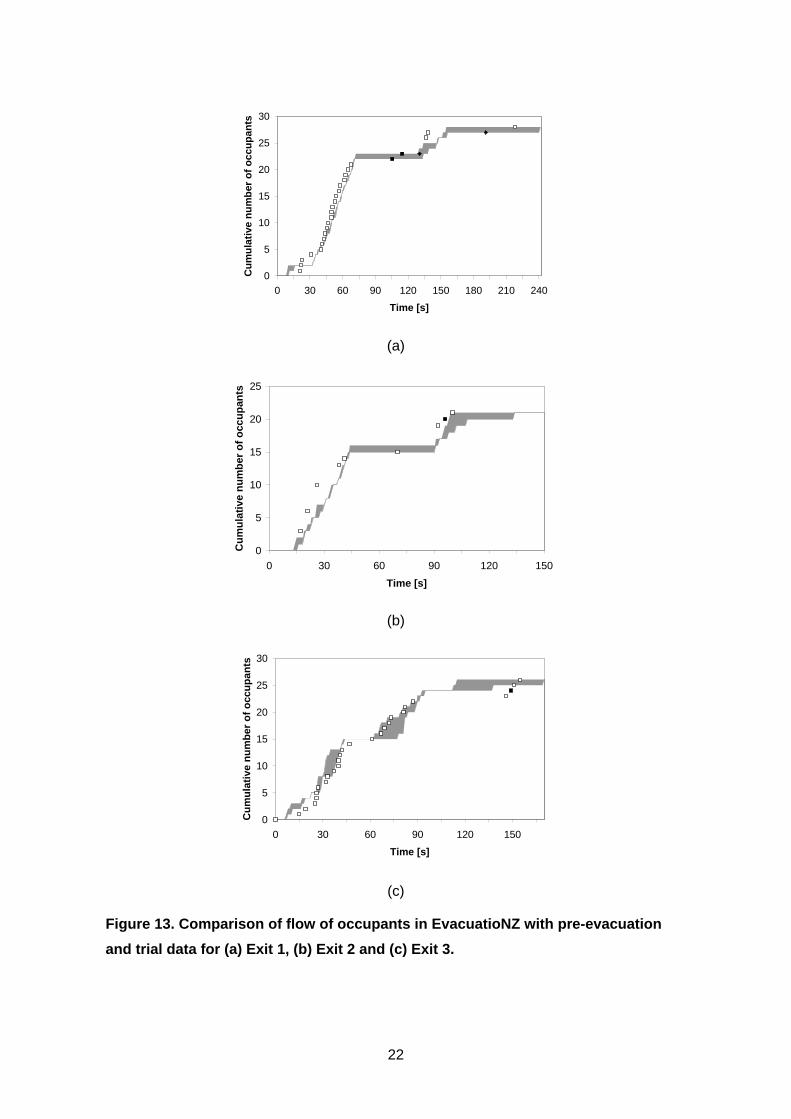
shaded region and the trial evacuation observations. The distribution of final evacuation
times given by EvacuatioNZ compared to the trial data is shown in Figure 14. For Exit 1 it
was found that approximately 70% of the simulations gave shorter times when compared
to the trial data. The majority of final evacuation times for Exit 3 were less than observed
in the trial whereas at Exit 2 EvacuatioNZ predominantly predicted greater values.
Overall, the flows of the occupants at these exits were very close to the actual flows
measured during the evacuation trial. Further refinement of the pre-evacuation times
could have achieved more favourable comparisons between the trial and the
EvacuatioNZ model although such an optimisation exercise would be of little value in
demonstrating the general capability of the model.
22
0
5
10
15
20
25
30
0 30 60 90 120 150 180 210 240
Time [s]
Cum
ulat
ive
num
ber o
f occ
upan
ts
(a)
0
5
10
15
20
25
0 30 60 90 120 150
Time [s]
Cum
ulat
ive
num
ber o
f occ
upan
ts
(b)
0
5
10
15
20
25
30
0 30 60 90 120 150
Time [s]
Cum
ulat
ive
num
ber o
f occ
upan
ts
(c)
Figure 13. Comparison of flow of occupants in EvacuatioNZ with pre-evacuation and trial data for (a) Exit 1, (b) Exit 2 and (c) Exit 3.
23
0
10
20
30
40
50
60
70
80
90
100
90 105 120 135 150 165 180 195 210 225 240
Evacuation time [s]
Perc
entil
e of
sim
ulat
ions
Exit 1Exit 2 Exit 3
Recorded evacuation time
Recorded evacuation time
Recorded evacuation time
Figure 14. Distribution of final evacuation times given by EvacuatioNZ compared to the trial data for Exits 1, 2 and 3.
It must be noted that this method of assigning of a specific pre-evacuation time may not
be applicable as a general design method. Designers would not know what the exact pre-
evacuation time for their buildings would be prior to an actual evacuation. Instead, typical
pre-evacuation distributions for the class of building and type of occupants would need to
be used as discussed, for example, by Purser [17]. The results show potential of
EvacuatioNZ where the probability of having tail-enders and the extent of their pre-
evacuation delay is known. In this case, the comparison between the simulations and the
trial data can be matched closely by specifying the pre-evacuation times for the
occupants that formed the tails.
4.4 Movement speed
As noted earlier, if the occupants at the tail of the evacuation are excluded, it was found
that Simulex gave faster flows compared with EvacuatioNZ. One reason for this
difference between the two models was with the movement speeds of the occupants
particularly where unimpeded flow is considered.
Occupant flow rates depend greatly on the queuing process and this is related to the
geometry of the building. In areas with a relatively high number of constrictions and
24
occupants it might be expected that one or more queues would be formed and these
queues would dominate the evacuation process. Where there are fewer constrictions or a
lower occupant density, the occupants are able to move freely and thus attain their
maximum unimpeded travel speeds.
The current version of EvacuatioNZ applies a user-specified constant maximum travel
speed for unimpeded flow. In order to compare the output from the two computer models,
two different maximum travel speeds were simulated in EvacuatioNZ:
• the unimpeded travel speed of 1.2 m/s given by the equations in the Fire
Engineering Design Guide [15],
• The maximum unimpeded travel speed of 1.7 m/s used by Simulex.
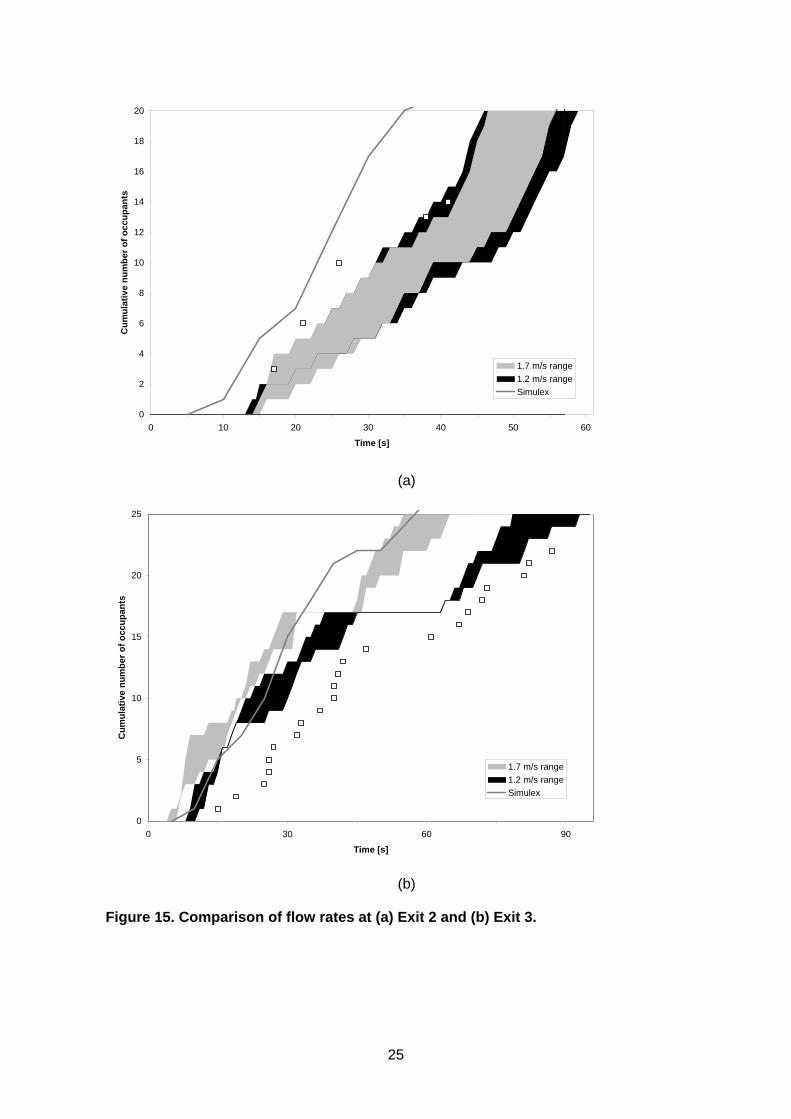
Prior to the main EvacuatioNZ comparison described earlier, a sensitivity analysis on the
user-specified constant maximum speed was conducted by executing an additional series
of runs. Figure 15 shows the flow rates for the two different unimpeded travel speeds at
Exits 2 and 3. The maximum and minimum values obtained from EvacuatioNZ are shown
by the shaded regions. Area G was an office area with a number of doors that terminated
at Exit 2. It can be seen in Figure 15(a) that altering the unimpeded travel speed had little
impact on the evacuation progress. Between approximately 15 s and 30 s the values
were an exact match and the period after 30 s shows only slight variations that result
from the Monte Carlo modelling approach. Alternatively, Area A was an open area that
terminated with Exit 3 and Figure 15(b) shows a noticeable difference in the EvacuatioNZ
predictions. In particular, the results for Exit 3 show a closer match between Simulex and
EvacuatioNZ at the 1.7 m/s unimpeded travel speed.
25
0
2
4
6
8
10
12
14
16
18
20
0 10 20 30 40 50 60
Time [s]
Cum
ulat
ive
num
ber o
f occ
upan
ts
1.7 m/s range1.2 m/s rangeSimulex
(a)
0
5
10
15
20
25
0 30 60 90
Time [s]
Cum
ulat
ive
num
ber o
f occ
upan
ts
1.7 m/s range1.2 m/s rangeSimulex
(b)
Figure 15. Comparison of flow rates at (a) Exit 2 and (b) Exit 3.
26
Overall, an EvacuatioNZ maximum unimpeded travel speed of 1.2 m/s showed a better
comparison with the trial data whether queues or unimpeded travel speeds were a
dominant factor in the evacuation. The results also suggest that the unimpeded travel
speed used by Simulex may be greater than typically found in the trial evacuation.
5. DISCUSSION
In carrying out this analysis, several issues were identified concerning the modelling
philosophy used in EvacuatioNZ and its usability compared with Simulex. The coarse
network approach employed by EvacuatioNZ attempts to minimise the computation time
required. Compared to Simulex, which can simply use CAD plans as input, the user is
required to create a specific geometric representation of the building geometry and this
can be time-consuming for a complex building. However, EvacuatioNZ does have has
some additional flexibility over Simulex. In EvacuatioNZ, the user can simply turn on or off
a node or a connection when necessary and it is easy to add or delete a node or a
connection. In Simulex, the user would have to edit the floor plan using a CAD program
before importing it to Simulex. If the overall floor area does not change, it would not
cause any problems; otherwise, all the links and exits will have to be moved by the user.
One of the major advantages of Simulex over EvacuatioNZ is that it provides a visual
display of the evacuation. This makes tracking the occupants and observing the
movement relatively easy. It also enables the user to identify bottlenecks and rectify any
problems during the simulation. The lack of graphical output in EvacuatioNZ made
tracking occupants and finding any flaws in EvacuatioNZ more troublesome especially
when there are many nodes and connections.
Maximum connection lengths were used in all the simulations using EvacuatioNZ. This
length was assumed as the distance for an occupant in the most remote position of a
node to the furthest exit from that node. For a node such as a corridor or a pathway, the
distance would be its length or alternatively the user could divide the corridor into several
nodes according to where each adjacent room is located. The use of the maximum
connection length may result in longer evacuation times and it may not represent a
realistic walking path. For example, consider two interconnected rooms with only one exit
that is in the second room but very close to the interconnecting door. The occupants from
the first room would have to travel a longer distance than in actuality using the maximum
connection length assumption. If the room were small, the extra distance would not have
significant effect, whereas in a large room the additional travel distance may result in
27
significant time increases. The use of the maximum connection length assumption in this
study appeared to provide a reasonable approximation of the actual evacuation and
would err on the side of safety for design purposes. The effect on the evacuation
progression of using alternative representations of the same building using nodes and
arcs could be a subject of future investigation.
It can be seen from the analysis of the evacuation trial that the comparison with the
computer models was affected by a number of factors including the maximum travel
speed for unimpeded flow, the pre-evacuation distributions and the behaviour of the
people. Although it would be desirable to have models that accounted fully for all of these
factors, there may be others that are beyond the required scope of such models. For
example, it may not be reasonable to expect or require a computer model to be able to
include wardens particularly for design purposes. The ability to predict the occurrence of
re-entry behaviour and its subsequent effects of the evacuation simulation also pose
challenges to evacuation models.
The EvacuatioNZ model has the ability to incorporate further behavioural aspects in
addition to its exit choice feature and this is the subject of future development. Issues
such as redirection and group behaviour could be added to EvacuatioNZ subject to
sufficient input data being available and appropriate validation being conducted. The
ability to import building plans into EvacuatioNZ is also under consideration.
6. CONCLUSIONS
Results from the two evacuation simulations show Simulex has a quicker evacuation
time. EvacuatioNZ results generally are more accurate representations of the actual
events compared with Simulex results. Further development and validation of the
EvacuatioNZ model is required before it could be used as a general design tool. The
current version of EvacuatioNZ would be recommended as a research tool or only be
used under certain circumstances where users are aware of the limitations of the model
and proceed with care.
As in the case of any computer modelling for design purposes, the user should consider
including some measures that provide a safety factor to the modelling. In terms of
evacuation modelling these measures could be having an appropriately conservative pre-
evacuation delay, assuming a slower maximum movement speed or simply by adjusting
the final calculated evacuation time with an appropriate safety margin.
28
There is always an uncertainty regarding the exact situation evacuees would find
themselves in an emergency evacuation. Therefore, designers should create a number of
possible scenarios in which this uncertainty can be investigated through parameter
variation. EvacuatioNZ achieves this by generating probability distributions of evacuation
times from the repeated simulations allowing the user to have an overview of what the
possible evacuation times are and some indication of the possible worst-case scenario.
ACKNOWLEDGEMENTS The authors would like to thank the ENFE 604 2002 class for assisting with the data
collection, in particular Kristin Hoskin. The authors also appreciate the assistance of the
owners of the industrial site for allowing access to their buildings and IES Ltd for
providing the Simulex software. The University of Canterbury Fire Engineering
programme is supported by the New Zealand Fire Service Commission.
REFERENCES 1. Fire safety and evacuation of buildings regulations 1992, SR 1992/361, New
Zealand Government, Wellington, New Zealand, 1993.
2. Proulx, G. and Fahy, R.F. The time delay to start evacuation: Review of five case
studies. Fire Safety Science - Proceedings of the Fifth International Symposium.
(Melbourne, Australia), pp 771- 782, 1997.
3. Kimura, M. and Sime, J.D. Exit choice behaviour during the evacuation of two
lecture theatres. Fire Safety Science - Proceedings of the Second International
Symposium. pp 541- 550, 1989.
4. Olsson P A, Regan M A. A comparison between actual and predicted evacuation
times. Human Behaviour in Fire – Proc. of the 1st International Symposium,
Belfast, Northern Ireland, pp.13-29, 1999.
5. Sime, J.D. Escape behaviour in fires and evacuations. In: Design Against Fire: An
Introduction to Fire Safety Engineering Design. Eds: P. Stallord and L. Johnston,
E & FN SPON, London, 1994.
6. Gwynne, S., Galea, E.R., Owen, M. and Lawrence, P.J. An investigation of the
aspects of occupant behaviour required for an evacuation modelling. In: Evacuation from fires, Vol. II. Ed: P.R. DeCicco, Baywood Publishing Company,
Amityville, N.Y., 2002.
7. Gwynne, S., Galea, E.R., Owen, M., Lawrence, P.J. and Filippidis, L. A review of
the methodologies used in evacuation modelling. Fire and Materials, 23, 383-388,
1999.
29
8. Kisko, T.M. and Francis R. L. EVACNET+: A computer program to determine
optimal building evacuation plans. Fire Safety Journal, 9, 211-220, 1985.
9. Owen, M., Galea, E.R. and Lawrence, P.J. Advanced occupant behavioural
features of the buildingEXODUS evacuation model. Fire Safety Science -
Proceedings of the Fifth International Symposium. (Melbourne, Australia), pp 795-
806, 1997.
10. Fahy, R.F. Enhancement of EXIT89 and analysis of World Trade Center Data.
NIST-GCR-95-684, Building and Fire Research Laboratory, NIST, USA, 1996.
11. Kostreva, M.M and Lancaster, L.C. A comparison of two methodologies in Hazard
I fire egress analysis. Fire Technology, 34(3), 227-243, 1998.
12. Ghosh, B. and Fraser-Mitchell, J. Fire Risk Assessment: CRISP – A calculation
tool. Fire Safety Engineering, 6 (4), 11-13, 1999.
13. Teo, A.P.Y. Validation of an evacuation model currently under development, Fire
Engineering Research Report 01/7, University of Canterbury, New Zealand, 2001.
14. Thompson, P., Wu, J. and Marchant, E. Modelling evacuation in multi-storey
buildings with Simulex. Fire Engineers Journal, 56, 7-11, 1996.
15. Buchanan A H. (ed.). Fire Engineering Design Guide, 2nd Edition, Centre of
Advanced Engineering, University of Canterbury, New Zealand, pp 83-94, 2001.
16. Ko S. Comparison of evacuation times using Simulex and EvacuatioNZ based on
trial evacuations, Masters of Fire Engineering thesis, University of Canterbury,
New Zealand, 2003.
17. Purser D. Data benefits. Fire Engineers Journal & Fire Prevention, pp.21-24,
August 2003.


![PREMISES SECURITY EXPERTS AND ADMISSIBILITY … Article.pdf2010] ADMISSIBILITY OF PREMISES SECURITY EXPERT TESTIMONY 181 devastating impact on the outcome of a case.6 As such, trial](https://img.pdfslide.net/doc/110x75/5f1f79d134e1ff456a053a46/premises-security-experts-and-admissibility-articlepdf-2010-admissibility-of-premises.jpg)