Embed Size (px)
Citation preview
Trial StatisticsIPR, PGR, CBMPatent Trial and Appeal Board May 2018
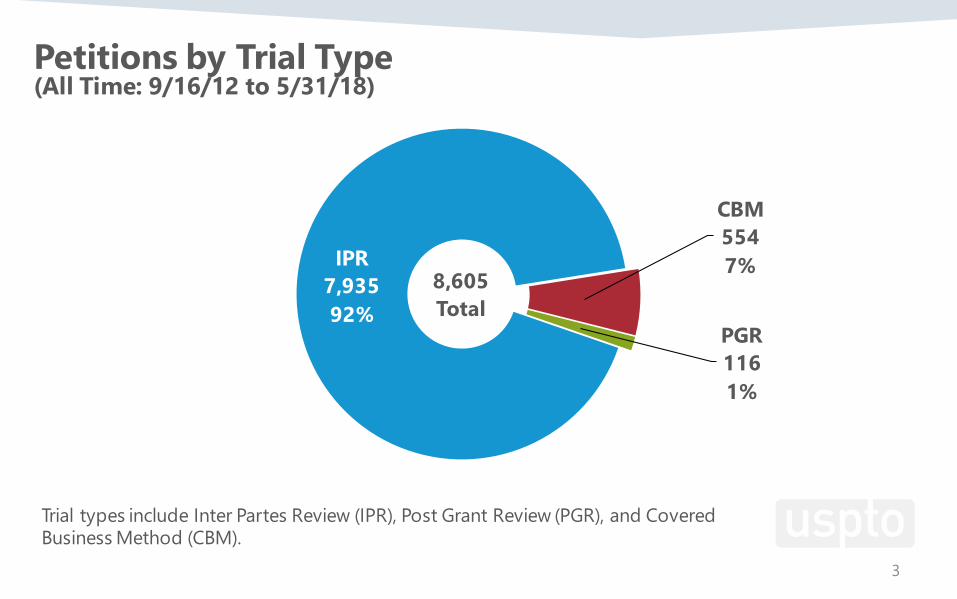
IPR7,93592%
CBM5547%
PGR1161%
8,605Total
3
Petitions by Trial Type (All Time: 9/16/12 to 5/31/18)
Trial types include Inter Partes Review (IPR), Post Grant Review (PGR), and Covered Business Method (CBM).
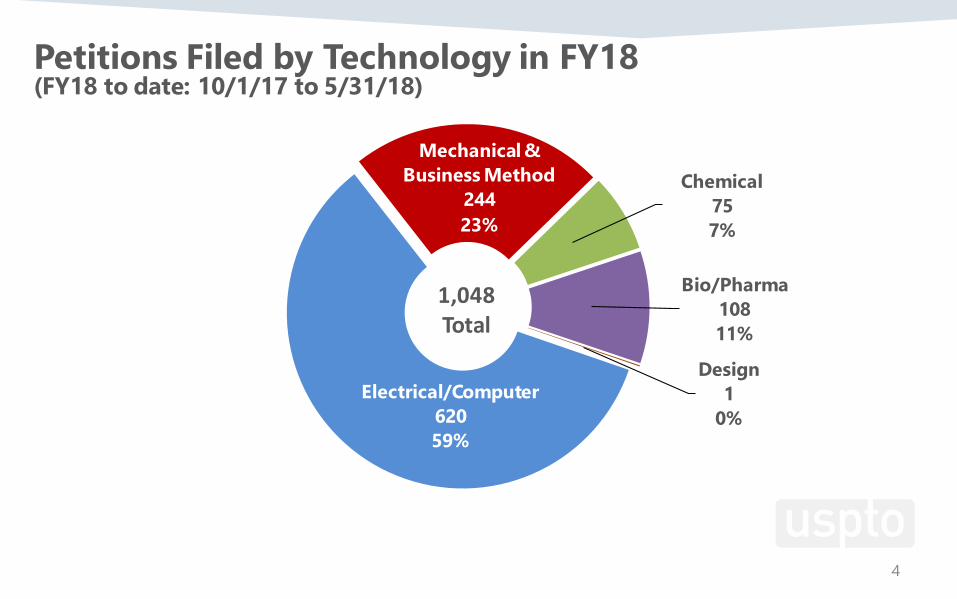
Electrical/Computer62059%
Mechanical & Business Method
24423%
Chemical757%
Bio/Pharma10811%
Design1
0%
1,048Total
4
Petitions Filed by Technology in FY18(FY18 to date: 10/1/17 to 5/31/18)
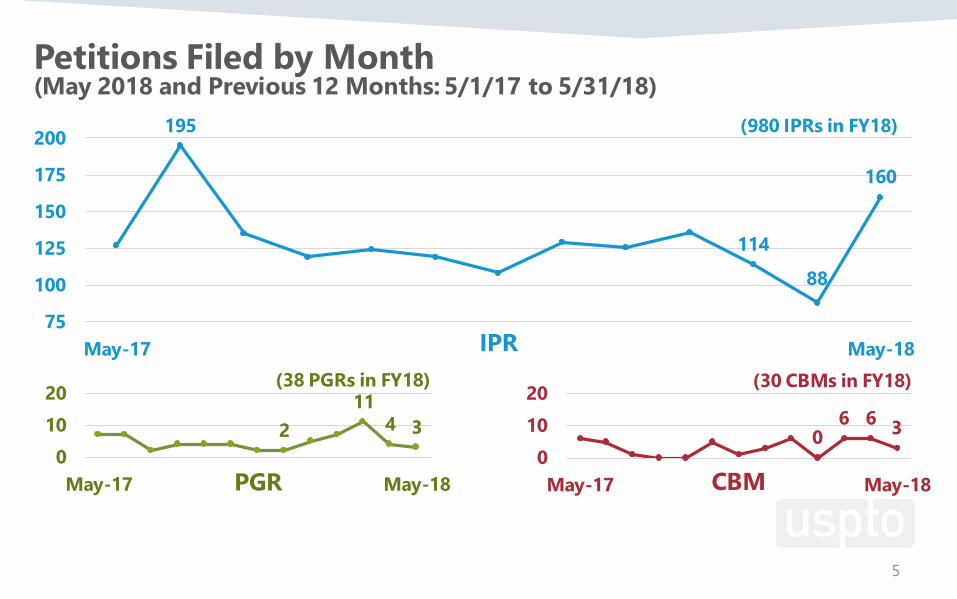
06 6 3
01020
May-17 May-18CBM
(30 CBMs in FY18)
211
4 30
1020
May-17 May-18PGR
(38 PGRs in FY18)
195
114
88
160
75
100
125
150
175
200
May-17 May-18IPR
(980 IPRs in FY18)
5
Petitions Filed by Month (May 2018 and Previous 12 Months: 5/1/17 to 5/31/18)
NTENTE
NTENTE NTE
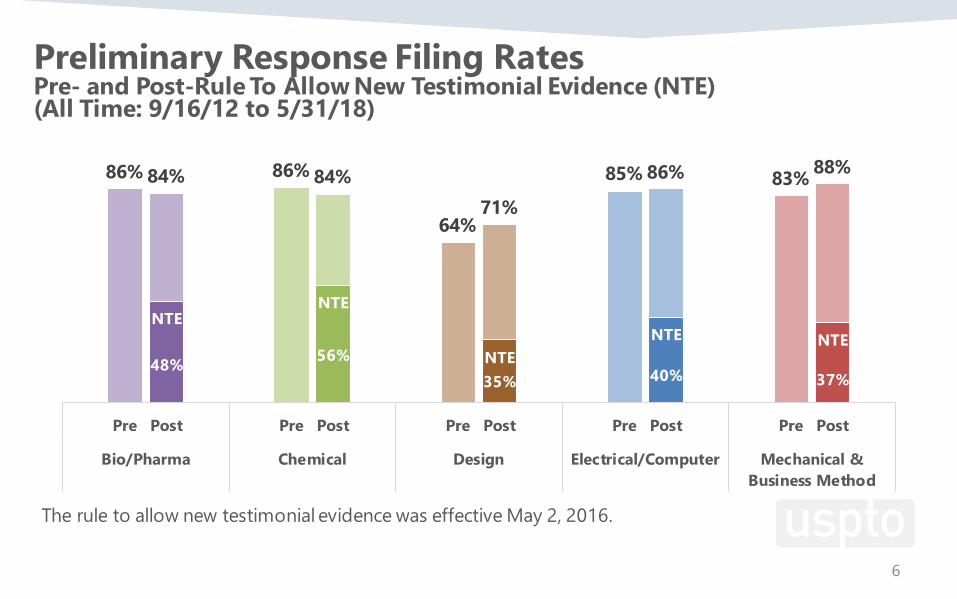
86% 84% 86% 84%
64%71%
85% 86% 83% 88%
48% 56%35% 40% 37%
Pre Post Pre Post Pre Post Pre Post Pre Post
Bio/Pharma Chemical Design Electrical/Computer Mechanical &Business Method
6
Preliminary Response Filing RatesPre- and Post-Rule To Allow New Testimonial Evidence (NTE)(All Time: 9/16/12 to 5/31/18)
The rule to allow new testimonial evidence was effective May 2, 2016.
7
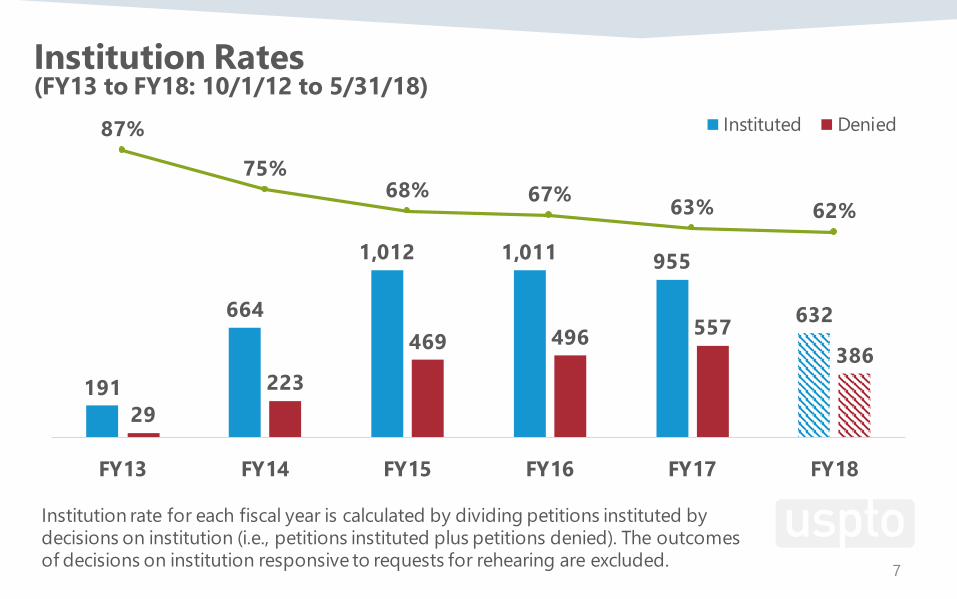
Institution Rates(FY13 to FY18: 10/1/12 to 5/31/18)
Institution rate for each fiscal year is calculated by dividing petitions instituted by decisions on institution (i.e., petitions instituted plus petitions denied). The outcomes of decisions on institution responsive to requests for rehearing are excluded.
191
664
1,012 1,011 955
632
29223
469 496 557386
87%
75%68% 67% 63% 62%
FY13 FY14 FY15 FY16 FY17 FY18
Instituted Denied
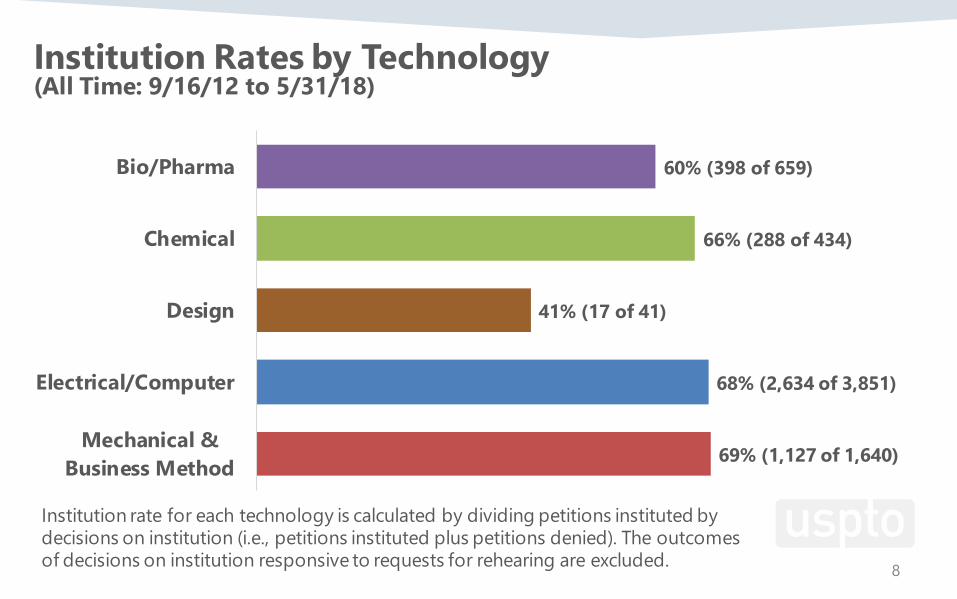
69% (1,127 of 1,640)
68% (2,634 of 3,851)
41% (17 of 41)
66% (288 of 434)
60% (398 of 659)
Mechanical &Business Method
Electrical/Computer
Design
Chemical
Bio/Pharma
8
Institution Rates by Technology(All Time: 9/16/12 to 5/31/18)
Institution rate for each technology is calculated by dividing petitions instituted by decisions on institution (i.e., petitions instituted plus petitions denied). The outcomes of decisions on institution responsive to requests for rehearing are excluded.
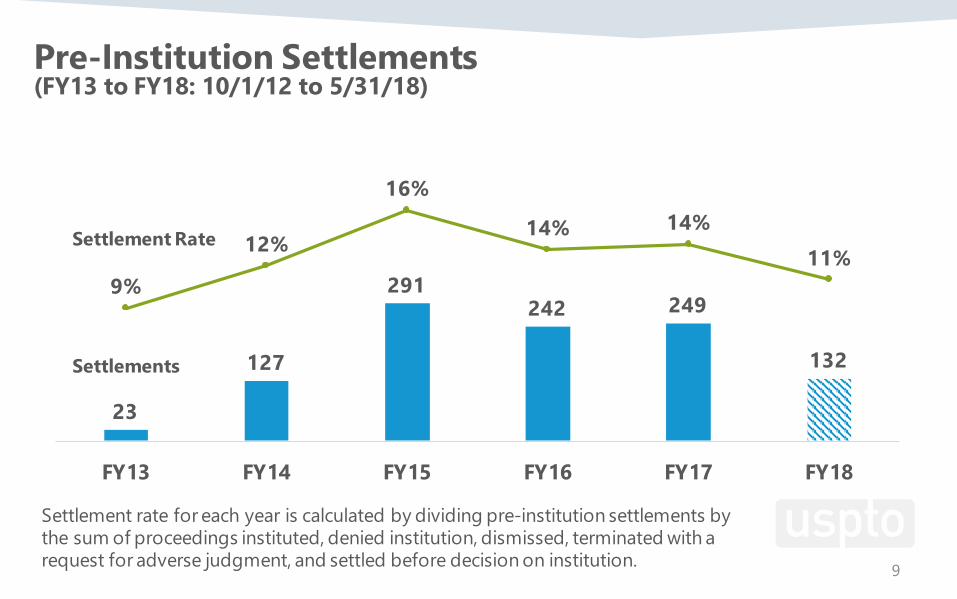
23
127
291242 249
132
9%
12%
16%
14% 14%11%
0%
2%
4%
6%
8%
10%
12%
14%
16%
18%
20%
FY13 FY14 FY15 FY16 FY17 FY18
9
Settlement rate for each year is calculated by dividing pre-institution settlements by the sum of proceedings instituted, denied institution, dismissed, terminated with a request for adverse judgment, and settled before decision on institution.
Settlements
Settlement Rate
Pre-Institution Settlements(FY13 to FY18: 10/1/12 to 5/31/18)
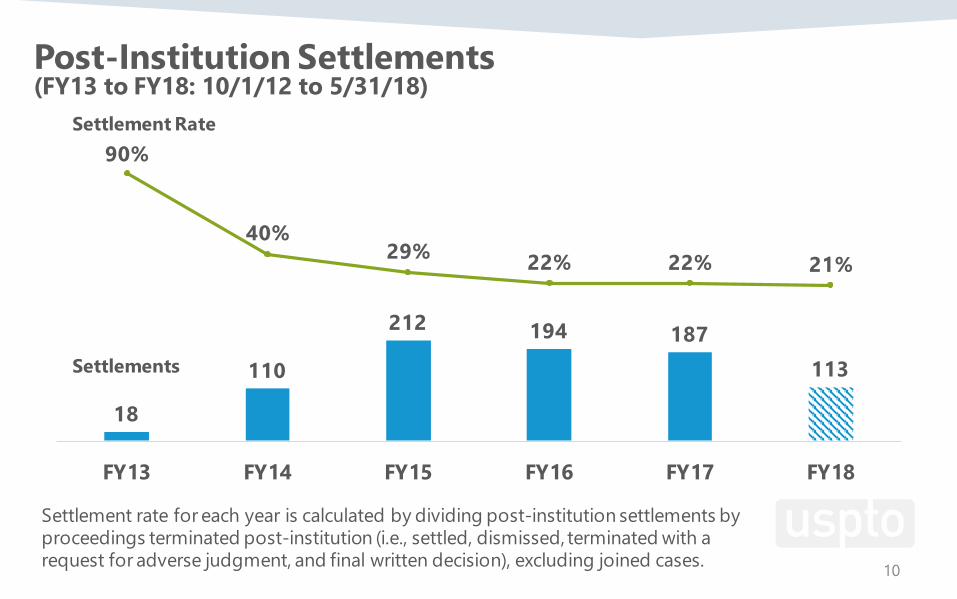
18
110
212 194 187113
90%
40%29% 22% 22% 21%
-75%
-55%
-35%
-15%
5%
25%
45%
65%
85%
FY13 FY14 FY15 FY16 FY17 FY18
10
Settlement rate for each year is calculated by dividing post-institution settlements by proceedings terminated post-institution (i.e., settled, dismissed, terminated with a request for adverse judgment, and final written decision), excluding joined cases.
Settlements
Settlement Rate
Post-Institution Settlements(FY13 to FY18: 10/1/12 to 5/31/18)
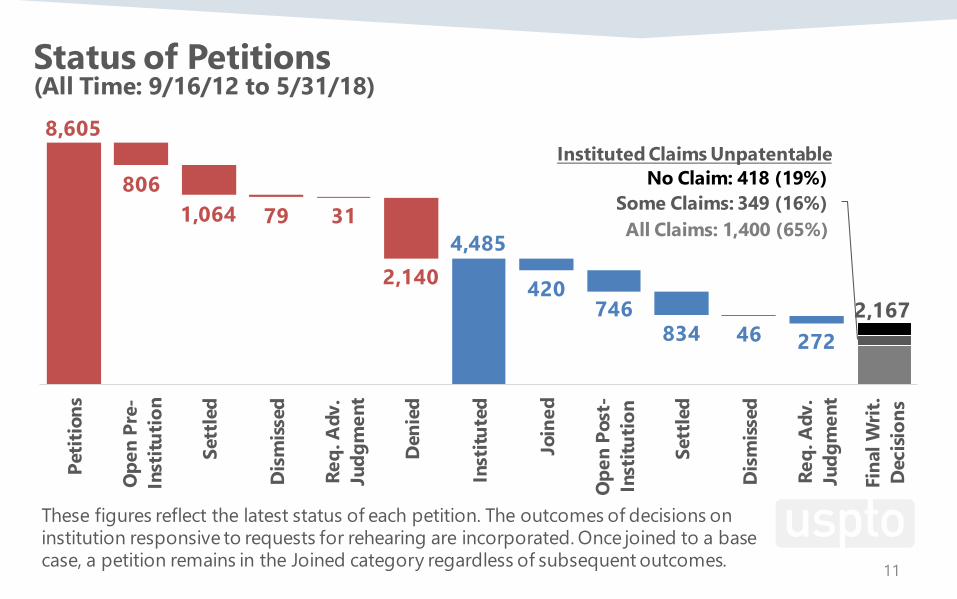
8,605
4,485
2,167
8061,064 79 31
2,140 420746
834 46 272
All Claims: 1,400 (65%)Some Claims: 349 (16%)
No Claim: 418 (19%)
Petit
ions
Ope
n Pr
e-In
stitu
tion
Sett
led
Dis
miss
ed
Req.
Adv
.Ju
dgm
ent
Den
ied
Inst
itute
d
Join
ed
Ope
n Po
st-
Inst
itutio
n
Sett
led
Dis
miss
ed
Req.
Adv
.Ju
dgm
ent
Fina
l Writ
.D
ecisi
ons
Instituted Claims Unpatentable
11
Status of Petitions(All Time: 9/16/12 to 5/31/18)
These figures reflect the latest status of each petition. The outcomes of decisions on institution responsive to requests for rehearing are incorporated. Once joined to a base case, a petition remains in the Joined category regardless of subsequent outcomes.