Embed Size (px)
Citation preview
Control Clin Trials 22:605–619 (2001)© Elsevier Science Inc. 2001 0197-2456/01/$–see front matter655 Avenue of the Americas, New York, NY 10010 PII S0197-2456(01)00180-5
Trials within Trials: Confirmatory Subgroup Analyses in Controlled Clinical Experiments
Lemuel A. Moyé, MD, PhD, and Anita Deswal, MD
University of Texas School of Public Health, Houston, Texas (L.A.M.), and Veterans Administration Medical Center and Baylor College of Medicine, Houston, Texas (A.D.)
ABSTRACT:
Subgroup analyses remain a popular and necessary component of controlled clinicaltrials. However, lack of prospective specification, inadequate sample size, inability tomaintain power, and the cumulative effect of sampling error can complicate their inter-pretation. This article demonstrates that clinical trial design tools that would allow themedical community to draw confirmatory and not just exploratory conclusions from spe-cific subgroup evaluations are available to methodologists. Distinct from the use of a treat-ment by subgroup interaction term, this methodology provides an evaluation of the effectof an intervention within a particular subgroup stratum prospectively declared to be of in-terest to the investigators. The necessary prespecification of stratum-specific type I errorrates, when combined with (1) a stratum-specific event rate in the subgroup, (2) a stratum-specific primary endpoint, (3) a stratum-specific endpoint precision, and/or (4) a stratum-
specific efficacy, satisfies the requirements for a subgroup stratum’s “stand-alone” inter-
pretation at the trial’s conclusion.
Control Clin Trials
2001;22:605–619 © Elsevier Sci-ence Inc. 2001
KEY WORDS:
Subgroups, prospective design, alpha allocation
INTRODUCTION
There may be no better maxim for guiding the interpretation of subgroupanalyses as currently executed in clinical trials than “Look, but don’t touch.”Research investigators are trained to be thorough in their evaluation of the in-tervention’s impact in a controlled clinical trial. This has naturally evolved intothe interpretation of this impact not just in the entire cohort, but in subcohortsas well, searching for heterogeneity of effect. Commonly evaluated subgroupanalyses are the evaluation of the controlled clinical trial’s intervention in pa-tients with certain demographic characteristics (e.g., women) or in patientswith certain biochemical characteristics (e.g., patients with low-density lipo-protein [LDL] cholesterol levels
�
125 mg/dL). Some clinical trials report theseresults both in the article announcing the trial’s overall results [1–4] and sepa-rately [5–7]. Such subgroup analyses can provide leading information about an
Address reprint requests to: Lemuel A. Moyé, MD, PhD, University of Texas School of Public Health,RAS Building E815, 1200 Herman Pressler, Houston, TX 77030 ([email protected]).
Received March 5, 2001; accepted August 3, 2001.
606
L.A. Moyé and A. Deswal
unanticipated benefit or hazard of an intervention being evaluated in the clini-cal trial.
However useful and provocative these results can be, it is well establishedthat subgroup analyses are often misleading [8–11]. Although the medicalcommunity often rejects such findings, attributing their effects to sampling er-ror, it continues to be tantalized by spectacular subgroup findings from clinicaltrials, as seen most recently [12, 13]. Assmann et al. [14] have demonstratedhow commonly subgroup analysis is misused. Articles in both the clinical [15]and methodologic literature point out that accepting subgroup analyses as con-firmatory, independent of the findings of the trial for the entire cohort, is haz-ardous.
One of the complications of subgroup analyses is that these evaluations focuson heterogeneity of the intervention effect among the subgroup strata. Althoughthis is often a correct approach [16, 17], there are nevertheless circumstanceswhere the presence of this heterogeneity is not the question. In these cases, issuelies in demonstrating efficacy within a single subgroup stratum (e.g., patientsrandomized from a particular country in a multinational study, or the effect ofthe intervention in patients whose prognosis is particularly grim).
The purpose of this article is to identify those circumstances in which the es-timation of therapy effect size in a subgroup stratum will be confirmatoryrather than exploratory while adhering to the tenets of Yusuf et al. [18]. The ra-tionale section will provide the justification for the use of prospective devicesto improve the protection of the subgroup’s results from sampling error. Thiswill be followed by the delineation of five strategies to strengthen the identifi-cation of a stratum-specific efficacy.
RATIONALE
We will assume throughout this article that a randomized, controlled clini-cal trial to study an intervention’s effectiveness is the vehicle in which the sub-group will be analyzed. We will also assume that each subgroup stratum inwhich efficacy is to be examined has been announced prospectively and thatthe subgroup is a proper subgroup [18]. We will in addition assume that theprospectively planned clinical trial is executed concordantly (i.e., the experi-ment is executed according to its protocol) [19]. Thus, in this environment, theestimates the trial provides of the effectiveness of the intervention are trust-worthy and need only have appropriately low levels of type I and type II errorto produce a confirmatory evaluation of the intervention’s effect in the sub-group.
We propose and illustrate a detailed evaluation of the design for the sub-group analysis under consideration during the trial’s design phase. This pro-spective specification can go further than (1) the announcement that aparticular subgroup evaluation is to take place at the trial’s end and (2) providethe inclusion/exclusion criteria for the subgroup. In addition to these state-ments, the investigators have the authority to specify (1) type I and type II er-ror levels for the subgroup stratum of interest, (2) control group event rates inthe subgroup stratum (or in the case of continuous outcome, the standard devi-ation of the endpoint measurement), and (3) the level of therapeutic effective-ness (efficacy of the intervention) in the stratum. The evaluation of each of
Confirmatory Subgroup Analyses
607
these quantities is a necessity when designing the trial to consider the effect ofthe intervention in the entire cohort. We advocate their explicit considerationwhen designing a subgroup stratum-specific analysis. Furthermore, the char-acteristics of a subgroup stratum can lead to conclusions about the values ofthese quantities that are different than those conclusions used to design thetrial for the entire cohort. Thus at the initiation of the trial, two confirmatoryplans are deployed. The first is the plan for the evaluation of the effect of ther-apy for the entire cohort of the controlled clinical trial. The second is the confir-matory plan for the evolution of the intervention within the subgroup stratum.Each plan is predicated on its own defensible assumptions for statistical errors,endpoint choice, endpoint event rate, and intervention efficacy.
Strategy 1: Apply Different Type I Error Levels Prospectively
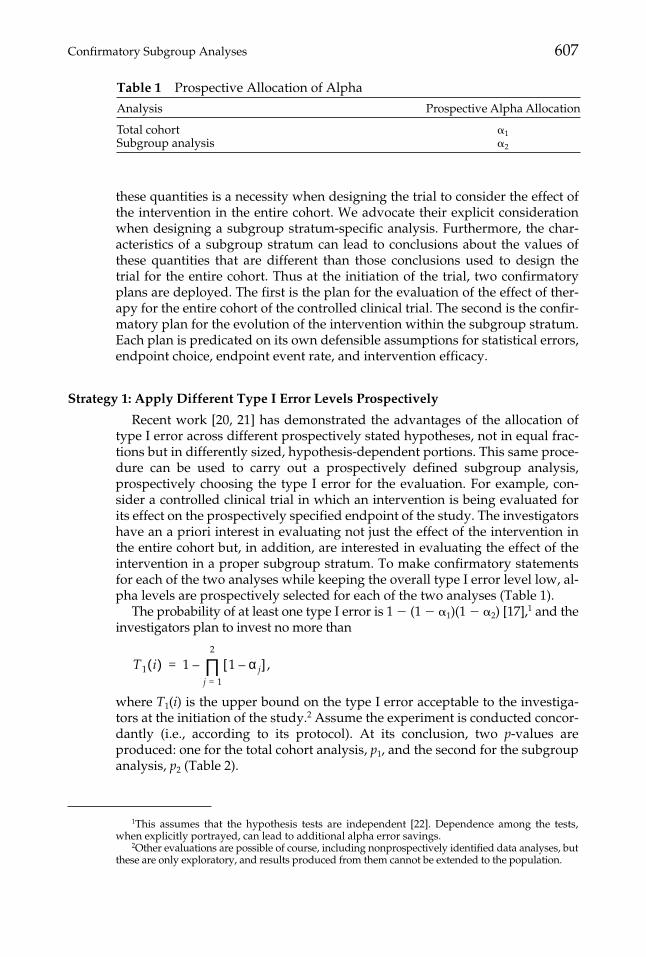
Recent work [20, 21] has demonstrated the advantages of the allocation oftype I error across different prospectively stated hypotheses, not in equal frac-tions but in differently sized, hypothesis-dependent portions. This same proce-dure can be used to carry out a prospectively defined subgroup analysis,prospectively choosing the type I error for the evaluation. For example, con-sider a controlled clinical trial in which an intervention is being evaluated forits effect on the prospectively specified endpoint of the study. The investigatorshave an a priori interest in evaluating not just the effect of the intervention inthe entire cohort but, in addition, are interested in evaluating the effect of theintervention in a proper subgroup stratum. To make confirmatory statementsfor each of the two analyses while keeping the overall type I error level low, al-pha levels are prospectively selected for each of the two analyses (Table 1).
The probability of at least one type I error is 1
�
(1
�
�
1
)(1
�
�
2
) [17],
1
and theinvestigators plan to invest no more than
where
T
1
(
i
) is the upper bound on the type I error acceptable to the investiga-tors at the initiation of the study.
2
Assume the experiment is conducted concor-dantly (i.e., according to its protocol). At its conclusion, two
p
-values areproduced: one for the total cohort analysis,
p
1
, and the second for the subgroupanalysis,
p
2
(Table 2).
T1 i( ) 1 1 α j–[ ]j 1=
2
∏ ,–=
1
This assumes that the hypothesis tests are independent [22]. Dependence among the tests,when explicitly portrayed, can lead to additional alpha error savings.
2
Other evaluations are possible of course, including nonprospectively identified data analyses, butthese are only exploratory, and results produced from them cannot be extended to the population.
Table 1
Prospective Allocation of Alpha
Analysis Prospective Alpha Allocation
Total cohort
�
1
Subgroup analysis
�
2
608
L.A. Moyé and A. Deswal
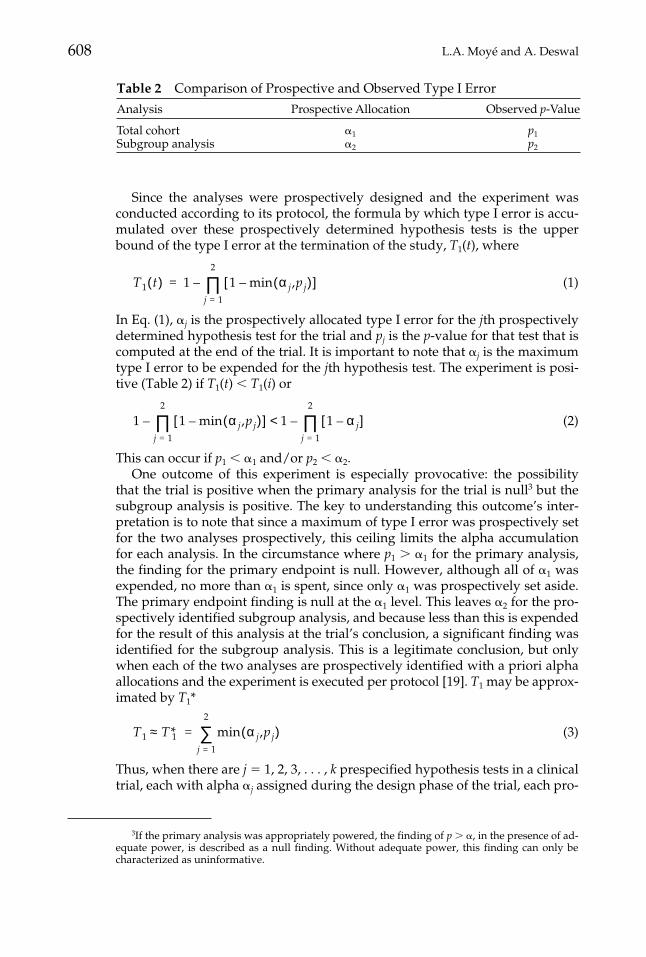
Since the analyses were prospectively designed and the experiment wasconducted according to its protocol, the formula by which type I error is accu-mulated over these prospectively determined hypothesis tests is the upperbound of the type I error at the termination of the study,
T
1
(
t
), where
(1)
In Eq. (1),
�
j
is the prospectively allocated type I error for the
j
th prospectivelydetermined hypothesis test for the trial and
p
j
is the
p
-value for that test that iscomputed at the end of the trial. It is important to note that
�
j
is the maximumtype I error to be expended for the
j
th hypothesis test. The experiment is posi-tive (Table 2) if
T
1
(
t
)
�
T
1
(
i
) or
(2)
This can occur if
p
1
�
�
1
and/or
p
2
�
�
2
.One outcome of this experiment is especially provocative: the possibility
that the trial is positive when the primary analysis for the trial is null
3
but thesubgroup analysis is positive. The key to understanding this outcome’s inter-pretation is to note that since a maximum of type I error was prospectively setfor the two analyses prospectively, this ceiling limits the alpha accumulationfor each analysis. In the circumstance where
p
1
�
�
1
for the primary analysis,the finding for the primary endpoint is null. However, although all of
�
1
wasexpended, no more than
�
1
is spent, since only
�
1
was prospectively set aside.The primary endpoint finding is null at the
�
1
level. This leaves
�
2
for the pro-spectively identified subgroup analysis, and because less than this is expendedfor the result of this analysis at the trial’s conclusion, a significant finding wasidentified for the subgroup analysis. This is a legitimate conclusion, but onlywhen each of the two analyses are prospectively identified with a priori alphaallocations and the experiment is executed per protocol [19].
T
1
may be approx-imated by
T
1
*
(3)
Thus, when there are
j
�
1, 2, 3, . . . ,
k
prespecified hypothesis tests in a clinicaltrial, each with alpha
�
j
assigned during the design phase of the trial, each pro-
T1 t( ) 1 1 min α j,pj( )–[ ]j 1=
2
∏–=
1 1 min α j,pj( )–[ ]j 1=
2
∏– 1 1 α j–[ ]j 1=
2
∏–<
T1 T*1 min α j,pj( )j 1=
2
∑=≈
3If the primary analysis was appropriately powered, the finding of p � �, in the presence of ad-equate power, is described as a null finding. Without adequate power, this finding can only becharacterized as uninformative.
Table 2 Comparison of Prospective and Observed Type I Error
Analysis Prospective Allocation Observed p-Value
Total cohort �1 p1Subgroup analysis �2 p2
Confirmatory Subgroup Analyses 609
ducing pj as the p-value of the test statistic computed at the conclusion of theconcordantly executed trial, then
(4)
and, as a simplifying approximation, a trial is positive when
(5)
While the calculations for the remainder of this article will be based on Eq. (1)and Eq. (2), the approximations contained in Eq. (3), Eq. (4), and Eq. (5) are alsoavailable.
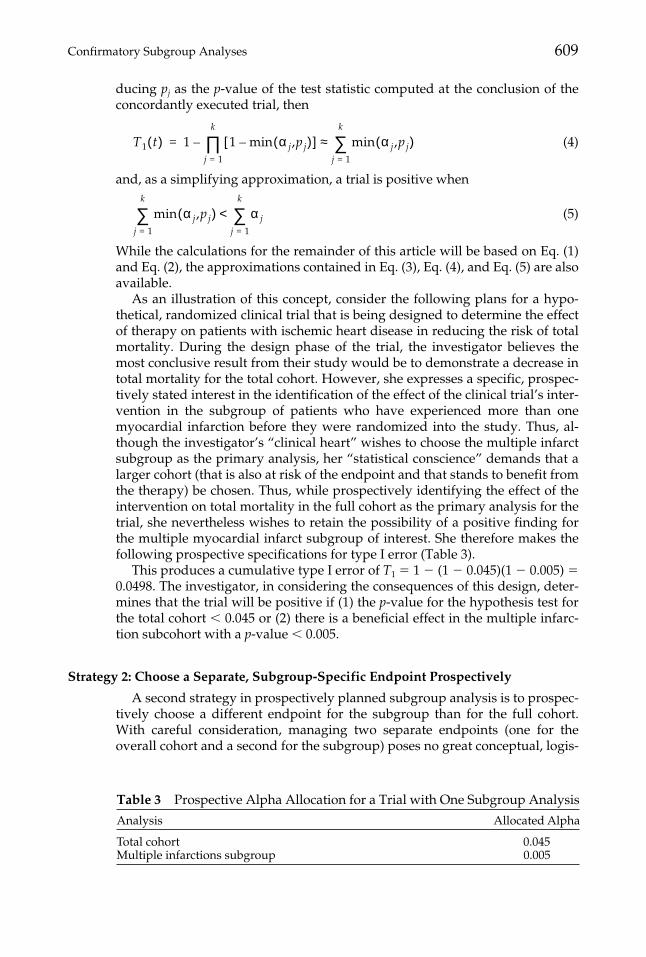
As an illustration of this concept, consider the following plans for a hypo-thetical, randomized clinical trial that is being designed to determine the effectof therapy on patients with ischemic heart disease in reducing the risk of totalmortality. During the design phase of the trial, the investigator believes themost conclusive result from their study would be to demonstrate a decrease intotal mortality for the total cohort. However, she expresses a specific, prospec-tively stated interest in the identification of the effect of the clinical trial’s inter-vention in the subgroup of patients who have experienced more than onemyocardial infarction before they were randomized into the study. Thus, al-though the investigator’s “clinical heart” wishes to choose the multiple infarctsubgroup as the primary analysis, her “statistical conscience” demands that alarger cohort (that is also at risk of the endpoint and that stands to benefit fromthe therapy) be chosen. Thus, while prospectively identifying the effect of theintervention on total mortality in the full cohort as the primary analysis for thetrial, she nevertheless wishes to retain the possibility of a positive finding forthe multiple myocardial infarct subgroup of interest. She therefore makes thefollowing prospective specifications for type I error (Table 3).
This produces a cumulative type I error of T1 � 1 � (1 � 0.045)(1 � 0.005) �0.0498. The investigator, in considering the consequences of this design, deter-mines that the trial will be positive if (1) the p-value for the hypothesis test forthe total cohort � 0.045 or (2) there is a beneficial effect in the multiple infarc-tion subcohort with a p-value � 0.005.
Strategy 2: Choose a Separate, Subgroup-Specific Endpoint Prospectively
A second strategy in prospectively planned subgroup analysis is to prospec-tively choose a different endpoint for the subgroup than for the full cohort.With careful consideration, managing two separate endpoints (one for theoverall cohort and a second for the subgroup) poses no great conceptual, logis-
T1 t( ) 1 1 min α j,pj( )–[ ]j 1=
k
∏– min α j,pj( )j 1=
k
∑≈=
min α j,pj( )j 1=
k
∑ α jj 1=
k
∑<
Table 3 Prospective Alpha Allocation for a Trial with One Subgroup Analysis
Analysis Allocated Alpha
Total cohort 0.045Multiple infarctions subgroup 0.005
610 L.A. Moyé and A. Deswal
tical, or interpretative difficulty in a clinical trial. While it is certainly true thatbecause of the lack of adequate prespecification and planning, the interpreta-tion of multiple endpoints in controlled clinical trials has been immersed inconfusion [12, 13], surprise [23, 24], and contention [25–30], the presence of lu-cid, detailed prospective statements can lead to clear interpretations. For exam-ple, consider a controlled clinical trial whose goal is to assess the effect of arandomly allocated intervention on the occurrence of the primary endpoint, fa-tal coronary heart disease (CHD) death. The investigators have an interest inthe effect of the intervention that is to be the focus of the controlled clinical trialin a particular subgroup. They understand that, as traditionally planned andexecuted, the subgroup analysis carried out at the trial’s conclusion would beexploratory. However, they have an important prospective interest in the find-ings in this subgroup stratum and wish to elevate the subgroup findings fromexploratory to confirmatory.
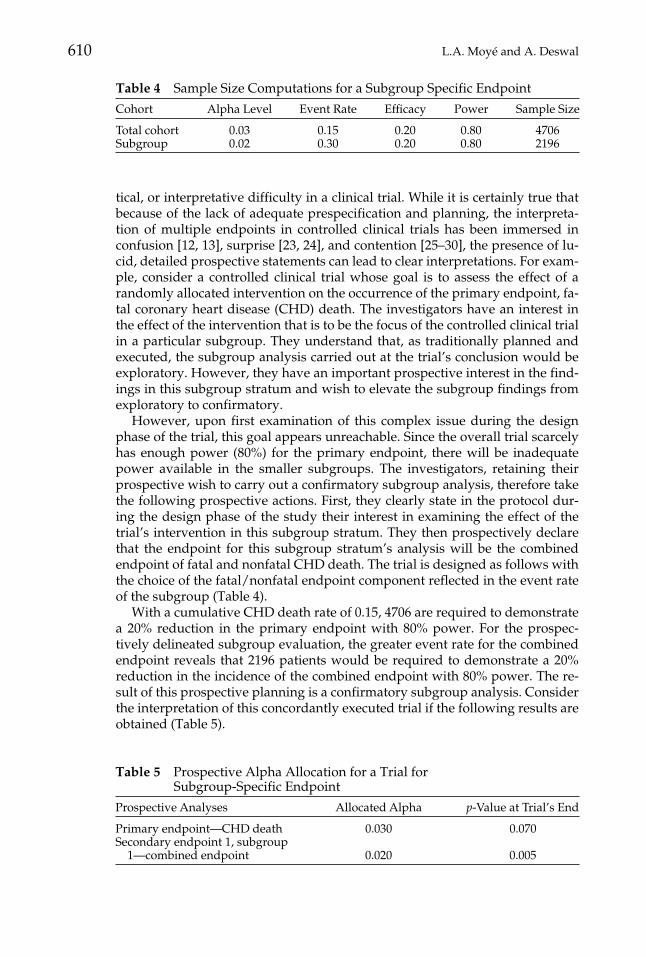
However, upon first examination of this complex issue during the designphase of the trial, this goal appears unreachable. Since the overall trial scarcelyhas enough power (80%) for the primary endpoint, there will be inadequatepower available in the smaller subgroups. The investigators, retaining theirprospective wish to carry out a confirmatory subgroup analysis, therefore takethe following prospective actions. First, they clearly state in the protocol dur-ing the design phase of the study their interest in examining the effect of thetrial’s intervention in this subgroup stratum. They then prospectively declarethat the endpoint for this subgroup stratum’s analysis will be the combinedendpoint of fatal and nonfatal CHD death. The trial is designed as follows withthe choice of the fatal/nonfatal endpoint component reflected in the event rateof the subgroup (Table 4).
With a cumulative CHD death rate of 0.15, 4706 are required to demonstratea 20% reduction in the primary endpoint with 80% power. For the prospec-tively delineated subgroup evaluation, the greater event rate for the combinedendpoint reveals that 2196 patients would be required to demonstrate a 20%reduction in the incidence of the combined endpoint with 80% power. The re-sult of this prospective planning is a confirmatory subgroup analysis. Considerthe interpretation of this concordantly executed trial if the following results areobtained (Table 5).
Table 4 Sample Size Computations for a Subgroup Specific Endpoint
Cohort Alpha Level Event Rate Efficacy Power Sample Size
Total cohort 0.03 0.15 0.20 0.80 4706Subgroup 0.02 0.30 0.20 0.80 2196
Table 5 Prospective Alpha Allocation for a Trial forSubgroup-Specific Endpoint
Prospective Analyses Allocated Alpha p-Value at Trial’s End
Primary endpoint—CHD death 0.030 0.070Secondary endpoint 1, subgroup
1—combined endpoint 0.020 0.005
Confirmatory Subgroup Analyses 611
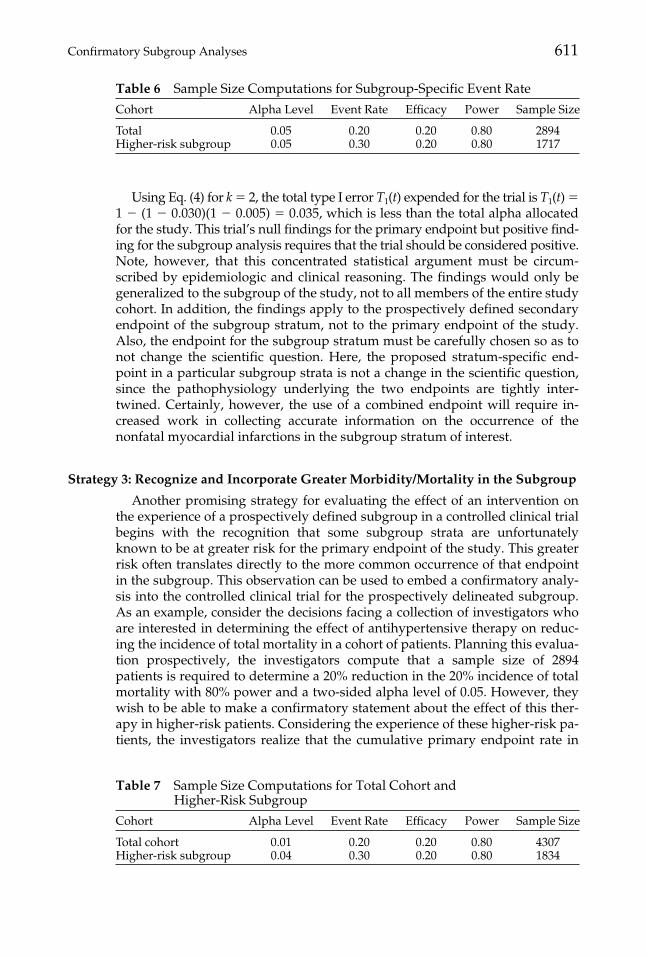
Using Eq. (4) for k � 2, the total type I error T1(t) expended for the trial is T1(t) �1 � (1 � 0.030)(1 � 0.005) � 0.035, which is less than the total alpha allocatedfor the study. This trial’s null findings for the primary endpoint but positive find-ing for the subgroup analysis requires that the trial should be considered positive.Note, however, that this concentrated statistical argument must be circum-scribed by epidemiologic and clinical reasoning. The findings would only begeneralized to the subgroup of the study, not to all members of the entire studycohort. In addition, the findings apply to the prospectively defined secondaryendpoint of the subgroup stratum, not to the primary endpoint of the study.Also, the endpoint for the subgroup stratum must be carefully chosen so as tonot change the scientific question. Here, the proposed stratum-specific end-point in a particular subgroup strata is not a change in the scientific question,since the pathophysiology underlying the two endpoints are tightly inter-twined. Certainly, however, the use of a combined endpoint will require in-creased work in collecting accurate information on the occurrence of thenonfatal myocardial infarctions in the subgroup stratum of interest.
Strategy 3: Recognize and Incorporate Greater Morbidity/Mortality in the Subgroup
Another promising strategy for evaluating the effect of an intervention onthe experience of a prospectively defined subgroup in a controlled clinical trialbegins with the recognition that some subgroup strata are unfortunatelyknown to be at greater risk for the primary endpoint of the study. This greaterrisk often translates directly to the more common occurrence of that endpointin the subgroup. This observation can be used to embed a confirmatory analy-sis into the controlled clinical trial for the prospectively delineated subgroup.As an example, consider the decisions facing a collection of investigators whoare interested in determining the effect of antihypertensive therapy on reduc-ing the incidence of total mortality in a cohort of patients. Planning this evalua-tion prospectively, the investigators compute that a sample size of 2894patients is required to determine a 20% reduction in the 20% incidence of totalmortality with 80% power and a two-sided alpha level of 0.05. However, theywish to be able to make a confirmatory statement about the effect of this ther-apy in higher-risk patients. Considering the experience of these higher-risk pa-tients, the investigators realize that the cumulative primary endpoint rate in
Table 6 Sample Size Computations for Subgroup-Specific Event Rate
Cohort Alpha Level Event Rate Efficacy Power Sample Size
Total 0.05 0.20 0.20 0.80 2894Higher-risk subgroup 0.05 0.30 0.20 0.80 1717
Table 7 Sample Size Computations for Total Cohort andHigher-Risk Subgroup
Cohort Alpha Level Event Rate Efficacy Power Sample Size
Total cohort 0.01 0.20 0.20 0.80 4307Higher-risk subgroup 0.04 0.30 0.20 0.80 1834
612 L.A. Moyé and A. Deswal
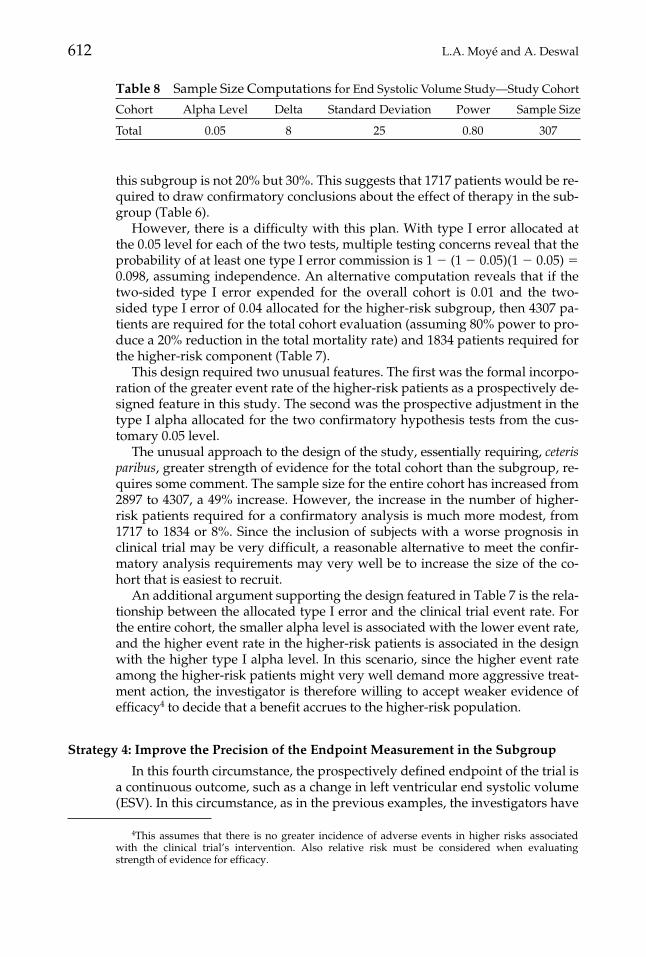
this subgroup is not 20% but 30%. This suggests that 1717 patients would be re-quired to draw confirmatory conclusions about the effect of therapy in the sub-group (Table 6).
However, there is a difficulty with this plan. With type I error allocated atthe 0.05 level for each of the two tests, multiple testing concerns reveal that theprobability of at least one type I error commission is 1 � (1 � 0.05)(1 � 0.05) �0.098, assuming independence. An alternative computation reveals that if thetwo-sided type I error expended for the overall cohort is 0.01 and the two-sided type I error of 0.04 allocated for the higher-risk subgroup, then 4307 pa-tients are required for the total cohort evaluation (assuming 80% power to pro-duce a 20% reduction in the total mortality rate) and 1834 patients required forthe higher-risk component (Table 7).
This design required two unusual features. The first was the formal incorpo-ration of the greater event rate of the higher-risk patients as a prospectively de-signed feature in this study. The second was the prospective adjustment in thetype I alpha allocated for the two confirmatory hypothesis tests from the cus-tomary 0.05 level.
The unusual approach to the design of the study, essentially requiring, ceterisparibus, greater strength of evidence for the total cohort than the subgroup, re-quires some comment. The sample size for the entire cohort has increased from2897 to 4307, a 49% increase. However, the increase in the number of higher-risk patients required for a confirmatory analysis is much more modest, from1717 to 1834 or 8%. Since the inclusion of subjects with a worse prognosis inclinical trial may be very difficult, a reasonable alternative to meet the confir-matory analysis requirements may very well be to increase the size of the co-hort that is easiest to recruit.
An additional argument supporting the design featured in Table 7 is the rela-tionship between the allocated type I error and the clinical trial event rate. Forthe entire cohort, the smaller alpha level is associated with the lower event rate,and the higher event rate in the higher-risk patients is associated in the designwith the higher type I alpha level. In this scenario, since the higher event rateamong the higher-risk patients might very well demand more aggressive treat-ment action, the investigator is therefore willing to accept weaker evidence ofefficacy4 to decide that a benefit accrues to the higher-risk population.
Strategy 4: Improve the Precision of the Endpoint Measurement in the Subgroup
In this fourth circumstance, the prospectively defined endpoint of the trial isa continuous outcome, such as a change in left ventricular end systolic volume(ESV). In this circumstance, as in the previous examples, the investigators have
4This assumes that there is no greater incidence of adverse events in higher risks associatedwith the clinical trial’s intervention. Also relative risk must be considered when evaluatingstrength of evidence for efficacy.
Table 8 Sample Size Computations for End Systolic Volume Study—Study Cohort
Cohort Alpha Level Delta Standard Deviation Power Sample Size
Total 0.05 8 25 0.80 307
Confirmatory Subgroup Analyses 613
a special prospectively stated interest in a proper subgroup stratum. If it is pos-sible to derive greater precision in the evaluation of the continuous outcomemeasure in this subgroup of interest, the investigators will be able to produceacceptable type I and type II level control with a smaller achievable samplesize. Consider the scenario in which the investigators are interested in deter-mining the effect of therapy in reducing the rate of increase in ESV in patientswho are suffering from congestive heart failure. The plan is to measure eachpatient’s ESV at baseline, randomize the patient to receive either active therapyor placebo therapy, and then follow that patient until the end of the trial. At thetrial’s conclusion, ESV will be measured again, and for each patient, the differ-ence �ESV � ESV(final) � ESV(baseline) will be taken. It is expected that the�ESV will be smaller in the patients treated with the intervention than in thecontrol group patients. The investigator has a particular prospectively declaredinterest in demonstrating this effect, not just in the total cohort of patients whohave congestive heart failure, but also in the particular proper subgroup of pa-tients who have had at least two myocardial infarctions before they entered thestudy. The initial plans for the experiment require a sample size of 307 patients(Table 8).
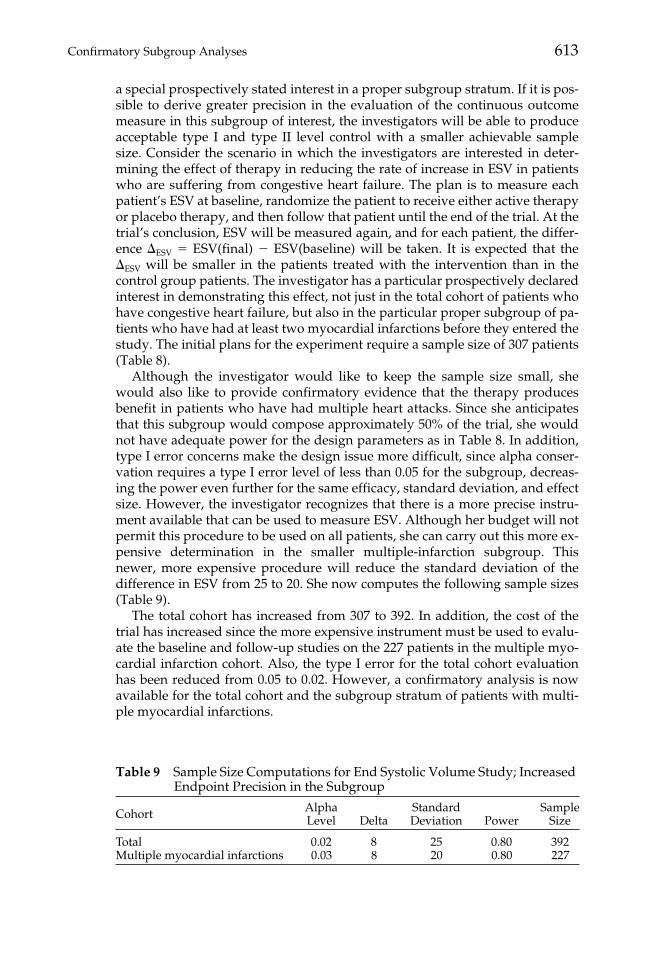
Although the investigator would like to keep the sample size small, shewould also like to provide confirmatory evidence that the therapy producesbenefit in patients who have had multiple heart attacks. Since she anticipatesthat this subgroup would compose approximately 50% of the trial, she wouldnot have adequate power for the design parameters as in Table 8. In addition,type I error concerns make the design issue more difficult, since alpha conser-vation requires a type I error level of less than 0.05 for the subgroup, decreas-ing the power even further for the same efficacy, standard deviation, and effectsize. However, the investigator recognizes that there is a more precise instru-ment available that can be used to measure ESV. Although her budget will notpermit this procedure to be used on all patients, she can carry out this more ex-pensive determination in the smaller multiple-infarction subgroup. Thisnewer, more expensive procedure will reduce the standard deviation of thedifference in ESV from 25 to 20. She now computes the following sample sizes(Table 9).
The total cohort has increased from 307 to 392. In addition, the cost of thetrial has increased since the more expensive instrument must be used to evalu-ate the baseline and follow-up studies on the 227 patients in the multiple myo-cardial infarction cohort. Also, the type I error for the total cohort evaluationhas been reduced from 0.05 to 0.02. However, a confirmatory analysis is nowavailable for the total cohort and the subgroup stratum of patients with multi-ple myocardial infarctions.
Table 9 Sample Size Computations for End Systolic Volume Study; Increased Endpoint Precision in the Subgroup
Cohort AlphaLevel Delta
StandardDeviation Power
SampleSize
Total 0.02 8 25 0.80 392Multiple myocardial infarctions 0.03 8 20 0.80 227
614 L.A. Moyé and A. Deswal
Strategy 5: Choose and Justify a Different Minimum Efficacy for the Subgroup
This final scenario evaluates the consequences of the prospective clinicaltrial design that assumes that the intervention’s effectiveness in the subgroupis different from that in the total cohort. The detectable efficacy of a compoundin a controlled clinical trial should be the minimal effectiveness of the interven-tion that is believed by the medical community to be clinically important, mak-ing the determination of intervention effectiveness a clinical as well as astatistical issue. It is logical to integrate the level of adverse events associatedwith this intervention into the efficacy determination. Essentially, the clinicalquestion confronting the investigators as they consider efficacy levels is: Whatminimum benefit must the intervention produce that, when balanced againstthe risk of therapy, demonstrates the positive worth of the intervention? If asubgroup can be unfortunately anticipated to have a greater frequency of ad-verse events, the efficacy should be greater to offset this increased risk andthereby produce a favorable risk-benefit assessment for the intervention.
Consider a clinical trial in which the investigators are interested in demon-strating a 20% reduction in a clinical endpoint whose cumulative incidenceover the course of the trial is estimated to be 15% in the control group. If thetrial is to be powered at 80%, then 4072 patients are required for the study for atwo-sided type I error level of 0.05 (Table 10).
If this cohort has a subgroup (e.g., the elderly) that has a greater frequencyof adverse events reasonably believed to be associated with the intervention, ajustification for the use of this drug would be the demonstration of greater effi-cacy in this elderly subgroup. If the investigators required 30% efficacy fromthis subgroup that is more likely to experience adverse events, the calculated,minimum sample size for the subgroup would be 2203 (Table 11).
In this prospective plan, the required sample size of the total cohort has in-creased from 4072 to 4706, an increase driven exclusively by the reduction intype I error for the total cohort evaluation from 0.05 to 0.03. This decrease intype I error was required to ensure that there is adequate alpha conservationwhen the confirmatory hypotheses are executed at the trial’s conclusion. Usinga type I error level of 0.02 for the prospectively defined subgroup analysis re-veals that requiring an efficacy of 30% requires 2203 patients for this subgroup.With a subgroup of this size, the two clinical hypotheses to be carried out at theconclusion of the study would be confirmatory.
Table 10 Sample Size Computations for the Total Cohort
Cohort Alpha Level Event Rate Efficacy Power Sample Size
Total 0.05 0.15 0.20 0.80 4072
Table 11 Sample Size Computations for Clinical Trial with Different Efficacy Levels within the Subgroup of Elderly Patients and Alpha Levelof 0.02
Cohort Alpha Level Event Rate Efficacy Power Sample Size
Total 0.03 0.15 0.20 0.80 4706Elderly 0.02 0.15 0.30 0.80 2203
Confirmatory Subgroup Analyses 615
DISCUSSION
Subgroup analyses is hazardous ground in clinical trial interpretations forwell-understood reasons. Retrospectively considered, sometimes only casuallyplanned, their conclusions, while descriptive of the findings in the sample, of-ten times do not reveal the truth about the relationship in the larger popula-tion. The recent discussions in the literature concerning the wide variation inresults by clinical center in the BHAT trial [31–33] is an illustration of the diffi-culty in interpreting these examinations. Currently, the findings of the PRAISE1 study [12] that suggested that the subgroup of patients with congestive heartfailure of a nonischemic etiology would benefit from amlodipine were not con-firmed by a second study specifically designed to illustrate this same beneficialeffect [13]. These examples demonstrate the propriety of sharply circumscrib-ing subgroup interpretation. Indeed, current literature [11, 16–18, 20, 34, 35]recommends that, as currently incorporated in clinical trials, subgroup analy-ses interpretations are exploratory; they can suggest, but not confirm, a rela-tionship in the population at large.
However, there are circumstances in which subgroup evaluations can pro-duce confirmatory results that will stand on their own, separate from those ofthe overall cohort. These criteria, characterized by Yusuf et al. [18], are that thesubgroups be prospectively specified, proper, and important consideration begiven to type I and type II error. Unfortunately the appearance of these criteriahave not led to a plethora of well-designed, prospective subgroup analyseswith confirmatory evaluations at the study’s end. This is in all likelihood dueto the fact that, as currently designed, subgroup evaluations cannot meet thesecriteria for confirmatory evaluations, primarily, the requirement for type I/IIerror control. Thus, the growth of the use of subgroups as confirmatory toolshas to some extent been stunted by the recognition that, as currently executed,one cannot reasonably construct a prospective clinical trial with an embedded,prospectively defined proper subgroup for which tight statistical control isprovided for type I and type II statistical errors.
Oftentimes, subgroup analyses mean an assessment of an explicit term in astatistical model that directly measures the effect of treatment by subgroup in-teraction. However, not every useful subgroup evaluation need be based on aninteraction effect that evaluates the heterogeneity of the effect of the interactionacross subgroup strata. The methodology suggested herein is not a strategythat would supplant the interaction examination; we suggest a methodologicanswer to a different question: Is there an explicit effect of the intervention inthe prospectively defined subgroup stratum of interest?
An important component of the strategies recommended in this article is theselective levels of type I error. There is nothing but tradition that binds clinicaltrial methodologists to the 0.05 level of statistical significance. Recent work [21]has demonstrated the advantages of the allocation of type I error across hy-pothesis testing in clinical trials, in which the type I error is allocated not inequal components but in different sizes depending on the risks the investiga-tors are willing to run to mistakenly conclude that there is an effect in the pop-ulation based on the sample findings when there is no such effect in thepopulation. However, this work has been predicated on the notion of indepen-dence of the executed hypothesis tests. The notion of dependent type I errors isa critical one. Gray [36] has explored this issue involving right-censored end-
616 L.A. Moyé and A. Deswal
point data. Our preliminary examination of this problem when there are twohypothesis tests has revealed that considerable savings in type I error can ac-crue when dependence between the hypothesis tests is taken into account. Fur-ther research is needed in this area. In addition, the weighted average of Senn[37], which focuses not on hypothesis testing as we do here but on estimation ofeffect size and several Bayesian approaches [38–40], has also been considered.
This article provides no casual solution to the subgroup analysis issue inclinical trials. The illustrations provided here do not vitiate the need for adisciplined approach to confirmatory subgroup analysis; they amplify it. Theplanned subgroup evaluations must be considered very carefully. There mustbe a biologically plausible rationale that leads the investigators to focus on theresponse of the subgroup to the clinical trial’s intervention. The investigatorsmust give careful consideration of the initial type I error allocations, and the in-vestigators must think through the possible implications of the trial’s possiblefindings. As demonstrated in the illustrations of this article, the size of the sub-group is commonly on the order of 40–60% of the total cohort sample size forthe confirmatory analyses to be executed successfully. In some cases, the size ofthe overall trial must be adjusted. These procedures certainly cannot be carriedout for every subgroup of interest in the study. After careful study, one or per-haps two subgroups can have confirmatory analyses prospectively embeddedin the trial. The remaining subgroup analyses can be traditionally executed andinterpreted in an exploratory light. Also, interpretation of trial results mustjointly consider the quality of prospective planning, the manner of trial execu-tion (concordant or discordant), effect size with its standard error, confidenceintervals, and p-values. The focus of this article is on the p-value component,but this focus does not detract from the primacy of the joint interpretation.
In addition, many subgroups may be misinterpreted because subgroupmembership may merely be a surrogate for the true risk-determining or effi-cacy-determining characteristic. The investigator must consider this possible ex-planation for her subgroup-specific effect in her interpretation of the analysis.
In the planning stages of a clinical trial, the strategies outlined in this articlecan be combined. The investigators have the freedom, indeed they have themandate, to choose the appropriate combinations of these strategies prospec-tively. For example, it is possible to simultaneously take advantage of an ac-knowledged greater event rate in the subgroup of interest and implement theuse of a second combined endpoint, while simultaneously giving careful con-sideration to alternative alpha allocations, when designing the study. Wheneach of these strategies is acknowledged and built into the study prospectively,followed by the experiment’s concordant execution, a confirmatory subgroupevaluation is produced at the trial’s conclusion. In fact, this effort will producea prospectively designed “trial within a trial,” with the subtrial having its owninclusion and exclusion criteria (subgroup definitions), prospective endpoint,and type I/type II error specification. Only the stratification of the therapy allo-cation within the subgroup is missing to complete the “trial within a trial” con-struction and is easily supplied.
A positive subgroup evaluation when the overall trial result is null and thetreatment by subgroup interaction is negative is an unusual argument in thestandard clinical trial paradigm. However, that paradigm has been altered inthis article, changing the interpretation of this result. The prospective identifi-
Confirmatory Subgroup Analyses 617
cation of the subgroup of interest in concert with the apportionment of type Ierror between the overall cohort and this subgroup renders the positive sub-group evaluation interpretation appropriate because it is a prospective designthat preserves type I error. In this prospective subgroup-designed clinical trial,the interaction analysis (notoriously underpowered in many major clinical tri-als) would not be executed because there is no interest in subgroup heteroge-neity. One can focus on the subgroup finding with the significant result whenthe significance level was prospectively determined, the trial was concordantlyexecuted, and type I error was conserved.
There are several questions that can be asked of subgroups. One is whetherthe response to the intervention differs by subgroup, a question best addressedusing a treatment by subgroup interaction analysis. The methodology we pro-pose addresses a different question: Is there an explicit effect of the interven-tion in the prospectively defined subgroup stratum of interest? Both arerelevant questions, and investigators should choose carefully which of thesequestions is the most important to address in their scientific inquiry.
Dr. Deswal’s effort was supported by V.A. Cooperative Studies Program Clinical Research CareerDevelopment Award (CRCD #712B).
REFERENCES1. Pfeffer MA, Braunwald E, Moyé LA, et al. Effect of captopril on mortality and morbid-
ity in patients with left ventricular dysfunction after myocardial infarction—Results ofthe Survival and Ventricular Enlargement Trial. N Eng J Med 1992;327:669–677.
2. Sacks FM, Pfeffer MA, Moyé LA, et al. The effect of pravastatin on coronary eventsafter myocardial infarction in patients with average cholesterol levels. N Engl J Med1996;335:1001–1009.
3. The SHEP Cooperative Research Group. Prevention of stroke by antihyperten-sive drug therapy in older persons with isolated systolic hypertension: Final re-sults of the Systolic Hypertension in the Elderly Program (SHEP). JAMA 1999;265:3255–3264.
4. The Long-Term Intervention with Pravastatin in Ischaemic Disease (LIPID) StudyGroup. Prevention of cardiovascular events and death with pravastatin in patientswith coronary heart disease and a broad range of initial cholesterol levels. N Engl JMed 1998;339:1349–1357.
5. Moyé LA, Pfeffer MA, Wun CC, et al. Uniformity of captopril benefit in the post in-farction population: Subgroup analysis in SAVE. Eur Heart J 1994;15(Suppl B):2–8.
6. Lewis SJ, Moyé LA, Sacks FM, et al. Effect of pravastatin on cardiovascular events inolder patients with myocardial infarction and cholesterol levels in the averagerange. Results of the Cholesterol and Recurrent Events (CARE) trial. Ann Intern Med1998;129:681–689.
7. Lewis SJ, Sacks FM, Mitchell JS, et al. Effect of pravastatin on cardiovascular eventsin women after myocardial infarction: The cholesterol and recurrent events (CARE)trial. J Am Coll Cardiol 1998;32:140–146.
8. Peto R, Collins R, Gray R. Large-scale randomized evidence: Large, simple trialsand overviews of trials. J Clin Epidemiol 1995;48:23–40.
9. MRFIT Research Group. Multiple Risk Factor Intervention Trial: Risk factor changesand mortality. JAMA 1982;248:1465–1477.
10. ISIS-I Collaborative Group. Randomized trial of intravenous atenolol among 16027cases of suspected acute myocardial infarction-ISIS-1. Lancet 1986;2:57–66.
618 L.A. Moyé and A. Deswal
11. Lee KL, McNeer F, Starmer CF, Harris PJ, Rosari RA. Clinical judgment and statis-tics. Lessons from a simulated randomized trial in coronary artery disease. Circula-tion 1980:61;508–515.
12. Packer M, O’Connor CM, Ghali JK, et al. for the Prospective Randomized Amlo-dipine Survival Evaluation Study Group. Effect of amlodipine on morbidity andmortality in severe chronic heart failure. N Engl J Med 1996;335:1107–1114.
13. Packer M. Results of the Prospective Randomized Amlodipine Survival Evalua-tion-2 Trial (PRAISE-2), presentation at the American College of Cardiology Scien-tific Sessions, Anaheim, California, March 15, 2000.
14. Assmann S, Pocock S, Enos L, Kasten L. Subgroup analysis and other (mis)uses ofbaseline data in clinical trials. Lancet 2000;355:1064–1069.
15. Bulpitt C. Subgroup analysis. Lancet 1988;2:31–34.16. Simon R. Patient subsets and variation in therapeutic efficacy. Br J Clin Pharmacol
1982;14:473–482.17. Pocock SJ. Clinical Trials: A Practical Approach. Chichester: John Wiley & Sons;
1983:213–215.18. Yusuf S., Wittes J, Probstfield J, Tyroler HA. Analysis and interpretation of treat-
ment effects in subgroups of patients in randomized clinical trials. JAMA1991;266:93–98.
19. Moyé LA. P-value interpretation and alpha allocation in clinical trials. Ann Epide-miol 1998;8:351–357.
20. Moyé LA. Statistical Reasoning in Medicine. The Intuitive P Value Primer. New York:Springer-Verlag; 2000.
21. Moyé LA. Alpha calculus in clinical trials: Considerations and commentary for thenew millennium. Stat Med 2000;19:767–779.
22. Snedecor GW, Cochran WG. Statistical Methods. 7th ed. Ames, Iowa: Iowa State Uni-versity Press; 1980.
23. Pitt B, Segal R, Martinez FA, et al. on behalf of the ELITE Study Investigators. Ran-domized trial of losartan versus captopril in patients over 65 with heart failure. Lan-cet 1997;349:747–752.
24. Pitt B, Poole-Wilson PA, Segal R, et al. Effect of losartan compared with captopril onmortality in patients with symptomatic heart failure: Randomized trial—The losar-tan heart failure survival study ELITE II. Lancet 2000;355:1582–1587.
25. Packer M, Bristow MR, Cohn JN, et al. The effect of carvedilol on morbidity andmortality in patients with chronic heart failure. N Engl J Med 1996;334:1349–1355.
26. Moyé LA, Abernethy D. Carvedilol in patients with chronic heart failure (Letter). NEngl J Med 1996;335:1318–1319.
27. Packer M, Cohn JN, Colucci WS. Response to Moyé and Abernethy. N Engl J Med1996;335:1318–1319.
28. Fisher LD, Moyé LA. Carvedilol and the Food and Drug Administration approvalprocess: An introduction. Control Clin Trials 1999;20:1–15.
29. Fisher L. Carvedilol and the FDA approval process: The FDA paradigm and reflec-tions upon hypotheses testing. Control Clin Trials 1996;20:16–39.
30. Moyé LA. P-value interpretation in clinical trials. The case for discipline. ControlClin Trials 1999;20:40–49.
31. Horwitz RI, Singer B, Makuch RW, Viscoli CM. Can treatment that is helpful on av-erage be harmful to some patients? A study of the conflicting information needs ofclinical inquiry and drug regulation. J Clin Epidemiol 1996;49:395–400.
32. Altman DG. Within trial variation—A false trial? J Clin Epidemiol 1998;51:301–303.33. Feinstein AR. The problem of cogent subgroups: A clinicostatistical tragedy. J Clin
Epidemiol 1998;51:297–299.34. Friedman L, Furberg C, DeMets D. Fundamentals of Clinical Trials. 3rd ed. New York:
Springer; 1996.

Confirmatory Subgroup Analyses 619
35. Meinert CL. Clinical Trials Design, Conduct, and Analysis. New York: Oxford Univer-sity Press; 1986.
36. Gray R. A simultaneous inference procedure for clinical trials. Communications inStatistics 1987;16:499–510.
37. Senn S. Statistical issues in drug development. Chichester: John Wiley & Sons;1997:132–136.
38. Davis CE, Leffingwell D. Empirical Bayes estimates of subgroup effects in clinicaltrials. Control Clin Trials 1990;11:37–42.
39. Donner A. A Bayesian approach for the interpretation of subgroup results in clinicaltrials. J Chronic Dis 1982;34:429–435.
40. Louis TA. Estimating a population of parameter values using Bayes and empiricalBayes methods. J Am Stat Assoc 1984;79:393–398.


![Perspective on adaptive designs: 4 years European ......Reflection Paper on ‘Methodological issues in confirmatory clinical trials with flex-ible design and analysis plan’ [1]](https://img.pdfslide.net/doc/110x75/5f50cb92b6a6816030233eb0/perspective-on-adaptive-designs-4-years-european-reflection-paper-on-amethodological.jpg)