Embed Size (px)
Citation preview

3449
Proceedings of the XVI ECSMGEGeotechnical Engineering for Infrastructure and DevelopmentISBN 978-0-7277-6067-8
© The authors and ICE Publishing: All rights reserved, 2015doi:10.1680/ecsmge.60678
a) the increase of the Mohr-Coulomb peak shear strength of treated samples over the correspond-ing of the untreated samples, occurs mainly as an increase of the cohesion intercept.
b) the undrained monotonic shear strength of the treated samples is significantly larger than the corresponding of untreated samples at compara-ble strains. It also increases with increasing effec-tive stress up to 300kPa.
c) for the materials tested at the studied density range, treated sands possess approximately dou-ble the liquefaction resistance of untreated sands, under σ΄0 = 100kPa.
d) the treated samples exhibit increased deformation resistance to cyclic loading, as compared to the untreated samples which experience much larger εDA in fewer cycles.
e) post-cycling undrained monotonic shear strength of treated samples is not affected by the accumu-lated strains (at least εDA ≈ 5%) during the preced-ing cyclic loading, indicating that no deterioration of sand improvement occurs during cyclic load-ing.
ACKNOWLEDGEMENT
This research has been co-financed by the European Union (European Social Fund – ESF) and Greek na-tional funds through the Operational Program "Edu-cation and Lifelong Learning" of the National Strate-gic Reference Framework (NSRF) - Research Funding Program: Thales. Investing in knowledge society through the European Social Fund.
REFERENCES
Díaz-Rodriguez, J.A. Antonio-Izarraras, V.M. Bandini, P. & López-Molina, J.A. 2008. Cyclic strength of a natural liquefiable sand stabilized with colloidal silica grout, Can. Geotech. Journal 45, 1345–1355. Gallagher, P.M. 2000. Passive site remediation for mitigation of liquefaction risk, Ph.D. Virginia Polytechnic Institute and State University, Blacksbourgh, Virginia. Gallagher, P. M. & Mitchell, J. K. 2002. Influence of colloidal sil-ica grout on liquefaction potential and cyclic undrained behavior of loose sand, Soil Dynamics and Earthquake Eng., 22, 1017-1026. Iler, R. K. 1979. The chemistry of silica: solubility, polymerization, colloid and surface properties and biochemistry, John Wiley & Sons, New York, NY. Kabashima, Y. & Towhata, I. 2000. Improvement of dynamic strength of sand by means of infiltration grouting. Ground Im-provement Techniques, Proceedings, 3rd Int. Conf. (Ed.: Pinto, M.), 203-208. Singapore. Ladd, R. S. 1978. Preparing test specimens using undercompac-tion, Geotech. Test. J., 1, (1), 16-23. Mollamahmutoglu, M. & Yilmaz, Y. 2010. Pre- and post-cyclic loading strength of silica grouted sand, Geot. Engineering, 163 (GE6), 343-348. Papadopoulou, Α.Ι. 2008. Monotonic and cyclic behaviour of liq-uefiable soils, Ph.D., Aristotle University of Thessaloniki, Thessa-loniki, Greece. Silco International 2005. Colloidal silica technical information. Vranna, A.D. 2014. Monotonic and cyclic behaviour of liquefiable soils, Ph.D., Aristotle University of Thessaloniki, Thessaloniki, Greece (in progress).
Triaxial compression tests on a crushable sand in dry and wet conditions
Essais triaxiaux sur un sable écrasable en conditions sèches et humides
L. Wils*1, W. Haegeman1 and P.O. Van Impe1
1 Ghent University, Ghent, Belgium * Corresponding Author
ABSTRACT A calcareous sand from the Persian Gulf is subjected to a series of dry and fully drained saturated triaxial shear tests. Thesamples are prepared at relative densities of 65% and either left dry or saturated. They are consolidated to confining pressures ranging from 50 to 750 kPa, and sheared until shear strains of 20%. It is shown that the stress-strain and strength characteristics of crushable sand are significantly affected by the presence of water. During shearing of wet samples, there is less dilation, the peak is postponed and a lower shear strength is reached compared to dry samples. Crushability is assessed by comparing the granulometry before and after the triaxial tests. While both dry and wet samples show breakage, the wet sand is consistently more crushable. It is stated that the higher crushability of the wet sand suppresses its dilation during shearing.
RÉSUMÉ Un sable calcaire du Golfe Persique est soumis à une série d’essais triaxiaux secs et consolidés-drainés. Les échantillons sont préparés à des densités relatives de 65% et soit laissés à sec soit saturé. Ils sont consolidés à des pressions de confinement allant de 50 à 750 kPa, et cisaillées jusqu'à contraintes de cisaillement de 20%. Il est montré que les caractéristiques de contrainte-déformation et la résis-tance au cisaillement du sable écrasable sont sensiblement affectés par la présence de l'eau. Pendant le cisaillage des échantillons saturés, il y a moins de dilatation, le résistance de pic est reportée et une résistance au cisaillement inférieure est atteinte par rapport aux échantillons secs. Aptitude à l'écrasement est évaluée en comparant la granulométrie avant et après les essais triaxiaux. Alors que les échantillons secs et saturés montrent également de la rupture, le sable saturé est toujours plus déformable. Il est précisé que l'aptitude à l'écrasement plus élevée de sable humide supprime la dilatation au cours de son cisaillement.
1 INTRODUCTION
In the recent decades the Gulf States have become a hub for major land reclamation projects intended for petrochemical structures, housing and leisure. New land is usually created with sand reclaimed offshore, in the warm semi-enclosed Persian Gulf. This sand consists mainly of shells, which are in fact angular, calcareous grains. The crushable nature of this sand is responsible for its specific geotechnical behaviour.
The interpretation of cone penetration resistance of crushable sand in terms of relative density is one area of increased complexity. This correlation can be established empirically in the controlled laboratory environment of calibration chambers (Jamiolkowski
et al. 2003) and for silica sediments it can be cap-tured with traditional bearing capacity theories in terms of shear angle. In calcareous sands however, the bearing capacity is lower than what is estimated from classical bearing capacity equations (Huang et al. 1999), which infer from the high friction angle of these sands a dilatant response whereas in reality it is contractant.
Indeed, crushing occurs during cone penetration, thereby progressively changing the density, the sand fabric and granulometry. The ultimate bearing re-sistance in calcareous sands then depends on their in-stantaneous state, friction angle as well as compress-ibility (Semple 1988). Reasonable correlations between qc and Dr for application in crushable sands,

Geotechnical Engineering for Infrastructure and Development
3450
considering both shear and compression characteris-tics, have been developed using spherical cavity ex-pansion theory (e.g. Jiang & Sun, 2012).
Wang et al. (2011) performed plate load tests on calcareous sands from coral reefs of Nansha Islands and found that the bearing capacity of wet calcareous sand is only half of that of dry sand. There is no such difference in cone resistance of dry and wet silica sands and drained calibration chamber tests are simu-lated using dry conditions, simplifying the test set-up (Jamiolkowski et al. 2003).
Since bearing capacity is a result of shear and compression characteristics, different results for wet and dry conditions are expected in laboratory tests such as oedometer and triaxial tests. A test program was set up in the Ghent University Laboratory of Ge-otechnics, consisting of dry and wet compression and shear tests on a calcareous sand. The obtained me-chanical parameters will be used as input for the spherical cavity expansion models designed for the cone penetration resistance of crushable sands.
One-dimensional compression tests on S2-sand (Wils et al. 2014) have shown the increased com-pressibility of wet calcareous sand. This paper is a report of a triaxial test series under rather common, moderate stress levels, and shows how the shearing angle of friction and dilatancy are affected by the wa-ter content.
From the viewpoint of a generalised stress-strain behaviour of cohesionless soils (Miura & O-Hara, 1979, Semple 1988, Coop 1988), it has been brought forward that the particle crushing phenomenon can be found in all sands from a certain stress level on, depending on their mineralogy. Therefore, it is ex-pected that similar phenomena occur during the triax-ial compression tests of calcareous sands as presented here and those done on Toyoura sand by Miura & Yamanouchi (1975) at pressures up to 50 MPa. These authors found that at high confining pressures, satu-rated samples showed more volumetric strain, lower shear strength and stiffness, and less dilatancy at fail-ure, all due to the increased amount of particle break-age that is induced by the presence of water.
2 MATERIAL DESCRIPTION
For this study a calcareous sand from the Persian Gulf was tested. This “S2-sand” has angular grains
and a high CaCO3 content in the form of aragonite and calcite, reflecting its bioclastic origin. Because of the angular particles, the brittleness of the mother material and the intraparticle porosity, it is a very crushable sand. The grain size distribution is given in Figure 1, physical properties in Table 1.
.
Figure 1. PSD of S2 sand. The breakage potential Bp is the area above the original PSD and in this study is adapted to particles larger than 63 µm because of the use of ASTM sieves.
Table 1. Physical properties of S2 sand.
CU 3.67 D50 0.57 mm Bp 0.92 Gs,intact 2.82 g/cm³ Gs,powder 2.88 g/cm³ CaCO3 92% emin 0.832 emax 1.382
3 TEST DESCRIPTION
All samples are reconstituted from weighted sieve fractions to maintain the same grading at the start of every test. As such, the breakage potential (the area above the grain size distribution curve indicated in Figure 1, Hardin 1985) remains the same for all tests, legitimating the comparison of breakage.
Triaxial compression tests were carried out on cy-lindrical specimens (height 88 mm, diameter 38 mm). Samples were prepared in 6 layers, using dry pluvia-tion and gentle tamping following the undercompac-tion method of Ladd (1978) to obtain a homogeneous relative density Dr of 60%. Samples that were to be tested at higher consolidation stresses were prepared at slightly smaller densities, so that upon consolida-
tion and at the start of the shearing phase, all samples would have a Dr of 65±3%. This density is a relevant in-situ value, it provides a stable structure that won’t easily collapse upon saturation and can be reached without crushing.
Half of the samples were tested dry. The other half were saturated in the triaxial cell by flushing the samples with de-aired water and application of a back pressure, yielding B-coefficients of minimum 0.94. After saturation, S2-samples were consolidated under stresses of 50, 100, 200, 400, 500 and 750 kPa respectively. For the wet samples, the amount of drained water was recorded with a volume change transducer, and the density at the end of consolida-tion (i.e. at the start of shearing) could be calculated. For the dry sands ΔV-values were not known; it was assumed that they would compact equally to the wet sands, although earlier oedometer tests on S2-sand (Wils et al. 2014) proved that wet S2 is more com-pressible and would therefore be at higher density at the start of the shearing phase.
The consolidated samples were sheared at a strain rate of 0.1 mm/min and the deviator stress was rec-orded. Volume changes of the wet samples were also obtained and pore pressures were monitored to ascer-tain that shearing happened under drained conditions.
Tests were terminated at an axial strain of 20% of the initial sample height. Samples were then dried and sieved. The change in grain size distribution was measured using Hardin’s relative breakage factor (Hardin 1985), which is the ratio of total to potential breakage. The potential breakage is defined in Figure 1 and the total breakage is the difference in area be-tween the original PSD and the PSD after testing.
4 TEST RESULTS
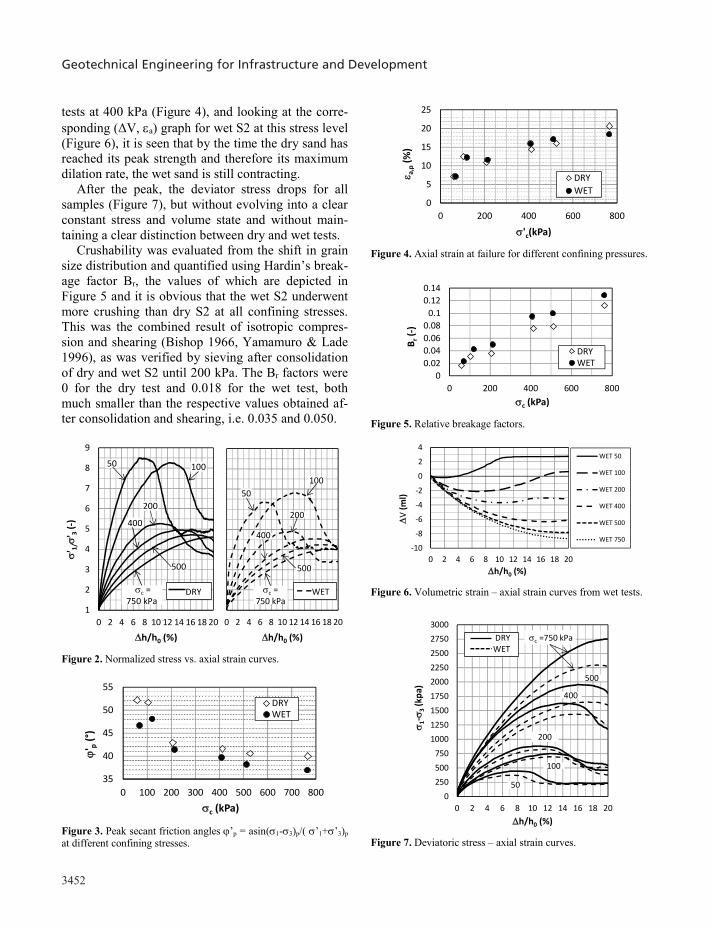
The results are presented in Figure 2 in terms of prin-cipal effective stress ratios for the different levels of consolidation pressure. In these graphs a clear peak can be seen for the low confining stresses, which is to be expected for a sand of medium high density.
Figure 3 shows the peak results interpreted using the secant angle of friction (Bolton, 1986). The tests at the lowest pressure (50 kPa) yield the highest fric-tion angle. Figure 4 depicts axial strain at failure, and shows that these tests also reached the lowest axial strain at failure. Figure 5 shows that breakage during
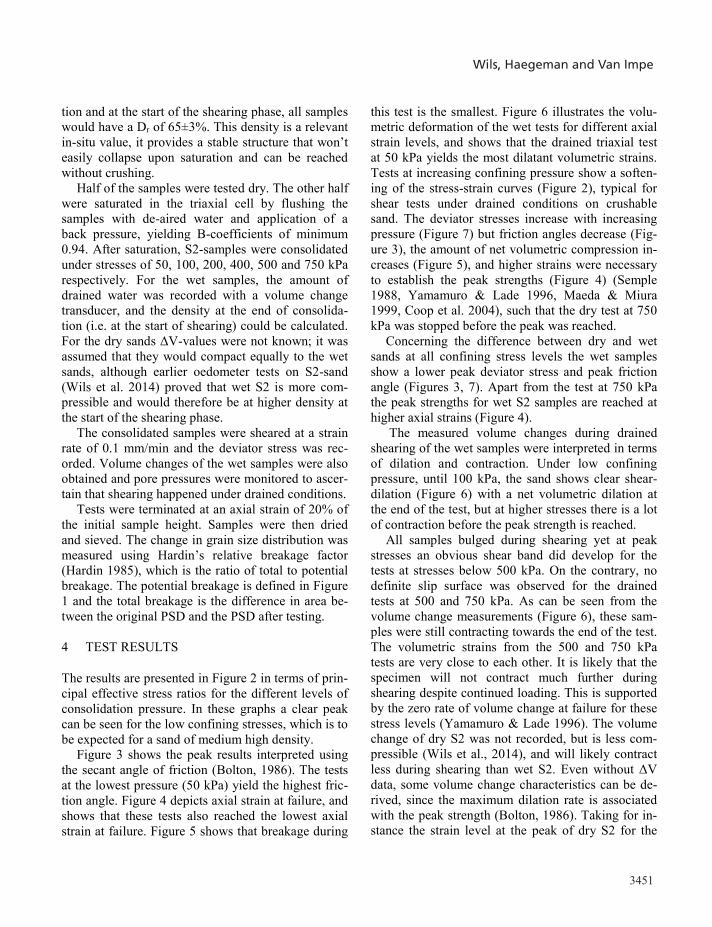
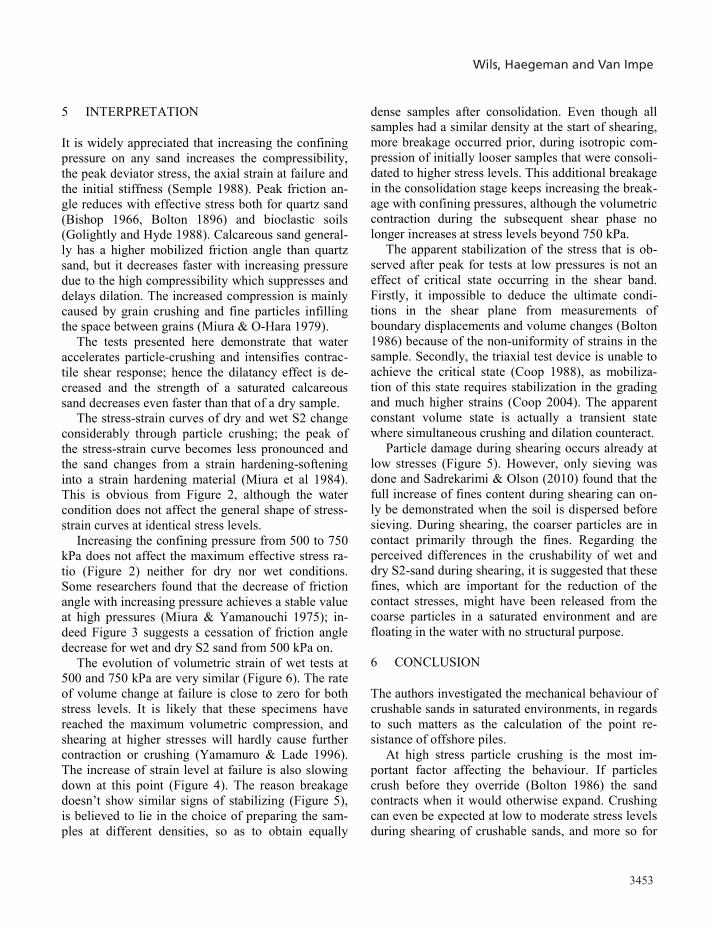
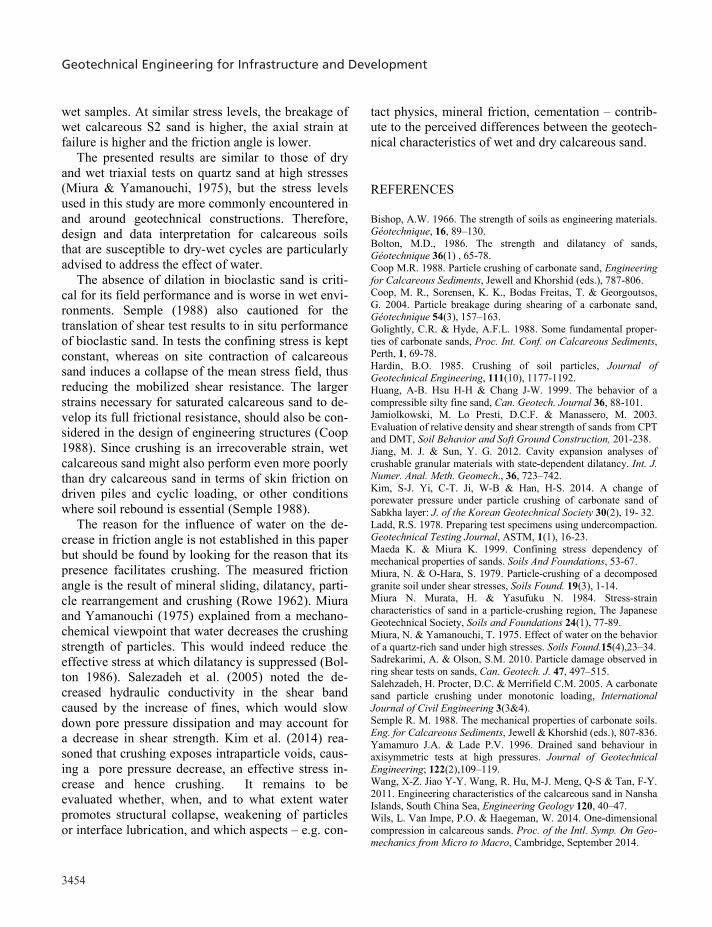
this test is the smallest. Figure 6 illustrates the volu-metric deformation of the wet tests for different axial strain levels, and shows that the drained triaxial test at 50 kPa yields the most dilatant volumetric strains. Tests at increasing confining pressure show a soften-ing of the stress-strain curves (Figure 2), typical for shear tests under drained conditions on crushable sand. The deviator stresses increase with increasing pressure (Figure 7) but friction angles decrease (Fig-ure 3), the amount of net volumetric compression in-creases (Figure 5), and higher strains were necessary to establish the peak strengths (Figure 4) (Semple 1988, Yamamuro & Lade 1996, Maeda & Miura 1999, Coop et al. 2004), such that the dry test at 750 kPa was stopped before the peak was reached.
Concerning the difference between dry and wet sands at all confining stress levels the wet samples show a lower peak deviator stress and peak friction angle (Figures 3, 7). Apart from the test at 750 kPa the peak strengths for wet S2 samples are reached at higher axial strains (Figure 4).
The measured volume changes during drained shearing of the wet samples were interpreted in terms of dilation and contraction. Under low confining pressure, until 100 kPa, the sand shows clear shear-dilation (Figure 6) with a net volumetric dilation at the end of the test, but at higher stresses there is a lot of contraction before the peak strength is reached.
All samples bulged during shearing yet at peak stresses an obvious shear band did develop for the tests at stresses below 500 kPa. On the contrary, no definite slip surface was observed for the drained tests at 500 and 750 kPa. As can be seen from the volume change measurements (Figure 6), these sam-ples were still contracting towards the end of the test. The volumetric strains from the 500 and 750 kPa tests are very close to each other. It is likely that the specimen will not contract much further during shearing despite continued loading. This is supported by the zero rate of volume change at failure for these stress levels (Yamamuro & Lade 1996). The volume change of dry S2 was not recorded, but is less com-pressible (Wils et al., 2014), and will likely contract less during shearing than wet S2. Even without ΔV data, some volume change characteristics can be de-rived, since the maximum dilation rate is associated with the peak strength (Bolton, 1986). Taking for in-stance the strain level at the peak of dry S2 for the
3451
considering both shear and compression characteris-tics, have been developed using spherical cavity ex-pansion theory (e.g. Jiang & Sun, 2012).
Wang et al. (2011) performed plate load tests on calcareous sands from coral reefs of Nansha Islands and found that the bearing capacity of wet calcareous sand is only half of that of dry sand. There is no such difference in cone resistance of dry and wet silica sands and drained calibration chamber tests are simu-lated using dry conditions, simplifying the test set-up (Jamiolkowski et al. 2003).
Since bearing capacity is a result of shear and compression characteristics, different results for wet and dry conditions are expected in laboratory tests such as oedometer and triaxial tests. A test program was set up in the Ghent University Laboratory of Ge-otechnics, consisting of dry and wet compression and shear tests on a calcareous sand. The obtained me-chanical parameters will be used as input for the spherical cavity expansion models designed for the cone penetration resistance of crushable sands.
One-dimensional compression tests on S2-sand (Wils et al. 2014) have shown the increased com-pressibility of wet calcareous sand. This paper is a report of a triaxial test series under rather common, moderate stress levels, and shows how the shearing angle of friction and dilatancy are affected by the wa-ter content.
From the viewpoint of a generalised stress-strain behaviour of cohesionless soils (Miura & O-Hara, 1979, Semple 1988, Coop 1988), it has been brought forward that the particle crushing phenomenon can be found in all sands from a certain stress level on, depending on their mineralogy. Therefore, it is ex-pected that similar phenomena occur during the triax-ial compression tests of calcareous sands as presented here and those done on Toyoura sand by Miura & Yamanouchi (1975) at pressures up to 50 MPa. These authors found that at high confining pressures, satu-rated samples showed more volumetric strain, lower shear strength and stiffness, and less dilatancy at fail-ure, all due to the increased amount of particle break-age that is induced by the presence of water.
2 MATERIAL DESCRIPTION
For this study a calcareous sand from the Persian Gulf was tested. This “S2-sand” has angular grains
and a high CaCO3 content in the form of aragonite and calcite, reflecting its bioclastic origin. Because of the angular particles, the brittleness of the mother material and the intraparticle porosity, it is a very crushable sand. The grain size distribution is given in Figure 1, physical properties in Table 1.
.
Figure 1. PSD of S2 sand. The breakage potential Bp is the area above the original PSD and in this study is adapted to particles larger than 63 µm because of the use of ASTM sieves.
Table 1. Physical properties of S2 sand.
CU 3.67 D50 0.57 mm Bp 0.92 Gs,intact 2.82 g/cm³ Gs,powder 2.88 g/cm³ CaCO3 92% emin 0.832 emax 1.382
3 TEST DESCRIPTION
All samples are reconstituted from weighted sieve fractions to maintain the same grading at the start of every test. As such, the breakage potential (the area above the grain size distribution curve indicated in Figure 1, Hardin 1985) remains the same for all tests, legitimating the comparison of breakage.
Triaxial compression tests were carried out on cy-lindrical specimens (height 88 mm, diameter 38 mm). Samples were prepared in 6 layers, using dry pluvia-tion and gentle tamping following the undercompac-tion method of Ladd (1978) to obtain a homogeneous relative density Dr of 60%. Samples that were to be tested at higher consolidation stresses were prepared at slightly smaller densities, so that upon consolida-
tion and at the start of the shearing phase, all samples would have a Dr of 65±3%. This density is a relevant in-situ value, it provides a stable structure that won’t easily collapse upon saturation and can be reached without crushing.
Half of the samples were tested dry. The other half were saturated in the triaxial cell by flushing the samples with de-aired water and application of a back pressure, yielding B-coefficients of minimum 0.94. After saturation, S2-samples were consolidated under stresses of 50, 100, 200, 400, 500 and 750 kPa respectively. For the wet samples, the amount of drained water was recorded with a volume change transducer, and the density at the end of consolida-tion (i.e. at the start of shearing) could be calculated. For the dry sands ΔV-values were not known; it was assumed that they would compact equally to the wet sands, although earlier oedometer tests on S2-sand (Wils et al. 2014) proved that wet S2 is more com-pressible and would therefore be at higher density at the start of the shearing phase.
The consolidated samples were sheared at a strain rate of 0.1 mm/min and the deviator stress was rec-orded. Volume changes of the wet samples were also obtained and pore pressures were monitored to ascer-tain that shearing happened under drained conditions.
Tests were terminated at an axial strain of 20% of the initial sample height. Samples were then dried and sieved. The change in grain size distribution was measured using Hardin’s relative breakage factor (Hardin 1985), which is the ratio of total to potential breakage. The potential breakage is defined in Figure 1 and the total breakage is the difference in area be-tween the original PSD and the PSD after testing.
4 TEST RESULTS
The results are presented in Figure 2 in terms of prin-cipal effective stress ratios for the different levels of consolidation pressure. In these graphs a clear peak can be seen for the low confining stresses, which is to be expected for a sand of medium high density.
Figure 3 shows the peak results interpreted using the secant angle of friction (Bolton, 1986). The tests at the lowest pressure (50 kPa) yield the highest fric-tion angle. Figure 4 depicts axial strain at failure, and shows that these tests also reached the lowest axial strain at failure. Figure 5 shows that breakage during
this test is the smallest. Figure 6 illustrates the volu-metric deformation of the wet tests for different axial strain levels, and shows that the drained triaxial test at 50 kPa yields the most dilatant volumetric strains. Tests at increasing confining pressure show a soften-ing of the stress-strain curves (Figure 2), typical for shear tests under drained conditions on crushable sand. The deviator stresses increase with increasing pressure (Figure 7) but friction angles decrease (Fig-ure 3), the amount of net volumetric compression in-creases (Figure 5), and higher strains were necessary to establish the peak strengths (Figure 4) (Semple 1988, Yamamuro & Lade 1996, Maeda & Miura 1999, Coop et al. 2004), such that the dry test at 750 kPa was stopped before the peak was reached.
Concerning the difference between dry and wet sands at all confining stress levels the wet samples show a lower peak deviator stress and peak friction angle (Figures 3, 7). Apart from the test at 750 kPa the peak strengths for wet S2 samples are reached at higher axial strains (Figure 4).
The measured volume changes during drained shearing of the wet samples were interpreted in terms of dilation and contraction. Under low confining pressure, until 100 kPa, the sand shows clear shear-dilation (Figure 6) with a net volumetric dilation at the end of the test, but at higher stresses there is a lot of contraction before the peak strength is reached.
All samples bulged during shearing yet at peak stresses an obvious shear band did develop for the tests at stresses below 500 kPa. On the contrary, no definite slip surface was observed for the drained tests at 500 and 750 kPa. As can be seen from the volume change measurements (Figure 6), these sam-ples were still contracting towards the end of the test. The volumetric strains from the 500 and 750 kPa tests are very close to each other. It is likely that the specimen will not contract much further during shearing despite continued loading. This is supported by the zero rate of volume change at failure for these stress levels (Yamamuro & Lade 1996). The volume change of dry S2 was not recorded, but is less com-pressible (Wils et al., 2014), and will likely contract less during shearing than wet S2. Even without ΔV data, some volume change characteristics can be de-rived, since the maximum dilation rate is associated with the peak strength (Bolton, 1986). Taking for in-stance the strain level at the peak of dry S2 for the
Wils, Haegeman and Van Impe
Geotechnical Engineering for Infrastructure and Development
3452
tests at 400 kPa (Figure 4), and looking at the corre-sponding (ΔV, ea) graph for wet S2 at this stress level (Figure 6), it is seen that by the time the dry sand has reached its peak strength and therefore its maximum dilation rate, the wet sand is still contracting.
After the peak, the deviator stress drops for all samples (Figure 7), but without evolving into a clear constant stress and volume state and without main-taining a clear distinction between dry and wet tests.
Crushability was evaluated from the shift in grain size distribution and quantified using Hardin’s break-age factor Br, the values of which are depicted in Figure 5 and it is obvious that the wet S2 underwent more crushing than dry S2 at all confining stresses. This was the combined result of isotropic compres-sion and shearing (Bishop 1966, Yamamuro & Lade 1996), as was verified by sieving after consolidation of dry and wet S2 until 200 kPa. The Br factors were 0 for the dry test and 0.018 for the wet test, both much smaller than the respective values obtained af-ter consolidation and shearing, i.e. 0.035 and 0.050.
1
2
3
4
5
6
7
8
9
0 2 4 6 8 10 12 14 16 18 20
' 1/' 3(-)
Dh/h0 (%)
10050
400
c =750 kPa
500
DRY
200
0 2 4 6 8 10 12 14 16 18 20
Dh/h0 (%)
100
50
400
c =750 kPa
500
WET
200
Figure 2. Normalized stress vs. axial strain curves.
35
40
45
50
55
0 100 200 300 400 500 600 700 800
' p(°)
c (kPa)
DRYWET
Figure 3. Peak secant friction angles ’p = asin(1-3)p/( ’1+’3)p
at different confining stresses.
0
5
10
15
20
25
0 200 400 600 800
e a,p(%
)
'c(kPa)
DRY
WET
Figure 4. Axial strain at failure for different confining pressures.
0
0.02
0.04
0.06
0.08
0.1
0.12
0.14
0 200 400 600 800
Br(-)
c (kPa)
DRYWET
Figure 5. Relative breakage factors.
-10
-8
-6
-4
-2
0
2
4
0 2 4 6 8 10 12 14 16 18 20
DV(m
l)
Dh/h0 (%)
WET 50
WET 100
WET 200
WET 400
WET 500
WET 750
Figure 6. Volumetric strain – axial strain curves from wet tests.
0
250
500
750
1000
1250
1500
1750
2000
2250
2500
2750
3000
0 2 4 6 8 10 12 14 16 18 20
1-
3(kpa)
Dh/h0 (%)
400
500
100
50
c =750 kPaDRYWET
200
Figure 7. Deviatoric stress – axial strain curves.
5 INTERPRETATION
It is widely appreciated that increasing the confining pressure on any sand increases the compressibility, the peak deviator stress, the axial strain at failure and the initial stiffness (Semple 1988). Peak friction an-gle reduces with effective stress both for quartz sand (Bishop 1966, Bolton 1896) and bioclastic soils (Golightly and Hyde 1988). Calcareous sand general-ly has a higher mobilized friction angle than quartz sand, but it decreases faster with increasing pressure due to the high compressibility which suppresses and delays dilation. The increased compression is mainly caused by grain crushing and fine particles infilling the space between grains (Miura & O-Hara 1979).
The tests presented here demonstrate that water accelerates particle-crushing and intensifies contrac-tile shear response; hence the dilatancy effect is de-creased and the strength of a saturated calcareous sand decreases even faster than that of a dry sample.
The stress-strain curves of dry and wet S2 change considerably through particle crushing; the peak of the stress-strain curve becomes less pronounced and the sand changes from a strain hardening-softening into a strain hardening material (Miura et al 1984). This is obvious from Figure 2, although the water condition does not affect the general shape of stress-strain curves at identical stress levels.
Increasing the confining pressure from 500 to 750 kPa does not affect the maximum effective stress ra-tio (Figure 2) neither for dry nor wet conditions. Some researchers found that the decrease of friction angle with increasing pressure achieves a stable value at high pressures (Miura & Yamanouchi 1975); in-deed Figure 3 suggests a cessation of friction angle decrease for wet and dry S2 sand from 500 kPa on.
The evolution of volumetric strain of wet tests at 500 and 750 kPa are very similar (Figure 6). The rate of volume change at failure is close to zero for both stress levels. It is likely that these specimens have reached the maximum volumetric compression, and shearing at higher stresses will hardly cause further contraction or crushing (Yamamuro & Lade 1996). The increase of strain level at failure is also slowing down at this point (Figure 4). The reason breakage doesn’t show similar signs of stabilizing (Figure 5), is believed to lie in the choice of preparing the sam-ples at different densities, so as to obtain equally
dense samples after consolidation. Even though all samples had a similar density at the start of shearing, more breakage occurred prior, during isotropic com-pression of initially looser samples that were consoli-dated to higher stress levels. This additional breakage in the consolidation stage keeps increasing the break-age with confining pressures, although the volumetric contraction during the subsequent shear phase no longer increases at stress levels beyond 750 kPa.
The apparent stabilization of the stress that is ob-served after peak for tests at low pressures is not an effect of critical state occurring in the shear band. Firstly, it impossible to deduce the ultimate condi-tions in the shear plane from measurements of boundary displacements and volume changes (Bolton 1986) because of the non-uniformity of strains in the sample. Secondly, the triaxial test device is unable to achieve the critical state (Coop 1988), as mobiliza-tion of this state requires stabilization in the grading and much higher strains (Coop 2004). The apparent constant volume state is actually a transient state where simultaneous crushing and dilation counteract.
Particle damage during shearing occurs already at low stresses (Figure 5). However, only sieving was done and Sadrekarimi & Olson (2010) found that the full increase of fines content during shearing can on-ly be demonstrated when the soil is dispersed before sieving. During shearing, the coarser particles are in contact primarily through the fines. Regarding the perceived differences in the crushability of wet and dry S2-sand during shearing, it is suggested that these fines, which are important for the reduction of the contact stresses, might have been released from the coarse particles in a saturated environment and are floating in the water with no structural purpose.
6 CONCLUSION
The authors investigated the mechanical behaviour of crushable sands in saturated environments, in regards to such matters as the calculation of the point re-sistance of offshore piles.
At high stress particle crushing is the most im-portant factor affecting the behaviour. If particles crush before they override (Bolton 1986) the sand contracts when it would otherwise expand. Crushing can even be expected at low to moderate stress levels during shearing of crushable sands, and more so for
3453
tests at 400 kPa (Figure 4), and looking at the corre-sponding (ΔV, ea) graph for wet S2 at this stress level (Figure 6), it is seen that by the time the dry sand has reached its peak strength and therefore its maximum dilation rate, the wet sand is still contracting.
After the peak, the deviator stress drops for all samples (Figure 7), but without evolving into a clear constant stress and volume state and without main-taining a clear distinction between dry and wet tests.
Crushability was evaluated from the shift in grain size distribution and quantified using Hardin’s break-age factor Br, the values of which are depicted in Figure 5 and it is obvious that the wet S2 underwent more crushing than dry S2 at all confining stresses. This was the combined result of isotropic compres-sion and shearing (Bishop 1966, Yamamuro & Lade 1996), as was verified by sieving after consolidation of dry and wet S2 until 200 kPa. The Br factors were 0 for the dry test and 0.018 for the wet test, both much smaller than the respective values obtained af-ter consolidation and shearing, i.e. 0.035 and 0.050.
1
2
3
4
5
6
7
8
9
0 2 4 6 8 10 12 14 16 18 20
' 1/' 3(-)
Dh/h0 (%)
10050
400
c =750 kPa
500
DRY
200
0 2 4 6 8 10 12 14 16 18 20
Dh/h0 (%)
100
50
400
c =750 kPa
500
WET
200
Figure 2. Normalized stress vs. axial strain curves.
35
40
45
50
55
0 100 200 300 400 500 600 700 800
' p(°)
c (kPa)
DRYWET
Figure 3. Peak secant friction angles ’p = asin(1-3)p/( ’1+’3)p
at different confining stresses.
0
5
10
15
20
25
0 200 400 600 800
e a,p(%
)
'c(kPa)
DRY
WET
Figure 4. Axial strain at failure for different confining pressures.
0
0.02
0.04
0.06
0.08
0.1
0.12
0.14
0 200 400 600 800
Br(-)
c (kPa)
DRYWET
Figure 5. Relative breakage factors.
-10
-8
-6
-4
-2
0
2
4
0 2 4 6 8 10 12 14 16 18 20
DV(m
l)
Dh/h0 (%)
WET 50
WET 100
WET 200
WET 400
WET 500
WET 750
Figure 6. Volumetric strain – axial strain curves from wet tests.
0
250
500
750
1000
1250
1500
1750
2000
2250
2500
2750
3000
0 2 4 6 8 10 12 14 16 18 20
1-
3(kpa)
Dh/h0 (%)
400
500
100
50
c =750 kPaDRYWET
200
Figure 7. Deviatoric stress – axial strain curves.
5 INTERPRETATION
It is widely appreciated that increasing the confining pressure on any sand increases the compressibility, the peak deviator stress, the axial strain at failure and the initial stiffness (Semple 1988). Peak friction an-gle reduces with effective stress both for quartz sand (Bishop 1966, Bolton 1896) and bioclastic soils (Golightly and Hyde 1988). Calcareous sand general-ly has a higher mobilized friction angle than quartz sand, but it decreases faster with increasing pressure due to the high compressibility which suppresses and delays dilation. The increased compression is mainly caused by grain crushing and fine particles infilling the space between grains (Miura & O-Hara 1979).
The tests presented here demonstrate that water accelerates particle-crushing and intensifies contrac-tile shear response; hence the dilatancy effect is de-creased and the strength of a saturated calcareous sand decreases even faster than that of a dry sample.
The stress-strain curves of dry and wet S2 change considerably through particle crushing; the peak of the stress-strain curve becomes less pronounced and the sand changes from a strain hardening-softening into a strain hardening material (Miura et al 1984). This is obvious from Figure 2, although the water condition does not affect the general shape of stress-strain curves at identical stress levels.
Increasing the confining pressure from 500 to 750 kPa does not affect the maximum effective stress ra-tio (Figure 2) neither for dry nor wet conditions. Some researchers found that the decrease of friction angle with increasing pressure achieves a stable value at high pressures (Miura & Yamanouchi 1975); in-deed Figure 3 suggests a cessation of friction angle decrease for wet and dry S2 sand from 500 kPa on.
The evolution of volumetric strain of wet tests at 500 and 750 kPa are very similar (Figure 6). The rate of volume change at failure is close to zero for both stress levels. It is likely that these specimens have reached the maximum volumetric compression, and shearing at higher stresses will hardly cause further contraction or crushing (Yamamuro & Lade 1996). The increase of strain level at failure is also slowing down at this point (Figure 4). The reason breakage doesn’t show similar signs of stabilizing (Figure 5), is believed to lie in the choice of preparing the sam-ples at different densities, so as to obtain equally
dense samples after consolidation. Even though all samples had a similar density at the start of shearing, more breakage occurred prior, during isotropic com-pression of initially looser samples that were consoli-dated to higher stress levels. This additional breakage in the consolidation stage keeps increasing the break-age with confining pressures, although the volumetric contraction during the subsequent shear phase no longer increases at stress levels beyond 750 kPa.
The apparent stabilization of the stress that is ob-served after peak for tests at low pressures is not an effect of critical state occurring in the shear band. Firstly, it impossible to deduce the ultimate condi-tions in the shear plane from measurements of boundary displacements and volume changes (Bolton 1986) because of the non-uniformity of strains in the sample. Secondly, the triaxial test device is unable to achieve the critical state (Coop 1988), as mobiliza-tion of this state requires stabilization in the grading and much higher strains (Coop 2004). The apparent constant volume state is actually a transient state where simultaneous crushing and dilation counteract.
Particle damage during shearing occurs already at low stresses (Figure 5). However, only sieving was done and Sadrekarimi & Olson (2010) found that the full increase of fines content during shearing can on-ly be demonstrated when the soil is dispersed before sieving. During shearing, the coarser particles are in contact primarily through the fines. Regarding the perceived differences in the crushability of wet and dry S2-sand during shearing, it is suggested that these fines, which are important for the reduction of the contact stresses, might have been released from the coarse particles in a saturated environment and are floating in the water with no structural purpose.
6 CONCLUSION
The authors investigated the mechanical behaviour of crushable sands in saturated environments, in regards to such matters as the calculation of the point re-sistance of offshore piles.
At high stress particle crushing is the most im-portant factor affecting the behaviour. If particles crush before they override (Bolton 1986) the sand contracts when it would otherwise expand. Crushing can even be expected at low to moderate stress levels during shearing of crushable sands, and more so for
Wils, Haegeman and Van Impe
Geotechnical Engineering for Infrastructure and Development
3454
wet samples. At similar stress levels, the breakage of wet calcareous S2 sand is higher, the axial strain at failure is higher and the friction angle is lower.
The presented results are similar to those of dry and wet triaxial tests on quartz sand at high stresses (Miura & Yamanouchi, 1975), but the stress levels used in this study are more commonly encountered in and around geotechnical constructions. Therefore, design and data interpretation for calcareous soils that are susceptible to dry-wet cycles are particularly advised to address the effect of water.
The absence of dilation in bioclastic sand is criti-cal for its field performance and is worse in wet envi-ronments. Semple (1988) also cautioned for the translation of shear test results to in situ performance of bioclastic sand. In tests the confining stress is kept constant, whereas on site contraction of calcareous sand induces a collapse of the mean stress field, thus reducing the mobilized shear resistance. The larger strains necessary for saturated calcareous sand to de-velop its full frictional resistance, should also be con-sidered in the design of engineering structures (Coop 1988). Since crushing is an irrecoverable strain, wet calcareous sand might also perform even more poorly than dry calcareous sand in terms of skin friction on driven piles and cyclic loading, or other conditions where soil rebound is essential (Semple 1988).
The reason for the influence of water on the de-crease in friction angle is not established in this paper but should be found by looking for the reason that its presence facilitates crushing. The measured friction angle is the result of mineral sliding, dilatancy, parti-cle rearrangement and crushing (Rowe 1962). Miura and Yamanouchi (1975) explained from a mechano-chemical viewpoint that water decreases the crushing strength of particles. This would indeed reduce the effective stress at which dilatancy is suppressed (Bol-ton 1986). Salezadeh et al. (2005) noted the de-creased hydraulic conductivity in the shear band caused by the increase of fines, which would slow down pore pressure dissipation and may account for a decrease in shear strength. Kim et al. (2014) rea-soned that crushing exposes intraparticle voids, caus-ing a pore pressure decrease, an effective stress in-crease and hence crushing. It remains to be evaluated whether, when, and to what extent water promotes structural collapse, weakening of particles or interface lubrication, and which aspects – e.g. con-
tact physics, mineral friction, cementation – contrib-ute to the perceived differences between the geotech-nical characteristics of wet and dry calcareous sand.
REFERENCES
Bishop, A.W. 1966. The strength of soils as engineering materials. Géotechnique, 16, 89–130. Bolton, M.D., 1986. The strength and dilatancy of sands, Géotechnique 36(1) , 65-78. Coop M.R. 1988. Particle crushing of carbonate sand, Engineering for Calcareous Sediments, Jewell and Khorshid (eds.), 787-806. Coop, M. R., Sorensen, K. K., Bodas Freitas, T. & Georgoutsos, G. 2004. Particle breakage during shearing of a carbonate sand, Géotechnique 54(3), 157–163. Golightly, C.R. & Hyde, A.F.L. 1988. Some fundamental proper-ties of carbonate sands, Proc. Int. Conf. on Calcareous Sediments, Perth, 1, 69-78. Hardin, B.O. 1985. Crushing of soil particles, Journal of Geotechnical Engineering, 111(10), 1177-1192. Huang, A-B. Hsu H-H & Chang J-W. 1999. The behavior of a compressible silty fine sand, Can. Geotech. Journal 36, 88-101. Jamiolkowski, M. Lo Presti, D.C.F. & Manassero, M. 2003. Evaluation of relative density and shear strength of sands from CPT and DMT, Soil Behavior and Soft Ground Construction, 201-238. Jiang, M. J. & Sun, Y. G. 2012. Cavity expansion analyses of crushable granular materials with state-dependent dilatancy. Int. J. Numer. Anal. Meth. Geomech., 36, 723–742. Kim, S-J. Yi, C-T. Ji, W-B & Han, H-S. 2014. A change of porewater pressure under particle crushing of carbonate sand of Sabkha layer: J. of the Korean Geotechnical Society 30(2), 19- 32. Ladd, R.S. 1978. Preparing test specimens using undercompaction. Geotechnical Testing Journal, ASTM, 1(1), 16-23. Maeda K. & Miura K. 1999. Confining stress dependency of mechanical properties of sands. Soils And Foundations, 53-67. Miura, N. & O-Hara, S. 1979. Particle-crushing of a decomposed granite soil under shear stresses, Soils Found. 19(3), 1-14. Miura N. Murata, H. & Yasufuku N. 1984. Stress-strain characteristics of sand in a particle-crushing region, The Japanese Geotechnical Society, Soils and Foundations 24(1), 77-89. Miura, N. & Yamanouchi, T. 1975. Effect of water on the behavior of a quartz-rich sand under high stresses. Soils Found.15(4),23–34. Sadrekarimi, A. & Olson, S.M. 2010. Particle damage observed in ring shear tests on sands, Can. Geotech. J. 47, 497–515. Salehzadeh, H. Procter, D.C. & Merrifield C.M. 2005. A carbonate sand particle crushing under monotonic loading, International Journal of Civil Engineering 3(3&4). Semple R. M. 1988. The mechanical properties of carbonate soils. Eng. for Calcareous Sediments, Jewell & Khorshid (eds.), 807-836. Yamamuro J.A. & Lade P.V. 1996. Drained sand behaviour in axisymmetric tests at high pressures. Journal of Geotechnical Engineering; 122(2),109–119. Wang, X-Z. Jiao Y-Y. Wang, R. Hu, M-J. Meng, Q-S & Tan, F-Y. 2011. Engineering characteristics of the calcareous sand in Nansha Islands, South China Sea, Engineering Geology 120, 40–47. Wils, L. Van Impe, P.O. & Haegeman, W. 2014. One-dimensional compression in calcareous sands. Proc. of the Intl. Symp. On Geo-mechanics from Micro to Macro, Cambridge, September 2014.
Laboratory studies on the effect of gas bubbles on clay Des études en laboratoire sur l'effet de bulles de gaz sur terre battue
S.L. Yang*1, T. Kvalstad1 and C. Baxter2 1 Norwegian Geotechnical Institute, Oslo, Norway
2 University of Rhode Island, Rhode Island, USA * Corresponding Author
ABSTRACT Gas bubbles in offshore soil are created when gas hydrate is dissociated due to changes in pressure and/or temperature, and cracks may appear in the soil. In deep waters, even a small amount of gas dissolved in the pore water will come out of solution when samples are recovered from the sea bottom to deck level, causing significant sample disturbance. In this study, a laboratory programme consisting of various tests was developed to observe the effect of gas bubbles on the behavior of clay. Tests involved a Freon hydrate in both a transparent soil and intact samples of marine clay, and DSS and consolidation tests on undisturbed samples with carbon-dioxide sa-turated water as the pore fluid. Bubble and crack development was observed both visually and using X-ray computed tomography (CT). The experimental work showed that gas bubbles can be formed when temperature or pressure is changed, and bubbles can become disk-shaped with increasing volume and fractures can develop in the final stage. Values of undrained shear strength in simple shear were redu-ced by 15% from gas bubble formation. RÉSUMÉ Les bulles de gaz dans le sol étranger sont créés lors de l'hydrate de gaz est dissocié en raison de changements dans la pression et / ou température, et des fissures peut être apparue. En eaux profondes, même une petite quantité de gaz dissous dans l'eau des pores va sortir de la solution lorsque les échantillons sont recovered du fond de la mer au niveau du pont. Cela perturber l'échantillon et bon nombre de fissures peut être observé. Un programme de laboratoire avec appareil d'essai variée ups a été conçu pour observer l'effet des bulles de gaz sur terre battue. Le travail expérimental a montré que des bulles de gaz peuvent être formés lorsque la température ou la pression est changé, et la forme de la bulle peuvent changer de forme de disque avec l'augmentation de volumn et fracture peuvent se développer dans la phase finale. Résistance au cisaillement peut être réduite de 15% après que le gaz sortant de la solution en raison du changement de pres-sion.
1 REVIEW OF PREVIOUS WORK
Bubbles of undissolved gas have been found within soils forming the sea-bed at many locations through-out the world (Johnson et al., 2002). These gas bub-bles can have a negative effect on the engineering properties of the soil, with important consequences for the design of foundations for oil platforms and other offshore structures (Wheeler, 1988). The size of gas bubbles in the sea-bed are varied and bubbles predominantly possess radii from tens of m to 10 mm, and spherical bubbles are more common for smaller bubble sizes and in more coarse grained sed-iments, while vertically oriented, elongated bubbles
dominate in the more fine grained muds (Robb et al., 2006).
The mechanical response of sediments to bubble growth was studied by Johnson et al. (2002) and Gardiner et al., (2003). Gas was injected into natural and surrogate sediment samples through a fine capil-lary. Pressure was monitored during bubble growth. The observations indicated that bubbles grow by soil fracture and bubbles are disk-shaped.
Wheeler (1988) carried out undrained triaxial tests on reconstituted samples containing bubbles of me-thane gas. The experimental work showed that the undrained shear strength can be either increased or decreased by the presence of large gas bubbles within