Embed Size (px)
Citation preview

Tribe or Nation?
Nation-Building and Public Goods in Kenya versus Tanzania
Edward Miguel*
University of California at Berkeley
October 2002
Abstract The design of public policies that promote inter-ethnic cooperation remains poorly understood. This paper examines how central government policies toward ethnic diversity affect inter-ethnic relations by comparing outcomes across two nearby rural districts, one in western Kenya and one in western Tanzania. Despite their largely shared geography, history, and colonial institutional legacy, post-independence governments in Kenya and Tanzania have followed radically different ethnic policies along a range of dimensions – most notably in language use, education, and local institutional design, with Tanzania consistently pursuing more serious “nation-building” policies. The evidence in this paper indicates that the Tanzanian approach has allowed ethnically diverse communities in rural Tanzania to achieve considerably better local public goods outcomes than diverse communities in the nearby Kenyan region. To illustrate, while Kenyan communities at mean levels of ethnic diversity have 40 percent fewer desks per primary school pupil than homogeneous areas on average, the comparable figure for the Tanzanian district is near zero and statistically insignificant. The Kenya-Tanzania comparison provides novel empirical evidence that, in the long-run, serious nation-building reforms in ethnically diverse countries can ameliorate social divisions, and that nation-building should take a place in government policy agendas, especially in Africa, the world’s most ethnically diverse continent. * Correspondence to: [email protected]. Abhijit Banerjee, Melissa Gonzalez-Brenes, Tina Green, Rachel Kranton, David Laitin, and members of the UCLA Working Group in African Political Economy have provided valuable comments. I am deeply indebted to the staff of ICS Africa in both Kenya and Tanzania, the Meatu District Council, the Dutch Rural Development Programme, survey respondents in both Kenya and Tanzania, Alicia Bannon, Elizabeth Beasley, Negar Ghobadi, James Habyarimana, Sylvie Moulin, Avery Ouellette, Polycarp Waswa, and especially Melissa Gonzalez-Brenes, Mary Kay Gugerty, and Michael Kremer, my co-authors on related work, for their generosity. Tina Green provided excellent research assistance. I gratefully acknowledge financial support from the U.S. National Science Foundation (SGER-#0213652) and the U.C. Berkeley Committee on Research. Of course, all errors remain my own.

1. Introduction
The design of public policies that promote inter-ethnic cooperation remains poorly understood fifteen
years after Horowitz’s (1985) seminal work. Recent research suggests that higher levels of ethnic
diversity are related to low provision of local public goods across United States municipalities
(Alesina et al. 1999), and that ethnically diverse societies are prone to corruption, political instability,
poor institutional performance, and slow economic growth (Easterly and Levine 1997, Mauro 1995).
Ethnic divisions are at the heart of recent conflicts in Europe, South Asia, and Africa that have had
enormous human costs, including the Rwandan Genocide (DesForges 1999). Addressing ethnic
divisions is likely to be particularly important for sub-Saharan Africa – which is the most ethnically
diverse and poorest region in the world.
This paper examines how central government nation-building policies affect inter-ethnic
cooperation, by comparing the relationship between local ethnic diversity and public goods across
two nearby rural districts, one in western Kenya and one in western Tanzania.
Despite their largely shared geography, history, and colonial institutional legacy, post-
independence governments in Kenya and Tanzania have followed radically different ethnic policies
along a range of dimensions, most notably in national language policy, the educational curriculum,
and local institutional design. Tanzania has consistently pursued more serious nation-building
policies – attempts to forge a common national identity attractive across ethnic groups – than Kenya
during the post-colonial period, as described in detail below.
The empirical evidence in this paper indicates that the Tanzanian nation-building approach
has allowed ethnically diverse communities in rural Tanzania to achieve considerable success in local
public goods fundraising, while diverse communities in the nearby Kenyan region typically fail. To
illustrate, Kenyan communities at mean levels of ethnic diversity have 40 percent fewer desks per
pupil than homogeneous Kenyan communities on average (statistically significant at 95 percent
1

confidence), but the comparable figure for the Tanzanian district is near zero and statistically
insignificant. Analogous results hold when jointly testing hypotheses for multiple public goods,
including primary school funding, school infrastructure, and water well maintenance.
Of course, the case study presented in this paper has methodological shortcomings, the most
obvious being the small sample size of two countries, lack of a longitudinal dataset, and imperfect
econometric identification. Still, the Kenya-Tanzania comparison provides suggestive micro-
economic evidence that in the long-run, serious nation-building reforms in ethnically diverse
countries can successfully bridge social divisions, and affect important economic outcomes like
public goods provision. As such, this paper contributes to the growing literature within Economics
on the importance of identity to economic choices and outcomes (Akerlof and Kranton 2000), and to
recent debates on the role of social capital, institutions, and culture in economic development
(Putnam 1993, Acemoglu et al 2001, Sobel 2002).
2. Related Literature on Ethnic Diversity and Economic Development
The seminal article on ethnic diversity within Economics is Easterly and Levine (1997). The authors
explore how ethnic diversity affected growth rates across countries during the post-war period, using
a dataset on national ethno-linguistic diversity compiled by Russian anthropologists during the
1960’s. The continent with the greatest number of ethno-linguistically diverse countries according to
this measure is Africa, which contains nine of the ten most diverse countries (the one non-African
exception being India). Kenya and Tanzania, for example, have dozens of major ethnic groups and
are both among the world’s ten most diverse countries.
Easterly and Levine find two striking patterns in the cross-country data. First, ethnically
diverse countries had significantly lower per capita economic growth rates than homogeneous
countries during the post-war period. Second, Easterly and Levine find that diverse countries
2

exhibited poor public policy performance along a range of dimensions, including greater foreign
exchange distortion, slow financial development, poor schooling outcomes, and less physical
infrastructure investment, and use this evidence to argue that diversity led to slow growth through
poor policy choices.
Applied microeconomists have since documented many specific instances where ethnic
diversity produces sub-par economic outcomes, and for the remainder of this section I briefly survey
this growing evidence.1 To illustrate, Peruvian micro-credit groups have higher loan default rates
and lower savings when members are from different cultural backgrounds (Karlan 2002). United
States municipalities with higher levels of racial diversity raise considerably less funding for local
public goods (Alesina et al 1999). Finally, in the author’s own work with Mary Kay Gugerty, which
is discussed again below, rural Kenyan communities with greater ethno-linguistic diversity – or
diversity across “tribes”, as they are called in East Africa – have considerably less primary school
funding, worse school facilities, and poor water well maintenance (Miguel and Gugerty 2002).
There is less consensus regarding the underlying theoretical mechanisms generating these
patterns, and two sets of theories have emerged. Although distinct theoretical mechanisms have been
found to be more salient in particular settings, the two theories are not mutually exclusive, and both
probably capture important aspects of reality in most cases.
The first theories are what I call taste explanations for negative ethnic diversity effects.
There are several variants of this theory, mainly developed in research on the United States. For
example, Alesina et al (1999) have claimed that individuals from different ethnic groups prefer
distinct types of public goods – roads versus libraries, for instance – and this leads to less agreement
on public goods choices in diverse areas, and thus lower funding. Alesina et al (2000) have claimed
that, for the most part, individuals from different groups dislike “mixing” across ethnic lines, and this
drives the poor collective action and organizational outcomes in diverse areas. Finally, there is 1 Refer to Costa and Kahn (2002) for a more complete review.
3
recent empirical evidence that individuals prefer to fund public goods that benefit their own ethnic
group over others, in which case once again funding is lower in diverse areas (Vigdor 2002).
Unfortunately, none of these theories explain where these ethnic taste differences come from, nor
how they can be affected through public policy, so this body of work does not directly speak to the
central concern of this study, of how to ameliorate ethnic divisions.
The second set of theories emphasizes the important role community social sanctions play in
sustaining collective action, and how sanctions are ineffective in diverse settings. Observers of less
developed countries have long-noted the importance of community pressure based on dense social
ties in sustaining good collective outcomes, and the recent empirical studies from less developed
countries tend to emphasize this mechanism. The basic idea is that it becomes difficult to sustain
cooperation across ethnic groups in areas where members of different groups tend not to have
frequent or intimate social interactions, or close social affinity. In this view of the world, public
policies that promote interaction, information sharing, and coordination across ethnic groups are
plausible vehicles for reducing the efficiencies associated with ethnic diversity.
For example, Miguel and Gugerty (2002) focus on the difficulties of mobilizing diverse
communities in rural Kenya, and present quantitative evidence from primary school committee
meeting records that significantly fewer social sanctions are imposed on parents late with school fees
in ethnically diverse areas. Karlan (2002) comes to similar conclusions regarding the importance of
informal social sanctions in sustaining loan repayment in Peruvian micro-credit groups.
2.1 Reconciling Diversity and Development
There is limited empirical evidence regarding which public policies are most successful in addressing
ethnic divisions. One possible institutional reform is to promote power-sharing across ethnic groups
within governments or other organizations. In such a system, ethnic minorities are assured some
minimum influence over policy, possibly including veto power over certain policies. Although
4

intuitively attractive, in practice it is unclear how power-sharing actually overcomes the underlying
causes of negative ethnic diversity effects. In fact, at the same time that power-sharing structures
competition among ethnic groups in the political arena, it institutionalizes political divisions across
groups rather than bridging them. Rigid power-sharing rules that take ethnic classifications as fixed
reify existing ethnic divisions and may hinder the development of new social identities – or multi-
ethnic political coalitions – that cut across pre-existing divisions.
A second approach – which may be more promising – advocates promoting dialogue and
interaction among the leaders of distinct ethnic communities, who are then better able to coordinate
responses to violations of inter-group cooperation norms. One variant of this approach, associated
with the work of Fearon and Laitin (1996), would have group leaders agree to punish violators from
within their own ethnic group, so-called within-group policing. For example, if there is a violent
attack on a member of ethnic group A by members of group B, leaders of group B should publicly
sanction the perpetrators in their own group, making organized retaliation by group A unnecessary,
and thus avoiding a violent downward spiral.
A closely related form of elite coordination is the establishment of formal associational
bonds across ethnic groups. It has recently been argued that the density of cross-group associational
ties is the critical determinant of inter-religious relations in India during episodes of communal
violence: Varshney (2002) highlights the case of Bhiwandi, near Bombay, where a determined effort
to create inter-religious peace committees in the late 1980s successfully headed off communal
violence in the aftermath of the 1992 Ayodhya mosque incident, while nearby cities were engulfed in
anti-Muslim pogroms.
However, this theory too has limitations. Approaches predicated on the existence of
cooperation among ethnic group leaders beg the question of how this cooperation comes about in the
first place. In fact, elite cooperation is as much a manifestation of better ethnic relations as a cause,
5

and thus it is difficult to draw strong causal claims about how the existence of cross-group
associational links actually affects ethnic relations.
2.2 Political Socialization and Nation-building
The literature on “political socialization” within Political Science concerned itself with these and
related questions, namely, of how individual political ideals, opinions, identities and preferences are
generated. The field focused primarily on how the mass media and the educational system could be
employed by political leaders to inculcate citizens with “desirable” political ideals, including, often, a
strong attachment to the nation over ethnic and regional identities. To the extent that it is successful
in shaping individual views, political socialization offers a way out of the dilemma mentioned above,
of determining the origin of tastes for ethnic cooperation. Such nation-building policies may be
viewed more generally as investments in “social capital” (Putnam 1993).2
Nation-building reforms in the newly independent East African nations figured prominently
in the political socialization literature of the 1960s and 1970s (refer to Prewitt, Von der Muhll and
Court 1970). However, this body of research did not reach strong empirical conclusions about how
useful political socialization actually was in shaping a coherent national identity or political culture
(Court and Kinyanjui 1980), in part because of the limited time between the implementation of
nation-building programs in the 1960s and research only a decade later.
Sufficient time has now passed since independence – roughly forty years – to re-assess the
impact of political socialization and nation-building policies on inter-ethnic cooperation in East
Africa. In the next section I compare the post-independence development trajectories of Kenya and
Tanzania, paying particular attention to their divergent nation-building and ethnic policies.
2 However, the construction of ethnic identities may also serve different strategic purposes. More recently, Fearon and Laitin (2000) have found that political elites often successfully manipulate ethnic identities to provoke ethnic violence, in their words, to “gain, maintain, or increase their hold on political power.”
6

3. A Nation-building Case Study: Kenya versus Tanzania
3.1 Geographic and Historical Commonalities
Kenya and Tanzania are a natural paired comparison, with similar geography and histories, but they
have followed radically different nation-building policies since independence. Barkan (1994) writes:
Comparison between Kenya and Tanzania [is] … appealing because of their resemblances with respect to a number of variables that impinge upon the developmental process and that could be held constant or nearly constant in an examination of the countries. Both are populated mainly by small peasant households of similar cultures. … Both experienced British colonial rule and inherited a common set of political, administrative, and economic institutions, as well as a common market with a single currency and a common infrastructure of rail, port, and telecommunications facilities. As adjacent countries, they share a common climate and have similar natural resource endowments.
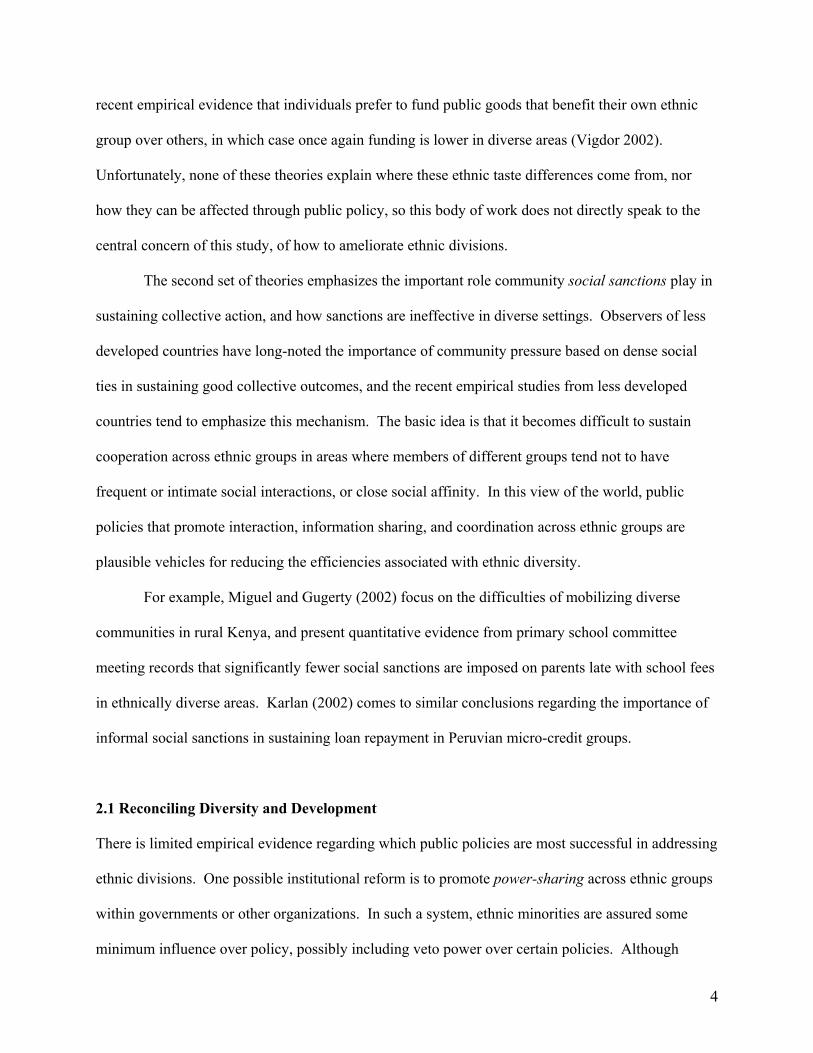
The two districts where I have conducted field work – Busia, Kenya, and Meatu, Tanzania
(Figure 1) – are the sites of field offices for the same non-governmental organization (ICS Africa),
and were originally chosen because they were thought to be poor rural areas in particular need of
development assistance. Although the Tanzanian district is somewhat more arid and less densely
populated than the Kenya district, the two districts are similar along many other important
characteristics. Busia, Kenya and Meatu, Tanzania are located relatively near each other (roughly
400 kilometers apart) on opposite sides of Lake Victoria3, both are overwhelmingly rural and share
similar staple crops (maize, sorghum, and cassava), although most of Meatu, Tanzania only has one
harvest per year while Busia, Kenya has two. The areas were also part of a shared pre-colonial
historical universe, with extensive migration across what is today the Kenya-Tanzania border; the
historian David Schoenbrun (1998: 28) writes of the “profound historical unity of Great Lakes
cultural practices.”
3 The ideal research design should not choose districts literally straddling a common border, since border areas are likely to be strongly influenced by developments in the neighboring country – including attitudes toward ethnic group and nation, potentially – and the existence of these cross-border “spillovers” would complicate the interpretation of outcomes across the regions.
7

The total 1989 population of Busia was 401,658 (Government of Kenya 1994) and the
current population of Meatu is approximately 201,981 (Government of Tanzania 1999). The two
districts have similar ethnic compositions, with majority Niger-Kordofanian (Bantu) populations and
substantial Nilo-Saharan minorities: the dominant Luhya ethnic group comprise nearly 70 percent of
the population in the Kenyan district, while the majority Sukuma group constitute roughly 85 percent
of the population of the Tanzanian district (Government of Tanzania 1999). Armed conflict
associated with cattle raids was common in both areas during the pre-colonial period (Kidamala
1961, Government of Kenya 1986).
Another similarity lies in the realm of language use: unlike many other regions of Tanzania,
Meatu district had minimal cultural and trade ties with Swahili speakers from the East African coast
during the 19th century, so few residents of the area spoke Swahili upon independence in the 1960s
(Abdulaziz 1971). Swahili was not widely spoken in western Kenya during the pre-colonial period
(Gorman 1974).
Moreover, community members play significant roles funding local public goods in both
countries, through school committees and water committees in Kenya (Wilson 1992) and through
Village Councils in Tanzania, so it is possible to compare local fund-raising across the two districts.
Public finance expenditures were increasingly decentralized in Tanzania during the local government
reforms of the 1990s (Therkildsen 2000).
The results of the East African Citizenship Project provide further evidence on
commonalities. The project surveyed representative national samples of schoolchildren in Kenya and
Tanzania in 1966-1967, less than a decade after independence, with a total of over 8,000 respondents.
Nearly identical survey instruments were administered in both countries on politics, citizenship, and
ethnicity, and the results support the claim that political attitudes were extremely similar in Kenya
and Tanzania during that period. In fact, they conclude that “there is an often startling similarity
between the responses given by Kenyan and Tanzanian students. … The cross-national similarities
8
are so constant as to raise questions about the significance of the nation state as a differentiating
variable” (Koff and Von der Muhll 1967: 50).4
Of course, this is not to say that Kenya and Tanzania were identical at independence. Nairobi
was the cosmopolitan capital of British East Africa, with its large and growing industrial base, and
Kenya had experienced a much more violent path toward independence than Tanzania, most
dramatically illustrated in the “Mau Mau” Uprising of the 1950s. Tanzania is also somewhat more
ethnically diverse than Kenya on the whole, although these differences are relatively minor (refer to
Court and Kinyanjui 1980 for further discussion of pre-independence differences). Nonetheless,
many social scientists have taken the fundamental similarity of Kenya and Tanzania as an analytical
starting point, and this paper follows in that tradition.5 Beyond East Africa, other scholars have also
used the colonial-era placement of African national borders as a kind of “natural experiment” which
allows them to evaluate the long-run impact of different policies (e.g., Miles 1994, Posner 2002).
3.2 Post-independence Divergences
Despite the geographical, historical, and institutional commonalities in western Kenya and western
Tanzania discussed above, post-colonial central governments in the two countries have pursued
drastically different public policies toward ethnicity, and I argue that this divergence has had a major
impact on current ethnic relations. In this section, I briefly highlight the main policy divergences.
Part of the divergence can be attributed to the personalities and philosophies of their
respective independence leaders, Jomo Kenyatta and Julius Nyerere. Inspired by a pan-Africanist
and socialist political philosophy, the gifted Tanzanian leader Julius Nyerere forcefully downplayed
the role of ethnic affiliation in public life and instead emphasized a single Tanzanian national
4 The author has acquired the original micro-survey data discussed in Koff and Von der Muhll (1967). One limitation of the dataset is that it does not contain pre-independence information, since nation-building policies had diverged by 1967 (the year of the Arusha Declaration), and it thus cannot serve as a true baseline. 5 Refer to Barkan (1984) and Barkan (1994) for collections of essays on this theme.
9

identity. A founding principle of Nyerere’s ruling TANU political party was “to fight tribalism and
any other factors which would hinder the development of unity among Africans” (Abdulaziz 1980).
National language policy is another area of major differences. Barkan (1994) writes:
The potential for [ethnic] conflict in Tanzania has … been muted by the near universal use of Kiswahili, which replaced English as the country’s official language in the mid-1960s and has evolved its own political idiom, nurturing the development of a national political culture.
Swahili (or “Kiswahili” in East Africa) is an indigenous African language originating on the
Indian Ocean coast of East Africa through contact between Africans and Arab traders, and it is seen
as largely ethnically “neutral” in both countries. The Tanzanian regime quickly pushed for total
“Swahilization” of government administration after independence, and established the National
Swahili Council to promote its use in all spheres of public life (Polome 1980).6
The public school curriculum in Tanzania has been aggressively employed as a nation-
building tool. The curriculum stresses common Tanzanian history, culture, and values, and
inculcates students with a strong sense of national and Pan-African identity (Court 1984). Political
education was included as early as the late 1960s as a standard curriculum subject in both primary
and secondary school, and tested on national exams (Court and Kinyanjui 1980: 67). Moreover, by
the 1970s all future teachers were required to serve in the para-military National Service
organization, which indoctrinated them in the national ideals of the Tanzanian regime (White 1980).
Prewitt, Von der Muhll and Court (1970: 222) asserted that:
Tanzania is unique among African nations in the extent to which it has self-consciously sought to adapt the educational system inherited at independence to the goals of the postcolonial leadership. Its government is currently engaged in an extensive effort to restructure both the educational curriculum and the organization of school life in the hope of producing a deeper commitment to the new social order.
And Von der Muhll (1971: 24) wrote that: 6 Laitin (1992) has discussed the important role of language policy for nation-building in newly independent African states, as well as the existence of lingua francas in other African regions that, like Swahili in East Africa, could potentially serve to promote the construction of stronger national identities.
10

[T]he government has now committed itself, deliberately and unreservedly, to using the schoolroom environment to effect a radical transformation of the social values of those members of the younger generation whose exposure to formal education has equipped them to play some part in the life of the national community. … The project currently enjoys a public saliency rarely accorded political education.
The nation-building role of the central government in Kenya could not be more different.
Both post-independence presidents, Jomo Kenyatta and Daniel arap Moi, are perceived as “tribalists”
within Kenya, as political opportunists who have thrived on the politics of ethnic division. Ethnicity
has become the primary cleavage of political life in Kenya – as in many other African countries –
and the current regime was widely implicated in arming and financing violent ethnic militias before
national elections in 1992 and 1997, fomenting ethnic clashes that left hundreds dead (Ndegwa
1997). Violence in Nairobi’s Kibera slums and elsewhere in the run-up to the 2002 national elections
is following a similar pattern.
In terms of language policy, although Swahili has long been widely spoken in Kenya as a
lingua franca, it competes with English and “vernacular” languages (Kikuyu, Luhya, Luo, and others)
in official settings, including political forums and schools. For example, local vernaculars – rather
than Swahili – typically serve as the medium of primary school instruction through the fourth grade,
while after fourth grade English is the principal language.
Though official Ministry of Education nation-building pronouncements were similar in
Kenya and Tanzania in the 1960s (Koff and Von der Muhll 1967), Court and Ghai (1974: 7)
observed that these were merely “vague invocations” in Kenya and “there [was] little evidence
within schools that the rhetoric [was] followed by any serious attempts to make real changes” (p. 19).
Nearly twenty years after independence, Court and Kinyanjui (1980: 69) concluded that “Tanzanian
students have a stronger sense of national identity than their Kenyan counterparts.”
Unlike Tanzania, the central government in Kenya has not used the primary school
curriculum to promote a coherent national linguistic or ideological identity: the official Kenyan
11

Geography, History, and Civics (GHC) curriculum does not study Kenya as a nation until grade 5,
instead focusing on “the Village”, “the Division” (an administrative unit), “the District”, and “the
Province” in grades 1 through 4, respectively. This focus on provincial geography and history
probably serves to exacerbate regional and ethnic divisions, especially among the many Kenyans
who drop out of primary school before grade 5, and thus never study national history in detail.7
Another important component of the reform package carried out during the Tanzanian
socialist period was the complete overhaul of local government institutions with the aim of
strengthening local Village Councils and District Councils, unlike Kenya, where the colonial-era
system of centrally-appointed tribal chiefs was retained. Kenya has no local government institution
comparable in either authority or legitimacy to the elected Tanzanian Village Council. In fact, Kenya
and Tanzania, respectively, fit neatly into the typology of “conservative” and “radical” post-
independence African states developed in Mamdani (1996: 25). In Tanzania, traditional rural
authorities and customary tribal law inherited from the colonial period were completely dismantled
upon independence, and this may have played a role in further diminishing the role of ethnicity in
Tanzanian public life relative to Kenya, where tribal chiefs remained in office.
Finally, the national distribution of central government resources – for education, health, and
infrastructure – has served to politicize ethnicity to a far greater extent in Kenya than in Tanzania.
The equitable regional distribution of national public investment was a centerpiece of Tanzanian
socialist policies since the 1960s (Court and Kinyanjui 1980). The post-independence regime in
Kenya was much less aggressive in confronting inherited colonial regional imbalances, and heavily
favored the ethnically Kikuyu areas that formed the core of Kenyatta’s political support. Since 1978,
7 Quantitative evidence from school books also suggests that the Kenyan curriculum is still considerably less pan-Africanist in orientation than the Tanzanian curriculum. As a rough measure of curricular emphasis on Africa and broader African issues, the author counted the number of times the word “Africa” (or “African”) appears in current Kenyan and Tanzanian GHC primary school textbooks for grades 3 through 6, and found more than twice as many mentions of Africa in the Tanzanian textbooks (66.5 times per textbook) than in the Kenyan books (28.6 times). The result also holds if we control for the number of pages per textbook. We examined four current Tanzanian GHC textbooks and five Kenyan GHC textbooks. The author thanks Negar Ghobadi for excellent research assistance.
12

favoritism toward ruling party areas continued, but shifted to reflect Moi’s new ruling coalition
centered in the Rift Valley, as documented by Barkan and Chege (1989), further contributing to the
political salience of regional and ethnic identities within Kenya.
Taken together, the pan-Africanist ideology of Julius Nyerere, the promotion of Swahili as a
national language, the aggressive political and civic education in schools, the dismantling of tribal
authorities, and the relatively equal regional distribution of resources contributed to the growing
salience of a coherent and popular Tanzanian national identity, which binds Tanzanians together
across ethnic lines.
The recent Afro-Barometer public opinion surveys conducted among representative adult
samples in twelve countries during 1999-2001 (although not in Kenya, unfortunately) provides
further evidence that popular notions of ethnic and national identity in Tanzania are in fact radically
different than those found in other African countries (Afro-Barometer 2002).8 When asked the open-
ended question “Which specific group do you feel you belong to first and foremost”, only three
percent of Tanzanians responded in terms of an ethnic, language or tribal affiliation, the lowest of the
twelve countries in the sample with the exception of small and relatively homogeneous Lesotho (at
two percent). Instead, 76 percent of Tanzanians answered in terms of an occupational category (e.g.,
farmer). This low rate of attachment to ethnic identity stands in sharp contrast to other countries –
Nigeria (48 percent), Namibia (46 percent), Mali (39 percent), Malawi (38 percent), and Zimbabwe
(36 percent) – where, as in Kenya, ethnic divisions have been politicized during the post-
independence period. Moreover, over 90 percent of people in Tanzania claim they are “proud” to be
called Tanzanian.9 Chaligha et al (2002: 11) conclude that:
President Nyerere’s efforts to mould a national identity (for example, by emphasizing Kiswahili and abolishing traditional rule) have borne fruit. The survey certainly provides
8 The twelve mainly Anglophone African countries are Botswana, Ghana, Lesotho, Malawi, Mali, Namibia, Nigeria, South Africa, Tanzania, Uganda, Zambia, and Zimbabwe. 9 Tanzanians also show among the highest levels of support for democracy, confidence in government institutions, and trust in their fellow citizens among the twelve countries surveyed (Chaligha et al 2002).
13

evidence of a consensual, shared national identity, even in Zanzibar. If Tanzania was once an artificial construct of colonial mapmakers, it is no more. … [T]he extent of common perception of nationhood and the lack of ethnic considerations in politics is an important reason that Tanzania has been one of the most politically stable countries in the region.
These findings link closely with the existing theories of diversity and collective action
surveyed above. First, as the broader Tanzanian identity becomes increasingly attractive and
particular ethnic identities lose salience, the “taste” theories become less important, since individuals
increasingly identify with all of their fellow citizens rather than just their own tribe, and are thus
willing to fund public goods that benefit “other” groups. To the extent that nation-building policies
also increase informal inter-ethnic social interactions – in schools, village council meetings, other
civic gatherings, or community groups – this could also increase the scope for stronger “social
sanctions” across ethnic groups, reducing free-riding and improving local collective action outcomes.
4. Data and Methods
4.1 Data from Busia, Kenya
Jointly with Mary Kay Gugerty, the author has estimated the impact of ethnic diversity on local
public good outcomes in a rural Kenyan district in previous work (Miguel and Gugerty 2002), and
some of the data and methods in that paper are discussed below.
Detailed data for 100 of the 337 rural primary schools in Busia and Teso districts were
collected from pupil, school, and teacher questionnaires in early 1996 as baseline information for a
non-governmental organization (ICS Africa) School Assistance Project (SAP).10, 11 Busia primary
schools are typical for Kenya in terms of educational attainment: the district ranked twenty-sixth of
fifty districts on 1995 national primary school exams (Glewwe, Kremer, and Moulin 1998). The
non-governmental organization (NGO) that collaborated on the data project collected a variety of 10 Refer to Miguel and Gugerty (2002) for information on which schools were chosen for the sample. 11 In 1996, the original Busia district was split in two: Teso district is the northern part of the original Busia district, and Busia district is the southern part. I refer to the combined area as “Busia” for simplicity from now on.
14

financial and demographic data for these schools in 1996. The pupil questionnaire focused on pupil
schooling background, family educational characteristics and asset ownership, and self-described
ethnic affiliation, and was administered by trained survey enumerators to all grade six through eight
pupils present on the day of questionnaire administration. In total, 100 school questionnaires and 861
teacher questionnaires were also administered in 1996.12 The Busia District Education Office
provided school examination results and exam name lists. NGO enumerators used portable Global
Positioning System (GPS) machines to collect latitude and longitude for all primary schools and
water wells in the sample. The analysis below includes the eighty-four of 100 schools with complete
pupil, school, teacher, GPS data, and school committee records.13
Ethno-linguistic fractionalization (ELF) is used as the principal empirical measure of ethnic
diversity in this study, mainly because this measure has the advantage of comparability with the
existing literature (Mauro 1995, Easterly and Levine 1997, and Alesina et al 1999).14 Ethno-
linguistic fractionalization is the probability two people randomly drawn from the population are
from distinct groups, and is closely related to a Herfindahl index. Formally,
(1) ELF ≡ 1 – ∑i (Proportion of group i)2
In Kenya, the principal measure of “local” ethnic diversity for a primary school is computed
among all pupils attending primary schools located within five kilometers of the school in question.
The five kilometer radius around each school appears to be a rough upper limit on the distance that
people may walk to attend school or fetch water on a daily basis, and thus on what may constitute a
“community”, although the empirical results are robust to radiuses of between three to six kilometers
12 School questionnaires – filled by schoolmasters with the assistance of a trained enumerator – contain detailed information on school finances, infrastructure, inputs, and pupil enrollment. Teacher questionnaires focus on teacher qualifications, and were completed by the teachers themselves. 13 This dataset is available from the author upon request. 14 Vigdor (2001) derives the fractionalization index from a simple model of “directed altruism”.
15

(results not shown). These data were created from 1996 government examination name lists
provided by the Busia District Education Office, together with GPS data.
4.1.1 Primary School Organization and Funding
Both the central government and local school committees play important roles in Kenyan primary
school finance. The national Kenya Ministry of Education pays teacher salaries, while school
committees raise funds locally for desks, classrooms, books, and chalk. Although the teacher salaries
and benefits paid by the central government account for most primary school spending –
approximately 90 percent of total primary school spending – a reduction in local funding could have
an important impact on educational outcomes to the extent local inputs and teachers are complements
in educational production.
Each primary school is managed by its own school committee. Parents raise the bulk of
local school funds through two mechanisms: school fees and local fundraising events. Annual school
fees are set by the school committee and collected by the school headmaster. The school committee
is composed of class representatives directly elected by parents of schoolchildren, and typically
meets several times per year to discuss school finances and projects.
The other important source of local primary school funding in western Kenya, accounting for
approximately one-third of local funding, are village fundraisers called harambees in Swahili. At
these events parents and other community members meet and publicly pledge financial support for a
school project, such as the construction of a classroom. Harambees are major local events; planning a
harambee requires a great deal of effort on the part of the school committee and all parents and
members of the local community are expected to attend. While contributions at these events are
supposedly voluntary, school committees often announce expected harambee contributions for
parents, and individual contributions are recorded by the school committee. Harambees are an
16

important source of local public finance throughout Kenya, accounting for 40 percent of total local
primary school expenditures, well maintenance, and other public goods according to Wilson (1992).
The main school finance outcome for Kenya is total local school funding collected per pupil
in 1995. School facilities and inputs – the number of desks per pupil, latrines per pupil, and
classrooms per pupil in 1996 – are other school outcome measures.
4.1.2 Community Water Wells
Water wells are another important local public good in rural East Africa, since well water is generally
safer to drink than alternative water sources, such as stream or lake water, and the lack of safe
drinking water is a major public health problem that contributes to the spread of water-borne diseases
including schistosomiasis, amebiasis, cholera, and other infections (Government of Kenya 1986).
The vast majority of community wells in western Kenya were constructed in 1982-1991 with
the assistance of the Finnish government, through an organization called the Kenya-Finland
Development Cooperation (KEFINCO). KEFINCO identified well sites in cooperation with local
communities, dug the original boreholes, and provided the equipment required to operate the wells.
Communities were responsible for forming well committees in charge of maintenance and collecting
usage and repair fees from the community. The committees operate on a voluntary basis with little
explicit public authority for revenue collection, so their ability to collect fees largely depends on their
success in exerting social pressure in the local community.
The data on well maintenance comes from a survey of nearly 700 wells conducted in Kenya
from October 2000 to August 2001 by NGO field workers. The sample consists of the universe of
modern borehole wells constructed in both districts from 1982-1991 by KEFINCO. The current
condition of the KEFINCO wells thus reflects the success of local collective action in maintenance
17

from the 1980s through 2001.15 The survey collected detailed information on the physical condition
of the wells, as well as GPS locations. The principal dependent variable for well maintenance is an
indicator variable that takes on a value of one if water flow in the well was judged to be “normal” by
field workers, and zero if either no water flows from the well or if the water flow is “very low”.
Only fifty-seven percent of the wells had “normal” water flow at the time of the survey, suggesting
widespread collective action failures, echoing an existing Kenyan government report (Community
Water Supply Management Project 2000).
In the empirical analysis for Kenya, the unit of observation is a “primary school community”,
and we consider all wells within 5 kilometers of the school (using GPS locations) as wells “assigned
to” that primary school. This is necessary in order to pool the results from both the primary school
and water well regressions and perform joint tests across collective action outcomes, as described
below. Unlike Tanzania, rural western Kenya does not have coherent villages with fixed boundaries,
and for this reason the Kenya analysis focuses on schools. In practice, this is likely to result in a
noisier measure of local ethnic diversity for a particular well, as discussed below.
4.2 Data from Meatu, Tanzania
Data collection for two survey instruments, the Village Council Survey and the Household Survey,
was carried out in Meatu, Tanzania in two waves from August 2001 to August 2002 by ICS Africa
field staff, with the cooperation of Meatu District Council government authorities. The surveys were
designed to be largely comparable with existing survey data from Kenya, but considerable additional
information was also collected.
The Village Council Survey was administered in all 71 villages, and has resulted in a unique
village-level public finance dataset in a rural African setting. We relied both on interviews with
15 Unfortunately, we were unable to obtain data on the precise year of construction for each well, and so cannot control for this variable in the analysis below.
18
Village Council members and on local administrative records – especially the Village Tax Register –
for the survey data. Tax registers are universally available and of reasonably consistent quality in the
area. Specifically, we collected retrospective information on all village public good projects –
including schools, water, roads, and health clinic projects – by year from 1997 to 2002, including
funds collected from community members as well as outside funding from other government
agencies or NGOs. Field workers also observed the current condition of school, water, road, and
health clinic infrastructure; recorded total village population from village records; and determined
village ethnic composition (with the assistance of village officials), by assigning ethnic affiliation to
all individuals in a 20 percent random sample of the Tax Register. The Tax Register includes all
village adult males; unfortunately there is no comparable data for females.
We collected information on social capital measures, including local community groups and
attendance at Village Meetings during 2001. Village meeting attendance is constructed as the sum of
attendance at all meetings in 2001, divided by the number of households in the village. Village
meetings are held for some local elections, to discuss development project planning, and to
disseminate information from higher levels of government, for example, recently on HIV/AIDS
awareness. We also gathered information on village historical and political characteristics, some of
which are described below. Due to logistical problems in the field, five villages are missing data for
at least some survey component, reducing the sample to 66 villages.
The 2001-2002 Household Surveys were administered to approximately 15-20 households
from each village in Meatu District. Households were randomly chosen from the Tax Register to be
surveyed, and neighbors of the Register households were also randomly selected, in order to obtain a
reasonably representative sample. In all, 1293 households were surveyed in 2001.16 The Household
Survey included detailed socioeconomic, migration, and demographic questions, and a consumption
16 Additional Household Surveys were conducted in 2002 but these data have not yet been fully processed for analysis. The 2002 Household Survey results will be included in future versions of this paper.
19

expenditure module for a subset of households, and the resulting dataset allows us to construct
average village living standards, asset ownership, and demographic characteristics.
4.3 Identifying Ethnic Diversity Effects
There are two steps in the econometric identification strategy. First, we estimate the impact of local
ethnic diversity on local collective action outcomes in both Kenya and Tanzania (Sections 4.3 and
4.4). Second, we argue that the differences observed across the two districts, in terms of the impact
of ethnic diversity on local outcomes, is most likely caused by divergent central government nation-
building policies, rather than other causes (Section 4.5).
4.3.1 Ethnic Diversity in Kenya
In order to credibly estimate the relationship between diversity and local collective action outcomes,
we must rule out the possibility that local unobservable characteristics correlated with ethnic
diversity in each district – rather than ethnic diversity itself – are in fact driving the estimated effects.
Busia and Teso districts in Kenya are moderately ethnically diverse: the largest ethnic groups
are the Luhya (67 percent of the sample), Teso (26 percent), and Luo (5 percent). The Luo and Teso
are Nilo-Saharan ethno-linguistic groups with pastoralist traditions, and the Luhya are a Bantu
(Niger-Kordofanian) group. Luhyas are the majority ethnic group in sourthern Busia district and
Tesos are numerically dominant in northern Busia district, although there are significant minority
communities throughout the area.
The exogeneity of ethnic land settlement patterns in Busia district forms a basis for the
empirical identification strategy within Kenya. A variety of evidence suggests that current levels of
local ethnic diversity in Busia district is largely the product of historical accident rather than recent
migration. “The nineteenth century was a time of considerable unrest throughout the District, with
20

conflict between the Luhya groups, Luo, Teso and Kalenjin” (Government of Kenya 1986). Were
(1967) writes that “various factors - famine, epidemics, domestic disputes, the spirit of adventure
and warfare – made the inhabitants of the region extremely mobile” from the 17th to 19th centuries,
when various Nilo-Saharan ethnic groups migrated to western Kenya from present-day Uganda.
Successive waves of Teso and Luo migration, and the resulting wars with established Luhya
communities largely determined ethnic residential patterns in the area.
The emergence of British colonial authority in western Kenya in 1894 ended wars and cattle
raiding, as well as the population movements that accompanied them. Morgan et al. (1966) writes
that ethnic land claims were “frozen by the Colonial Government by the demarcation of ‘African
Land Units.’ This prevented the expansion of tribes into another’s territory and thus eliminated the
principal source of major inter-tribal wars. ... Within the African areas the indigenous pattern of
‘water-tight’ units was maintained, but accentuated by the increasing population.” Land demarcation
and individual land registration during the post-colonial period “has frozen the previously fluid
situation and virtually halted the traditional mobility” (Government of Kenya 1986). Busia was free
of European settlement – and resulting disruptions of land claims – during the colonial period.17
Comparing residential ethnic composition at the geographic division level in 1996, using
pupil survey data, to residential composition in 1962 using Kenyan Census data (Government of
Kenya 1965) suggests that ethnic residence patterns have been largely stable: the ordering of
residential ethnic diversity across geographic divisions, measured by the size of the largest ethnic
group is identical in 1962 and 1996 (results not shown). Recent survey evidence also suggests that
land sales and residential mobility are extremely rare in Busia (Miguel and Gugerty 2002).
Residential mobility is low in rural Kenya for a variety of reasons, including the fact that local land
17 The use of historically determined ethnic settlement patterns in Miguel and Gugerty (2002) to estimate the impact of local ethnic diversity on public good provision in Kenya constitutes an improvement over recent estimates of the impact of ethnic diversity from the United States (Alesina et al 1999): the high rate of residential mobility observed in the United States complicates the interpretation of coefficient estimates on ethnic diversity, since unobserved aspects of school quality or individuals’ taste for education may be correlated with local ethnic composition.
21

markets are thin, as in much of Sub-Saharan Africa, and because approval from relatives is required
de facto to sell traditional family land (Platteau 2000).
Although residential patterns in this area are stable, households can choose which local
primary school their children will attend and which water well they will use, creating endogenous
school populations and water users. Local sorting is an important issue in this context: evidence
from a parent survey indicates that nearly one quarter of all households send a child to a primary
school that is not the nearest to their home. In order to avoid biases due to endogenous sorting among
schools and wells within walking distance of the household, we employ local ethnic diversity within
5 kilometers of each school as our principal measure of local ethnic diversity in the Kenya analysis,
rather than the ethnic diversity of actual school pupils or water users.
Endogenous local sorting is less salient in Meatu, Tanzania where individuals live in coherent
and separate villages and where population density is lower, and hence households generally have
fewer schools and wells to choose from.
4.3.2 Ethnic Diversity in Tanzania
An empirical methodology similar to that used in the Busia, Kenya analysis is used to estimate the
relationship between local ethnic diversity and public good provision in Meatu, Tanzania. As in
Kenya, understanding patterns of ethnic land settlement is central to the econometric identification
strategy. Meatu district was relatively sparsely populated until the mid-20th century, after which
increasing numbers of individuals from neighboring areas migrated there in search of additional
farmland, so unfortunately, unlike Busia, Kenya, there is no compelling migration “natural
experiment” that can be used to identify ethnic diversity effects in Meatu, Tanzania.
Yet the relative stability of residential patterns helps rule out the most obvious forms of
recent sorting in response to socioeconomic or public finance variation. There was local migration
associated with the forced villagization program of the mid-1970s (which is described in more detail
22

below), but villagization per se did not significantly alter local ethnic settlement patterns since
individuals seldom moved more than five miles from their original homes (Mwapachu 1975).
Stringent residency regulations during the Socialist period further dampened migration, and, as in
rural Kenya, the absence of a well-functioning land market currently contributes to low rates of
residential mobility.
Quantitative evidence from the Household Survey also indicates that local residential patterns
have in fact been largely stable in Meatu since the mid-1970s. To illustrate, over 80 percent of the
young adult (under 30 years) male respondents in the sample have been living in the same village for
at least the past ten years.18 As a further check, rates of residential stability over the past ten years for
young adult males are also nearly identical in relatively high ethnic diversity (ELF > 0.15) and low
diversity (ELF ≤ 0.15) villages, at 80 and 83 percent, respectively.
Moreover, to the extent that there is endogenous sorting in Meatu, Tanzania, the sorting bias
would most likely be negative. There is a widespread perception in Meatu that ethnically diverse
areas – mainly in Nyalanja division – are marginalized and have poor quality land, perhaps because
members of the dominant Sukuma group secured better areas during the in-migration waves of the
mid-20th century. The unconditional correlation between village per capita income and ethnic
diversity is negative in Meatu (although not statistically significant), which is consistent with this
perception. To the extent that land quality is unobserved, and is not entirely captured by our other
socio-economic controls, this would negatively bias our estimates of ethnic diversity effects in
Meatu, Tanzania, and so the resulting estimates would be lower bounds on actual diversity effects.
These arguments cannot definitively resolve the potential problem of omitted variable bias,
and this remains an important limitation of the identification strategy for Meatu, Tanzania. Still,
18 It is natural to focus on male residential stability in this context, since marital exogamy is practiced in this region and thus most women move in with their husband’s family upon marriage.
23
there are no compelling stories of positive sorting bias, it turns out this is sufficient in our case since
ethnic diversity effect estimates in Tanzania tend to be near zero, as discussed below.
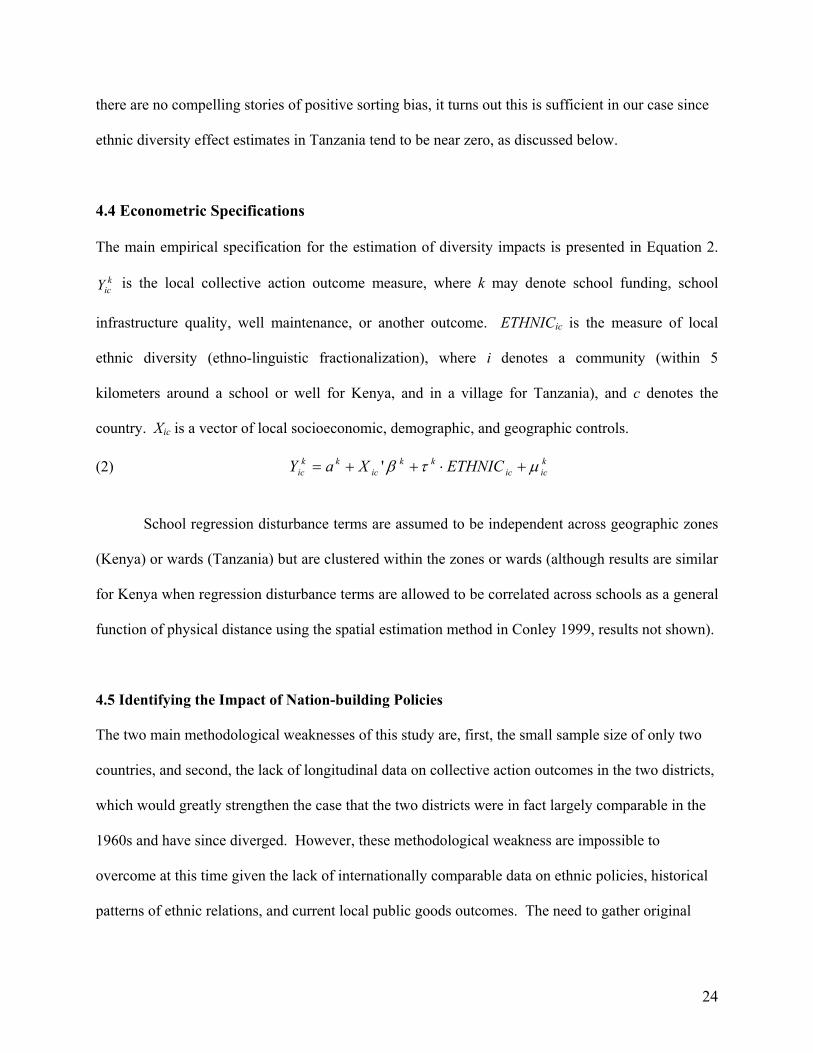
4.4 Econometric Specifications
The main empirical specification for the estimation of diversity impacts is presented in Equation 2.
is the local collective action outcome measure, where k may denote school funding, school
infrastructure quality, well maintenance, or another outcome. ETHNIC
kicY
ic is the measure of local
ethnic diversity (ethno-linguistic fractionalization), where i denotes a community (within 5
kilometers around a school or well for Kenya, and in a village for Tanzania), and c denotes the
country. Xic is a vector of local socioeconomic, demographic, and geographic controls.
(2) Y kicic
kkic
kkic ETHNICXa µτβ +⋅++= '
School regression disturbance terms are assumed to be independent across geographic zones
(Kenya) or wards (Tanzania) but are clustered within the zones or wards (although results are similar
for Kenya when regression disturbance terms are allowed to be correlated across schools as a general
function of physical distance using the spatial estimation method in Conley 1999, results not shown).
4.5 Identifying the Impact of Nation-building Policies
The two main methodological weaknesses of this study are, first, the small sample size of only two
countries, and second, the lack of longitudinal data on collective action outcomes in the two districts,
which would greatly strengthen the case that the two districts were in fact largely comparable in the
1960s and have since diverged. However, these methodological weakness are impossible to
overcome at this time given the lack of internationally comparable data on ethnic policies, historical
patterns of ethnic relations, and current local public goods outcomes. The need to gather original
24

data on these issues through field surveys limited the number of countries that could be examined in
the current study.
Another central identification concern is that pre-existing ethnic relations in Busia, Kenya
and Meatu, Tanzania endogenously affected the nation-building policies that were chosen, such that
causality actually runs from ethnic cooperation to nation-building, rather than vice versa. Although
the nation-building policies chosen in Kenya and Tanzania, as well as the characteristics of post-
independence leaders, may indeed have been related to the nature of ethnic relations at the national
level in both countries, all that is necessary for a valid comparison of the impact of nation-building
policies in Busia, Kenya and Meatu, Tanzania is that the choice of national policies was not directly
related to ethnic relations in these two small and politically marginal districts, which is plausible.
An important limitation of the study is the inability to separately estimate the effects of
various components of the Tanzanian nation-building package – in language, education, national
politics, and local institutional reform – on ethnic relations and local collective action. These
components may in principle interact in complex and multiple ways, and we are entirely unable to
estimate these interactions in this study. Instead, the estimated effects presented below should be
seen as the reduced-form impact of the entire Tanzanian reform package on local collective action,
relative to Kenyan policies.
A reading of the recent history of western Kenya and western Tanzania indicates that
differences in current levels of inter-ethnic cooperation across Busia, Kenya and Meatu, Tanzania are
most likely to be due to their strikingly different nation-building policies during the post-colonial
period, rather than due to divergent economic policies, or to other factors.
The period of most sustained public policy divergences between Busia, Kenya and Meatu,
Tanzania occurred during the mid-1970s: from August 1974 through 1977, the Shinyanga regional
government pursued a policy of “forced villagization”, in which over 340,000 rural residents were
compelled to leave their homes and move to nearby villages, sometimes by force – including the
25

burning of resistors’ homes (Mwapachu 1975). The centerpiece of Tanzanian rural socialism was the
goal of concentrating Tanzania’s scattered populations into “Ujamaa” villages, where the
government could, in theory, more efficiently provide public services, like education and health care,
and where collectivized farming would take place (McHenry 1979). Village Council survey
evidence indicates that two-thirds of the villages in our sample were created during this brief three
year period. Nationally during this period of radical economic reform, Tanzanian economic growth
rates lagged far behind Kenyan rates (Barkan 1994).
However, if anything, the policies of the Ujamaa period appear likely to have enflamed
ethnic tensions, rather than promoting cooperation: the non-Bantu Taturu and Hadzabe minority
groups in the area were particularly hard-hit by forced villagization, since it contributed to the
erosion of their traditional semi-nomadic lifestyles. To the extent that ethnic relations are currently
better in western Tanzania than in western Kenya, it is unlikely to be due to the arbitrary and violent
villagization policies – and anemic economic growth – of the Ujamaa period.
In the aftermath of Ujamaa, the economic policies of Kenya and Tanzania since the financial
crises of 1982 have been largely parallel: “There were strong similarities in the nature of and
responses to the crisis in each country … [and] the ongoing efforts at economic reform and structural
adjustment in both countries are similar in many respects, [as] they are both spearheaded by
International Monetary Fund (IMF) and World Bank programs” (Ndulu and Mwega 1994). Joel
Barkan (1994) also documents the broad convergence of economic development strategies and
outcomes in Kenya and Tanzania since the 1980s.19
19 An alternative explanation for the existence of a stronger national identity in Tanzania could be the successful 1979 war repelling a Ugandan invasion of northwestern Tanzania. Victorious wars have long been credited with promoting national unity (for the British case, refer to Colley 1992). However, this hypothesis appears unlikely for at least two reasons. First, the Uganda war was brief, lasting only three months, leaving little time for wartime struggles against a common foe to serve as “the essential crucible of the nation” (Castles et al 1992). Second, although the war that began as an effort to stop Idi Amin’s marauding army, it became an exhausting six-year occupation of Uganda that nearly bankrupted the Tanzanian budget, contributing to the financial crisis of 1982 – not an outcome that generated lasting national pride (Gordon 1994).
26

4.5.1 Econometric Estimation Equation
Equation 3 presents the empirical estimation framework for the cross-district comparison, where
notation is as in equation 2 above. Data points are pooled from both countries in this specification.
An indicator variable (KENYAic) is included for Kenyan communities to capture any average
differences in levels across the two districts.
(3) kicic
kkkic XKENYAaaY β'21 +⋅+=
{ } kicicic
kic
k KENYAETHNICETHNIC µττ +⋅+⋅+ *21
The coefficient estimate of captures the impact of ethnic diversity on local outcomes in Tanzania
for outcome k, while + is the effect in Kenya. The main hypothesis of this paper can be re-
stated as H
k1τ
k2τk
1τ
0: = 0, jointly for all outcomes k. Rejecting this hypothesis is equivalent to finding that
ethnic diversity has significantly different effects on local collective action in Busia, Kenya and in
Meatu, Tanzania.
k2τ
The existence of multiple collective action outcomes provides additional statistical power to
reject the hypothesis that the impact of diversity is the same in the two districts. Collective action
outcomes for a given village are only imperfectly correlated due to various idiosyncratic factors,
including the competence of local officials and the school headmaster, for instance. To illustrate, the
correlation between desks per pupil and classrooms per pupil in Busia, Kenya is approximately 0.4,
while the correlation between school funding per pupil and the quality of well maintenance is only
0.1, and similar patterns hold in Meatu, Tanzania. So the confidence interval around the estimated
impact of ethnic diversity when data is pooled across collective action outcomes is considerably
narrower than the interval for any single outcome.
Two methods are used to pool data across outcomes and produce an overall estimate of the
impact of ethnic diversity on local collective action. The first method is seemingly unrelated
27

regression (SUR), in which each regression is estimated separately, but disturbance terms are allowed
to be correlated across outcome measures for the same village (or school) during hypothesis testing.
This method uses information from multiple dependent variables to test whether the effect of ethnic
diversity local public goods differs across Busia, Kenya and Meatu, Tanzania overall.20
The second, related, method is a specification that literally pools data across collective action
outcomes, imposing common coefficient estimates and error structure. Regression disturbance are
allowed to be correlated (clustered) across the various collective action outcomes for each village
(Tanzania) or school community (Kenya), since common unobserved influences may affect different
outcomes. In order to have comparability across different outcomes – e.g., school funding per pupil
and the proportion of functioning water wells, which are measured in different units – collective
action outcomes are normalized (within each district), such that they are mean zero and standard
deviation one, and then the data are “stacked”. This comes at the cost of making coefficient
estimates more difficult to interpret, and imposing a single regression framework may lead to
specification errors, and thus this approach is less attractive than the SUR method described above.
5. Empirical Results from Western Kenya and Western Tanzania
5.1 Descriptive Statistics
Average levels of local ethnic diversity are similar in the two districts, although somewhat higher in
the Kenyan district: the average level of ELF in Busia, Kenya is 0.23 and in Meatu, Tanzania 0.15
(Table 1, Panel A). Nonetheless the supports of the two local ELF distributions are nearly identical,
ranging from zero to 0.6, and there is considerable variation in local ethnic diversity in both districts.
In terms of local public goods, school fundraising levels are somewhat higher in Meatu,
Tanzania, but the quality of school infrastructure in Busia, Kenya is considerably better. For
20 Since the set of explanatory variables is the same across outcome measures, SUR coefficient estimates are identical to OLS. The advantage of SUR lies in allowing us to perform joint hypothesis tests across regressions.
28

example, while there are only 0.013 classrooms per pupil in Tanzania, there are 0.031 classrooms per
pupil in Kenya and there are also large differences in the provision of latrines and in the pupil-teacher
ratio across the two districts, with Kenya consistently having better quality infrastructure. This
indicates that it will be important to include a regression term (the KENYA indicator variable
discussed above) that controls for levels differences across districts. The proportion of wells with
“normal water flow” is very low and nearly identical, at 57 percent in Meatu, Tanzania and 56
percent in Busia, Kenya, suggesting pervasive local collective action failures in both districts.
Busia, Kenya is similar to Meatu, Tanzania along some socioeconomic characteristics –
including the proportion of homes with iron roofs, livestock ownership, and the proportion of
households that grow a cash crop – but is consistently better-off along several others. For example,
both average educational attainment and the proportion of respondents with formal sector
employment are substantially higher in Busia, Kenya than in Meatu, Tanzania.21 These
socioeconomic characteristics, as well as the proportion of Catholic households, are included in all
regression specifications as control variables.22
Table 1, Panel B presents data that exist only for the Tanzanian district, including average
total annual expenditures on local public finance projects. Information on the cost of different types
of local public projects was provided by the Meatu District Council and the Dutch Rural
21 These differences are potentially somewhat misleading for the following reason: the Kenyan data reported in Table 1, Panel A is for pupils’ fathers. However, even though most respondents in the Tanzanian survey were also male (two-thirds) and respondents tended to be young adults – and thus comparable to the Kenyan data – a minority of Tanzanian respondents were women or elderly. Women and the elderly have lower educational attainment and less formal sector employment on average, compared to young men, and thus the actual socioeconomic gaps between the two districts are likely to be somewhat smaller than those reported in Table 1. 22 Religious diversity is not included as an explanatory variable in the analysis since local religious affiliation is not plausibly exogenous due to extensive missionary activity in both districts during the past fifty years. A negative correlation between religious fragmentation and local outcomes would be misleading if evangelical activity is targeted to, and is most successful in, the poorest areas or areas with low levels of social capital, for example. The numerical strength of “traditional” religions in Meatu – over 60 percent of the household sample – also complicates the interpretation of the religious fragmentation index, since it is difficult to distinguish between different traditional belief systems and to disentangle these religious differences from ethnic identity. Finally, since the most salient religious cleavage in East Africa is that between Christians and Muslims, the absence of large Muslim populations in these districts blunts the most likely religious divisions.
29

Development Programme. Each village funded 8.65 USD worth of local public finance projects per
household per year on average from 1997 to 2002, and there was considerable variation across
villages in these funding levels (standard deviation 6.39 USD). Most of this funding was spent on
education, health, and water projects. Villages complete only 0.67 local projects per year, so roughly
four projects per village on average in the six years of survey data.
The information on actual 2001 tax collection per household indicates that only a fraction of
total local public goods contributions are in cash while the remaining contributions are often in kind,
usually in materials and labor. In addition, some funding for local projects in Tanzania comes in the
form of assistance from the Meatu District Council (MDC) or other Tanzanian government agencies
(e.g., the Tanzanian Social Action Fund, TASAF) or non-governmental organizations (NGOs). This
assistance is typically structured as “cost-sharing”: the MDC or TASAF provide partial assistance for
classroom construction, provided that the Village Council raises at least a certain portion of the funds
from the local community. NGO’s also often follow such cost-sharing policies both in Meatu,
Tanzania and in Busia, Kenya.
Thus, in both western Kenya and western Tanzania the bulk of funding, materials, and labor
for local public goods is raised locally, but with some degree of outside assistance. The public
finance outcomes described in this paper thus capture both the ability of communities to raise funds
and supplies locally, as well as their ability to secure funds from outside donors, and both of these are
important collective action outcomes in their own right.
5.2 Ethnic Diversity and Local Collective Action Outcomes in Kenya and Tanzania
The two key terms in Table 2 are the coefficient estimate on the ELF*KENYA interaction term,
which is the difference between the impact of ethnic diversity on the public goods outcome in Kenya
versus Tanzania, and the coefficient estimate on local ethnic diversity (ELF), which can be
30

interpreted as the relationship between ethnic diversity and the local public goods outcome in
Tanzania. The sum of these two coefficient estimates is the impact of ethnic diversity in Kenya.
The estimated relationship between ethnic diversity and local public goods provision in
Busia, Kenya – the sum of the coefficient estimates on the ELF and ELF*KENYA terms – is negative
for all five local public goods outcomes on which there is data for both countries (local primary
school funding per pupil, desks per pupil, latrines per pupil, classrooms per pupil, and the proportion
of water wells with normal water flow), and statistically significantly different than zero for desks
per pupil. The desks per pupil result implies that the change from ethnic homogeneity to average
levels of diversity in Busia, Kenya is associated with a drop of approximately 40 percent in average
desks per pupil – a large effect – while the estimated effect for Meatu, Tanzania is small, positive and
statistically insignificant. Figure 2 graphically presents the negative relationship between ethnic
diversity versus local school funding in Busia, Kenya, and Figure 3 presents the negative relationship
between diversity and desks per pupil.
One important difference between the results in Table 2 and those in Miguel and Gugerty
(2002) is the econometric specification used to estimate the impact of local ethnic diversity on well
maintenance. In Miguel and Gugerty (2002), each water well is considered a separate data point, and
an ethnic diversity measure specific to that well (typically diversity within 5 kilometers of the well)
is constructed. By way of contrast, in Table 2 we examine well maintenance within 5 kilometers of
each primary school in the sample, and consider the local ethnic diversity of that primary school as
the key explanatory variable. This school diversity measure is thus a noisy measure of the ethnic
diversity of each well located within 5 kilometers of the school, and resulting attenuation bias in the
coefficient estimate on ethnic diversity is the most likely explanation why the well results in Table 2
are weaker than those in Miguel and Gugerty (2002). In Miguel and Gugerty (2002), the comparable
coefficient estimate on local ethnic diversity is –0.26 (standard error 0.14, statistically significant at
over 90 percent confidence).
31

For all four primary school outcomes, the coefficient estimate on ELF is statistically
insignificant, suggesting that there is no strong relationship between village diversity and local
school funding in Meatu, Tanzania. For one outcome – the proportion of water wells with normal
water flow – the coefficient estimate on ELF is negative and marginally statistically significant,
suggesting that diverse villages in Tanzania do a somewhat worse job of maintaining water wells.
However, Table 3 below provides more compelling evidence on the water infrastructure in Meatu,
Tanzania: the number of functioning wells per household is not in fact any lower in diverse villages,
as we discuss below. Figure 4 graphically presents the positive but statistically insignificant
estimated relationship between local ethnic diversity and school funding in Meatu, Tanzania, and
Figure 5 presents the relationship between diversity and desks per pupil. These offer a sharp contrast
with the negative relationships in Kenya.
The key coefficient estimate for our purposes is that on the ELF*KENYA term, which
captures how the relationship between ethnic diversity and local public goods differs between Busia,
Kenya and Meatu, Tanzania. We find that the coefficient estimate is negative in four of the five
outcomes we examine, and is negative and statistically significant at 95 percent confidence in the
case of desks per pupil. Using the seemingly unrelated regression (SUR) method, which combines
information across dependent variables, allows us to jointly test hypotheses for the five regressions,
and the hypothesis that the coefficient estimate on ELF*KENYA is equal to zero is rejected at 95
percent confidence (p-value=0.049). In other words, local ethnic diversity has a significantly more
negative effect on local public goods provision in Busia, Kenya than in Meatu, Tanzania. This is the
main empirical result of the paper. By way of contrast, we are unable to reject the hypothesis that the
coefficient estimate on the ELF term is zero (p-value=0.38).
The SUR results are robust to aggregating the data up to the ward level (for Meatu, Tanzania)
and the zone level (for Busia, Kenya); the 66 Tanzanian villages in our sample are located in 19
wards and the 84 Kenyan primary schools are in 22 zones. One advantage of analyzing data at
32

higher levels of aggregation is that it reduces the likely bias from endogenous local residential sorting
decisions. We again reject the hypothesis that the coefficient on the ELF*KENYA term is equal to
zero, this time at 99 percent confidence (results not shown).
The second method of pooling information across outcomes is presented in regression 6, in
which we normalize all outcomes (by district) and then stack the data. Consistent with the SUR
results, we once again we find that the coefficient estimate on ELF is not statistically significantly
different than zero, while the coefficient estimate on ELF*KENYA is negative and significantly
different than zero at 95 percent confidence, confirming the main finding.
5.3 Other Public Finance Outcomes in Tanzania
Ethnic diversity is robustly unrelated to a range of other local public finance outcomes in Meatu,
Tanzania. Total local expenditures per household on all public goods projects – which is perhaps the
best estimate of total local Village Council activity – is not significantly related to local ethnic
diversity and the coefficient estimate is near zero (coefficient estimate 3.8 USD, standard error 6.8
USD), and the same holds for local expenditures on health and water well projects, total local tax
collection, and the number of completed local public goods projects (Table 3, Panel A). A similar
finding holds for average spending on local taxes and school expenses, using Household Survey data
(Table 3, Panel B). There is also no evidence that the quality of local water well or road
infrastructure is related to local ethnic diversity (Table 3, Panel C). All results in Table 3 are robust
to the inclusion of average village per capita consumption expenditures (from the Household Survey)
and the village consumption Gini coefficient as additional explanatory variables (results not shown).
We are unable to reject the joint hypothesis that the coefficient on ELF is equal to zero across
all thirteen local public finance outcomes in Meatu presented in Tables 2 and 3 (p-value=0.93).
33

5.4 Community Groups
The results on ethnic diversity and community group membership in Meatu, Tanzania are mixed:
there is no significant relationship between village ethnic diversity and the total number of
community groups or attendance at village meetings, and in fact the point estimates on ethnic
diversity are mainly positive and insignificant (Table 4, Panel A). However, there is a strong
negative relationship between local ethnic diversity and the probability that a Household Survey
respondent was a member of a community group (Table 4, Panel B), echoing recent findings from
the U.S. (Alesina and LaFerrara 2000). This membership effect is reasonably large: the change from
complete ethnic homogeneity to average levels of ethnic diversity in Meatu, Tanzania is associated
with a ten percent (3 percentage point) drop in average community group membership.23
This negative result on community group membership appear inconsistent with the robust
local public goods findings presented above, at first glance. One natural interpretation is that the
nation-building policies pursued in Tanzania have promoted local collective action – attendance at
local village meetings and local public fundraising, for example – but have not affected less “formal”
patterns of social interaction, as expressed in community group membership (for example, in
women’s self-help groups). This resonates with the hypothesis that nation-building in Tanzania
affected individual “taste” for inter-ethnic cooperation rather than affecting the “social sanctions”
23 The author attempted to obtain analogous data on community group densities for the Kenyan district, with only partial success. Data on registered community group membership in Kenya were available for only part of the sample area due to difficulties in obtaining the administrative data from local officials. Restricting attention to registered groups is also not ideal, since many community groups are not registered in Kenya. (The enumerators for the 2001 Meatu, Tanzania surveys specified that they were interested in both registered and unregistered community groups, so this should not be as serious a problem there.) The relationship between local ethnic diversity and total registered group membership in this limited sample is consistently negative, and statistically significant at 90 percent confidence in some specifications (results available upon request). Due to the data limitations mentioned above, however, I have opted not to highlight the Kenyan results in the text.
34

technology available to Tanzanians. To further explore these issues, in the next section we turn to
existing World Bank household surveys for Tanzania.24
6. Ethnic Diversity and Social Capital in Tanzania: Results from World Bank Surveys
This section uses data from the 1995 Tanzania Social Capital and Poverty Survey (SCPS) and the
1993 Tanzania Human Resource Development Survey (HRDS), both conducted by the World Bank.
The SCPS sampled 87 rural clusters (subsets of villages) from the National Master Sample
framework maintained by the Tanzania Bureau of Statistics, and fifteen households were randomly
sampled in each cluster (Narayan 1997).25 Because the HRDS also used the National Master Sample
framework, we matched SCPS and HRDS clusters, and this allows us to construct cluster-level ethnic
fractionalization, the principal measure of local ethnic diversity in the empirical analysis below.
The SCPS was primarily concerned with measuring social capital, but also contained
questions on agricultural patterns, savings and credit, environmental resources, and household assets,
and for fifty-three of the SCPS clusters, household consumption expenditure data was also collected.
The survey instrument allows us to measure various dimensions of social capital. For example,
individuals were asked about community group memberships, asked to rate “village unity” and the
“spirit of participation” in their community, as well as to evaluate the level of “trust” they had for
different types of people (for example, tribal elders, political leaders, and members of other ethnic
groups). Normalized indices ranging in value from zero to one were then created, where values close
to one indicate higher levels of social capital. The trust index used in Table 5 is the (normalized)
sum of expressed “trust” across all categories of people.
24 Future versions of this paper will present additional household level information on the characteristics of informal social networks, and attitudes towards the ethnic group and nation, in both districts, to further distinguish between these two competing theories of ethnic diversity and local collective action. 25 However, it appears that this may not have been the case in practice. We have observations on 6 to 21 households in each cluster with nonmissing data on the variables of interest to us. Refer to LaFerrara (1999) for a more detailed description of the data, and for an examination of income inequality and group membership in the same setting.
35

The empirical specification is similar to Equation 2 above. Since the dataset contains data
across Tanzanian regions, it is difficult to make convincing arguments establishing that the statistical
correlation between ethnic diversity and the social capital represents a truly causal relationship, or
even a lower bound on a causal relationship (as for Meatu, Tanzania), due to possible positive or
negative omitted variable biases, although the inclusion of a rich set of explanatory variables
ameliorates this concern to some extent.26 As a result, it is best to see these regressions as suggestive
evidence regarding the impact of ethnic diversity on social capital outcomes.
Consistent with the findings in Table 4, the World Bank survey data indicate that community
group membership rates are in fact somewhat lower in ethnically diverse communities (Table 5,
Panel A), although the coefficient estimate on ELF is not significantly different than zero at
traditional confidence levels. The relationship between ethnic diversity and group membership is
driven by lower membership rates in non-religious community groups, and this effect is marginally
statistically significant (coefficient estimate –0.32, standard error 0.21). However, there is no
significant relationship between local ethnic diversity and subjective measures of trust, village unity,
or participation in these villages (Table 5, Panel B), and these may be the key factors driving the
public goods results.
Taken together, the results suggest that even though ethnic diversity is associated with lower
community group membership rates in Meatu district and in Tanzania as a whole, it does not affect
perceived community unity, self-expressed trust of others, village meeting attendance, or the ability
to fund local public goods.
7. Conclusion
26 As explanatory variables, we include individual characteristics including a household income measure, and the respondent’s educational attainment, sex, and age. The income measure is household expenditure per adult equivalent. We also control for average village-level expenditure per capita, and inequality using the Gini measure.
36

To summarize the main results, although western Kenya and western Tanzania were largely similar
along key social, economic, and political dimensions in the 1960s, after independence Tanzania
adopted perhaps the most serious nation-building program in sub-Saharan Africa, and in forty years
these regions have diverged sharply: ethnic diversity leads to lower public goods funding in western
Kenya, but is not associated with collective action outcomes in western Tanzania.
Moving to the national level, Tanzanian economic growth rates were also substantially faster
than Kenyan growth rates during the 1990s, governance and institutional quality were considerably
higher, and national politics less violent (UNDP 2002). Although we should not read too much into
the national differences – which are the product of many factors – these broad patterns are also
consistent with the claim that Tanzanian nation-building policies have indeed had a beneficial long-
run impact on political stability and economic development.
On a less formal level, visitors to Kenya and Tanzania – including the author – are routinely
struck by different popular attitudes towards tribe and nation in the two countries, and the far greater
degree of attachment to national ideals, to national leaders, and to the Swahili language in Tanzania
(although the lingering separatist dispute with Zanzibar indicates that regional divisions have not
been entirely eliminated). To illustrate, during fieldwork in November 2000, one Tanzanian
schoolteacher responded to a question about possible inter-ethnic divisions on the school committee
by stating: “This is Tanzania – we do not have that sort of problem here.”
7.1 Potential Drawbacks to Nation-building in Diverse Societies
There are also many legitimate sources of concern regarding nation-building policies like those
pursued in Tanzania. First, the articulation and imposition of a single national identity through
coordinated public policies may have serious negative costs for communities that do not fit neatly
into the dominant national vision, as well-known European examples illustrate. The construction of
a British national identity from distinct English and Scottish identities during the 18th and 19th
37

centuries was forged around common Protestant religious traditions and the English language, but no
comparable compromise was reached for integrating Catholics or Celtic-language speakers into the
mainstream of British public life (Colley 1992). The process of nation-building in France also
entailed the loss of numerous regional linguistic and cultural identities (Weber 1976).
As a result, the fear remains real in many societies that the construction of a national identity
will accelerate the erosion of indigenous cultures – and perhaps inevitably lead to a backlash by those
who perceive these policies as a threat to their way of life. Nation-building policies could also be
employed by opportunistic ethnic majority leaders to repress the legitimate political aspirations of
minority groups under the guise of benign reform; the historical treatment of the Kurds in Turkey is
one example. In societies with pronounced ethnic divisions, the process of nation-building may be
slow and painful, such that in the short-term other solutions – including extensive decentralization, or
even the secession of regions dominated by dissident minority groups – may actually lead to less
conflict and more rapid economic development.
Even if nation-building policies should not be applied in every ethnically diverse society, the
Tanzanian case suggests that nation-building can succeed without jeopardizing indigenous cultures
and languages in an African context. Most vernacular languages – like the Sukuma language in
Meatu – continue to thrive in non-official contexts in Tanzania decades after independence, co-
existing with Swahili in homes and markets. In fact, one key to the success of the Tanzanian reform
program may be that the central government never made efforts to “stamp out” vernacular languages
or most indigenous cultural practices, nor to deny the very existence of particular ethnic groups.27
The maintenance of distinct Scottish and Welsh identities – and a thriving Welsh language – in Great
Britain after centuries of nation-building and cultural diversity are compatible in the long run.
27 One partial exception to the inclusiveness of the Tanzanian approach is the small and wealthy South Asian community, who were never entirely welcome within Nyerere’s pan-Africanist and socialist vision, as well as several small groups that rely on hunting and gathering for food – like the Hadzabe in Meatu district – who have seen their numbers shrink rapidly in recent decades as other Tanzanians have encroached on their traditional lands.
38

Another reasonable concern about nation-building is that, although it binds people together
within a society – reducing the likelihood of domestic civil strife – it may provoke nationalistic
impulses that lead to war with neighboring countries. However, once again, this fear has not
materialized in Tanzania. In fact, Tanzania has been an excellent neighbor, accepting millions of
refugees fleeing armed conflicts in the region, and Tanzanian leaders have worked tirelessly for
negotiated settlements to several African civil wars, most recently in Burundi. Internal tranquility
and international peace have gone hand in hand for Tanzania, perhaps as a result of the pan-
Africanist ideals at the heart of Julius Nyerere’s political philosophy.
7.2 Ethnic Diversity and Public Policy
Promoting nation-building policies will require a dramatic restructuring of cultural, educational, and
language policies in many countries, and the centralized nature of this restructuring runs against
current “Washington Consensus” thinking about economic development, which strongly advocates
political and fiscal decentralization in less developed countries. Nation-building in less developed
countries is also likely to be opposed by powerful politicians in the global North, concerned that
increasingly nationalistic less developed countries will promote anti-Northern and anti-globalization
views. Moreover, the benefits of nation-building may take decades to materialize.
Nonetheless, the results of this paper suggest that the risks may be worth taking, and that
nation-building should move onto government policy agendas, especially in Africa. The articulation
of new national political identities and institutions has been underway in many African countries
since the democratization wave of the early 1990’s, which re-opened the public debate on the nature
of the state in Africa. As a result, the upcoming decade may be a special window of opportunity for
progressive African political leaders to adopt elements of the Tanzanian nation-building “model” as
investments in long-run social stability and economic growth.
39

8. Tables and Figures
Figure 1: Map of East Africa
(featuring Busia District, Kenya and Meatu District, Tanzania)
40

Figure 2: Busia, Kenya – Total local primary school funds per pupil (2001 U.S. dollars) in 1995 versus residential ethno-linguistic fractionalization in the geographic zone
Local Ethnic diversity (ELF)
School Funding Kenya (USD) Fitted values
0 .2 .4 .6
0
5
10
Figure 3: Busia, Kenya – Desks per primary school pupil in 1996
versus residential ethno-linguistic fractionalization in the geographic zone
Local Ethnic diversity (ELF)
Desks per pupil Kenya Fitted values
0 .2 .4 .6
0
.2
.4
.6
41

Figure 4: Meatu, Tanzania – Total local school funds per pupil (2001 U.S. dollars) per year in
1997-2002 versus residential ethno-linguistic fractionalization in the ward
Local Ethnic diversity (ELF)
School Funding Tanzania (USD) Fitted values
0 .2 .4 .6
0
10
20
30
Figure 5: Meatu, Tanzania – Desks per primary school pupil in 2001 versus residential ethno-linguistic fractionalization in the ward
Local Ethnic diversity (ELF)
Desks per pupil Tanzania Fitted values
0 .2 .4 .6
0
.2
.4
.6
42

Table 1: Descriptive Statistics
Meatu District, Tanzania Busia District, Kenya
Mean Std dev. Obs. (villages)
Mean Std dev. Obs. (schools)
Panel A: Data for Tanzania and Kenya
Local ethnic fractionalization (ELF) 0.15 0.17 66 0.23 0.14 84 Annual expenditures on local primary school projects per pupil (USD)
4.89 3.90 66 3.45 2.23 84
Desks per primary school pupil 0.19 0.09 66 0.21 0.12 84 Latrines per primary school pupil 0.011 0.005 66 0.016 0.013 84 Classrooms per primary school pupil 0.013 0.005 66 0.031 0.014 84 Teachers per primary school pupil 0.013 0.004 66 0.039 0.015 84 Proportion wells with “normal water flow” 0.57 0.37 66 0.56 0.14 84
Average years of education 4.1 1.1 66 7.4 1.3 84 Proportion formal sector employment 0.06 0.07 66 0.23 0.10 84 Proportion of homes with iron roofs 0.26 0.20 66 0.24 0.10 84 Proportion households grow cash crops 0.61 0.25 66 0.40 0.24 84 Proportion households own cattle 0.47 0.17 66 0.60 0.19 84 Proportion Catholic 0.17 0.12 66 0.58 0.22 84
Panel B: Data for Tanzania
Number of households per village 408.3 179.2 66 - - - Annual per capita consumption expenditures (USD)
192.2 82.5 66 - - -
Gini coefficient of annual per capita consumption expenditures (at village level)
0.35 0.15 66 - - -
Annual local expenditures on all public goods projects, per household (USD)
8.65 6.39 66 - - -
Annual local expenditures on health and water well projects, per household (USD)
1.51 1.78 66 - - -
Total annual local tax collection, per household (USD)
2.14 3.47 66 - - -
Average number of completed local public goods project, per year
0.67 0.40 66 - - -
Average household spending on local taxes and school expenses (USD) [HH Survey]
12.17 14.29 66 - - -
Wells with normal water flow, per household 0.008 0.009 66 - - - Total water wells, per household 0.014 0.011 66 - - - Average road quality (scale 1-4) 2.5 0.8 65 - - -
Community groups, per household 0.026 0.017 66 - - - Women’s groups, per household 0.004 0.005 66 - - - Youth groups, per household 0.004 0.007 66 - - - Water groups, per household 0.011 0.011 66 - - - Proportion survey respondents who are community group members [HH Survey]
0.33 0.23 66 - - -
Village meeting attendance, per household 1.22 1.03 66 - - -
Table 1 Notes: 1) Busia, Kenya data are from the 1996 ICS School and Pupil Questionnaires, 1996 Government Examination Namelists, and Global Positioning Systems (GPS) readings taken by NGO field workers. Each Kenyan data point
43

refers to a primary school, or to the 5 km radius around a school (in the case of the ethnic composition and water well maintenance). Meatu, Tanzania data are from the 2001-2002 Household Survey and 2001-2002 Village Council Surveys, and ethnicity measures are for the village, computed using a 20 percent random sample of the Village Tax Register, to which ethnic affiliation was assigned. 2) For “Annual local expenditures on primary school projects per pupil (USD)”, the Kenyan data are from school records about parent and community contributions to the school in 1995. For Tanzania, local project values were obtained from the Meatu District Council and the Dutch Rural Development Programme, and then combined with 2001-2 Village Council Survey information on the types of project completed in each village to determine the overall value of local project activity. Thus measures for the two countries are not entirely equivalent. All dollar figures for both countries are in 2002 USD. 3) Local characteristics (education, employment, etc.) for Kenya are from the 1996 Pupil Questionnaire, and are data about pupils’ fathers. Local characteristics for Tanzania are from the 2001-2 Household Survey, in which both men and women were surveyed, though two-thirds of respondents were men. The gender of respondents may partially explain differences in average reported socio-economic characteristics between Busia, Kenya and Meatu, Tanzania, since educational attainment and formal sector employment are higher among men in both countries, and the Tanzanian sample contains both men and women while the Kenyan sample contains only men (fathers), and some Tanzanian respondents were also elderly, and the elderly tend to have less education and formal employment.
44

Table 2: Ethnic Diversity and Local Public Goods (Kenya and Tanzania)
Annual
school spending /
pupil (USD)
Desks / pupil
Latrines /
pupil
Classrooms /
pupil
Proportion wells with
normal flow
All outcomes (normalized and stacked)
Explanatory variable (1) (2) (3) (4) (5) (6)
Local ethnic diversity (ELF) * Kenya Indicator
-4.7 (4.8)
-0.37** (0.14)
-0.016 (0.011)
-0.014 (0.010)
0.21 (0.29)
-1.75** (0.72)
Local ethnic diversity (ELF)
1.3 (3.4)
0.11 (0.09)
0.005 (0.004)
0.008 (0.005)
-0.31* (0.18)
0.60 (0.48)
Kenya indicator variable
-2.8**
(1.2) 0.01
(0.06) 0.007
(0.005) 0.021*** (0.004)
0.16 (0.15)
0.06 (0.31)
Socio-economic controls Average years of education 0.40
(0.24) 0.011
(0.008) 0.0002
(0.0007) 0.0006 (0.006)
-0.044** (0.019)
0.04 (0.04)
Proportion formal sector employment
-2.7 (2.9)
0.16 (0.10)
0.008 (0.016)
0.001 (0.010)
0.29 (0.26)
0.77 (0.49)
Proportion homes with iron roofs -2.2 (2.2)
-0.00 (0.06)
-0.005 (0.004)
0.002 (0.005)
0.06 (0.13)
-0.27 (0.34)
Proportion households grow cash crops
-0.6 (1.1)
-0.01 (0.03)
-0.002 (0.003)
-0.001 (0.004)
-0.16* (0.09)
-0.30* (0.16)
Proportion households own cattle -0.5 (1.2)
0.03 (0.07)
-0.003 (0.006)
-0.006 (0.006)
-0.14 (0.11)
-0.26 (0.32)
Proportion Catholic 3.4*** (1.1)
0.03 (0.08)
-0.002 (0.007)
-0.005 (0.007)
-0.28** (0.12)
-0.03 (0.38)
R2 0.12 0.16 0.09 0.41 0.11 0.06 Root MSE 3.04 0.10 0.011 0.011 0.26 0.96 Number of observations 150 150 150 150 150 750
Table 2 Notes: 1) Huber robust standard errors in parentheses. Significantly different than zero at 90% (*), 95% (**), 99% (***) confidence. Regression disturbance terms are clustered at the zone level for Kenya, and at the ward level for Tanzania. Local ethnic diversity is ethno-linguistic fractionalization = 1 – ∑i (Proportion of Ethno-linguistic group i in the population)2. Local ELF is diversity in all primary schools within 5 kilometers for Kenya, and for Tanzania, it is diversity at the village-level (based on the 2001 Village Council Survey). The data contains 84 primary schools in Busia, Kenya, and for 66 villages in Meatu, Tanzania, for all outcomes.
45

Table 3: Local Public Finance and Collective Action Outcomes (Tanzania)
Dependent variable
Coefficient estimate on local ELF
Panel A: Public Finance Outcomes, 2001-2002 Village Council Data
Annual total local expenditures on all public goods projects, per household (USD) 3.9 (6.8)
Annual local expenditures on health and water well projects, per household (USD) 0.6 (1.2)
Total annual local tax collection, per household 0.9 (2.6)
Average number of completed local public goods project, per year -0.33 (0.41)
Panel B: Public Finance Outcomes, 2001-2002 Household Data
Average household spending on local taxes and school expenses (USD) 5.9 (10.7)
Panel C: Local Infrastructure, 2001-2002 Village Council Data
Wells with normal water flow, per household 0.003 (0.007)
Average road quality (scale 1-4) -0.2 (0.4)
Table 3 Notes: 1) Huber robust standard errors in parentheses. Significantly different than zero at 90% (*), 95% (**), 99% (***) confidence. Regression disturbance terms are clustered at the ward level. Ethno-linguistic fractionalization is defined as 1 – ∑i (Proportion of Ethno-linguistic group i in the population)2. Local ELF is diversity in the village for Tanzania (based on the 2001 Village Council Survey, using Village Tax Register data). The data is for 66 villages in Meatu, Tanzania, for all outcomes. 2) The same socioeconomic controls as in Table 2 are included in all regressions: average years of education; proportion formal sector employment; proportion iron roofing at home; proportion cultivates cash crop; proportion cattle ownership; and proportion Catholic.
46

Table 4: Community Group and Village Meeting Activity (Tanzania)
Dependent variable
Coefficient estimate on local ELF
Panel A: 2001-2002 Village Council Data
Total community groups, per household 0.018 (0.016)
Women’s groups, per household 0.005 (0.004)
Youth groups, per household 0.009 (0.010)
Water groups, per household -0.001 (0.008)
Village meeting attendance, per household 0.53 (0.82)
Panel B: 2001-2002 Household Data
Proportion household survey respondents who are community group members -0.22** (0.08)
Table 4 Notes: 1) Huber robust standard errors in parentheses. Significantly different than zero at 90% (*), 95% (**), 99% (***) confidence. Regression disturbance terms are clustered at the ward level. Ethno-linguistic fractionalization is defined as 1 – ∑i (Proportion of Ethno-linguistic group i in the population)2. Local ELF is diversity in the village for Tanzania (based on the 2001 Village Council Survey, using Village Tax Register data). The data is for 66 villages in Meatu, Tanzania, for all outcomes. 2) The same socioeconomic controls as in Table 2 are included in all regressions: average years of education; proportion formal sector employment; proportion iron roofing at home; proportion cultivates cash crop; proportion cattle ownership; and proportion Catholic.
47

Table 5: Ethnic Diversity and Social Capital in Tanzania (World Bank Household Survey Data, 1993 and 1995)
Dependent variable
Coefficient estimate on ELF (within the survey
cluster)
Number of households
Mean of dependent variable
(s.d.)
Panel A: Community group memberships Respondent community group memberships, total -0.25
(0.20) 545 1.56
(1.50)
Respondent non- religious community group memberships -0.32 (0.21)
545 1.13 (1.21)
Respondent religious community group memberships -0.01 (0.12)
545 0.45 (0.61)
Panel B: Subjective measures of trust and cooperation Trust index 0.010
(0.033) 590 0.62
(0.16)
Index rating village unity -0.011 (0.049)
590 0.67 (0.18)
Index rating village spirit of participation -0.001 (0.027)
590 0.53 (0.24)
Table 5 Notes: 1) Huber robust standard errors in parentheses. Significantly different than zero at 90% (*), 95% (**), 99% (***) confidence. Regression disturbance terms are clustered. Ethno-linguistic fractionalization is defined as ELF ≡ 1 – ∑i (Proportion of Ethno-linguistic group i in the population)2. 2) The data are from the 1995 Tanzania Social Capital and Poverty Survey (SCPS) and the 1993 Tanzania Human Resource Development Survey (HRDS), both conducted by the World Bank. The SCPS sampled 87 rural clusters (subsets of villages) from the National Master Sample framework maintained by the Tanzania Bureau of Statistics. Socioeconomic controls include: household head age; household head sex; household head years education; household size; an indicator for residence in the village for at least ten years; average village consumption per adult equivalent (in 1993 Tanzanian Shillings); log(cluster population); cluster-level fractionalization in household head education level; cluster-level fractionalization in household head economic activity; household consumption per adult equivalent in 1993 shillings (linearly and squared); GINI coefficient; and regional controls. The number of household observations per cluster ranges between 7 and 21. There are 46 sample clusters in all regressions above, those with complete consumption expenditure and other socio-economic controls. 3) The normalized indices in Panel B range in value from zero to one indicate how the respondent subjectively rated trust, the spirit of participation in the community, or village unity. The trust index is the (normalized) sum of a series of trust question, regarding trust for various types of people.
48

9. References
Abdulaziz, Mohamed H. (1971). “Tanzania’s National Language Policy and the Rise of Swahili Political Political Culture”, in Language Use and Social Change, ed. Wilfred Whiteley, 160-178. Oxford University Press, London. Abdulaziz, Mohamed H. (1980). “The Ecology of Tanzanian National Language Policy,” in Language in Tanzania, ed. Edgar C. Polome and C.P. Hill. Oxford University Press: Oxford. Acemoglu, Daron, Simon Johnson, and James Robinson. (2001). “Colonial Origins of Comparative Development: An Empirical Investigation,” American Economic Review, 91 (5), 1369-1401 Afro-Barometer Network. (2002). “Afro-Barometer Round I: Compendium of Comparative Data from a Twelve-Nation Survey”, Afro-Barometer Paper #11. Akerlof, George, and Rachel Kranton. (2000). “Economics and Identity”, Quarterly Journal of Economics, 115(3), 715-753. Alesina, Alberto, Reza Baqir, and William Easterly. (1999). “Public goods and ethnic divisions”, Quarterly Journal of Economics, 114(4), 1243-1284. Alesina, Alberto, and Eliana Laferrara. (2000) “Participation in Heterogeneous Communities,” Quarterly Journal of Economics, 115(3), 847-904. Barkan, Joel D. (ed.). (1984). Politics and Public Policy in Kenya and Tanzania (Revised). Praeger: New York. Barkan, Joel D. (1994). “Divergence and Convergence in Kenya and Tanzania: Pressures for Reform,” in Beyond Capitalism versus Socialism in Kenya and Tanzania, ed. Joel D. Barkan. Lynne Rienner Publishers: Boulder. Barkan, Joel D., and Michael Chege. (1989). “Decentralising the state: district focus and the politics of reallocation in Kenya”, Journal of Modern African Studies, 27(3), 431-453. Castles, Steven, Bill Cope, Mary Kalantzis, Michael Morrissey. (1992). Mistaken Identity, pp. 139-148. Pluto Press, Sydney. Chaligha, Amon, Robert Mattes, Michael Bratton, and Yul Derek Davids. (2002). “Uncritical Citizens or Patient Trustees? Tanzanians’ Views of Political and Economic Reform”, Afro-Barometer Paper #18. Colley, Linda. (1992). Britons: Forging the Nation, 1707-1837. Yale University Press: New Haven. Community Water Supply Management Project (CWSP). (2000). “Report of the Status of Piped Schemes in Western Province”, Kakamega, Kenya, mimeo. Conley, Timothy. (1999). “GMM estimation with cross-sectional dependence,” Journal of Econometrics, 92, 1-45.
49

Costa, Dora L. and Matthew E. Kahn. (2002). “Civic Engagement and Community Heterogeneity: An Economist’s Perspective”, for the Conference on Social Connectedness and Public Activism, Harvard University, May 2002. Court, David. (1984). “The Education System as a Response to Inequality,” in Politics and Public Policy in Kenya and Tanzania (Revised Edition), ed. Joel D. Barkan. Praeger: New York. Court, David, and Dharam Ghai (eds.). (1974). Education, Society, and Development: New Perspectives from Kenya. Nairobi: Oxford University Press (on behalf of the Institute of Development Studies, University of Nairobi). Court, David, and Kabiru Kinyanjui. (1980). “Development Policy and Educational Opportunity: The Experience of Kenya and Tanzania”, University of Nairobi Institute of Development Studies Occasional Paper #33. Court, David, and Kenneth Prewitt. (1974). “Nation versus Region in Kenya: A Note on Political Learning”, British Journal of Political Science, 4, 109-120. DesForges, Alison. (1999). Leave None to Tell the Story: Genocide in Rwanda. Human Rights Watch: New York. Easterly, William, and Ross Levine. (1997). “Africa’s growth tragedy: policies and ethnic divisions”, Quarterly Journal of Economics, 112 (4), 1203-1250. Fearon, James, and David Laitin. (1996). “Explaining Interethnic Cooperation”, American Political Science Review, 90(4), 715-735. Fearon, James, and David Laitin. (2000). “Violence and Social Construction of Ethnic Identity,” International Organization, 54(4), 845-877. Glewwe, Paul, Michael Kremer, and Sylvie Moulin. (1998). “Textbooks and test scores: Evidence from a prospective evaluation in Kenya”, unpublished manuscript, MIT. Gordon, David F. (1994). “International Economic Relations, Regional Cooperation, and Foreign Policy”, in Beyond Capitalism versus Socialism in Kenya and Tanzania, ed. Joel D. Barkan. Lynne Rienner Publishers: Boulder. Gorman, T.P. (1974). “The Development of Language Policy in Kenya with Particular Reference to the Educational System”, in Language in Kenya, ed. W.H. Whiteley. Oxford University Press, Nairobi. Government of Kenya. (1965). Kenya Population Census, 1962. Central Bureau of Statistics: Nairobi. Government of Kenya. (1986). Kenya Socio-Cultural Profiles: Busia District, ed. Gideon Were. Ministry of Planning and National Development, Nairobi. Government of Kenya. (1994). Kenya Population Census, 1989. Central Bureau of Statistics: Nairobi. Government of the United Republic of Tanzania. (1999). Shinyanga Region Socio-economic Profile. Dar es Salaam. Horowitz, Donald. (1985). Ethnic Groups in Conflict. University of California Press: Berkeley.
50

Kidamala, Daudi, and E.R. Danielson. (1961). “A Brief History of the Waniramba People Up to the Time of the German Occupation”, Tanganyika Notes and Records, 56, 67-78. Koff, David and George von der Muhll, 1967, “Political Socialization in Kenya and Tanzania – A Comparative Analysis”, Journal of Modern African Studies, 5(1), 13-51. Koff, David and George von der Muhll, 1971, “Political Socialization in Kenya and Tanzania – A Comparative Analysis”, in Education and Political Values: An East African Case Study, ed. Kenneth Prewitt. Nairobi: East African Publishing House. LaFerrara, Eliana. (1999). “Inequality and Group Participation: Theory and Evidence from Rural Tanzania,” IGIER Working Paper #161. Laitin, David. (1992). Language Repertoires and State Construction in Africa. Cambridge University Press. Mamdani, Mahmood. (1996). Citizen and Subject: Contemporary Africa and the Legacy of Late Colonialism. Princeton University Press: Princeton. Mauro, Paolo. (1995). “Corruption and Growth,” Quarterly Journal of Economics, 110(3), 681-712. McHenry, Dean E., Jr. (1979). Tanzania’s Ujamaa Villages. Institute of International Studies, University of California, Berkeley. Miguel, Edward, and Mary Kay Gugerty. (2002). “Ethnic Diversity, Social Sanctions, and Public Goods in Kenya,” unpublished manuscript, University of California at Berkeley. Miles, William F.S. (1994). Hausaland Divided: Colonialism and Independence in Nigeria and Niger. Cornell University Press. Morgan, W.T.W., and N. Manfred Shaffer. (1966). Population of Kenya, Density and Distribution: A geographical introduction to the Kenya Population Census, 1962. Oxford University Press: Nairobi. Mwapachu, Juma Volter. (1975). “Operation Planned Villages in Rural Tanzania: A Revolutionary Strategy for Development”, Mbioni, 7(11), 5-39. Ndulu, Benno J., and Francis W. Mwega. (1994). “Economic Adjustment Policies”, in Beyond Capitalism versus Socialism in Kenya and Tanzania, ed. Joel D. Barkan. Lynne Rienner Publishers: Boulder. Ndegwa, Stephen. (1997). “Citizenship and Ethnicity: An Examination of Two Transition moments in Kenyan Politics,” American Political Science Review 91(3), 599-616. Platteau, Jean-Philippe. (2000). Institutions, Social Norms, and Economic Development. Harwood. Polome, Edgar C. (1980). “Tanzania: A Socio-linguistic perspective,” in Language in Tanzania, ed. Edgar C. Polome and C.P. Hill. Oxford University Press: Oxford. Posner, Daniel. (2002). “The Political Salience of Cultural Difference: Why Chewas and Tumbukas are Allies in Zambia and Adversaries in Malawi”, unpublished manuscript, UCLA.
51
Prewitt, Kenneth, George Von der Muhll, and David Court. (1970). “School Experiences and Political Socialization: A Study of Tanzanian Secondary School Students”, Comparative Political Studies, 3(2), 203-225. Putnam, Robert. (1993). Making Democracy Work. Princeton University Press. Schoenbraun, David Lee. (1998). A Green Place, a Good Place: Agrarian Change, Gender, and Social Identity in the Great Lakes Region to the 15th Century. Heinemann. Sobel, Joel. (2002). “Can We Trust Social Capital?” Journal of Economic Literature, 40 (1), 139-154. Therkildsen, Ole. (2000). “Contextual Issues in Decentralization of Primary Education in Tanzania,” International Journal of Educational Development, 20, 407-421. United Nations Development Program. (2002). Human Development Report: Deepening Democracy in a Fragmented World. Oxford University Press. Varshney, Ashutosh. (2002). Civic Life and Ethnic Conflict: Hindus and Muslims in India, Yale University Press. Vigdor, Jacob. (2001). “Community Composition and Collective Action: Analyzing Initial Mail Response to the 2000 Census”, unpublished manuscript, Duke University. Von der Muhll, George. (1971). “Education, Citizenship, and Social Revolution in Tanzania”, in Education and Political Values: An East African Case Study, ed. Kenneth Prewitt. Nairobi: East African Publishing House. Weber, Eugen. (1976). Peasants into Frenchmen: The Modernization of Rural France, 1870-1914. Stanford University Press. Were, Gideon. (1967). A History of the Abaluyia of Western Kenya. East African Publishing: Nairobi. White, John. (1980). “The Historical Background to National Education in Tanzania,” in Language in Tanzania, ed. Edgar C. Polome and C.P. Hill. Oxford University Press: Oxford. Wilson, L.S. (1992). “The Harambee movement and efficient public good provision in Kenya,” Journal of Public Economics, 48(1), 1-19.
52