Embed Size (px)
Citation preview
UPTEC K12 010
Examensarbete 30 hpJuli 2012
Tribological testing of DLC coatings for automotive applications
Viktor Renman
Teknisk- naturvetenskaplig fakultet UTH-enheten Besöksadress: Ångströmlaboratoriet Lägerhyddsvägen 1 Hus 4, Plan 0 Postadress: Box 536 751 21 Uppsala Telefon: 018 – 471 30 03 Telefax: 018 – 471 30 00 Hemsida: http://www.teknat.uu.se/student
Abstract
Tribological testing of DLC coatings for automotiveapplications
Viktor Renman
In this work, the friction and wear behavior of one commercial and two experimentalDLC coatings was evaluated in various conventional and alternative fuels as well as incommercially available formulated engine oils and additive-free synthetic oil. The firstDLC has a thin top-coating of hydrogenated amorphous carbon (a-C:H), the secondconsists of Si-doped DLC (a-C:H:Si) and the third is a multilayered structure of a-C:Hand a-C:H:W.
The tribological tests were performed using a ball-on-flat reciprocating rig at lowcontact pressures. Methods such as white light interferometry (VSI), scanning electronmicroscopy (SEM), energy dispersive x-ray spectroscopy (EDS), Raman spectroscopyand electron spectroscopy for chemical analysis (ESCA/XPS) were used for analyzingand characterizing the coatings and counter surfaces in an effort to gain anunderstanding of the tribological mechanisms involved.
In some fuels, it was found that a soft W-doped top coating contributed to drasticallylowering the wear of the counter surface as well as giving a slight decrease in friction.Chemical analysis of the wear scars suggests the formation of easily sheared WS2 atsome points in the contact might be directly responsible for this behavior, orindirectly by inhibiting the formation of aggressive oxides.
In the engine oils it was found that the coating with a thin and hard top layer ofamorphous carbon shows practically no wear. Instead most wear was seen on thecounter surface. Formulated oils bring a slight improvement for the coefficient offriction, µ, while having a small negative effect on the wear of the counter surface.With the Si-doped DLC the type of oil has very little influence on the total wear. Thelowest average µ is achieved in additive free synthetic oil. Formulated oils providelittle to no benefit friction-wise, but has a small positive effect on the wear behaviorof the coating.
The soft W-doped top layer resulted in high wear of both coating and countersurface. With respect to friction, formulated oils seemed to form unfavorabletribofilms in the contact. The lowest µ is achieved in synthetic oil. The wear of thecoating benefits from using formulated oils, while the counter surface gets the leastwear in additive-free oil.
ISSN: 1650-8297, UPTEC K12 010Examinator: Rolf BergerÄmnesgranskare: Staffan JacobsonHandledare: Fredrik Gustavsson och Peter Forsberg
i
Tribologiska tester av DLC-beläggningar
för motorapplikationer
Viktor Renman
Ökad miljömedvetenhet och krav på minskad energiförbrukning är starka drivkrafter
bakom utvecklingen av morgondagens transportfordon. Genom att minska
nötningsförluster och friktionsförluster hos maskinkomponenter kan verkningsgraden
och livslängden öka avsevärt, och därmed också indirekt påverka utsläppen av partiklar
och gaser. Med tanke på det stora antalet personbilar och lastbilar i världen skulle en
förbättring med endast några få procent i laboratorieskala kunna få stort genomslag på
en global skala.
I moderna motorer har det blivit alltmer vanligt att belägga maskinkomponenter med
tunna, nötningsbeständiga skikt bestående av amorft kol, även kallad diamantlikt kol
(DLC). Genom att modifiera fysisk struktur och kemisk sammansättning är det möjligt
att skräddarsy en beläggnings egenskaper efter behov.
Under särskilda förhållanden kan det bildas gynnsamma lågfriktionsfilmer i kontakten
mellan två ytor i relativ rörelse. Exempelvis kan ett ytskikt under belastning
omvandlas till ett fast smörjmedel genom att reagera med tillsatser i bränslet eller
oljan, en s.k. tribokemisk reaktion. Dessa tribofilmer behöver dock inte nödvändigtvis
vara gynnsamma, utan kan istället ha en negativ inverkan på friktionen och nötningen i
ett tekniskt system. Det är därför viktigt att kartlägga och förstå de mekanismer som
verkar i den tribologiska kontaktytan.
I det här examensarbetet har friktions- och nötningsbeteendet hos några kommersiella
samt experimentella DLC-beläggningar undersökts i en rad olika bränslen och
motoroljor som skiljer sig med avseende på typ och mängd av tillsatser.
Examensarbete 30 hp civilingenjörsprogrammet Kemiteknik med materialinriktning
Uppsala universitet, juni 2012
ii
Contents
1 Introduction .............................................................................................................. 1
1.1 Background ........................................................................................................ 1
1.2 Aim .................................................................................................................... 1
1.3 Diamond-like carbon ........................................................................................... 1
2 Theory & Methods .................................................................................................... 2
2.1 Some basic concepts of tribology......................................................................... 2
2.1.1 Surface contact ............................................................................................. 2
2.1.2 Friction ........................................................................................................ 3
2.1.3 Lubrication ................................................................................................... 3
2.1.4 Additives ...................................................................................................... 5
2.1.5 Wear ............................................................................................................ 6
2.2 Analysis methods ................................................................................................ 7
2.2.1 Vertical Scanning Interferometry (VSI) ........................................................ 7
2.2.2 Surface roughness parameters ....................................................................... 7
2.2.3 SEM & EDS ................................................................................................. 8
2.2.4 Raman spectroscopy ..................................................................................... 9
2.2.5 ESCA (XPS) .............................................................................................. 10
2.2.6 TEM & EELS ............................................................................................ 11
3 Experimental details ............................................................................................... 12
3.1 The tribological test rig .................................................................................... 12
3.1.1 Ball holder .................................................................................................. 13
3.1.2 Friction gauge ............................................................................................ 13
3.1.3 Heating system ............................................................................................ 13
3.1.4 Generated data ............................................................................................ 14
3.2 The coatings ..................................................................................................... 15
DLC 1 .................................................................................................................. 15
DLC 2 .................................................................................................................. 15
Multilayered DLC ................................................................................................ 16
Uncoated steel ...................................................................................................... 16
3.3 Determining wear ............................................................................................. 16
A. Fuels ..................................................................................................................... 18
A.1 Used fuels ........................................................................................................ 18
A.2 Studied coatings............................................................................................... 18
A.3 Test parameters ............................................................................................... 18
iii
A.4 Results ............................................................................................................. 19
A.4.1 Friction ..................................................................................................... 19
A.4.2 Wear ......................................................................................................... 19
A.4.3 Raman spectroscopy .................................................................................. 21
A.4.4 ESCA ........................................................................................................ 22
A.4.5 TEM & EELS............................................................................................ 23
A.5 Discussion ........................................................................................................ 24
A.6 Conclusions ...................................................................................................... 25
B. Engine oils............................................................................................................. 27
B.1 Oils used .......................................................................................................... 27
B.2 Studied coatings ............................................................................................... 27
B.2.1 Test parameters ............................................................................................ 27
B.3 Results ................................................................................................................ 28
B.3.1 Friction ......................................................................................................... 28
B.3.2 Wear ............................................................................................................. 29
B.3.3 SEM & EDS .................................................................................................. 32
B.3.4 ESCA (XPS) ................................................................................................. 39
B.3.4 Raman spectroscopy ...................................................................................... 39
B.4 Discussion ............................................................................................................ 40
B.4.1 Evaluation of the new ball-holder .................................................................. 40
B.4.2 Tribological results ........................................................................................ 40
B.5 Conclusions ......................................................................................................... 42
Future work ................................................................................................................ 43
Acknowledgements ...................................................................................................... 44
References ................................................................................................................... 45
Appendix .................................................................................................................... 47
A Friction curves for DLC/Fuels ............................................................................ 47
B Friction curves for DLC/Oils .............................................................................. 49

1
1 Introduction This diploma work was carried out during the spring semester of 2012 at the Ångström
Tribomaterials Group at the Department of Engineering Sciences, Applied Materials
Science, Uppsala University.
1.1 Background Increasing environmental awareness and demands on lowering energy consumption are
strong driving forces behind the development of the transport vehicles of tomorrow. By
reducing friction and wear of machine components, the efficiency and lifetime of a
vehicle can be significantly increased, thus also indirectly affecting the emission of
particles and greenhouse gases. Considering the large numbers of cars and trucks in the
world, an improvement of only a few percent could have a large global impact on the
energy consumption and emissions.
In modern engines, it has become increasingly more common to deposit thin wear-
resistant low friction coatings composed of amorphous carbon, also known as diamond-
like carbon (DLC), on the components in question. By modifying the structure,
composition and amount of doping elements it is possible to achieve a wide range of
different properties for these types of coatings.
1.2 Aim The purpose of this work is to investigate the tribological
properties, i.e. the friction and wear behavior of some
carbon based coatings intended for automotive applications
run at relatively low contact pressures, for instance
tappets, see Figure 1. Material combinations that show
interesting or promising friction and wear results will be
further analyzed to gain a deeper understanding of the
mechanisms involved.
This work is divided into two parts one that deals with
DLC coatings in contact with various fuels, and one that
deals with DLC coatings in different engine oils. These
fuels and oils differ with respect to composition and
amounts of additives.
Recently, a new piece of testing equipment has been installed at the Ångström
tribology laboratory. It will also be evaluated.
Figure 1: Tappet (red) between exhaust valve and cam shaft in an engine.
1
1.3 Diamond-like carbon Diamond-like carbon (DLC) coatings consist mainly of amorphous carbon and small
clusters of locally microcrystalline structures of sp2 and sp3 bonded carbon [1]. These
coatings generally show extreme hardness, high E-modulus, high corrosion resistance,
high thermal and chemical stability as well as superb tribological properties. But the
properties are heavily influenced by humidity, temperature and other environmental
factors. DLCs undergo degradation at higher temperatures. The tribological properties
may begin to change at temperatures as low as 100 ◦C [2]. Since automotive
components must work at high temperature and in humid and oxidative environments,
it is therefore important to investigate the effects of doping elements that may improve
the tribological properties of the coating. By using different doping elements such as W,
Si and Cr it is possible to enhance and tailor certain properties, for instance increasing
hardness, thermal stability and increasing affinity towards additives in lubricants.
The presence of hydrogen in the DLC-coatings is due to the nature of the deposition
processes, where various hydrocarbons (mainly acetylene) are used as precursors for
depositing amorphous carbon. The amount of H in these coatings used in this work is
unclear, but for pure DLCs the H-content is usually 15-20 %, but may be as high as 50
%. Studies by A. Erdemir [3] show that hydrogen plays an important role in
determining the tribological properties of DLC coatings. Generally, the lower hydrogen
content, the more diamond-like the coating becomes. At the same time, the hydrogen
atoms promote the formation and stabilization of sp3 tetrahedral bonds and prevent
graphitization, yielding a harder, more wear resistant material. As previously stated,
the atmospheric conditions also play a vital part in determining the tribological
behavior. Highly hydrogenated DLCs perform well in dry atmospheric conditions,
undergoing graphitization in the contact due to increased temperature during sliding,
but they show great sensitivity towards moisture. The tribological behavior and
performance of DLCs in dry, unlubricated conditions is relatively well understood. The
mechanisms involved in lubricated contacts, on the other hand, need to be further
investigated.
2
2 Theory & Methods
The science of friction, wear and lubrication is called tribology (derived from the greek
verb ]) and deals with interacting surfaces in relative motion. The
interface between these surfaces can be an extreme environment, where local
temperatures can reach the melting point of the material and the pressure can reach
several GPa. The chemical reactivity of these interfaces may also be enhanced,
sometimes giving rise to the formation of so called chemical tribofilms in the contact
between two surfaces. These films may have a dramatic effect on the friction and wear
behavior of a technical system.
In the following section a brief introduction to the basics of tribology that are relevant
to this study will be given.
2.1 Some basic concepts of tribology
2.1.1 Surface contact
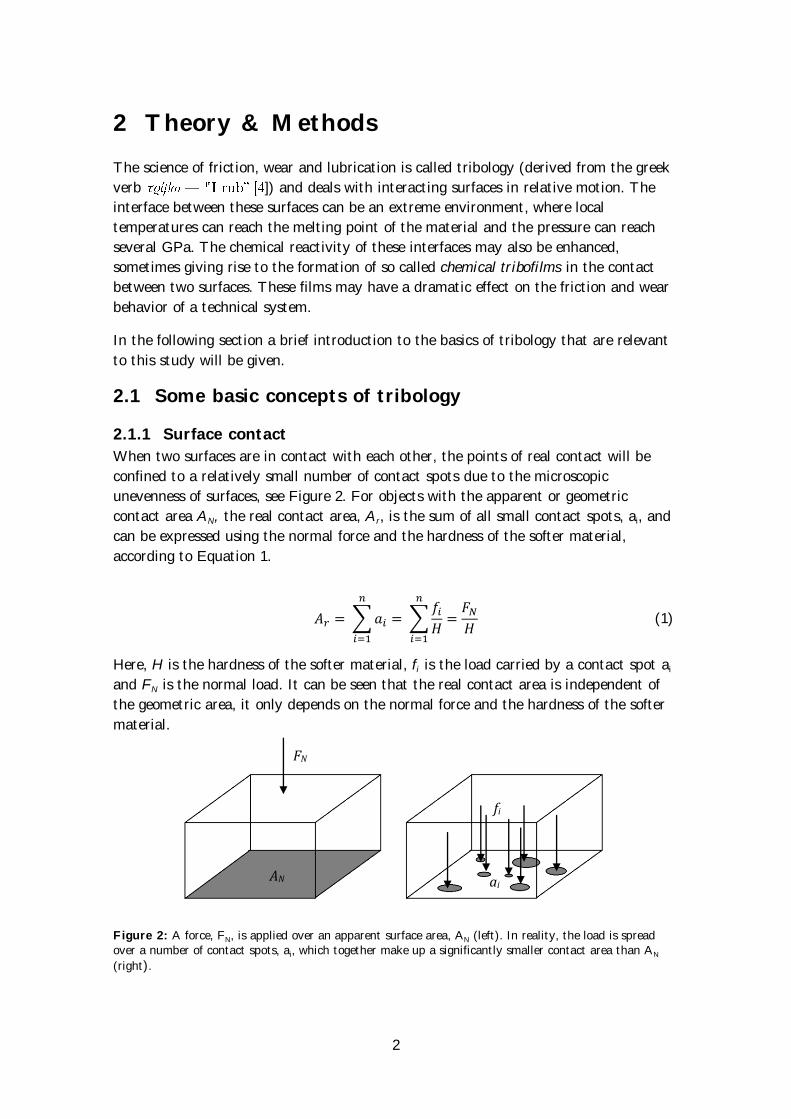
When two surfaces are in contact with each other, the points of real contact will be
confined to a relatively small number of contact spots due to the microscopic
unevenness of surfaces, see Figure 2. For objects with the apparent or geometric
contact area AN, the real contact area, Ar, is the sum of all small contact spots, ai, and
can be expressed using the normal force and the hardness of the softer material,
according to Equation 1.
(1)
Here, H is the hardness of the softer material, fi is the load carried by a contact spot ai
and FN is the normal load. It can be seen that the real contact area is independent of
the geometric area, it only depends on the normal force and the hardness of the softer
material.
Figure 2: A force, FN, is applied over an apparent surface area, AN (left). In reality, the load is spread over a number of contact spots, ai, which together make up a significantly smaller contact area than AN
(right).
FN
AN
fi
ai
3
2.1.2 Friction
Friction is the resistance that arises whenever two surfaces glide or roll against each
other. The resulting force opposite to the direction of motion is called the friction force,
FT. Friction is commonly described using the coefficient of friction, which is a
dimensionless parameter that can be expressed using the normal force, FN, and the
friction force according to Equation 2.
(2)
Another way to describe the friction in a sliding contact is based on taking the
adhesion between contact spots into consideration. If the friction resistance is caused by
the shearing of the contact spots, then the yield strength for pure shearing of the
weaker material, , will determine the friction force together with the real contact area,
see Equation 3 [5].
(3)
This can then be used to modify Equation 2 to give the coefficient of friction as a
function of two material properties, see Equation 4.
(4)
The same general reasoning can be applied to systems where thin coatings or lubricants
are introduced at the tribological interface of smooth surfaces. In this case the
properties of the intermediate layer will have a large impact on the friction behavior.
This will be treated in more detail in a section of its own, see Lubrication.
Finally, it is important to emphasize that the coefficient of friction, µ, is not really a
material parameter, but rather a property of the system as a whole. The equations
presented above are by no means to be considered natural laws, but rather as simplified
models and descriptions to aid the understanding of friction in general terms.
2.1.3 Lubrication
It is intuitively known by many that the friction between dry, unlubricated surfaces is
generally relatively high, leading to high energy losses and possibly increased wear. To
battle this problem, one can introduce small amounts of a lubricant at the interface
between the moving parts. The lubricant can be in the form of a liquid, a solid or even
a gas. Normally, only a very small amount is required to drastically change the friction
and wear behavior of the system for the better. While this is the primary purpose of
lubricants, the desired properties of lubricants can be summarized as the following [6,7]:
4
Separate surfaces
Reduce friction
Protect against corrosion
Cool the system
Electrically isolate
Transfer power
Reduce vibrations
Carry away debris
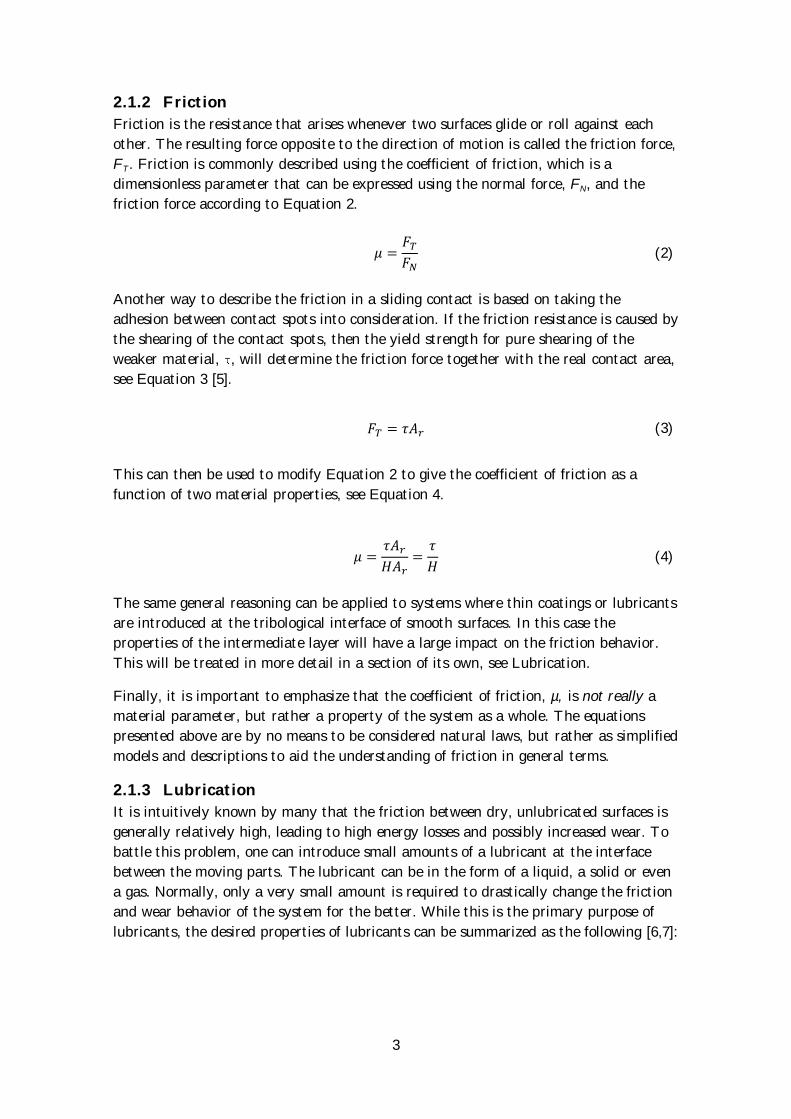
Lubricated contacts can be categorized into three lubrication regimes boundary
lubrication, mixed lubrication and full film lubrication. These regimes are illustrated
using a so called Stribeck curve, as shown in Figure 3. It shows the friction coefficient,
µ, as a function of the viscosity of the lubricant ( ), sliding speed ( ), and the applied
load (P) [5].
Figure 3: A schematic illustration of a Stribeck curve and the corresponding lubrication regimes Boundary lubrication (I), mixed lubrication (II) and full film lubrication (III).
Boundary lubrication happens when the lubricant cannot support a high enough
pressure to fully separate the surfaces. In many cases a thin tribofilm is formed in the
contact, often due to lubricant additives, that has a lower sliding resistance than a dry
contact. The friction is mainly determined by how easily the tribofilm is sheared, while
the viscosity of the lubricant does not matter that much.
Full film lubrication occurs when the two surfaces are fully separated from each other.
The load is completely carried by the lubricant itself, which means that the friction is
all in all determined by the viscosity of the lubricant and is independent of the
surfaces.
Mixed lubrication occurs in the transition between boundary and full film regimes. The
friction is determined by both the shearing resistance of the tribofilm and the viscosity
of the lubricant.
In many cases full film lubrication is desired, as it combines low friction with low wear,
but it is of course not possible to obtain for all systems since a relatively small load and
high viscosity and/or high sliding speed is required. The development of materials for
systems that work in the boundary lubrication regime is therefore an important
research area. The experiments carried out in this work were all performed in the
boundary lubrication regime.
P
µ
5
2.1.4 Additives
Even though the base fluid by itself already lives up to many of the desired properties
stated above, additives are commonly incorporated to promote certain features.
Additives allow the lubricant to work at a wider temperature range and at higher loads
as well as it is prolonging the life of the lubricant and the involved mechanical parts. In
general terms, these additives can be put into the following categories:
Friction modifiers (FM). These additives are added to lubricants to reduce friction.
They are polar molecules, commonly fatty acids containing 13 to 18 carbons, that
adsorb on the surfaces in either monolayers or multilayers, forming thin films that are
asperities. By this mechanism it follows that FM
molecules only function in the boundary or mixed lubrication regimes.
Antiwear (AW) additives. Compared to FM, AW additives adsorb more strongly,
and are able to reduce wear of the involved surfaces by forming thicker films that serve
to separate the surfaces at even higher loads. The most common AW additive is a zinc,
sulfur and phosphorus containing compound called ZDDP (zincdialkyldithiophosphate).
Extreme pressure (EP) additives. EP additives are primarily used for contacts
under heavy load, for example gears.
Both AW and EP additives are activated by pressure, temperature as well as shear
forces. At elevated temperatures, they chemisorb at surfaces, while at more moderate
temperatures they are more likely to physisorb. In general, EP additives are activated
under more extreme conditions than AW additives.
Corrosion inhibitors. These additives are most commonly film forming substances
that either physisorb or chemisorb at exposed metal surfaces and because of that
prevent water and oxygen from reaching the surface. They are normally phosphorus-
based (phosphites), nitrogen-based (amines) and sulphur-based (sulphonates).
Viscosity modifiers & engine oil viscosity grades. The purpose of viscosity
modifiers is to allow the lubricant to work over a wider temperature range. These
additives consist of high molecular weight polymers that unfold at high temperatures,
leading to an increase in viscosity. At low temperatures they curl up, leading to a less
pronounced increase in viscosity.
The Society of Automotive Engineers (SAE) engine oil viscosity grade standard
classifies engine oils based on their viscosities: The higher the SAE-number, the higher
the viscosity at 100 ◦C. There are monograde and multigrade oils which work in
different temperature ranges. A monograde oil has to be changed twice a year, before
and after winter, since the viscosity is too high at low temperatures (shearing the
lubricant requires too much energy) and too low at high temperatures (difficulty
building enough pressure in the lubricant to separate surfaces). Multigrade oils on the
other hand are formulated using viscosity modifiers to eliminate the need for seasonal-
dependent oil changes. For example, a SAE 5W-30 engine oil has the same viscosity as
an SAE 30 oil at high temperatures, but at lower temperatures, it performs like an SAE
5 oil.
6
Other than these additives there may also be dispersants, emulsifiers and demulsifiers,
pour point depressants and substances that prevent foam formation added to the
lubricant.
2.1.5 Wear
Throughout this work, wear is defined as the net loss of material as surfaces move
relative to each other. Surface modifications without material loss will not be
considered wear. The wear rate [m3/Nm] can be expressed using the wear coefficient, K,
which is a dimensionless parameter and is defined by Archard's wear equation [5]:
(5)
Here, FN is the applied load, H is the hardness of the affected material, V is the volume
of the worn off material and S is the total sliding distance. In this work, the wear
volumes are calculated directly from white light interferometry.
7
2.2 Analysis methods A variety of analysis methods were used to give both qualitative and quantitative data
on topography, wear, surface chemistry and friction mechanisms. In this section these
methods are presented along with brief descriptions.
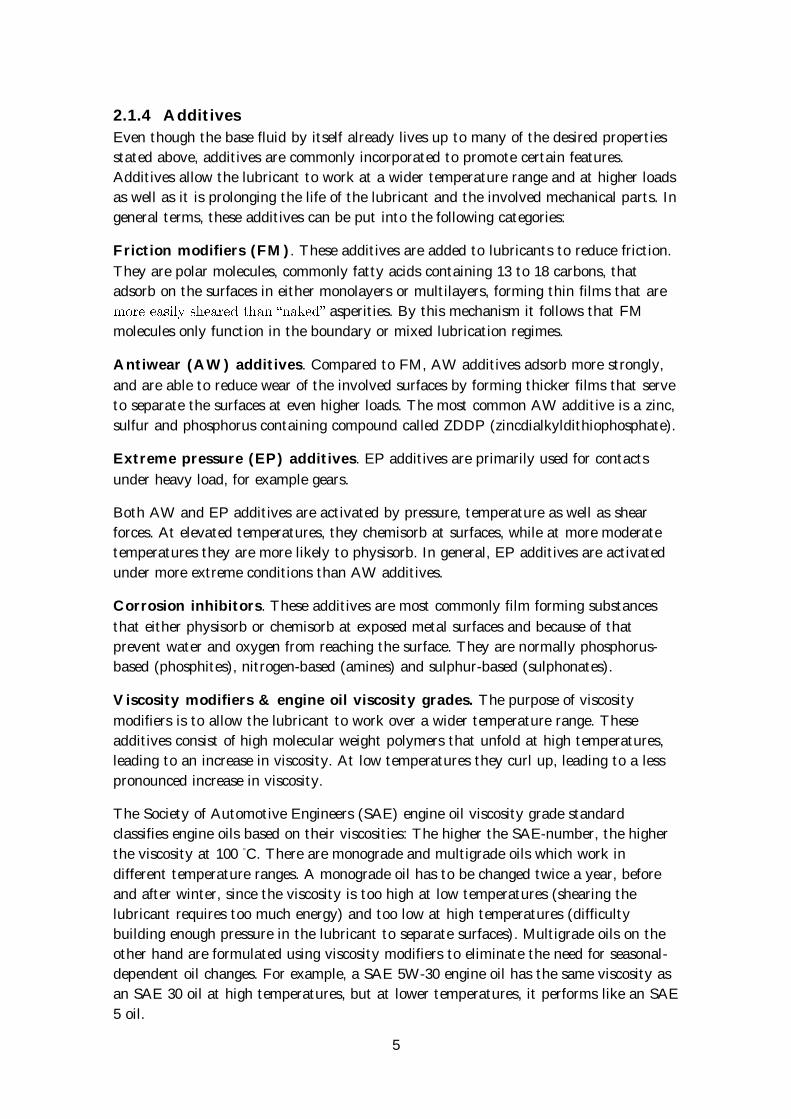
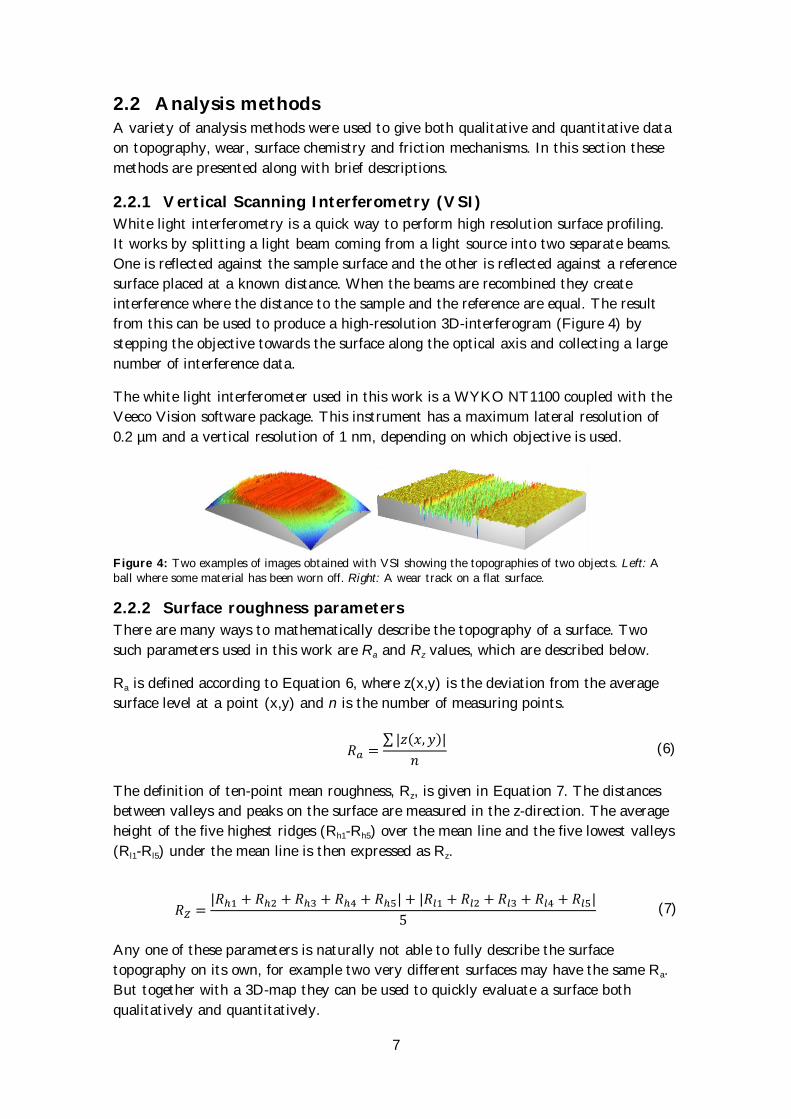
2.2.1 Vertical Scanning Interferometry (VSI)
White light interferometry is a quick way to perform high resolution surface profiling.
It works by splitting a light beam coming from a light source into two separate beams.
One is reflected against the sample surface and the other is reflected against a reference
surface placed at a known distance. When the beams are recombined they create
interference where the distance to the sample and the reference are equal. The result
from this can be used to produce a high-resolution 3D-interferogram (Figure 4) by
stepping the objective towards the surface along the optical axis and collecting a large
number of interference data.
The white light interferometer used in this work is a WYKO NT1100 coupled with the
Veeco Vision software package. This instrument has a maximum lateral resolution of
0.2 µm and a vertical resolution of 1 nm, depending on which objective is used.
Figure 4: Two examples of images obtained with VSI showing the topographies of two objects. Left: A ball where some material has been worn off. Right: A wear track on a flat surface.
2.2.2 Surface roughness parameters
There are many ways to mathematically describe the topography of a surface. Two
such parameters used in this work are Ra and Rz values, which are described below.
Ra is defined according to Equation 6, where z(x,y) is the deviation from the average
surface level at a point (x,y) and n is the number of measuring points.
(6)
The definition of ten-point mean roughness, Rz, is given in Equation 7. The distances
between valleys and peaks on the surface are measured in the z-direction. The average
height of the five highest ridges (Rh1-Rh5) over the mean line and the five lowest valleys
(Rl1-Rl5) under the mean line is then expressed as Rz.
(7)
Any one of these parameters is naturally not able to fully describe the surface
topography on its own, for example two very different surfaces may have the same Ra.
But together with a 3D-map they can be used to quickly evaluate a surface both
qualitatively and quantitatively.
8
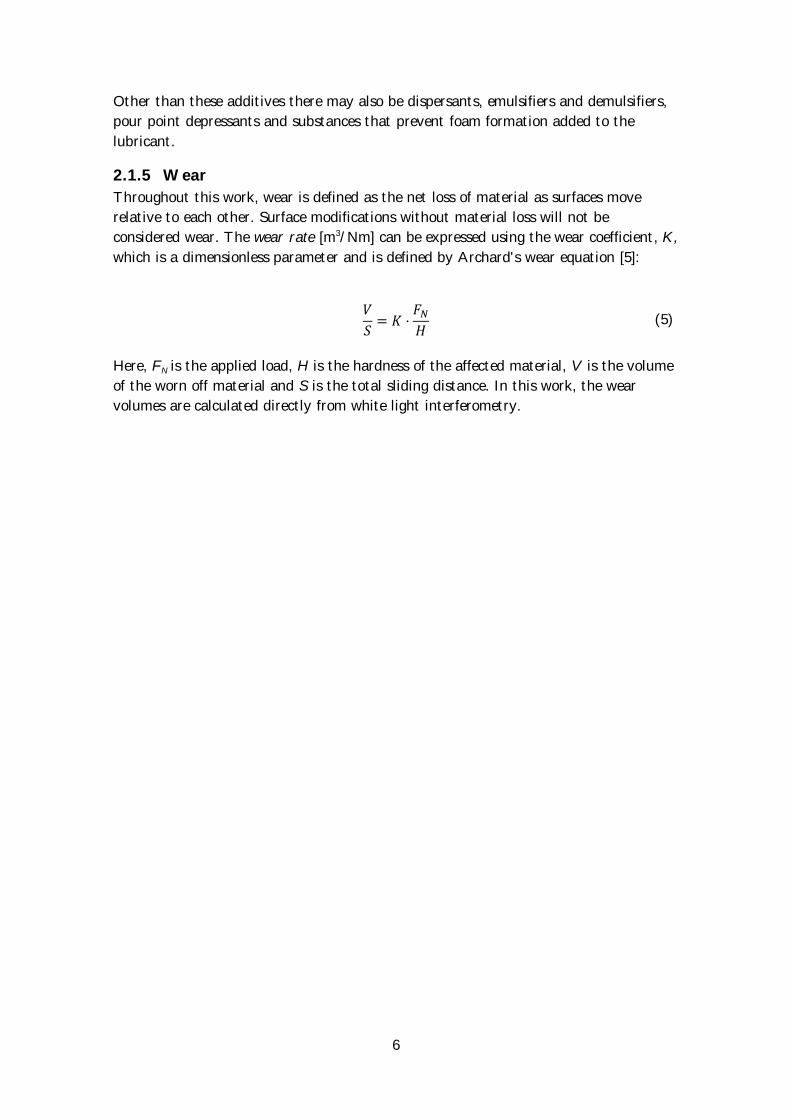
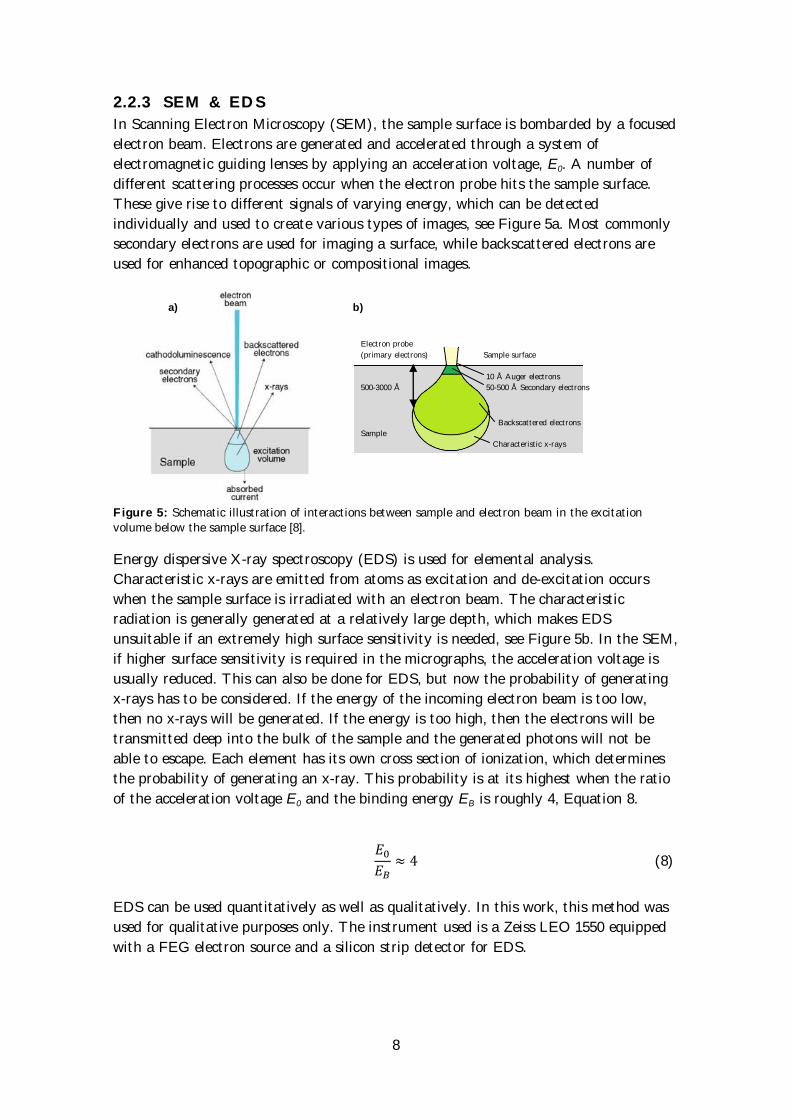
2.2.3 SEM & EDS
In Scanning Electron Microscopy (SEM), the sample surface is bombarded by a focused
electron beam. Electrons are generated and accelerated through a system of
electromagnetic guiding lenses by applying an acceleration voltage, E0. A number of
different scattering processes occur when the electron probe hits the sample surface.
These give rise to different signals of varying energy, which can be detected
individually and used to create various types of images, see Figure 5a. Most commonly
secondary electrons are used for imaging a surface, while backscattered electrons are
used for enhanced topographic or compositional images.
Figure 5: Schematic illustration of interactions between sample and electron beam in the excitation
volume below the sample surface [8].
Energy dispersive X-ray spectroscopy (EDS) is used for elemental analysis.
Characteristic x-rays are emitted from atoms as excitation and de-excitation occurs
when the sample surface is irradiated with an electron beam. The characteristic
radiation is generally generated at a relatively large depth, which makes EDS
unsuitable if an extremely high surface sensitivity is needed, see Figure 5b. In the SEM,
if higher surface sensitivity is required in the micrographs, the acceleration voltage is
usually reduced. This can also be done for EDS, but now the probability of generating
x-rays has to be considered. If the energy of the incoming electron beam is too low,
then no x-rays will be generated. If the energy is too high, then the electrons will be
transmitted deep into the bulk of the sample and the generated photons will not be
able to escape. Each element has its own cross section of ionization, which determines
the probability of generating an x-ray. This probability is at its highest when the ratio
of the acceleration voltage E0 and the binding energy EB is roughly 4, Equation 8.
(8)
EDS can be used quantitatively as well as qualitatively. In this work, this method was
used for qualitative purposes only. The instrument used is a Zeiss LEO 1550 equipped
with a FEG electron source and a silicon strip detector for EDS.
Electron probe
(primary electrons) Sample surface
10 Å Auger electrons
500-3000 Å 50-500 Å Secondary electrons
Backscattered electrons
Sample
Characteristic x-rays
a) b)
9
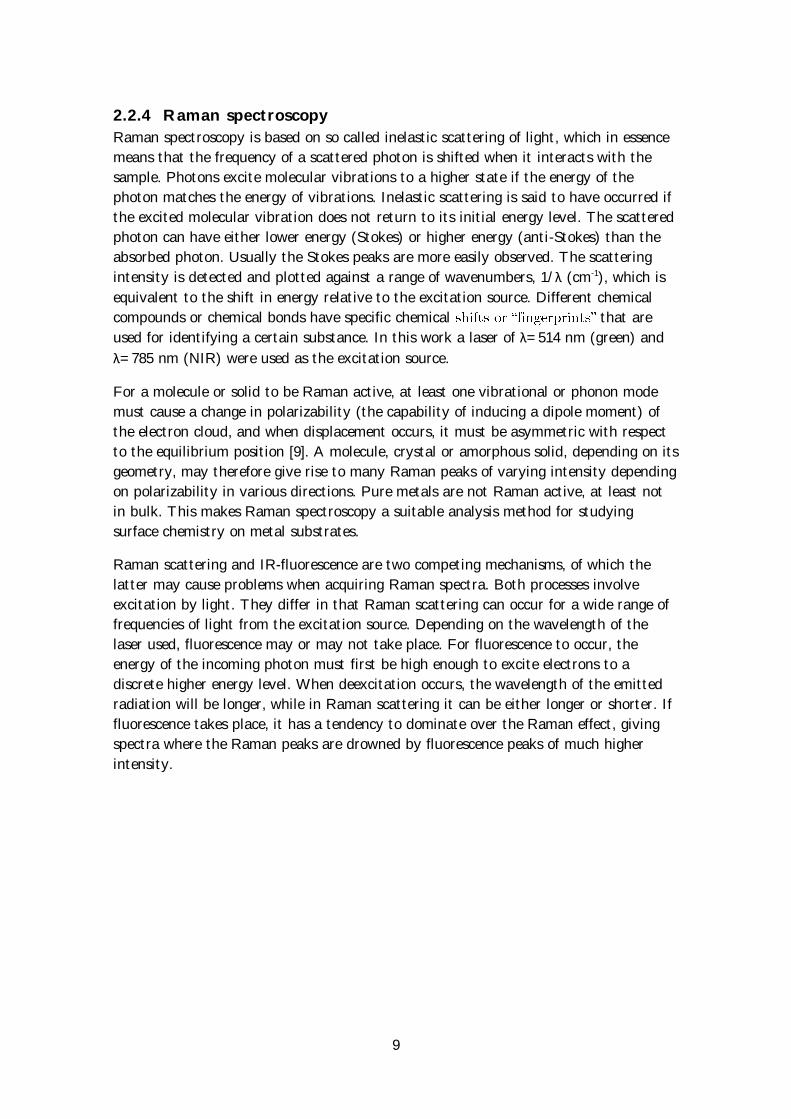
2.2.4 Raman spectroscopy
Raman spectroscopy is based on so called inelastic scattering of light, which in essence
means that the frequency of a scattered photon is shifted when it interacts with the
sample. Photons excite molecular vibrations to a higher state if the energy of the
photon matches the energy of vibrations. Inelastic scattering is said to have occurred if
the excited molecular vibration does not return to its initial energy level. The scattered
photon can have either lower energy (Stokes) or higher energy (anti-Stokes) than the
absorbed photon. Usually the Stokes peaks are more easily observed. The scattering
intensity is detected and plotted against a range of wavenumbers, 1/λ (cm-1), which is
equivalent to the shift in energy relative to the excitation source. Different chemical
compounds or chemical bonds have specific chemical that are
used for identifying a certain substance. In this work a laser of λ=514 nm (green) and
λ=785 nm (NIR) were used as the excitation source.
For a molecule or solid to be Raman active, at least one vibrational or phonon mode
must cause a change in polarizability (the capability of inducing a dipole moment) of
the electron cloud, and when displacement occurs, it must be asymmetric with respect
to the equilibrium position [9]. A molecule, crystal or amorphous solid, depending on its
geometry, may therefore give rise to many Raman peaks of varying intensity depending
on polarizability in various directions. Pure metals are not Raman active, at least not
in bulk. This makes Raman spectroscopy a suitable analysis method for studying
surface chemistry on metal substrates.
Raman scattering and IR-fluorescence are two competing mechanisms, of which the
latter may cause problems when acquiring Raman spectra. Both processes involve
excitation by light. They differ in that Raman scattering can occur for a wide range of
frequencies of light from the excitation source. Depending on the wavelength of the
laser used, fluorescence may or may not take place. For fluorescence to occur, the
energy of the incoming photon must first be high enough to excite electrons to a
discrete higher energy level. When deexcitation occurs, the wavelength of the emitted
radiation will be longer, while in Raman scattering it can be either longer or shorter. If
fluorescence takes place, it has a tendency to dominate over the Raman effect, giving
spectra where the Raman peaks are drowned by fluorescence peaks of much higher
intensity.
10
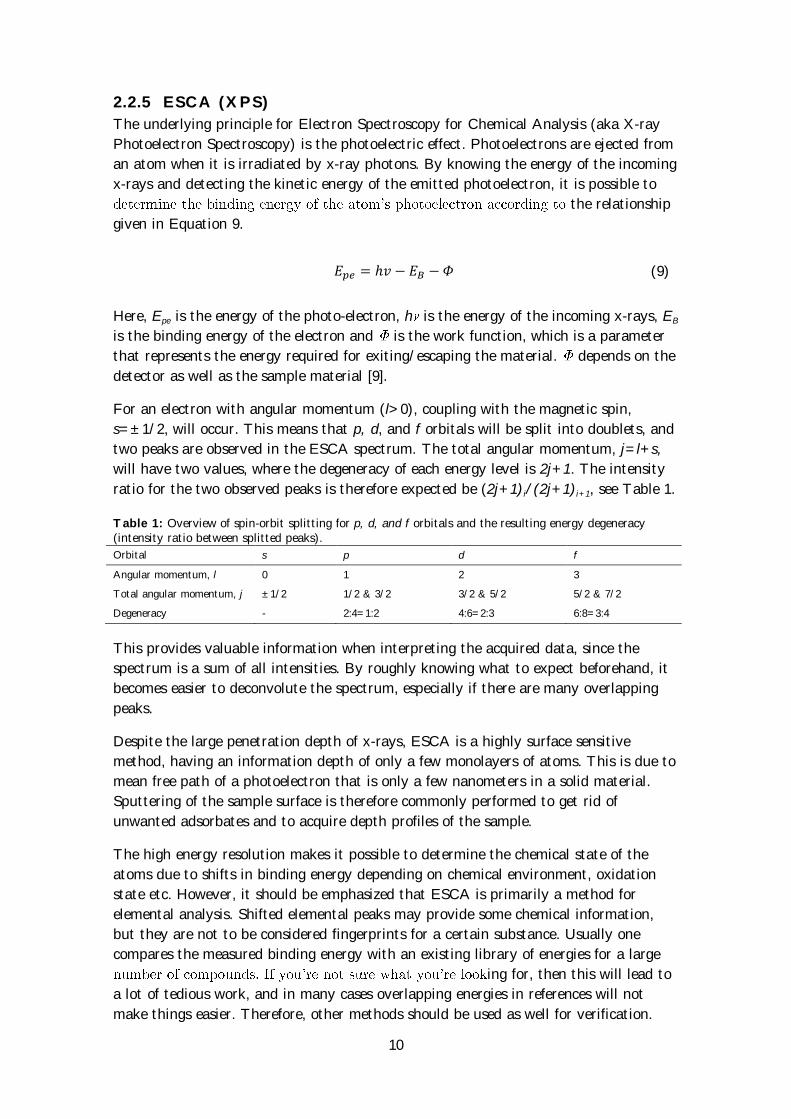
2.2.5 ESCA (XPS)
The underlying principle for Electron Spectroscopy for Chemical Analysis (aka X-ray
Photoelectron Spectroscopy) is the photoelectric effect. Photoelectrons are ejected from
an atom when it is irradiated by x-ray photons. By knowing the energy of the incoming
x-rays and detecting the kinetic energy of the emitted photoelectron, it is possible to
the relationship
given in Equation 9.
(9)
Here, Epe is the energy of the photo-electron, h is the energy of the incoming x-rays, EB
is the binding energy of the electron and is the work function, which is a parameter
that represents the energy required for exiting/escaping the material. depends on the
detector as well as the sample material [9].
For an electron with angular momentum (l>0), coupling with the magnetic spin,
s=±1/2, will occur. This means that p, d, and f orbitals will be split into doublets, and
two peaks are observed in the ESCA spectrum. The total angular momentum, j=l+s,
will have two values, where the degeneracy of each energy level is 2j+1. The intensity
ratio for the two observed peaks is therefore expected be (2j+1)i/(2j+1)i+1, see Table 1.
Table 1: Overview of spin-orbit splitting for p, d, and f orbitals and the resulting energy degeneracy (intensity ratio between splitted peaks).
Orbital s p d f
Angular momentum, l 0 1 2 3
Total angular momentum, j ±1/2 1/2 & 3/2 3/2 & 5/2 5/2 & 7/2
Degeneracy - 2:4=1:2 4:6=2:3 6:8=3:4
This provides valuable information when interpreting the acquired data, since the
spectrum is a sum of all intensities. By roughly knowing what to expect beforehand, it
becomes easier to deconvolute the spectrum, especially if there are many overlapping
peaks.
Despite the large penetration depth of x-rays, ESCA is a highly surface sensitive
method, having an information depth of only a few monolayers of atoms. This is due to
mean free path of a photoelectron that is only a few nanometers in a solid material.
Sputtering of the sample surface is therefore commonly performed to get rid of
unwanted adsorbates and to acquire depth profiles of the sample.
The high energy resolution makes it possible to determine the chemical state of the
atoms due to shifts in binding energy depending on chemical environment, oxidation
state etc. However, it should be emphasized that ESCA is primarily a method for
elemental analysis. Shifted elemental peaks may provide some chemical information,
but they are not to be considered fingerprints for a certain substance. Usually one
compares the measured binding energy with an existing library of energies for a large
ing for, then this will lead to
a lot of tedious work, and in many cases overlapping energies in references will not
make things easier. Therefore, other methods should be used as well for verification.
11
Some major drawbacks of the ESCA method are the low lateral resolution of roughly
200 µm, yielding a detection limit of only 0.1-2 at% and the fact that ultrahigh vacuum
is needed for analysis.
2.2.6 TEM & EELS
Transmission electron microscopy (TEM) gives information about the local
microstructure and composition with extremely high resolution. Electrons are
transmitted through a thin sample by applying an acceleration voltage of 200-300 kV.
Elastically scattered electrons are used for imaging microstructure as well as
determining crystal structure and lattice parameters through diffraction. Inelastically
scattered electrons can be used to determine elemental and chemical composition with
high spatial resolution, for instance with electron energy loss spectroscopy (EELS). In
EELS one measures how much energy electrons with a well-known kinetic energy lose
when they pass through a sample. Inelastic interactions include inner-shell ionization
and plasmon as well as phonon excitations.
12
3 Experimental details
3.1 The tribological test rig
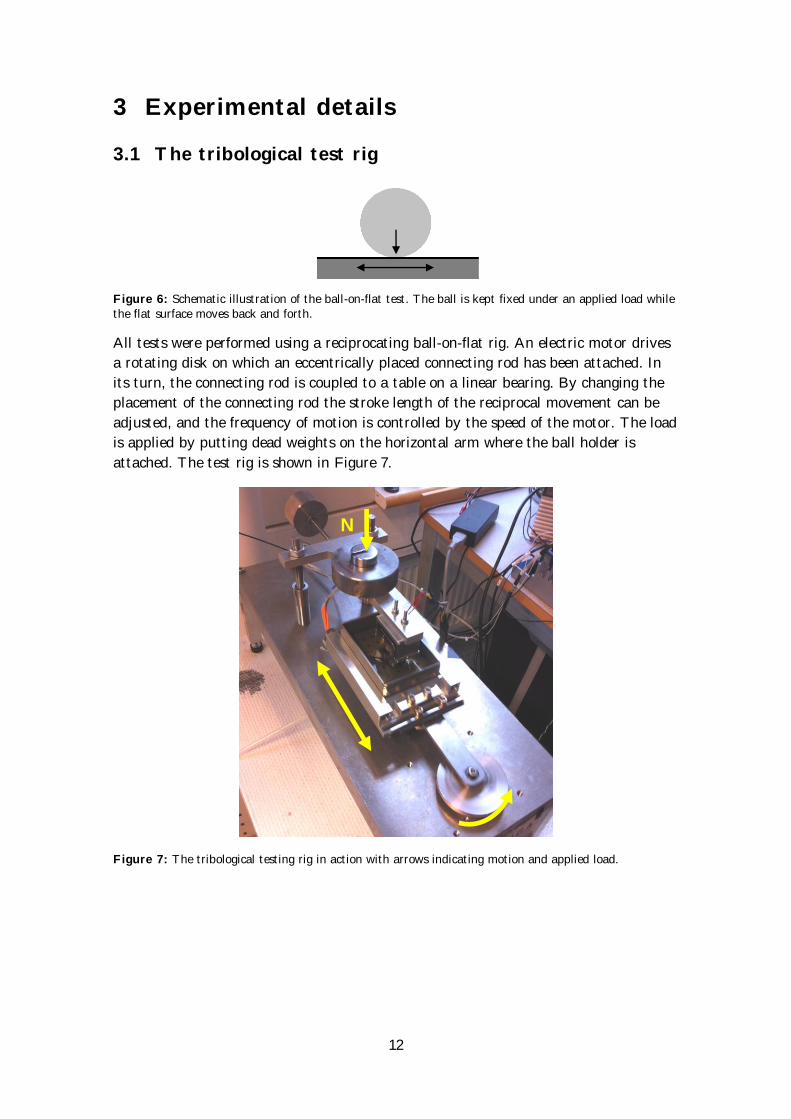
Figure 6: Schematic illustration of the ball-on-flat test. The ball is kept fixed under an applied load while the flat surface moves back and forth.
All tests were performed using a reciprocating ball-on-flat rig. An electric motor drives
a rotating disk on which an eccentrically placed connecting rod has been attached. In
its turn, the connecting rod is coupled to a table on a linear bearing. By changing the
placement of the connecting rod the stroke length of the reciprocal movement can be
adjusted, and the frequency of motion is controlled by the speed of the motor. The load
is applied by putting dead weights on the horizontal arm where the ball holder is
attached. The test rig is shown in Figure 7.
Figure 7: The tribological testing rig in action with arrows indicating motion and applied load.
N
13
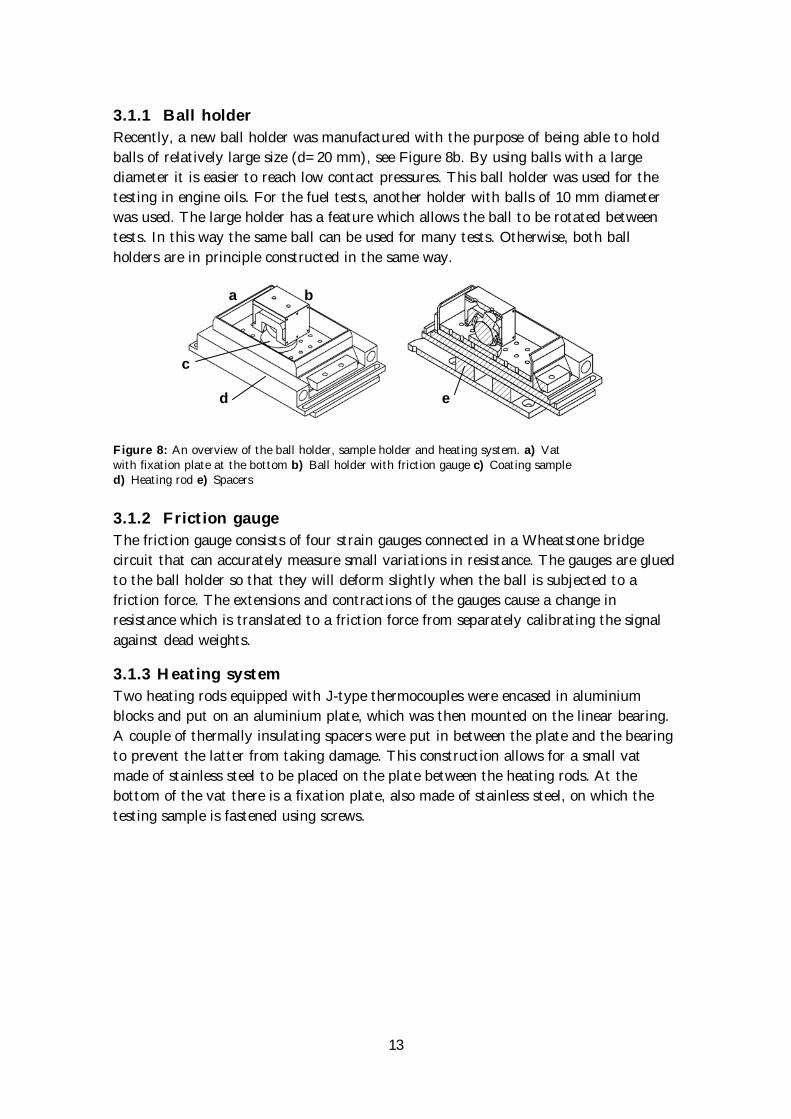
3.1.1 Ball holder
Recently, a new ball holder was manufactured with the purpose of being able to hold
balls of relatively large size (d=20 mm), see Figure 8b. By using balls with a large
diameter it is easier to reach low contact pressures. This ball holder was used for the
testing in engine oils. For the fuel tests, another holder with balls of 10 mm diameter
was used. The large holder has a feature which allows the ball to be rotated between
tests. In this way the same ball can be used for many tests. Otherwise, both ball
holders are in principle constructed in the same way.
3.1.2 Friction gauge
The friction gauge consists of four strain gauges connected in a Wheatstone bridge
circuit that can accurately measure small variations in resistance. The gauges are glued
to the ball holder so that they will deform slightly when the ball is subjected to a
friction force. The extensions and contractions of the gauges cause a change in
resistance which is translated to a friction force from separately calibrating the signal
against dead weights.
3.1.3 Heating system
Two heating rods equipped with J-type thermocouples were encased in aluminium
blocks and put on an aluminium plate, which was then mounted on the linear bearing.
A couple of thermally insulating spacers were put in between the plate and the bearing
to prevent the latter from taking damage. This construction allows for a small vat
made of stainless steel to be placed on the plate between the heating rods. At the
bottom of the vat there is a fixation plate, also made of stainless steel, on which the
testing sample is fastened using screws.
Figure 8: An overview of the ball holder, sample holder and heating system. a) Vat
with fixation plate at the bottom b) Ball holder with friction gauge c) Coating sample d) Heating rod e) Spacers
a b
c
d e
14
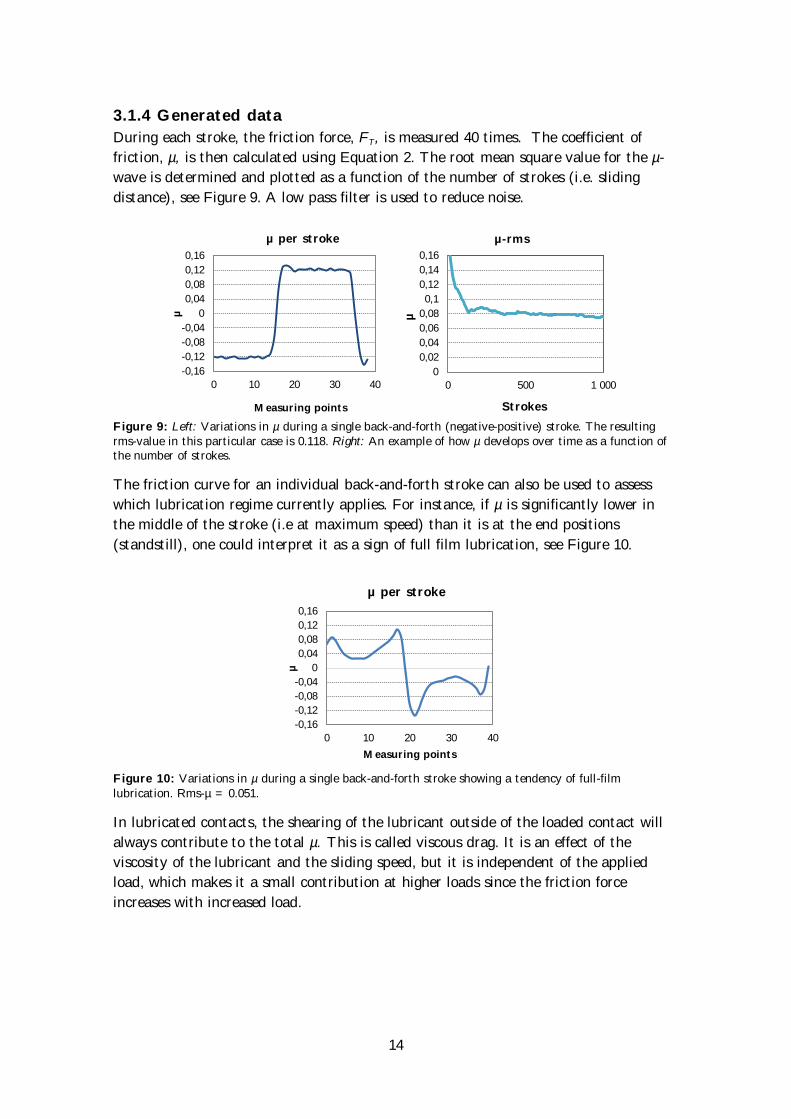
3.1.4 Generated data
During each stroke, the friction force, FT, is measured 40 times. The coefficient of
friction, µ, is then calculated using Equation 2. The root mean square value for the µ-
wave is determined and plotted as a function of the number of strokes (i.e. sliding
distance), see Figure 9. A low pass filter is used to reduce noise.
Figure 9: Left: Variations in µ during a single back-and-forth (negative-positive) stroke. The resulting rms-value in this particular case is 0.118. Right: An example of how µ develops over time as a function of the number of strokes.
The friction curve for an individual back-and-forth stroke can also be used to assess
which lubrication regime currently applies. For instance, if µ is significantly lower in
the middle of the stroke (i.e at maximum speed) than it is at the end positions
(standstill), one could interpret it as a sign of full film lubrication, see Figure 10.
Figure 10: Variations in µ during a single back-and-forth stroke showing a tendency of full-film lubrication. Rms-µ = 0.051.
In lubricated contacts, the shearing of the lubricant outside of the loaded contact will
always contribute to the total µ. This is called viscous drag. It is an effect of the
viscosity of the lubricant and the sliding speed, but it is independent of the applied
load, which makes it a small contribution at higher loads since the friction force
increases with increased load.
-0,16
-0,12
-0,08
-0,04
0
0,04
0,08
0,12
0,16
0 10 20 30 40
µ
Measuring points
µ per stroke
0
0,02
0,04
0,06
0,08
0,1
0,12
0,14
0,16
0 500 1 000
µ
Strokes
µ-rms
-0,16
-0,12
-0,08
-0,04
0
0,04
0,08
0,12
0,16
0 10 20 30 40
µ
Measuring points
µ per stroke
15
3.2 The coatings
Three DLC coatings were evaluated in this work. A summary of these can be found in
Table 2, accompanied by some more detailed descriptions.
Table 2: Summary of studied coatings.
Name Deposition Composition Thickness
[µm]
Hardness
[HV] Ra [nm] Rz [nm]
DLC 1 PA-CVD
Cr+a-C:H:W +
a-C:H
1.6-1.7 1500 13 440
DLC 2 PA-CVD Cr+a-C:H:Si 2.1-2.2 1900 10 300
Multilayer
DLC PVD
Cr+(aC:H:W + a-
C:H)×7 +
a-C:H:W
3.1-3.2 700 12 400
Reference High speed
steel puck Fe, C, Cr, Mo, V, W Bulk 700 8 270
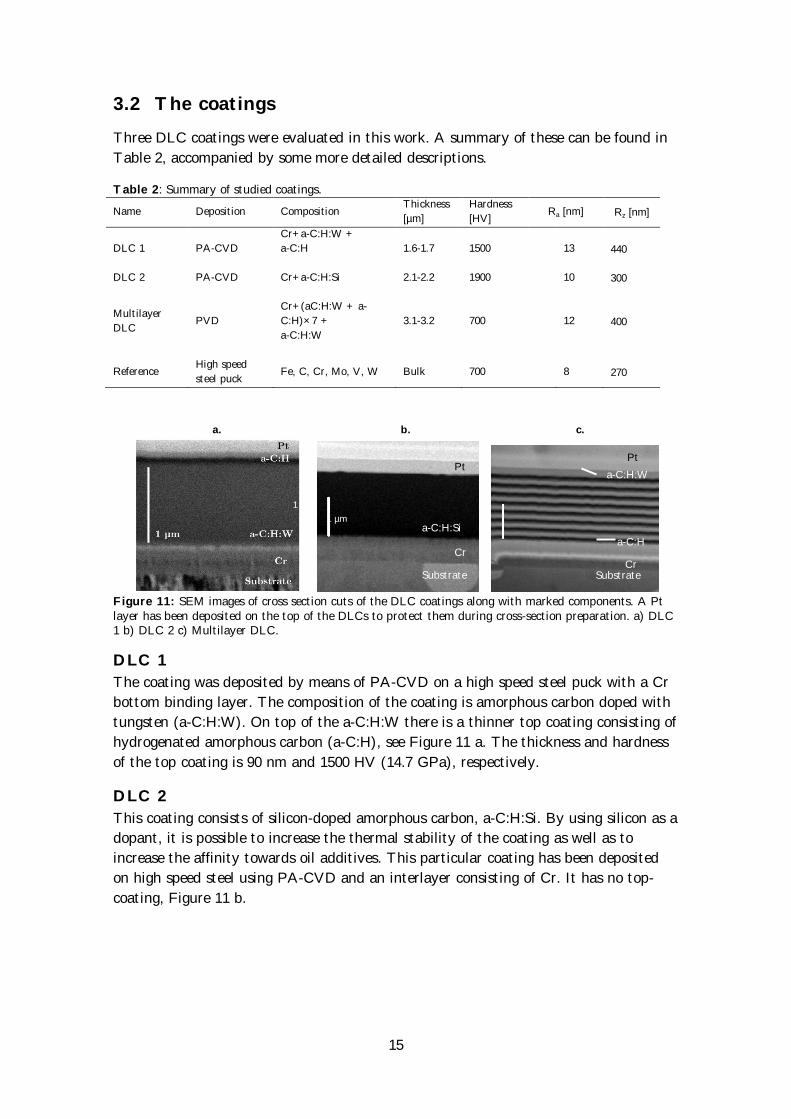
Figure 11: SEM images of cross section cuts of the DLC coatings along with marked components. A Pt layer has been deposited on the top of the DLCs to protect them during cross-section preparation. a) DLC 1 b) DLC 2 c) Multilayer DLC.
DLC 1
The coating was deposited by means of PA-CVD on a high speed steel puck with a Cr
bottom binding layer. The composition of the coating is amorphous carbon doped with
tungsten (a-C:H:W). On top of the a-C:H:W there is a thinner top coating consisting of
hydrogenated amorphous carbon (a-C:H), see Figure 11 a. The thickness and hardness
of the top coating is 90 nm and 1500 HV (14.7 GPa), respectively.
DLC 2
This coating consists of silicon-doped amorphous carbon, a-C:H:Si. By using silicon as a
dopant, it is possible to increase the thermal stability of the coating as well as to
increase the affinity towards oil additives. This particular coating has been deposited
on high speed steel using PA-CVD and an interlayer consisting of Cr. It has no top-
coating, Figure 11 b.
1 µm
a-C:H:Si
Cr
Substrate
Substrate Cr
a-C:H:W
a-C:H
Pt
1 µm
Pt
a.
b.
c.
16
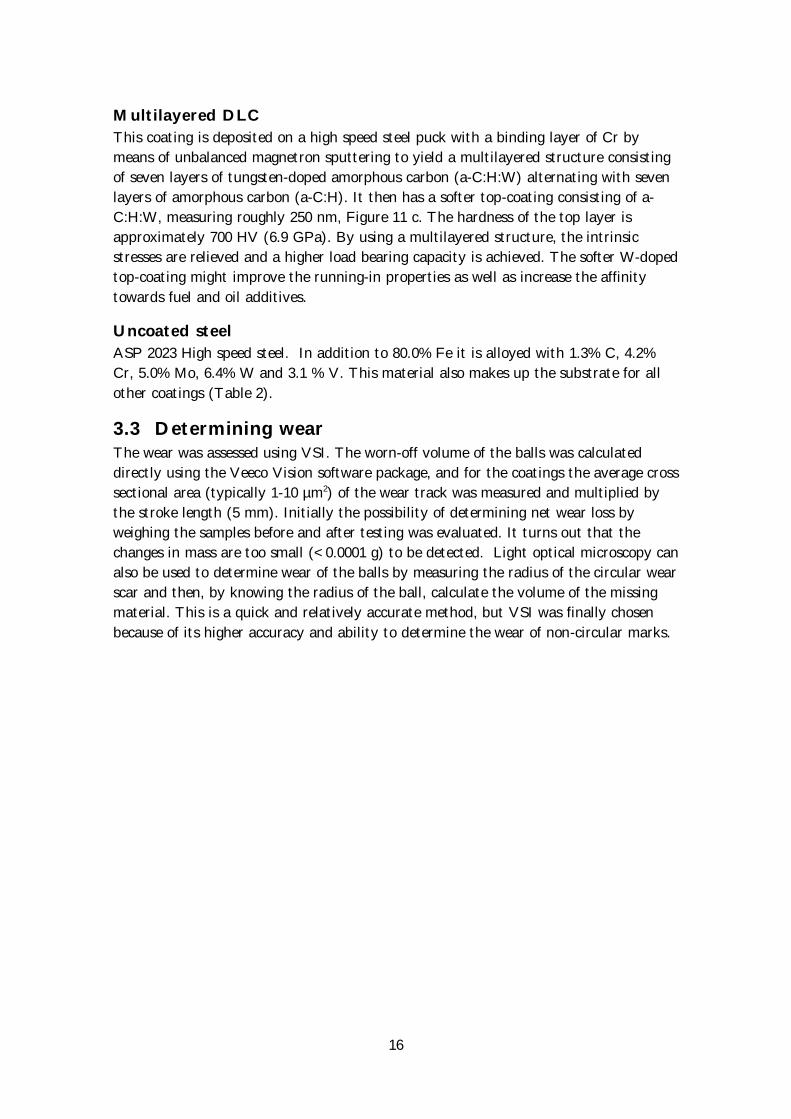
Multilayered DLC
This coating is deposited on a high speed steel puck with a binding layer of Cr by
means of unbalanced magnetron sputtering to yield a multilayered structure consisting
of seven layers of tungsten-doped amorphous carbon (a-C:H:W) alternating with seven
layers of amorphous carbon (a-C:H). It then has a softer top-coating consisting of a-
C:H:W, measuring roughly 250 nm, Figure 11 c. The hardness of the top layer is
approximately 700 HV (6.9 GPa). By using a multilayered structure, the intrinsic
stresses are relieved and a higher load bearing capacity is achieved. The softer W-doped
top-coating might improve the running-in properties as well as increase the affinity
towards fuel and oil additives.
Uncoated steel
ASP 2023 High speed steel. In addition to 80.0% Fe it is alloyed with 1.3% C, 4.2%
Cr, 5.0% Mo, 6.4% W and 3.1 % V. This material also makes up the substrate for all
other coatings (Table 2).
3.3 Determining wear The wear was assessed using VSI. The worn-off volume of the balls was calculated
directly using the Veeco Vision software package, and for the coatings the average cross
sectional area (typically 1-10 µm2) of the wear track was measured and multiplied by
the stroke length (5 mm). Initially the possibility of determining net wear loss by
weighing the samples before and after testing was evaluated. It turns out that the
changes in mass are too small (<0.0001 g) to be detected. Light optical microscopy can
also be used to determine wear of the balls by measuring the radius of the circular wear
scar and then, by knowing the radius of the ball, calculate the volume of the missing
material. This is a quick and relatively accurate method, but VSI was finally chosen
because of its higher accuracy and ability to determine the wear of non-circular marks.
17
A Testing in fuels
18
A. Fuels The tribological properties of a couple of DLC:s in various conventional as well as
alternative fuels were tested in an effort to gain a deeper understanding of the
mechanisms behind some results previously obtained by F. Gustavsson et al [10].
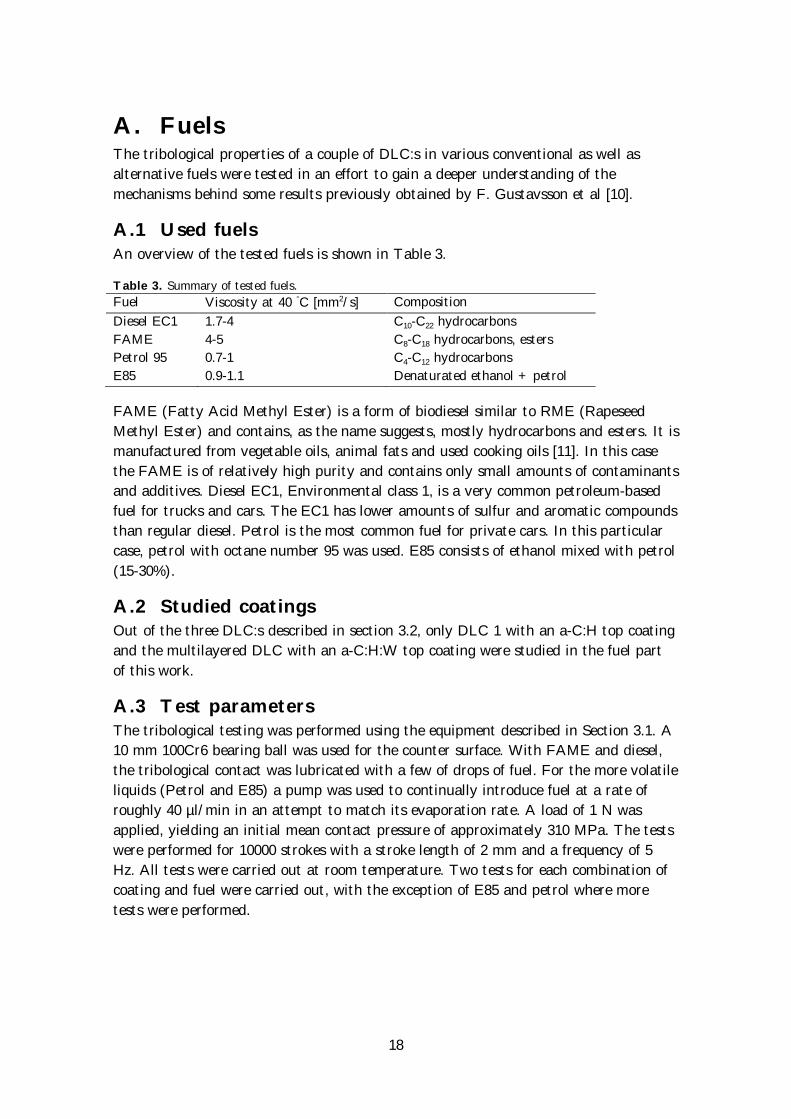
A.1 Used fuelsAn overview of the tested fuels is shown in Table 3.
Table 3. Summary of tested fuels.
Fuel Viscosity at 40 ◦C [mm2/s] Composition
Diesel EC1 1.7-4 C10-C22 hydrocarbons
FAME 4-5 C8-C18 hydrocarbons, esters
Petrol 95 0.7-1 C4-C12 hydrocarbons
E85 0.9-1.1 Denaturated ethanol + petrol
FAME (Fatty Acid Methyl Ester) is a form of biodiesel similar to RME (Rapeseed
Methyl Ester) and contains, as the name suggests, mostly hydrocarbons and esters. It is
manufactured from vegetable oils, animal fats and used cooking oils [11]. In this case
the FAME is of relatively high purity and contains only small amounts of contaminants
and additives. Diesel EC1, Environmental class 1, is a very common petroleum-based
fuel for trucks and cars. The EC1 has lower amounts of sulfur and aromatic compounds
than regular diesel. Petrol is the most common fuel for private cars. In this particular
case, petrol with octane number 95 was used. E85 consists of ethanol mixed with petrol
(15-30%).
A.2 Studied coatings Out of the three DLC:s described in section 3.2, only DLC 1 with an a-C:H top coating
and the multilayered DLC with an a-C:H:W top coating were studied in the fuel part
of this work.
A.3 Test parameters The tribological testing was performed using the equipment described in Section 3.1. A
10 mm 100Cr6 bearing ball was used for the counter surface. With FAME and diesel,
the tribological contact was lubricated with a few of drops of fuel. For the more volatile
liquids (Petrol and E85) a pump was used to continually introduce fuel at a rate of
roughly 40 µl/min in an attempt to match its evaporation rate. A load of 1 N was
applied, yielding an initial mean contact pressure of approximately 310 MPa. The tests
were performed for 10000 strokes with a stroke length of 2 mm and a frequency of 5
Hz. All tests were carried out at room temperature. Two tests for each combination of
coating and fuel were carried out, with the exception of E85 and petrol where more
tests were performed.
19
A.4 Results
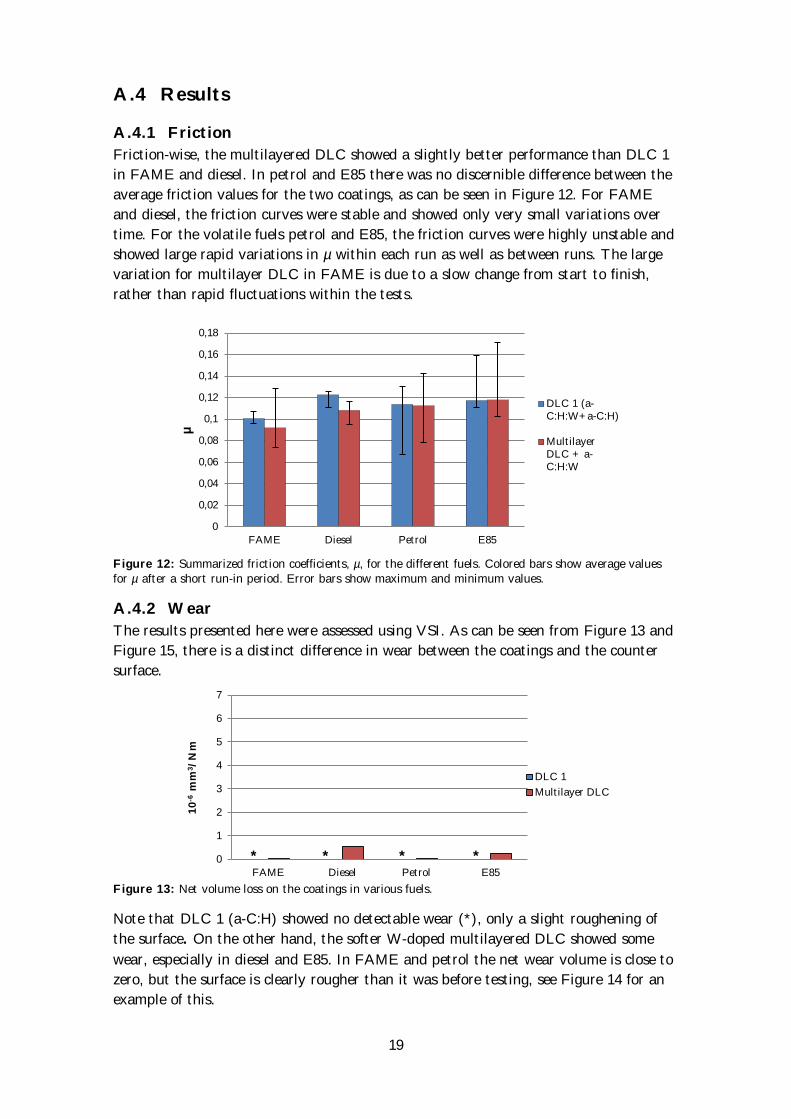
A.4.1 Friction
Friction-wise, the multilayered DLC showed a slightly better performance than DLC 1
in FAME and diesel. In petrol and E85 there was no discernible difference between the
average friction values for the two coatings, as can be seen in Figure 12. For FAME
and diesel, the friction curves were stable and showed only very small variations over
time. For the volatile fuels petrol and E85, the friction curves were highly unstable and
showed large rapid variations in µ within each run as well as between runs. The large
variation for multilayer DLC in FAME is due to a slow change from start to finish,
rather than rapid fluctuations within the tests.
Figure 12: Summarized friction coefficients, µ, for the different fuels. Colored bars show average values for µ after a short run-in period. Error bars show maximum and minimum values.
A.4.2 Wear
The results presented here were assessed using VSI. As can be seen from Figure 13 and
Figure 15, there is a distinct difference in wear between the coatings and the counter
surface.
Figure 13: Net volume loss on the coatings in various fuels.
Note that DLC 1 (a-C:H) showed no detectable wear (*), only a slight roughening of
the surface. On the other hand, the softer W-doped multilayered DLC showed some
wear, especially in diesel and E85. In FAME and petrol the net wear volume is close to
zero, but the surface is clearly rougher than it was before testing, see Figure 14 for an
example of this.
0
0,02
0,04
0,06
0,08
0,1
0,12
0,14
0,16
0,18
FAME Diesel Petrol E85
µ
DLC 1 (a-C:H:W+a-C:H)
Multilayer DLC + a-C:H:W
0
1
2
3
4
5
6
7
FAME Diesel Petrol E85
10
-6 m
m3/N
m
DLC 1
Multilayer DLC
* * * *
20
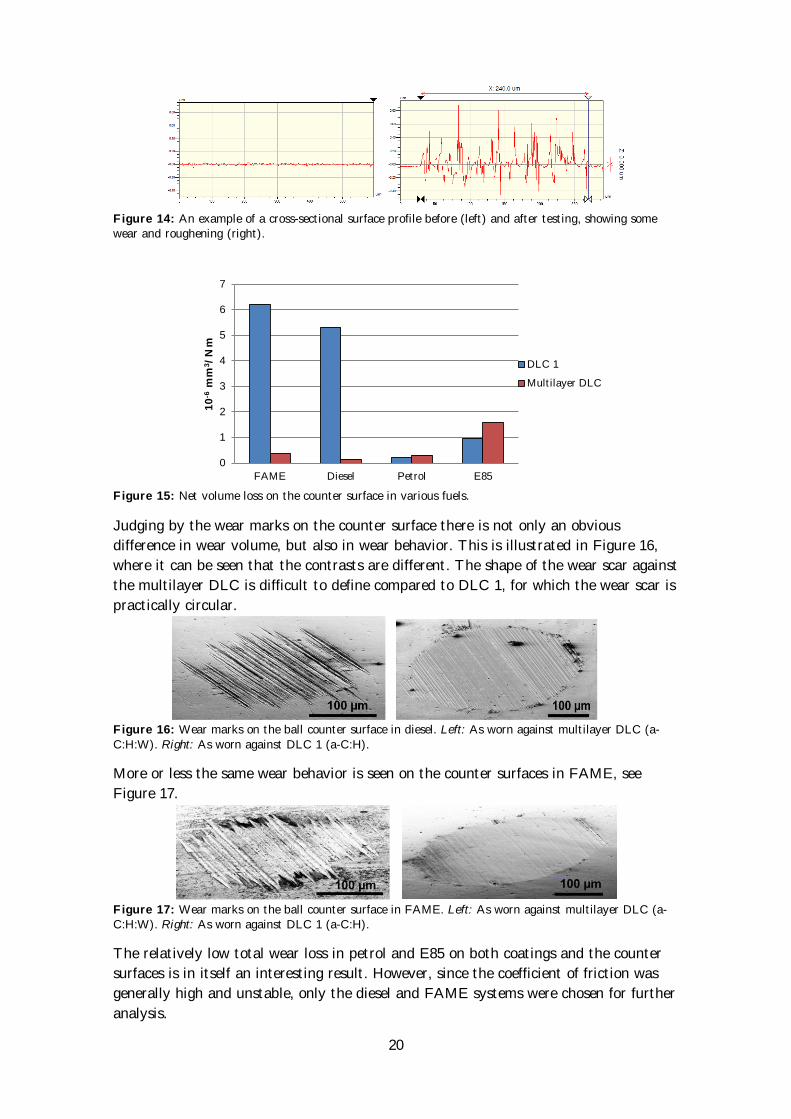
Figure 14: An example of a cross-sectional surface profile before (left) and after testing, showing some wear and roughening (right).
Figure 15: Net volume loss on the counter surface in various fuels.
Judging by the wear marks on the counter surface there is not only an obvious
difference in wear volume, but also in wear behavior. This is illustrated in Figure 16,
where it can be seen that the contrasts are different. The shape of the wear scar against
the multilayer DLC is difficult to define compared to DLC 1, for which the wear scar is
practically circular.
Figure 16: Wear marks on the ball counter surface in diesel. Left: As worn against multilayer DLC (a-
C:H:W). Right: As worn against DLC 1 (a-C:H).
More or less the same wear behavior is seen on the counter surfaces in FAME, see
Figure 17.
Figure 17: Wear marks on the ball counter surface in FAME. Left: As worn against multilayer DLC (a-C:H:W). Right: As worn against DLC 1 (a-C:H).
The relatively low total wear loss in petrol and E85 on both coatings and the counter
surfaces is in itself an interesting result. However, since the coefficient of friction was
generally high and unstable, only the diesel and FAME systems were chosen for further
analysis.
0
1
2
3
4
5
6
7
FAME Diesel Petrol E85
10
-6 m
m3/N
m
DLC 1
Multilayer DLC
21
A.4.3 Raman spectroscopy
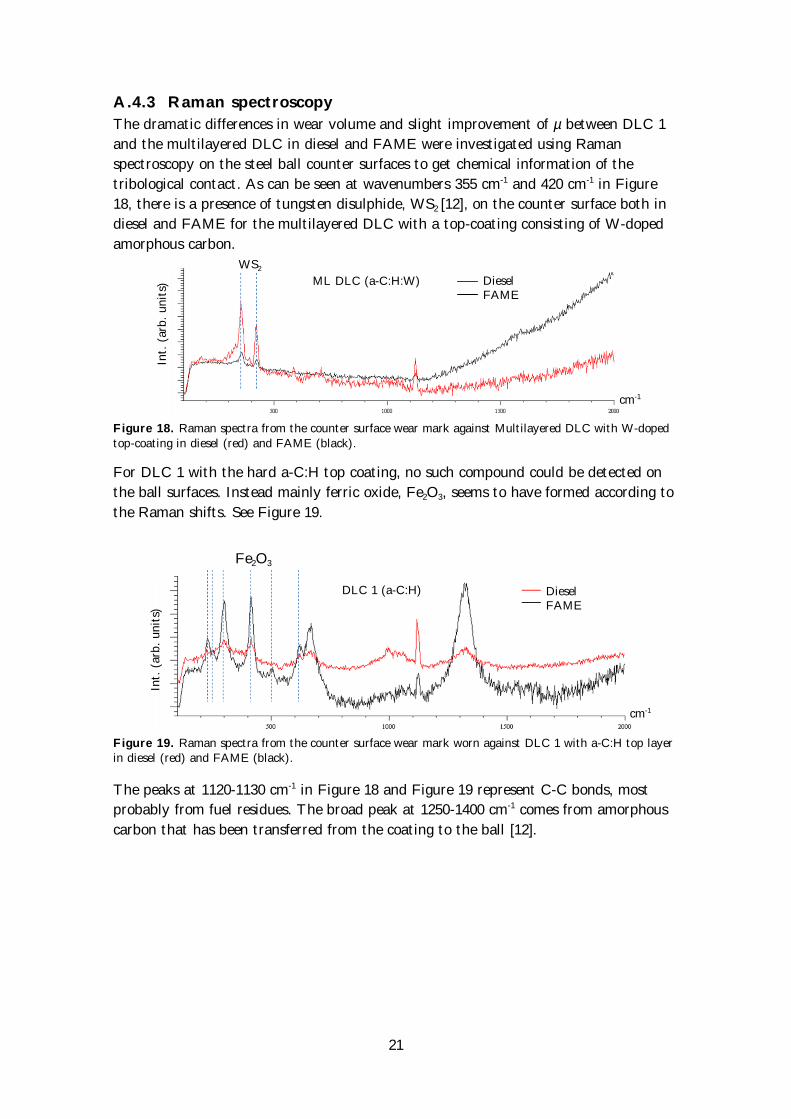
The dramatic differences in wear volume and slight improvement of µ between DLC 1
and the multilayered DLC in diesel and FAME were investigated using Raman
spectroscopy on the steel ball counter surfaces to get chemical information of the
tribological contact. As can be seen at wavenumbers 355 cm-1 and 420 cm-1 in Figure
18, there is a presence of tungsten disulphide, WS2 [12], on the counter surface both in
diesel and FAME for the multilayered DLC with a top-coating consisting of W-doped
amorphous carbon.
Figure 18. Raman spectra from the counter surface wear mark against Multilayered DLC with W-doped
top-coating in diesel (red) and FAME (black).
For DLC 1 with the hard a-C:H top coating, no such compound could be detected on
the ball surfaces. Instead mainly ferric oxide, Fe2O3, seems to have formed according to
the Raman shifts. See Figure 19.
Figure 19. Raman spectra from the counter surface wear mark worn against DLC 1 with a-C:H top layer in diesel (red) and FAME (black).
The peaks at 1120-1130 cm-1 in Figure 18 and Figure 19 represent C-C bonds, most
probably from fuel residues. The broad peak at 1250-1400 cm-1 comes from amorphous
carbon that has been transferred from the coating to the ball [12].
Int.
(arb
. units)
ML DLC (a-C:H:W)
DLC 1 (a-C:H)
cm-1
cm-1
Diesel FAME
WS2
Int.
(arb
. units)
Diesel FAME
Fe2O3
22
A.4.4 ESCA
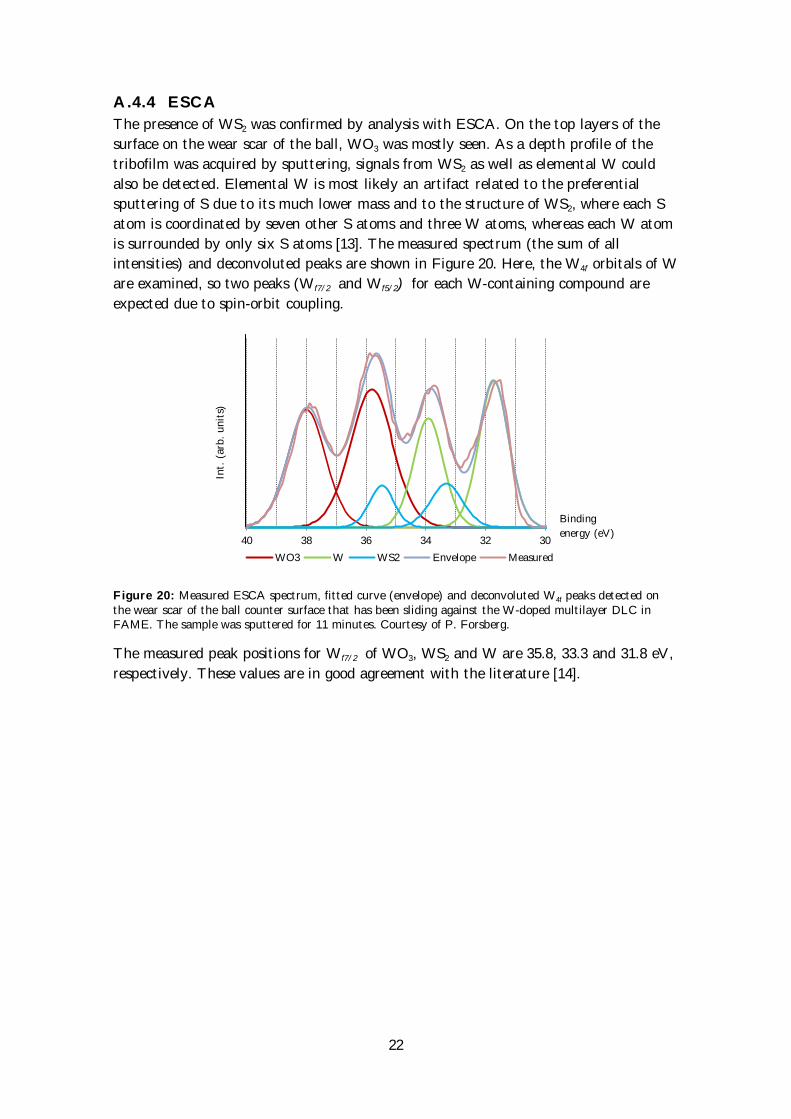
The presence of WS2 was confirmed by analysis with ESCA. On the top layers of the
surface on the wear scar of the ball, WO3 was mostly seen. As a depth profile of the
tribofilm was acquired by sputtering, signals from WS2 as well as elemental W could
also be detected. Elemental W is most likely an artifact related to the preferential
sputtering of S due to its much lower mass and to the structure of WS2, where each S
atom is coordinated by seven other S atoms and three W atoms, whereas each W atom
is surrounded by only six S atoms [13]. The measured spectrum (the sum of all
intensities) and deconvoluted peaks are shown in Figure 20. Here, the W4f orbitals of W
are examined, so two peaks (Wf7/2 and Wf5/2) for each W-containing compound are
expected due to spin-orbit coupling.
Figure 20: Measured ESCA spectrum, fitted curve (envelope) and deconvoluted W4f peaks detected on the wear scar of the ball counter surface that has been sliding against the W-doped multilayer DLC in FAME. The sample was sputtered for 11 minutes. Courtesy of P. Forsberg.
The measured peak positions for Wf7/2 of WO3, WS2 and W are 35.8, 33.3 and 31.8 eV,
respectively. These values are in good agreement with the literature [14].
30 32 34 36 38 40
WO3 W WS2 Envelope Measured
Binding
energy (eV)
Int.
(arb
. unit
s)
23
A.4.5 TEM & EELS
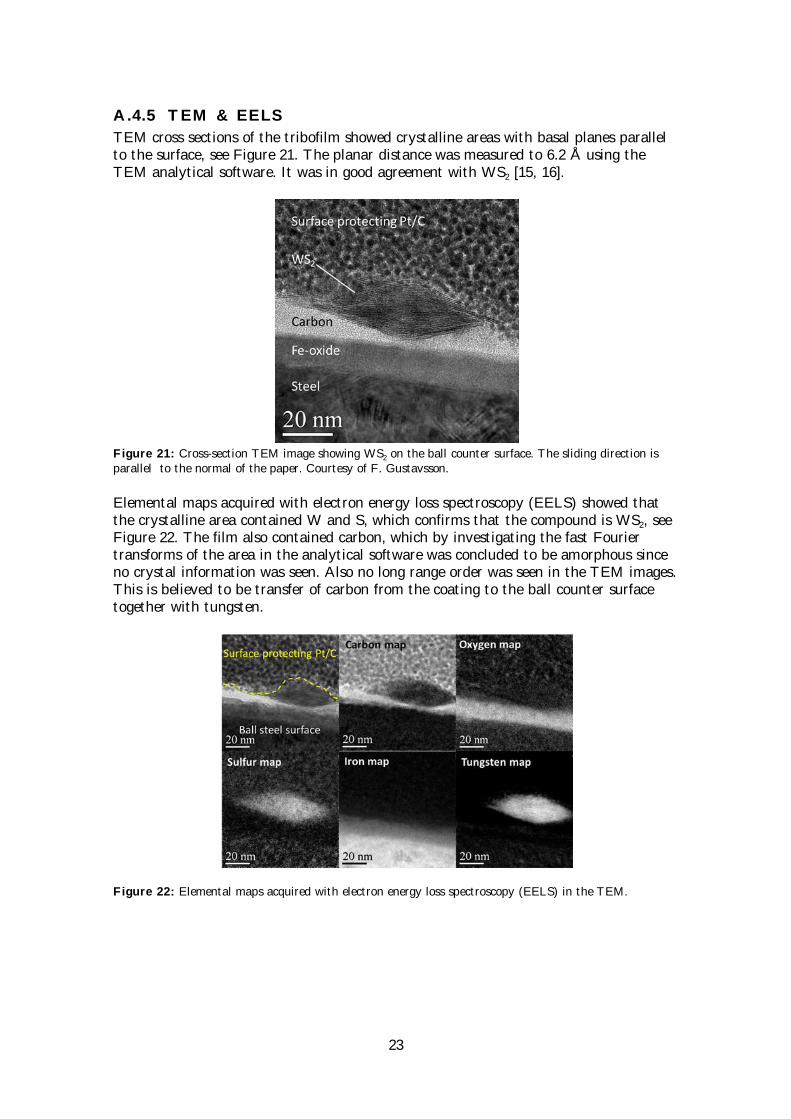
TEM cross sections of the tribofilm showed crystalline areas with basal planes parallel to the surface, see Figure 21. The planar distance was measured to 6.2 Å using the TEM analytical software. It was in good agreement with WS2 [15, 16].
Figure 21: Cross-section TEM image showing WS2 on the ball counter surface. The sliding direction is parallel to the normal of the paper. Courtesy of F. Gustavsson.
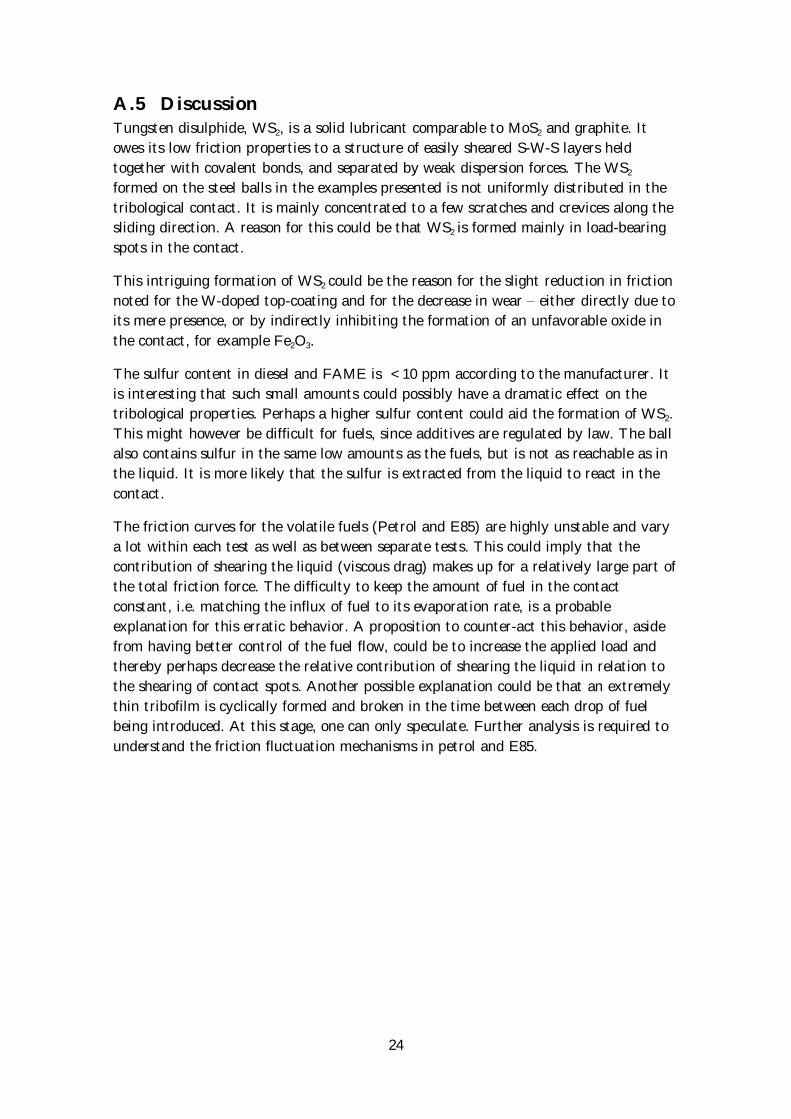
Elemental maps acquired with electron energy loss spectroscopy (EELS) showed that the crystalline area contained W and S, which confirms that the compound is WS2, see Figure 22. The film also contained carbon, which by investigating the fast Fourier transforms of the area in the analytical software was concluded to be amorphous since no crystal information was seen. Also no long range order was seen in the TEM images. This is believed to be transfer of carbon from the coating to the ball counter surface together with tungsten.
Figure 22: Elemental maps acquired with electron energy loss spectroscopy (EELS) in the TEM.
24
A.5 Discussion Tungsten disulphide, WS2, is a solid lubricant comparable to MoS2 and graphite. It
owes its low friction properties to a structure of easily sheared S-W-S layers held
together with covalent bonds, and separated by weak dispersion forces. The WS2
formed on the steel balls in the examples presented is not uniformly distributed in the
tribological contact. It is mainly concentrated to a few scratches and crevices along the
sliding direction. A reason for this could be that WS2 is formed mainly in load-bearing
spots in the contact.
This intriguing formation of WS2 could be the reason for the slight reduction in friction
noted for the W-doped top-coating and for the decrease in wear either directly due to
its mere presence, or by indirectly inhibiting the formation of an unfavorable oxide in
the contact, for example Fe2O3.
The sulfur content in diesel and FAME is <10 ppm according to the manufacturer. It
is interesting that such small amounts could possibly have a dramatic effect on the
tribological properties. Perhaps a higher sulfur content could aid the formation of WS2.
This might however be difficult for fuels, since additives are regulated by law. The ball
also contains sulfur in the same low amounts as the fuels, but is not as reachable as in
the liquid. It is more likely that the sulfur is extracted from the liquid to react in the
contact.
The friction curves for the volatile fuels (Petrol and E85) are highly unstable and vary
a lot within each test as well as between separate tests. This could imply that the
contribution of shearing the liquid (viscous drag) makes up for a relatively large part of
the total friction force. The difficulty to keep the amount of fuel in the contact
constant, i.e. matching the influx of fuel to its evaporation rate, is a probable
explanation for this erratic behavior. A proposition to counter-act this behavior, aside
from having better control of the fuel flow, could be to increase the applied load and
thereby perhaps decrease the relative contribution of shearing the liquid in relation to
the shearing of contact spots. Another possible explanation could be that an extremely
thin tribofilm is cyclically formed and broken in the time between each drop of fuel
being introduced. At this stage, one can only speculate. Further analysis is required to
understand the friction fluctuation mechanisms in petrol and E85.
25
A.6 Conclusions
The lowest average friction coefficient is obtained for the W-doped multilayer
DLC in combination with FAME.
Both coatings show very little wear. DLC 1 is more or less unaffected, but
instead most wear is seen on the counter surface.
The softer W-containing top-coating of the multilayered DLC together with
sulfur in diesel and FAME seems to facilitate the formation of WS2, a solid
lubricant, in the tribological contact. A dramatic difference in wear of the
counter surface could be observed, while it only had a small influence on the
friction.
Although WS2 is formed in only very small amounts in this study, the
mechanism shows that there is potential for obtaining even better results. With
the right design it might be possible to further enable the formation of WS2 in
the tribological interface and thereby lowering friction and wear even more.
The kind of fuel plays an important role in both the friction and wear of the
system.
The mechanisms involved in determining the friction and wear behavior in E85
and petrol remain largely unknown because of experimental difficulties.
26
B Testing in
engine oils
27
B. Engine oils B.1 Oils used Four different oils were used for testing. A summary of these can be found in Table 4,
followed by some more detailed descriptions.
Table 4: Summary of tested oils.
Lubricant Viscosity at 100°C [mm2/s] Type
Oil A 11-13 Commercial engine oil
Oil B 9.5-12.5 Commercial engine oil
Used Oil B 9.5-12.5 Used commercial engine oil
PAO 12 Synthetic base fluid
Oil A. SAE 0W-40 engine oil. A commercially available multigrade engine oil designed
for a wide variety of engines in private cars.
Oil B. SAE 5W-30 engine oil. Highly refined multigrade base engine oil, readily
available on the market. It has many similar properties to Oil A, but differs with respect
to the composition of additives. 5W-30 engine oil is the most common viscosity grade in
the U.S, having a 47 % market share among cars and trucks [17].
Used Oil B. SAE 5W-30 engine oil. This is essentially the same as Oil B SAE 5W-30
engine oil, the difference being that it has been used in an engine that has run for 30.120
km. As a result, it is black due to oxidation and soot particles. The mechanical function
(viscosity) is assumed to be largely unaffected. A large share of the additives has most
likely been depleted. The remaining additives may also have deteriorated due to thermal
instability and oxidation.
PAO. Polyalphaolefin 12 synthetic base fluid. This lubricant consists only of
hydrocarbons and contains no additives.
For an explanation of SAE-numbers, see Viscosity modifiers in section 2.1.4.
B.2 Studied coatings In contrast to the fuel part of this work, all three DLC:s were tested in the various
engine oils.
B.2.1 Test parameters These tribological tests were also performed using the equipment described in Section
3.1. This time a 20 mm 100Cr6 bearing ball was used as counter-surface. The coating
sample was fastened at the bottom of the vat. Roughly 30 ml of engine oil was poured
into the vat so that the sample surface was just covered. A load of 4 N was applied,
yielding a mean initial Hertzian contact pressure of approximately 310 MPa. The tests
were performed for 10000 strokes (i.e. 100 m sliding distance) with a stroke length of 5
mm and a frequency of 3 Hz. All tests were carried out at an oil temperature of 90 ◦C.
For each combination of oil and coating, 3 tests were performed to get good statistics.
28
B.3 Results
B.3.1 Friction Friction curves for various combinations of coatings and oils were generated using the
tribometer described in section 3. A summary of the friction results can be found in
Figure 23. The colored solid bars show the average µ of three tests for each coating-oil
combination. The error bars show the maximum and minimum µ-values within the
tests.
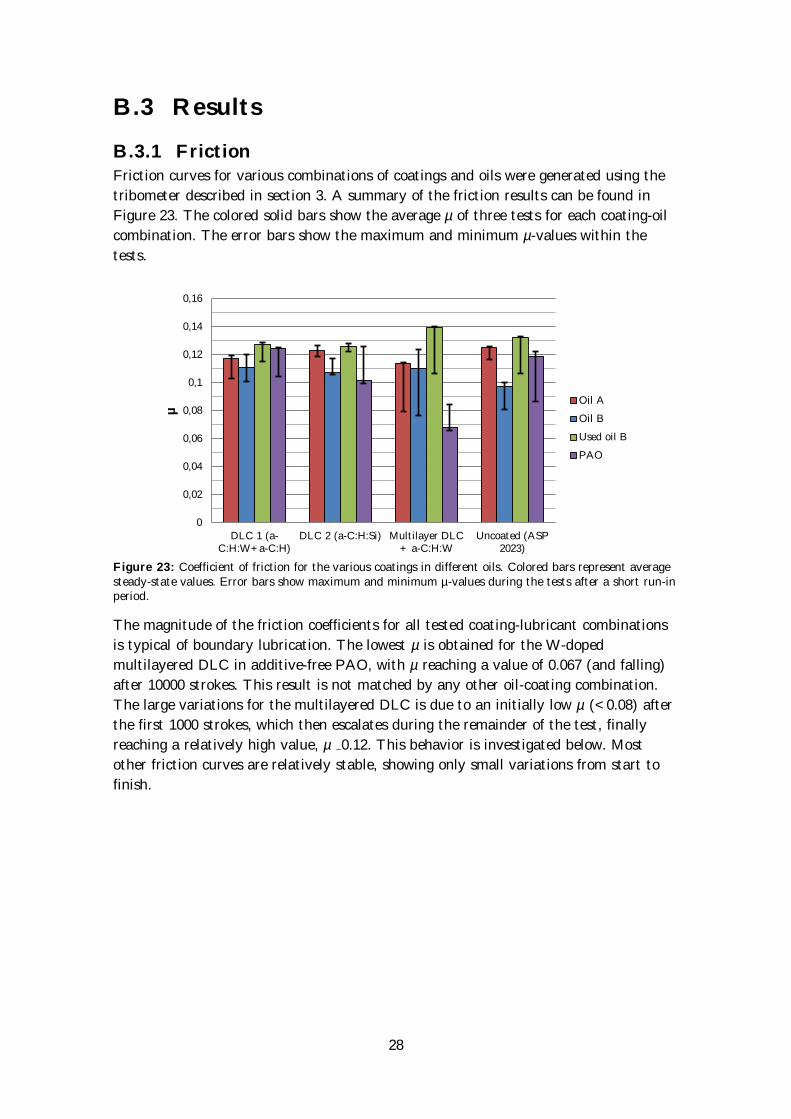
Figure 23: Coefficient of friction for the various coatings in different oils. Colored bars represent average steady-state values. Error bars show maximum and minimum µ-values during the tests after a short run-in period.
The magnitude of the friction coefficients for all tested coating-lubricant combinations
is typical of boundary lubrication. The lowest µ is obtained for the W-doped
multilayered DLC in additive-free PAO, with µ reaching a value of 0.067 (and falling)
after 10000 strokes. This result is not matched by any other oil-coating combination.
The large variations for the multilayered DLC is due to an initially low µ (<0.08) after
the first 1000 strokes, which then escalates during the remainder of the test, finally
reaching a relatively high value, µ ~0.12. This behavior is investigated below. Most
other friction curves are relatively stable, showing only small variations from start to
finish.
0
0,02
0,04
0,06
0,08
0,1
0,12
0,14
0,16
DLC 1 (a-C:H:W+a-C:H)
DLC 2 (a-C:H:Si) Multilayer DLC + a-C:H:W
Uncoated (ASP 2023)
µ Oil A
Oil B
Used oil B
PAO
29
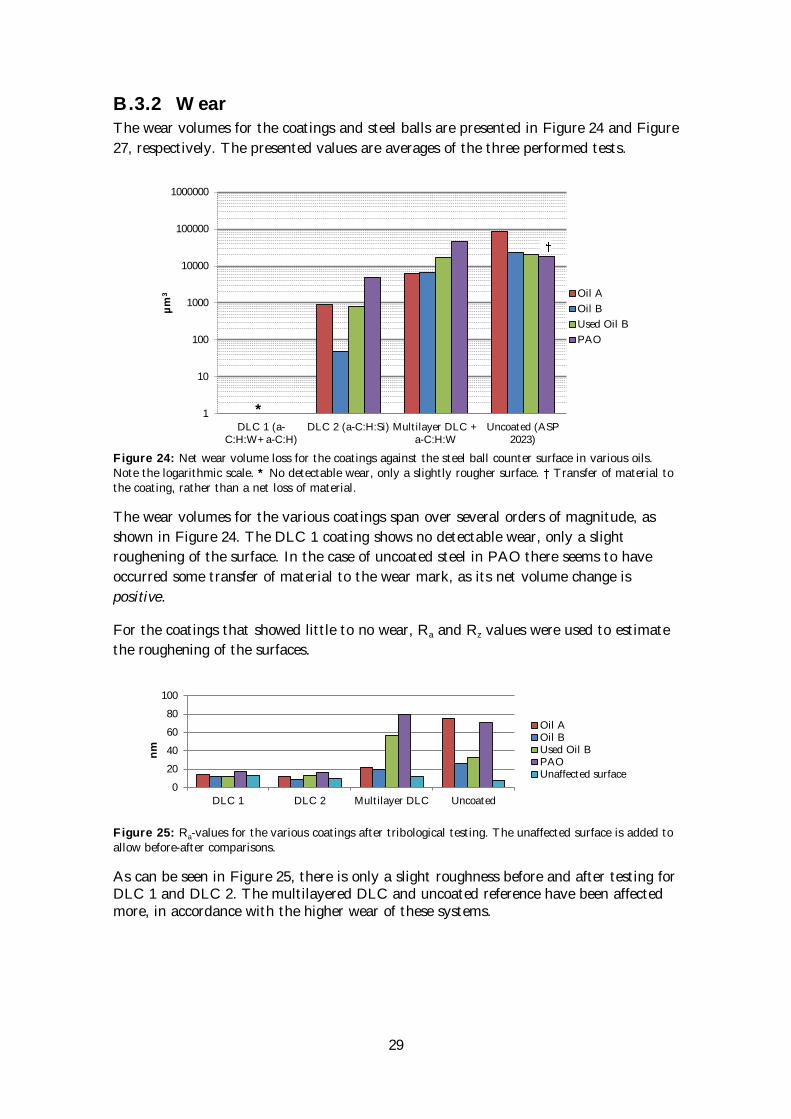
B.3.2 Wear The wear volumes for the coatings and steel balls are presented in Figure 24 and Figure
27, respectively. The presented values are averages of the three performed tests.
Figure 24: Net wear volume loss for the coatings against the steel ball counter surface in various oils. Note the logarithmic scale. * No detectable wear, only a slightly rougher surface. Transfer of material to the coating, rather than a net loss of material.
The wear volumes for the various coatings span over several orders of magnitude, as
shown in Figure 24. The DLC 1 coating shows no detectable wear, only a slight
roughening of the surface. In the case of uncoated steel in PAO there seems to have
occurred some transfer of material to the wear mark, as its net volume change is
positive.
For the coatings that showed little to no wear, Ra and Rz values were used to estimate
the roughening of the surfaces.
Figure 25: Ra-values for the various coatings after tribological testing. The unaffected surface is added to allow before-after comparisons.
As can be seen in Figure 25, there is only a slight roughness before and after testing for DLC 1 and DLC 2. The multilayered DLC and uncoated reference have been affected more, in accordance with the higher wear of these systems.
1
10
100
1000
10000
100000
1000000
DLC 1 (a-C:H:W+a-C:H)
DLC 2 (a-C:H:Si) Multilayer DLC + a-C:H:W
Uncoated (ASP 2023)
µm
3 Oil A
Oil B
Used Oil B
PAO
0
20
40
60
80
100
DLC 1 DLC 2 Multilayer DLC Uncoated
nm
Oil A Oil B Used Oil B PAO Unaffected surface
*
30
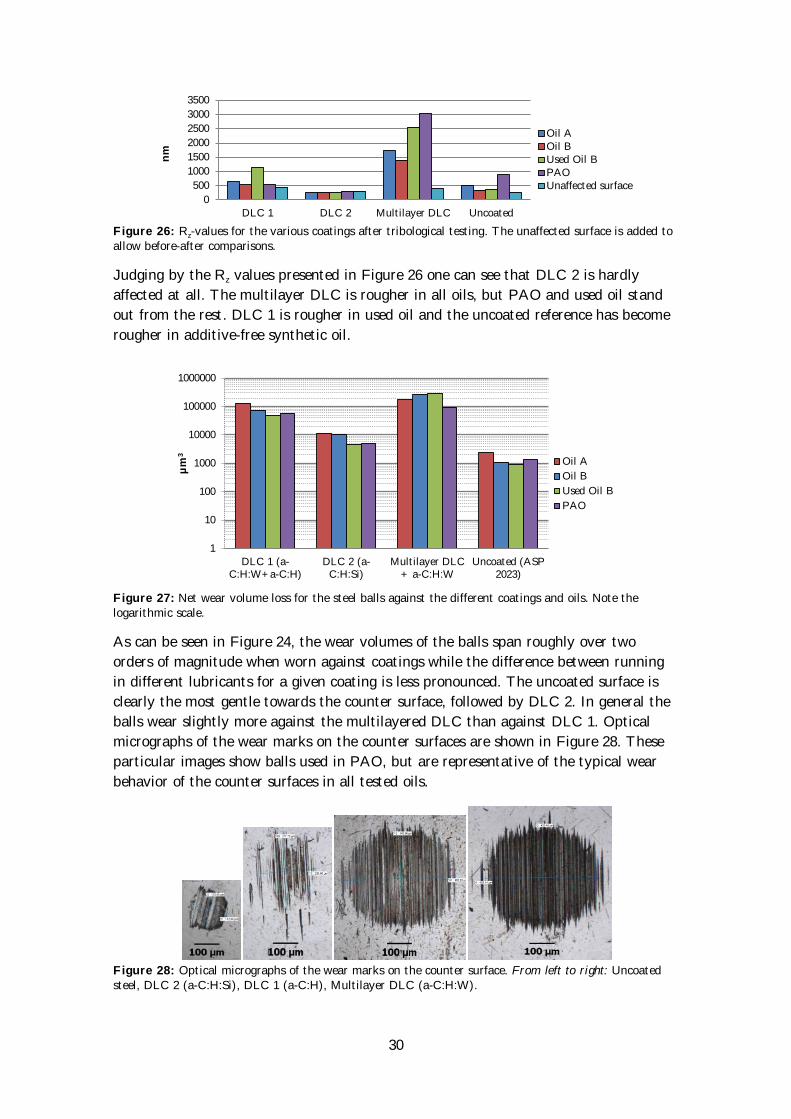
Figure 26: Rz-values for the various coatings after tribological testing. The unaffected surface is added to allow before-after comparisons.
Judging by the Rz values presented in Figure 26 one can see that DLC 2 is hardly
affected at all. The multilayer DLC is rougher in all oils, but PAO and used oil stand
out from the rest. DLC 1 is rougher in used oil and the uncoated reference has become
rougher in additive-free synthetic oil.
Figure 27: Net wear volume loss for the steel balls against the different coatings and oils. Note the logarithmic scale.
As can be seen in Figure 24, the wear volumes of the balls span roughly over two
orders of magnitude when worn against coatings while the difference between running
in different lubricants for a given coating is less pronounced. The uncoated surface is
clearly the most gentle towards the counter surface, followed by DLC 2. In general the
balls wear slightly more against the multilayered DLC than against DLC 1. Optical
micrographs of the wear marks on the counter surfaces are shown in Figure 28. These
particular images show balls used in PAO, but are representative of the typical wear
behavior of the counter surfaces in all tested oils.
Figure 28: Optical micrographs of the wear marks on the counter surface. From left to right: Uncoated steel, DLC 2 (a-C:H:Si), DLC 1 (a-C:H), Multilayer DLC (a-C:H:W).
0
500
1000
1500
2000
2500
3000
3500
DLC 1 DLC 2 Multilayer DLC Uncoated
nm
Oil A Oil B Used Oil B PAO Unaffected surface
1
10
100
1000
10000
100000
1000000
DLC 1 (a-C:H:W+a-C:H)
DLC 2 (a-C:H:Si)
Multilayer DLC + a-C:H:W
Uncoated (ASP 2023)
µm
3
Oil A
Oil B
Used Oil B
PAO
31
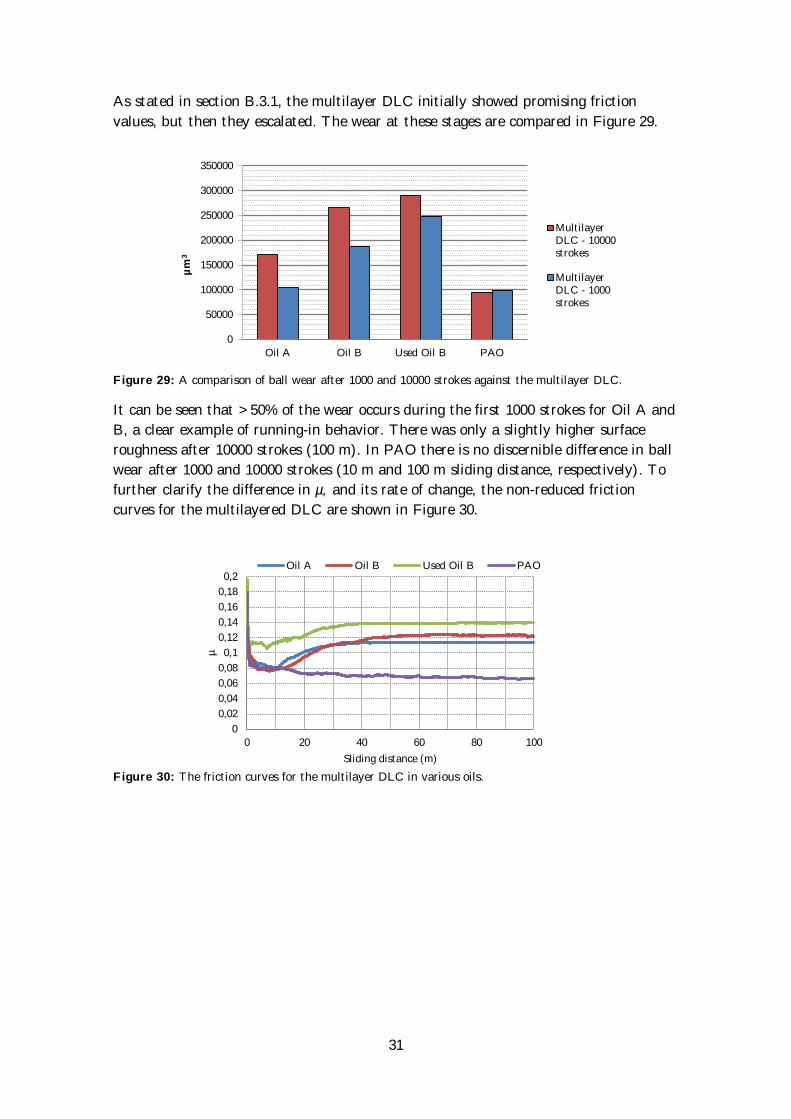
As stated in section B.3.1, the multilayer DLC initially showed promising friction
values, but then they escalated. The wear at these stages are compared in Figure 29.
Figure 29: A comparison of ball wear after 1000 and 10000 strokes against the multilayer DLC.
It can be seen that >50% of the wear occurs during the first 1000 strokes for Oil A and
B, a clear example of running-in behavior. There was only a slightly higher surface
roughness after 10000 strokes (100 m). In PAO there is no discernible difference in ball
wear after 1000 and 10000 strokes (10 m and 100 m sliding distance, respectively). To
further clarify the difference in µ, and its rate of change, the non-reduced friction
curves for the multilayered DLC are shown in Figure 30.
Figure 30: The friction curves for the multilayer DLC in various oils.
0
50000
100000
150000
200000
250000
300000
350000
Oil A Oil B Used Oil B PAO
µm
3
Multilayer DLC - 10000 strokes
Multilayer DLC - 1000 strokes
0
0,02
0,04
0,06
0,08
0,1
0,12
0,14
0,16
0,18
0,2
0 20 40 60 80 100
µ
Sliding distance (m)
Oil A Oil B Used Oil B PAO
32
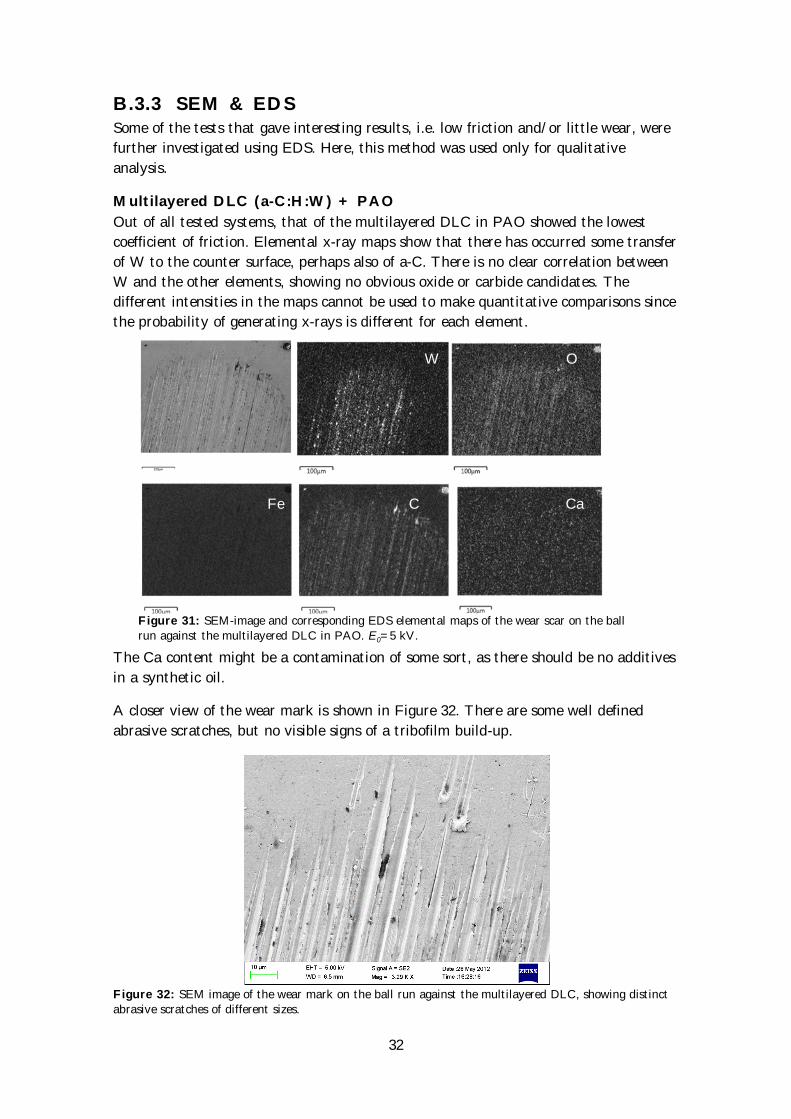
B.3.3 SEM & EDS Some of the tests that gave interesting results, i.e. low friction and/or little wear, were
further investigated using EDS. Here, this method was used only for qualitative
analysis.
Multilayered DLC (a-C:H:W) + PAO
Out of all tested systems, that of the multilayered DLC in PAO showed the lowest
coefficient of friction. Elemental x-ray maps show that there has occurred some transfer
of W to the counter surface, perhaps also of a-C. There is no clear correlation between
W and the other elements, showing no obvious oxide or carbide candidates. The
different intensities in the maps cannot be used to make quantitative comparisons since
the probability of generating x-rays is different for each element.
The Ca content might be a contamination of some sort, as there should be no additives
in a synthetic oil.
A closer view of the wear mark is shown in Figure 32. There are some well defined
abrasive scratches, but no visible signs of a tribofilm build-up.
Figure 32: SEM image of the wear mark on the ball run against the multilayered DLC, showing distinct
abrasive scratches of different sizes.
W O
Fe C Ca
Figure 31: SEM-image and corresponding EDS elemental maps of the wear scar on the ball
run against the multilayered DLC in PAO. E0=5 kV.
33
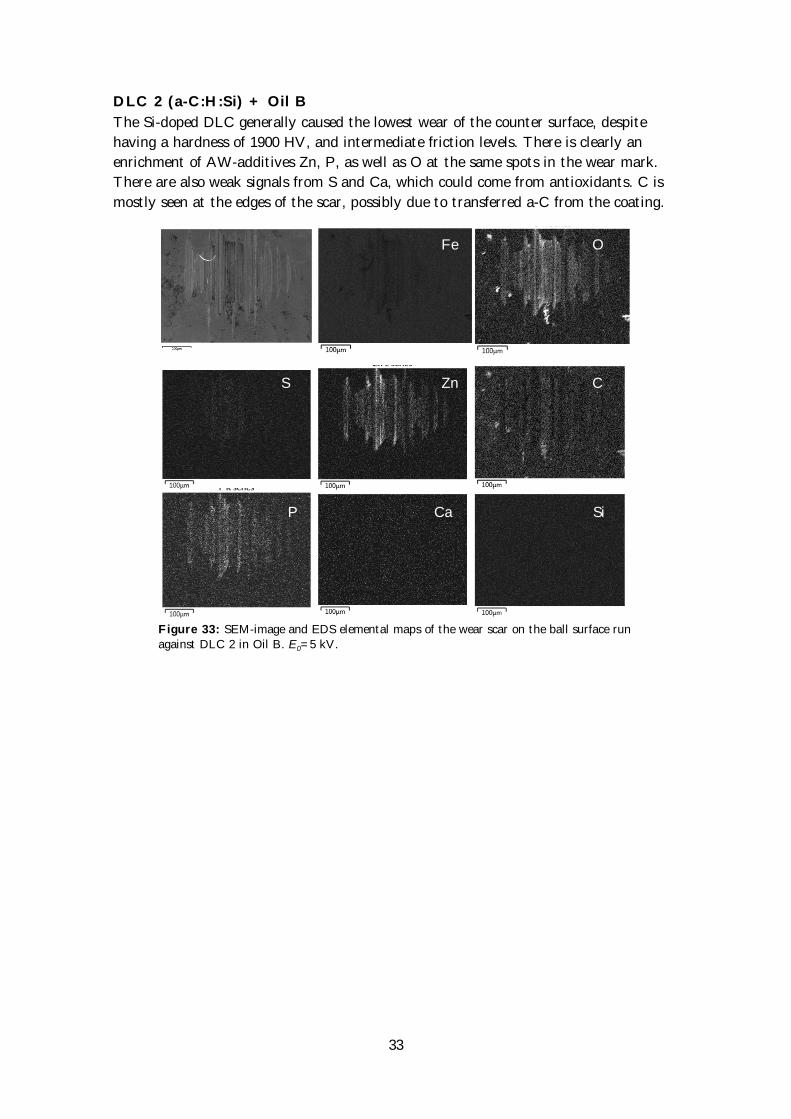
DLC 2 (a-C:H:Si) + Oil B
The Si-doped DLC generally caused the lowest wear of the counter surface, despite
having a hardness of 1900 HV, and intermediate friction levels. There is clearly an
enrichment of AW-additives Zn, P, as well as O at the same spots in the wear mark.
There are also weak signals from S and Ca, which could come from antioxidants. C is
mostly seen at the edges of the scar, possibly due to transferred a-C from the coating.
Fe O
S Zn C
Figure 33: SEM-image and EDS elemental maps of the wear scar on the ball surface run
against DLC 2 in Oil B. E0=5 kV.
P Ca Si
34
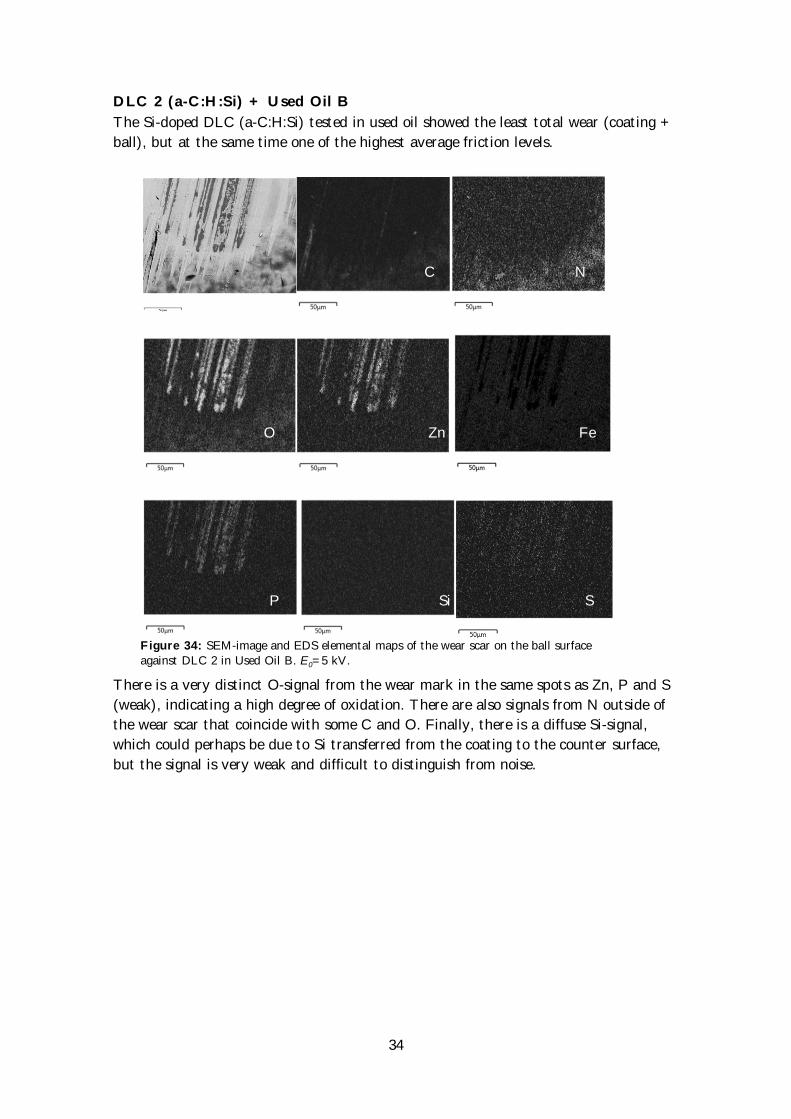
DLC 2 (a-C:H:Si) + Used Oil B
The Si-doped DLC (a-C:H:Si) tested in used oil showed the least total wear (coating +
ball), but at the same time one of the highest average friction levels.
There is a very distinct O-signal from the wear mark in the same spots as Zn, P and S
(weak), indicating a high degree of oxidation. There are also signals from N outside of
the wear scar that coincide with some C and O. Finally, there is a diffuse Si-signal,
which could perhaps be due to Si transferred from the coating to the counter surface,
but the signal is very weak and difficult to distinguish from noise.
Figure 34: SEM-image and EDS elemental maps of the wear scar on the ball surface
against DLC 2 in Used Oil B. E0=5 kV.
C N
Zn
O Zn Fe
Zn
P Si S
Zn
35
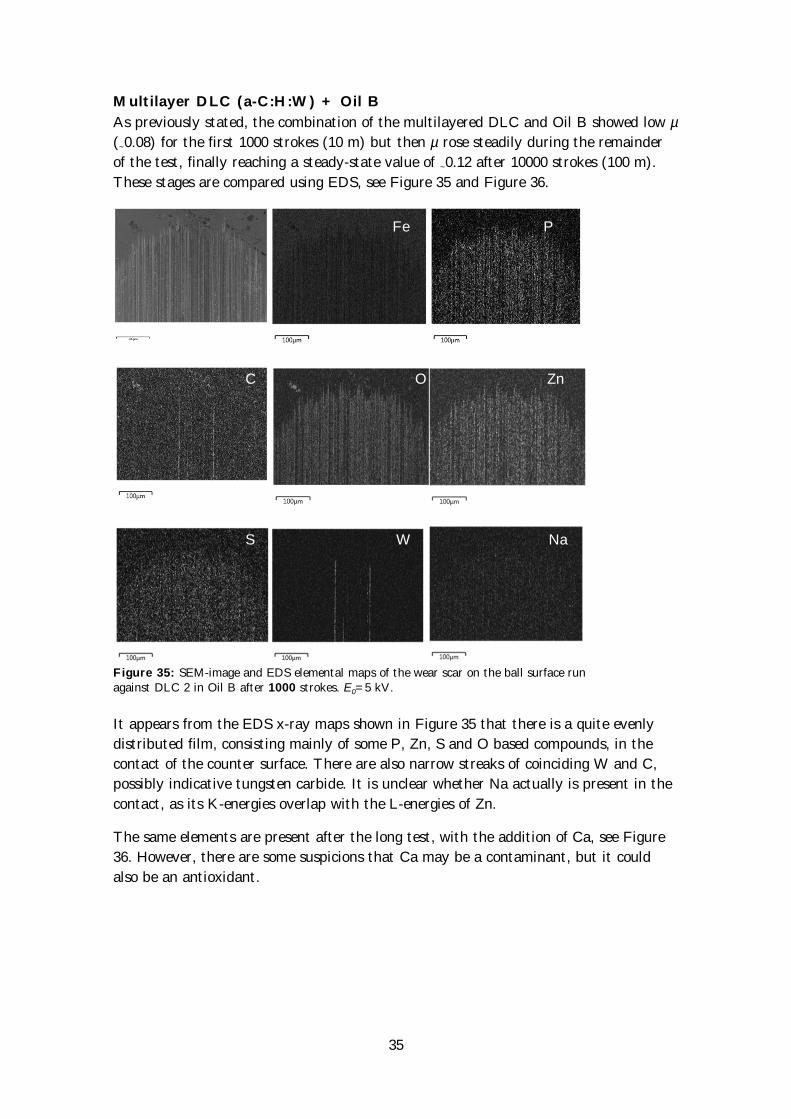
Multilayer DLC (a-C:H:W) + Oil B
As previously stated, the combination of the multilayered DLC and Oil B showed low µ
(~0.08) for the first 1000 strokes (10 m) but then µ rose steadily during the remainder
of the test, finally reaching a steady-state value of ~0.12 after 10000 strokes (100 m).
These stages are compared using EDS, see Figure 35 and Figure 36.
It appears from the EDS x-ray maps shown in Figure 35 that there is a quite evenly
distributed film, consisting mainly of some P, Zn, S and O based compounds, in the
contact of the counter surface. There are also narrow streaks of coinciding W and C,
possibly indicative tungsten carbide. It is unclear whether Na actually is present in the
contact, as its K-energies overlap with the L-energies of Zn.
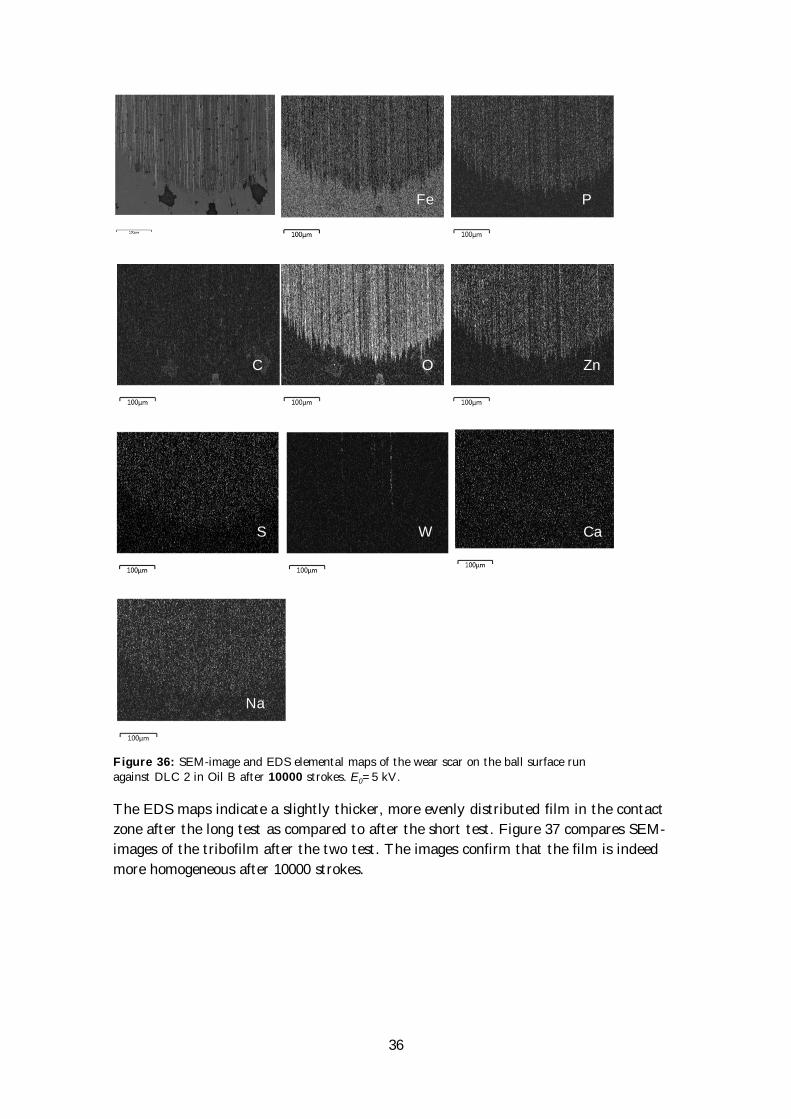
The same elements are present after the long test, with the addition of Ca, see Figure
36. However, there are some suspicions that Ca may be a contaminant, but it could
also be an antioxidant.
Fe P
C O Zn
S W
Figure 35: SEM-image and EDS elemental maps of the wear scar on the ball surface run against DLC 2 in Oil B after 1000 strokes. E0=5 kV.
Na
36
The EDS maps indicate a slightly thicker, more evenly distributed film in the contact
zone after the long test as compared to after the short test. Figure 37 compares SEM-
images of the tribofilm after the two test. The images confirm that the film is indeed
more homogeneous after 10000 strokes.
Figure 36: SEM-image and EDS elemental maps of the wear scar on the ball surface run
against DLC 2 in Oil B after 10000 strokes. E0=5 kV.
Fe P
C O Zn
S W Ca
Na
37
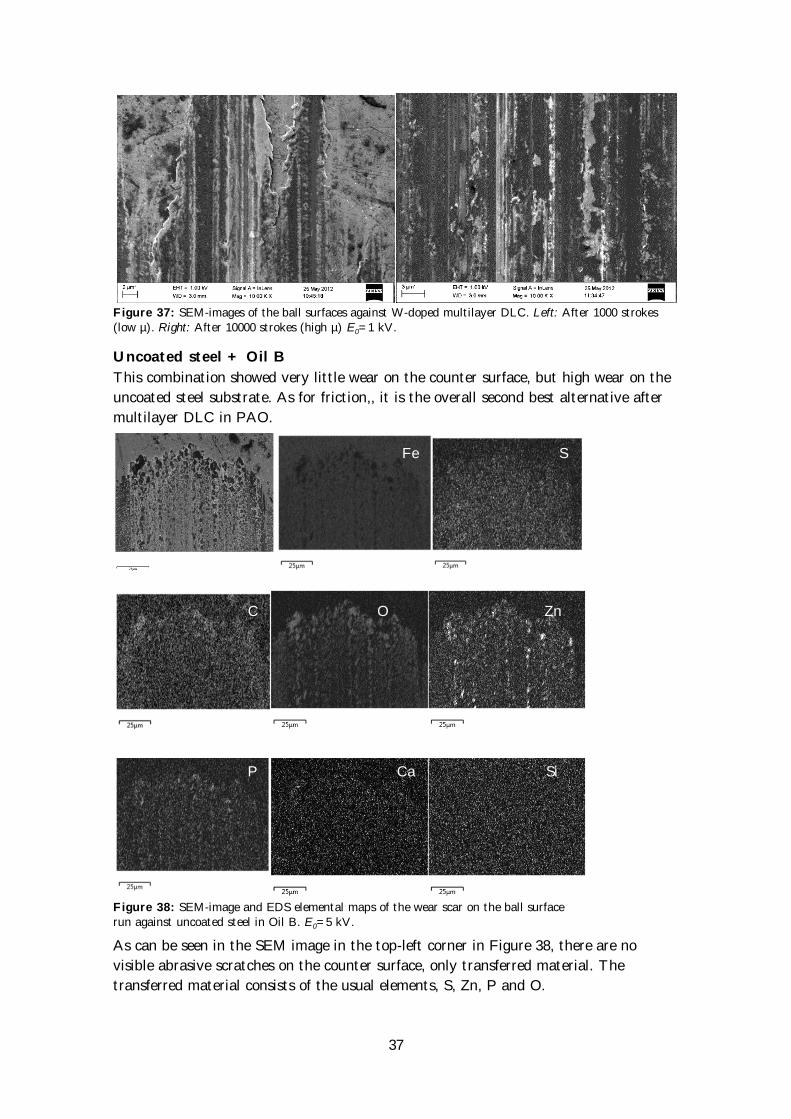
Figure 37: SEM-images of the ball surfaces against W-doped multilayer DLC. Left: After 1000 strokes (low µ). Right: After 10000 strokes (high µ) E0=1 kV.
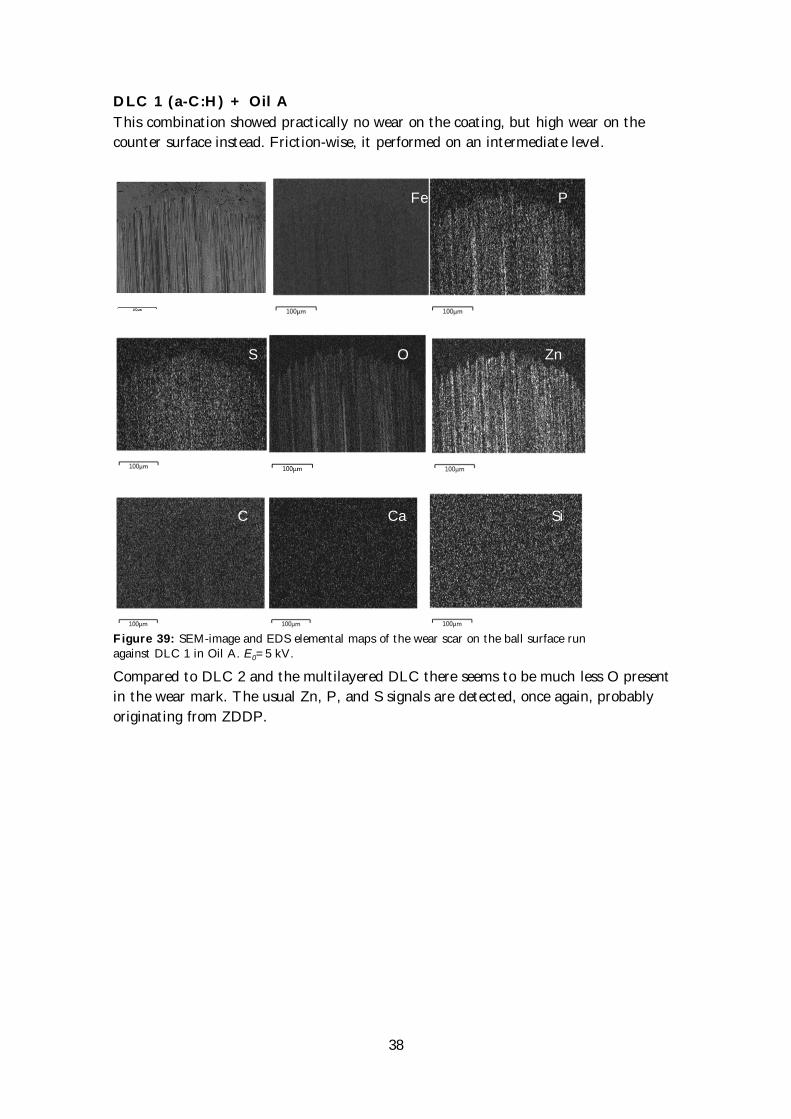
Uncoated steel + Oil B
This combination showed very little wear on the counter surface, but high wear on the
uncoated steel substrate. As for friction,, it is the overall second best alternative after
multilayer DLC in PAO.
As can be seen in the SEM image in the top-left corner in Figure 38, there are no
visible abrasive scratches on the counter surface, only transferred material. The
transferred material consists of the usual elements, S, Zn, P and O.
Figure 38: SEM-image and EDS elemental maps of the wear scar on the ball surface run against uncoated steel in Oil B. E0=5 kV.
Fe S
C O Zn
P Ca Si
38
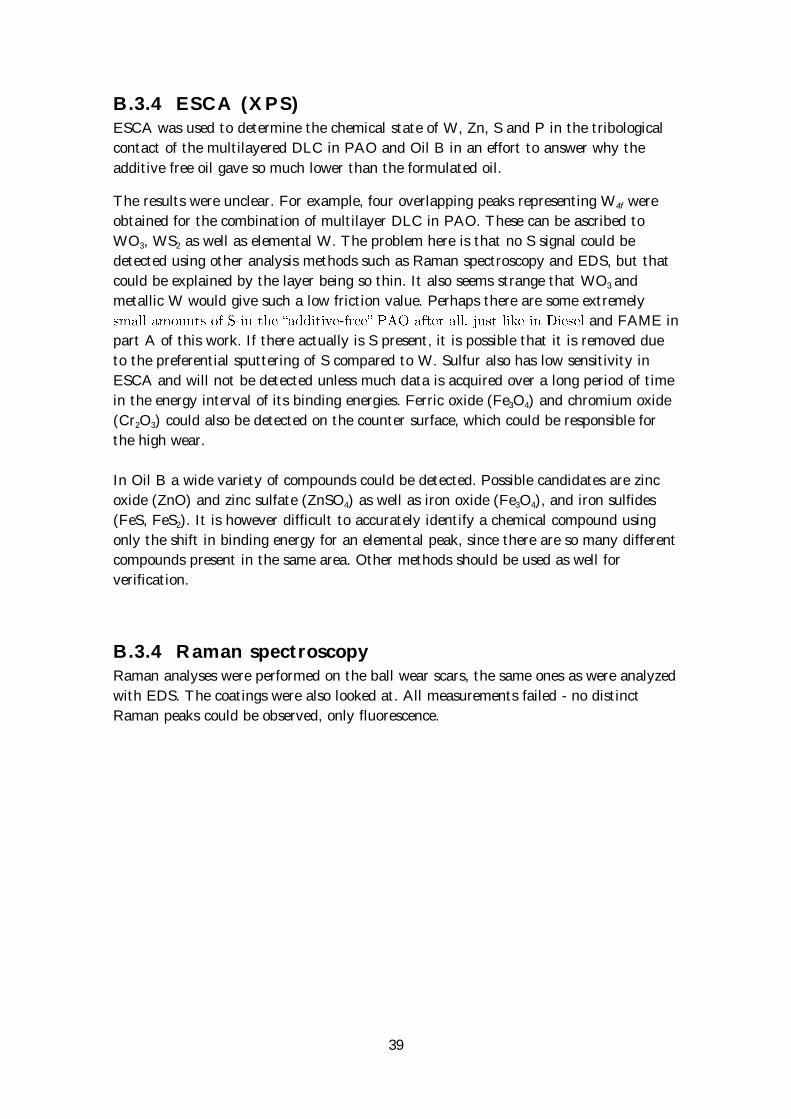
DLC 1 (a-C:H) + Oil A
This combination showed practically no wear on the coating, but high wear on the
counter surface instead. Friction-wise, it performed on an intermediate level.
Compared to DLC 2 and the multilayered DLC there seems to be much less O present
in the wear mark. The usual Zn, P, and S signals are detected, once again, probably
originating from ZDDP.
Figure 39: SEM-image and EDS elemental maps of the wear scar on the ball surface run against DLC 1 in Oil A. E0=5 kV.
S O Zn
Fe P
C Ca Si
39
B.3.4 ESCA (XPS) ESCA was used to determine the chemical state of W, Zn, S and P in the tribological
contact of the multilayered DLC in PAO and Oil B in an effort to answer why the
additive free oil gave so much lower than the formulated oil.
The results were unclear. For example, four overlapping peaks representing W4f were
obtained for the combination of multilayer DLC in PAO. These can be ascribed to
WO3, WS2 as well as elemental W. The problem here is that no S signal could be
detected using other analysis methods such as Raman spectroscopy and EDS, but that
could be explained by the layer being so thin. It also seems strange that WO3 and
metallic W would give such a low friction value. Perhaps there are some extremely
- and FAME in
part A of this work. If there actually is S present, it is possible that it is removed due
to the preferential sputtering of S compared to W. Sulfur also has low sensitivity in
ESCA and will not be detected unless much data is acquired over a long period of time
in the energy interval of its binding energies. Ferric oxide (Fe3O4) and chromium oxide
(Cr2O3) could also be detected on the counter surface, which could be responsible for
the high wear.
In Oil B a wide variety of compounds could be detected. Possible candidates are zinc
oxide (ZnO) and zinc sulfate (ZnSO4) as well as iron oxide (Fe3O4), and iron sulfides
(FeS, FeS2). It is however difficult to accurately identify a chemical compound using
only the shift in binding energy for an elemental peak, since there are so many different
compounds present in the same area. Other methods should be used as well for
verification.
B.3.4 Raman spectroscopy Raman analyses were performed on the ball wear scars, the same ones as were analyzed
with EDS. The coatings were also looked at. All measurements failed - no distinct
Raman peaks could be observed, only fluorescence.
40
B.4 Discussion
B.4.1 Evaluation of the new ball-holder In contrast to Part A, the testing in engine oils were performed using 20 mm diameter
balls as counter surfaces with the purpose of being able to reach low contact pressure
more easily. To accomplish this, a new holder for 20 mm balls was constructed. In
general, the ball holder and friction gauges are able to produce and reproduce reliable
results. However, the high moment of inertia of the heavy 20 mm ball (mass ca. 33 g) is
responsible for limiting its use under certain conditions. For instance, a high frequency
of the reciprocal motion give rise to a kind of resonant fluctuations where the ball
begins to oscillate out of synchrony with the moving substrate. This can be seen in the
variations in friction force for each individual stroke. The signal can be manipulated to
filter away most of the noise from resonance, but this is undesirable since too much
manipulation may yield µ-values that do not represent the true conditions in the
tribological contact. Instead it is recommended to use the ball holder at low frequencies
(f<5 Hz) or long stroke lengths (>2 mm), or both. Increasing the load might also be a
good measure to prevent resonant motion of the ball.
B.4.2 Tribological results
DLC 1. The lowest average µ is achieved in Oil B, and the highest µ is achieved in
used oil, closely followed by PAO. No wear could be detected on the coating, only a
slightly rougher surface. The thin a-C:H top-coating (90 nm) seems to be able to
withstand the strain of the testing, showing little effect on Ra but more effect on Rz,
especially in used oil. Instead most wear is seen on the counter surface, where used oil
is the best alternative by a small margin. The additives of the formulated oils seem to
favor the friction behavior rather than decreasing the wear.
DLC 2. The lowest average friction coefficient is achieved in additive-free PAO, while
the highest is once again achieved in used oil. Both the coating and the counter surface
show relatively little wear, despite the high hardness of the coating. The lowest total
wear is seen in used oil. It should however be noted that the kind of oil only plays a
minor role in determining the wear behavior of the counter surface. The oil dependence
is stronger for the wear of the coating. EDS analysis show a clear enrichment of Zn and
P in the contact on the counter surface, both in fresh and used oil. The EDS maps also
show that there is a stronger, more concentrated O-signal in used oil, indicating a
higher degree of oxidation. Given the fact that there is very little difference in wear
when using different oils, and the lowest µ is obtained in PAO, it seems that the only
benefit from using a formulated oil here is that it offers some wear protection to the
coating.
Multilayer DLC. The multilayer DLC run in PAO showed the (by far) lowest µ of
all tested coatings. However, there was much wear on both the coating and the counter
surface. For the coating most wear was seen in PAO, and the least wear was seen in
Oil A. On the counter surface most wear was seen in used oil, while the least wear was
seen in PAO. Judging by the total wear of the system, PAO is the best alternative and
41
used oil the worst. SEM and EDS analysis indicate that the high friction is associated
with the gradual build-up of a tribofilm, most likely based on AW-additives (ZDDP),
with poor friction properties. The film seemed to have little effect on the total wear.
With synthetic oil, PAO, there had clearly occurred some transfer of W to the counter
surface. The low friction mechanism for this system remains unclear. There is the
possibility that there were some S present, resembling the results obtained in Part A.
Raman spectroscopy gave no interpretable results.
There are many similarities between all combinations of coatings and oils. For all
formulated oils a tribofilm could be established in the contact. These films consist
mainly of Zn, S, P and their oxides, as indicated by EDS. ESCA showed no
unequivocal results. There were a number of candidates for metal oxides and
phosphorus-based compounds, but these are most likely byproducts of ZDDP since it is
such a common oil additive. The mechanism involved with ZDDP is fairly complex,
and involves many reaction steps and a range of possible byproducts, although iron
oxides, zinc oxides and zinc phosphates are the main ones [18]. Raman analysis was
also performed on a large number of coatings as well as on balls, but showed only
fluorescence.
There does not seem to be a clear correlation between the hardness of the coating and
the wear of neither the ball nor the coating. It, however, become clear that the
composition of the DLCs has a greater influence on the wear than what type of
lubricant is used.
Commercially available engine oils are mainly intended for use in steel/steel contacts,
so the additives are therefore primarily designed to react at those kinds of surfaces.
Considering the different chemical properties of a steel surface and a carbon-based
coating, the additives may prove to have no beneficial use for DLCs, as shown in this
work. In general, DLC surfaces are largely chemically inert, especially if they are
hydrogenated, which may lead to the additives not being able to fulfill their purpose
simply because they do not adsorb at the surfaces. Judging by the EDS maps, it seems
that mostly AW-additives are activated under these experimental conditions. It would
be interesting to see what would happen at higher loads, perhaps EP-additives would
also be seen. It also becomes evident that the doping of the top layer has a great
influence on the tribological behavior of the coating. With the right coating design and
adapting the additive composition, it might be possible to develop coatings that fulfill
the requirements for automotive applications.
42
B.5 Conclusions The physical properties and chemical composition of the coating have a great
impact on the total wear in a system.
The DLC 1 coating with a hard top-layer (a-C:H) shows practically no wear at
all. The counter surface, on the other hand, wears significantly more. The
lowest µ is seen for Oil B. The additives in fresh formulated oils improve the
friction behavior slightly, while having a small negative effect on the wear of the
counter surface.
For DLC 2 (a-C:H:Si) the type of oil has very little influence on the total wear
loss. The lowest µ is achieved in additive-free PAO. It seems that the main
benefit of using formulated oils is to provide protection against wear on the
coating.
The soft W-doped top layer of the multilayered DLC results in high wear of
both coating and counter surface. The change in friction levels, from low to
high, for the multilayered DLC is associated with the gradual build-up of a
tribofilm consisting of anti-wear additives with undesirable friction properties.
The lowest µ is achieved in synthetic oil. The wear of the coating benefits from
using formulated oils, while the counter surface sees the least wear in additive-
free oil.
The best friction results are obtained for the W-doped multilayer DLC and
additive-free PAO. ESCA hinted at the presence of WS2, just like some results
for the fuels in part A. EDS did not detect any S, and Raman showed only
fluorescence. The possibility that WS2 is formed in the interface cannot be ruled
out. Further analysis is required here.
The highest average friction, for all coatings, is seen with used oil.
Most additives are designed with steel surfaces in mind. Depositing a coating
may therefore give both beneficial and detrimental effects.
Mostly AW-additives are activated in this study.
There is no clear correlation between wear and friction.
There is no clear correlation between wear and hardness.
The new ball holder is able to reproduce reliable results as long as the frequency
of the reciprocal motion is not too high.
43
Future work
Test more coatings. As shown in this work, the composition of the coatings play
a crucial part in determining the tribological behavior. By changing the amount
and type of doping elements, the properties of the coatings can be tailored to
give better performance. The formation of WS2 when using a W-doped top layer
in some fuels (and possibly engine oils) is an interesting result that deserves
some follow-up experiments.
Analyze the coatings more closely. In this work, it has been assumed that
(traces of) the tribofilms will be seen on both the coatings and balls. The balls
were chosen for analysis since undergo more drastic changes than the coatings,
and that makes them easier to analyze. To gain a fully comprehensive
understanding of the mechanisms involved, the coatings need to be further
analyzed.
Mostly AW-additives were activated during testing in engine oils. It would be
interesting to see if any other additives are activated if the experimental
conditions are changed. What happens if the load is increased? Perhaps other
chemical reactions will occur in the tribological interface.

44
Acknowledgements
I would like to express appreciation and gratitude to my supervisors, Fredrik
Gustavsson and Peter Forsberg at the Ångström Tribomaterials Group for all the help
and guidance during the course of this work.
Thanks to IonBond and Balzers Oerlikon for providing the DLC coatings.
Staffan Jacobson is also acknowledged for giving me the opportunity to participate in
workshops with interesting people at fancy places it has been fun and educationally
rewarding.
45
References [1] Y. Liu, A. Erdemir, E. I. Meletis. An investigation of the relationship between
graphitization and frictional behavior of DLC coatings. Surface and Coatings
Technology 86 87, Part 2, 15 December 1996, Pages 564 568.
[2] A. Vanhulsel, B. Blanpain, J-P Celis, J. Roos, E. Dekempeneer. J. Smeets. Study of
the wear behavior of diamond-like coatings at elevated temperatures. Surface &
Coatings Technology 98 (1998) 1047-1052.
[3] A. Erdemir. The role of hydrogen in tribological properties of diamond-like carbon
films. Surface and Coatings Technology 146-147 (2001) 292-297.
[4] Wiktionary. [Online] [Cited: 120411.] .
[5] S. Jacobson, S. Hogmark. Tribologi Friktion, smörjning, nötning.
Ångströmlaboratoriet, Uppsala universitet. 2nd ed. 2005.
[6] M. Torbacke, Å. Kassman Rudolphi, E. Kassfeldt. Lubricants Properties and
Performance. Universitetstryckeriet, Luleå 2012.
[7] B. Podgornik, J Vizintin. Tribological reactions between oil additives and DLC
coatings for automotive applications. Surface & Coatings Technology 200 (2005) 1982-
1989.
[8] Northern Arizona University, Planetary Materials Microanalysis Facility. [Online] [Cited: 120601] http://www4.nau.edu/microanalysis/Microprobe-SEM/Signals.html [9] Y. Leng. Materials Characterization Introduction to Microscopic and
Spectroscopic Methods. John Wiley & Sons, Singapore 2008. Reprinted 2010.
[10] F. Gustavsson, P. Forsberg, S. Jacobson, Friction and wear behaviour of low-friction coatings in conventional and alternative fuels, Tribology International 48 (2012) 22-28.
[11] Guidelines for handling and blending FAME. Working Party on Pollution and Energy (GRPE No-61-27). Concawe, Brussels 2009.
[12] J. S. Zabinski, N. T. McDevitt. Raman spectra of inorganic compounds related to solid state tribochemical studies. Technical report WL-TR-96-4034, Wright laboratory, 1996.
[13] L.E. Rumaner, T. Tazawa, F.S. Ohuchi, Compositional change of (0001) WS2
surfaces induced by ion beam bombardment with energies between 100 and 1500 eV, J.
Vac. Sci. Technol. A 12, 2451 (1994).
[14] J.F. Moulder, W.F. Sobol, K.D. Bomben, Handbook of X-ray Photoelectron
Spectroscopy, Physical Electronics Inc., Minnesota, 1995, pp. 172 173.
46
[15] F. Pedraza, J. Cruz-Reyes, D. Acosta, M. J. Yanez, M. Avalos-Borja and S.
Fuentes. The structure characterization of MoS2 and WS2 catalysts by HREM. J.
Phys. Condens. Matter (1993) A219-A220 .
[16] Jung-wook Seo, Young-wook Jun, Seung-won Park, Hyunsoo Nah, Taeho Moon,
Byungwoo Park, Jin-Gyu Kim, Youn Joong Kim, and Jinwoo Cheon. Two-Dimensional
Nanosheet Crystals. Angew. Chem. Int. Ed. 2007, 46, 8828 8831
[18] T. Onodera. A theoretical investigation on the abrasive wear prevention mechanism of ZDDP and ZP tribofilms. App. Surf. Sci. 254:23 (2008), p. 7976 7979.
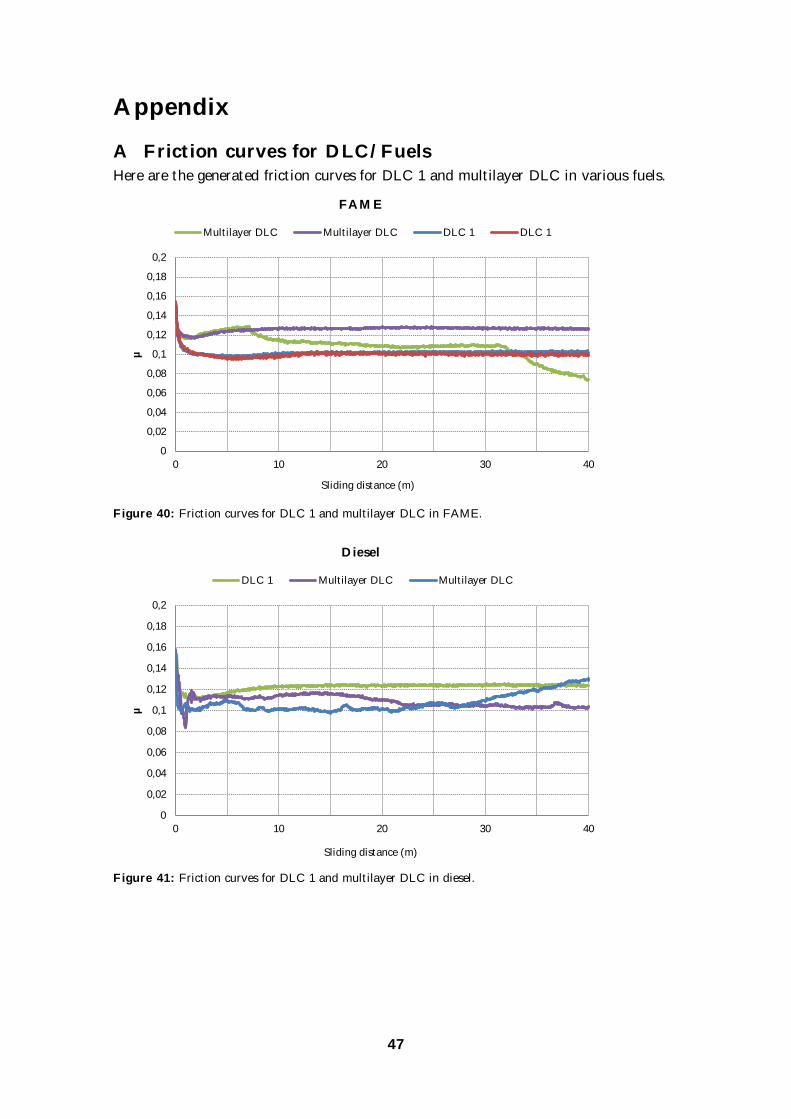
47
Appendix
A Friction curves for DLC/Fuels Here are the generated friction curves for DLC 1 and multilayer DLC in various fuels.
Figure 40: Friction curves for DLC 1 and multilayer DLC in FAME.
Figure 41: Friction curves for DLC 1 and multilayer DLC in diesel.
0
0,02
0,04
0,06
0,08
0,1
0,12
0,14
0,16
0,18
0,2
0 10 20 30 40
µ
Sliding distance (m)
FAME
Multilayer DLC Multilayer DLC DLC 1 DLC 1
0
0,02
0,04
0,06
0,08
0,1
0,12
0,14
0,16
0,18
0,2
0 10 20 30 40
µ
Sliding distance (m)
Diesel
DLC 1 Multilayer DLC Multilayer DLC
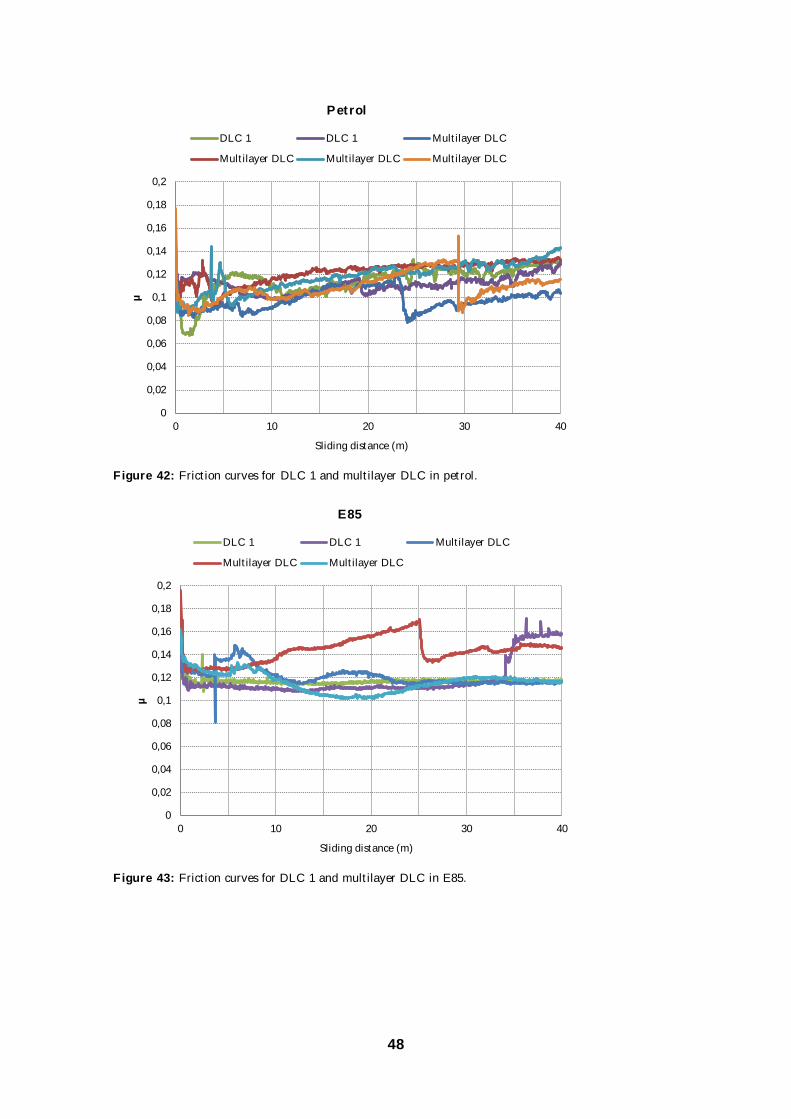
48
Figure 42: Friction curves for DLC 1 and multilayer DLC in petrol.
Figure 43: Friction curves for DLC 1 and multilayer DLC in E85.
0
0,02
0,04
0,06
0,08
0,1
0,12
0,14
0,16
0,18
0,2
0 10 20 30 40
µ
Sliding distance (m)
Petrol
DLC 1 DLC 1 Multilayer DLC
Multilayer DLC Multilayer DLC Multilayer DLC
0
0,02
0,04
0,06
0,08
0,1
0,12
0,14
0,16
0,18
0,2
0 10 20 30 40
µ
Sliding distance (m)
E85
DLC 1 DLC 1 Multilayer DLC
Multilayer DLC Multilayer DLC
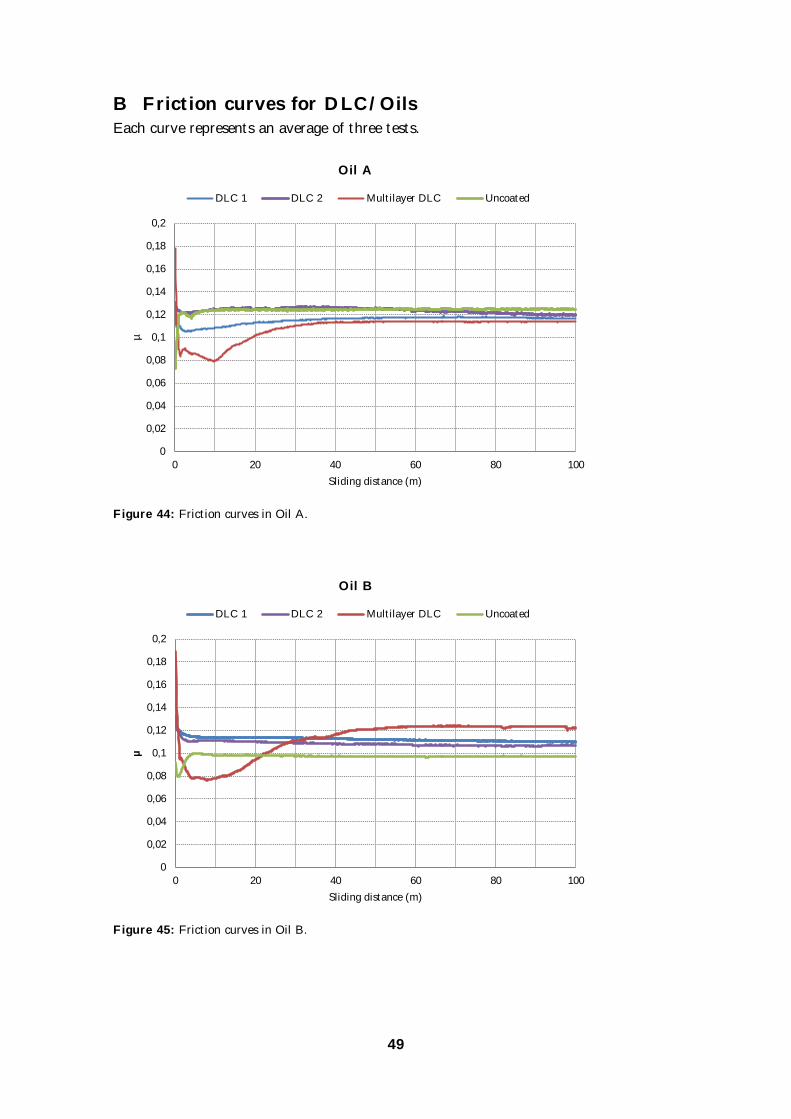
49
B Friction curves for DLC/Oils Each curve represents an average of three tests.
Figure 44: Friction curves in Oil A.
Figure 45: Friction curves in Oil B.
0
0,02
0,04
0,06
0,08
0,1
0,12
0,14
0,16
0,18
0,2
0 20 40 60 80 100
µ
Sliding distance (m)
Oil A
DLC 1 DLC 2 Multilayer DLC Uncoated
0
0,02
0,04
0,06
0,08
0,1
0,12
0,14
0,16
0,18
0,2
0 20 40 60 80 100
µ
Sliding distance (m)
Oil B
DLC 1 DLC 2 Multilayer DLC Uncoated
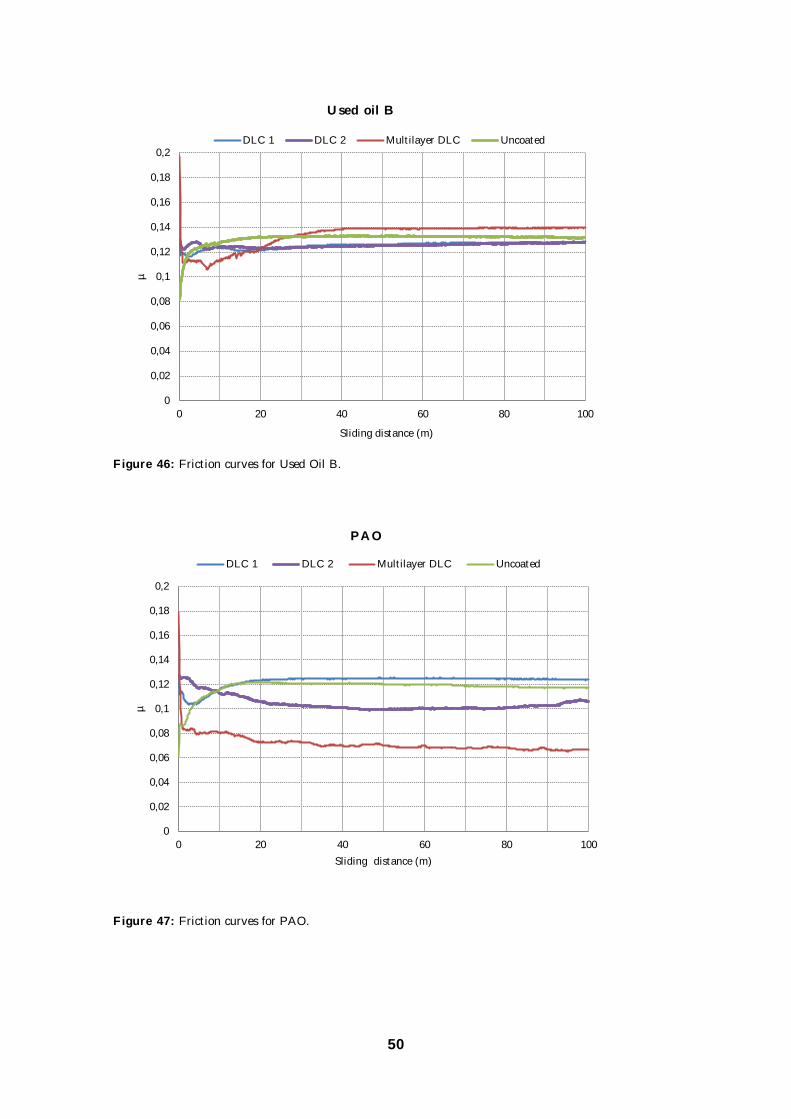
50
Figure 46: Friction curves for Used Oil B.
Figure 47: Friction curves for PAO.
0
0,02
0,04
0,06
0,08
0,1
0,12
0,14
0,16
0,18
0,2
0 20 40 60 80 100
µ
Sliding distance (m)
Used oil B
DLC 1 DLC 2 Multilayer DLC Uncoated
0
0,02
0,04
0,06
0,08
0,1
0,12
0,14
0,16
0,18
0,2
0 20 40 60 80 100
µ
Sliding distance (m)
PAO
DLC 1 DLC 2 Multilayer DLC Uncoated

51


![Adaptive Mo2N/MoS /Ag Tribological Nanocomposite Coatings ... · of hard nanocomposite structures are known to provide such enhanced mechanical and tribological properties [16]: (1)](https://img.pdfslide.net/doc/110x75/5f97faa50befeb2acb16a5a6/adaptive-mo2nmos-ag-tribological-nanocomposite-coatings-of-hard-nanocomposite.jpg)