Embed Size (px)
Citation preview

TRIHALOMETHANE SPECIATION AND THE RELATIONSHIP TO ELEVATED TOTAL DISSOLVED SOLID CONCENTRATIONS AFFECTING
DRINKING WATER QUALITY AT SYSTEMS UTILIZING THE MONONGAHELA RIVER AS A PRIMARY SOURCE DURING THE 3RD AND
4TH QUARTERS OF 2008
EXECUTIVE SUMMARY In September 2008, a collaborative distribution field event, with representatives from the Environmental Protection Agency (EPA), the Pennsylvania Department of Environmental Protection (DEP) and the Allegheny County Health Department (ACHD) was conducted at a surface water treatment facility located on the Ohio River. During this field event, sample analysis results for Disinfection By-Products (DBPs) showed a high percentage of the DBPs being formed were brominated DBPs, which pose a greater health risk than chlorinated DBPs. A raw water sample indicated that the source water bromide concentration was 170 ug/L. Bromide in fresh water is typically found in areas influenced by saltwater intrusion or another bromide source (well drilling brines, industrial chemicals and agricultural chemicals).
In October 2008, unusually high levels of sulfate and Total Dissolved Solids (TDS) were detected at points along the Monongahela River, beginning at the West Virginia border to the confluence with the Youghigheny River and were impacting surface water supplies in that same area. Sulfates and TDS are naturally occurring substances that are found in minerals, soil and rocks. Sulfates and TDS may also be discharged to surface water sources through mine drainage, gas well drilling or sewage treatment plants. In addition, several systems on the Monongahela River, which feeds the Ohio River, have recently experienced elevated THMs, as shown by their compliance monitoring results.
The presence of bromide and subsequent formation of brominated DBPs increases overall DBP concentrations, specifically trihalomethanes (THMs). Although bromide may not create additional THMs on a molecular level, it does create brominated analogues, which have higher molecular weights and increase the overall concentration on a weight to volume basis (i.e. mg/L). The concentration of regulated haloacetic acids (HAAs) may decrease, since other non-regulated species, which are brominated, will most likely increase in concentration, while the regulated species decrease in concentration.
Overall, the systems that were used in this study have TTHM concentrations that are impacted by bromide in the source water at various times during the year. In some cases the TTHM concentration that was comprised of mostly brominated species produced the highest historical TTHM value. In conjunction, the systems on the Monongahela River appear to have been impacted directly by the source of the TDS and sulfate, which is most likely also a source of bromide. Elevated concentrations of bromide, as well as TDS and sulfates, may also have been impacted by low river flows during the 3rd and 4th quarters 2008, compared to historical seasonal flows. Without source water bromide sample results it is difficult to make a direct correlation between the TDS and sulfate event and the elevated brominated THM species. However, based on the speciation there appears to be a strong correlation between THM formation and elevated source water bromide concentrations in the Monongahela River.
The water systems on the Allegheny and Ohio Rivers have a more historical and seasonal cycle of brominated THM formation. As with the Monongahela, the source of the bromide contributing to the seasonal increases in brominated THMs is unknown; although, there appears to be a correlation between low seasonal flows and increased brominated THM formation. During the 3rd and 4th quarter 2008, the drinking water systems on the Ohio River may have been impacted by the same source of bromide as the systems on the Monongahela River, since it feeds into the Ohio River.

TRIHALOMETHANE SPECIATION AND THE RELATIONSHIP TO ELEVATED TOTAL DISSOLVED SOLID CONCENTRATIONS AFFECTING
DRINKING WATER QUALITY AT SYSTEMS UTILIZING THE MONONGAHELA RIVER AS A PRIMARY SOURCE DURING THE 3RD AND
4TH QUARTERS OF 2008 Paul Handke
Water Program Specialist Pennsylvania Department of Environmental Protection
Bureau of Water Standards and Facility Regulation
BACKGROUND
In September 2008, a collaborative distribution field event, with representatives from the Environmental Protection Agency (EPA), the Pennsylvania Department of Environmental Protection (DEP) and the Allegheny County Health Department (ACHD) was conducted at a surface water treatment facility located on the Ohio River. During this field event, sample analysis results for Disinfection By-Products (DBPs) showed a high percentage of the DBPs being formed were brominated DBPs, which pose a greater health risk than chlorinated DBPs. A raw water sample indicated that the source water bromide concentration was 170 ug/L. Bromide in fresh water is typically found in areas influenced by saltwater intrusion or another bromide source (well drilling brines, industrial chemicals and agricultural chemicals).
In October 2008, unusually high levels of sulfate and Total Dissolved Solids (TDS) were detected at points along the Monongahela River, beginning at the West Virginia border to the confluence with the Youghigheny River and were impacting surface water supplies in that same area. Sulfates and TDS are naturally occurring substances that are found in minerals, soil and rocks. Sulfates and TDS may also be discharged to surface water sources through mine drainage, gas well drilling or sewage treatment plants. In addition, several systems on the Monongahela River, which feeds the Ohio River, have recently experienced elevated THMs, as shown by their compliance monitoring results.
The presence of bromide and subsequent formation of brominated DBPs increases overall DBP concentrations, specifically trihalomethanes (THMs). Although bromide may not create additional THMs on a molecular level, it does create brominated analogues, which have higher molecular weights and increase the overall concentration on a weight to volume basis (i.e. mg/L). The concentration of regulated haloacetic acids (HAAs) may decrease, since other non-regulated species, which are brominated, will most likely increase in concentration, while the regulated species decrease in concentration.
This report will summarize specific THM results from drinking water systems treating surface water from the Ohio River and Monongahela and Allegheny Rivers, which combine to form the Ohio River. The purpose is to compare THM results, on a species level, to determine if there has been a recent increase in brominated species that may be related to the sudden increase in TDS and Sulfates. Source water bromide results are not available, so this report will be relying on THM speciation to determine if source water bromide had an impact on DBP formation.
1

OVERVIEW
DBPs have been a focus of the drinking water industry since their presence in finished drinking water first appeared in published reports in 1974.1 Since that time, EPA has promulgated a THM rule (1979) and the Stage 1 (1998) and Stage 2 (2006) Disinfectants / Disinfection By-Products Rules (DBPR). The DBPRs focus on four disinfection by-products - Trihalomethanes (THMs), Haloacetic Acids (HAAs), bromate and chlorite. This report will focus on the formation and regulation of THMs and HAAs and present THM data for systems on the Monongahela, Allegheny and Ohio Rivers.
DBPR The DBPR regulates four species of THMs and five (of a total of nine major) species of HAAs (Table 1).
Table 1: Regulated THM and HAA Species
DBP Individual Species Chemical Formula Molecular Weight
Chloroform CHCl3 119 g/mol Bromodichloromethane CHCl2Br 164 g/mol Dibromochloromethane CHClBr2 208 g/mol
Trihalomethane
Bromoform CHBr3 253 g/mol Monochloroacetic acid CH2ClCOOH Dichloroacetic acid CHCl2COOH Trichloroacetic acid CCl3COOH Monobromoacetic acid CHBrClCOOH
Haloacetic Acids
Dibromoacetic acid CHBr2ClCOOH
The DBPR establishes a Maximum Contaminant Level (MCL) in micrograms per liter (ug/L) for a total of the four species of THMs (TTHMs) and a total of the five HAA species (HAA5) (Table 2).
Table 2: TTHM and HAA5 MCLs
DBP MCL (ug/L) Total Trihalomethanes 80 Haloacetic Acids 60
The DBPR also establishes a Maximum Contaminant Level Goal (MCLG) for some of the species of DBPs (Table 3). The MCLG is the maximum level of a contaminant in drinking water at which no known or anticipated adverse health effects occur, allowing for an adequate margin of safety. MCLGs are non-enforceable health goals. EPA establishes the MCL based on the MCLG.
2

Table 3: TTHM and HAA5 MCLGs
DBP Individual Species MCLG (ug/L) Chloroform 70 Bromodichloromethane Zero Dibromochloromethane 60
Trihalomethane
Bromoform Zero Monochloroacetic acid 70 Dichloroacetic acid Zero
Haloacetic Acids
Trichloroacetic acid 20
For the Stage 1 DBPR (current compliance monitoring), sample results are used to calculate an overall system running annual average (RAA) that is compared to the MCL. For the Stage 2 DBPR (compliance monitoring to start in 2012), sample results from each sample location will be used to calculate a location running annual average (LRAA) that will be compared to the MCL. This change to an LRAA more precisely determines a consumer’s exposure to DBPs in a specific location during any given annual timeframe.
THM and HAA Formation THMs and HAAs are, simply stated, a product of a reaction between a disinfectant (chlorine or monochloramine) and a precursor (natural organic matter (NOM) and bromide). The overall formation is affected by various parameters including concentration of precursors, disinfectant dose and residual, time, temperature and pH.1
During DBP formation, the disinfectant will react with NOM to form the various species of by-products. If bromide is present in the source water or is introduced during treatment, it will become oxidized by aqueous chlorine and then react with NOM to form brominated DBPs.1 In most fresh water sources, that are not influenced by saltwater intrusion or other bromide source, THM formation is dominated by chloroform and HAA formation is dominated by mono-, di- and trichloroacetic acids. When bromide is present, formation starts to include the brominated species of DBPs and as the ratio of bromide to NOM increases, the percentage of brominated DBPs will increase.1 Studies have shown that the rate of THM formation is higher in water with increased concentrations of bromide.1 Once the bromide reaches a certain level, the formation of DBPs will also be predominantly brominated unless very high chlorine doses are used, which will cause the chlorine to “out-compete” the bromide.1
In 2002 the Environmental Protection Agency (EPA) published a study entitled “The Occurrence of Disinfection By-Products (DBPs) of Health Concern in Drinking Water: Results of a Nationwide DBP Occurrence Study” (EPA/600/R-02/068) that examined DBP formation at systems throughout the United States. This study included drinking waters disinfected with the four common disinfectants: chlorine, chloramines, ozone, and chlorine dioxide. Because many of the high priority DBPs were brominated, the EPA study selected drinking water systems treating sources that contained relatively high bromide levels. In addition, many of the selected systems had source waters that were relatively high in TOC. These studies showed the same pattern of formation as described in the previous paragraph.
3

It is important to note that the EPA study found source water bromide levels as high as 0.40 mg/L (400 ug/L), which the report classified as high levels. The report referred to a bromide concentration of 0.15 mg/L (150 ug/L) as a moderate concentration and 0.02 mg/L (20 ug/L) as a low concentration. It is also important to note that the system that had the highest source water bromide concentration (400 ug/L), treated water impacted by saltwater intrusion.
Although DBP formation will tend towards the brominated species in the presence of bromide in the source water, overall formation is highly variable from drinking water system to system, even if source water characteristics are similar. Treatment techniques, treatment effectiveness and chemical dosages are factors affecting formation at a water treatment facility. Distribution system size, distribution system maintenance and water age are factors influencing formation in the distribution system.
1 Formation and Control of Disinfection By-Products in Drinking Water, American Water Works Association, Denver, CO, 1999
4

STUDY APPROACH The objective was to determine if THM formation, and more specifically brominated species, increased during the same timeframe as the TDS event in the Monongahela (3rd and 4th quarters of 2008). If so, this may indicate that the source of the sulfate and TDS may also be a source of bromide that is impacting THM formation.
To determine if bromide is impacting THM formation at plants along the Monongahela, Allegheny or Ohio Rivers, historical THM data was collected from various drinking water systems that utilize these rivers for their source water. Lab sheets showing the breakdown of the THM species were obtained in order to determine the THM speciation since compliance monitoring data is reported as Total Trihalomethanes (TTHMs), which is the sum of the species.
Figure 1 is a map of the intakes and related Public Water System ID number (PWSID) for systems in the DEP Southwest Region that utilize the Ohio, Monongahela and Allegheny Rivers as at least one of their source waters. Table 4 is a list of the related system owners with the PWSIDs shown on the map. The green dots in Figure 1 represent the intakes of systems whose data is presented in this report and the green highlighted systems in Table 4 are associated with the intakes.
Figure 1: DEP SW Region Drinking Water Intakes on the Ohio, Monongahela and Allegheny Rivers
5

6
Table 4: DEP SW Region Drinking Water Systems with Intakes on the Ohio, Monongahela and Allegheny Rivers
PWSID SYSTEM NAME PRIMARY SOURCE 5630039 AUTH OF BORO OF CHARLEROI MONONGAHELA RIVER 5020039 PA AMER WATER CO-PITTSBURGH MONONGAHELA RIVER 5630045 TRI CNTY JT MUNI AUTH MONONGAHELA RIVER 5260004 BELLE VERNON BORO MUNI AUTH MONONGAHELA RIVER 5260005 PA-AMERICAN WATER-BROWNSVILLE MONONGAHELA RIVER 5260009 WASHINGTON TWP MUNI AUTH MONONGAHELA RIVER 5260013 MASONTOWN MUNI WATER WORKS MONONGAHELA RIVER 5260014 NEWELL MUNI AUTH MONONGAHELA RIVER 5300005 CARMICHAELS MUNI WATER AUTH MONONGAHELA RIVER 5300007 DUNKARD VALLEY JT MUNI AUTH MONONGAHELA RIVER 5300012 EAST DUNKARD WATER ASSN MONONGAHELA RIVER 5300017 SOUTHWESTERN PA WATER AUTH MONONGAHELA RIVER 5020036 OAKMONT BORO MUNI AUTH ALLEGHENY RIVER 5020038 PITTSBURGH WATER & SEWER AUTH ALLEGHENY RIVER 5650070 NEW KENSINGTON MUNI AUTH ALLEGHENY RIVER 5020006 BRACKENRIDGE BORO WATER DEPT ALLEGHENY RIVER 5020055 TARENTUM BORO WATER DEPT ALLEGHENY RIVER 5020056 WILKINSBURG-PENN JT WATER AUTH ALLEGHENY RIVER 5020108 HARRISON TWP WATER AUTH ALLEGHENY RIVER 5030019 BUFFALO TWP MUN AUTH FREEPORT ALLEGHENY RIVER 5020011 MOON TWP MUNI AUTH OHIO RIVER 5020045 ROBINSON TWP MUNI AUTH OHIO RIVER 5020043 WEST VIEW BORO MUNI AUTH OHIO RIVER 5040038 MIDLAND BORO MUNI AUTH OHIO RIVER 5040300 NOVA CHEMICALS BEAVER VLY PLT OHIO RIVER
Data was obtained from two systems from each of the three rivers, including data from a consecutive system (Oakdale Borough) of PA American Water Company - Pittsburgh (7 total systems). Most of the systems where data was obtained utilize free chlorine as their primary disinfectant. The exception is Oakmont Borough which utilizes chloramination from May 15th to November 15th.
The goal was to obtain at least two years of DBP data for each system, although the data obtained varies from three and a half years to one year. This data was compiled using Microsoft Excel and graphed to determine if there was a trend in speciation that would indicate an increase in brominated species of THMs. The following items were trended graphically for each sample location where DBP samples were obtained:
• Chloroform concentration in ug/L • Bromodichloromethane concentration in ug/L • Dibromochloromethane concentration in ug/L • Bromoform concentration in ug/L • Total trihalomethane concentration in ug/L • % of the total trihalomethane concentration that are brominated species
Low river flows may also contribute to increased concentrations of contaminants, including bromide. Flow data from one United States Geological Survey (USGS) Stream Gauge on each river was obtained from the USGS National Water Information System. The monitoring station selected was the one most representative of flows near the intakes of the systems presented in this report. Figure 2 is a map of the USGS Stream Gauges on the Ohio, Monongahela and Allegheny Rivers, and their tributaries, in the DEP

Southwest Region. Table 5 is a list of the related monitoring station names with the ID numbers shown on the map, for those gauges that are located on the rivers. The green triangles in Figure 2 represent the monitoring stations whose data is presented in this report and the green highlighted names in Table 5 are associated with the stream gauges.
Figure 2: DEP SW Region USGS Stream Gauges on the Ohio, Monongahela and Allegheny Rivers and Their Tributaries
Table 5: DEP SW Region USGS Stream Gauges on the Ohio, Monongahela and
Allegheny Rivers STATION NUMBER STATION NAME RIVER 3075070 ELIZABETH, PA MONONGAHELA RIVER 3063000 LOCK & DAM 8 AT POINT MARION, PA MONONGAHELA RIVER 3072655 MASONTOWN, PA MONONGAHELA RIVER 3075000 CHARLEROI, PA MONONGAHELA RIVER 3049500 NATRONA, PA ALLEGHENY RIVER 3086000 SEWICKLEY, PA OHIO RIVER 3085734 EMSWORTH DAM LOWER POOL OHIO RIVER 3108490 MONTGOMERY DAM & LOCKS AT OHIOVIEW, PA OHIO RIVER
7

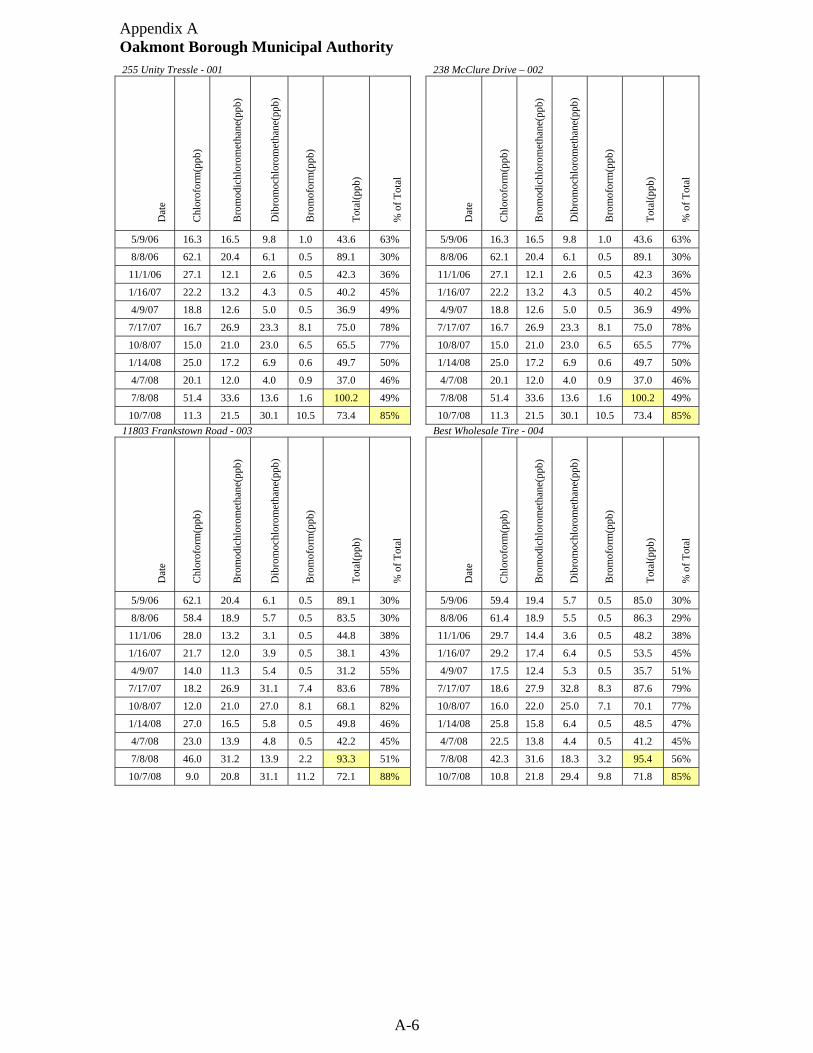
STUDY RESULTS The data is presented for each system by source. In order to better manage the size of this report, only one or two representative locations are shown for each system. These graphs represent typical speciation throughout the system. Tabular data for all systems and all sample locations is located in Appendix A. In Appendix A, the highest percentage of brominated species and highest TTHM value are highlighted in yellow for each sample location data set.
Flow data from one USGS monitoring station on each river is also presented graphically for the years 2005 through 2008.
Monongahela River
Authority of the Borough of Charleroi
0.0
20.0
40.0
60.0
80.0
100.0
120.0
140.0
160.0
Sep-05
Mar-06
Oct-06
Apr-07
Nov-07
Jun-0
8
Dec-08
0%10%20%30%40%50%60%70%80%90%100%
Chloroform(ug/L)Bromodichloromethane(ug/L)Dibromochloromethane(ug/L)Bromoform(ug/L)Total(ug/L)% of Total
PA American Water Company – Pittsburgh
USC Twp Building - 119
0.0
20.0
40.0
60.0
80.0
100.0
120.0
Jan-0
8
Feb-08
Apr-08
Jun-0
8Ju
l-08
Sep-08
Oct-08
Dec-08
0%10%20%30%40%50%60%70%80%90%100%
Chloroform(ug/L)Bromodichloromethane(ug/L)Dibromochloromethane(ug/L)Bromoform(ug/L)Total(ug/L)% of Total
8

Independence Booster - 156
0.0
20.0
40.0
60.0
80.0
100.0
120.0
140.0
Jan-0
8
Feb-08
Apr-08
Jun-0
8Ju
l-08
Sep-08
Oct-08
Dec-08
0%10%20%30%40%50%60%70%80%90%100%
Chloroform(ug/L)Bromodichloromethane(ug/L)Dibromochloromethane(ug/L)Bromoform(ug/L)Total(ug/L)% of Total
Oakdale Borough
Huckleberry's - 003
0.0
20.0
40.0
60.0
80.0
100.0
120.0
140.0
160.0
180.0
Jan-0
7
Apr-07
Aug-07
Nov-07
Feb-08
Jun-0
8
Sep-08
Dec-08
0%10%20%30%40%50%60%70%80%90%100%
Chloroform(ug/L)Bromodichloromethane(ug/L)Dibromochloromethane(ug/L)Bromoform(ug/L)Total(ug/L)% of Total
9

Oakdale UP Church - 014
0.0
20.0
40.0
60.0
80.0
100.0
120.0
140.0
160.0
180.0
Jan-0
7
Apr-07
Aug-07
Nov-07
Feb-08
Jun-0
8
Sep-08
Dec-08
0%10%20%30%40%50%60%70%80%90%100%
Chloroform(ug/L)Bromodichloromethane(ug/L)Dibromochloromethane(ug/L)Bromoform(ug/L)Total(ug/L)% of Total
Discussion All three systems experienced a significant increase in the percentage of the TTHM that was brominated in the 4th quarter of 2008 (all sample results, including those not shown, indicated between 85% and 95% were brominated).
At the Authority of the Borough of Charleroi, the sample results for the 4th quarter 2008 showed, in conjunction with the increase in brominated species, the chloroform concentration decreased significantly. This would indicate a high bromide to NOM ratio since the speciation was predominantly brominated. Based on the data shown, the transfer of speciation to brominated species did lead to a significant increase in TTHMs, compared to the 3rd quarter 2008 results and historical data.
At the Pennsylvania American Water Company – Pittsburgh system, the sample results for the 4th quarter 2008 also showed, in conjunction with the increase in brominated species, the chloroform concentration decreased significantly, indicating a high bromide to NOM ratio since the speciation was predominantly brominated. Based on the data shown, the transfer of speciation to brominated species did not lead to an increase in TTHMs, compared to the 3rd quarter 2008 results. Although the brominated species appear to be trending upwards in the 3rd quarter 2008, which would indicate bromide in the source water, chloroform has the highest concentration of the four species of THMs.
At the Oakdale Borough consecutive system, the sample results for the 4th quarter 2008 also showed, in conjunction with the increase in brominated species, the chloroform concentration decreased significantly, indicating a high bromide to NOM ratio since the speciation was predominantly brominated. Based on the data shown, the transfer of speciation to brominated species did not lead to an increase in TTHMs at the Huckleberry’s sample location, compared to the 3rd quarter 2008 results or historical data. It did however produce the highest TTHM concentration at the Oakdale UP Church, compared to the historical data shown. Although the brominated species appear to be trending upwards in the 3rd quarter 2008 at both sites, which would indicate bromide in the source water, chloroform has the highest concentration of the four species of THMs.
10

Allegheny River
Oakmont Borough Municipal Authority
255 Unity Tressle - 001
0.0
20.0
40.0
60.0
80.0
100.0
120.0
Mar-06
Jul-0
6
Oct-06
Jan-0
7
Apr-07
Aug-07
Nov-07
Feb-08
Jun-0
8
Sep-08
Dec-08
0%10%20%30%40%50%60%70%80%90%100%
Chloroform(ug/L)Bromodichloromethane(ug/L)Dibromochloromethane(ug/L)Bromoform(ug/L)Total(ug/L)% of Total
11803 Frankstown Road - 003
0.010.020.030.040.050.060.070.080.090.0
100.0
Mar-06
Jul-0
6
Oct-06
Jan-0
7
Apr-07
Aug-07
Nov-07
Feb-08
Jun-0
8
Sep-08
Dec-08
0%10%20%30%40%50%60%70%80%90%100%
Chloroform(ug/L)Bromodichloromethane(ug/L)Dibromochloromethane(ug/L)Bromoform(ug/L)Total(ug/L)% of Total
11

Pittsburgh Water and Sewer Authority
Mission Pump Station (Highland #2)
0.0
50.0
100.0
150.0
200.0
250.0
Feb-05
Sep-05
Mar-06
Oct-06
Apr-07
Nov-07
Jun-0
8
Dec-08
Jul-0
90%10%20%30%40%50%60%70%80%90%100%
Chloroform(ug/L)Bromodichloromethane(ug/L)Dibromochloromethane(ug/L)Bromoform(ug/L)Total(ug/L)% of Total
1022 Chestnut (Lanpher)
0.0
20.0
40.0
60.0
80.0
100.0
120.0
140.0
160.0
180.0
Feb-05
Sep-05
Mar-06
Oct-06
Apr-07
Nov-07
Jun-0
8
Dec-08
Jul-0
90%10%20%30%40%50%60%70%80%90%100%
Chloroform(ug/L)Bromodichloromethane(ug/L)Dibromochloromethane(ug/L)Bromoform(ug/L)Total(ug/L)% of Total
Discussion Both systems experienced an increase in the percentage of the TTHM that was brominated in the 4th quarter of 2008 (all sample results, including those not shown, indicated between 85% and 94% were brominated).
12
At the Oakmont Borough Municipal Authority, the sample results for the 4th quarter 2008 showed, in conjunction with the increase in brominated species, the chloroform concentration decreased significantly. This would indicate a high bromide to NOM ratio since the speciation was predominantly brominated. Based on the data shown, the

transfer of speciation to brominated species did not lead to an increase in TTHMs, compared to the 3rd quarter 2008 results or historical data. During 2007, the same pattern occurred with increased brominated species in the 4th quarter, but a lower TTHM result compared to the 3rd quarter, which was also predominantly brominated. The elevated 3rd quarter TTHMs during 2007 appear to be related to elevated bromide in the source water (i.e. elevated brominated species) compared to the elevated 3rd quarter 2008 TTHM results in which chloroform is present in the highest concentration. It is important to note that the Oakmont Borough Municipal Authority utilizes chloramines as their primary disinfectant from May 15th to November 15th. Therefore, the majority of the DBPs formed during this timeframe are formed in the treatment process, prior to chloramination.
Sample results for the 4th quarter 2008 from the Pittsburgh Water and Sewer Authority also showed, in conjunction with the increase in brominated species, the chloroform concentration decreased significantly. This would indicate a high bromide to NOM ratio since the speciation was predominantly brominated. Based on the data shown, the transfer of speciation to brominated species did not lead to an increase in TTHMs, compared to the 3rd quarter 2008 results. Samples taken during the 3rd quarter 2008, specifically August 19th, had results that also showed elevated brominated species (all sample results from August 19th, including those not shown, indicated between 82% and 84% were brominated). These results did produce a significant increase in TTHM. During 2007, the same pattern occurred with elevated TTHMs in the 3rd quarter, but in 2007 the percentage of brominated species was higher in the 3rd quarter compared to the 4th quarter results. Both of the elevated 3rd and 4th quarter 2007 TTHMs appear to be related to elevated bromide in the source water (i.e. elevated brominated species).
Ohio River
Moon Township Municipal Authority
1935 Hassam Road
0.010.020.030.040.050.060.070.080.090.0
100.0
Sep-05
Mar-06
Oct-06
Apr-07
Nov-07
Jun-0
8
Dec-08
0%10%20%30%40%50%60%70%80%90%100%
Chloroform(ug/L)Bromodichloromethane(ug/L)Dibromochloromethane(ug/L)Bromoform(ug/L)Total(ug/L)% of Total
13

Carnot Storage Tanks
0.010.0
20.0
30.040.0
50.060.0
70.0
80.090.0
Sep-05
Mar-06
Oct-06
Apr-07
Nov-07
Jun-0
8
Dec-08
0%10%20%30%40%50%60%70%80%90%100%
Chloroform(ug/L)Bromodichloromethane(ug/L)Dibromochloromethane(ug/L)Bromoform(ug/L)Total(ug/L)% of Total
Municipal Authority of the Township of Robinson
Waste Tank Cleaning
0
5
10
15
20
25
30
35
40
45
Jan-0
7
Apr-07
Aug-07
Nov-07
Feb-08
Jun-0
8
Sep-08
Dec-08
0%10%20%30%40%50%60%70%80%90%100%
Chloroform(ug/L)Bromodichloromethane(ug/L)Dibromochloromethane(ug/L)Bromoform(ug/L)Total(ug/L)% of Total
14

Highland Towers
0
20
40
60
80
100
120
Jan-0
7
Apr-07
Aug-07
Nov-07
Feb-08
Jun-0
8
Sep-08
Dec-08
0%10%20%30%40%50%60%70%80%90%100%
Chloroform(ug/L)Bromodichloromethane(ug/L)Dibromochloromethane(ug/L)Bromoform(ug/L)Total(ug/L)% of Total
Discussion Both systems experienced an increase in the percentage of the TTHM that was brominated in the 4th quarter of 2008 (all sample results, including those not shown, indicated between 87% and 98% were brominated).
At the Moon Township Municipal Authority, the sample results for the 4th quarter 2008 showed, in conjunction with the increase in brominated species, the chloroform concentration decreased significantly. This would indicate a high bromide to NOM ratio since the speciation was predominantly brominated. Based on the data shown, the transfer of speciation to brominated species did not lead to an increase in TTHMs at one sample location, 1935 Hassam Road, but did at the other sample location, Carnot Storage Tanks. Compared to historical data, the increase in TTHMs at the Carnot Storage Tanks during the 4th quarter 2008 was significant. During 2006 and 2007, the same pattern occurred with increased brominated species in the 4th quarter and associated elevated TTHM results at only the 1935 Hassam Road sample location. The 3rd and 4th quarter 2007 sample results at the Carnot Storage Tanks were very similar, with elevated brominated speciation but only slightly elevated TTHMs.
At the Municipal Authority of the Township of Robinson, the sample results for the 4th quarter 2008 showed, in conjunction with the increase in brominated species, the chloroform concentration decreased significantly, indicating a high bromide to NOM ratio since the speciation was predominantly brominated. Based on the data shown, the increase in speciation to the brominated species in the 4th quarter 2008 did not lead to an increase in TTHMs, compared to the 3rd quarter 2008 results, where the THMs were also highly brominated. Compared to historical data, the increase in TTHMs at all sample locations, including those not shown, during the 3rd quarter 2008 was significant. During 2007, the same pattern occurred with increased brominated species in the 4th quarter, but a lower TTHM value compared to the 3rd quarter, where the THMs were highly brominated as well (all sample results, including those not shown, indicated between 84% and 93% were brominated).
15

River Flow Data
16

Discussion
All three rivers have had significant seasonal changes in flow from 2005 though 2008. With the exception of occasional spikes during any given seasonal cycle, most likely due to precipitation or snow melt, the flows are typically lower during the warmer and typically dryer months (summer and early fall) and higher in the cooler and typically more precipitant months (late winter and spring).
The Monongahela River has very comparable seasonal high and low flows, with the exception of the summer and early fall of 2008, which, at times, had slightly lower than normal flows. The lower flows may have contributed to the increased concentrations of TDS, sulfates and, potentially, bromide.
The Allegheny and Ohio Rivers also have very comparable seasonal high and low flows. The exception is on the Ohio River during the summer and early fall of 2005 which, at times, had slightly lower than normal flows.
Conclusion Overall, the systems that were used in this study have TTHM concentrations that are impacted by bromide in the source water at various times during the year. In some cases the TTHM concentration that was comprised of mostly brominated species produced the highest historical TTHM value. In conjunction, the systems on the Monongahela River appear to have been impacted directly by the source of the TDS and sulfate, which is most likely also a source of bromide. Elevated concentrations of bromide, as well as TDS and sulfates, may also have been impacted by low river flows during the 3rd and 4th quarters 2008, compared to historical seasonal flows. Without source water bromide sample results it is difficult to make a direct correlation between the TDS and sulfate event and the elevated brominated THM species. However, based on the speciation there appears to be a strong correlation between THM formation and elevated source water bromide concentrations in the Monongahela River.
The water systems on the Allegheny and Ohio Rivers have a more historical and seasonal cycle of brominated THM formation. As with the Monongahela, the source of the bromide contributing to the seasonal increases in brominated THMs is unknown;
17

18
although, there appears to be a correlation between low seasonal flows and increased brominated THM formation. During the 3rd and 4th quarter 2008, the drinking water systems on the Ohio River may have been impacted by the same source of bromide as the systems on the Monongahela River, since it feeds into the Ohio River.
As stated previously, it is important to note that THMs are, simply stated, a product of a reaction between a disinfectant (chlorine or monochloramine) and a precursor (natural organic matter (NOM) and bromide). In order to control DBP formation various parameters must be properly managed including the concentration of precursors, disinfectant dose and residual, time, temperature and pH. Although THM formation will tend towards the brominated species in the presence of bromide in the source water, overall formation is highly variable from drinking water system to system, even if source water characteristics are similar. Treatment techniques, treatment effectiveness and chemical dosages are factors affecting formation at a water treatment facility. Distribution system size, distribution system maintenance and water age are factors influencing formation in the distribution system.
When contemplating and investigating options to control DBP formation, it is important to remember that the primary function of water treatment and distribution system management is the removal or inactivation of pathogens and prevention of pathogenic contamination and consumption. Pathogens present an acute (conditions are severe and sudden in onset), and potentially widespread, health risk. DBPs, on the other hand, present a chronic (long-developing syndrome) health risk from continued exposure over an extended timeframe. Although the control of DBPs is an important aspect of water treatment and distribution, the treatment for the removal or inactivation of pathogens should not be compromised in an effort to reduce DBP formation.

Appendix A
A-1
APPENDIX A
MONONGAHELA RIVER
Charleroi
Dat
e
Chl
orof
orm
(ppb
)
Bro
mod
ichl
orom
etha
ne(p
pb)
Dib
rom
ochl
orom
etha
ne(p
pb)
Bro
mof
orm
(ppm
)
Tota
l(ppb
)
% o
f Tot
al
1/23/06 13.8 7.2 2.3 0.5 23.8 42%
4/18/06 20.4 13.0 5.0 0.5 38.9 48%
7/12/06 54.9 9.4 2.2 0.5 67.0 18%
11/6/06 30.1 14.7 3.3 0.5 48.6 38%
1/22/07 16.4 6.9 1.6 0.5 25.4 35%
4/27/07 24.6 8.4 2.1 0.5 35.6 31%
7/30/07 48.5 28.1 28.1 0.7 105.3 54%
10/25/07 31.5 28.5 18.8 2.6 81.3 61%
1/22/08 13.5 8.5 4.0 0.5 26.5 49%
6/24/08 43.5 15.9 6.0 0.5 65.9 34%
7/30/08 57.0 28.0 13.0 1.2 99.2 43%
10/20/08 9.0 28.3 57.2 45.1 139.6 94%
PA American - Pittsburgh USC Twp Building - 119 PAWC – Valley Operations Center – 145
Dat
e
Chl
orof
orm
(ppb
)
Bro
mod
ichl
orom
etha
ne(p
pb)
Dib
rom
ochl
orom
etha
ne(p
pb)
Bro
mof
orm
(ppb
)
Tota
l(ppb
)
% o
f Tot
al
Dat
e
Chl
orof
orm
(ppb
)
Bro
mod
ichl
orom
etha
ne(p
pb)
Dib
rom
ochl
orom
etha
ne(p
pb)
Bro
mof
orm
(ppb
)
Tota
l(ppb
)
% o
f Tot
al
2/13/08 32.1 9.3 2.8 0.5 44.7 28% 2/13/08 36.1 11.9 3.2 0.5 51.7 30%
5/12/08 25.7 4.4 13.2 1.0 44.3 42% 5/12/08 26.2 4.5 14.5 1.0 46.2 43%
8/12/08 42.5 20.2 35.7 2.8 101.2 58% 8/12/08 47.0 19.1 34.9 2.6 103.6 55%
11/19/08 4.5 34.7 16.2 34.6 90.0 95% 11/19/08 5.6 34.7 16.7 32.9 89.9 94% Independence Booster – 156 Malone Ridge Booster – 136
Dat
e
Chl
orof
orm
(ppb
)
Bro
mod
ichl
orom
etha
ne(p
pb)
Dib
rom
ochl
orom
etha
ne(p
pb)
Bro
mof
orm
(ppb
)
Tota
l(ppb
)
% o
f Tot
al
Dat
e
Chl
orof
orm
(ppb
)
Bro
mod
ichl
orom
etha
ne(p
pb)
Dib
rom
ochl
orom
etha
ne(p
pb)
Bro
mof
orm
(ppb
)
Tota
l(ppb
)
% o
f Tot
al
2/13/08 39.2 11.8 3.2 0.5 54.7 28% 2/13/08 38.7 12.6 3.6 0.5 55.4 30%
5/12/08 28.2 6.6 14.0 1.0 49.8 43% 5/12/08 20.4 5.1 12.5 1.0 39.0 48%
8/12/08 62.4 16.4 35.7 1.8 116.3 46% 8/12/08 59.2 19.0 37.3 2.5 118.0 50%
11/19/08 6.6 44.8 22.1 41.7 115.2 94% 11/19/08 4.4 15.4 32.1 33.2 85.1 95%

Appendix A
A-2
Independence Booster – 156 Malone Ridge Booster – 136
Dat
e
Chl
orof
orm
(ppb
)
Bro
mod
ichl
orom
etha
ne(p
pb)
Dib
rom
ochl
orom
etha
ne(p
pb)
Bro
mof
orm
(ppb
)
Tota
l(ppb
)
% o
f Tot
al
Dat
e
Chl
orof
orm
(ppb
)
Bro
mod
ichl
orom
etha
ne(p
pb)
Dib
rom
ochl
orom
etha
ne(p
pb)
Bro
mof
orm
(ppb
)
Tota
l(ppb
)
% o
f Tot
al
2/13/08 44.2 10.9 2.5 0.5 58.1 24% 2/13/08 46.3 13.7 3.4 0.5 63.9 28%
5/12/08 51.5 5.3 19.0 1.0 76.8 33% 5/12/08 51.4 4.5 17.1 1.0 74.0 31%
8/12/08 58.3 19.1 37.2 2.2 116.8 50% 8/12/08 55.0 16.5 34.6 1.9 108.0 49%
11/19/08 5.2 14.9 11.8 7.3 39.2 87% 11/19/08 6.3 16.5 14.0 7.6 44.4 86% Homestead PRV Station - 151 Waterways Plumbing - 138
Dat
e
Chl
orof
orm
(ppb
)
Bro
mod
ichl
orom
etha
ne(p
pb)
Dib
rom
ochl
orom
etha
ne(p
pb)
Bro
mof
orm
(ppb
)
Tota
l(ppb
)
% o
f Tot
al
Dat
e
Chl
orof
orm
(ppb
)
Bro
mod
ichl
orom
etha
ne(p
pb)
Dib
rom
ochl
orom
etha
ne(p
pb)
Bro
mof
orm
(ppb
)
Tota
l(ppb
)
% o
f Tot
al
2/13/08 44.2 10.7 2.4 0.5 57.8 24% 2/13/08 45.9 13.4 3.4 0.5 63.2 27%
5/12/08 51.0 4.2 18.0 1.0 74.2 31% 5/12/08 55.6 4.3 16.4 1.0 77.3 28%
8/12/08 49.9 15.7 32.1 1.7 99.4 50% 8/12/08 52.8 15.3 32.1 1.8 102.0 48%
11/19/08 4.6 12.5 10.1 6.0 33.3 86% 11/19/08 6.8 17.1 14.1 7.9 45.9 85%
Oakdale Borough (PA American Pittsburgh Consecutive) Oakdale Maintenance Garage - 012 Huckleberry’s - 003
Dat
e
Chl
orof
orm
(ppb
)
Bro
mod
ichl
orom
etha
ne(p
pb)
Dib
rom
ochl
orom
etha
ne(p
pb)
Bro
mof
orm
(ppb
)
Tota
l(ppb
)
% o
f Tot
al
Dat
e
Chl
orof
orm
(ppb
)
Bro
mod
ichl
orom
etha
ne(p
pb)
Dib
rom
ochl
orom
etha
ne(p
pb)
Bro
mof
orm
(ppb
)
Tota
l(ppb
)
% o
f Tot
al
3/7/07 30.0 8.1 1.8 0.5 40.4 26% 3/7/07 28.6 7.8 1.7 0.5 38.6 26%
5/10/07 28.0 11.0 4.3 0.5 43.8 36% 5/10/07 23.0 9.8 4.0 0.5 37.3 38%
8/8/07 48.2 37.4 21.8 2.7 110.1 56% 8/8/07 45.2 36.9 22.3 3.0 107.4 58%
10/3/07 62.0 44.0 22.0 3.9 131.9 53% 10/3/07 59.0 41.0 24.0 4.0 128.0 54%
6/9/08 28.7 6.7 2.1 1.0 38.5 25% 6/9/08 12.6 3.5 0.5 0.5 17.1 26%
8/7/08 90.8 45.4 18.6 1.4 156.2 42% 8/7/08 88.4 47.3 19.8 1.6 157.1 44%
10/17/08 14.6 39.0 78.8 61.2 193.6 92% 10/17/08 14.9 33.5 40.4 38.1 126.9 88%

Appendix A
A-3
Oakdale UP Church - 014 405 Clinton Ave. Ext. - 011
Dat
e
Chl
orof
orm
(ppb
)
Bro
mod
ichl
orom
etha
ne(p
pb)
Dib
rom
ochl
orom
etha
ne(p
pb)
Bro
mof
orm
(ppb
)
Tota
l(ppb
)
% o
f Tot
al
Dat
e
Chl
orof
orm
(ppb
)
Bro
mod
ichl
orom
etha
ne(p
pb)
Dib
rom
ochl
orom
etha
ne(p
pb)
Bro
mof
orm
(ppb
)
Tota
l(ppb
)
% o
f Tot
al
3/7/07 28.6 7.6 1.6 0.5 38.3 25% 3/7/07 32.8 10.1 2.4 0.5 45.8 28%
5/10/07 25.0 11.0 4.5 0.5 41.0 39% 5/10/07 32.0 12.0 4.5 0.5 49.0 35%
8/8/07 46.9 37.5 24.4 3.5 112.3 58% 8/8/07 46.8 34.4 19.6 2.5 103.3 55%
10/3/07 60.0 34.0 19.0 3.7 116.7 49% 10/3/07 64.0 40.0 22.0 3.7 129.7 51%
6/9/08 18.5 4.0 1.8 1.1 25.4 27% 6/9/08 27.8 6.8 2.7 1.2 38.5 28%
8/7/08 78.8 41.7 17.4 1.4 139.3 43% 8/7/08 88.0 45.8 19.4 1.6 154.8 43%
10/17/08 13.2 32.6 73.3 46.2 165.3 92% 10/17/08 14.4 39.6 71.1 55.9 181.0 92%

Appendix A
A-4
ALLEGHENY RIVER
Pittsburgh Water and Sewer Authority Mission Pump St. (Highland #2) Bedford Fire House
Dat
e
Chl
orof
orm
(ppb
)
Bro
mod
ichl
orom
etha
ne(p
pb)
Dib
rom
ochl
orom
etha
ne(p
pb)
Bro
mof
orm
(ppb
)
Tota
l(ppb
)
% o
f Tot
al
Dat
e
Chl
orof
orm
(ppb
)
Bro
mod
ichl
orom
etha
ne(p
pb)
Dib
rom
ochl
orom
etha
ne(p
pb)
Bro
mof
orm
(ppb
)
Tota
l(ppb
)
% o
f Tot
al
8/11/05 66.1 49.0 75.2 12.8 203.1 67% 8/1/05 25.9 34.7 44.9 20.0 125.5 79%
8/16/05 37.2 45.0 54.3 20.6 157.1 76% 8/11/05 43.1 36.7 66.0 12.9 158.7 73%
8/30/05 14.2 22.5 29.8 16.1 82.5 83% 8/16/05 18.2 30.8 46.1 26.1 121.2 85%
9/13/05 8.8 23.3 45.6 38.3 115.9 92% 8/30/05 7.7 13.4 24.4 18.3 63.8 88%
2/14/06 11.8 10.5 8.1 1.5 31.8 63% 9/13/05 19.0 27.9 44.0 27.3 118.3 84%
5/16/06 12.4 14.3 14.0 4.1 44.9 72% 2/14/06 8.0 8.4 7.1 1.6 25.0 68%
8/29/06 31.9 31.9 38.0 16.3 118.1 73% 5/16/06 6.4 12.8 15.2 7.3 41.8 85%
10/25/06 25.6 22.0 11.7 1.5 60.9 58% 8/29/06 13.8 21.9 35.7 14.9 86.2 84%
11/14/06 31.3 16.7 7.1 0.8 55.9 44% 11/14/06 21.4 14.2 7.7 0.9 44.2 51%
11/29/06 23.6 14.6 5.3 0.0 43.5 46% 2/15/07 5.5 7.1 6.4 2.5 21.6 75%
2/15/07 11.2 10.2 7.5 2.5 31.4 64% 5/15/07 18.5 14.4 11.2 1.8 45.9 60%
5/15/07 33.0 19.5 9.5 1.3 63.3 48% 8/14/07 5.8 16.7 40.5 49.1 112.1 95%
8/14/07 5.0 15.8 42.7 56.6 120.1 96% 11/14/07 12.2 22.1 25.4 12.6 72.3 83%
11/14/07 16.7 24.4 32.6 16.7 90.3 82% 1/15/08 8.7 7.6 6.8 2.0 25.1 65%
1/15/08 7.7 7.4 7.2 1.8 24.1 68% 2/14/08 10.7 7.6 4.3 0.8 23.4 54%
2/14/08 12.9 8.8 5.3 1.3 28.3 55% 3/18/08 8.1 6.4 4.7 1.5 20.7 61%
3/18/08 13.6 8.3 5.2 1.1 28.1 52% 4/15/08 10.7 8.4 6.8 1.3 27.2 61%
4/15/08 11.2 6.0 3.5 0.8 21.5 48% 5/13/08 9.1 10.4 13.7 5.3 38.5 76%
5/13/08 10.3 12.6 16.2 5.7 44.8 77% 6/17/08 11.0 17.0 22.6 10.6 61.2 82%
6/17/08 18.9 23.0 23.3 9.4 74.5 75% 7/24/08 41.9 43.0 32.0 6.6 123.6 66%
7/24/08 54.5 49.0 36.4 5.9 145.8 63% 8/19/08 15.8 27.0 39.4 14.6 96.8 84%
8/19/08 26.9 53.5 53.0 15.9 149.2 82% 11/18/08 5.6 15.7 26.5 20.1 67.8 92%
11/18/08 5.0 17.3 33.3 25.9 81.4 94%

Appendix A
A-5
1022 Chestnut (Lanpher) Homestead Fire House
Dat
e
Chl
orof
orm
(ppb
)
Bro
mod
ichl
orom
etha
ne(p
pb)
Dib
rom
ochl
orom
etha
ne(p
pb)
Bro
mof
orm
(ppb
)
Tota
l(ppb
)
% o
f Tot
al
Dat
e
Chl
orof
orm
(ppb
)
Bro
mod
ichl
orom
etha
ne(p
pb)
Dib
rom
ochl
orom
etha
ne(p
pb)
Bro
mof
orm
(ppb
)
Tota
l(ppb
)
% o
f Tot
al
8/1/05 25.1 36.4 45.6 20.9 128.0 80% 8/1/05 22.5 32.6 44.2 20.9 120.2 81%
8/11/05 34.4 35.1 66.1 18.7 154.2 78% 8/11/05 46.6 33.9 56.7 12.9 150.0 69%
8/16/05 19.8 32.9 46.4 24.5 123.6 84% 8/16/05 22.5 28.0 39.4 25.2 115.1 80%
8/30/05 13.2 19.2 26.7 16.4 75.4 83% 8/30/05 8.4 12.9 21.3 16.6 59.1 86%
9/13/05 12.4 25.1 45.4 39.2 122.1 90% 9/15/05 38.2 36.9 49.4 31.9 156.4 76%
12/2/05 16.4 20.1 18.1 5.1 59.7 73% 2/14/06 10.2 9.7 8.6 1.9 30.4 67%
2/14/06 11.0 11.3 9.4 1.9 33.6 67% 5/16/06 8.3 13.4 15.5 6.5 43.6 81%
5/16/06 12.3 16.1 16.1 5.3 49.8 75% 8/29/06 15.3 23.1 29.6 12.6 80.5 81%
8/29/06 18.1 24.5 34.5 14.4 91.5 80% 11/14/06 23.7 14.7 8.6 1.1 48.1 51%
11/14/06 27.5 18.3 8.8 1.0 55.5 51% 2/15/07 3.3 6.9 7.1 3.4 20.7 84%
2/15/07 7.5 8.8 6.0 1.6 24.0 69% 5/15/07 18.2 12.2 10.9 1.6 43.0 58%
5/15/07 18.1 16.0 11.6 1.5 47.2 62% 8/14/07 6.7 12.9 32.8 45.4 97.8 93%
8/14/07 4.8 16.8 42.7 61.3 125.6 96% 11/14/07 9.2 17.6 26.1 16.4 69.4 87%
11/14/07 12.5 24.1 34.2 21.0 91.7 86% 1/15/08 9.1 8.4 7.1 1.9 26.5 66%
1/15/08 9.0 9.3 6.4 2.1 26.7 66% 2/14/08 12.2 8.3 5.4 1.5 27.5 55%
2/14/08 9.4 9.2 6.7 2.1 27.4 66% 3/18/08 9.5 7.1 5.3 1.4 23.3 59%
3/18/08 8.4 7.0 5.2 1.6 22.2 62% 4/15/08 10.2 8.3 7.2 1.8 27.4 63%
4/15/08 10.6 9.4 6.9 1.4 28.4 63% 5/13/08 10.7 11.1 13.3 3.9 39.0 72%
5/13/08 9.5 12.8 16.1 5.1 43.6 78% 6/17/08 7.8 8.8 9.8 3.4 29.8 74%
6/17/08 17.2 22.1 21.0 7.5 67.8 75% 7/24/08 33.0 33.0 29.8 7.4 103.3 68%
7/24/08 25.8 24.0 16.9 4.3 71.1 64% 8/19/08 12.8 24.2 30.7 11.7 79.4 84%
8/19/08 18.5 36.5 42.7 16.9 114.5 84% 11/18/08 7.5 17.8 28.8 16.3 70.3 89%
11/18/08 6.5 18.9 31.8 8.2 65.4 90%
Appendix A
A-6
Oakmont Borough Municipal Authority 255 Unity Tressle - 001 238 McClure Drive – 002
Dat
e
Chl
orof
orm
(ppb
)
Bro
mod
ichl
orom
etha
ne(p
pb)
Dib
rom
ochl
orom
etha
ne(p
pb)
Bro
mof
orm
(ppb
)
Tota
l(ppb
)
% o
f Tot
al
Dat
e
Chl
orof
orm
(ppb
)
Bro
mod
ichl
orom
etha
ne(p
pb)
Dib
rom
ochl
orom
etha
ne(p
pb)
Bro
mof
orm
(ppb
)
Tota
l(ppb
)
% o
f Tot
al
5/9/06 16.3 16.5 9.8 1.0 43.6 63% 5/9/06 16.3 16.5 9.8 1.0 43.6 63%
8/8/06 62.1 20.4 6.1 0.5 89.1 30% 8/8/06 62.1 20.4 6.1 0.5 89.1 30%
11/1/06 27.1 12.1 2.6 0.5 42.3 36% 11/1/06 27.1 12.1 2.6 0.5 42.3 36%
1/16/07 22.2 13.2 4.3 0.5 40.2 45% 1/16/07 22.2 13.2 4.3 0.5 40.2 45%
4/9/07 18.8 12.6 5.0 0.5 36.9 49% 4/9/07 18.8 12.6 5.0 0.5 36.9 49%
7/17/07 16.7 26.9 23.3 8.1 75.0 78% 7/17/07 16.7 26.9 23.3 8.1 75.0 78%
10/8/07 15.0 21.0 23.0 6.5 65.5 77% 10/8/07 15.0 21.0 23.0 6.5 65.5 77%
1/14/08 25.0 17.2 6.9 0.6 49.7 50% 1/14/08 25.0 17.2 6.9 0.6 49.7 50%
4/7/08 20.1 12.0 4.0 0.9 37.0 46% 4/7/08 20.1 12.0 4.0 0.9 37.0 46%
7/8/08 51.4 33.6 13.6 1.6 100.2 49% 7/8/08 51.4 33.6 13.6 1.6 100.2 49%
10/7/08 11.3 21.5 30.1 10.5 73.4 85% 10/7/08 11.3 21.5 30.1 10.5 73.4 85% 11803 Frankstown Road - 003 Best Wholesale Tire - 004
Dat
e
Chl
orof
orm
(ppb
)
Bro
mod
ichl
orom
etha
ne(p
pb)
Dib
rom
ochl
orom
etha
ne(p
pb)
Bro
mof
orm
(ppb
)
Tota
l(ppb
)
% o
f Tot
al
Dat
e
Chl
orof
orm
(ppb
)
Bro
mod
ichl
orom
etha
ne(p
pb)
Dib
rom
ochl
orom
etha
ne(p
pb)
Bro
mof
orm
(ppb
)
Tota
l(ppb
)
% o
f Tot
al
5/9/06 62.1 20.4 6.1 0.5 89.1 30% 5/9/06 59.4 19.4 5.7 0.5 85.0 30%
8/8/06 58.4 18.9 5.7 0.5 83.5 30% 8/8/06 61.4 18.9 5.5 0.5 86.3 29%
11/1/06 28.0 13.2 3.1 0.5 44.8 38% 11/1/06 29.7 14.4 3.6 0.5 48.2 38%
1/16/07 21.7 12.0 3.9 0.5 38.1 43% 1/16/07 29.2 17.4 6.4 0.5 53.5 45%
4/9/07 14.0 11.3 5.4 0.5 31.2 55% 4/9/07 17.5 12.4 5.3 0.5 35.7 51%
7/17/07 18.2 26.9 31.1 7.4 83.6 78% 7/17/07 18.6 27.9 32.8 8.3 87.6 79%
10/8/07 12.0 21.0 27.0 8.1 68.1 82% 10/8/07 16.0 22.0 25.0 7.1 70.1 77%
1/14/08 27.0 16.5 5.8 0.5 49.8 46% 1/14/08 25.8 15.8 6.4 0.5 48.5 47%
4/7/08 23.0 13.9 4.8 0.5 42.2 45% 4/7/08 22.5 13.8 4.4 0.5 41.2 45%
7/8/08 46.0 31.2 13.9 2.2 93.3 51% 7/8/08 42.3 31.6 18.3 3.2 95.4 56%
10/7/08 9.0 20.8 31.1 11.2 72.1 88% 10/7/08 10.8 21.8 29.4 9.8 71.8 85%

Appendix A
A-7
OHIO RIVER
Moon Township Municipal Authority 1935 Hassam Road 1000 Stoop Ferry Road
Dat
e
Chl
orof
orm
(ppb
)
Bro
mod
ichl
orom
etha
ne(p
pb)
Dib
rom
ochl
orom
etha
ne(p
pb)
Bro
mof
orm
(ppb
)
Tota
l(ppb
)
% o
f Tot
al
Dat
e
Chl
orof
orm
(ppb
)
Bro
mod
ichl
orom
etha
ne(p
pb)
Dib
rom
ochl
orom
etha
ne(p
pb)
Bro
mof
orm
(ppb
)
Tota
l(ppb
)
% o
f Tot
al
2/7/06 12.4 9.7 4.1 0.5 26.8 54% 2/7/06 11.7 10.0 4.5 0.5 26.6 56%
4/18/06 11.2 11.5 6.4 1.1 30.1 63% 4/18/06 10.1 8.8 4.0 0.6 23.5 57%
7/10/06 16.3 20.0 14.9 2.5 53.7 70% 7/10/06 12.4 16.1 11.0 1.7 41.2 70%
10/10/06 17.5 25.6 20.2 3.9 67.2 74% 10/10/06 11.4 18.5 15.5 3.2 48.6 77%
1/16/07 16.3 11.3 4.3 0.5 32.4 50% 1/16/07 19.3 13.3 5.2 0.6 38.4 50%
4/10/07 13.6 14.0 9.1 1.3 38.0 64% 4/10/07 12.7 12.8 8.4 1.3 35.2 64%
7/10/07 7.2 10.9 11.3 2.8 32.2 78% 7/10/07 6.0 9.9 10.1 2.3 28.3 79%
10/16/07 10.0 20.3 30.1 12.4 72.8 86% 10/16/07 5.8 13.0 18.5 8.0 45.3 87%
1/15/08 20.6 16.8 8.4 1.0 46.8 56% 1/15/08 17.2 12.2 5.7 0.8 35.9 52%
4/15/08 16.0 14.2 7.6 0.9 38.7 59% 4/15/08 13.9 12.3 6.5 0.8 33.5 59%
7/15/08 15.6 18.2 25.2 29.4 88.4 82% 7/15/08 9.9 11.0 9.6 1.5 32.0 69%
10/14/08 5.2 11.2 17.4 7.0 40.8 87% 10/14/08 3.7 9.5 17.6 10.0 40.8 91% 1700 Beaver Road Carnot Storage Tank
Dat
e
Chl
orof
orm
(ppb
)
Bro
mod
ichl
orom
etha
ne(p
pb)
Dib
rom
ochl
orom
etha
ne(p
pb)
Bro
mof
orm
(ppb
)
Tota
l(ppb
)
% o
f Tot
al
Dat
e
Chl
orof
orm
(ppb
)
Bro
mod
ichl
orom
etha
ne(p
pb)
Dib
rom
ochl
orom
etha
ne(p
pb)
Bro
mof
orm
(ppb
)
Tota
l(ppb
)
% o
f Tot
al
2/7/06 16.0 10.5 3.9 0.5 30.9 48% 2/7/06 27.9 18.4 8.3 0.9 55.5 50%
4/18/06 17.3 19.4 13.1 0.5 50.3 66% 4/18/06 21.1 20.1 12.1 1.9 55.2 62%
7/10/06 19.1 20.0 14.0 2.2 55.3 65% 7/10/06 19.4 25.0 19.9 4.2 68.5 72%
10/10/06 15.8 23.3 20.2 4.5 63.8 75% 10/10/06 12.9 20.1 20.8 5.6 59.4 78%
1/16/07 22.1 15.5 6.0 0.7 44.3 50% 1/16/07 24.7 19.1 8.7 1.0 53.5 54%
4/10/07 25.0 14.3 6.1 0.5 45.9 46% 4/10/07 25.3 16.3 7.8 0.8 50.2 50%
7/10/07 8.3 14.5 18.3 5.3 46.4 82% 7/10/07 10.1 18.1 24.3 7.1 59.6 83%
10/16/07 10.8 19.9 19.9 8.9 59.5 82% 10/16/07 9.4 17.5 20.6 7.1 54.6 83%
1/15/08 19.5 12.8 5.9 0.9 39.1 50% 1/15/08 24.8 16.5 7.7 1.1 50.1 50%
4/15/08 15.2 13.4 7.2 0.9 36.7 59% 4/15/08 26.4 15.3 6.1 0.5 48.3 45%
7/15/08 13.3 12.8 9.5 1.5 37.1 64% 7/15/08 18.0 17.0 15.9 3.1 54.0 67%
10/14/2008 4.2 11.1 18.7 9.2 43.2 90% 10/14/2008 6.1 15.7 34.0 23.0 78.8 92%

Appendix A
A-8
Municipal Authority of the Township of Robinson Waste Tank Cleaning Robinson Public Works
Dat
e
Chl
orof
orm
(ppb
)
Bro
mod
ichl
orom
etha
ne(p
pb)
Dib
rom
ochl
orom
etha
ne(p
pb)
Bro
mof
orm
(ppb
)
Tota
l(ppb
)
% o
f Tot
al
Dat
e
Chl
orof
orm
(ppb
)
Bro
mod
ichl
orom
etha
ne(p
pb)
Dib
rom
ochl
orom
etha
ne(p
pb)
Bro
mof
orm
(ppb
)
Tota
l(ppb
)
% o
f Tot
al
5/7/07 4.1 5.3 5.3 0.8 15.5 74% 5/7/07 15 11 9.8 1.2 37.0 59%
8/13/07 2.8 8 16.1 10.5 37.4 93% 8/13/07 9 18.9 33.7 18.4 80.0 89%
11/5/07 1.1 4.1 10.8 7.4 23.4 95% 11/5/07 8.3 21 45.7 31.5 106.5 92%
2/4/08 4.5 5.1 4.4 0.5 14.5 69% 2/4/08 7.5 9.1 6.2 0.9 23.7 68%
5/5/08 3.3 4.6 6.6 1.5 16.0 79% 5/5/08 5.1 6.2 7.3 1.5 20.1 75%
8/4/08 10.5 13.8 13.9 2.8 41.0 74% 8/4/08 19.1 20.9 19.7 3.5 63.2 70%
11/3/08 0.5 3.7 13.4 14.5 32.1 98% 11/3/08 1.5 8.6 22.4 19.0 51.5 97% Highland Towers MATR Office
Dat
e
Chl
orof
orm
(ppb
)
Bro
mod
ichl
orom
etha
ne(p
pb)
Dib
rom
ochl
orom
etha
ne(p
pb)
Bro
mof
orm
(ppb
)
Tota
l(ppb
)
% o
f Tot
al
Dat
e
Chl
orof
orm
(ppb
)
Bro
mod
ichl
orom
etha
ne(p
pb)
Dib
rom
ochl
orom
etha
ne(p
pb)
Bro
mof
orm
(ppb
)
Tota
l(ppb
)
% o
f Tot
al
5/7/07 16 11 9.9 1.3 38.2 58% 05/07/07 17 11 11 1.5 40.5 58%
8/13/07 13.4 25.3 35.6 14.8 89.1 85% 08/13/07 15.3 26 37 15.5 93.8 84%
11/5/07 3.3 10.8 26.3 19 59.4 94% 11/05/07 6.9 18.4 40.5 28.2 94.0 93%
2/4/08 10.8 14.3 12.9 0.5 38.5 72% 2/4/08 11.9 15.3 14.5 0.7 42.4 72%
5/5/08 15.1 13.0 16.0 3.9 48.0 69% 5/5/08 20.0 14.3 16.2 3.6 54.1 63%
8/4/08 27.9 31.5 33.4 9.3 102.1 73% 8/4/08 32.4 32.6 33.4 9.0 107.4 70%
11/3/08 6.2 21.3 41.2 28.8 97.5 94%


![V. SPECIATION A. Allopatric Speciation B. Parapatric Speciation (aka Local or Progenitor - Derivative) C. Adaptive Radiation D. Sympatric Speciation [Polyploidy]](https://img.pdfslide.net/doc/110x75/56649d3f5503460f94a186e2/v-speciation-a-allopatric-speciation-b-parapatric-speciation-aka-local.jpg)