Embed Size (px)
Citation preview
TriMet Southwest Barbur Boulevard Stormwater Capstone Project
Portland State University • Civil Engineering Capstone (CE 484)Winter/Spring 2018
ALBA Consulting: Aryk Atkinson • Lucien Friedenfels • Bernadel Garstecki Abdullah Saleem
Bernadel Garstecki • Report Compilation
Patrick McLaughlin • Instructor • Civil and Environmental EngineeringMaseeh College of Engineering and Computer Science
Portland State University
Sustainable Cities InitiativeT R I M E T
2
Acknowledgments ALBA Consulting would like to extend gratitude to Jenny Lyman with TriMet and Doug Gates with David Evans and Associates for all their assistance and guidance throughout this project. ALBA Consulting would also like acknowledge Patrick McLaughlin for all his support in provid-ing resources and information to use on this project, as well as Dr. Gwynn Johnson and the civ-il engineering team at VLMK Engineering and Design, Portland, OR, for their help with design analysis portion of this project.
Project DisclaimerThis report was prepared as part of a class project for the Civil and Environmental Engineering Project Management and Design course at Portland State University. The contents of this report were developed by the student authors and do not necessarily reflect the views of Portland State University. The analyses, conclusions, and recommendations contained in the report should not be construed as an engineering report or used as a substitute for professional engineering services.
3Sustainable Cities Initiative
About SCIThe Sustainable Cities Initiative (SCI) is a cross-disciplinary organization at the University of Oregon that promotes education, service, public outreach, and research on the design and development of sustainable cities. We are redefining higher education for the public good and catalyzing community change toward sustainability. Our work addresses sustainability at multiple scales and emerges from the conviction that creating the sustainable city cannot happen within any single discipline. SCI is grounded in cross-disciplinary engagement as the key strategy for improving community sustainability. Our work connects student energy, faculty experience, and community needs to produce innovative, tangible solutions for the creation of a sustainable society.
About SCYPThe Sustainable City Year Program (SCYP) is a year-long partnership between SCI and a partner in Oregon, in which students and faculty in courses from across the university collaborate with a public entity on sustainability and livability projects. SCYP faculty and students work in collaboration with staff from the partner agency through a variety of studio projects and service-learning courses to provide students with real world projects to investigate. Students bring energy, enthusiasm, and innovative approaches to difficult, persistent problems. SCYP’s primary value derives from collaborations resulting in on-the-ground impact and expanded conversations for a community ready to transition to a more sustainable and livable future.
SCI Directors and Staff Marc Schlossberg, SCI Co-Director, and Professor of Planning, Public Policy, and Management, University of OregonNico Larco, SCI Co-Director, and Associate Professor of Architecture, University of OregonMegan Banks, SCYP Manager, University of Oregon

4
About TriMetThe Tri-County Metropolitan Transportation District of Oregon was created by the Oregon Legislature in 1969 to operate and oversee mass transit in the Portland Metropolitan region. This public entity was formed by the legislature as a municipal corporation to replace the multiple private interest mass transit companies that previously operated in Multnomah County, Clackamas County, and Washington County; the counties that make up TriMet.In addition to operating bus lines, light rail, and paratransit in the defined Tri-Metropolitan district, TriMet also connects to external mass transit services to provide wider blanket coverage for the region. TriMet’s nationally recognized transit system provides more than 100 million rides annually, and carries 45% of rush hour commuters going into the downtown Portland area. TriMet not only moves people, but helps build sustainable cities by improving public health; creating vibrant, walkable communities; supporting economic growth; and working to enhance the region’s livability.Several civic leaders have been highlighted as key Figures in the creation, establishment, and ultimate success of TriMet. Governor Tom McCall is credited with the initial call for the creation of the public corporation; other key contributors include Congressman Earl Blumenauer, Rick Gustafson, Dick Feeney, and Mayor Neil Goldschmidt. All were instrumental in shaping the organization itself, as well as the land use, civic development, and transformation policies that make TriMet the success that it is today.The vision and efforts of these individuals and countless others have borne fruit. Recently, TriMet celebrated the second anniversary of the opening of its most recent light rail line. Since its inauguration the 7.3-mile MAX Orange Line has experienced continued growth, having a six percent year-to-year increase in ridership. Illustrating the holistic approach that has been a part of TriMet from its inception, there have been wider community benefits such as a positive impact on employment and a focus on sustainable practices such as bio-swales, eco-roofs, afirst-in-the-nation eco-track segment, solar paneling, and regenerative energy systems.TriMet is a key partner in the region’s Southwest Corridor Plan and Shared Investment Strategy. Eleven partner agencies are participating in planning for a new 12-mile light rail line in southwest Portland and southeast Washington County that will also include bicycle, pedestrian, and roadway projects to improve safety and access to light rail stations. Southwest Corridor stakeholders include Metro (the regional government), Washington County, Oregon Department of Transportation, and the cities of Beaverton, Durham, King City, Portland, Sherwood, Tigard, and Tualatin. This collaborative approach strives to align local, regional, and state policies and investments in the Corridor, and will implement and support adopted regional and local plans. These initiatives and outcomes from participation with the UO’s Sustainable City Year Program will help develop ideas that are cost effective to build and operate, provide safe and convenient access, and achieve sustainability goals while supporting the corridor’s projected growth in population and employment.

5Sustainable Cities Initiative
Table of ContentsAcknowledgments 2About SCI 3About SCYP 3SCI Directors and Staff 3About TriMet 4Course Participants 6Executive Summary 7Introduction 8Alternate Analysis 10Facility Design 22Regulatory Compliance and Permitting 30Conclusion 31Appendices 32References 42
This report represents original student work and recommendationsprepared by students in the University of Oregon’s Sustainable City
Year Program for TriMet’s Southwest Corridor project. Text andimages contained in this report may not be used without
permission from the University of Oregon.

6
Course ParticipantsALBA Consulting, an undergraduate alliance formed for the TriMet SW Barbur Boulevard Stormwater Capstone Project at Portland State University:Aryk Atkinson, Environmental Engineering, Undergraduate Lucien Friedenfels, Environmental Engineering, UndergraduateBernadel Garstecki, Civil Engineering, Undergraduate Abdullah Saleem, Environmental Engineering, Undergraduate
7Sustainable Cities Initiative
Executive SummaryThis project was designed by ALBA Consulting. ALBA Consulting is an academic exercise comprised of four members of an undergraduate capstone class in engineering at Portland State University during winter and spring terms, 2018. ALBA Consulting strives to be a steward of sustainable solutions by engineering effective future assets for the communities we serve. The group sorted itself into professional roles, including: a Project Manager, an Assistant Project Manager, a Scribe, and a Quality Control Technician. Furthermore, each member also had a technical role providing supplemental content generated in AutoCAD, GIS, and Excel. The following design report consists of preliminary facility designs and an alternative analysis for the TriMet Southwest Barbur Boulevard Stormwater Capstone Project. Over the course of six months, ALBA consulting prepared a construction cost estimates, a construction schedule, a drawing set, calculations, and site hydrographs in addition to other deliverables for this project. This capstone project was developed from the ongoing Southwest Corridor Light Rail Transit (SWC) Project, which is presently underway at TriMet. The purpose of the SWC Project is to connect downtown Portland, Tigard, and Tualatin with public transportation, thus providing a more convenient way for people to commute within the area while also reducing the number of personal vehicles on the roads. This project is currently in the preliminary design phase, and many aspects of the project have not been finalized, therefore, this report will focus on only one aspect of the overall project: the light rail line alignment option. The chosen alignment option runs along Barbur Boulevard, with a focus on a one-mile-long segment, south of downtown Portland. This particular alignment option was chosen for the purpose of addressing the issues of stormwater drainage from Barbur Boulevard and Interstate 5 into Stephens Creek. Currently, stormwater that flows into Stephens Creek has a high level of pollutants from the highways. This compromises the quality of the stream and increases erosion and toxic sediment levels in the creek. The objective of ALBA Consulting’s portion of the project is to provide TriMet with stormwater designs and analyses for the Barbur Boulevard alignment option. This information can be used to assist TriMet with their design of the alignment along Barbur Boulevard, with the goal of treating and detaining stormwater onsite to meet the criteria of predevelopment discharge levels. Treating stormwater onsite reduces the load on the conveyance pipes and helps recharge the groundwater system. The stormwater from the chosen section of the boulevard will then be discharged at the approved outfall for Stephens Creek. By treating the stormwater from the possible expansion on the boulevard, improvements in the water quality at Stephens Creek are expected. ALBA Consulting focused on the preliminary design of planters and ponds for this project. Planters and ponds were chosen because of their low maintenance costs, ability to improve greenspace, and effectiveness at managing stormwater. The recommendation is planters are placed along the length of Barbur Boulevard to meet pollution reduction requirements. Since planters alone will not meet detention requirements (due to low soil infiltration rates in the surrounding area), ponds were chosen as the preferred facility to meet detention requirements. Therefore, the preliminary design of one planter and one pond was conducted. The locations of potential planters along the length of the boulevard were identified, as well as two additional pond locations. Due to elevation and space constraints along the new road development, no location large enough to install one pond to detain all the stormwater from this section was found on the boulevard itself. As a result, the design of one pond was selected to treat water from approximately one-third of the road section in the southeastern end of the area. Additional ponds or other detention facilities will be needed to meet the total detention requirements for the stormwater from this section of Barbur Boulevard as well. The planter that was designed using a presumptive approach calculator online showed that the planter was able to meet
8
pollution reductions requirements. Based on this information, it is assumed that planters placed along the length of the boulevard will be adequate to meet the total pollution reduction requirements of the road section considered. The information provided in this report is intended to be used as a preliminary design for stormwater detention and treatment along Barbur Boulevard if this alignment option is chosen. All designs were based on preliminary site assessments from previous geotechnical reports of the surrounding area as well as a hydrograph based on estimated values for the Portland area as found from the Stormwater Management Manual (SWMM, 2016). Further analysis of the site should be conducted in order to ensure that all facilities are sized appropriately.
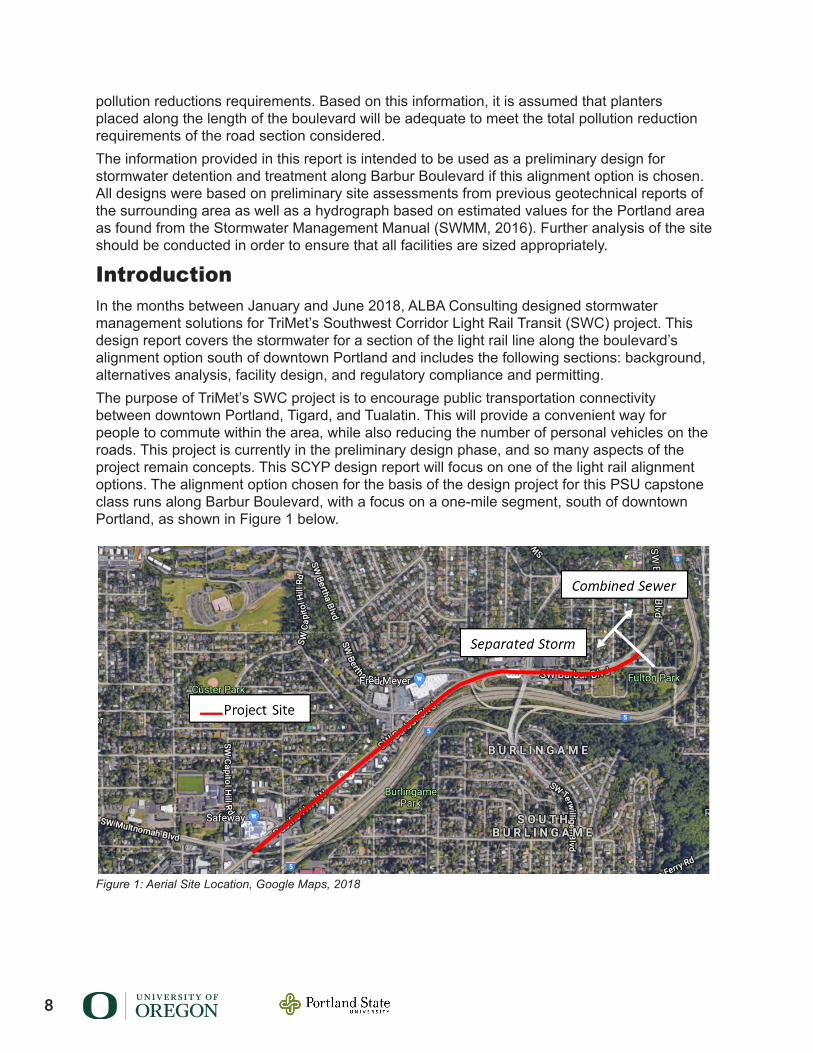
IntroductionIn the months between January and June 2018, ALBA Consulting designed stormwater management solutions for TriMet’s Southwest Corridor Light Rail Transit (SWC) project. This design report covers the stormwater for a section of the light rail line along the boulevard’s alignment option south of downtown Portland and includes the following sections: background, alternatives analysis, facility design, and regulatory compliance and permitting. The purpose of TriMet’s SWC project is to encourage public transportation connectivity between downtown Portland, Tigard, and Tualatin. This will provide a convenient way for people to commute within the area, while also reducing the number of personal vehicles on the roads. This project is currently in the preliminary design phase, and so many aspects of the project remain concepts. This SCYP design report will focus on one of the light rail alignment options. The alignment option chosen for the basis of the design project for this PSU capstone class runs along Barbur Boulevard, with a focus on a one-mile segment, south of downtown Portland, as shown in Figure 1 below.
Figure 1: Aerial Site Location, Google Maps, 2018

9Sustainable Cities Initiative
The objective of ALBA Consulting’s portion of TriMet’s project is to provide TriMet with stormwater designs and analyses for the one-mile segment. This student work can be used to assist TriMet with their design if an alignment option is chosen along Barbur Boulevard. All stormwater that travels above ground to the chosen section of Barbur Boulevard needs to be collected and infiltrated into the ground or sent to the storm sewer system. All new development projects are required to infiltrate and treat stormwater onsite to the maximum extent possible. This reduction in the load on the conveyance pipes will help recharge the groundwater system, a method whereby a route for surface water to enter the aquifer is ensured. Specific requirements for stormwater management are outlined in the Alternatives Analysis section following.
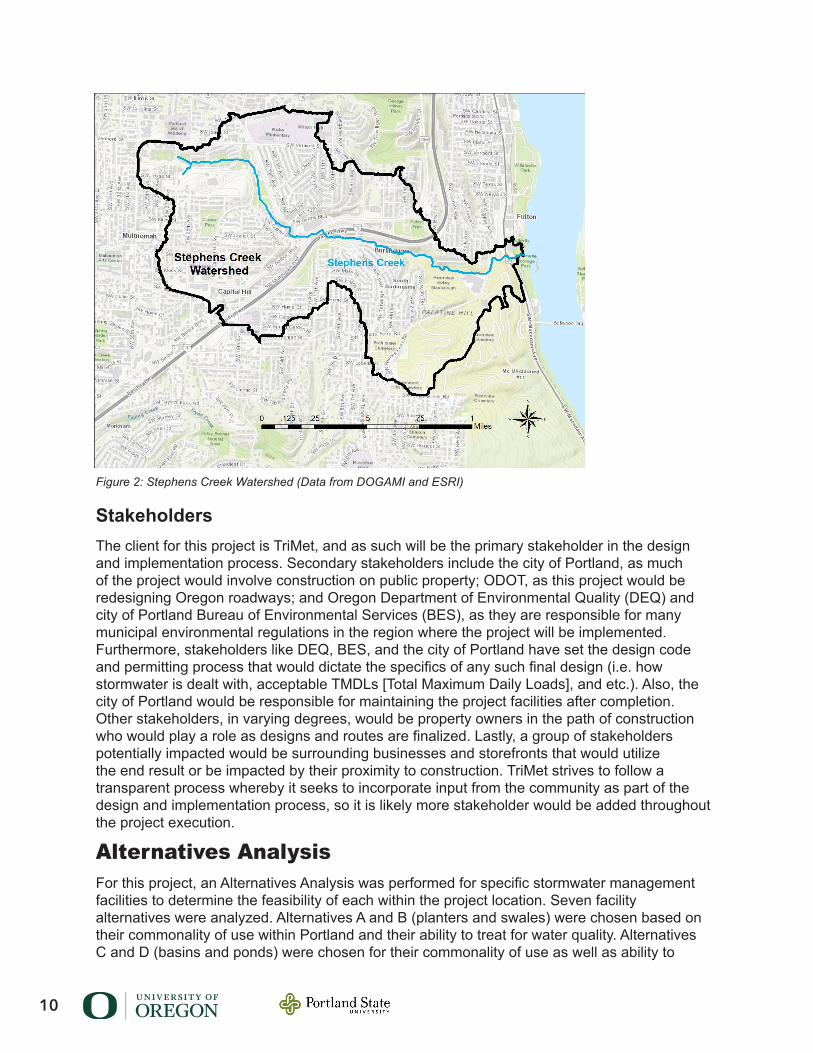
Existing Site ConditionsThe existing site is located south of downtown Portland along Barbur Boulevard. As shown in Figure 1, the chosen section includes both vegetated (pervious) areas and built-up (impervious) areas. Each type of area requires its own stormwater design calculations. All new development projects are required by the city of Portland to treat and detain the stormwater generated on the site, regardless of whether the project creates pervious or impervious area. The stormwater from the section of Barbur Boulevard chosen for this project will feed entirely into a separated storm sewer system. Stormwater north of the chosen section of Barbur Boulevard will feed into a combined sewer system as shown in Figure 1 above. Separated sewer systems have specific requirements that are outlined by the city of Portland’s Bureau of Environmental Services. Barbur Boulevard is currently a low speed highway that is used by private, public, and freight transportation. Portions of the boulevard will be entirely rebuilt in order to incorporate the new light rail line alignment. South of downtown Portland was chosen for this project in order to address the issues of stormwater from Barbur Boulevard and I-5 impacting Stephens Creek. The stormwater that flows into Stephens Creek has a high level of pollutants from the highways and it flows into the creek at higher velocities and for longer durations than what is presently supported by the stream. This is due to inadequate management at receiving facilities upstream. As a result, there is an increase in erosion and sediment levels in the creek. ArcGIS was used to estimate the drainage area of Stephens Creek Watershed as shown below in Figure 2. The stormwater management at this location is unique and challenging due to the steep slopes of the land surrounding Stephens Creek and the amount of runoff that accumulates. Therefore, the stormwater runoff from Barbur Boulevard will first need to be infiltrated to the maximum extent possible at facilities located along the boulevard before overflow stormwater is piped or channeled into Stephens Creek, where it will then be treated at additional facilities.
10
StakeholdersThe client for this project is TriMet, and as such will be the primary stakeholder in the design and implementation process. Secondary stakeholders include the city of Portland, as much of the project would involve construction on public property; ODOT, as this project would be redesigning Oregon roadways; and Oregon Department of Environmental Quality (DEQ) and city of Portland Bureau of Environmental Services (BES), as they are responsible for many municipal environmental regulations in the region where the project will be implemented. Furthermore, stakeholders like DEQ, BES, and the city of Portland have set the design code and permitting process that would dictate the specifics of any such final design (i.e. how stormwater is dealt with, acceptable TMDLs [Total Maximum Daily Loads], and etc.). Also, the city of Portland would be responsible for maintaining the project facilities after completion. Other stakeholders, in varying degrees, would be property owners in the path of construction who would play a role as designs and routes are finalized. Lastly, a group of stakeholders potentially impacted would be surrounding businesses and storefronts that would utilize the end result or be impacted by their proximity to construction. TriMet strives to follow a transparent process whereby it seeks to incorporate input from the community as part of the design and implementation process, so it is likely more stakeholder would be added throughout the project execution.
Alternatives AnalysisFor this project, an Alternatives Analysis was performed for specific stormwater management facilities to determine the feasibility of each within the project location. Seven facility alternatives were analyzed. Alternatives A and B (planters and swales) were chosen based on their commonality of use within Portland and their ability to treat for water quality. Alternatives C and D (basins and ponds) were chosen for their commonality of use as well as ability to
Figure 2: Stephens Creek Watershed (Data from DOGAMI and ESRI)

11Sustainable Cities Initiative
detain larger volumes of water than planters and swales. Alternative E (vaults) was chosen as an alternative method of storing water underground. Alternative F (pervious pavement) was chosen since it doesn’t require as many site restrictions, and Alternative G (Drywell) was chosen as a potential method to help infiltrate stormwater underground. All facility alternatives for this project are based on design criteria outlined in the BES Stormwater Management Manual (SWMM) and the Sewer and Drainage Facilities Design Manual (SDFDM) (SWMM, SDFDM, 2016, 2007). This section outlines the required standards for stormwater facilities, descriptions of the seven facility alternatives, selection criteria and Pugh matrix, as well as the results from the Pugh Matrix analysis with the chosen alternatives.
StandardsThe BES Stormwater Management Manual (SWMM) states that stormwater must be managed to meet standards for water quality, water quantity, and conveyance. Each of these three standards are outlined below.
Water Quality
The BES SWMM requires that there is at least 70% removal of TSS (Total Suspended Solids) from 90% of average annual runoff. This is the only requirement for this project since the site location is not in a watershed that regulates TMDL (Total Maximum Daily Loads).
Water Quantity
The BES SWMM requirements for storm only sewers for flow control are to maintain peak flow rates at their predevelopment levels for the 2-year, 5-year, 10-year, and 24-hour runoff events.
Conveyance
The BES SWMM requires that pipes have the capacity to convey flows from the 25-year design storm from all contributing upstream drainage areas.
Facility AlternativesThe seven facility alternatives that have been chosen to treat the runoff onto Barbur Boulevard are outlined and summarized below. These are threshold criteria that influenced ALBA’s recommendations for the purpose of this report; however, it should be noted that additional criteria were considered in subsequent sections as well as the methodology for analysis.
12
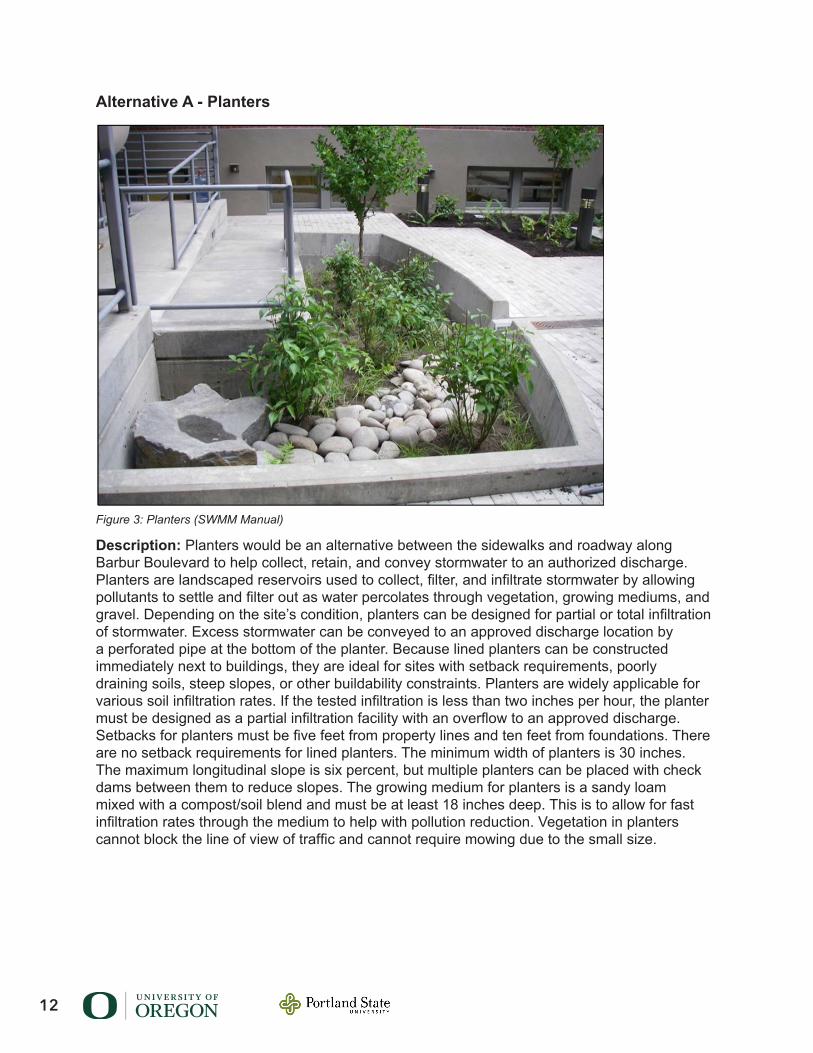
Description: Planters would be an alternative between the sidewalks and roadway along Barbur Boulevard to help collect, retain, and convey stormwater to an authorized discharge. Planters are landscaped reservoirs used to collect, filter, and infiltrate stormwater by allowing pollutants to settle and filter out as water percolates through vegetation, growing mediums, and gravel. Depending on the site’s condition, planters can be designed for partial or total infiltration of stormwater. Excess stormwater can be conveyed to an approved discharge location by a perforated pipe at the bottom of the planter. Because lined planters can be constructed immediately next to buildings, they are ideal for sites with setback requirements, poorly draining soils, steep slopes, or other buildability constraints. Planters are widely applicable for various soil infiltration rates. If the tested infiltration is less than two inches per hour, the planter must be designed as a partial infiltration facility with an overflow to an approved discharge. Setbacks for planters must be five feet from property lines and ten feet from foundations. There are no setback requirements for lined planters. The minimum width of planters is 30 inches. The maximum longitudinal slope is six percent, but multiple planters can be placed with check dams between them to reduce slopes. The growing medium for planters is a sandy loam mixed with a compost/soil blend and must be at least 18 inches deep. This is to allow for fast infiltration rates through the medium to help with pollution reduction. Vegetation in planters cannot block the line of view of traffic and cannot require mowing due to the small size.
Figure 3: Planters (SWMM Manual)
Alternative A - Planters
13Sustainable Cities Initiative
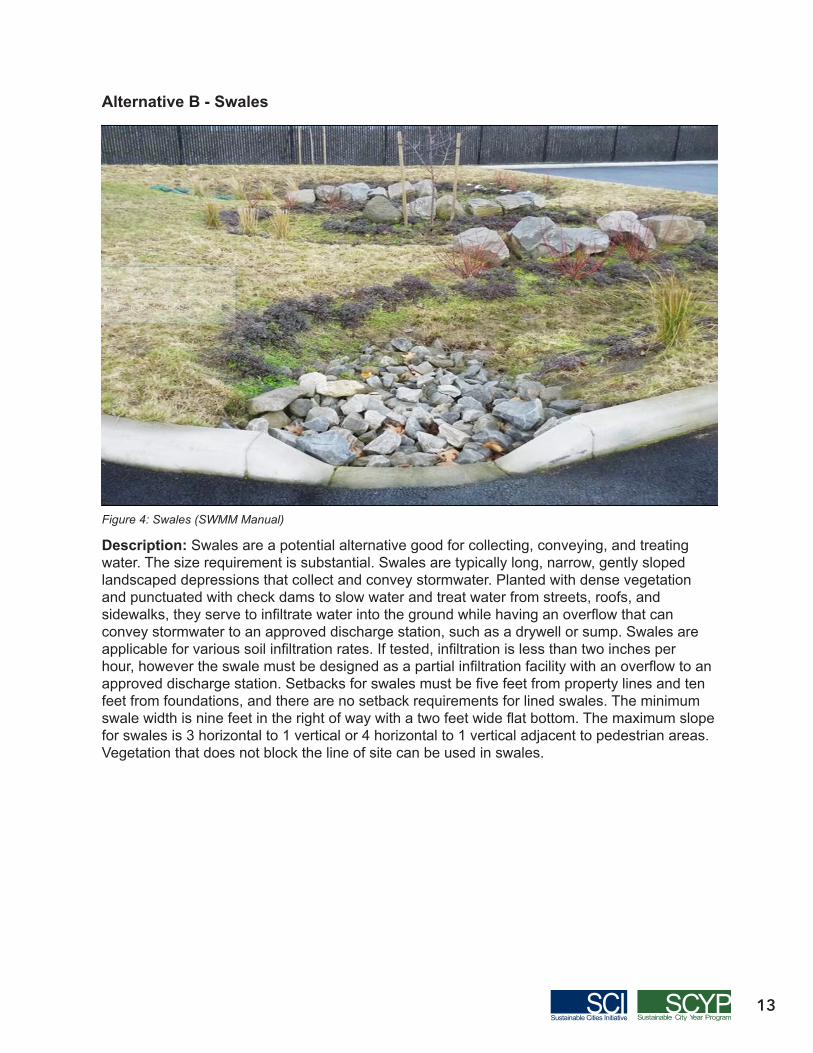
Description: Swales are a potential alternative good for collecting, conveying, and treating water. The size requirement is substantial. Swales are typically long, narrow, gently sloped landscaped depressions that collect and convey stormwater. Planted with dense vegetation and punctuated with check dams to slow water and treat water from streets, roofs, and sidewalks, they serve to infiltrate water into the ground while having an overflow that can convey stormwater to an approved discharge station, such as a drywell or sump. Swales are applicable for various soil infiltration rates. If tested, infiltration is less than two inches per hour, however the swale must be designed as a partial infiltration facility with an overflow to an approved discharge station. Setbacks for swales must be five feet from property lines and ten feet from foundations, and there are no setback requirements for lined swales. The minimum swale width is nine feet in the right of way with a two feet wide flat bottom. The maximum slope for swales is 3 horizontal to 1 vertical or 4 horizontal to 1 vertical adjacent to pedestrian areas. Vegetation that does not block the line of site can be used in swales.
Figure 4: Swales (SWMM Manual)
Alternative B - Swales
14
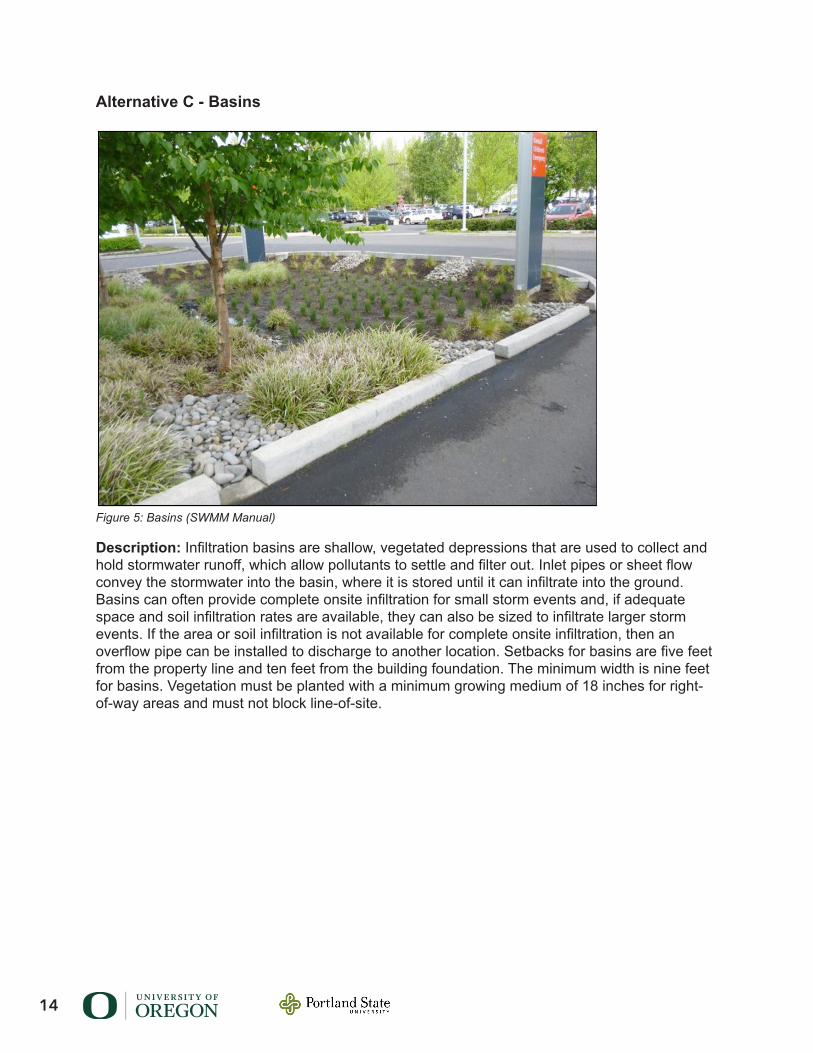
Description: Infiltration basins are shallow, vegetated depressions that are used to collect and hold stormwater runoff, which allow pollutants to settle and filter out. Inlet pipes or sheet flow convey the stormwater into the basin, where it is stored until it can infiltrate into the ground. Basins can often provide complete onsite infiltration for small storm events and, if adequate space and soil infiltration rates are available, they can also be sized to infiltrate larger storm events. If the area or soil infiltration is not available for complete onsite infiltration, then an overflow pipe can be installed to discharge to another location. Setbacks for basins are five feet from the property line and ten feet from the building foundation. The minimum width is nine feet for basins. Vegetation must be planted with a minimum growing medium of 18 inches for right-of-way areas and must not block line-of-site.
Figure 5: Basins (SWMM Manual)
Alternative C - Basins
15Sustainable Cities Initiative
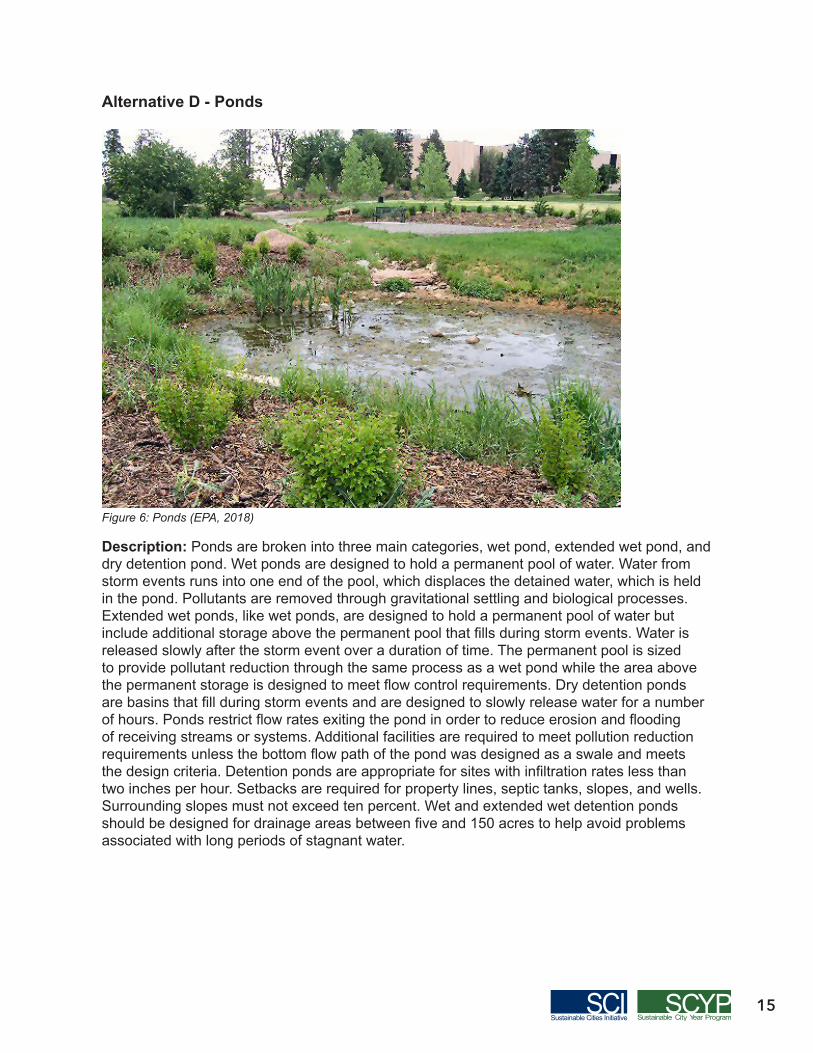
Description: Ponds are broken into three main categories, wet pond, extended wet pond, and dry detention pond. Wet ponds are designed to hold a permanent pool of water. Water from storm events runs into one end of the pool, which displaces the detained water, which is held in the pond. Pollutants are removed through gravitational settling and biological processes. Extended wet ponds, like wet ponds, are designed to hold a permanent pool of water but include additional storage above the permanent pool that fills during storm events. Water is released slowly after the storm event over a duration of time. The permanent pool is sized to provide pollutant reduction through the same process as a wet pond while the area above the permanent storage is designed to meet flow control requirements. Dry detention ponds are basins that fill during storm events and are designed to slowly release water for a number of hours. Ponds restrict flow rates exiting the pond in order to reduce erosion and flooding of receiving streams or systems. Additional facilities are required to meet pollution reduction requirements unless the bottom flow path of the pond was designed as a swale and meets the design criteria. Detention ponds are appropriate for sites with infiltration rates less than two inches per hour. Setbacks are required for property lines, septic tanks, slopes, and wells. Surrounding slopes must not exceed ten percent. Wet and extended wet detention ponds should be designed for drainage areas between five and 150 acres to help avoid problems associated with long periods of stagnant water.
Figure 6: Ponds (EPA, 2018)
Alternative D - Ponds
16
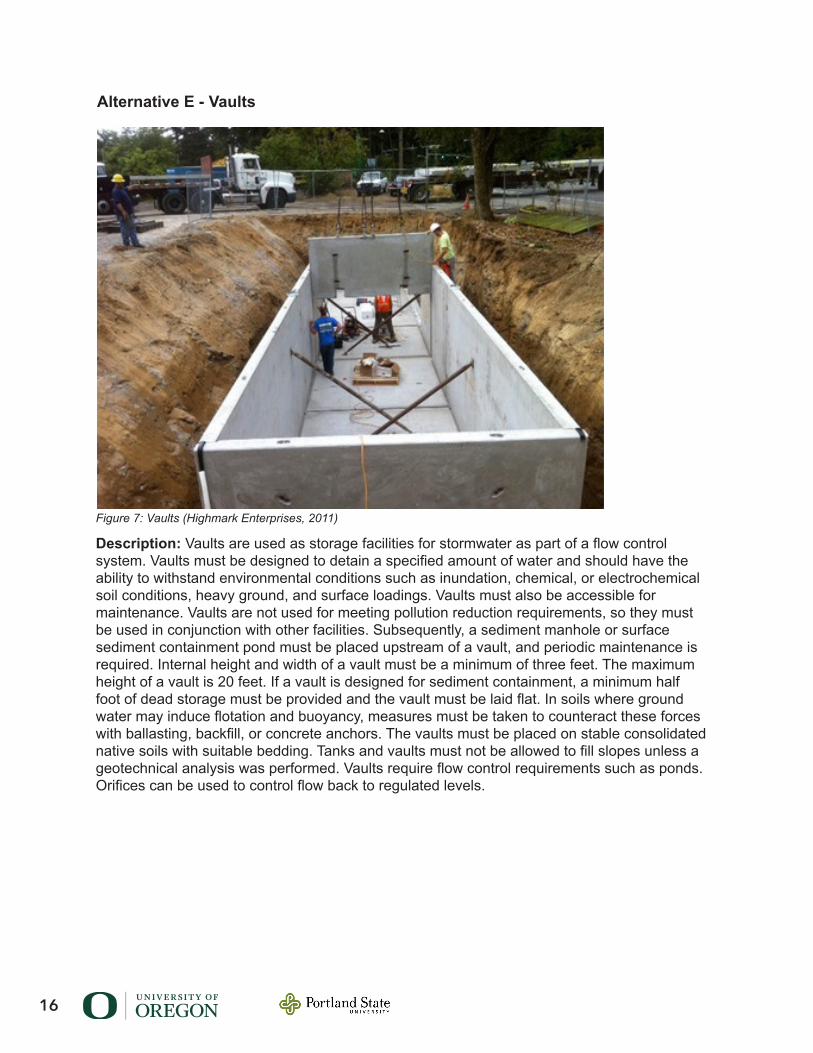
Figure 7: Vaults (Highmark Enterprises, 2011)
Description: Vaults are used as storage facilities for stormwater as part of a flow control system. Vaults must be designed to detain a specified amount of water and should have the ability to withstand environmental conditions such as inundation, chemical, or electrochemical soil conditions, heavy ground, and surface loadings. Vaults must also be accessible for maintenance. Vaults are not used for meeting pollution reduction requirements, so they must be used in conjunction with other facilities. Subsequently, a sediment manhole or surface sediment containment pond must be placed upstream of a vault, and periodic maintenance is required. Internal height and width of a vault must be a minimum of three feet. The maximum height of a vault is 20 feet. If a vault is designed for sediment containment, a minimum half foot of dead storage must be provided and the vault must be laid flat. In soils where ground water may induce flotation and buoyancy, measures must be taken to counteract these forces with ballasting, backfill, or concrete anchors. The vaults must be placed on stable consolidated native soils with suitable bedding. Tanks and vaults must not be allowed to fill slopes unless a geotechnical analysis was performed. Vaults require flow control requirements such as ponds. Orifices can be used to control flow back to regulated levels.
Alternative E - Vaults
17Sustainable Cities Initiative
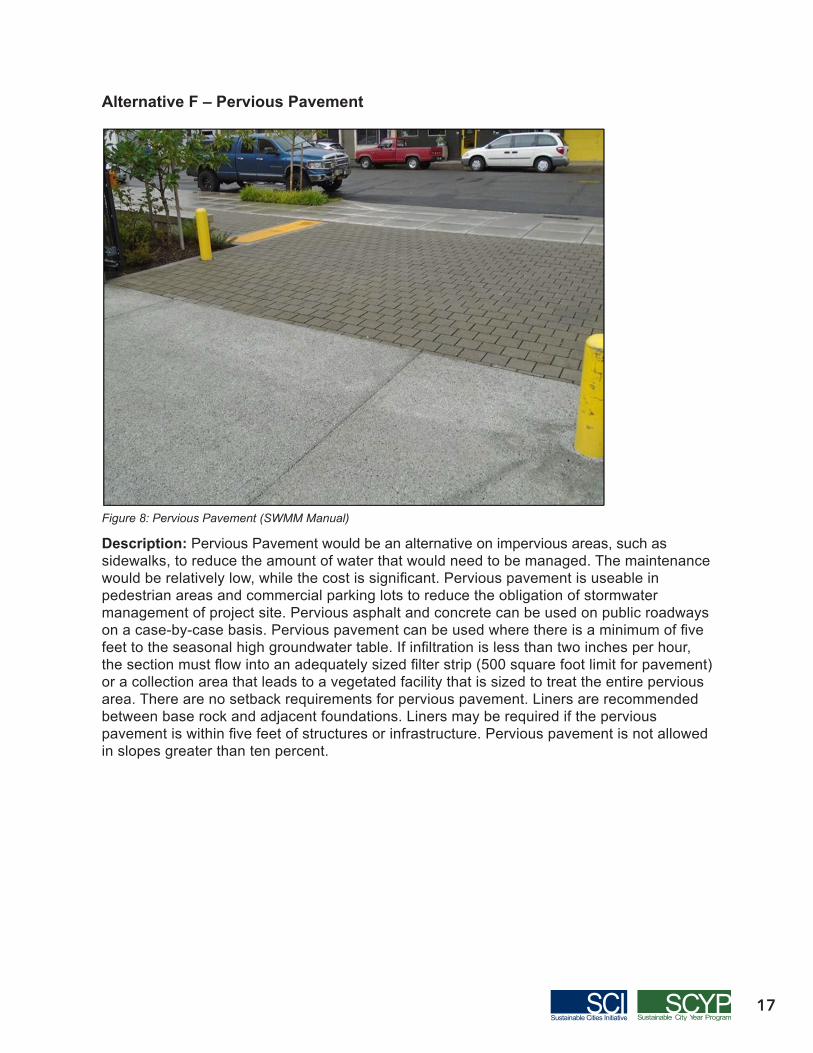
Description: Pervious Pavement would be an alternative on impervious areas, such as sidewalks, to reduce the amount of water that would need to be managed. The maintenance would be relatively low, while the cost is significant. Pervious pavement is useable in pedestrian areas and commercial parking lots to reduce the obligation of stormwater management of project site. Pervious asphalt and concrete can be used on public roadways on a case-by-case basis. Pervious pavement can be used where there is a minimum of five feet to the seasonal high groundwater table. If infiltration is less than two inches per hour, the section must flow into an adequately sized filter strip (500 square foot limit for pavement) or a collection area that leads to a vegetated facility that is sized to treat the entire pervious area. There are no setback requirements for pervious pavement. Liners are recommended between base rock and adjacent foundations. Liners may be required if the pervious pavement is within five feet of structures or infrastructure. Pervious pavement is not allowed in slopes greater than ten percent.
Figure 8: Pervious Pavement (SWMM Manual)
Alternative F – Pervious Pavement
18
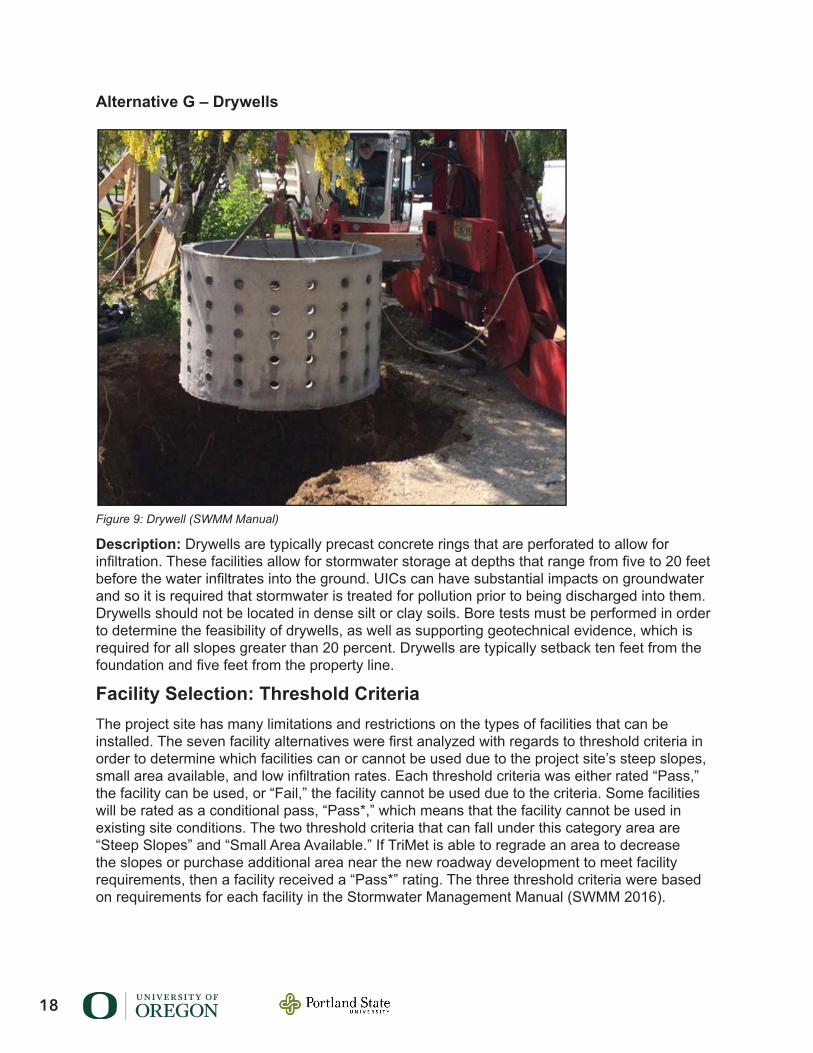
Description: Drywells are typically precast concrete rings that are perforated to allow for infiltration. These facilities allow for stormwater storage at depths that range from five to 20 feet before the water infiltrates into the ground. UICs can have substantial impacts on groundwater and so it is required that stormwater is treated for pollution prior to being discharged into them. Drywells should not be located in dense silt or clay soils. Bore tests must be performed in order to determine the feasibility of drywells, as well as supporting geotechnical evidence, which is required for all slopes greater than 20 percent. Drywells are typically setback ten feet from the foundation and five feet from the property line.
Facility Selection: Threshold CriteriaThe project site has many limitations and restrictions on the types of facilities that can be installed. The seven facility alternatives were first analyzed with regards to threshold criteria in order to determine which facilities can or cannot be used due to the project site’s steep slopes, small area available, and low infiltration rates. Each threshold criteria was either rated “Pass,” the facility can be used, or “Fail,” the facility cannot be used due to the criteria. Some facilities will be rated as a conditional pass, “Pass*,” which means that the facility cannot be used in existing site conditions. The two threshold criteria that can fall under this category area are “Steep Slopes” and “Small Area Available.” If TriMet is able to regrade an area to decrease the slopes or purchase additional area near the new roadway development to meet facility requirements, then a facility received a “Pass*” rating. The three threshold criteria were based on requirements for each facility in the Stormwater Management Manual (SWMM 2016).
Figure 9: Drywell (SWMM Manual)
Alternative G – Drywells
19Sustainable Cities Initiative
Steep Slopes
The ground slopes in the surrounding site area are greater than ten percent on average, and the road slopes range between one percent to three percent. Setbacks for slopes limit the types of facilities that can be installed. If a stormwater facility is needed in an area that has steeper slopes than the criteria for the stormwater facility allows, TriMet could regrade the area as needed in order to meet the requirements.
Small Area Available
Determining what type of facility can be installed depends on how much area is available and what of that area is available. The threshold criteria for “small area available” means the area is readily available for facility installment. The readily available area for installing facilities on Barbur Boulevard is limited to the planting strip between the sidewalk and roadway on either side of the boulevard. Thus, planters are the only facility that can be installed in the planting strip, but they have a 30-inch minimum width requirement. Since the planting strip is only 24 inches wide, the assumption is made for this project that TriMet would apply and be granted a land use design exception to install planters with a width of 24 inches. The area that is not readily available refers to possible locations near Barbur Boulevard where buildings would theoretically be removed to make room for the light rail line. Detention is required for stormwater management, and if needed, TriMet could acquire additional land in order to comply with the quantity and detention requirements. If additional area is needed for facilities, this will be identified in the facility design portion of the report.
Low Infiltration Rates
According to PortlandMaps, the soil class at the project site is Class C (PortlandMaps, 2018). Class C soils are defined by the NRCS as soils having a slow infiltration rate and a moderately high runoff potential when thoroughly wet (NRCS, 2007). Group C soils typically have between 20% to 40% clay. In order to determine the actual infiltration rates of the site, infiltration testing must be completed using one of three methods outlined in the SWMM manual. Due to time and resources, local infiltration testing was not performed and so an assumed value of 0.5 inches per hour was chosen for the native soil infiltration rate. The value is the average of four infiltration tests that were done in 2009 for Fred Meyer’s expansion on Barbur Boulevard (Abbott Construction, 2011). While this value may not be the actual soil infiltration rates of the project site, Class C does indicate low infiltration rates. The assumed rate of 0.5 inches per hour will be the assumed value for infiltration and will be used for any calculations in this report. However, TriMet is encouraged to commission a full infiltration testing prior to choosing the final design.
Facility Considerations: Additional CriteriaIf multiple facilities were found to be suitable for the site through the threshold criteria, three additional criteria (cost, ease of maintenance, and aesthetics) were used to determine which facility to select for the project location. Each additional criterion will be ranked from 1 to 5, with 5 being the most ideal ranking for the criteria. A median score of 3 will indicate satisfactory, while 1 shows that the design does not satisfy the criteria at all. The additional criteria will also be weighted on a scale from 1 to 3, whereby the weight of 3 will indicate the most important criterion for this project. A Pugh Matrix was used to analyze each facility alternative and choose which facilities would work best for the site location. The following are descriptions of the three additional threshold criteria used to analyze the facilities.

20
Cost
The cost criterion will indicate all associated costs for the building and installation of each alternative. Cost was graded for the initial investment cost associated with the scope of the respective design. Furthermore, construction and materials associated with each potential facility were factored. A score of 1 indicates the most expensive options while a score of 5 indicates the least expensive option. A higher score given simply indicates a less expensive cost of building the facility.
MaintenanceThe maintenance criteria will indicate which maintenance would be associated with each alternative. Maintenance can include upkeep, replacement of plants, and growing medium as well as regularity of required maintenance. Maintenance criteria was graded from 1 to 5 with a score of 1 indicating regular maintenance (weekly) and how it would be associated with which time and what cost requirements. A score of 5 indicates relatively no annual maintenance requirement.
Aesthetics
The aesthetic of each alternative will be ranked to indicate how visually appealing the facility or structure would be. Aesthetic grades were assigned if proposed facilities would improve the aesthetic of the surrounding area. If a facility would greatly improve the appearance of its location, a score of 5 would be assigned. If the facility didn’t detract from the appearance of the location or add to its appearance, a score of 3 would be given. And, if a facility greatly degraded the appearance of the existing area, a grade of 1 would be assigned.
Pugh Matrix & ResultsThe following Pugh Matrix shows the threshold criteria used to determine facility feasibility as well as the additional criteria used to choose the preferred facility for the site.
Table 1 – Pugh Matrix
21Sustainable Cities Initiative
Swales were eliminated for this project based on the land availability. Swales are used to slow water so it can infiltrate or flow into an overflow, and not to store water. The only area that swales could be used would be next to the road for overflow into a pipe conveyance, which is not recommended. This stretch of the boulevard has two feet on each side and since swales have a much larger width requirement of eight feet they were eliminated as an alternative.Based on infiltration rates obtained from the Geotechnical Investigation from the Burlingame Fred Meyer by Abbott Construction (Abbott, 2011) adjacent to our project location, the infiltration rate was found too low to make drywells a viable alternative. Drywells require a minimum infiltration rate of two inches per hour and the geotechnical investigation found that the infiltration rate near our project location was less than 0.1 inches per hour. As a result, this alternative was eliminated from selection and is not recommended. The information gathered eliminated swales and drywells from consideration for the purposes of our project, however further geotechnical investigation could potentially reveal that they are viable alternatives should be existing conditions change. Basins and ponds both conditionally passed the slope and area threshold criteria. If an area is identified that TriMet can purchase to install these facilities and regrade the area as needed, then both of these facilities can be used for this project. Detention is required for stormwater management and since this project site has low infiltration rates, these facilities will need to be used for detention and storage. Planters, basins, ponds, vaults, and pervious pavement all passed the threshold criteria--indicating they are viable alternatives. The viable options were then comparatively graded in the Pugh Matrix that scored them based on cost, maintenance, and aesthetic on a score from 1 to 5. A score of 5 indicates the most ideal and 1 was the least satisfactory for the respective criterion.
Cost
Planters were given a score of 3 for cost as they have an initial investment associated with their design and build. However, they are cheaper to build than the other facilities, since they can be built into the planter strip. They are made from poured concrete with cut curbs and have an overflow pipe and a perforated pipe below the growing medium that tie into the existing storm pipe infrastructure. Basins and ponds received a score of 2 for cost because they require excavation and grading. They also require overflow pipes and conveyance discharge facilities. Vaults received a score of 1 for cost because they are expensive to build. They are made of concrete and require substantial excavation. They are also very expensive to maintain due to limited accessibility. Pervious pavement was given a score of 2 because of the cost of installation and the upfront materials cost. Pervious pavement can be installed in discrete units or can be poured from a special cement mix, which results in added cost when compared to conventional concrete.
Maintenance
Planters, basins, and ponds were given a maintenance score of 4 because maintenance is minimal. Maintenance would be seasonal, with increased inspection during the wet parts of the year. Vaults received a score of 1 for maintenance because they require very regular maintenance. They require frequent inspection and cleaning or risk sediment backup. Any maintenance that is required on vaults is difficult due to limited accessibility after installation.
22
Pervious pavement earned a score of 3 because pervious pavement requires more regular inspection to make sure it is kept clean to allow infiltration. The pervious pavement would also function as pedestrian walkways. This would result in frequent sidewalk inspections to ensure safety because pervious pavement is susceptible to cracking and breaking, more so than conventional cement sidewalks. AestheticsPlanters, basins, and ponds were given a score of 5 for aesthetics as they improve the appearance versus a conventional sidewalk because they add plant variety and greenspace to an otherwise potentially bland paved area. Vaults and pervious pavement earned a score of 3 for aesthetics because they do not improve or detract from the appearance of a paved sidewalk.
Preferred AlternativeBased on the threshold criteria and the selection criteria in the Pugh matrix, the preferred alternatives are planters, basins, and ponds for stormwater facilities. ALBA’s Alternatives Analysis determined they are cheaper, require less maintenance, and are more aesthetically pleasing than the pervious pavement and vault alternatives. Planters should be used along the roadway in as much of the planter strip as possible. Likewise, basins and ponds will be used near the project site where land is identified for acquisition. Basins will be used for smaller areas and ponds will be used if larger areas area available. If basins and ponds can be installed at the project site, they are preferred over vaults because the cost of vaults is more expensive and, furthermore, difficult to maintain. However, vaults can be used if additional detention is required. The ponds and basins should be placed in a designated area in proximity of Stevens Creek in order to meet the flow requirement of stormwater from the SWC project. Once the design area is implemented, a pond or other detention facility will be necessary as facilities located along the roadway will not be able to meet flow requirements set by the city of Portland alone.Although the pervious pavement passed the threshold criteria, the pervious pavement does not seem to be as affective an alternative as the soil infiltration rates for the project area, and it has low infiltration rates. With infiltration rates lower than two inches per hour a filter strip or basin is required for sheet flow from impervious pavement. This makes the pervious pavement behave as impervious pavement, which negates any benefit. The cost and maintenance of this option simply outweighs any potential benefits.
Facility DesignALBA’s final consideration for the TriMet Southwest Light Rail stormwater design project consisted of several treatment facilities and a detention facilities. Locations and geometries of these treatment locations are presented and discussed below. Due to scope of work constraints for this project, conveyance sizing will not be addressed. Therefore, further analysis of the routing of water from the facilities to an existing or new conveyance system will need to be conducted.This section describes considered treatments along Barbur Boulevard. It is divided into sections for each treatment facility. Planters were chosen in the Pugh Matrix analysis as the preferred treatment facility. This section also describes the design of the detention facility for which a pond was chosen as the preferred alternative. The Santa Barbara Urban Hydrograph (SBUH) method was used to analyze the treatment and detention requirements as outlined in the BES Stormwater Management Manual (SWMM) and the Sewer and Drainage Facilities Design
23Sustainable Cities Initiative
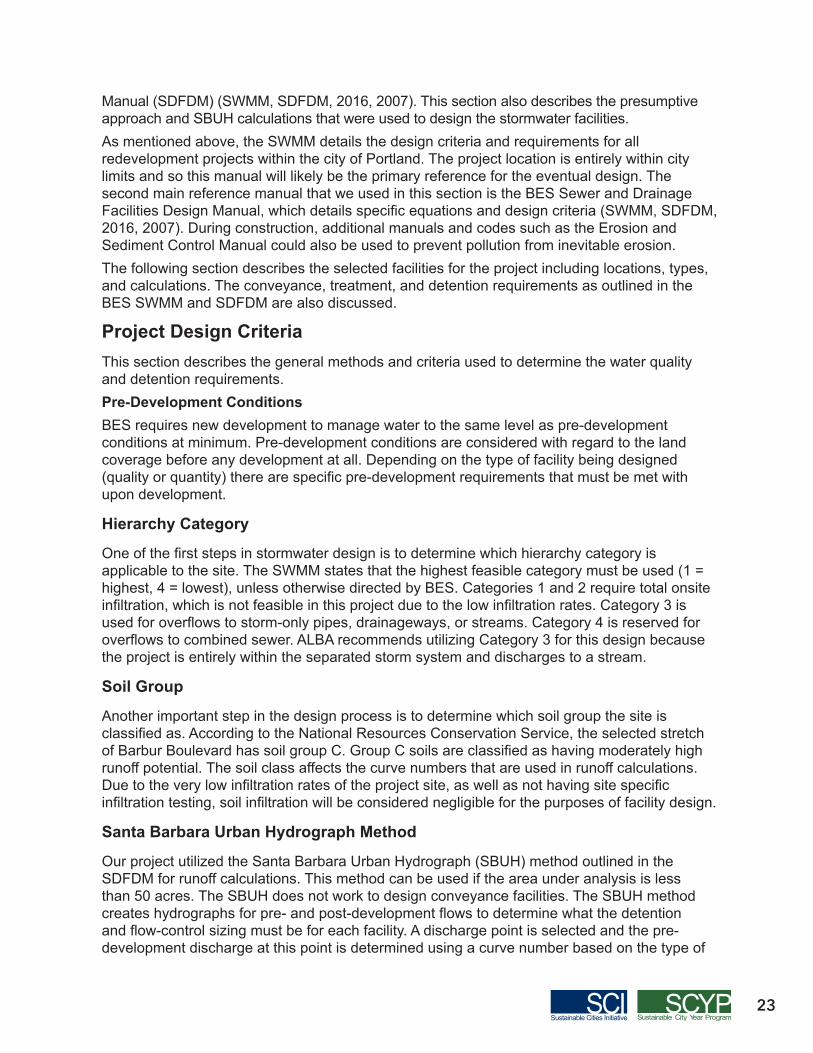
Manual (SDFDM) (SWMM, SDFDM, 2016, 2007). This section also describes the presumptive approach and SBUH calculations that were used to design the stormwater facilities.As mentioned above, the SWMM details the design criteria and requirements for all redevelopment projects within the city of Portland. The project location is entirely within city limits and so this manual will likely be the primary reference for the eventual design. The second main reference manual that we used in this section is the BES Sewer and Drainage Facilities Design Manual, which details specific equations and design criteria (SWMM, SDFDM, 2016, 2007). During construction, additional manuals and codes such as the Erosion and Sediment Control Manual could also be used to prevent pollution from inevitable erosion.The following section describes the selected facilities for the project including locations, types, and calculations. The conveyance, treatment, and detention requirements as outlined in the BES SWMM and SDFDM are also discussed.
Project Design CriteriaThis section describes the general methods and criteria used to determine the water quality and detention requirements. Pre-Development ConditionsBES requires new development to manage water to the same level as pre-development conditions at minimum. Pre-development conditions are considered with regard to the land coverage before any development at all. Depending on the type of facility being designed (quality or quantity) there are specific pre-development requirements that must be met with upon development.
Hierarchy Category
One of the first steps in stormwater design is to determine which hierarchy category is applicable to the site. The SWMM states that the highest feasible category must be used (1 = highest, 4 = lowest), unless otherwise directed by BES. Categories 1 and 2 require total onsite infiltration, which is not feasible in this project due to the low infiltration rates. Category 3 is used for overflows to storm-only pipes, drainageways, or streams. Category 4 is reserved for overflows to combined sewer. ALBA recommends utilizing Category 3 for this design because the project is entirely within the separated storm system and discharges to a stream.
Soil Group
Another important step in the design process is to determine which soil group the site is classified as. According to the National Resources Conservation Service, the selected stretch of Barbur Boulevard has soil group C. Group C soils are classified as having moderately high runoff potential. The soil class affects the curve numbers that are used in runoff calculations. Due to the very low infiltration rates of the project site, as well as not having site specific infiltration testing, soil infiltration will be considered negligible for the purposes of facility design.
Santa Barbara Urban Hydrograph Method
Our project utilized the Santa Barbara Urban Hydrograph (SBUH) method outlined in the SDFDM for runoff calculations. This method can be used if the area under analysis is less than 50 acres. The SBUH does not work to design conveyance facilities. The SBUH method creates hydrographs for pre- and post-development flows to determine what the detention and flow-control sizing must be for each facility. A discharge point is selected and the pre-development discharge at this point is determined using a curve number based on the type of
24
land coverage and soil class. The pre-development curve number is based on only vegetated land cover, which, in the case of the project location, was chosen as a wooded area. The post-development flow to the same point is determined using a new curve number, which will include impervious areas as well as pervious areas depending on the site. The discharge to the point of interest is found by using a time to concentration at that point. This is the travel time from the point-of-interest to the most remote point of the tributary area. The time of concentration used in calculations cannot be less than 5 minutes. The SBUH method also uses a SCS Type 1A rainfall distribution along with a total of 24-hour storm rainfall depths for each design storm (2-year, 5-year, etc.) to compute a final hydrograph volume and peak flow rate. This information is provided in tables in Appendix D. The online Presumptive Approach Calculator (PAC) calculator created hydrographs automatically for the planter design. The pond hydrographs were created using excel formulas consistent with the equations provided in the SDFDM. The calculations used in creating the SBUH are shown in Appendix D as well as associated hydrographs in Appendix G, which are based on the pre-development and post-development stormwater design guidelines of the detention facility.
Facility Details and RequirementsThis section describes the treatment, detention, and conveyance requirements as outlined in the BES Stormwater Management Manual for each facility.
Water Quality Treatment
The area of water to be treated for water quality is the newly developed area of Barbur Boulevard as well as approximately ten feet of easement on either side of the roadway. Additional water that sheet flows onto the boulevard from areas outside of this treatment area is not considered in this design calculation. Water is not required to be treated for the SWC project and so will be considered as pass-through. Furthermore, during peak flows, this water will be considered as pass-through flow and travel into the overflow devices of the facilities. The conveyance pipes will have to be sized to handle the pass-through flow.The options ALBA considered required runoff treatment from all of the impervious development. This area was calculated from the total width of the new road section. An assumption was made for this project that the track will be ballasted throughout the length of the road segment, except for intersections. The ballasted area is treated as pervious and will be subtracted from the impervious area for this segment. Due to low infiltration rates, this area will not be able to infiltrate fully in the ballasted section. Also, it is assumed that any additional runoff from the ballasted area will be collected in an under-drain below the ballast, which will connect, to the storm conveyance system. The following section outlines the area available for planters along the chosen stretch of Barbur Boulevard. The option proffered by ALBA is to place planters in as many locations adjacent to the boulevard as possible in order to treat and detain as much water from the impervious area as possible. This will minimize the amount of treatment required by the ponds prior to discharge to Stevens Creek.
Quality Requirements
Water quality facilities in hierarchy category 3 are required to achieve 70 percent total suspended solids (TSS) removal from 90 percent of the average annual runoff. The design storm for pollution requirement is 0.83 inches of rainfall over 24 hours using the National

25Sustainable Cities Initiative
Resources Conservation Service (NRCS) (SCS) Type 1A rainfall distribution (SWMM, 2016). This information is used with the SBUH method to size the facility to meet annual pollution reduction.
Facility Design
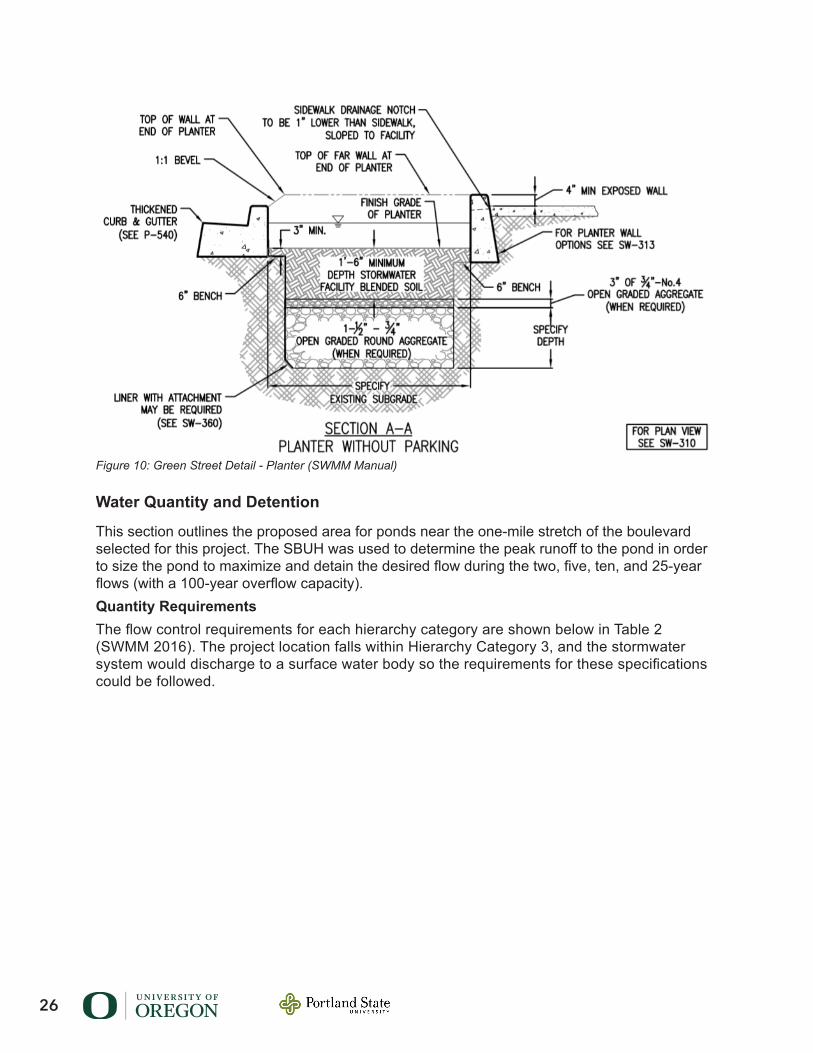
The PAC on the city of Portland website (BES, 2018) was used for a preliminary planter design. This approach utilizes the Santa Barbara Urban Hydrograph (SBUH) method. The impervious area of the new roadway was divided into subcatchments for each planter section to treat. One planter was chosen for which to run the PAC calculations, and this planter design is to be used as a template for the other planters in this road section. The chosen planter location and subcatchment are shown in Appendix C with associated typical details. The PAC calculations are shown in Appendix F. Infiltration was not done for this project so the values found in the Fred Meyer report were used for the PAC calculator with an average value of 0.5 inches per hour. The open pit falling head test was selected as the infiltration testing procedure to match how the Fred Meyer test was performed. The curve numbers that were chosen for the calculator were 70 for the pre-development wooded area and 98 for the post-development impervious roadway. The recommended facility configuration for the planter is flat-bottomed with rock storage with an underdrain. The bottom width for all planters will be two feet, which is the maximum space available to use for the planters in the TriMet road design of Barbur Boulevard. While the SWMM requires two-and-a-half-foot minimum width for planters in the right-of-way, it is assumed for this project that TriMet will apply and be granted an exception. The default values of 12 inches of rock storage depth and 0.3 rock porosity were used in the PAC. The rock storage depth below the underdrain assumes six inches. And, the storage depth above the growing medium assumes six inches if the growing medium depth was kept at the default of 18 inches.The results from the PAC calculator showed that the pollution reduction would pass the requirements, but the flow control would fail. The results also revealed that only 19% of the surface capacity would be used in the planter (Appendix F). From these results, it is likely that pollution reduction for the entire project site could be met by lining Barbur Boulevard with planters in the locations shown in the drawing set in Appendix C. The below image shows the typical cross-section of a planter from the SWMM manual (SWMM, 2018).Plant selection for the planters should be completed in compliance with the SWMM and the provided template in Appendix C.
26
Water Quantity and Detention
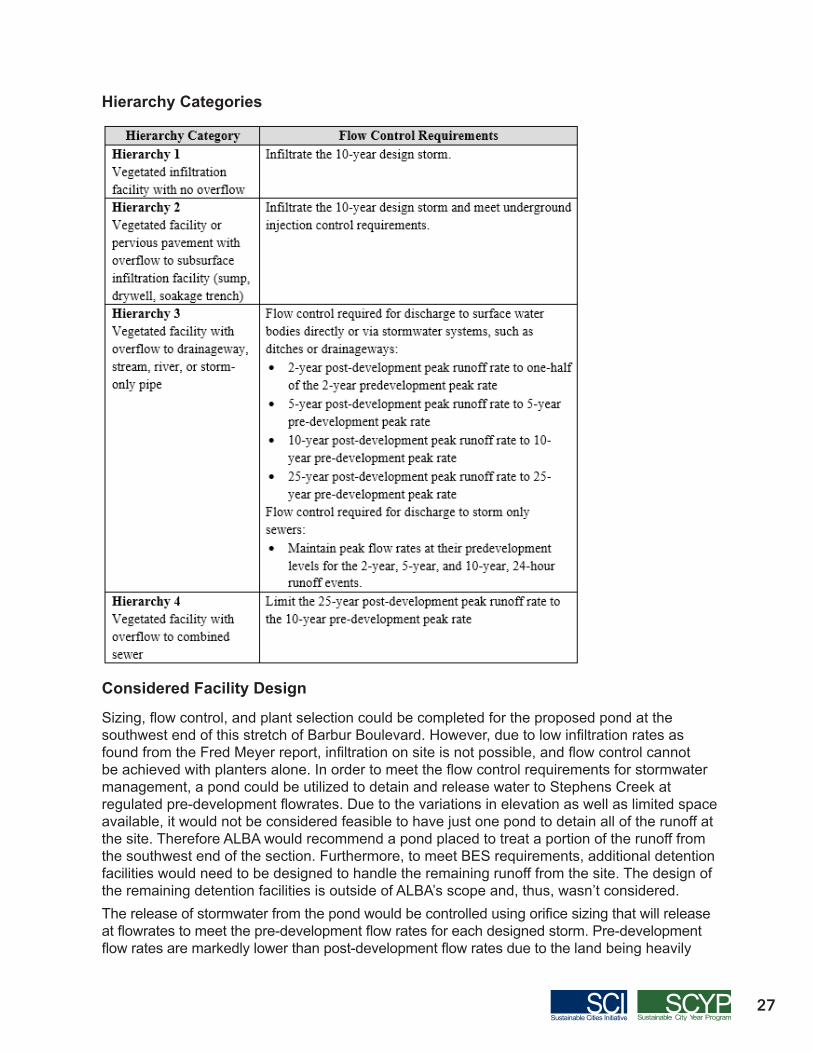
This section outlines the proposed area for ponds near the one-mile stretch of the boulevard selected for this project. The SBUH was used to determine the peak runoff to the pond in order to size the pond to maximize and detain the desired flow during the two, five, ten, and 25-year flows (with a 100-year overflow capacity). Quantity RequirementsThe flow control requirements for each hierarchy category are shown below in Table 2 (SWMM 2016). The project location falls within Hierarchy Category 3, and the stormwater system would discharge to a surface water body so the requirements for these specifications could be followed.
Figure 10: Green Street Detail - Planter (SWMM Manual)
27Sustainable Cities Initiative
Hierarchy Categories
Considered Facility Design
Sizing, flow control, and plant selection could be completed for the proposed pond at the southwest end of this stretch of Barbur Boulevard. However, due to low infiltration rates as found from the Fred Meyer report, infiltration on site is not possible, and flow control cannot be achieved with planters alone. In order to meet the flow control requirements for stormwater management, a pond could be utilized to detain and release water to Stephens Creek at regulated pre-development flowrates. Due to the variations in elevation as well as limited space available, it would not be considered feasible to have just one pond to detain all of the runoff at the site. Therefore ALBA would recommend a pond placed to treat a portion of the runoff from the southwest end of the section. Furthermore, to meet BES requirements, additional detention facilities would need to be designed to handle the remaining runoff from the site. The design of the remaining detention facilities is outside of ALBA’s scope and, thus, wasn’t considered.The release of stormwater from the pond would be controlled using orifice sizing that will release at flowrates to meet the pre-development flow rates for each designed storm. Pre-development flow rates are markedly lower than post-development flow rates due to the land being heavily
28
vegetated and forested prior to development. The difference of the land cover type is represented by the difference in curve numbers employed in the presumptive approach (i.e. pre-development is 70 for a wooded area, post-development is 98 for impervious surfaces). To find pre- and post-development flow velocity, Manning’s equation was employed using Manning’s coefficients of 0.6 for pre-development sheet flow (wooded area), 0.05 for pre-development shallow concentrated flow (wooded area), and 0.013 for post-development flows (smooth road surfaces and gravity conduits) (SDFDM, 2007). Slopes were obtained from topographic maps, and the velocities were used to find time of concentration (Tc). Appendix C shows the calculations used to find the flows and times of concentration for the pond and Appendix G were associated with hydrographs for each design storm.Potential locations for detention ponds have been identified. Current lots that will be encroached as a result of development along the boulevard were targeted as possible locations for detention ponds. Another factor that was considered was elevation, and locations at low points where they can collect water from surrounding roadway at higher elevations were selected. Using lots that will be intersected by the new development along with lots that were at lower elevation that surrounding road ways resulted in three potential locations, as shown in Appendix C. The location of the pond that was designed for this project is located in the southeastern portion of the road segment. The area for the pond was chosen because it is likely that the buildings on the existing adjacent lots would need to be removed since the new road development will expand into them. This assumption was made based on the alignment option that was analyzed in ALBA’s capstone class.A conservative estimate of the required storage volume was calculated by taking the difference in total volumes of the pre- and post-development 25-year design storm. The area selected for the pond will be sufficient based on this volume. Hydraulic modeling software could indicate that the proposed volume is larger than needed, which could potentially result in an eventual reduction in pond size.From SWMM regulations, ALBA considered the design for a detention pond, which would be placed at the boundaries of the facility at least 20 feet from any adjacent property lines. Additionally, the side slope of the pond must be 4:1, meaning for every one foot of depth there are four feet of horizontal distance (see Appendix C for pond shape and detail). Finally, detention ponds are required to have a maximum depth of four feet. As part of ALBA’s considerations, a dry pond was selected that does not have permanent water storage, as opposed to a wet pond that would have water at all times. A wet pond was not selected because of the difficulty in growing plants as well as the nuisance caused by increase in mosquitoes and other pests. In order to meet these design requirements, the pond was set 20 feet from the property lines of the allotted area, and detention volumes were calculated for the two, five, ten, and 25-year 24-hour storm events. Based on these volumes, as well as the area of the pond, the required depth was found to be 3.5 ft, with a total volume of 18,756 ft. The minimum depth meets the required constraint of four feet and the area fits within the chosen lot. Therefore, the pond is adequately sized.To meet flow control regulations, three orifices could be placed in a manhole downstream of the detention pond to control discharge flow rates. The three orifices are sized to discharge stormwater at predevelopment flow rates for half of a two-year 24-hour design storm; a ten-year 24-hour design storm; and a 25-year 24-hour design storm. The predevelopment flow rate for the five-year design storm could be achieved by the additional hydraulic head above the two-year orifice. Each orifice could be placed based on the height of the water level each design storm reaches in the detention pond.Upon preliminary analysis, orifices could overlap for the ten and 25-year 24-hour design storm.
29Sustainable Cities Initiative
This is due to the small difference in storage volume between the two design storms. Due to scope of work constraints, the orifice design was not considered. More calculations would need to be done to properly design the orifice locations and size. Orifice sizing and required volume storage calculations can be found in Appendix D. ALBA assumes the plant selection would be consistent with the SWMM and the provided template, found in Appendix C.
ConveyanceConveyance Requirements
Conveyance facilities in hierarchy category 3 are required to have the capacity to convey flows from the 25-year design storm from all contributing upstream drainage areas. The rational method can be used to size the conveyance facilities.
Facility Design
Due scope of work constraints, pipe sizing was not addressed. Additional information is needed regarding pipe slopes and inverse elevations of existing pipes. ALBA recommends the conveyance pipes are sized to convey all upstream runoff as well as Barbur Boulevard runoff. While the planters do not need to treat the pass-through flow, this flow would have to be considered for the final conveyance facility design, as the pipes will need to be sized to handle all incoming flows regardless of origin. Separate conveyance pipes will be placed from all the planters to the pond in order to treat runoff from the boulevard in the pond. Underdrain pipes that convey the runoff from below the ballast would also connect to the conveyance and add to the flow that the conveyance pipes will need to handle. It is likely that the current conveyance system would be adequate for new development on Barbur Boulevard since the facility designs would implement more flow control than is currently being employed, which would reduce peak flows. The new roadway would increase the width of Barbur Boulevard, which would reduce current pervious area, but if the new road includes planters, pervious area would increase. A preliminary analysis of the net difference in impervious area appears to be small, and so it is likely that current conveyance pipes would be able to support the separate storm sewer requirements of the new development. Manholes would also need to be installed every 500 feet, unless BES provides approval for alternate spacing, for maintenance and access to pipes.
Outfall
After detention requirements are met on Barbur Boulevard, the stormwater should be sent to Stephen’s Creek at pre-development levels in existing pipes that are sent to the creek.
Construction Cost and ScheduleThe cost estimate includes all proposed planters along the length of Barbur Boulevard and one pond as detailed in the drawings. The cost estimate also includes conveyance piping between planters and ponds and between the pond and existing conveyance. All the costs were estimated using the Portland Bureau of Transportation’s (PBOT) estimating template for projects greater than one million dollars (PBOT, 2018) The planter cost was estimated using information from TriMet. The total estimated cost of the stormwater facilities is $2,322,585 Million. See Appendix A for Construction Cost Estimate.The construction schedule includes only the construction of the stormwater facilities for the one-mile section of Barbur Boulevard. For the purposes of the construction schedule, the stormwater design is treated as a standalone project from the larger SWC project. The total estimated construction time is approximately six months. See Appendix B for Construction Schedule.
30
Regulatory Compliance and PermittingALBA Consulting is currently working with TriMet, but there are other agencies that have investments in this project as well as permit requirements. The three regulatory compliance agencies as well as the required permits that are relevant to this project are:
Portland Bureau of Transportation (PBOT)The road will be transferred from ODOT to PBOT and will be designed to city standards. PBOT has broad code authority over public improvements in the public right-of-way. PBOT is responsible for maintaining storm drains, sewer pipes, and streets.
Department Of Environmental Quality (DEQ)DEQ regulates environmental quality and pollution control. 1200-C National Pollutant Discharge Elimination System (NPDES)Stormwater Discharge Permit
DEQ would be consulted for regulation of point and non-point source dischargers, effluent limits, and required best management practices to remove pollutants from discharges. And, a permit is required for construction activities that may discharge to surface waters or conveyance systems leading to surface waters. This permit applies for areas greater than one area of which clearing, grading, or excavation will occur. These criteria applies to the stormwater facilities being developed for this project.
Bureau Of Development Services (BDS)BDS oversees the building and development codes within the city of Portland.
31Sustainable Cities Initiative
Building Permit
Site development permits are required for work such as clearing, grading, and groundwork. Clearing consists of cutting or removal of vegetation, which results in exposing any bare soil. Grading consists of earthwork, excavation, or filling in excess of ten cubic yards. All of these apply to the stormwater facilities being designed for this project.
Bureau Of Environmental Services (BES)BES regulates environmental quality and pollution control. BES oversees the Stormwater Management Manual, which is the primary source of regulations for stormwater design in Portland. This manual was used for the student design work of the facilities for this project. The mission of BES is to protect public health, water quality, and the environment. Some of BES’s federal regulations include the Clean Water Act, National Pollutant Discharge Elimination System, Total Maximum Daily Load, and Safe Drinking Water Act.
ConclusionIn order to meet the regulatory requirements of stormwater management for this portion of the Southwest Corridor Light Rail Transit (SWC) Project, ALBA Consulting considered the use of both pollution reduction planters and a detention pond. The water that falls on the newly developed Barbur Boulevard would flow into planters placed adjacent to the road on both sides of the boulevard. These planters would allow the project to meet water quality standards for storm runoff and would help slowpeak flows by storing some storm runoff within the rock storage layer below the planter. The majority of the flow control would be achieved through the use of a detention pond designed to detain the 25-year storm with overflow for the 100-year storm event, which would subsequently discharge the stormwater at pre-development flow rates to meet environmental regulations. The pond could contribute to pollution reduction through settling of particulates using an underdrain with a compost layer above it to filter water prior to discharge. By keeping all facility designs as surface facilities rather than underground options, the construction and maintenance costs could be greatly reduced. To increase the community value, the pond and all planters could be planted to contribute to overall greenspace and neighborhood aesthetic.ALBA considerations were selected not only for performance but also for ease and cost of maintenance, in addition to aesthetic appeal. This design report is intended to be a preliminary analysis/design package of student considerations as part of a Capstone exercise focused on TriMet’s SWC project. The location of the pond was done based on preliminary analysis of our site and potential locations that would become available during the routine acquisition process of the land for this project. Due to the fact that the area of this project has significant slopes, which provides difficulties in choosing a location for a detention facility, ALBA did not determine a specific alignment choice for the SWC project, and rather used the example of one potential alignment. Based on our assumptions, the preliminary cost for this project would be an estimated $2.3 Million and the estimated time to complete the project is approximately six months.To progress the project to the next steps, ALBA acknowledged that various agencies would be consulted on the final design. A geotechnical engineering consultant could be brought in to conduct infiltration testing and to test for slope stability in the potential detention pond locations. With more accurate infiltration rates, more accurate runoff rates can be calculated, and the number of planters needed may be reduced. If that is the case, our current design can still be used to attain a pollution reduction credit for other parts of the SWC project. Furthermore, City Planners could make sure that the location of the stormwater facilities are acceptable.
32
And, regulating agencies like BES, DEQ, and ODOT could be consulted throughout the design and implementation process to ensure regulatory requirements are met. Hypothetically, once the project met final design standard, a landscape architect could be brought in to assist with everything from plant selection to the detention pond in order to meet compliance for planting standards in stormwater facilities.
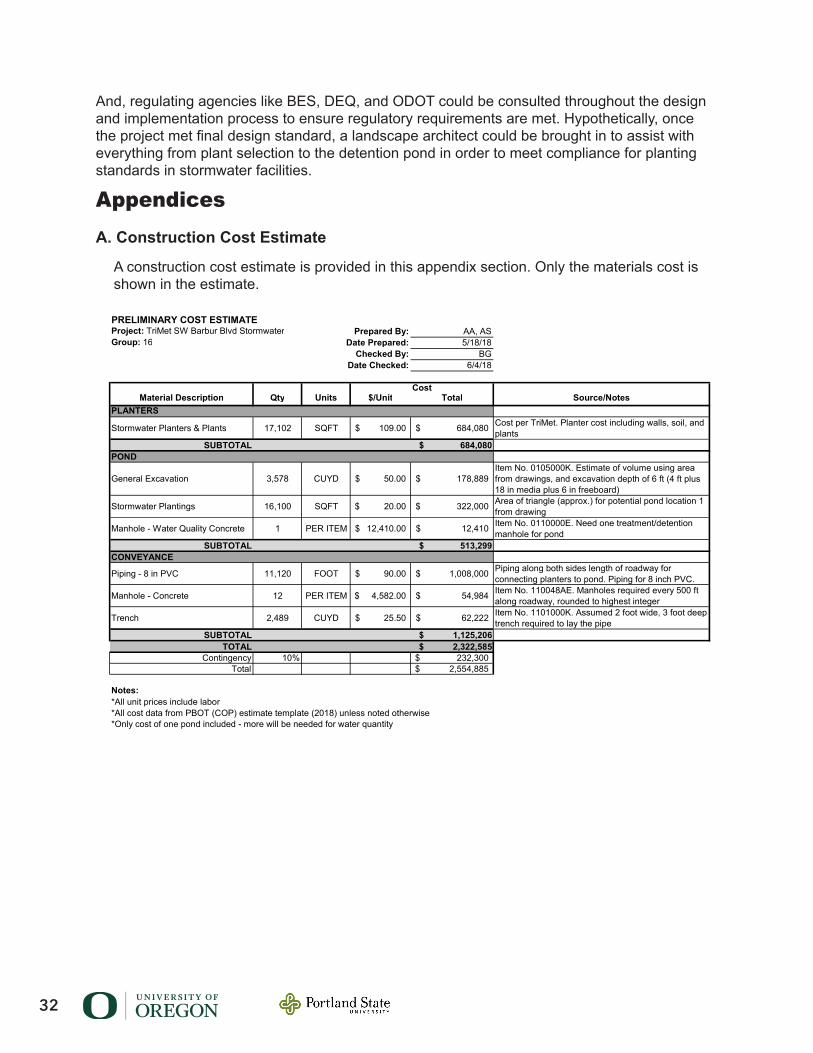
AppendicesA. Construction Cost Estimate
A construction cost estimate is provided in this appendix section. Only the materials cost is shown in the estimate.
PRELIMINARY COST ESTIMATEProject: TriMet SW Barbur Blvd Stormwater Prepared By: AA, ASGroup: 16 Date Prepared: 5/18/18
Checked By: BGDate Checked: 6/4/18
CostMaterial Description Qty Units $/Unit Total Source/Notes
PLANTERS
Stormwater Planters & Plants 17,102 SQFT 109.00$ 684,080$ Cost per TriMet. Planter cost including walls, soil, and plants
SUBTOTAL $ 684,080 POND
General Excavation 3,578 CUYD 50.00$ 178,889$ Item No. 0105000K. Estimate of volume using area from drawings, and excavation depth of 6 ft (4 ft plus 18 in media plus 6 in freeboard)
Stormwater Plantings 16,100 SQFT 20.00$ 322,000$ Area of triangle (approx.) for potential pond location 1 from drawing
Manhole - Water Quality Concrete 1 PER ITEM 12,410.00$ 12,410$ Item No. 0110000E. Need one treatment/detention manhole for pond
SUBTOTAL $ 513,299 CONVEYANCE
Piping - 8 in PVC 11,120 FOOT 90.00$ 1,008,000$ Piping along both sides length of roadway for connecting planters to pond. Piping for 8 inch PVC.
Manhole - Concrete 12 PER ITEM 4,582.00$ 54,984$ Item No. 110048AE. Manholes required every 500 ft along roadway, rounded to highest integer
Trench 2,489 CUYD 25.50$ 62,222$ Item No. 1101000K. Assumed 2 foot wide, 3 foot deep trench required to lay the pipe
SUBTOTAL $ 1,125,206 TOTAL $ 2,322,585
Contingency 10% 232,300$ Total 2,554,885$
Notes:*All unit prices include labor *All cost data from PBOT (COP) estimate template (2018) unless noted otherwise*Only cost of one pond included - more will be needed for water quantity
33Sustainable Cities Initiative
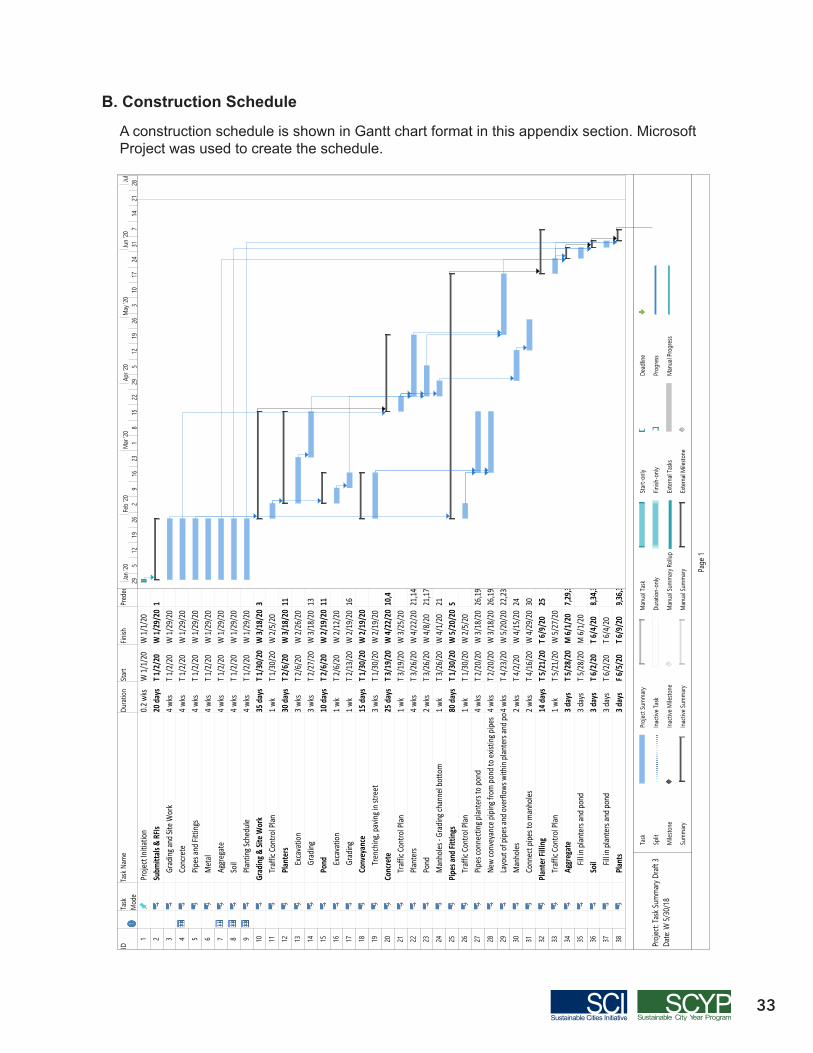
B. Construction Schedule
A construction schedule is shown in Gantt chart format in this appendix section. Microsoft Project was used to create the schedule.
IDTa
sk
Mod
eTa
sk N
ame
Durat
ionSt
artFin
ishPr
edec
esso
rs
1Pr
ojec
t Init
iation
0.2 w
ksW
1/1/
20W
1/1/
202
Subm
ittals
& R
FIs20
days
T 1/2
/20
W 1/
29/2
01
3Gr
ading
and S
ite W
ork
4 wks
T 1/2
/20
W 1/
29/2
04
Conc
rete
4 wks
T 1/2
/20
W 1/
29/2
05
Pipes
and F
itting
s4 w
ksT 1
/2/2
0W
1/29
/20
6M
etal
4 wks
T 1/2
/20
W 1/
29/2
07
Aggr
egat
e4 w
ksT 1
/2/2
0W
1/29
/20
8So
il4 w
ksT 1
/2/2
0W
1/29
/20
9Pla
nting
Sche
dule
4 wks
T 1/2
/20
W 1/
29/2
010
Grad
ing &
Site
Wor
k35
days
T 1/3
0/20
W 3/
18/2
03
11Tr
affic
Cont
rol P
lan1 w
kT 1
/30/
20W
2/5/
2012
Plan
ters
30 da
ysT 2
/6/2
0W
3/18
/20
1113
Exca
vatio
n3 w
ksT 2
/6/2
0W
2/26
/20
14Gr
ading
3 wks
T 2/2
7/20
W 3/
18/2
013
15Po
nd10
days
T 2/6
/20
W 2/
19/2
011
16Ex
cava
tion
1 wk
T 2/6
/20
W 2/
12/2
017
Grad
ing1 w
kT 2
/13/
20W
2/19
/20
1618
Conv
eyan
ce15
days
T 1/3
0/20
W 2/
19/2
019
Tren
ching
, pav
ing in
stre
et3 w
ksT 1
/30/
20W
2/19
/20
20Co
ncre
te25
days
T 3/1
9/20
W 4/
22/2
010
,421
Traf
fic Co
ntro
l Plan
1 wk
T 3/1
9/20
W 3/
25/2
022
Plant
ers
4 wks
T 3/2
6/20
W 4/
22/2
021
,1423
Pond
2 wks
T 3/2
6/20
W 4/
8/20
21,17
24M
anho
les - G
radin
g cha
nnel
botto
m1 w
kT 3
/26/
20W
4/1/
2021
25Pi
pes a
nd Fi
tting
s80
days
T 1/3
0/20
W 5/
20/2
05
26Tr
affic
Cont
rol P
lan1 w
kT 1
/30/
20W
2/5/
2027
Pipes
conn
ectin
g plan
ters
to po
nd4 w
ksT 2
/20/
20W
3/18
/20
26,19
28Ne
w co
nvey
ance
pipin
g fro
m po
nd to
exist
ing pi
pes
4 wks
T 2/2
0/20
W 3/
18/2
026
,1929
Layo
ut of
pipe
s and
over
flows
with
in pla
nter
s and
pond
s4 w
ksT 4
/23/
20W
5/20
/20
22,23
30M
anho
les2 w
ksT 4
/2/2
0W
4/15
/20
2431
Conn
ect p
ipes t
o man
holes
2 wks
T 4/1
6/20
W 4/
29/2
030
32Pl
ante
r Filli
ng14
days
T 5/2
1/20
T 6/9
/20
2533
Traf
fic Co
ntro
l Plan
1 wk
T 5/2
1/20
W 5/
27/2
034
Aggr
egat
e3 d
ays
T 5/2
8/20
M 6/
1/20
7,29
,33
35Fil
l in pl
ante
rs an
d pon
d3 d
ays
T 5/2
8/20
M 6/
1/20
36So
il3 d
ays
T 6/2
/20
T 6/4
/20
8,34
,33
37Fil
l in pl
ante
rs an
d pon
d3 d
ays
T 6/2
/20
T 6/4
/20
38Pl
ants
3 day
sF 6
/5/2
0T 6
/9/2
09,
36,3
3295
1219
262
916
231
815
2229
512
1926
310
1724
317
1421
28Ja
n '20
Feb '
20M
ar '20
Apr '2
0M
ay '2
0Ju
n '20
Jul '2
0
Task
Split
Mile
stone
Sum
mary
Proje
ct Su
mm
ary
Inacti
ve Ta
sk
Inacti
ve M
ilesto
ne
Inacti
ve Su
mm
ary
Man
ual T
ask
Dura
tion-
only
Man
ual S
umm
ary R
ollup
Man
ual S
umm
ary
Star
t-only
Finish
-only
Exte
rnal
Task
s
Exte
rnal
Mile
stone
Dead
line
Prog
ress
Man
ual P
rogr
ess
Page
1
Proje
ct: Ta
sk Su
mma
ry Dr
aft 3
Date
: W 5/
30/1
8
34
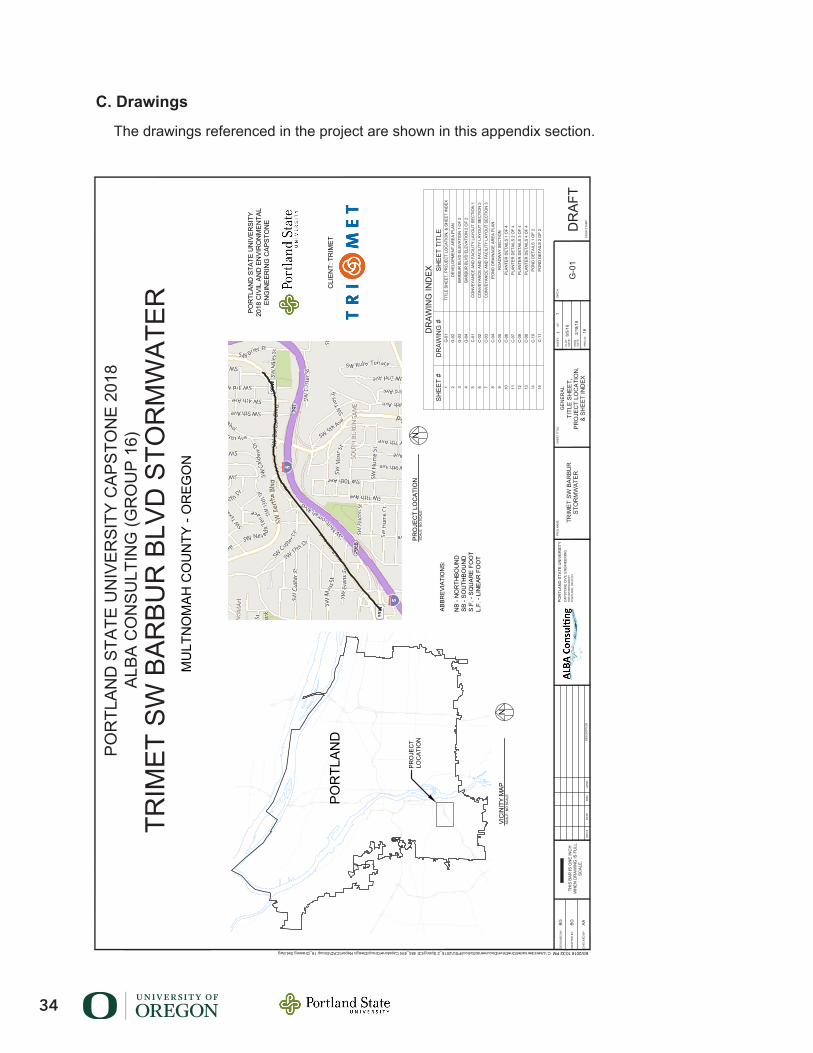
C. Drawings
The drawings referenced in the project are shown in this appendix section.
6/5/2018 10:32 PM C:\Users\bernadel\OneDrive\Documents\School\PSU\2018_2 Spring\CE 484_494 Capstone\Group\Design Report\CAD\Group 16_Drawing Set.dwg
THIS
BAR
IS O
NE
INC
HW
HEN
DR
AWIN
G IS
FU
LLSC
ALE.
CH
ECKE
D B
Y:
DES
IGN
ED B
Y:
DR
AFTE
D B
Y:
DES
CR
IPTI
ON
APPD
DAT
ER
EV #
DR
N
SHEE
T:
O
F:PR
OJ
NAM
E:
PRO
J #:
SHEE
T TI
TLE:
DAT
E:PL
OT
ENG
R S
TAM
P:
DW
G #
:
6/5/
18
DAT
E:D
WN
TRIM
ET S
W B
ARBU
RST
OR
MW
ATER
16
1BG BG AA
GEN
ERAL
TITL
E SH
EET,
PRO
JEC
T LO
CAT
ION
,&
SHEE
T IN
DEX
1 2/18
/18
G-0
1
POR
TLAN
D S
TATE
UN
IVER
SITY
CAP
STO
NE
CIV
IL E
NG
INEE
RIN
G18
25 S
W B
RO
ADW
AYPO
RTL
AND
, OR
972
01
DR
AFT
TRIM
ET S
W B
ARBU
R B
LVD
STO
RM
WAT
ER
POR
TLAN
D S
TATE
UN
IVER
SITY
CAP
STO
NE
2018
ALBA
CO
NSU
LTIN
G (G
RO
UP
16)
DR
AWIN
G IN
DEX
SHEE
T #
DR
AWIN
G #
SHEE
T TI
TLE
1G
-01
TITL
E SH
EET,
PR
OJE
CT
LOC
ATIO
N, &
SH
EET
IND
EX2
G-0
2D
EVEL
OPM
ENT
AREA
PLA
N3
G-0
3BA
RBU
R B
LVD
ELE
VATI
ON
1 O
F 2
4G
-04
BAR
BUR
BLV
D E
LEVA
TIO
N 2
OF
25
C-0
1C
ON
VEYA
NC
E AN
D F
ACIL
ITY
LAYO
UT
SEC
TIO
N 1
6C
-02
CO
NVE
YAN
CE
AND
FAC
ILIT
Y LA
YOU
T SE
CTI
ON
27
C-0
3C
ON
VEYA
NC
E AN
D F
ACIL
ITY
LAYO
UT
SEC
TIO
N 3
8C
-04
PON
D D
RAI
NAG
E AR
EA P
LAN
9C
-05
RO
ADW
AY S
ECTI
ON
10C
-06
PLAN
TER
DET
AILS
1 O
F 4
11C
-07
PLAN
TER
DET
AILS
2 O
F 4
12C
-08
PLAN
TER
DET
AILS
3 O
F 4
13C
-09
PLAN
TER
DET
AILS
4 O
F 4
14C
-10
PON
D D
ETAI
LS 1
OF
215
C-1
1PO
ND
DET
AILS
2 O
F 2
POR
TLAN
D
SCAL
E:VI
CIN
ITY
MAP
NO
SC
ALE
SCAL
E:PR
OJE
CT
LOC
ATIO
NN
O S
CAL
E
N
N
MU
LTN
OM
AH C
OU
NTY
- O
REG
ON
POR
TLAN
D S
TATE
UN
IVER
SITY
2018
CIV
IL A
ND
EN
VIR
ON
MEN
TAL
ENG
INEE
RIN
G C
APST
ON
E
CLI
ENT:
TR
IMET
PRO
JEC
TLO
CAT
ION
ABBR
EVIA
TIO
NS:
NB
- NO
RTH
BOU
ND
SB -
SOU
THBO
UN
DS.
F. -
SQU
ARE
FOO
TL.
F. -
LIN
EAR
FO
OT
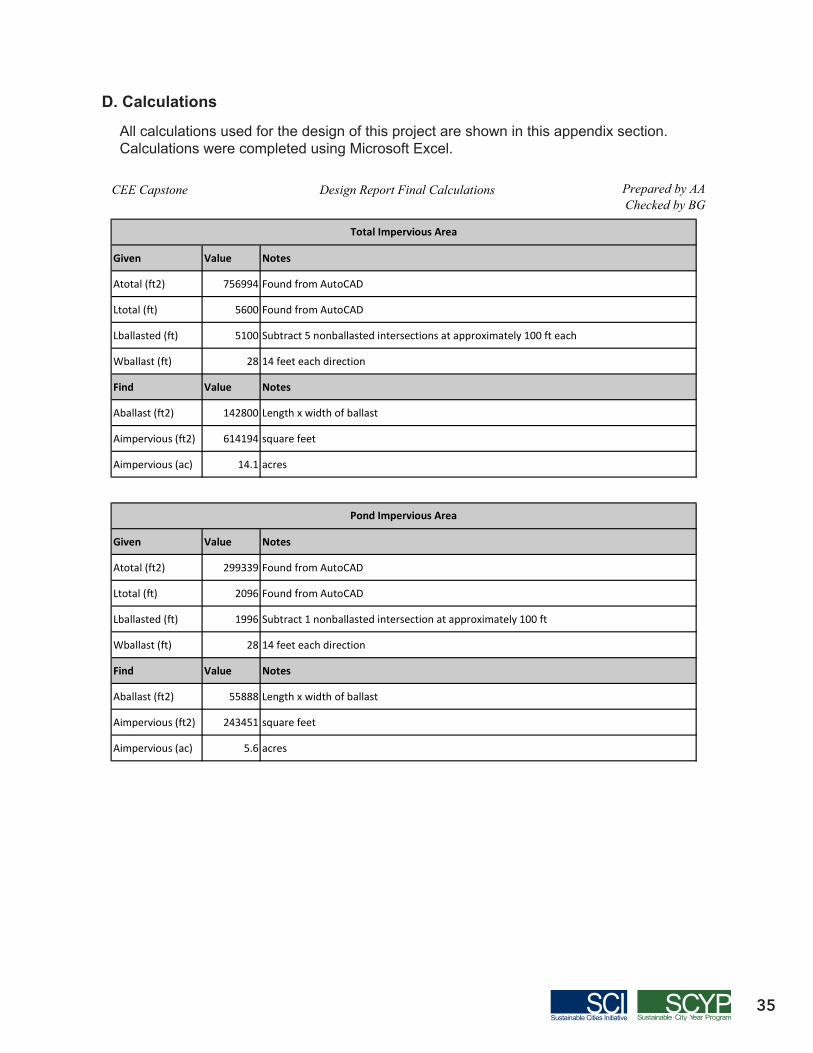
35Sustainable Cities Initiative
D. Calculations
All calculations used for the design of this project are shown in this appendix section. Calculations were completed using Microsoft Excel.
CEE Capstone Design Report Final Calculations Prepared by AAChecked by BG
Given Value Notes
Atotal (ft2) 756994 Found from AutoCAD
Ltotal (ft) 5600 Found from AutoCAD
Lballasted (ft) 5100 Subtract 5 nonballasted intersections at approximately 100 ft each
Wballast (ft) 28 14 feet each direction
Find Value Notes
Aballast (ft2) 142800 Length x width of ballast
Aimpervious (ft2) 614194 square feet
Aimpervious (ac) 14.1 acres
Given Value Notes
Atotal (ft2) 299339 Found from AutoCAD
Ltotal (ft) 2096 Found from AutoCAD
Lballasted (ft) 1996 Subtract 1 nonballasted intersection at approximately 100 ft
Wballast (ft) 28 14 feet each direction
Find Value Notes
Aballast (ft2) 55888 Length x width of ballast
Aimpervious (ft2) 243451 square feet
Aimpervious (ac) 5.6 acres
Total Impervious Area
Pond Impervious Area
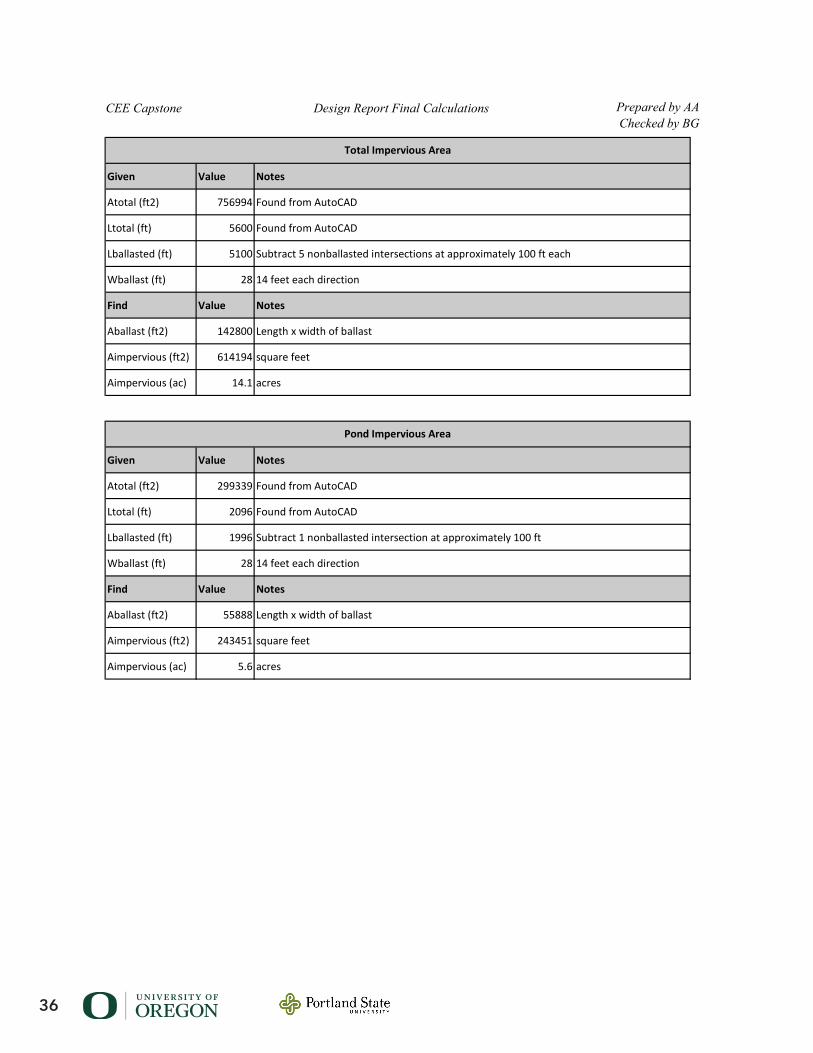
36
CEE Capstone Design Report Final Calculations Prepared by AAChecked by BG
Given Value Notes
Atotal (ft2) 756994 Found from AutoCAD
Ltotal (ft) 5600 Found from AutoCAD
Lballasted (ft) 5100 Subtract 5 nonballasted intersections at approximately 100 ft each
Wballast (ft) 28 14 feet each direction
Find Value Notes
Aballast (ft2) 142800 Length x width of ballast
Aimpervious (ft2) 614194 square feet
Aimpervious (ac) 14.1 acres
Given Value Notes
Atotal (ft2) 299339 Found from AutoCAD
Ltotal (ft) 2096 Found from AutoCAD
Lballasted (ft) 1996 Subtract 1 nonballasted intersection at approximately 100 ft
Wballast (ft) 28 14 feet each direction
Find Value Notes
Aballast (ft2) 55888 Length x width of ballast
Aimpervious (ft2) 243451 square feet
Aimpervious (ac) 5.6 acres
Total Impervious Area
Pond Impervious Area
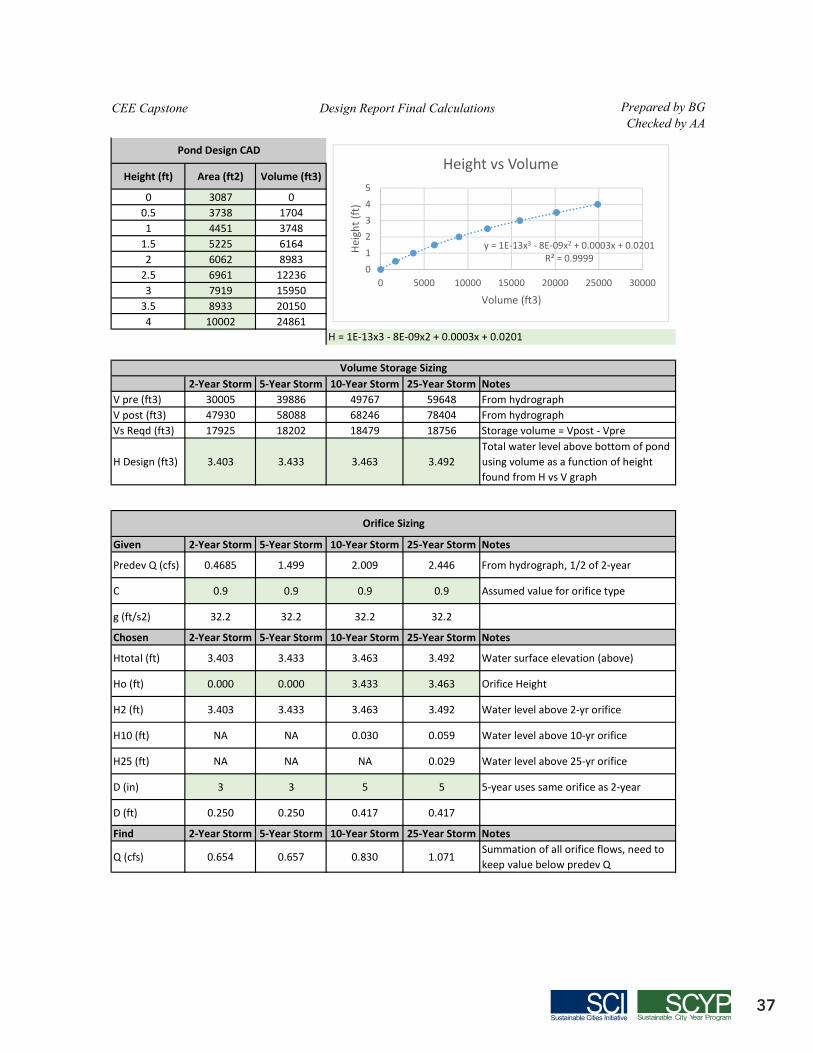
37Sustainable Cities Initiative
CEE Capstone Design Report Final Calculations Prepared by BGChecked by AA
Height (ft) Area (ft2) Volume (ft3)
0 3087 00.5 3738 17041 4451 3748
1.5 5225 61642 6062 8983
2.5 6961 122363 7919 15950
3.5 8933 201504 10002 24861
2-Year Storm 5-Year Storm 10-Year Storm 25-Year Storm NotesV pre (ft3) 30005 39886 49767 59648 From hydrograph V post (ft3) 47930 58088 68246 78404 From hydrographVs Reqd (ft3) 17925 18202 18479 18756 Storage volume = Vpost - Vpre
H Design (ft3) 3.403 3.433 3.463 3.492Total water level above bottom of pond using volume as a function of height found from H vs V graph
Given 2-Year Storm 5-Year Storm 10-Year Storm 25-Year Storm Notes
Predev Q (cfs) 0.4685 1.499 2.009 2.446 From hydrograph, 1/2 of 2-year
C 0.9 0.9 0.9 0.9 Assumed value for orifice type
g (ft/s2) 32.2 32.2 32.2 32.2
Chosen 2-Year Storm 5-Year Storm 10-Year Storm 25-Year Storm Notes
Htotal (ft) 3.403 3.433 3.463 3.492 Water surface elevation (above)
Ho (ft) 0.000 0.000 3.433 3.463 Orifice Height
H2 (ft) 3.403 3.433 3.463 3.492 Water level above 2-yr orifice
H10 (ft) NA NA 0.030 0.059 Water level above 10-yr orifice
H25 (ft) NA NA NA 0.029 Water level above 25-yr orifice
D (in) 3 3 5 5 5-year uses same orifice as 2-year
D (ft) 0.250 0.250 0.417 0.417
Find 2-Year Storm 5-Year Storm 10-Year Storm 25-Year Storm Notes
Q (cfs) 0.654 0.657 0.830 1.071Summation of all orifice flows, need to keep value below predev Q
Orifice Sizing
Volume Storage Sizing
Pond Design CAD
H = 1E-13x3 - 8E-09x2 + 0.0003x + 0.0201
y = 1E-13x3 - 8E-09x2 + 0.0003x + 0.0201R² = 0.9999
012345
0 5000 10000 15000 20000 25000 30000
Heig
ht (f
t)
Volume (ft3)
Height vs Volume
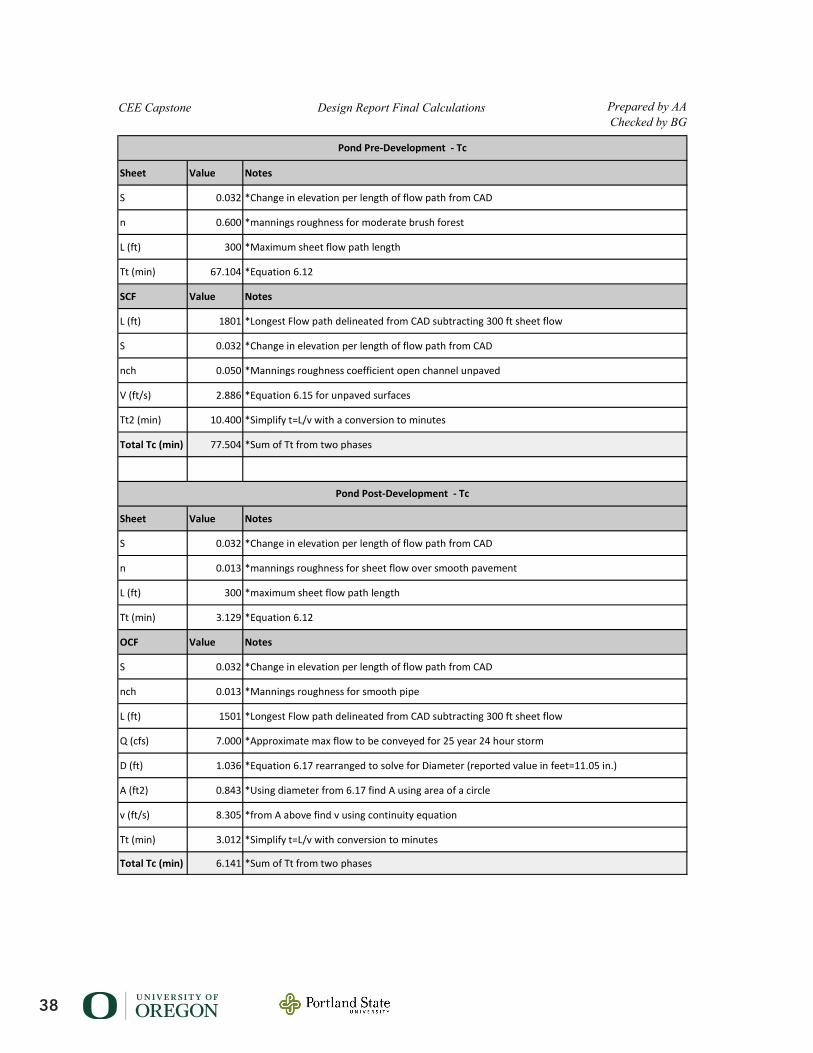
38
CEE Capstone Design Report Final Calculations Prepared by AAChecked by BG
Sheet Value Notes
S 0.032 *Change in elevation per length of flow path from CAD
n 0.600 *mannings roughness for moderate brush forest
L (ft) 300 *Maximum sheet flow path length
Tt (min) 67.104 *Equation 6.12
SCF Value Notes
L (ft) 1801 *Longest Flow path delineated from CAD subtracting 300 ft sheet flow
S 0.032 *Change in elevation per length of flow path from CAD
nch 0.050 *Mannings roughness coefficient open channel unpaved
V (ft/s) 2.886 *Equation 6.15 for unpaved surfaces
Tt2 (min) 10.400 *Simplify t=L/v with a conversion to minutes
Total Tc (min) 77.504 *Sum of Tt from two phases
Sheet Value Notes
S 0.032 *Change in elevation per length of flow path from CAD
n 0.013 *mannings roughness for sheet flow over smooth pavement
L (ft) 300 *maximum sheet flow path length
Tt (min) 3.129 *Equation 6.12
OCF Value Notes
S 0.032 *Change in elevation per length of flow path from CAD
nch 0.013 *Mannings roughness for smooth pipe
L (ft) 1501 *Longest Flow path delineated from CAD subtracting 300 ft sheet flow
Q (cfs) 7.000 *Approximate max flow to be conveyed for 25 year 24 hour storm
D (ft) 1.036 *Equation 6.17 rearranged to solve for Diameter (reported value in feet=11.05 in.)
A (ft2) 0.843 *Using diameter from 6.17 find A using area of a circle
v (ft/s) 8.305 *from A above find v using continuity equation
Tt (min) 3.012 *Simplify t=L/v with conversion to minutes
Total Tc (min) 6.141 *Sum of Tt from two phases
Pond Pre-Development - Tc
Pond Post-Development - Tc
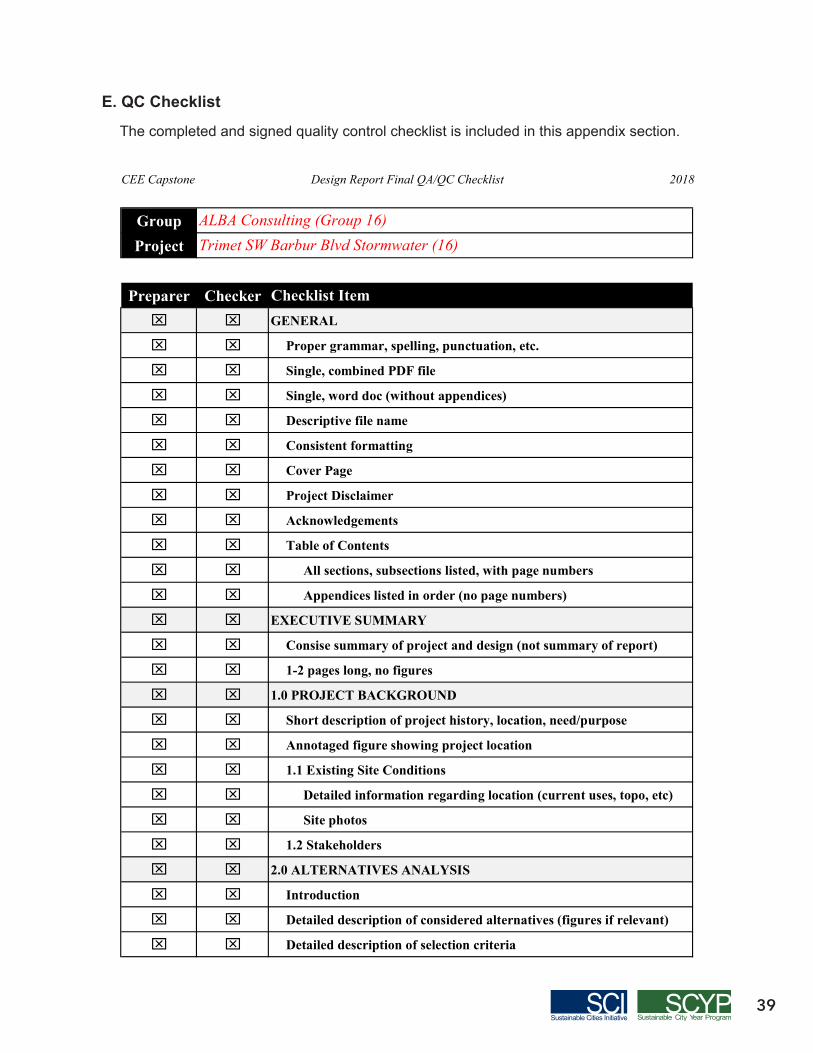
39Sustainable Cities Initiative
E. QC Checklist
The completed and signed quality control checklist is included in this appendix section.
CEE Capstone Design Report Final QA/QC Checklist 2018
GroupProject
Preparer Checkerx x GENERAL
x x Proper grammar, spelling, punctuation, etc.
x x Single, combined PDF file
x x Single, word doc (without appendices)
x x Descriptive file name
x x Consistent formatting
x x Cover Page
x x Project Disclaimer
x x Acknowledgements
x x Table of Contents
x x All sections, subsections listed, with page numbers
x x Appendices listed in order (no page numbers)
x x EXECUTIVE SUMMARY
x x Consise summary of project and design (not summary of report)
x x 1-2 pages long, no figures
x x 1.0 PROJECT BACKGROUND
x x Short description of project history, location, need/purpose
x x Annotaged figure showing project location
x x 1.1 Existing Site Conditions
x x Detailed information regarding location (current uses, topo, etc)
x x Site photos
x x 1.2 Stakeholders
x x 2.0 ALTERNATIVES ANALYSIS
x x Introduction
x x Detailed description of considered alternatives (figures if relevant)
x x Detailed description of selection criteria
Checklist Item
Trimet SW Barbur Blvd Stormwater (16)ALBA Consulting (Group 16)
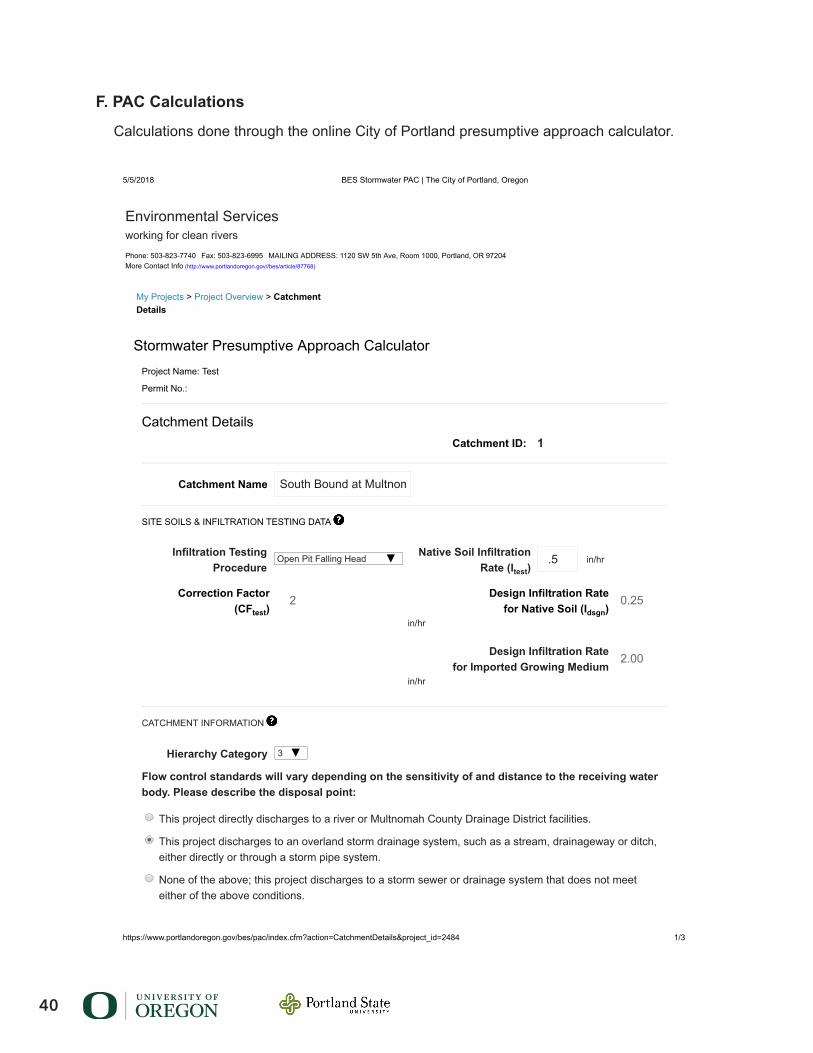
40
F. PAC Calculations
Calculations done through the online City of Portland presumptive approach calculator.
5/5/2018 BES Stormwater PAC | The City of Portland, Oregon
https://www.portlandoregon.gov/bes/pac/index.cfm?action=CatchmentDetails&project_id=2484 1/3
Phone: 503-823-7740 Fax: 503-823-6995 MAILING ADDRESS: 1120 SW 5th Ave, Room 1000, Portland, OR 97204More Contact Info (http://www.portlandoregon.gov//bes/article/87768)
Environmental Servicesworking for clean rivers
My Projects > Project Overview > CatchmentDetails
Stormwater Presumptive Approach CalculatorProject Name: Test
Permit No.:
Catchment DetailsCatchment ID: 1
Catchment Name South Bound at Multnom
SITE SOILS & INFILTRATION TESTING DATA
Infiltration TestingProcedure
Open Pit Falling Head Native Soil Infiltration
Rate (Itest) .5 in/hr
Correction Factor(CFtest)
2
Design Infiltration Rate for Native Soil (Idsgn)
0.25
in/hr
Design Infiltration Rate for Imported Growing Medium
2.00
in/hr
CATCHMENT INFORMATION
Hierarchy Category 3
Flow control standards will vary depending on the sensitivity of and distance to the receiving waterbody. Please describe the disposal point:
This project directly discharges to a river or Multnomah County Drainage District facilities.
This project discharges to an overland storm drainage system, such as a stream, drainageway or ditch,either directly or through a storm pipe system.
None of the above; this project discharges to a storm sewer or drainage system that does not meeteither of the above conditions.
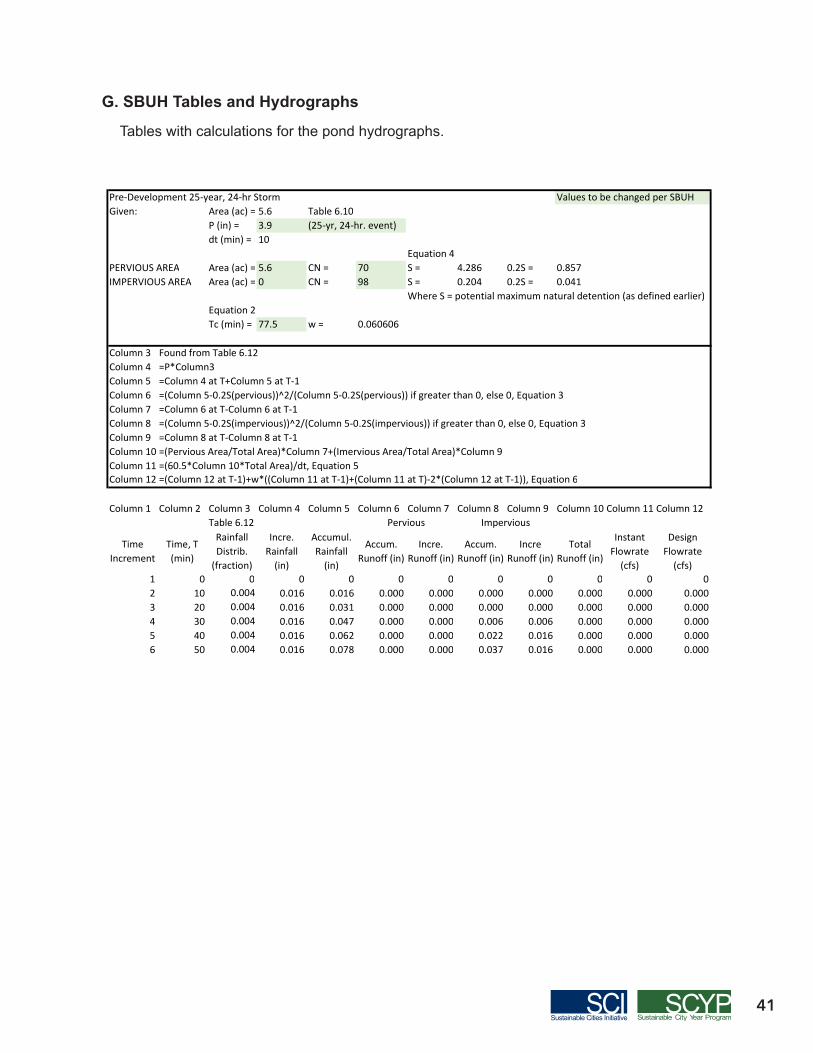
41Sustainable Cities Initiative
G. SBUH Tables and Hydrographs
Tables with calculations for the pond hydrographs.
Pre-Development 25-year, 24-hr Storm Values to be changed per SBUHGiven: Area (ac) = 5.6 Table 6.10
P (in) = 3.9 (25-yr, 24-hr. event)dt (min) = 10
Equation 4PERVIOUS AREA Area (ac) = 5.6 CN = 70 S = 4.286 0.2S = 0.857IMPERVIOUS AREA Area (ac) = 0 CN = 98 S = 0.204 0.2S = 0.041
Where S = potential maximum natural detention (as defined earlier)Equation 2Tc (min) = 77.5 w = 0.060606
Column 3 Found from Table 6.12Column 4 =P*Column3Column 5 =Column 4 at T+Column 5 at T-1Column 6 =(Column 5-0.2S(pervious))^2/(Column 5-0.2S(pervious)) if greater than 0, else 0, Equation 3Column 7 =Column 6 at T-Column 6 at T-1Column 8 =(Column 5-0.2S(impervious))^2/(Column 5-0.2S(impervious)) if greater than 0, else 0, Equation 3Column 9 =Column 8 at T-Column 8 at T-1Column 10 =(Pervious Area/Total Area)*Column 7+(Imervious Area/Total Area)*Column 9Column 11 =(60.5*Column 10*Total Area)/dt, Equation 5Column 12 =(Column 12 at T-1)+w*((Column 11 at T-1)+(Column 11 at T)-2*(Column 12 at T-1)), Equation 6
Column 1 Column 2 Column 3 Column 4 Column 5 Column 6 Column 7 Column 8 Column 9 Column 10 Column 11 Column 12Table 6.12
Time Increment
Time, T (min)
Rainfall Distrib.
(fraction)
Incre. Rainfall
(in)
Accumul. Rainfall
(in)
Accum. Runoff (in)
Incre. Runoff (in)
Accum. Runoff (in)
Incre Runoff (in)
Total Runoff (in)
Instant Flowrate
(cfs)
Design Flowrate
(cfs)1 0 0 0 0 0 0 0 0 0 0 02 10 0.004 0.016 0.016 0.000 0.000 0.000 0.000 0.000 0.000 0.0003 20 0.004 0.016 0.031 0.000 0.000 0.000 0.000 0.000 0.000 0.0004 30 0.004 0.016 0.047 0.000 0.000 0.006 0.006 0.000 0.000 0.0005 40 0.004 0.016 0.062 0.000 0.000 0.022 0.016 0.000 0.000 0.0006 50 0.004 0.016 0.078 0.000 0.000 0.037 0.016 0.000 0.000 0.000
Pervious Impervious
42
References1. Abbott Construction. (2011). “Fred Meyer Store 00040 Burlingame Occupancy Safety
Program Narrative.” City of Portland Permit # 10-144791.2. Bureau of Environmental Services (BES). (2018). “Stormwater Presumptive Approach
Calculator.” Bureau of Environmental Services. <https://www.portlandoregon.gov/bes/pac/>
3. Bureau of Environmental Services (BES). (2007). “Sewer and Drainage Facilities Design Manual.” Bureau of Environmental Services. <https://www.portlandoregon.gov/bes/article/360710>
4. Bureau of Environmental Services (BES). (2018). “I-5 and SW 26th Avenue Terraced Rain Gardens Project.” Bureau of Environmental Services. <https://www.portlandoregon.gov/bes/article/557929>
5. City of Portland (COP). (2016). “2016 Stormwater Management Manual.” City of Portland.
6. City of Portland (COP). (2008). “Erosion and Sediment Control Manual.” City of Portland. 7. Environmental Protection Agency (EPA). (2018). “Green Infrastructure.” Environmental
Protection Agency. <https://www.epa.gov/region8/green-infrastructure>8. Highmark Enterprises, LLC. (2011). “Stormwater Vault Installation, Bellevue, WA.”
<http://www.highmarkellc.com/view-our-work/excavation--site-prep/photo-41.html>9. Natural Resources Conservation Service (NRCS). (2007). “Hydrologic Soil Groups.”
National Engineering Handbook. United States Department of Agriculture. <https://directives.sc.egov.usda.gov/OpenNonWebContent.aspx?content=17757.wba>
10. Portland Bureau of Transportation (PBOT). (2018). “Estimate Template Master for Projects > $1 Million.” City of Portland. <https://www.portlandoregon.gov/transportation/article/207301#Estimation>
11. PortlandMaps. (2018). “Regional Topography and Geology, Infiltration, Soils, and Groundwater.” PortlandMaps <https://pdx.maps.arcgis.com/home/webmap/viewer.html?webmap=82f3baf4eb12415e8c1afd2517115d5f>