Embed Size (px)
Citation preview
Trinity Biotech plc
Annual Report 2020
This report has been prepared in accordance with the Irish Companies
Act 2014
TABLE OF CONTENTS
Page
Corporate Information
Market, Industry and Other Data
Cautionary Statement Regarding Forward-Looking Statements
1
2
2
Board of Directors & Executive Officers 3
Chairman’s Statement 5
Business Overview 6
Directors’ Report 11
Statement of Directors’ Responsibilities in respect of the annual report and the
financial statements
21
Selected Consolidated Financial Data 22
Risk Factors 25
Performance Review 51
Independent Auditor’s Report to the members of Trinity Biotech plc 66
Financial Statements
Consolidated Statement of Operations 74
Consolidated Statement of Comprehensive Income 75
Consolidated Statement of Financial Position 76
Consolidated Statement of Changes in Equity 77
Consolidated Statements of Cash Flows 78
Notes to the Consolidated Financial Statements 79
Company Statement of Comprehensive Income 150
Company Statement of Financial Position 151
Company Statement of Changes in Equity 152
Company Statement of Cash Flows 153
Notes to the Company Financial Statements 154
1
Corporate Information DIRECTORS
Mr Ronan O’Caoimh, Chairman and CEO
Dr Jim Walsh
Mr John Gillard (Appointed November 17, 2020)
Mr Kevin Tansley
Dr Denis Burger (US) (Resigned October 23, 2020)
Mr Clint Severson (US)
Mr James Merselis (US) COMPANY SECRETARY
Mr John Gillard (Appointed November 17, 2020)
Mr Kevin Tansley (Resigned November 17, 2020) REGISTERED OFFICE
IDA Business Park,
Bray,
Co. Wicklow,
Ireland. LEGAL ADVISORS
William Fry,
2 Grand Canal Square,
Dublin 2,
Ireland.
Matheson,
70 Sir John Rogerson’s Quay
Dublin 2,
Ireland Carter, Ledyard & Milburn,
2 Wall Street,
New York,
United States of America. PRINCIPAL BANKERS
AIB Bank plc,
Morehampton Road,
Donnybrook,
Dublin 4,
Ireland. AUDITOR
Grant Thornton
Chartered Accountants and Registered Auditors,
City Quay,
Dublin 2,
Ireland. DEPOSITARY FOR AMERICAN SHARES
Bank of New York,
101 Barclay Street,
New York,
United States of America.
2
Market, Industry and Other Data
Unless otherwise indicated, information contained in this Annual Report concerning our industry and the markets in which we operate,
including our competitive position and market opportunity, is based on information from our own management estimates and research,
as well as from industry and general publications and research, surveys and studies conducted by third parties. Management estimates
are derived from publicly available information, our knowledge of our industry and assumptions based on such information and
knowledge, which we believe to be reasonable. Our management estimates have not been verified by any independent source, and we
have not independently verified any third-party information. In addition, assumptions and estimates of our and our industry’s future
performance are necessarily subject to a high degree of uncertainty and risk due to a variety of factors, including those described in
“Risk Factors” below.
Cautionary Statement Regarding Forward-Looking Statements
This Annual Report contains statements that constitute “forward-looking statements” within the meaning of the U.S. Private Securities
Litigation Reform Act of 1995. These statements are neither historical facts nor assurances of future performance. Although we believe
that these estimates and forward-looking statements are based upon reasonable assumptions, they are subject to numerous risks and
uncertainties some of which are beyond our control, and are made in light of information currently available to us.
In some cases, these forward-looking statements can be identified by words or phrases such as “believe,” “may,” “will,” “expect,”
“estimate,” “could,” “should,” “anticipate,” “aim,” “estimate,” “intend,” “plan,” “believe,” “potential,” “continue,” “is/are likely to” or
other similar expressions. Forward-looking statements contained in this Annual Report include, but are not limited to, statements about:
• the development of our products;
• the potential attributes and benefit of our products and their competitive position;
• our ability to successfully commercialize, or enter into strategic relationships with third parties to commercialize, our
products;
• our estimates regarding expenses, future revenues, capital requirements and our need for additional financing;
• our ability to acquire or in-licence new product candidates;
• potential strategic relationships; and
• the duration of our patent portfolio.
These forward-looking statements are subject to risks, uncertainties and assumptions, some of which are beyond our control. In addition,
these forward-looking statements reflect our current views with respect to future events and are not a guarantee of future performance.
Actual outcomes may differ materially from the information contained in the forward-looking statements as a result of a number of
important factors, including, without limitation, the important risk factors set forth in the “Risk Factors” section of this Annual Report.
We operate in an evolving environment. New risks emerge from time to time, and it is not possible for our management to predict all
risks, nor can we assess the effect of all factors on our business or the extent to which any factor, or combination of factors, may cause
actual results to differ materially from those contained in any forward-looking statements.
The forward-looking statements made in this Annual Report relate only to events or information as of the date on which the statements
are made in this Annual Report. Except as required by law, we undertake no obligation to update or revise publicly any forward-looking
statements, whether as a result of new information, future events or otherwise, after the date on which the statements are made or to
reflect the occurrence of unanticipated events. You should read this Annual Report with the understanding that our actual future results
or performance may be materially different from what we expect.
3
Board of Directors and Executive Officers
Ronan O’Caoimh, Chairman and Chief Executive Officer, co-founded Trinity Biotech in June 1992 and acted as Chief Financial
Officer until March 1994 when he became Chief Executive Officer. He was also elected Chairman in May 1995. In November 2007, it
was decided to separate the role of Chief Executive Officer and Chairman and Mr O’Caoimh assumed the role of Executive Chairman.
In October 2008, following the resignation of the Chief Executive Officer, Mr O’Caoimh resumed the role of Chief Executive Officer
and Chairman. Prior to joining Trinity Biotech, Mr O’Caoimh was Managing Director of Noctech Limited, an Irish diagnostics company.
Mr O’Caoimh was Finance Director of Noctech Limited from 1988 until January 1991 when he became Managing Director. Mr
O’Caoimh holds a Bachelor of Commerce degree from University College Dublin. On March 30, 2011, the service agreement with
Ronan O’Caoimh as Chief Executive Officer was terminated and replaced by a management agreement with Darnick Company. This
arrangement ceased with effect from December 31, 2018 with Ronan O’Caoimh returning as an employee of the company.
Jim Walsh, PhD, Executive Director, initially joined Trinity Biotech in October 1995 as Chief Operations Officer. Dr Walsh resigned
from the role of Chief Operations Officer in 2007 to become a Non Executive Director of the Company. In October, 2010 Dr Walsh
rejoined the company as Chief Scientific Officer. Dr Walsh transferred from this position in 2015 and focuses on Business Development
activities. Prior to joining Trinity Biotech, Dr Walsh was Managing Director of Cambridge Diagnostics Ireland Limited (“CDIL”). He
was employed with CDIL since 1987. Before joining CDIL he worked with Fleming GmbH as Research & Development Manager. Dr
Walsh holds a PhD degree in Chemistry from University College Galway.
John Gillard, Chief Financial Officer, joined Trinity Biotech in November 2020 as Chief Financial Officer, Secretary to the Board
of Directors and was appointed to the Board as Executive Director. Mr. Gillard is both a Chartered Accountant and Chartered Tax
Advisor, having trained at PWC. Prior to joining Trinity Biotech, Mr. Gillard held a number of senior financial roles including from
2012 to 2016 at Alphabet Inc./Google, and from Nov 2016 to May 2020 at ION Investment Group. Since June 2020 Mr. Gillard has
also acted as a business consultant. Mr. Gillard holds a Bachelor of Commerce degree from the National University of Ireland Galway
and a Masters degree in Accounting from University College Dublin.
Kevin Tansley, Executive Director, joined Trinity Biotech in March 2003 and was appointed Chief Financial Officer and Secretary to
the Board of Directors in November 2007. Mr. Tansley was appointed to the board in September 2016 as Executive Director. In
November 2020 it was announced that Mr. Tansley was stepping down as Chief Financial Officer and Company Secretary but remains
a Director of the Company. Mr. Tansley trained as a chartered accountant in the Corporate Financial Services practice of Arthur
Andersen & Co. Prior to joining Trinity Biotech in 2003, Mr. Tansley held a number of financial positions in the Irish electricity utility
ESB. Mr. Tansley holds a Masters of Accounting degree from University College Dublin and is a Fellow of the Institute of Chartered
Accountants in Ireland.
Clint Severson, Non-executive director, joined the board of Trinity Biotech in November 2008 as a non-executive director. Mr.
Severson served as Chairman and CEO of Abaxis Inc. from June, 1996 to August, 2018, a NASDAQ traded diagnostics company based
in Union City, California. From February 1989 to May 1996, Mr. Severson served as President and Chief Executive Officer of MAST
Immunosystems, Inc., a privately-held medical diagnostic company and to date he has accumulated over 40 years of experience in the
medical diagnostics industry. Mr Severson is also on the board of Cutera, a provider of laser, light and other energy-based aesthetic
systems for medical practitioners worldwide.
4
Board of Directors and Executive Officers continued
James D. Merselis, Non-executive director, joined the board of Trinity Biotech in February 2009. He is currently a Co-Founder and
Managing Director of Synchrony Bio LLC, a healthcare-focused venture investment fund based in St. Louis, MO. He is also a non-
executive director for the following companies: Kypha Inc., a St. Louis, Missouri based diagnostic company focused on Complement
assays in the diagnosis and management of patients with inflammatory diseases; Geneoscopy, a St. Louis, Missouri based company
developing next generation diagnostics that leverage the power of RNA to better prevent, detect, and treat gastrointestinal disease; and
Abram Scientific Inc., a coagulation diagnostics company located in Palo Alto, California. Mr. Merselis has more than forty years’
experience in healthcare, including twenty-two years at Boehringer Mannheim Diagnostics (now Roche Diagnostics). Mr. Merselis has
led a number of healthcare diagnostic start-ups. From 2002 to 2007, he served as President and CEO of HemoSense, Inc., a point-of-
care diagnostics company providing patients and physicians with rapid test results to help manage the risk of stroke with the use of
Warfarin or Coumadin. During this time he successfully took the company public (AMEX:HEM) followed two years later by its
acquisition by Alere (now Abbott) (NYSE:ABT). His leadership at other start-ups has included: Nexus Dx (now Samsung), Alverix,
Inc. (now Becton Dickenson), and Micronics, Inc. (now SONY).
5
Chairman’s Statement
Dear Shareholder,
2020 has been an unprecedented year which has brought out the best in Trinity Biotech as we worked together to keep our people safe
and deliver for our customers. I am grateful for and proud of the remarkable resilience and dedication of our employees who worked
diligently throughout the pandemic to observe public health protocols and keep each other safe while going about their work. As a
company, we can be proud that our products helped to save lives.
The global spread of COVID‑19 and the public healthcare measures implemented by governments, such as quarantines and the
temporary closure of businesses led to fewer patients presenting themselves for medical check-ups resulting in a fall in demand for
certain of our products. Furthermore, funding allocated to combatting COVID-19 resulted in a reduction or a postponement in the
funding available for other diseases, conditions and disorders that our products are used to diagnose. Consequently, revenues for our
core product lines were significantly impacted by the pandemic, particularly in the second and third quarters of 2020.
We acted swiftly in response to the COVID-19 crisis, taking early action to control costs and conserve cash amid lower activity levels.
We pivoted the business to focus more on our COVID-related product portfolio. New production lines were set up in four of our plants
and very quickly we were fulfilling large orders for our PCR viral transport media product. This FDA approved product is used to store
the nasopharyngeal swab, which contains the patient sample and stabilises it, prevents bacterial growth and maintains its integrity until
a test is run in the laboratory. Simultaneously, our R&D function set to work developing COVID antibody and antigen tests.
Our excellent financial results for 2020 are testament to the adaptability of our business and to our ability to execute well against a plan.
Total revenues for the year were $102 million, an increase of 12.8% compared to 2019. Profit on continuing operations before
impairment charges increased to $11.8 million, compared to a loss of $4.7 million for 2019. Our cash balance increased from $16 million
to $27 million.
The situation with the COVID‑19 pandemic remains fluid and uncertain at this time. If the virus remains a threat to public health, we
will be ready to serve that market. Alternatively, if there is a return to normality, our core businesses are set up to rebound strongly in a
post-pandemic period. Looking to the longer term, I have confidence that Trinity Biotech is poised for significant growth. In the last
five years, we have invested heavily in our product pipeline and this investment is about to bear fruit. We expect to take a significant
share of the large HIV screening market with our forthcoming launch of our TrinScreen HIV product. The World Health Organisation
are currently reviewing our TrinScreen HIV submission and we expect approval before the end of 2021. In haemoglobins, we are excited
by our expected launch of a new mid-tier analyser in the next year. We will then have instruments to cater for all sizes of laboratories.
Our large installed base of haemoglobin analysers means we are a key player in the diabetes market, meeting growing global demand
for testing and monitoring. In autoimmunity, we are set to expand the range of services offered at our New York reference laboratory.
Lastly, I would like to thank all our employees and you, our shareholders, for your contribution to Trinity Biotech and for your continuing
support as we meet the new challenges ahead.
Ronan O’Caoimh
Chairman
September 7, 2021
6
Business Overview
Trinity Biotech develops, acquires, manufactures and markets medical diagnostic products for the clinical laboratory and point-of-care
segments of the diagnostic market. These products are used to detect autoimmune, infectious and sexually transmitted diseases, diabetes
and disorders of the liver and intestine. Trinity Biotech is a significant provider of raw materials to the life sciences and research
industries globally. Trinity Biotech also operates a licenced reference laboratory that specializes in diagnostics for autoimmune diseases.
We market our portfolio of several hundred products to customers in approximately 100 countries around the world through our own
sales force and a network of international distributors and strategic partners.
Trinity Biotech was incorporated as a public limited company (“plc”) registered in Ireland in 1992. The Company commenced operations
in 1992 and, in October 1992, completed an initial public offering of its securities in the US. The principal offices of the Group are
located at IDA Business Park, Bray, Co Wicklow, Ireland. The Group has expanded its product base through internal development and
acquisitions.
Industry Overview
The diagnostic industry is very competitive. There are many companies, both public and private, engaged in the sale of medical
diagnostic products and diagnostics-related research and development, including a number of well-known pharmaceutical and chemical
companies. Competition is based primarily on product reliability, customer service and price. This is a technology driven market with
an emphasis on automation and emerging biomarkers. Trinity actively works on increasing automation for the clinical laboratory. Trinity
seeks to bring novel biomarkers to market by licensing agreements with universities and innovative companies.
The Group’s competition includes several large companies such as, but not limited to: Abbott Diagnostics, Arkray, Bio-Rad, Diasorin
Inc., Johnson & Johnson, Roche Diagnostics, Siemens (from the combined acquisitions of Bayer, Dade-Behring and DPC), Thermo
Fisher, Copan, Becton Dickenson and Tosoh.
Products and services
Our product and services portfolio is divided between Clinical Laboratory tests, Point-of-Care tests and Laboratory services. In 2020,
our clinical laboratory division had revenue of US$84.3 million, the point-of-care division had revenue of US$9.2 million and the
revenue from laboratory services was US$8.5 million.
7
Business Overview (Continued)
Clinical Laboratory
Trinity Biotech supplies the clinical laboratory segment of the in-vitro diagnostic market with a range of diagnostic tests and
instrumentation which detect :
Infectious diseases,
Glycated haemoglobin (for diabetes monitoring and diagnosis) and haemoglobin variants for the detection of
haemoglobinopathies (haemoglobin abnormalities);
Autoimmune diseases
Trinity Biotech also supplies this market with other products through its clinical chemistry business.
Infectious Diseases
Trinity Biotech manufactures kits for the detection of specialty and esoteric biomarkers of infectious diseases and other associated
laboratory products. The products are used in processing patient samples whose results aid physicians in the diagnosis and clinical
assessment of a broad range of infectious diseases. The key clinical laboratory disease areas that Trinity Biotech serves include:
Sexually transmitted diseases, including Syphilis and Herpes ,
Markers for Epstein Barr, Measles, Mumps, Toxoplasmosis, Cytomegalovirus, Rubella, Varicella and other viral pathogens;
Lyme disease; and
SARS-CoV-2.
Trinity Biotech develops, manufactures and distributes products predominantly in enzyme-linked immunosorbent assay (“ELISA”)
format. As a complement to its product range, the company also offers third party automated processors to its customers.
Many of the products in our Infectious Diseases product line are FDA cleared for sale in the United States and CE marked in Europe.
Products are sold in approximately 100 countries in total, with the focus on the Americas, Europe and Asia. The infectious disease
products are sold through the sales and marketing organisation of Trinity Biotech to a variety of customers including public health
authorities, clinical and reference laboratories directly in the U.S. and U.K. and through independent distributors and strategic partners
in other countries.
Diabetes and Haemoglobinopathies
Trinity Biotech manufactures products for in-vitro diagnostic measurement of haemoglobin A1c (“HbA1c”) used in the monitoring and
diagnosis of diabetes, as well identifying those who are at a high risk of developing diabetes (pre-diabetic). The Premier Hb9210 uses
patented boronate affinity technology to measure HbA1c which is a marker of a patient’s average blood sugar control over the last 100
to 120 days. It is a highly accurate biomarker available for the diagnosis of diabetes and is a strong indicator of a diabetic’s glycemic
control. HbA1c is also used to identify those at risk of becoming diabetic; often referred to as impaired glucose tolerance. Additionally,
HbA1c is used in the assessment of diabetes complications.
Trinity Biotech manufactures its own HbA1c instrument, the Premier Hb9210, which was launched in Europe and obtained FDA
approval in late 2011. In Europe, Trinity Biotech distributes Premier Hb9210 through its partner Menarini Diagnostics. In the USA and
Brazil, Trinity Biotech sells the Premier Hb9210 through its own direct sales organisations. In the rest of the world, Trinity sells the
Premier Hb9210 through a network of distributors. The Premier’s unique features, cost structure and core technology enables it to
compete in most economies and settings.
Trinity Biotech also sells products for haemoglobin variants, through the Premier Resolution (CE cleared - meaning it can be sold in the
EU). The Premier Resolution detects and identifies haemoglobinapothies. These are genetic defects that result in abnormal structure of
the haemoglobin molecule. Haemoglobinapathies include sickle-cell diseases, alpha and beta thalassemia which are amongst the most
common genetic disorders in the world.
Trinity Biotech has launched the Premier Resolution, its next generation Haemoglobinapothy Analyzer in Europe and the Middle East
after undergoing rigorous and successful field trials. The Company expects to submit the Premier Resolution to the FDA for approval
in 2021. The submission has been significantly delayed due to the Covid-19 pandemic. The Premier Resolution uses an internally
designed column as well as state of the art hardware and software in order to provide unparalleled variant detection.
8
Business Overview (Continued)
The point-of-care segment of the HbA1c market is addressed by the Tri-stat system. The Tri-stat offers rapid, precise analysis in a simple
and highly cost effective manner. Using boronate affinity technology and a two phase optical system, the instrument can process three
samples simultaneously with the three results available in just 10 minutes. In 2018, a new, second generation Tri-stat analyser was
launched in international markets outside of the USA. In 2020 an enhanced version of the Tri-stat analyser was launched which includes
a dual detector for improved performance.
Autoimmune Diseases
Autoimmune diseases are diseases that involve an abnormal immune response in which the immune system attacks the body’s own cells
and tissues.
In 2013, Trinity Biotech acquired Immco Diagnostics (“Immco”), an autoimmunity company known for novel assay development and
high impact contributions to autoimmune disease diagnostic research. Immco develops, manufactures and sells products in the following
formats for diagnosis of autoimmune diseases:
• Immunofluorescence Assay (“IFA”),
• Enzyme-linked immunosorbent (“ELISA”),
• Western Blot (“WB”) and
• Line immunoassay (“LIA”).
The Immco products are a seamless fit for the instrument platforms that Trinity Biotech markets for its infectious diseases portfolio.
Additionally, Trinity sells a complete line of IFA processors. Many of Immco’s products are FDA cleared for sale in the U.S. and CE
marked in Europe.
The Immco product line addresses the high growth, lower throughput, specialty autoimmune segment, where competition is limited.
The principal autoimmune conditions in this segment are Rheumatoid Arthritis, Vasculitis, Lupus, Celiac and Crohn’s Disease,
Ulcerative Colitis, Neuropathy, Hashimoto’s Disease and Grave’s Disease.
In addition, Immco markets a panel of proprietary early markers for Sjögrens disease often referred to as “dry eye disorder” .
The Immco products are sold through Trinity Biotech’s sales and marketing organisation to clinical and reference laboratories directly
in the USA and via distributors in other countries. Menarini Diagnostics, a European market leader in autoimmune testing, distributes
Immco products in key European markets.
The diagnostic product line is complemented by Immco’s New York State Department of Health licenced reference laboratory offering
specialised services in diagnostic immunology, pathology and immunogenetics, and is marketed to U.S.-based reference laboratories
and hospitals.
9
Business Overview (Continued)
Clinical Chemistry
The speciality clinical chemistry business of Trinity Biotech includes reagent products such as ACE, bile acids, oxalate and glucose-6-
phosphate dehydrogenase (“G6PDH”) that are clearly differentiated in the marketplace. These products are suitable for both manual and
automated testing and have proven performance in the diagnosis of many disease states from liver and kidney disease to G6PDH
deficiency which is an indicator of haemolytic anaemia.
Point-of-Care (POC)
Point-of-care refers to diagnostic tests which are carried out in the presence of the patient.
Uni-Gold™ HIV
We believe that Trinity Biotech makes a very significant contribution to the global effort to meet the challenge of human immuno-
deficiency virus, or HIV, with its principal product, Uni-Gold™ HIV. In Africa, Uni-Gold™ HIV has been used for many years in
voluntary counselling and testing centers in the sub-Saharan region where it is a cornerstone to early detection and treatment intervention.
The Future of Point-Of Care at Trinity Biotech
In Africa, HIV testing typically involves using a point-of-care rapid test for screening followed by a different rapid test as the
confirmatory test. Our Uni-Gold™ HIV product is the dominant confirmatory HIV test in the African market and has been the gold
standard for over 15 years. It is the confirmatory test of choice in the vast majority of significant African countries.
Point-Of-Care is key to the growth of Trinity Biotech. Central to this growth will be a new HIV screening test, TrinScreen HIV, which
we are in the process of developing. Trinity Biotech has not previously competed in the larger screening market, which is estimated to
be valued at approximately US$150 million p.a. The screening market is addressed by few companies. TrinScreen should not jeopardise
our existing confirmatory business as it employs a different HIV antigen to the existing Uni-Gold™ HIV test. In other words, countries
will be able to use both the TrinScreen HIV test and the Uni-Gold™ HIV test as part of their testing algorithm. Our strategy is to leverage
the existing brand equity of Trinity Biotech in African markets to take market share in the screening market. This initiative will be
supported by increased sales and marketing resources in the African market. Market opportunities for the TrinScreen HIV product also
exist in other territories, in particular in emerging countries.
We are developing a rapid Covid-19 antigen test with which we intend to leverage our existing infectious disease rapid test design to
expedite the development and validation timeframe and also generate scale efficiencies in manufacture and distribution.
The Trinity Biotech Uni-Gold™ S. pneumonia, Uni-Gold™ Legionella, are both Conformité Européenne (“CE”) marked and we will
concentrate selling these products on international markets outside of the USA.
These point-of-care products will be sold through Trinity Biotech’s sales and marketing organisation to a variety of customers including
public health authorities, non-governmental organisations, clinical and reference laboratories directly in the United Kingdom, France
and Germany and through independent distributors and strategic partners in other countries.
Blood Bank Screening
Trinity Biotech manufactures enzyme-linked immunosorbent assays (“ELISA”), for the detection of Syphilis and Malaria. These
products are sold through distributors and are manufactured under original equipment manufacturer agreements for other major third
party diagnostic companies. The business is not currently operating in the United States.
10
Business Overview (Continued)
In relation to products produced at our facilities – these are as follows:
Bray, Ireland – Point-of-Care/HIV, Clinical Chemistry and Viral Transport Media products are manufactured at this site.
Jamestown, New York – this site specializes in the production of Microtitre Plate EIA products for infectious diseases and auto-
immunity. Viral Transport Media products are also manufactured at this facility.
Carlsbad, California – this facility specialises in the development and manufacture of products utilising Western Blot and lateral flow
technology. Our suite of Lyme products were manufactured at this facility and our new Infectious Diseases Point-of-Care range were
manufactured at this site. In 2020, management made the decision to close this facility permanently.
Kansas City, Missouri – this site is responsible for the manufacture of the Group’s haemoglobin and Viral Transport Media range of
products. It also carries out all of the Group’s haemoglobin R&D activities.
Buffalo, New York – these two sites are responsible for the manufacture of autoimmune test kits, Viral Transport Media products and
the majority of R&D activities for Immco Diagnostics, along with its reference laboratory business.
We are in material compliance with all environmental legislation, regulations and rules applicable in each jurisdiction in which we
operate.
11
Directors’ Report
Year ended December 31, 2020
Introduction
The directors submit their Annual Report, together with the audited financial statements of the Company and its subsidiaries (“Trinity
Biotech” and/or “the Group”), for the year ended December 31, 2020.
Principal activities
Trinity Biotech develops, acquires, manufactures and markets medical diagnostic products for the clinical laboratory and point-of-care
segments of the diagnostic market. These products are used to detect autoimmune, infectious and sexually transmitted diseases, diabetes
and disorders of the liver and intestine. Trinity Biotech is a significant provider of raw materials to the life sciences and research
industries globally. Trinity Biotech also operates a licenced reference laboratory that specializes in diagnostics for autoimmune diseases.
Our products are sold in over 75 countries worldwide by the Group’s own sales force and by a network of international distributors and
strategic partners.
Business review
In 2020, revenues increased by 12.8% from US$90.4 million in 2019 to US$102.0 million. The increase is mainly due to strong sales
within our Covid-19 related portfolio of products, with our Viral Transport Media product being the most significant contributor to
revenue within that portfolio. Offsetting these increases were decreases in our other product lines mainly due to the impact of the Covid-
19 pandemic.
Geographically, 69% of our sales were generated in the Americas, 22% in Africa/Asia and 9% in Europe.
The gross margin increased from 42.2% in 2019 to 47.6% in 2020 and this is largely due to the impact of strong sales within our Covid-
19 related portfolio of products, fewer instrument placements, lower depreciation and a range of cost saving measures implemented
during the year.
Selling General & Administrative Expenditure (excluding impairment charges, closure costs, recognition of contingent asset and tax
settlement) decreased from US$27.7 million in 2019 to US$26.4 million in 2020, which represents a decrease of 4.6%. The decrease is
mainly attributable to a range of cost saving measures implemented in response to the Covid-19 pandemic partially offset by foreign
currency losses mainly on Euro-denominated lease liabilities and increased performance-related pay due to higher revenues and profits.
The Group recognized a non-cash impairment charge of US$17.8 million in 2020 (2019: US$24.3 million).
The operating profit for continuing operations was US$0.1 million for the year, which compares to an operating loss of US$24.1 million
for 2019. Excluding the impairment charges, the plant closure costs and the recognition of contingent asset, the operating profit for
continuing operations for 2020 is US$19.0 million, compared to US$5.2 million (also excluding impairment charges and a once-off tax
settlement) in 2019. This increase in adjusted operating profit/loss is mainly attributable to higher revenues, higher gross margin and
income from the Paycheck Protection program.
In 2020, net financing expense was US$6.7 million compared to US$5.9 million in 2019. The increase of US$0.8 million was due to a
US$1.2 million unrealised increase in the fair value of the derivatives embedded in the Exchangeable Notes compared to a US$0.2
million decrease in 2019, lower deposit interest of US$0.4 million, offset by the inclusion of interest on a tax audit settlement of US$1.0
million in the prior year.
The loss for the year from continuing operations was US$6.0 million, compared to US$29.0 million in 2019. Before the impact of
impairment charges, plant closure costs and the recognition of contingent asset, the profit for 2020 from continuing operations would
have been US$12.9 million, compared to a US$0.4 million (excluding the tax settlement expense) for 2019.
12
Directors’ Report (Continued)
Dividends
In 2011 the Company announced that it intended to commence a dividend policy, to be paid once a year. As provided in the Articles of
Association of the Company, dividends or other distributions are declared and paid in US Dollars. Following on from this announcement,
a dividend was paid in respect of the 2010 financial year. Dividends were paid in each of the four subsequent years, 2011 to 2014. In
2016, the Company announced that it was suspending dividend payments in order to commence a share repurchase programme. No
dividend has been proposed in respect of the 2016, 2017, 2018, 2019 and 2020 financial years.
Going Concern
The directors have considered the group’s current financial position and cash flow projections, taking into account all known events and
developments including the Covid-19 pandemic. The directors have a reasonable expectation that the group will be able to continue its
operations for at least the next 12 months from the date of this report and that it is appropriate to continue to prepare the consolidated
financial statements on a going concern basis. In making this assessment, the directors have considered the potential repayment in April
2022 of part or all of the US$99.9 million exchangeable notes under the terms of the indenture for such exchangeable notes.
The directors have considered the various financing options expected to be available to the Group to assist it in meeting any repayment
obligations under the exchangeable notes over the next 12 months, to the extent such obligations cannot be met from cash on hand,
including refinancing the debt, repaying the debt with the proceeds from equity or debt offerings and the sale of assets. As with all such
potential transactions, there are risks to successfully implement such transactions and the directors have acknowledged and considered
these risks when considering the financing options and the appropriateness of adopting a going concern basis of accounting. Failure to
secure additional financing in a timely manner and on favourable terms could have a material adverse effect on our financial
performance, results of operations and share price and may require the Group to curtail or cease operations, sell off assets, seek protection
from its creditors through bankruptcy proceedings, or otherwise.
Developments during the year
We closed our Carlsbad, California manufacturing facility during 2020. This site specialised mainly in Western Blot manufacturing.
The last number of years have seen a steady migration of customers away from using the Western Blot testing format for diagnosing
Lyme in favour of alternative testing platforms. Production volumes at our Carlsbad, California facility had declined steadily to the
extent that it no longer made economic sense to continue.
Key Performance Indicators
The key financial indicators are set out below:
2020 2019
US$’000 US$’000
Revenue 101,980 90,435
Operating profit/(loss) 82 (24,112)
Loss for the year (6,388) (28,914)
Research and Development activity
Historically, Trinity Biotech had been primarily focused on infectious diseases diagnostics. The Group acquired a broad portfolio of
microtitre plate (“EIA”) and Western Blot products and has added to these over the last number of years through additional internally
developed products. More recently, the Group has entered into several other diagnostic areas including Point-of-Care (“POC”) and
clinical chemistry. The Research and Development (“R&D”) activities of the Group have mirrored this expansion by developing new
products in these areas also.
Haemoglobin Development Group
Premier Hb9210 Instrument for Haemoglobin A1c Testing
This project entails the development of a new HPLC instrument for testing HbA1c. Development was initiated in late 2007, and was
launched outside of the United States in 2011 and in the United States in early 2012.
13
Directors’ Report (Continued)
As part of our continuous improvement a new monitor, key board and frit housing have been customised and validated. These
improvements maintain the competiveness of the instruments.
Premier Resolution Instrument for Haemoglobin Variant Testing
We have developed the Premier Resolution instrument which is utilised for haemoglobin variant testing and is currently being rolled
out in certain international markets outside of the USA. Meanwhile, Premier Resolution continues to be enhanced with unique features
such as lot specific gradients, an optimised internally designed column with extended column life, and a rapidly expanding on-board
variant library.
Tri-stat 2.0
Tri-stat 2.0 represents a new HbA1c device that offers rapid, precise analysis in a simple and highly cost effective manner. Using
boronate affinity technology and a two phase optical system, three samples can be analysed simultaneously. This instrument though
often characterised as point-of-care is targeted at very low volume laboratories and governmental outreach programs. The ability to
perform three samples simultaneously enables the instrument to address these segments. Taking advantage of the latest technology the
instrument features a colour touchscreen, multiple language capability, modern connectivity, increased storage capacity as well as
replaceable diodes for state-of-the-art performance. Whilst the product has been launched in international markets, the company
continues to make enhancements to further improve its operational efficiency and accuracy. In 2020 an enhanced version of the Tri-stat
analyser was launched which includes a dual detector for improved performance.
Low to Medium throughput Haemoglobin instrument for A1c Testing
We are developing a low to medium throughput Haemoglobin A1c instrument with a view to targeting the market segment for testing
volumes which lie between the Tri-stat 2.0 and Premier Hb9210. These are customers that perform 3,000 to 12,000 tests each year per
instrument.
Point-of-Care (“POC”) Development Group
Trinity Biotech is in the process of developing point-of-care tests for the detection of HIV (TrinScreen) for the HIV screening market
in Africa. The product, which was developed at our Carlsbad facility, has been transferred to the high volume manufacturing facility in
Bray, Ireland. Multi-site clinical evaluations in Africa have been completed and the product was submitted to the World Health
Organisation for approval in March 2021.
We are developing a Covid-19 rapid antigen test.
A syphilis point-of-care rapid test is also in development using our existing lateral flow format.
Autoimmunity Development Group
IFA Smart Reader Project
We are developing two devices which will enable cell based Immunofluorescence Assays (IFA) to be read in a more automated manner.
The first device, ScopeSmart will be an automated IFA reader capable of performing image capture, pattern recognition and analysis on
IFA slides. This will then be followed by SlideSmart which will fully automate this entire testing process by integrating the sample
preparation.
Future developments
Trinity Biotech will continue to pursue product and technological developments through its research and development programmes and
the expansion of existing activities through its sales and marketing programmes. As outlined above, the Group is currently developing
several new diagnostic tests and instrumentation, while at the same time enhancing its existing products.
14
Directors’ Report (Continued)
Important events since the year end
Forgiveness of Paycheck Protection Loans
In 2020, six of the Group’s subsidiaries located in USA applied for and received loans under the U.S. government’s Paycheck Protection
Program (“PPP”). The loans were intended to offer support for businesses during the Covid-19 pandemic and were forgivable subject
to meeting certain criteria. Two out of the six PPP loans were forgiven during 2020. The four loans which remained unforgiven at year
end, totaling US$2,905,000, are treated as short term liabilities at December 31, 2020. Three of these loans were 100% forgiven in early
2021, amounting to a total of US$2,661,000. The final remaining PPP loan, which amounts to US$244,000, was forgiven in June 2021.
Director Indemnifications
In 2021, the Company and certain of its subsidiaries entered into indemnification agreements with each of the Directors in respect of
their involvement with the Company. Such arrangements are adjudged to be necessary to attract and retain highly qualified individuals.
Submission of TrinScreen test to World Health Organisation
In March 2021, the Group submitted its new HIV screening product, TrinScreen HIV, to the World Health Organisation for approval.
This product is a strategic priority for the Group. It is expected that the addition of a HIV screening test to our product range will drive
future growth in Point-of-Care revenues.
Covid-19 pandemic
The COVID-19 pandemic has not yet abated and the situation in 2021 remains fluid. The speed and nature of economic recovery is
uncertain and depends on several factors including the rollout of vaccines, the continuation of lockdown restrictions and the existence
of new variants of the disease. Management continues to monitor the pandemic situation closely and seeks to minimise the negative
impacts on the business, while at the same time, optimising the opportunities that a pandemic affords to a medical diagnostic company.
The continued uncertainty created by the pandemic increases the uncertainty in deciding on estimates and judgements underpinning the
financial statements.

15
Directors’ Report (Continued)
Directors
In accordance with the Articles of Association of the Company, Mr. Clint Severson retires by rotation and, being eligible, offers himself
for re-election.
Directors’ and Secretary’s interests Neither the directors, the Company Secretary, their spouses or minor children had interests in the company or its subsidiary undertakings
as at December 31, 2020, December 31, 2019 or subsequent date of appointment, except as follows:
Number of
‘A’ Ordinary
Shares
December
31, 2020
Number of
‘A’ Ordinary
Shares
December
31, 2019
Number of
options*
December
31, 2020
Number of
options*
December 31,
2019
Weighted
average
exercise price
of options
outstanding at
December 31,
2020
Weighted
average
exercise price
of options
outstanding at
December 31,
2019
Directors
Ronan
O’Caoimh**
7,057,501 7,057,501 11,704,000 7,104,000 US$0.69 US$1.09
John Gillard - - 600,000 - US$0.67 -
Jim Walsh 1,393,612 1,393,612 1,510,000 910,000 US$1.00 US$1.53
Kevin Tansley 150,000 150,000 1,664,000 1,364,000 US$0.79 US$1.74
James Merselis 188,600 188,600 630,000 270,000 US$0.79 US$1.58
Clint Severson 288,000 288,000 630,000 270,000 US$0.79 US$1.58
* Represents the number of ‘A’ ordinary shares which can be purchased under the Company’s share option plan.
** Includes options issued to Darnick Company which in the past provided Trinity Biotech with the services of Mr. O’Caoimh as Chief
Executive Officer.
Movement in directors’ and company secretary options during the year is as follows;
Number of
options held at
January 1, 2020
Options
granted
during the
year
Options lapsed
/exercised/forfeited
during the year
Number of
options held at
December 31,
2020
Directors
Ronan O’Caoimh 7,104,000 5,400,000 (800,000) 11,704,000
John Gillard - 600,000 - 600,000
Jim Walsh 910,000 600,000 - 1,510,000
Kevin Tansley 1,364,000 800,000 (500,000) 1,664,000
Denis R. Burger* 496,000 360,000 (200,000) 656,000
James Merselis 270,000 360,000 - 630,000
Clint Severson 270,000 360,000 - 630,000
The options outstanding at December 31, 2020 are exercisable and expire at various dates between 2021 and 2027. The exercise of
these options is not conditional upon meeting performance criteria.
* Denis R. Burger resigned as Non-executive Director on October 23, 2020.
16
Directors’ Report (Continued)
At December 31, 2020, the market price of Trinity Biotech plc shares was US$3.81 per ADS, which is equivalent to US$0.95 per ‘A’
Ordinary Share (December 31, 2019: US$1.03 per ADS or US$0.26 per ‘A’ Ordinary Share). The share price ranged from US$0.62 per
ADS (US$0.16 per ‘A’ Ordinary Share) to US$4.77 per ADS (US$1.19 per ‘A’ Ordinary Share) during the year ended December 31,
2020.
The Company’s register of directors’ interests, which is open to inspection at the registered office, contains full details of directors’
shareholdings and share options. From January 1, 2021 to June 30, 2021, there were no purchases of shares by the Directors of the
Company or by the Company Secretary.
Share option plans
The Board of Directors have adopted the Employee Share Option Plans (the "Plans"); with the most recently adopted Share Option
Plan being the 2020 Plan. The purpose of these Plans is to provide Trinity Biotech's employees, consultants, officers and directors
with additional incentives to improve Trinity Biotech's ability to attract, retain and motivate individuals upon whom Trinity Biotech's
sustained growth and financial success depends. These Plans are administered by the Board of Directors. Options under the Plans may
be awarded only to employees, officers, directors and consultants of Trinity Biotech.
The aggregate maximum number of ‘A’ Ordinary Shares of Trinity Biotech available for awards under the 2020 Plan is 5,000,000,
subject to adjustments to reflect changes in Trinity Biotech's capitalisation. Options under the Plans may be awarded only to employees,
officers, directors and consultants of Trinity Biotech.
The exercise price and the term of options is determined by the Board of Directors. The term may not exceed ten years from the date
of grant in relation to the 2011, 2013, 2017 and 2020 Plans. All options will terminate 90 days after termination of the option holder’s
employment, service or consultancy with Trinity Biotech (or one year after such termination because of death or disability) except
where a longer period is approved by the board of directors. Under certain circumstances involving a change in control of Trinity
Biotech, the exercisability and termination of the options may be accelerated.
Transactions with directors
There were no transactions with directors other than those outlined in Note 28 to the financial statements.
Directors’ remuneration
The Group’s policy in respect of remuneration of executive directors is to provide remuneration packages which attract, retain, motivate
and reward the executives concerned and encourage them to enhance the Group’s performance. In considering such packages,
cognisance is taken of the levels of remuneration for comparable positions, the responsibilities of the individuals concerned and the
overall performance of the Group. Directors’ and executive officers’ remuneration shown below comprises emoluments, pension contributions and bonuses in respect of
executive directors. The basis for the executive directors’ remuneration and level of annual bonuses is determined by the Remuneration
Committee of the board. The Remuneration Committee consists of Mr. Clint Severson (Committee Chairman and Lead Director) and
Mr. James Merselis. The Committee meets annually, or more often if required, to review and amend the packages of executive directors. Non-executive directors are remunerated by fees and the granting of share options. Non-executive directors who perform additional
services outside the normal duties of a director receive additional fees. The fees payable to non-executive directors are determined by
the board.

17
Directors’ Report (Continued)
Executive Director
Salary/ Benefits US$’000
Performance related bonus
US$’000
Defined contribution
pension US$’000
Total 2020
US$’000
Total 2019
US$’000
Ronan O’Caoimh 697 355 — 1,052 425
John Gillard 52 — — 52 —
Jim Walsh 38 — — 38 —
Kevin Tansley 487
229
41
757
630
1,274 584 41 1,899 1,055
Non-executive Director Fees
US$’000
Total 2020
US$’000
Total 2019
US$’000
Denis R. Burger1 48 48 75
James Merselis 57 57 75
Clint Severson 57
57
75
162 162 225
1 Denis Burger resigned as Non-executive Director on October 23, 2020.
Subsidiary and associate undertakings A list of the principal subsidiary undertakings of Trinity Biotech is given in Note 33 to the consolidated financial statements. The Group
does not have any branches outside of Ireland.
Accounting records
The directors are responsible for ensuring adequate accounting records, as outlined in Sections 281 to 285 of the Companies Act, 2014,
are kept by the Company. To achieve this, the directors have appointed suitably qualified accounting personnel in order to ensure that
these requirements are complied with. The accounting records of the Company are maintained at the Company’s registered office at
IDA Business Park, Bray, Co. Wicklow.
Statement on relevant audit information
In accordance with Section 330 of the Companies Act 2014, the Directors confirm that, in so far as the Directors are aware, there is no
relevant audit information of which the Company’s statutory auditors are unaware, and the Directors have taken all the steps that they
ought to have taken as Directors in order to make themselves aware of any relevant audit information and to establish that the Company’s
statutory auditors are aware of that information.
Non-financial reporting
Introduction At Trinity Biotech, in addition to advancing our strategic objectives and addressing relevant risks, we also work to support our customers,
our employees and the communities we serve, and promote a sustainable environment.
Trinity Biotech develops, acquires, manufactures and markets medical diagnostic products for the clinical laboratory and point-of-care
segments of the diagnostic market. These products are used to detect autoimmune, infectious and sexually transmitted diseases, diabetes
and disorders of the liver and intestine. Trinity Biotech is a significant provider of raw materials to the life sciences and research
industries globally. Trinity Biotech also operates a licenced reference laboratory that specializes in diagnostics for autoimmune diseases.
Our products are sold in over 75 countries worldwide by the Group’s own sales force and by a network of international distributors and
strategic partners.
18
Directors’ Report (Continued)
Environment It is our objective to conduct our business in an environmentally responsible way that minimizes environmental impacts. As a
manufacturer of medical devices we face risks associated with the handling and disposal of hazardous materials. We are committed to
reducing waste generation and disposing of all waste through safe and responsible methods; minimizing environmental risks by
employing safe technologies and operating procedures including engaging specialist service providers; and being prepared to respond
appropriately to accidents and emergencies.
Social and employee matters At Trinity Biotech plc, we are proud to devote our time and resources to initiatives that benefit our customers, our employees and our
community.
Customers
We are focused on developing, manufacturing and marketing medical diagnostic products for the clinical laboratory and point-of-care
segments of the diagnostic market. These products are used to detect autoimmune, infectious and sexually transmitted diseases, diabetes
and disorders of the liver and intestine. Trinity Biotech is a significant provider of raw materials to the life sciences and research
industries globally. Trinity Biotech also operates a licenced reference laboratory that specializes in diagnostics for autoimmune diseases.
Trinity Biotech plans to continue to pursue product and technological developments through its research and development programmes.
The Group is currently developing several new diagnostic tests and instrumentation, while at the same time enhancing its existing
products. We believe that our products make a meaningfully positive contribution to our customers and patients.
Employees
The average number of persons employed by the group during 2020 was 543 full-time employees. We employee staff across a number
of countries which increases the risks associated with staff management. The challenge given to all colleagues who work in Trinity
Biotech is to demonstrate shared ownership, accountability and responsibility for the business. Personal leadership, an ability within us
all, helps to create a vibrant workplace where we are challenged to do our best and be high performing at all times.
In our work environment we are responsible for ourselves, responsible for each other and responsible for the business. We trust each
other and we strive to bring out the best qualities of our people; we practice behaviours that foster change and ultimately, assist every
colleague to become the best they can be.
At Trinity Biotech, we work as a team. In a rapidly changing world we require flexibility from all colleagues to do what it takes in order
to deliver an excellent job. We recognise that we are part of a complex adaptive system and so we support each other to thrive, through
our behaviours and the relationships we build with each other.
In order to continue our track record of success, we need demonstrated leadership from all colleagues. We are committed to continually
learning in order to create a high performing work environment where we continuously improve on what we do and how we do it.
Employee Safety - Our business is typically deemed “essential” and we have continued to operate, manufacture and distribute products
to customers throughout most of 2020. We implemented health and safety policies to help safeguard our on-site employees and maintain
business continuity throughout the Covid-19 pandemic. We have also enhanced cleaning procedures, provided additional personal
hygiene supplies and protective equipment to employees, limited access to our facilities to visitors, trained employees on social
distancing and mask wearing. Where practical, we have facilitated many employees to work remotely. While the above is what we did
to ensure the pandemic was controlled in the workplace and our staff were safe we have health and safety at the centre of all we do. We
hold health and safety meetings daily and have key performance indicators we track to ensure that all issues are dealt with in a timely
manner ensuring that our staff are safe in the workplace
19
Directors’ Report (Continued)
Community
We take corporate social responsibility seriously. We are committed to promoting a working environment where all decisions are based
on socially responsible and ethical principles. As a company we endorse such values as Learning, Trust, Leadership, Support and
Teamwork, and as individuals we endeavour to do all we can to breathe life into these very values.
We believe strongly in corporate community involvement. Our colleagues are encouraged to take up activities intended to promote such
involvement and foster good relations between Trinity Biotech and the communities within which our various sites are located. By
visiting schools, for example, and demonstrating to students how science is central to the practical and beneficial work we do, we can
engage meaningfully with the wider community and help create advocacy among possible employees of the future.
Of course we don’t simply focus on communities close to hand. As an organisation that spans continents we are fully aware that distance
is no barrier when it comes to forging connections between people.
The way we work with all communities reflects the values we hold dear as a company. We see ourselves as a progressive and dynamic
group of people – and our charitable work is governed equally by these principles. Making a difference on the ground is essential. For
example, we donated food and equipment to a local homeless charity in Ireland in the summer of 2021 during the challenging COVID
19 Pandemic.
Our Charities Team plans to increase charitable activities as the company grows. We see such work as a vital constituent in the
development of a successful and ethically grounded corporate organisation – and one which is central to the betterment of not only the
lives of our colleagues but in the lives of all those we engage with.
Human rights, bribery and corruption
All our employees are required to adhere to our Code of Business and Ethical Conduct which requires all employees to comply with all
laws and regulations applicable to Trinity’s business, including any anti-bribery, anti-corruption and human rights laws. The Code of
Business and Ethical Conduct requires all staff to act with integrity in all business matters. The fact that we sell products to a large
number of countries globally is an inherent risk regarding these matters.
Our Code of Business and Ethical Conduct requires staff to report any potential violations of the code to a designated senior individual
in the Group or to the Chairman of the Group’s Audit Committee. In 2020 no such potential violations were reported.
Principal risks and uncertainties
Under Section 327(b) of the Companies Act, 2014, the Group is required to give a description of the principal risk and uncertainties
which it faces. These risk factors are outlined on pages 25-50.
Financial Instruments
An analysis of the financial instruments used by the Group is contained in Note 29 to the consolidated financial statements.
Substantial holdings
The information below outlines holdings of 3% or more of the Company’s subscribed capital as at March 31, 2021.
Renaissance Technologies Holdings Corporation 9.1%
Paradice Investment Management, LLC 7.4%
Heartland Advisors, Inc. 5.6%
Lapides Asset Management, LLC 5.3%
Boston Partners 5.1%
Stonehill Capital Management, LLC 4.7%
20
Directors’ Report (Continued)
Apart from the directors’ interests and the substantial holdings set out above of the Shares of the Company, as at June 30, 2021, the
Company has not been made aware of any other interests, directly or indirectly, in 3% or more of the Company’s subscribed capital, by
any person having such an interest.
Directors’ Compliance Statement
It is the policy of the Company to comply with its relevant obligations (as defined in the Companies Act 2014). The Directors have
drawn up a compliance policy statement (as defined in section 225(3)(a) of the Companies Act 2014) and arrangements and structures
are in place that are, in the Directors’ opinion, designed to secure material compliance with the Company’s relevant obligations. The
Directors confirm that these arrangements and structures were reviewed during the financial year. As required by Section 225(2) of the
Companies Act 2014, the Directors acknowledge that they are responsible for the Company’s compliance with the relevant obligations.
In discharging their responsibilities under Section 225, the Directors relied on the advice both of persons employed by the Company
and of persons retained by the Company under contract, who they believe have the requisite knowledge and experience to advise the
Company on compliance with its relevant obligations.
Audit Committee The Committee is chaired by James Merselis and includes Clint Severson and their biographies can be found on pages 3-4. The audit committee meet as required and specifically to review the financial statements and to consider the suitability and monitor the effectiveness of internal control processes. The Audit Committee also reviews the findings of the external auditor and reviews accounting policies and material accounting judgements. The Audit Committee normally meets at least three times in each financial year and has unrestricted access to the Group’s external auditor.
Auditors
Grant Thornton, Chartered Accountants, have expressed their willingness to remain in office in accordance with Section 383 (2) of the
Companies Act, 2014.
On behalf of the board
Ronan O’Caoimh
John Gillard
Directors
September 7, 2021
21
Statement of Directors’ Responsibilities in respect of the Annual Report and the Financial Statements
The directors are responsible for preparing the Annual Report and the consolidated financial statements in accordance with Irish law
and regulations.
Irish company law requires the directors to prepare the consolidated and company financial statements for each financial year. Under
the law, the directors have elected to prepare the financial statements in accordance with Companies Act 2014 and International Financial
Report Standards (IFRSs) as adopted by the EU. Under company law, the directors must not approve the financial statements unless
they are satisfied that they give a true and fair view of the assets, liabilities and financial position of the company as at the financial year
end date and of the profit or loss of the company for the financial year and otherwise comply with the Companies Act 2014.
In preparing these financial statements, the directors are required to:
select suitable accounting policies and then apply them consistently;
make judgments and accounting estimates that are reasonable and prudent;
state whether the financial statements have been prepared in accordance with applicable accounting standards, identify those
standards, and note the effect and the reasons for any material departure from those standards; and
prepare the financial statements on the going concern basis unless it is inappropriate to presume that the company will continue
in business.
The directors are responsible for ensuring that the company keeps or causes to be kept adequate accounting records which correctly
explain and record the transactions of the company, enable at any time the assets, liabilities, financial position and profit or loss of the
company to be determined with reasonable accuracy, enable them to ensure that the financial statements and directors’ report comply
with the Companies Act 2014 and enable the financial statements to be audited. They are also responsible for safeguarding the assets of
the company and hence for taking reasonable steps for the prevention and detection of fraud and other irregularities.
The directors are responsible for the maintenance and integrity of the corporate and financial information included on the company’s
website. Legislation in Ireland governing the preparation and dissemination of financial statements may differ from legislation in other
jurisdictions.
22
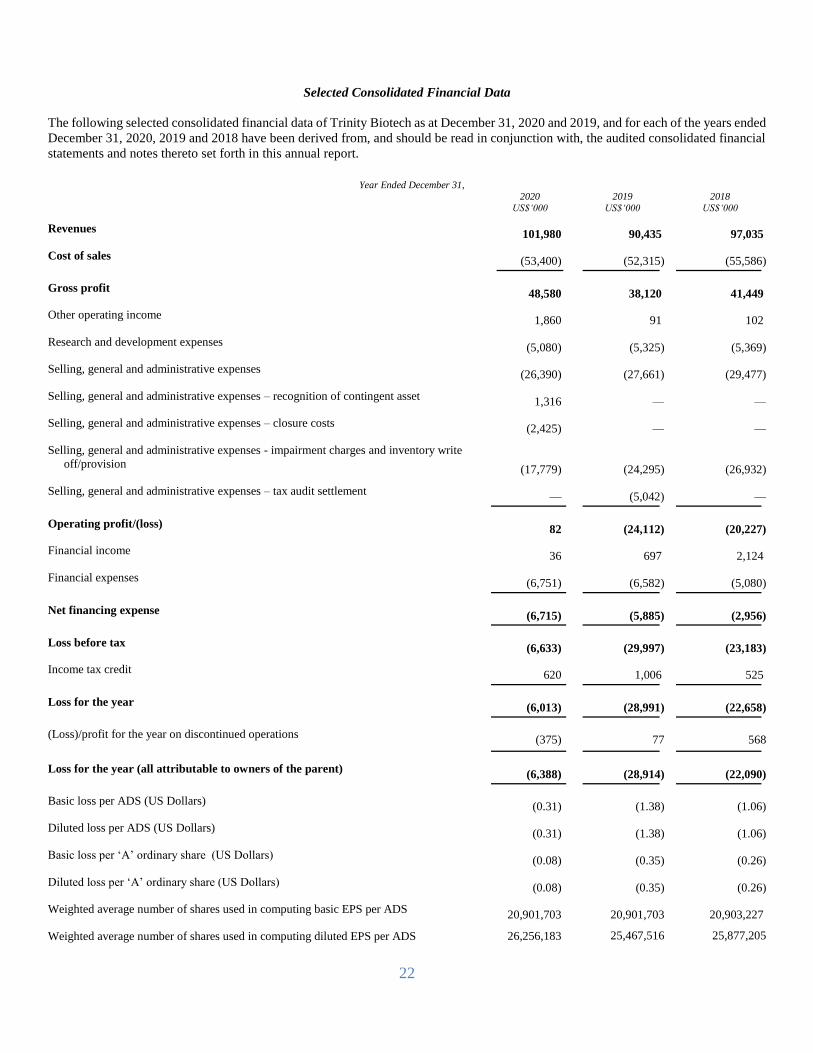
Selected Consolidated Financial Data
The following selected consolidated financial data of Trinity Biotech as at December 31, 2020 and 2019, and for each of the years ended
December 31, 2020, 2019 and 2018 have been derived from, and should be read in conjunction with, the audited consolidated financial
statements and notes thereto set forth in this annual report.
Year Ended December 31,
2020 US$‘000
2019 US$‘000
2018 US$‘000
Revenues 101,980 90,435 97,035
Cost of sales (53,400) (52,315) (55,586)
Gross profit 48,580 38,120 41,449
Other operating income 1,860 91 102
Research and development expenses (5,080) (5,325) (5,369)
Selling, general and administrative expenses (26,390) (27,661) (29,477)
Selling, general and administrative expenses – recognition of contingent asset 1,316 — —
Selling, general and administrative expenses – closure costs (2,425) — —
Selling, general and administrative expenses - impairment charges and inventory write
off/provision (17,779) (24,295) (26,932)
Selling, general and administrative expenses – tax audit settlement — (5,042) —
Operating profit/(loss) 82 (24,112) (20,227)
Financial income 36 697 2,124
Financial expenses (6,751) (6,582) (5,080)
Net financing expense (6,715) (5,885) (2,956)
Loss before tax (6,633) (29,997) (23,183)
Income tax credit 620 1,006 525
Loss for the year (6,013) (28,991) (22,658)
(Loss)/profit for the year on discontinued operations (375) 77 568
Loss for the year (all attributable to owners of the parent) (6,388) (28,914) (22,090)
Basic loss per ADS (US Dollars) (0.31) (1.38) (1.06)
Diluted loss per ADS (US Dollars) (0.31) (1.38) (1.06)
Basic loss per ‘A’ ordinary share (US Dollars) (0.08) (0.35) (0.26)
Diluted loss per ‘A’ ordinary share (US Dollars) (0.08) (0.35) (0.26)
Weighted average number of shares used in computing basic EPS per ADS 20,901,703 20,901,703 20,903,227
Weighted average number of shares used in computing diluted EPS per ADS 26,256,183 25,467,516 25,877,205

23
Year Ended December 31,
2020 US$‘000
2019 US$‘000
2018 US$‘000
Weighted average number of shares used in computing basic EPS per ‘A’ ordinary share 83,606,810 83,606,810 83,612,908
Weighted average number of shares used in computing diluted EPS per ‘A’ ordinary
share 105,024,732 101,870,064 103,508,820
24
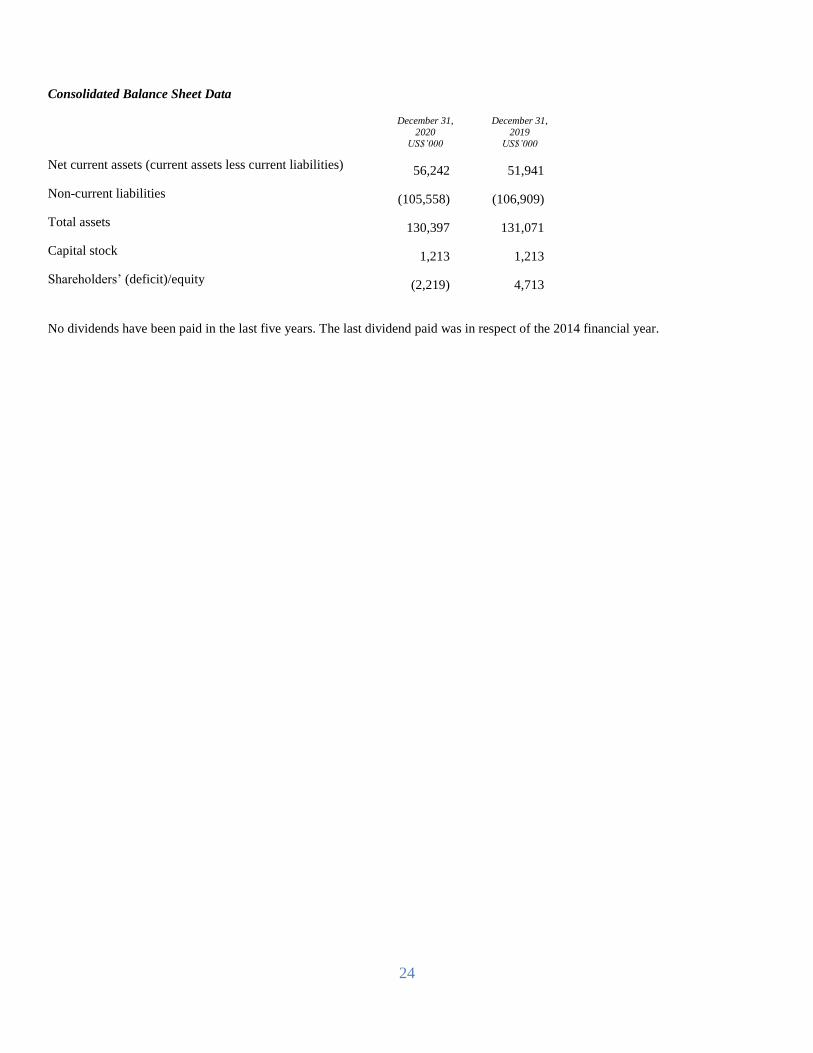
Consolidated Balance Sheet Data
December 31,
2020 US$’000
December 31,
2019 US$’000
Net current assets (current assets less current liabilities) 56,242 51,941
Non-current liabilities (105,558) (106,909)
Total assets 130,397 131,071
Capital stock 1,213 1,213
Shareholders’ (deficit)/equity (2,219) 4,713
No dividends have been paid in the last five years. The last dividend paid was in respect of the 2014 financial year.

25
Risk Factors
Investing in our shares involves a high degree of risk and uncertainty. You should carefully consider all of the information set forth in
this annual report, including the following summary of risk factors, when investing in our securities. These risks and uncertainties reflect
the international scope of our company’s operations and the highly regulated industry in which it operates. The risks and uncertainties
presented below, which are discussed in more detail in the Risk Factors are reviewed on an annual basis and represent the principal risks
and uncertainties faced by us at the time of compilation of this annual report. During the course of 2021, new risks and uncertainties
may materialise attributable to changes in markets, regulatory environments and other factors and existing risks and uncertainties may
become less relevant, including the following.
Risks Related to our Business & Industry
Competition and trading conditions - our ability to sell products could be adversely affected by competition from new and
existing diagnostic products, changing conditions in the diagnostic market, including, inter alia, reductions in government
funding and sector consolidation.
New product development - our long-term success depends upon the successful development and commercialization of new
products.
Capital structure - we may require future additional capital.
Borrowings - we have incurred substantial debt, which could impair our flexibility and access to capital and adversely affect
our financial position. To the extent we are unable to repay our debt as it becomes due with cash on hand or from other sources,
we will need to refinance our debt, sell assets or repay the debt with the proceeds from equity offerings in order to continue in
business. Our ability to obtain additional funding may determine our ability to continue as a going concern.
Product recalls and claims - our products may in the future be subject to product recalls that could harm our reputation,
business and financial results. If our products cause or contribute to a death or a serious injury, or malfunction in certain ways,
we will be subject to medical device reporting regulations, which can result in voluntary corrective actions or regulatory agency
enforcement actions. We may be subject to liability resulting from our products or services.
Corporate strategy - failure to achieve our financial and strategic objectives could have a material adverse impact on our
business prospects.
Global economic conditions – changes may have a material adverse impact on our results.
Pandemic impact - the Covid-19 outbreak could significantly disrupt our operations and adversely affect our results of
operations.
People - we are highly dependent on our senior management team and other key employees, and the loss of one or more of
these employees or the inability to attract and retain qualified personnel as necessary could adversely affect our operations.
Supply chains - significant interruptions in production at our principal manufacturing facilities and/or third-party
manufacturing facilities would adversely affect our business and operating results. We are dependent on third-party suppliers
for certain critical components and the primary raw materials required for our test kits. Our inability to manufacture products
in accordance with applicable specifications, performance standards or quality requirements could adversely affect our
business.
Distributor network - our revenues are highly dependent on a network of distributors worldwide. Our success depends on our
ability to service and support our products directly or in collaboration with our strategic partners.
Cyber security - our ability to protect our information systems and electronic transmissions of sensitive data from data
corruption, cyber-based attacks, security breaches or privacy violations is critical to the success of our business.
Foreign exchange - our sales and operations are subject to the risks of fluctuations in currency exchange rates.
Financial impairment - the large amount of intangible assets and goodwill recorded on our balance sheet may lead to
significant impairment charges in the future.
Taxation - tax matters, including disagreements with taxing authorities, the changes in corporate tax rates and imposition of
new taxes could impact our results of operations and financial condition.
Acquisitions - future acquisitions may be less successful than expected, not generate the expected benefits, disrupt our ongoing
business, distract our management, increase our expenses and adversely affect our business, and therefore, growth may be
limited.
Brexit - the United Kingdom’s withdrawal from the European Union could potentially impact our supply chains and the market
for our products in the United Kingdom.

26
Environmental, Social and Governance - increasing scrutiny and changing expectations from investors, lenders, customers
and other market participants with respect to our Environmental, Social and Governance, or ESG, policies may impose
additional costs on us or expose us to additional risks.
Risks Related to Government Regulations
Clinical trials - clinical trials necessary to support future premarket submissions will be expensive and will require enrolment
of suitable patients who may be difficult to identify and recruit. Delays or failures in our clinical trials will prevent us from
commercializing any modified or new products and will adversely affect our business, operating results and prospects. If the
third parties on whom we rely to conduct our pre-clinical studies and clinical trials and to assist in pre-clinical development do
not perform as contractually required or expected, we may not be able to obtain regulatory approval or commercialize our
products. The results of our clinical trials may not support our product candidate claims.
Regulatory compliance - we may be subject to fines, penalties or injunctions if we are determined to be promoting the use of
our products for unapproved or “off-label” uses. If the FDA were to modify its policy of enforcement discretion with respect
to our laboratory developed tests, we could incur substantial costs and delays associated with trying to obtain premarket
clearance or other approvals.
Product approvals - if we fail to maintain regulatory approvals and clearances our ability to commercially distribute and
market these products could suffer. Failure to comply with FDA or other regulatory requirements may require us to suspend
production of our products or institute a recall which could result in higher costs and a loss of revenues. Modifications to our
products may require new 510(k) clearances or pre-market approvals, or may require us to cease marketing or recall the
modified products until clearances or approvals are obtained. Our laboratory business could be harmed from the loss or
suspension of a licence or imposition of a fine or penalties under, or future changes in, the law or regulations of the Clinical
Laboratory Improvement Amendments of 1988 (“CLIA”), or those of other state or local agencies.
International regulations - we face risks relating to our international sales and business operations, including regulatory risks,
which could impact our current business operations and growth strategy.
Healthcare industry laws - we are subject to various laws targeting fraud and abuse in the healthcare industry. Changes in
healthcare regulation could affect our revenues, costs and financial condition.
Public company regulations - compliance with regulations governing public company corporate governance and reporting is
complex and expensive.
Risks Related to Our Intellectual Property
Proprietary rights - we may be unable to protect or obtain proprietary rights that we utilise or intend to utilise.
Patent protection – our patent protection may not be sufficiently broad to compete effectively, the existing patents could be
challenged; and trade secrets and confidential know-how could be obtained by competitors. Our patent protection could be
reduced or eliminated for non-compliance with various procedural requirements or due to changes in patent law. We may be
involved in lawsuits to enforce our patents, the patents of our licensors or our other intellectual property rights, which could be
expensive, time consuming and unsuccessful. Product infringement claims by other companies could result in costly disputes
and could limit our ability to sell our products.
Risks Related to Ownership of our ADSs
Information - as a foreign private issuer we are exempt from a number of rules under the Exchange Act and are permitted to
file less information with the SEC than a domestic U.S. reporting company.
Passive foreign investment company - we may be classified as a passive foreign investment company, or PFIC, which would
subject our U.S. investors to adverse tax rules.
Volatility - the market price of our ADSs has been, and may continue to be, highly volatile. Future sales of our ADSs could
reduce the market price of the ADSs.
Capital - we expect we will need additional capital in the future.
Dilution - the conversion of our outstanding employee share options would dilute the ownership interest of existing
shareholders.
Governed by Irish law - it could be difficult for US holders of ADSs to enforce any securities laws claims against Trinity
Biotech, its officers or directors in Irish Courts.
Dividends - we have no plans to pay dividends on our ADSs, and you may not receive funds without selling the ADSs.
Voting rights of holders of ADSs - the terms of the deposit agreement limits the voting rights of holders of ADSs.
27
Risks Related to our Business & Industry
Our ability to sell products could be adversely affected by competition from new and existing diagnostic products.
We have invested in research and development but there can be no guarantees that our R&D programmes will not be rendered
technologically obsolete or financially non-viable by the technological advances of our competitors, which would also adversely affect
our existing product lines and inventory. Our main competitors (and their principal products with which we compete) include: Abbott
Diagnostics (AxSYM™, IMx™, i-STAT®, Determine™, Wampole™, Athena™, Biosite Triag®), Arkray (HA-8180), Bio-Rad (Bio-
Plex™, Variant II, Turbo and D10™), Diasorin Inc. (Liasion™, ETIMAX™), Ortho Clinical Diagnostics (Vitros™), Roche Diagnostics
(COBAS AMPLICOR™, Ampliscreen™, Accutrend™, Tina Quant™), Siemens – Beckman Coulter (Uni-Cel), Siemens – Dade-
Behring (BEP 2000, Enzygnost®), Siemens – Bayer (Centaur™), Siemens – DPC (Immulite™), Thermo Fisher (Konelab™), Copan
(UTM ®), Becton Dickenson (BD universal viral transport system) and Tosoh (G8™).
The diagnostics industry is focused on the testing of biological specimens in a laboratory or at the point-of-care and is highly competitive
and rapidly changing. As new products enter the market, our products may become obsolete or a competitor’s products may be more
effective or more effectively marketed and sold than ours. If we fail to maintain and enhance our competitive position, our customers
may decide to use products developed by competitors which could result in a loss of revenues and adversely affect our results of
operations, cash flow and business.
We may in certain instances also face competition from products that are sold at a lower price. Where this occurs, customers may choose
to buy lower cost products from third parties or we may be forced to sell our products at a lower price, both of which could result in a
loss of revenues or a lower gross margin contribution from the sale of our products. We may also be required to increase our marketing
efforts in order to compete effectively, which would increase our costs.
Our tests compete with products made by our competitors. Multiple competitors are making investments in competing technologies and
products, and a number of our competitors have significantly greater financial, technical, research and other resources. Some competitors
offer broader product lines and may have greater market presence or name recognition than we have. If we receive FDA clearance, and
in order to achieve market acceptance, we and/or our distributors will likely be required to undertake substantial marketing efforts and
spend significant funds to inform potential customers and the public of the existence and perceived benefits of our products. Our
marketing efforts for these products may not be successful. As such, there can be no assurance that these products will obtain significant
market acceptance and fill the market needs that are perceived to exist on a timely basis, or at all.
We have incurred substantial debt, which could impair our flexibility and access to capital and adversely affect our financial position.
As of December 31, 2020, we had total indebtedness with a carrying value of approximately US$102.8 million, which included US$84.0
million of outstanding indebtedness under our 4% exchangeable notes due in 2045. The exchangeable notes have a nominal amount of
US$99.9 million and include a number of put and call options. The earliest date on which holders can require Trinity Biotech to
repurchase their notes at par is April 1, 2022.
Our debt may:
• limit our ability to borrow additional funds for working capital, capital expenditures, acquisitions or other general business
purposes;
• limit our ability to use our cash flow or obtain additional financing for working capital, capital expenditures, acquisitions
or other general business purposes;
• require us to use a substantial portion of our cash flow from operations to make debt service payments;
• limit our flexibility to plan for, or react to, changes in our business and industry;
• result in dilution to our existing shareholders in the event exchanges of the exchangeable notes are settled in our ordinary
shares;
• place us at a competitive disadvantage compared to our less leveraged competitors; and
• increase our vulnerability to the impact of adverse economic and industry conditions.
In addition, the holders of the exchangeable notes have the ability to require us to repurchase their notes for cash if we undergo certain
fundamental changes, such as specified change of control transactions, our liquidation or dissolution, or the delisting of our ordinary
shares from the Nasdaq Global Market. Moreover, upon exchange of the exchangeable notes, unless we elect to deliver only our ordinary
shares to settle such exchange, we will be required to make cash payments in respect of the exchangeable notes. We may not have
enough available cash or be able to obtain financing at the time we are required to make any required repurchases of surrendered
exchangeable notes or to pay cash upon exchanges of the exchangeable notes. Our failure to repurchase the exchangeable notes at a time
28
when the repurchase is required by the indenture governing the exchangeable notes or to pay any cash payable on future exchanges of
the exchangeable notes as required by the indenture governing the exchangeable notes would constitute a default under that indenture.
If the repayment of the related indebtedness were to be accelerated, we may not have sufficient funds to repay the related indebtedness,
which could have a material adverse effect on our financial condition and our business.
To the extent we are unable to repay our debt as it becomes due with cash on hand or from other sources, we will need to refinance our
debt, sell assets or repay the debt with the proceeds from equity offerings in order to continue in business. Additional indebtedness or
equity financing may not be available to us in the future for the refinancing or repayment of existing debt, or if available, such additional
debt or equity financing may not be available on a timely basis, or on terms acceptable to us and within the limitations specified in our
then existing debt instruments. In addition, in the event we decide to sell additional assets, we can provide no assurance as to the timing
of any asset sales or the proceeds that could be realized by us from any such asset sale.
Our ability to obtain additional funding may determine our ability to continue as a going concern. Our directors have considered our
company’s current financial position and cash flow projections, taking into account all known events and developments including the
Covid-19 pandemic. The directors believe that we will be able to continue our operations for at least the next 12 months from the date
of this report and that it is appropriate to continue to prepare the consolidated financial statements on a going concern basis. In making
this assessment, the directors have considered the potential repayment in April 2022 of part or all of the US$99.9 million exchangeable
notes under the terms of the indenture for such exchangeable notes. Failure to secure additional financing in a timely manner and on
favourable terms could have a material adverse effect on our financial performance, results of operations and share price and may require
the Group to curtail or cease operations, sell off its assets, seek protection from its creditors through bankruptcy proceedings, or
otherwise. Furthermore, additional equity financing may be dilutive to the holders of our ADSs, and debt financing, if available, may
involve restrictive covenants. Any additional financing could have a negative effect on shareholders.
Our business could be adversely affected by changing conditions in the diagnostic market.
The diagnostics industry is in transition with a number of changes that affect the market for diagnostic test products. The diagnostics
industry has experienced considerable consolidation through mergers and acquisitions in the past several years. For example, major
consolidation among reference laboratories and the formation of multi-hospital alliances, reducing the number of institutional customers
for diagnostic test products. There can be no assurance that we will be able to enter into and/or sustain contractual or other marketing or
distribution arrangements on a satisfactory commercial basis with these institutional customers. In the recent past, we have discontinued
selling our Lyme Western Blot and HIV point-of-care tests in USA due to changing market conditions which made those sales
uncommercial.
Further, this consolidation trend may result in the remaining companies having greater financial resources and technological capabilities,
thereby intensifying competition in the industry, which could have a material adverse effect on our business.
Reductions in government funding to agencies and organizations we work with could adversely affect our business and financial
results.
We sell our products into the public health market, which consists of state, county and other governmental public health agencies,
community based organizations, service organizations and similar entities. Many of these customers depend to a significant degree on
grants or funding provided by governments or governmental agencies to run their operations, including programs that use our products,
such as our HIV testing products. In international markets, we often sell our products to parties funded by such agencies. The level of
available government grants or funding is unpredictable, and certain organizations may not have their contracts renewed for funding.
Available funding may be affected by various factors including future economic conditions, legislative and regulatory developments,
political changes, civil unrest, changing public health priorities and changing priorities for research and development activities. Any
reduction or delay in government funding or change in organizational contracts could cause our customers to delay, reduce or forego
purchases of our products or cause short term or long term fluctuations in our product revenues through these channels.
Consolidation of our customers or the formation of group purchasing organisations could result in increased pricing pressure that
could adversely affect our operating results.
The health care industry has undergone significant consolidation resulting in increased purchasing leverage for customers and
consequently increased pricing pressures on our business. Additionally, some of our customers have become affiliated with group
purchasing organisations. Group purchasing organisations typically offer members price discounts on laboratory supplies and equipment
if they purchase a bundled group of one supplier’s products, which results in a reduction in the number of manufacturers selected to
supply products to the group purchasing organization and increases the group purchasing organization’s ability to influence its members’
buying decisions. Further consolidation among customers or their continued affiliation with group purchasing organizations may result
29
in significant pricing pressures and correspondingly reduce the gross margins of our business or may cause our customers to reduce their
purchases of our products, thereby adversely affecting our business, prospects, operating results or financial condition.
The trend towards managed care, together with healthcare reform of the delivery system in the United States and efforts to reform in
Europe, has resulted in increased pressure on healthcare providers and other participants in the healthcare industry to reduce selling
prices. Consolidation among healthcare providers and consolidation among other participants in the healthcare industry has resulted in
fewer, more powerful groups, whose purchasing power gives them cost containment leverage. In particular, there has been a
consolidation of laboratories. These industry trends and competitive forces place constraints on the levels of overall pricing, and thus
could have a material adverse effect on our gross margins for products we sell in clinical diagnostic markets.
Our long-term success depends upon the successful development and commercialization of new products.
Our long-term viability and growth will depend upon the successful discovery, development and commercialization of new and enhanced
products from our research and development (“R&D”) activities. In order to remain competitive, we are committed to significant
expenditures on R&D and the commercialization of new or enhanced products. The R&D process generally takes a significant amount
of time from product inception to commercial launch. However, there is no certainty that this investment in research and development
will yield technically feasible or commercially viable products. We may have to abandon a new or enhanced product during its
development phase after our investment of substantial time and money. During the fiscal years ended December 31, 2020, 2019 and
2018, we incurred US$6.9 million, US$9.6 million and US$9.9 million, respectively, in capitalised R&D expenses. We expect to
continue to incur significant costs related to our research and development activities.
Successful products require significant development and investment, including testing to demonstrate their performance capabilities,
cost-effectiveness or other benefits prior to commercialization. In addition, unless exempt, regulatory clearance or approval must be
obtained before our medical device products may be sold. Additional development efforts on these products may be required before we
are ready to submit applications for marketing authorisation to any regulatory authority. Regulatory authorities may not clear or approve
these products for commercial sale or may substantially delay or condition clearance or approval. In addition, even if a product is
successfully developed and all applicable regulatory clearances or approvals are obtained, there may be little or no market for the
product. Accordingly, if we fail to develop and gain commercial acceptance for our products, or if we have to abandon a new product
during its development phase, or if competitors develop more effective products or a greater number of successful new products,
customers may decide to use products developed by our competitors. This would result in a loss of revenues and adversely affect our
results of operations, cash flow and business.
Our future growth in the United States is dependent in part on Food and Drug Administration (“FDA”) clearance of products. If FDA
clearance is delayed or not achieved for these products, it could have a material impact on the future growth of our business. Similarly,
future growth outside of USA is dependent on clearance of products by the relevant regulatory authorities in those countries.
We may require future additional capital.
Our future liquidity and ability to meet our future capital requirements will depend on numerous factors, including, but not limited to,
the following:
• The costs and timing of expansion of sales and marketing activities;
• The timing and size of any repayment requirements for existing debt obligations;
• The timing and success of the commercial launch of new products;
• The extent to which we gain or expand market acceptance for existing, new or enhanced products;
• The costs and timing of the expansion of our manufacturing capacity;
• The success of our research and product development efforts;
• The time, cost and degree of success of conducting clinical trials and obtaining regulatory approvals;
• The magnitude of capital expenditures;
• Changes in existing and potential relationships with distributors and other business partners;
• The costs involved in obtaining and enforcing patents, proprietary rights and necessary licences;
• The costs and liability associated with patent infringement or other types of litigation;
• Competing technological and market developments; and
• The scope and timing of strategic acquisitions.
30
If additional financing is needed, we may seek to raise funds through the sale of equity or other securities or through bank borrowings.
There can be no assurance that financing through the sale of securities, bank borrowings or otherwise will be available to us on
satisfactory terms, or at all.
If our products cause or contribute to a death or a serious injury, or malfunction in certain ways, we will be subject to medical device
reporting regulations, which can result in voluntary corrective actions or agency enforcement actions.
We are also required to comply with the FDA’s Medical Device Reporting (“MDR”) requirements in the United States and comparable
regulations worldwide, such as the Health Products Regulatory Authority (“HPRA”). For example, under the FDA’s MDR regulations,
we are required to report to the FDA any incident in which our product may have caused or contributed to a death or serious injury or
in which our product malfunctioned and, if the malfunction were to recur, would likely cause or contribute to death or serious injury. In
addition, all manufacturers placing medical devices in European Union markets are legally bound to report any serious or potentially
serious incidents involving devices they produce or sell to the Competent Authority in whose jurisdiction the incident occurred.
Were this to happen to us, the relevant Competent Authority would file an initial report, and there would then be a further inspection or
assessment if there are particular issues. This would be carried out either by the Competent Authority or it could require that our Notified
Body, carry out the inspection or assessment.
We have reported MDRs in the past, and we anticipate that in the future it is likely that we may experience events that would require
reporting to the FDA pursuant to the MDR regulations. Any adverse event involving our products could result in future voluntary
corrective actions, or agency actions, such as inspection, mandatory recall or other enforcement action.
Any corrective action, whether voluntary or involuntary, as well as defending ourselves in a lawsuit, will require the dedication of our
time and capital, distract management from operating our business, and may harm our reputation and financial results.
We may be subject to liability resulting from our products or services.
We may be subject to claims for personal injuries or other damages if any of our products, services, or any product which is made with
the use or incorporation of any of our technologies, causes injury of any type or is found otherwise unsuitable during product testing,
manufacturing, marketing, sale or usage. There is no assurance that we would be successful in defending any product liability lawsuits
brought against us. Regardless of merit or eventual outcome, product liability claims could result in:
• Decreased demand for our products;
• Lost revenues;
• Damage to our image or reputation;
• Costs related to litigation;
• Diversion of management time and attention; and
• Incurrence of damages payable to plaintiffs.
We have global product liability insurance in place for our manufacturing subsidiaries up to a maximum of €6,500,000 (US$7,944,000)
for any one accident, limited to a maximum of €6,500,000 (US$7,944,000) in any one-year period of insurance and is subject to a
deductible. The Company also has professional indemnity insurance for its laboratory services business up to a maximum of
US$5,000,000 for each claim and aggregate limit and is subject to a deductible. There can be no assurance that our product liability
insurance is sufficient to protect us against liability that could have a material adverse effect on our business. In addition, although we
believe that we will be able to continue to obtain adequate coverage in the future, there is no assurance that we will be able to do so at
acceptable costs.
Our products may be subject to product recalls that could harm our reputation, business and financial results.
Manufacturers may, on their own initiative, initiate actions, including a non-reportable market withdrawal or a reportable product recall,
for the purpose of correcting a material deficiency, improving device performance, or for other reasons. Additionally, the FDA and
similar foreign health or governmental authorities have the authority to require an involuntary recall of commercialized products in the
event of material deficiencies or defects in design, manufacturing or labeling or in the event that a product poses an unacceptable risk
to health. In the case of the FDA, the authority to require a recall must be based on an FDA finding that there is a reasonable probability
that a device intended for human use would cause serious, adverse health consequences or death. A government-mandated or voluntary
recall by us or one of our distributors could occur as a result of component failures, manufacturing errors, modifications, design or
labeling defects or other deficiencies and issues. Recalls of any of our products would divert managerial and financial resources and
have an adverse effect on our financial condition and results of operations. The FDA requires that certain classifications of recalls be
reported to FDA within 10 working days after the recall is initiated.
31
Companies are required to maintain certain records of post-market actions, even if they determine such actions are not reportable to the
FDA. If we determine that certain actions do not require notification of the FDA, the FDA may disagree with our determinations and
require us to report those actions as recalls. A future recall announcement could harm our reputation with customers and negatively
affect our sales. In addition, the FDA could take enforcement action for failing to report the recalls when they were conducted or failing
to timely report or initiate a reportable product action. Further, depending on the corrective action we take to redress a product’s
deficiencies or defects, the FDA may require, or we may decide, that we will need to obtain new approvals or clearances before we may
market or distribute the corrected device. Seeking such approvals or clearances may delay our ability to replace the recalled devices in
a timely manner.
Failure to achieve our financial and strategic objectives could have a material adverse impact on our business prospects.
As a result of any number of risk factors identified herein, no assurance can be given that we will be successful in implementing our
financial and strategic objectives. In addition, the funds for research, clinical development and other projects have in the past come
partly from our business operations. If our business slows and we have less money available to fund research and development and
clinical programs, we will have to decide at that time which programs to cut, and by how much. Similarly, if adequate financial,
personnel, equipment or other resources are not available, we may be required to delay or scale back our business. Our operations will
be adversely affected if our total revenue and gross profits do not correspondingly increase or if our technology, product, clinical and
market development efforts are unsuccessful or delayed.
Furthermore, our failure to successfully introduce new or enhanced products and develop new markets could have a material adverse
effect on our business and prospects.
Global economic conditions may have a material adverse impact on our results.
Uncertainty in global economic conditions may continue for the foreseeable future and intensify. This uncertainty poses a risk to the
overall economy that could impact demand for our products, as well as our ability to manage normal commercial relationships with our
customers, suppliers and creditors, including financial institutions. Volatile economic conditions have adversely affected and could
continue to adversely affect our financial performance and condition or those of our customers and suppliers. These circumstances could
adversely affect our access to liquidity needed to conduct or expand our business or conduct future acquisitions, refinance existing debts,
or make other discretionary investments. Many of our customers rely on public funding provided by federal, state and local governments,
and this funding may be reduced or deferred as a result of economic conditions.
If global economic conditions deteriorate significantly, our business could be negatively impacted, including such areas as reduced
demand for our products from a slow-down in the general economy, supplier or customer disruptions resulting from tighter credit
markets and/or temporary interruptions in our ability to conduct day-to-day transactions through our financial intermediaries involving
the payment to or collection of funds from our customers, vendors and suppliers. These circumstances may adversely impact our
customers and suppliers, which, in turn, could adversely affect their ability to purchase our products or supply us with necessary
equipment, raw materials or components. Even with the improvement of economic conditions, it may take time for our customers and
suppliers to establish new budgets and return to normal purchasing and shipping patterns. We cannot predict the reoccurrence of any
economic slowdown or the strength or sustainability of the economic recovery.
Public health emergencies, epidemics or pandemics, such as the emergence and spread of the Covid‑19 pandemic, have the
potential to significantly impact our operations through a decrease in demand for our products, interruption to business and a
reduction in staff availability.
The Covid‑19 pandemic has had a material impact on the healthcare industry and specifically the medical diagnostics sector in which
we operate. The continued uncertainty around the global pandemic could have an adverse effect on our operating results, cash flows,
financial condition and/or prospects.
The global spread of Covid‑19 and the public healthcare measures implemented by governments, such as quarantines and the temporary
closure of businesses has led to and may continue to lead to fewer patients presenting themselves for medical check-ups resulting in a
fall in demand for certain of our products which was offset by increased demand within our Covid-19 related portfolio of products.
Furthermore, funding allocated to combatting Covid-19 may result in a reduction or a postponement in the funding available for other
diseases, conditions and disorders that our products are used to diagnose.
We operate in a labour‑intensive industry where employees’, contractors’ and customers’ activities can be adversely impacted by the
availability of people to produce, manufacture or install our products. Covid-19 lead to the temporary closure of our manufacturing sites
and associated furloughing of some staff. Furthermore, Covid-19 has reduced our ability to visits customers and suppliers and has
required some of our staff to work from home in line with public health measures. Any significant loss of employee resources for a
32
sustained period of time due to lockdown restrictions, self‑isolation or sickness as a result of a public health emergency could impact
our ability to produce, manufacture and deliver goods. Similarly, our customer facing activities could be adversely impacted by similar
employee availability issues.
The situation with the Covid‑19 pandemic remains fluid and uncertain at this time. While it is not possible to predict the full extent and
duration of any further impacts, there could be a period where demand for our Covid-19 related portfolio of products declines but the
revenues for our other, non-Covid related products remain below historical levels due to the pandemic. There is no certainty that we will
be successful in our efforts to mitigate against these risks posed by Covid-19.
We are highly dependent on our senior management team and other key employees, and the loss of one or more of these employees
or the inability to attract and retain qualified personnel as necessary could adversely affect our operations.
Our success is dependent to a large extent upon the contributions of certain key management personnel. Our key employees at
December 31, 2020 were Ronan O’Caoimh, our CEO and Chairman, Jim Walsh, Executive Director, and John Gillard, our
CFO/Executive Director. We may not be able to attract or retain a sufficient number of qualified employees in the future due to the
intense competition for qualified personnel among medical products and other life science businesses.
If we are not able to attract and retain the necessary personnel to accomplish our business objectives, we may experience constraints
that will adversely affect our ability to effectively manufacture, sell and market our products, to meet the demands of our strategic
partners in a timely fashion, or to support research, development and clinical programs. Although we believe we will be successful in
attracting and retaining qualified personnel, competition for experienced scientists and other personnel from numerous companies and
academic and other research institutions may limit our ability to do so on acceptable terms.
Significant interruptions in production at our principal manufacturing facilities and/or third-party manufacturing facilities would
adversely affect our business and operating results.
Products manufactured at our facilities in Bray, Ireland, Jamestown and Buffalo, New York, Kansas City, Missouri and Carlsbad,
California accounted for the majority of our revenues during the fiscal year ended December 31, 2020. Our global supply of these
products and services is dependent on the uninterrupted and efficient operation of these facilities. In addition, we currently rely on a
small number of third-party manufacturers to produce certain of our diagnostic products and product components.
If we do not negotiate long-term contracts, our suppliers will likely not be required to provide us with any guaranteed minimum
production levels. As a result, we cannot assure you that we will be able to obtain sufficient quantities of product in the future.
In addition, our reliance on third-party suppliers involves a number of risks, including, among other things:
• contract manufacturers or suppliers may fail to comply with regulatory requirements or make errors in manufacturing that
could negatively affect the efficacy or safety of our products or cause delays in shipments of our products;
• we or our contract manufacturers and suppliers may not be able to respond to unanticipated changes in customer orders, and
if orders do not match forecasts, we or our suppliers may have excess or inadequate inventory of materials and components;
• we or our contract manufacturers and suppliers may be subject to price fluctuations due to a lack of long-term supply
arrangements for key components;
• we or our contract manufacturers and suppliers may lose access to critical services and components, resulting in an
interruption in the manufacture, assembly and shipment of our systems;
• we may experience delays in delivery by our contract manufacturers and suppliers due to changes in demand from us or
their other customers;
• fluctuations in demand for products that our contract manufacturers and suppliers manufacture for others may affect their
ability or willingness to deliver components to us in a timely manner;
• our suppliers or those of our contract manufacturer may wish to discontinue supplying components or services to us for risk
management reasons;
• we may not be able to find new or alternative components or reconfigure our system and manufacturing processes in a
timely manner if the necessary components become unavailable; and
• our contract manufacturers and suppliers may encounter financial hardships unrelated to our demand, which could inhibit
their ability to fulfill our orders and meet our requirements.
The operations of our facilities or these third-party manufacturing facilities could be adversely affected by fire, power failures, natural
or other disasters, such as earthquakes, floods, pandemics, or terrorist threats. Although we carry insurance to protect against certain
business interruptions at our facilities, some pieces of manufacturing equipment are difficult to replace and could require substantial

33
replacement lead-time. There can be no assurance that such coverage will be adequate or that such coverage will continue to remain
available on acceptable terms, if at all.
If any of these risks materialize, it could significantly increase our costs and impact our ability to meet demand for our products. If we
are unable to satisfy commercial demand for our products in a timely manner, our ability to generate revenue would be impaired, market
acceptance of our products could be adversely affected, and customers may instead purchase or use our competitors’ products. In
addition, we could be forced to secure new or alternative contract manufacturers or suppliers. Securing a replacement contract
manufacturer or supplier could be difficult. The introduction of new or alternative manufacturers or suppliers also may require design
changes to our products that are subject to FDA and other regulatory clearances or approvals.
We may also be required to assess the new manufacturer’s compliance with all applicable regulations and guidelines, which could
further impede our ability to manufacture our products in a timely manner. As a result, we could incur increased production costs,
experience delays in deliveries of our products, suffer damage to our reputation, and experience an adverse effect on our business and
financial results. Any significant interruption in our or third-party manufacturing capabilities could materially and adversely affect our
operating results.
We are dependent on third-party suppliers for certain critical components and the primary raw materials required for our test kits.
The primary raw materials required for Trinity Biotech’s test kits consist of antibodies, antigens or other reagents, glass fibre and
packaging materials which are acquired from third parties. If our third-party suppliers are unable or unwilling to supply or manufacture
a required component or product or if they make changes to a component, product or manufacturing process or do not supply materials
meeting our specifications, we may need to find another source and/or manufacturer. This could require that we perform additional
development work.
Some of our products, which we acquire from third parties, are highly technical and are required to meet exacting specifications, and
any quality control problems that we experience with respect to the products supplied by third-party vendors could adversely and
materially affect our reputation, our attempts to complete our clinical trials or commercialization of our products and adversely and
materially affect our business, operating results and prospects. We may also need to obtain FDA or other regulatory authorisations for
the use of an alternative component or for certain changes to our products or manufacturing process. We may also have difficulty
obtaining similar components from other suppliers that are acceptable to the FDA or foreign regulatory authorities and the failure of our
suppliers to comply with strictly enforced regulatory requirements could expose us to regulatory action including, warning letters,
product recalls, termination of distribution, product seizures, or civil penalties. Completing that development and obtaining such
authorisations could require significant time and expense and we may not obtain such authorisations on a timely basis, or at all. The
availability of critical components and products from other third parties could also reduce our control over pricing, quality and timely
delivery. These events could either disrupt our ability to manufacture and sell certain of our products into one or more markets or
completely prevent us from doing so, and could increase our costs. Any such event could have a material adverse effect on our results
of operations, cash flow and business. Furthermore, since some of these suppliers are located outside of the United States, we are subject
to foreign export laws and United States import and customs regulations, which complicate and could delay shipments of components
to us.
Although Trinity Biotech does not plan to be dependent upon any one source for these critical components or raw materials, alternative
sources of antibodies with the characteristics and quality desired by Trinity Biotech may not be available. Such unavailability could
affect the quality of our products and our ability to meet orders for specific products.
Our inability to manufacture products in accordance with applicable specifications, performance standards or quality requirements
could adversely affect our business.
The materials and processes used to manufacture our products must meet detailed specifications, performance standards and quality
requirements to ensure our products will perform in accordance with their label claims, our customers’ expectations and applicable
regulatory requirements.
As a result, our products and the materials used in their manufacture or assembly undergo regular inspections and quality testing. Factors
such as defective materials or processes, mechanical failures, human errors, environmental conditions, changes in materials or
production methods by our vendors, and other events or conditions could cause our products or the materials used to produce or assemble
our products to fail inspections and quality testing or otherwise not perform in accordance with our label claims or the expectations of
our customers.
Any failure or delay in our ability to meet the applicable specifications, performance standards, quality requirements or customer
expectations could adversely affect our ability to manufacture and sell our products or comply with regulatory requirements. These
events could, in turn, adversely affect our revenues and results of operations.
34
Our revenues are highly dependent on a network of distributors worldwide.
We currently distribute our product portfolio through distributors in approximately 75 countries worldwide. Our continuing economic
success and financial security is dependent on our ability to secure effective channels of distribution on favourable trading terms with
suitable distributors.
The loss or termination of our relationship with these key distributors could significantly disrupt our existing business unless suitable
alternatives were quickly found or lost sales to one distributor are absorbed by another distributor. Finding a suitable alternative to a lost
or terminated distributor may pose challenges in our industry’s competitive environment, and another suitable distributor may not be
found on satisfactory terms, if at all. For instance, some distributors already have exclusive arrangements with our competitors, and
others do not have the same level of penetration into our target markets as our existing distributors. If total revenue from these or any of
our other significant distributors were to decrease in any material amount in the future or we are not successful in timely transitioning
business to new distributors, our business, operating results and financial condition could be materially and adversely affected.
Our success depends on our ability to service and support our products directly or in collaboration with our strategic partners.
To the extent that we or our strategic partners fail to maintain a high quality level of service and support for diagnostic products, there
is a risk that the perceived quality of our products will be diminished in the marketplace. Likewise, we may fail to provide the level,
quantity or quality of service expected by the marketplace. These risks have increased as a result of the public health restrictions put in
place due to Covid-19. This could result in slower adoption rates and lower than anticipated utilisation of our products which could have
a material adverse effect on our business, financial condition and results of operations.
Our ability to protect our information systems and electronic transmissions of sensitive data from data corruption, cyber-based
attacks, security breaches or privacy violations is critical to the success of our business.
We are highly dependent on information technology networks and systems, including the Internet, to securely process, transmit and
store electronic information, including personal information of our customers. Security breaches of this infrastructure, including physical
or electronic break-ins, computer viruses, malware attacks by hackers and similar breaches, can cause all or portions of our websites to
be unavailable, create system disruptions, shutdowns, erasure of critical data and software or unauthorised disclosure of confidential
information. We invest in security technology to protect our data against risks of data security breaches and cyber-attacks and we have
implemented solutions, processes, and procedures to help mitigate these risks, such as encryption, virus protection, security firewalls
and comprehensive information security and privacy policies. However, despite our security measures, our information technology and
infrastructure may be vulnerable to attacks by hackers or breached due to employee error, malfeasance or other disruptions. We have
been the victim of cyber-attacks but these have had no material impact on our operations. The age of our information technology systems,
as well as the level of our protection and business continuity or disaster recovery capability, varies from site to site, and there can be no
guarantee that any such plans, to the extent they are in place, will be effective. In addition, a security breach or privacy violation that
leads to disclosure of personal information, including but not limited to employee or consumer information (including personally
identifiable information or protected health information) could harm our reputation, compel us to comply with disparate state breach
notification laws and otherwise subject us to liability under laws that protect personal data, resulting in increased costs or loss of revenue.
If we are unable to prevent further security breaches or privacy violations or implement satisfactory remedial measures, our operations
could be disrupted, we may be subject to legal claims or proceedings, or we may suffer loss of reputation, financial loss and other
regulatory penalties because of lost or misappropriated information, including sensitive consumer data, which could have a material
adverse impact on our business, financial condition and results of operations. While we currently expend resources to protect against
cyber-attacks and security breaches, hackers and other cyber criminals are using increasingly sophisticated and constantly evolving
techniques, and we may need to expend additional resources to continue to protect against potential security breaches or to address
problems caused by such attacks or any breach of our safeguards. In addition, a data security breach could distract management or other
key personnel from performing their primary operational duties.
In addition, the interpretation and application of consumer and data protection laws in the United States, Europe and elsewhere are often
uncertain, contradictory and in flux. It is possible that these laws may be interpreted and applied in a manner that is inconsistent with
our data practices. If so, this could result in government-imposed fines or orders requiring that we change our data practices, which
could have an adverse effect on our business. Complying with these various laws could cause us to incur substantial costs or require us
to change our business practices in a manner adverse to our business.
Our sales and operations are subject to the risks of fluctuations in currency exchange rates.
A substantial portion of our operations are based in Ireland and Europe is one of our main sales territories. As a result, changes in the
exchange rate between the U.S. Dollar and the Euro can have significant effects on our results of operations. In addition, in markets
where we invoice in U.S. Dollars but where the local currency has weakened, we have been required to reduce our pricing in order to
preserve our competitiveness. We have an exposure to the Canadian Dollar through our two Canadian subsidiaries and to the Brazilian
35
Real through our Brazilian subsidiary. We also have revenues and costs denominated in British Sterling. The discontinued operation in
Sweden, Fiomi Diagnostics, also gives us a Swedish Krona exposure.
In the future, we may enter into hedging instruments to manage our currency exchange rate risk. However, our attempts to hedge against
these risks may not be successful. If we are unable to successfully hedge against unfavourable foreign currency exchange rate
movements, our consolidated financial results may be adversely impacted.
The large amount of intangible assets and goodwill recorded on our balance sheet may lead to significant impairment charges in the
future.
We regularly review our long-lived assets, including identifiable intangible assets and goodwill, for impairment. Goodwill and acquired
indefinite life intangible assets are subject to impairment review on an annual basis and whenever potential impairment indicators are
present. Other long-lived assets are reviewed when there is an indication that an impairment may have occurred. The amount of goodwill
and identifiable intangible assets on our consolidated balance sheet as of December 31, 2020 was US$34 million (2019: US$44 million)
(2018: US$53 million). In 2020, we recorded total impairment charges of intangible assets of US$15 million (2019: US$17 million)
(2018: US$19 million) as a result of our annual impairment review. We may record further significant impairment charges in the future
if there are changes in market conditions, a significant reduction in share price or other changes in the future outlook. In addition, we
may from time to time sell assets that we determine are not critical to our strategy or execution. Future events or decisions may lead to
asset impairments and/or related charges. Certain non-cash impairments may result from a change in our strategic goals, business
direction or other factors relating to the overall business environment. Any significant impairment charges could have a material adverse
effect on our results of operations.
Tax matters, including disagreements with taxing authorities, the changes in corporate tax rates and imposition of new taxes could
impact our results of operations and financial condition.
We are subject to regular reviews, examinations, and audits by tax authorities in a number of jurisdictions across the world with respect
to our taxes. Although we believe our tax estimates are reasonable, if a taxing authority disagrees with the positions we have taken, we
could face additional tax liability, including interest and penalties. There can be no assurance that payment of such additional amounts
upon final adjudication of any disputes will not have a material impact on our results of operations and financial position.
A significant portion of our business is located in the U.S. and is subject to income and other taxes in the U.S. and our operations, plans
and results are affected by tax and other initiatives. In December, 2017, the U.S. Government enacted comprehensive tax legislation
known as the Tax Cuts and Jobs Act. This legislation made broad and complex changes to the U.S. tax code, including but not limited
to reducing the corporate tax rate from 35% to 21%, requiring a one-time mandatory deemed repatriation of certain deferred foreign
earnings tax on and accelerating first year expensing of certain capital expenditures. The legislation also introduced new tax laws
affecting our taxable income, which includes, but is not limited to, a new provision designed to tax global intangible low taxed income,
limitations on the deductibility of certain executive compensation, creating a base erosion anti-abuse tax and modifying or repealing
many deductions and credits. The ultimate impacts of the Tax Cuts and Jobs Act may differ from the Company’s estimates due to
changes in the interpretations and assumptions made, as well as any forthcoming regulatory guidance. The changes to the tax code could
also affect our valuation of deferred tax assets and liabilities. Any such change in valuation would have a material impact on our income
tax expense and deferred tax balances.
Future acquisitions may be less successful than expected, not generate the expected benefits, disrupt our ongoing business, distract
our management, increase our expenses and adversely affect our business, and therefore, growth may be limited.
Trinity Biotech has historically grown organically and through the acquisition of, and investment in, other companies, product lines and
technologies. We may enter into strategic acquisitions or investments as a way to expand our business. These activities, and their impact
on our business, are subject to many risks, including the following:
• Suitable acquisitions or investments may not be found or consummated on terms or schedules that are satisfactory to us or
consistent with our objectives;
• The benefits expected to be derived from an acquisition may not materialize and could be affected by numerous factors,
such as regulatory developments, insurance reimbursement, general economic conditions and increased competition;
• We may be unable to successfully integrate an acquired company’s personnel, assets, management systems, products and/or
technology into our business;
• Worse than expected performance of an acquired business may result in the impairment of intangible assets;
• Acquisitions may require substantial expense and management time and could disrupt our business;
• We may not be able to accurately forecast the performance or ultimate impact of an acquired business;

36
• An acquisition and subsequent integration activities may require greater capital and other resources than originally
anticipated at the time of acquisition;
• An acquisition may result in the incurrence of unexpected expenses, the dilution of our earnings or our existing stockholders’
percentage ownership, or potential losses from undiscovered liabilities not covered by an indemnification from the seller(s)
of the acquired business;
• An acquisition may result in the loss of our or the acquired company’s key personnel, customers, distributors or suppliers;
• An acquisition of a foreign business may involve additional risks, including, but not limited to, foreign currency exposure,
liability or restrictions under foreign laws or regulations, and our inability to successfully assimilate differences in foreign
business practices or overcome language or cultural barriers; and
• Our ability to integrate future acquisitions may be adversely affected by inexperience in dealing with new technologies.
The occurrence of one or more of the above or other factors may prevent us from achieving all or a significant part of the benefits
expected from an acquisition or investment. This may adversely affect our financial condition, results of operations and ability to grow
our business or otherwise achieve our financial and strategic objectives.
The United Kingdom’s withdrawal from the European Union could potentially impact our supply chains and the market for our
products in the United Kingdom.
The United Kingdom (“UK”) formally left the European Union in January 2020 and entered a transition period, to December 31, 2020,
during which time the UK remained bound to the rules and regulations of the EU. A Trade and Cooperation Agreement was ratified by
the European Union in April 2021 and sets out the future trading relationship between the UK and the European Union covering areas
such as trade in goods and services. Uncertainties, however, remain over the challenges which could be posed by the operation of the
trading agreement with delays in the import and export of goods being experienced at UK ports as customs check and regulatory
procedures are carried out. Such checks could impact the performance of supply chains extending timelines and delaying supplier and
customer commitments, while imposing additional taxes and duties dependent on rules of origin. The uncertainty might continue to
create volatility for the Pound Sterling. Any significant fall in the value of the Pound Sterling against the US Dollar could adversely
impact consolidated results and net worth.
Increasing scrutiny and changing expectations from investors, lenders, customers and other market participants with respect to
our Environmental, Social and Governance, or ESG, policies may impose additional costs on us or expose us to additional risks.
Companies across all industries are facing increasing scrutiny relating to their ESG policies. Investors, lenders and other market
participants are increasingly focused on ESG practices and in recent years have placed increasing importance on the implications and
social cost of their investments. The increased focus and activism related to ESG may hinder our access to capital, as investors and
lenders may reconsider their capital investment allocation as a result of their assessment of our ESG practices. If we do not adapt to or
comply with investor, lender or other industry shareholder expectations and standards, which are evolving, or if we are perceived to
have not responded appropriately to the growing concern for ESG issues, regardless of whether there is a legal requirement to do so, we
may suffer from reputational damage and the business, financial condition and the price of our company’s shares could be materially
and adversely affected.
Risks Related to Government Regulations
Clinical trials necessary to support future premarket submissions will be expensive and will require enrollment of suitable patients
who may be difficult to identify and recruit. Delays or failures in our clinical trials will prevent us from commercializing any modified
or new products and will adversely affect our business, operating results and prospects.
Initiating and completing clinical trials necessary to support approval of future products under development, is time consuming and
expensive and the outcome uncertain. Moreover, the results of early clinical trials are not necessarily predictive of future results, and
any product we advance into clinical trials may not have favorable results in later clinical trials.
Conducting successful clinical studies will require the enrollment of patients who may be difficult to identify and recruit. Patient
enrollment in clinical trials and completion of patient participation and follow-up depends on many factors, including the size of the
patient population, the nature of the trial protocol, and the availability of appropriate clinical trial investigators. Patients may not
participate in our clinical trials if they choose to participate in contemporaneous clinical trials of competitive products. Continuing
public health measures against Covid-19 may increase the difficulty of conducting clinical trials.
37
Development of sufficient and appropriate clinical protocols to demonstrate safety and efficacy are required and we may not adequately
develop such protocols to support clearance and approval. Further, the FDA and/or other regulatory authorities may require us to submit
data on a greater number of patients than we originally anticipated and/or for a longer follow-up period or change the data collection
requirements or data analysis applicable to our clinical trials. Any challenges to patient enrollment may cause an increase in costs and
delays in the approval and attempted commercialization of our products or result in the failure of the clinical trial. In addition, despite
considerable time and expense invested in our clinical trials, FDA and/or other regulatory authorities may not consider our data adequate
to demonstrate safety and efficacy. Such increased costs and delays or failures could adversely affect our business, operating results and
prospects.
Our facilities and our clinical investigational sites operate under procedures that govern the conduct and management of FDA-regulated
clinical studies under 21 CFR Parts 50, 56 and 812, and Good Clinical Practices. Although the majority of our in-vitro diagnostic
(“IVD”) clinical studies meet the definition of exempted investigations under 21 Part 812 and are exempt from the Investigational Device
Exemption (“IDE”) regulations in 21 CFR Part 812, we are still required to meet the requirements of 21 CFR Parts 50 and 56 for
informed consent and Institutional Review Board (“IRB”) approval. FDA may conduct Bioresearch Monitoring (“BiMo”) inspections
of us and/or our clinical sites to assess compliance with FDA regulations, our procedures, and the clinical protocol. If the FDA were to
find that we or our clinical investigators are not operating in compliance with applicable regulations, we could be subject to the above
FDA enforcement action as well as refusal to accept all or part of our data in support of a 510(k) or PMA and/or we may need to conduct
additional studies.
In relation to World Health Organisation (WHO) qualification, our IVD clinical studies are required to meet all the requirements of the
TSS-1: Human Immunodeficiency Virus (HIV) rapid diagnostic tests for professional use. If we are not operating in compliance with
this regulation we could be subject to WHO enforcement action. In addition, our IVD clinical studies are required to meet the
requirements of:
• WMA Declaration of Helsinki – Ethical Principles for Medical Research Involving Human Subjects (2008);
• ICH Harmonised Guidelines - Integrated Addendum to ICH E6 (R2) Guideline for Good Clinical Practice (Nov 2016);
• ISO 20916:2019 In vitro diagnostic medical devices — Clinical performance studies using specimens from human subjects —
Good study practice;
• ISO 14155:2011: Clinical investigation of medical devices for human subjects – Good clinical practice.
If the third parties on whom we rely to conduct our pre-clinical studies and clinical trials and to assist in pre-clinical development
do not perform as contractually required or expected, we may not be able to obtain regulatory approval or commercialize our
products.
We may not have the ability to independently conduct our pre-clinical studies and clinical trials for our products and we may rely on
third parties, such as contract research organizations, medical institutions, clinical investigators and contract laboratories to conduct
such trials. If these third parties do not successfully carry out their contractual duties or regulatory obligations or meet expected
deadlines, if these third parties need to be replaced, or if the quality or accuracy of the data they obtain is compromised due to the failure
to adhere to our pre-clinical or clinical protocols or regulatory requirements or for other reasons, our pre-clinical development activities
or clinical trials may be extended, delayed, suspended or terminated, and we may not be able to obtain regulatory approval for, or
successfully commercialize, our products on a timely basis, if at all, and our business, operating results and prospects may be adversely
affected. Furthermore, our third-party clinical trial investigators may be delayed in conducting our clinical trials for reasons outside of
their control.
The results of our clinical trials may not support our product candidate claims.
Even if our clinical trials are completed as planned, we cannot be certain that their results will support our product candidate claims or
that the FDA or other regulatory authorities will agree with our conclusions regarding them. The clinical trial process may fail to
demonstrate that our product candidates are safe and effective for the proposed indicated uses, which could cause us to abandon a
product candidate and may delay development of others. Any delay or termination of our clinical trials will delay the filing of our
product submissions and, ultimately, our ability to commercialize our product candidates and generate revenues.
We may be subject to fines, penalties or injunctions if we are determined to be promoting the use of our products for unapproved or
“off-label” uses.
Our promotional materials must comply with FDA and other applicable laws and regulations. We believe that the specific uses for which
our products are marketed fall within the scope of the indications for use that have been cleared or approved by the FDA or other relevant
regulatory authorities. However, the FDA and/or the other relevant regulatory authorities could disagree and require us to stop promoting
our products for those specific uses until we obtain clearance or approval for them. In addition, if the FDA or other relevant regulatory
authorities determines that our promotional materials constitutes promotion of an unapproved use, it could demand that we modify our
38
promotional materials or subject us to regulatory or enforcement actions, including the issuance of an untitled letter, a warning letter,
injunction, seizure, civil fine and criminal penalties.
It is also possible that other federal, state or foreign enforcement authorities might take action if they consider our promotional materials
to constitute promotion of an unapproved use, which could result in significant fines or penalties under other statutory authorities, such
as laws prohibiting false claims for reimbursement. In that event, our reputation could be damaged and adoption of the products would
be impaired.
If the FDA were to modify its policy of enforcement discretion with respect to our laboratory developed tests, we could incur
substantial costs and delays associated with trying to obtain premarket clearance or other approvals.
Although the FDA has statutory authority to assure that medical devices are safe and effective for their intended uses, the FDA has
generally exercised its enforcement discretion and not enforced applicable regulations with respect to laboratory developed tests
(“LDTs”), although reagents, instruments, software or components provided by third parties and used to perform LDTs may be subject
to FDA regulation. The FDA defines the term “laboratory developed test” as an IVD test that is intended for clinical use and designed,
manufactured and used within a single laboratory. Until 2014, the FDA exercised enforcement discretion such that it did not enforce
provisions of the Food, Drug, and Cosmetic Act, or FDA Act, with respect to LDTs. In July 2014, due to the increased proliferation of
LDTs for complex diagnostic testing and concerns with several high-risk LDTs related to lack of evidentiary support for claims and
erroneous results, the FDA issued guidance that, when finalized, would adopt a risk-based framework that would increase FDA oversight
of LDTs. As part of this developing framework, FDA issued draft guidance in October 2014, informing Congress and manufacturers of
LDTs of its intent to collect information from laboratories regarding their current LDTs and newly developed LDTs through a
notification process. The FDA will use this information to classify LDTs and to prioritize enforcement of premarket review requirements
for categories of LDTs based on risk, using a public process. Specifically, the FDA plans to use advisory panels to provide
recommendations to the agency on LDT risks, classification and prioritization of enforcement of applicable regulatory requirements on
certain categories of LDTs, as appropriate.
We cannot provide any assurance that FDA regulation, including premarket review, will not be required in the future for any of our
LDTs, whether through additional guidance or regulations issued by the FDA, new enforcement policies adopted by the FDA or new
legislation enacted by Congress. It is possible that legislation will be enacted into law, regulations could be promulgated or guidance
could be issued by the FDA which may result in increased regulatory burdens for us to continue to offer our current LDTs or to develop
and introduce new LDTs. We cannot predict the timing or content of future legislation enacted, regulations promulgated or guidance
issued regarding LDTs, or how it will affect our business.
If FDA premarket review, including clearance or approval, is required for our current or future LDTs (either alone or together with
sample collection devices), products or services we may develop, or if we decide to voluntarily pursue FDA clearance or approval, we
may be forced to stop selling our LDTs while we work to obtain such FDA clearance or approval. Our business would be negatively
affected until such review was completed and clearance to market or approval was obtained. The regulatory process may involve, among
other things, successfully completing additional clinical studies and submitting premarket notification or filing a premarket approval
application with the FDA. If premarket review is required by the FDA or if we decide to voluntarily pursue FDA premarket review of
our LDTs, there can be no assurance that any tests, products or services we may develop in the future will be cleared or approved on a
timely basis, if at all, nor can there be assurance that labeling claims will be consistent with our current claims or adequate to support
continued adoption of for our LDTs. If our LDTs are allowed to remain on the market but there is uncertainty in the marketplace about
our tests, if we are required by the FDA to label them investigational and we cannot offer the LDTs for diagnostic purposes, or if labeling
claims, the FDA allows us to make are limited, orders may decline and adversely affect our results of operations, cash flow and business.
Ongoing compliance with FDA regulations would increase the cost of conducting our business, and subject us to heightened regulation
by the FDA and penalties for failure to comply with these requirements.
If we fail to maintain regulatory approvals and clearances, or are unable to obtain, or experience significant delays in obtaining,
regulatory clearances or approvals for our future products or product enhancements, our ability to commercially distribute and
market these products could suffer.
Our medical device products and operations are subject to rigorous government regulation in the United States by the FDA, and
numerous other federal, state and foreign governmental authorities, as well as and by comparable regulatory authorities in other
jurisdictions such as the Health Products Regulatory Authority (“HPRA”) in Ireland. In particular, we are subject to strict governmental
controls on the development, manufacture, labelling, storage, testing, advertising, promotion, marketing, distribution and import and
export of our products. In addition, we or our distributors are often required to register with and/or obtain clearances or approvals from
foreign governments or regulatory bodies before we can import and sell our products in foreign countries. The clearance and approval
process for our products, while variable across countries, is generally lengthy, time consuming, detailed and expensive.
39
The process of obtaining and maintaining regulatory clearances or approvals to market a medical device can be costly and time
consuming, and we may not be able to obtain these clearances or approvals on a timely basis, if at all. In particular, the FDA permits
commercial distribution of a new medical device only after the device has received clearance under Section 510(k) of the Federal Food,
Drug, and Cosmetic Act (“FDCA”), or is the subject of an approved premarket approval application (“PMA”) unless the device is
specifically exempt from those requirements. The FDA will clear marketing of a lower risk medical device through the 510(k) process
if the manufacturer demonstrates that the new product is substantially equivalent to other 510(k)-cleared products. High risk devices
deemed to pose the greatest risk, such as life-sustaining, life-supporting, or implantable devices, or devices not deemed substantially
equivalent to a previously cleared device, require the approval of a PMA.
The PMA process is more costly, lengthy and uncertain than the 510(k) clearance process. A PMA application must be supported by
extensive data, including, but not limited to, technical, preclinical, clinical trial, manufacturing and labeling data, to demonstrate to the
FDA’s satisfaction the safety and efficacy of the device for its intended use. The 510(k) clearance process usually takes from three to
12 months, but it can take longer. The process of obtaining PMA approval is much more costly and uncertain than the 510(k) clearance
process. It generally takes from one to three years, or even longer, from the time the PMA application is submitted to the FDA, until an
approval is obtained. There is no assurance that we will be able to obtain FDA clearance or approval for any of our new products on a
timely basis, or at all.
In the United States, many of our currently commercialized products have received pre-market clearance under Section 510(k) of the
FDCA. If the FDA requires us to go through a lengthier, more rigorous examination for future products or modifications to existing
products than we had expected, our product introductions or modifications could be delayed or cancelled, which could cause our sales
to decline. In addition, the FDA may determine that future products will require the more costly, lengthy and uncertain PMA process.
Although we currently market only one device pursuant to an approved PMA, the FDA may demand that we obtain a PMA prior to
marketing certain of our future products.
The FDA can delay, limit or deny clearance or approval of a device for many reasons, including:
• our ability to demonstrate to the FDA’s satisfaction that our products are safe and effective for their intended users;
• insufficient data from our pre-clinical studies and clinical trials to support clearance or approval, where required; and
• the failure of the manufacturing process or facilities we use to meet applicable requirements.
In addition, the FDA may change its clearance and approval policies, adopt additional regulations or revise existing regulations, or take
other actions which may prevent or delay approval or clearance of our products under development or impact our ability to modify our
currently cleared products on a timely basis. For example, in response to industry and healthcare provider concerns regarding the
predictability, consistency and rigor of the 510(k) regulatory pathway, the FDA initiated an evaluation of the program, and in January
2011, announced several proposed actions intended to reform the review process governing the clearance of medical devices. FDA’s
review of its 510(k) clearance process could result in additional changes to regulatory requirements or guidance documents which could
increase the costs of compliance, or restrict our ability to maintain current clearances. In addition, as part of the Food and Drug
Administration Safety and Innovation Act (“FDASIA”), Congress reauthorised the Medical Device User Fee Amendments with various
FDA performance goal commitments and enacted several “Medical Device Regulatory Improvements” and miscellaneous reforms
which are further intended to clarify and improve medical device regulation both pre- and post-clearance and approval. Furthermore,
regulatory authorities, including the FDA, may not agree with our interpretation of its policies and regulations which may lead to
enforced modifications, restrictions, discontinuation, etc. of some of our products, even if they were previously approved.
Our continued success is dependent on our ability to develop and market new or updated products, some of which are currently awaiting
clearance or approval from the applicable regulatory authorities. There is no certainty that such clearance or approval will be granted
or, even once granted, will not be revoked during the continuing review and monitoring process. Further, regulatory authorities, including
the FDA, may not approve or clear our future products for the indications that are necessary or desirable for successful
commercialization. A regulatory authority may impose requirements as a condition to granting a marketing authorisation, may include
significant restrictions or limitations as part of a marketing authorisation it grants and may delay or refuse to authorise a product for
marketing, even though a product has been authorised for marketing without restrictions or limitations in another country or by another
agency. Failure to receive clearance or approval for our new products, or commercially undesirable limitations on our clearances or
approvals, would have an adverse effect on our ability to expand our business. Modifications made to our products may invalidate
previously granted regulatory approvals which may lead to revised regulatory clearances, enforced modifications, restrictions,
discontinuation, etc. of some of our products.
Additionally, changes in the FDA’s review of certain clinical diagnostic products referred to as laboratory developed tests, which are
tests developed by a single laboratory for use only in that laboratory, could affect some of our customers who use our Life Science
instruments for laboratory developed tests. In the past, the FDA has chosen to not enforce applicable regulations and has not reviewed
such tests for approval. However, the FDA has issued draft guidance that it may begin enforcing its medical device requirements,
40
including premarket submission requirements, to such tests. Any delay in, or failure to receive or maintain, clearance or approval for
our products could prevent us from generating revenue from these products and adversely affect our business operations and financial
results.
Failure to comply with FDA or other regulatory requirements may require us to suspend production of our products or institute a
recall which could result in higher costs and a loss of revenues.
Even after we obtain clearance or approval for our medical devices, we are still subject to ongoing and extensive post market regulatory
requirements. Regulation by the FDA and other federal, state and foreign regulatory agencies, such as the HPRA in E.U., impacts many
aspects of our operations, and the operations of our suppliers and distributors, including manufacturing, labeling, packaging, adverse
event reporting, storage, advertising, promotion, marketing, record keeping, import and export. For example, the manufacture of medical
devices must comply with the FDA’s Quality System Regulation (“QSR”), which covers the methods and documentation of the design,
testing, production, control, quality assurance, labeling, packaging, sterilization, storage and shipping of our products. Our
manufacturing facilities and those of our suppliers and distributors are, or can be, subject to periodic regulatory inspections by the FDA
to assess compliance with the QSR and other regulations, and by other comparable foreign regulatory authorities with respect to similar
requirements in other jurisdictions. The FDA and foreign regulatory agencies may require post-marketing testing and surveillance to
monitor the performance of approved products or place conditions on any product clearances or approvals that could restrict the
commercial applications of those products. The failure by us or one of our suppliers to comply with applicable statutes and regulations
administered by the FDA and other regulatory bodies, or the failure to timely and adequately respond to any adverse inspectional
observations or product safety issues, could result in, among other things, any of the following enforcement actions:
• untitled letters, warning letters, fines, injunctions, consent decrees and civil penalties;
• unanticipated expenditures to address or defend such actions;
• customer notifications for repair, replacement, refunds;
• recall, detention or seizure of our products;
• operating restrictions or partial suspension or total shutdown of production;
• refusing or delaying our requests for 510(k) clearance or premarket approval of new products or modified products;
• operating restrictions;
• withdrawing 510(k) clearances on PMA approvals that have already been granted;
• refusal to grant export approval for our products; or
• criminal prosecution.
Other regulatory authorities have similar sanctions in their respective jurisdictions.
If any of these actions were to occur, they may harm our reputation and cause our product sales and profitability to suffer and may
prevent us from generating revenue. Furthermore, our key component suppliers may not currently be or may not continue to be in
compliance with all applicable regulatory requirements which could result in our failure to produce our products on a timely basis and
in the required quantities, if at all.
For example, in August 2020, our subsidiary received a Warning Letter from FDA following an inspection of our subsidiary’s Kansas
City, Missouri manufacturing facility that took place in January and February 2020. We are taking voluntary remediation actions to
correct the observations noted in the Warning Letter, and are in regular contact with the FDA regarding our remediation progress.
Even if regulatory clearance or approval of a product is granted, such clearance or approval may be subject to limitations on the intended
uses for which the product may be marketed and reduce our potential to successfully commercialize the product and generate revenue
from the product. If the FDA determines that our promotional materials, labeling, training or other marketing or educational activities
constitute promotion of an unapproved use, it could request that we cease or modify our training or promotional materials or subject us
to regulatory enforcement actions. It is also possible that other federal, state or foreign enforcement authorities might take action if they
consider our training or other promotional materials to constitute promotion of an unapproved use, which could result in significant
fines or penalties under other statutory authorities, such as laws prohibiting false claims for reimbursement.
In addition, we may be required to conduct costly post-market testing and surveillance to monitor the safety or effectiveness of our
products, and we must comply with medical device reporting requirements, including the reporting of adverse events and malfunctions
related to our products. Later discovery of previously unknown problems with our products, including unanticipated adverse events or
adverse events of unanticipated severity or frequency, manufacturing problems, or failure to comply with regulatory requirements such
as QSR, may result in changes to labeling, restrictions on such products or manufacturing processes, withdrawal of the products from
41
the market, voluntary or mandatory recalls, a requirement to repair, replace or refund the cost of any medical device we manufacture or
distribute, fines, suspension of regulatory approvals, product seizures, injunctions or the imposition of civil or criminal penalties which
would adversely affect our business, operating results and prospects.
In the ordinary course of business, we must frequently make subjective judgments with respect to compliance with applicable laws and
regulations. If regulators subsequently disagree with the manner in which we have sought to comply with these regulations, we could
be subjected to substantial civil and criminal penalties, as well as product recall, seizure or injunction with respect to the sale of our
products. The assessment of any civil and criminal penalties against us could severely impair our reputation within the industry and any
limitation on our ability to manufacture and market our products could have a material adverse effect on our business.
In addition to the FDA and other regulations described above, laws and regulations in some countries may restrict our ability to sell
products in those countries. While we intend to comply with any applicable restrictions, there is no guarantee we will be successful in
these efforts.
We must also comply with numerous laws relating to such matters as safe working conditions, manufacturing practices, environmental
protection, fire hazard control, disposal of hazardous substances and labour or employment practices. Compliance with these laws or
any new or changed laws regulating our business could result in substantial costs. Because of the number and extent of the laws and
regulations affecting our industry, and the number of governmental agencies whose actions could affect our operations, it is impossible
to reliably predict the full nature and impact of these requirements. To the extent the costs and procedures associated with complying
with these laws and requirements are substantial or it is determined that we do not comply, our business and results of operations could
be adversely affected.
Modifications to our products, may require new 510(k) clearances or pre-market approvals, or may require us to cease marketing or
recall the modified products until clearances or approvals are obtained.
Any modification to a 510(k)-cleared device in the United States that could significantly affect its safety or effectiveness, or that would
constitute a major change in its intended use, design or manufacture, requires a new 510(k) clearance or, possibly, approval of a PMA.
The FDA requires every manufacturer to make this determination in the first instance, but the FDA may review any manufacturer’s
decision. The FDA may not agree with our decisions regarding whether new clearances or approvals are necessary. If the FDA disagrees
with our determination and requires us to submit new 510(k) notifications or PMAs for modifications to previously cleared products for
which we conclude that new clearances or approvals are unnecessary, we may be required to cease marketing or to recall the modified
product until we obtain clearance or approval, and we may be subject to significant regulatory fines or penalties. Further, our products
could be subject to recall if the FDA determines, for any reason, that our products are not safe or effective. Any recall or FDA
requirement that we seek additional approvals or clearances could result in significant delays, fines, increased costs associated with
modification of a product, loss of revenue and potential operating restrictions imposed by the FDA.
For example, we obtained 510(k) clearance for our Primus Variant System for the separation and quantification of normal and abnormal
haemoglobin species as an aid in the diagnosis of haemoglobinopathies. The sample type used by this system was blood tubes. We
subsequently introduced two systems based on the original Primus Variant System and they were named as ultra² GeneSys Variant
System and ultra² Resolution Variant System. The primary focus of the GeneSys Variant System was on newborn screening using Dried
Blood Spots as the sample type, while the Resolution was intended for confirmatory testing on the adult population using blood tubes
as the sample type. We determined that these modifications to the indications for use to both systems were within our existing clearance
and did not require the submission of a new 510(k) notification. The FDA stated that the use of Dried Blood Spots with the ultra²
GeneSys Variant System was not part of the original submission and represented a new modified Intended Use. The FDA informed us
that it disagreed with our decision not to seek new 510(k) clearances for these modifications, and we filed new 510(k) notifications to
obtain clearance for these indications. The FDA rejected our filing on the basis that the predicate device chosen did not meet their
requirements. Additionally, the FDA asked us to withdraw the ultra² GeneSys Variant System from the market. A recall was conducted
and has since been closed.
Additionally, in August 2020, we received a Warning Letter from the FDA. In the Warning Letter, FDA stated that we had made
additional changes to the ultra² Resolution Variant System not covered within our existing 510(k). Accordingly, we conducted a
voluntary recall of the ultra² Resolution Variant System. We have developed the Premier Resolution as a successor instrument to the
ultra² Resolution Variant System and this has already been launched in various jurisdictions outside the United States. We expect to
submit a 510(k) application for this successor instrument in 2021 which, if approved, will allow us to market this instrument in the
United States.
Furthermore, the FDA’s ongoing review of the 510(k) program may make it more difficult for us to make modifications to any products
for which we obtain clearance, either by imposing more strict requirements on when a manufacturer must submit a new 510(k)
notification for a modification to a previously cleared product, or by applying more onerous review criteria to such submissions. For
example, in accordance with FDASIA, the FDA was obligated to prepare a report for Congress on the FDA’s approach for determining
when a new 510(k) clearance will be required for modifications or changes to a previously cleared device. The FDA issued this report
42
and indicated that manufacturers should continue to adhere to the FDA’s 1997 Guidance on this topic when making a determination as
to whether or not a new 510(k) clearance is required for a change or modification to a device. However, the practical impact of the
FDA’s continuing scrutiny of the 510(k) program remains unclear.
We face risks relating to our international sales and business operations, including regulatory risks, which could impact our current
business operations and growth strategy.
Our international sales and operations are subject to various United States and foreign laws and regulations relating to export controls
(including, without limitation, the U.S. Commerce Department’s Export Administration Regulations), economic sanctions (including,
without limitation, various sanctions regulations administered by the U.S. Treasury Department’s Office of Foreign Assets Control),
and anti-corruption (including, without limitation, the United States Foreign Corrupt Practice Act). Failure to comply with such
applicable laws and regulations could subject us to civil or criminal penalties, government investigations, debarment from export
privileges, and reputational harm, which could have a material adverse effect on our business.
Changes in healthcare regulation could affect our revenues, costs and financial condition.
In the United States in recent years, there have been numerous initiatives at the federal and state level for comprehensive reforms
affecting the payment for, the availability of and reimbursement for healthcare services. These initiatives have ranged from proposals
to fundamentally change federal and state healthcare reimbursement programs, including providing comprehensive healthcare coverage
to the public under government-funded programs, to minor modifications to existing programs. One example is the Patient Protection
and Affordable Care Act, the Federal healthcare reform law enacted in 2010 (the “Affordable Care Act”). Similar reforms may occur
internationally.
Third party payors, such as Medicare and Medicaid in the United States, have reduced their reimbursements for certain medical products
and services. Our business is impacted by the level of reimbursement available for clinical tests from third party payors. In the United
States payment for many diagnostic tests furnished to Medicare fee-for-service beneficiaries is made based on the Medicare Clinical
Laboratory Fee Schedule (CLFS), a fee schedule established and adjusted from time to time by the Centers for Medicare and Medicaid
Services (CMS). Some commercial payors are guided by the CLFS in establishing their reimbursement rates. Laboratories and clinicians
may decide not to order or perform certain clinical diagnostic tests if third party payments are inadequate, and we cannot predict whether
third party payors will offer adequate reimbursement for tests utilizing our products to make them commercially attractive. Legislation,
such as the Affordable Care Act, as amended by the Health Care and Education Reconciliation Act and the Middle Class Tax Relief and
Job Creation Act of 2012, has reduced the payments for clinical laboratory services paid under the CLFS. In addition, the Protecting
Access to Medicare Act of 2014 (PAMA) has made significant changes to the way Medicare will pay for clinical laboratory services,
which has further reduced reimbursement rates.
Legislative and regulatory bodies are likely to continue to pursue healthcare reform initiatives in many forms and may continue to reduce
funding in an effort to lower overall federal healthcare spending. The U.S. government recently enacted legislation that eliminated what
is known as the “individual mandate” under the Affordable Care Act and may enact other changes in the future. The ultimate content
and timing of any of these types of changes in other healthcare reform legislation and the resulting impact on us are impossible to predict.
If significant reforms are made to the healthcare system in the U.S., or in other jurisdictions, those reforms may increase our costs or
otherwise have an adverse effect on our financial condition and results of operations.
Our laboratory business could be harmed from the loss or suspension of a licence or imposition of a fine or penalties under, or future
changes in, the law or regulations of the Clinical Laboratory Improvement Amendments of 1988 (“CLIA”), or those of other state
or local agencies.
Our laboratory operated by our subsidiary Immco Diagnostics Inc. is subject to CLIA, which is administered by CMS and extends
federal oversight to virtually all clinical laboratories by requiring that they be certified by the federal government or by a federally-
approved accreditation agency. CLIA is designed to ensure the quality and reliability of clinical laboratories by, among other things,
mandating specific standards in the areas of personnel qualifications, administration, and participation in proficiency testing, patient test
management, quality control, quality assurance and inspections. Laboratories must undergo on-site surveys at least every two years,
which may be conducted by the Federal CLIA program or by a private CMS approved accrediting agency such as the College of
American Pathologists, among others. The sanction for failure to comply with CLIA requirements may be suspension, revocation or
limitation of a laboratory’s CLIA certificate, which is necessary to conduct business, as well as significant fines and/or criminal penalties.
We are also subject to regulation of laboratory operations under state clinical laboratory laws of New York and of certain other states
from where we accept specimens. State clinical laboratory laws may require that laboratories and/or laboratory personnel meet certain
qualifications, specify certain quality controls or require maintenance of certain records. For example, California requires that we
43
maintain a licence to conduct testing in California, and California law establishes standards for our day-to-day laboratory operations,
including the training and skill required of laboratory personnel and quality control.
In some respects, notably with respect to qualifications of testing personnel, California’s clinical laboratory laws impose more rigorous
standards than does CLIA. Certain other states, including Florida, Maryland, New York and Pennsylvania, require that we hold licences
to test specimens from patients residing in those states, and additional states may require similar licences in the future. Potential sanctions
for violation of these statutes and regulations include significant fines and the suspension or loss of various licences, certificates and
authorisations, which could adversely affect our business and results of operations.
We are also subject to various federal and state laws targeting fraud and abuse in the healthcare industry.
If we fail to comply with federal and state health care laws, including fraud and abuse, false claims, physician payment transparency
and privacy and security laws, we could face substantial penalties and our business, operations and financial condition could be adversely
affected. We are subject to anti-kickback laws, self-referral laws, false claims laws, and laws constraining the sales, marketing and other
promotional activities of manufacturers of medical devices by limiting the kinds of financial arrangements we may enter into with
physicians, hospitals, laboratories and other potential purchasers of our products. The laws that may affect our ability to operate include,
but are not limited to:
• the federal Anti-Kickback Statute, which prohibits, among other things, persons from knowingly and willfully soliciting,
receiving, offering or paying remuneration, directly or indirectly, in exchange for or to induce either the referral of an
individual for, or the purchase, order or recommendation of, any good or service for which payment may be made under
federal healthcare programs, such as the Medicare and Medicaid programs. A person or entity does not need to have actual
knowledge of the federal Anti-Kickback Statute or specific intent to violate it to have committed a violation; in addition,
the government may assert that a claim including items or services resulting from a violation of the federal Anti-Kickback
Statute constitutes a false or fraudulent claim for purposes of the False Claims Act;
• the Physician Self-Referral Law, also known as the “Stark Law”, which provides for strict liability for referrals by physicians
to entities with which they or their immediate family members have a financial arrangement for certain designated health
services, including clinical laboratory services provided by our CLIA-certified laboratory owned and operated by our
subsidiary Immco Diagnostics Inc., that are reimbursable by federal healthcare programs, unless an exception applies.
Penalties for violating the Stark Law include denial of payment, civil monetary penalties of up to fifteen thousand dollars
per claim submitted, and exclusion from federal health care programs, as well as a penalty of up to one-hundred thousand
dollars for attempts to circumvent the law;
• federal false claims laws which prohibit, among other things, individuals or entities from knowingly presenting, or causing
to be presented, claims for payment from Medicare, Medicaid or other federal third-party payers that are false or fraudulent.
Suits filed under the False Claims Act, known as “qui tam” actions, can be brought by any individual on behalf of the
government and such individuals, commonly known as “whistleblowers”, may share in any amounts paid by the entity to
the government in fines or settlement. When an entity is determined to have violated the False Claims Act, it may be required
to pay up to three times the actual damages sustained by the government, plus civil penalties for each separate false claim.
Often, to avoid the threat of treble damages and penalties under the False Claims Act, which in 2020 were $11,665 to
$23,331 per false claim, companies will resolve allegations in a settlement without admitting liability to avoid the potential
treble damages. Any such settlement could materially affect our business, financial operations, and reputation;
• the federal Civil Monetary Penalties Law, which prohibits, among other things, offering or transferring remuneration to a
federal healthcare beneficiary that a person knows or should know is likely to influence the beneficiary’s decision to order
or receive items or services reimbursable by the government from a particular provider or supplier;
• federal criminal laws that prohibit executing a scheme to defraud any federal healthcare benefit program or making false
statements relating to healthcare matters. Similar to the federal Anti-Kickback Statute, a person or entity does not need to
have actual knowledge of the statute or specific intent to violate it to have committed a violation;
• the federal Health Insurance Portability and Accountability Act of 1996, as amended by the Health Information Technology
for Economic and Clinical Health Act, which governs the conduct of certain electronic healthcare transactions and protects
the security and privacy of protected health information;
• the federal Physician Payment Sunshine Act, which requires manufacturers of drugs, devices, biologics and medical supplies
for which payment is available under Medicare, Medicaid or the Children’s Health Insurance Program (with certain
exceptions) to report annually to the Centers for Medicare & Medicaid Services (“CMS”), information related to payments
or other “transfers of value” made to physicians (defined to include doctors, dentists, optometrists, podiatrists and
chiropractors) and teaching hospitals, and requires applicable manufacturers to report annually to the government ownership
and investment interests held by the physicians described above and their immediate family members and payments or other
“transfers of value” to such physician owners. Manufacturers are required to submit reports to CMS by the 90th day of each

44
calendar year. We cannot assure you that we have and will successfully report all transfers of value by us, and any failure
to comply could result in significant fines and penalties. Failure to submit the required information may result in civil
monetary penalties up to an aggregate of $150,000 per year (and up to an aggregate of $1 million per year for “knowing
failures”) for all payments, transfers of value or ownership or investment interests not reported in an annual submission,
and may result in liability under other federal laws or regulations;
• federal and state laws governing the certification and licensing of clinical laboratories, including operational, personnel and
quality requirements designed to ensure that testing services are accurate and timely, and federal and state laws governing
the health and safety of clinical laboratory employees;
• the U.S. Foreign Corrupt Practices Act, or the FCPA, which prohibits corporations and individuals from paying, offering to
pay or authorising the payment of anything of value to any foreign government official, government staff member, political
party or political candidate in an attempt to obtain or retain business or to otherwise influence a person working in an official
capacity; the UK Bribery Act, which prohibits both domestic and international bribery, as well as bribery across both public
and private sectors; and bribery provisions contained in the German Criminal Code, which makes the corruption and
corruptibility of physicians in private practice and other healthcare professionals a criminal offense; and
• analogous state and foreign law equivalents of each of the above federal laws, such as anti-kickback and false claims laws
which may apply to items or services reimbursed by any payor, including commercial insurers; state laws that require device
companies to comply with the industry’s voluntary compliance guidelines and the applicable compliance guidance
promulgated by the federal government or otherwise restrict payments that may be made to healthcare providers and other
potential referral sources; state laws that require device manufacturers to report information related to payments and other
transfers of value to physicians and other healthcare providers or marketing expenditures; and state laws governing the
privacy and security of health information in certain circumstances, many of which differ from each other in significant
ways and may not have the same effect, thus complicating compliance efforts.
Because of the breadth of these laws and the narrowness of the statutory exceptions and safe harbours available under such laws, it is
possible that some of our business activities, including our relationships with physicians and other healthcare providers, some of whom
may recommend, purchase and/or order our tests, our sales and marketing efforts and certain arrangements with customers, including
those where we provide our instrumentation for free in exchange for minimum purchase requirements of our reagents, and our billing
and claims processing practices, could be subject to challenge under one or more of such laws. By way of example, some of our
consulting arrangements with physicians do not meet all of the criteria of the personal services safe harbour under the federal Anti-
Kickback Statute. Accordingly, they do not qualify for safe harbour protection from government prosecution. A business arrangement
that does not substantially comply with a safe harbour, however, is not necessarily illegal under the Anti-Kickback Statute, but may be
subject to additional scrutiny by the government. We are also exposed to the risk that our employees, independent contractors, principal
investigators, consultants, vendors and distributors may engage in fraudulent or other illegal activity. Any action against us for violation
of these laws, even if we successfully defend against it, could cause us to incur significant legal expenses and divert our management’s
attention from the operation of our business.
To enforce compliance with the federal laws, the U.S. Department of Justice (“DOJ”), has recently increased its scrutiny of interactions
between health care companies and health care providers, which has led to a number of investigations, prosecutions, convictions and
settlements in the health care industry. Dealing with investigations can be time and resource consuming and can divert management’s
attention from the business. In addition, settlements with the DOJ or other law enforcement agencies have forced healthcare providers
to agree to additional compliance and reporting requirements as part of a consent decree or corporate integrity agreement. Any such
investigation or settlement could increase our costs or otherwise have an adverse effect on our business.
Many of the existing requirements are new and have not been definitively interpreted by state authorities or courts, and available
guidance is limited. In addition, changes in or evolving interpretations of these laws, regulations, or administrative or judicial
interpretations, may require us to change our business practices or subject our business practices to legal challenges, which could have
a material adverse effect on our business, financial condition and results of operations.
We have not yet developed a comprehensive compliance program that establishes internal controls to facilitate adherence to the rules
and program requirements to which we are or may become subject. Although the development and implementation of such compliance
programs can mitigate the risk of investigation, prosecution, and penalties assessed for violations of these laws, or any other laws that
may apply to us, the risks cannot be entirely eliminated.
If our operations are found to be in violation of any of the laws described above or any other laws and regulations that apply to us, we
could receive adverse publicity, face enforcement action and be subject to penalties, including civil and criminal penalties, damages,
fines, the curtailment or restructuring of our operations, the exclusion from participation in federal and state healthcare programs and
imprisonment, any of which could adversely affect our ability to operate our business and our results of operations.
45
Compliance with regulations governing public company corporate governance and reporting is complex and expensive.
Many laws and regulations impose obligations on public companies, which have increased the scope, complexity and cost of corporate
governance, reporting and disclosure practices. Our implementation of certain aspects of these laws and regulations has required and
will continue to require substantial management time and oversight and may require us to incur significant additional accounting and
legal costs. We continually evaluate and monitor developments with respect to new and proposed rules and cannot predict or estimate
the ultimate amount of additional costs we may incur or the timing of such costs. These laws and regulations are also subject to varying
interpretations, in many cases due to their lack of specificity, and as a result, their application in practice may evolve over time as new
guidance is provided by regulatory and governing bodies. This could result in continuing uncertainty regarding compliance matters and
higher costs necessitated by ongoing revisions to disclosure and governance practices. Although we are committed to maintaining high
standards of corporate governance and public disclosure, if we fail to comply with any of these requirements, legal proceedings may be
initiated against us, which may adversely affect our business.
Risks Related to Our Intellectual Property
We may be unable to protect or obtain proprietary rights that we utilise or intend to utilise.
In developing and manufacturing our products, we employ a variety of proprietary and patented technologies. In addition, we have
licenced, and expect to continue to licence, various complementary technologies and methods from academic institutions and public and
private companies. We cannot provide any assurance that the technologies that we own or licence provide protection from competitive
threats or from challenges to our intellectual property. In addition, we cannot provide any assurances that we will be successful in
obtaining licences or proprietary or patented technologies in the future, or that licences granted to us by third parties will not be granted
to other third parties who could potentially compete with us.
Filing, prosecuting and defending patents covering our current and future products throughout the world would be prohibitively
expensive. Competitors may use our technologies in jurisdictions where we have not obtained patent protection to develop their own
products and, further, may export otherwise infringing products to territories where we may obtain patent protection, but where patent
enforcement is not as strong as that in the United States. These products may compete with our products in jurisdictions where we do
not have any issued or licenced patents and any future patent claims or other intellectual property rights may not be effective or sufficient
to prevent them from so competing.
The scope of the patent protection we obtain may not be sufficiently broad to compete effectively in our markets; our patent
applications could be rejected or the existing patents could be challenged; and trade secrets and confidential know-how could be
obtained by competitors.
Trinity Biotech currently owns 5 U.S. patents with remaining patent lives varying from between less than 1 year and less than 12 years.
We may fail to identify patentable aspects of our research and development output before it is too late to obtain patent protection. The
patent applications that we own, or in-licence, may fail to result in issued patents with claims that cover our current products or any
future products in the United States or in other foreign countries. There is no assurance that all of the potentially relevant prior art
relating to our patents and patent applications has been found, which can invalidate a patent or prevent a patent from issuing from a
pending patent application.
We can provide no assurance that third parties will not challenge the validity, enforceability or scope of the patents Trinity Biotech may
apply for, or obtain, which may result in such patents being narrowed, invalidated, or held unenforceable. Any successful opposition to
these patents or any other patents owned by or licenced to us could deprive us of rights necessary for the successful commercialization
of any products covered by those patents.
Further, if we encounter delays in regulatory approvals, the period of time during which we could market a product under patent
protection could be reduced. We can provide no assurance that our patents will continue to be commercially valuable.
Trade secrets and confidential know-how are important to our scientific and commercial success. Although we seek to protect our
proprietary information through confidentiality agreements and other contracts, we can provide no assurance that others will not
independently develop the same or similar information or gain access to our proprietary information.
Obtaining and maintaining our patent protection depends on compliance with various procedural, document submission, fee
payment and other requirements imposed by governmental patent agencies, and our patent protection could be reduced or eliminated
for non-compliance with these requirements.
Periodic maintenance fees on any issued patent are due to be paid to the United States Patent and Trademark Organization (“USPTO”)
and other foreign patent agencies in several stages over the lifetime of the patent. The USPTO and various foreign national or
46
international patent agencies require compliance with a number of procedural, documentary, fee payment and other similar provisions
during the patent application process. While an inadvertent lapse can in many cases be cured by payment of a late fee or by other means
in accordance with the applicable rules, there are situations in which noncompliance can result in abandonment or lapse of the patent or
patent application, resulting in partial or complete loss of patent rights in the relevant jurisdiction. Non-compliance events that could
result in abandonment or lapse of patent rights include, but are not limited to, failure to timely file national and regional stage patent
applications based on our international patent application, failure to respond to official actions within prescribed time limits, non-
payment of fees and failure to properly legalise and submit formal documents. If we or our licensors fail to maintain the patents and
patent applications covering our current or future products, our competitors might be able to enter the market, which would have an
adverse effect on our business.
Changes in patent law could diminish the value of patents in general, thereby impairing our ability to protect our products.
Depending on actions by the U.S. Congress, the federal courts, and the USPTO, the laws and regulations governing patents could change
in unpredictable ways that would weaken our ability to obtain new patents or to enforce patents that we have licenced or that we might
obtain in the future. Similar changes could happen to patent laws outside of USA which would have the same consequences.
For example, the United States has enacted and implemented wide-ranging patent reform legislation, which could increase the
uncertainties and costs surrounding the prosecution of our patent applications and the enforcement or defence of our issued patents. On
September 16, 2011, the Leahy-Smith America Invents Act, or the Leahy-Smith Act, was signed into law. The Leahy-Smith Act includes
a number of significant changes to United States patent law. These include provisions that affect the way patent applications are
prosecuted and may also affect patent litigation. The United States Patent Office developed regulations and procedures to govern
administration of the Leahy-Smith Act, and many of the substantive changes to patent law associated with the Leahy-Smith Act, and in
particular, the first to file provisions, only became effective on March 16, 2013. Accordingly, it is not clear what, if any, impact the
Leahy-Smith Act will have on the operation of our business. However, the Leahy-Smith Act and its implementation could increase the
uncertainties and costs surrounding the prosecution of our patent applications and the enforcement or defence of our issued patents, all
of which could have an adverse effect on our business and financial condition.
Additionally, the U.S. Supreme Court has ruled on several patent cases in recent years, either narrowing the scope of patent protection
available in certain circumstances or weakening the rights of patent owners in certain situations. In addition to increasing uncertainty
with regard to our ability to obtain patents in the future, this combination of events has created uncertainty with respect to the value of
patents, once obtained.
Product infringement claims by other companies could result in costly disputes and could limit our ability to sell our products.
Litigation over intellectual property rights is prevalent in the diagnostic industry, including patent infringement lawsuits, interferences,
derivation and administrative law proceedings, inter party review, and post-grant review before the USPTO, as well as oppositions and
similar processes in foreign jurisdictions.
As the market for diagnostics continues to grow and the number of participants in the market increases, we may increasingly be subject
to patent infringement claims. It is possible that a third-party may claim infringement against us. For example, because patent
applications can take many years to issue, there may be currently pending patent applications which may later result in issued patents
that our products may infringe. Defence of these claims, regardless of their merit, would involve substantial litigation expense and would
be a substantial diversion of managerial and financial resources from our business. Parties making claims against us may obtain
injunctive or other equitable relief, which could effectively block our ability to further develop and commercialise one or more of our
products. The pendency of any litigation may cause our distributors and customers to reduce or terminate purchases of our products. If
found to infringe, we may have to pay substantial damages, including treble damages and attorneys’ fees for willful infringement, obtain
one or more licences from third parties, pay royalties or redesign our affected products, which may be impossible or require substantial
time and monetary expenditure. Any substantial loss resulting from such a claim could cause our revenues to decrease and have a
material adverse effect on our profitability, and the damage to our reputation in the industry could have a material adverse effect on our
business.
If we need to obtain a licence as a result of litigation, we cannot predict whether any such licence would be available at all or whether
it would be available on commercially reasonable terms. Furthermore, even in the absence of litigation, we may need to obtain licences
from third parties to advance our research or allow commercialisation of our products. We may fail to obtain any of these licences at a
reasonable cost or on reasonable terms, if at all. In that event, we would be unable to further develop and commercialise one or more of
our products, which could harm our business significantly.
47
We may be involved in lawsuits to enforce our patents, the patents of our licensors or our other intellectual property rights, which
could be expensive, time consuming and unsuccessful.
Competitors may infringe or otherwise violate our patents, the patents of our licensors or our other intellectual property rights. To
counter infringement or unauthorised use, we may be required to file legal claims, which can be expensive and time-consuming. In
addition, in an infringement proceeding, a court may decide that a patent of ours or our licensors is not valid or is unenforceable, or may
refuse to stop the other party from using the technology at issue on the grounds that our patents do not cover the technology in question.
An adverse result in any litigation or defence proceedings could put one or more of our patents at risk of being invalidated or interpreted
narrowly and could put our patent applications at risk of not issuing. The initiation of a claim against a third party may also cause the
third party to bring counter claims against us such as claims asserting that our patents are invalid or unenforceable. In patent litigation
in the United States, defendant counterclaims alleging invalidity or unenforceability are commonplace. Grounds for a validity challenge
could be an alleged failure to meet any of several statutory requirements, including lack of novelty, obviousness, non-enablement or
lack of statutory subject matter. Grounds for an unenforceability assertion could be an allegation that someone connected with
prosecution of the patent withheld relevant material information from the USPTO, or made a materially misleading statement, during
prosecution. Third parties may also raise similar validity claims before the USPTO in post-grant proceedings such as ex parte re-
examinations, inter partes review, or post-grant review, or oppositions or similar proceedings outside the United States, in parallel with
litigation or even outside the context of litigation. The outcome following legal assertions of invalidity and unenforceability is
unpredictable.
We cannot be certain that there is no invalidating prior art, of which we and the patent examiner were unaware during prosecution. For
the patents and patent applications that we have licenced, we may have limited or no right to participate in the defence of any licenced
patents against challenge by a third party. If a defendant were to prevail on a legal assertion of invalidity or unenforceability, we would
lose at least part, and perhaps all, of any future patent protection on our current or future products. Such a loss of patent protection could
harm our business.
We may not be able to prevent, alone or with our licensors, misappropriation of our intellectual property rights, particularly in countries
where the laws may not protect those rights as fully as in the United States. Our business could be harmed if in litigation the prevailing
party does not offer us a licence on commercially reasonable terms. Any litigation or other proceedings to enforce our intellectual
property rights may fail, and even if successful, may result in substantial costs and distract our management and other employees.
Furthermore, because of the substantial amount of discovery required in connection with intellectual property litigation, there is a risk
that some of our confidential information could be compromised by disclosure during this type of litigation. There could also be public
announcements of the results of hearings, motions or other interim proceedings or developments. If securities analysts or investors
perceive these results to be negative, it could have an adverse effect on the price of our ADSs.
Risks Related to Ownership of our ADSs
We are a foreign private issuer under the rules and regulations of the SEC and are therefore exempt from a number of rules under
the Exchange Act and are permitted to file less information with the SEC than a domestic U.S. reporting company, which reduces
the level and amount of disclosure that you receive.
As a foreign private issuer under the Exchange Act, we are exempt from certain rules under the Exchange Act, including the proxy rules,
which impose certain disclosure and procedural requirements for proxy solicitations. Moreover, we are not required to file periodic
reports and financial statements with the SEC as frequently or as promptly as domestic U.S. companies with securities registered under
the Exchange Act; and are not required to comply with Regulation FD, which imposes certain restrictions on the selective disclosure of
material information. In addition, our officers, directors and principal shareholders are exempt from the reporting and “short-swing”
profit recovery provisions of Section 16 of the Exchange Act and the rules under the Exchange Act with respect to their purchases and
sales of our Ordinary Shares. Accordingly, you receive less information about our company than you would receive about a domestic
U.S. company, and are afforded less protection under the U.S. federal securities laws than you would be afforded in holding securities
of a domestic U.S. company.
As a foreign private issuer whose ADSs are listed on the NASDAQ Global Market, we are permitted to follow certain home country
corporate governance practices instead of certain requirements of the NASDAQ Stock Market Rules. Among other things, as a foreign
private issuer we may also follow home country practice with regard to, the composition of the board of directors, director nomination
procedure, compensation of officers and quorum at shareholders’ meetings. In addition, we may follow our home country law, instead
of the NASDAQ Stock Market Rules, which require that we obtain shareholder approval for certain dilutive events, such as for the
establishment or amendment of certain equity based compensation plans, an issuance that will result in a change of control of the
48
company, certain transactions other than a public offering involving issuances of a 20% or more interest in the company and certain
acquisitions of the stock or assets of another company. Accordingly, our shareholders may not be afforded the same protection as
provided under NASDAQ’s corporate governance rules. In addition, as foreign private issuer, we are not required to file quarterly
reviewed financial statements. A foreign private issuer that elects to follow a home country practice instead of such requirements must
submit to NASDAQ in advance a written statement from an independent counsel in such issuer’s home country certifying that the
issuer’s practices are not prohibited by the home country’s laws.
We may be classified as a passive foreign investment company, or PFIC, which would subject our U.S. investors to adverse tax
rules.
U.S. holders of our ADSs may face income tax risks. Based on the composition of our income, assets (including the value of our
goodwill, going-concern value or any other unbooked intangibles, which may be determined based on the price of the ordinary shares),
and operations, we believe we will not be classified as a “passive foreign investment company”, or PFIC, for the 2020 taxable year.
However, because PFIC status is based on our income, assets and activities for the entire taxable year, it is not possible to determine
whether we will be characterized as a PFIC for our current taxable year or future taxable years until after the close of the applicable
taxable year. Moreover, we must determine our PFIC status annually based on tests that are factual in nature, and our status in the current
year and future years will depend on our income, assets and activities in each of those years and, as a result, cannot be predicted with
certainty as of the date hereof. Furthermore, fluctuations in the market price of our ADSs may cause our classification as a PFIC for the
current or future taxable years to change because the aggregate value of our assets for purposes of the asset test, including the value of
our goodwill and unbooked intangibles, generally will be determined by reference to the market price of our shares from time to time
(which may be volatile). The IRS or a court may disagree with our determinations, including the manner in which we determine the
value of our assets and the percentage of our assets that are passive assets under the PFIC rules. Therefore, there can be no assurance
that we will not be a PFIC for the current taxable year or for any future taxable year. Our treatment as a PFIC could result in a reduction
in the after-tax return to U.S. Holders of our ADSs and would likely cause a reduction in the value of such shares. A foreign corporation
will be treated as a PFIC for U.S. federal income tax purposes if either (1) at least 75% of its gross income for any taxable year consists
of certain types of “passive income,” or (2) at least 50% of the average value of the corporation’s gross assets produce, or are held for
the production of, such “passive income.” For purposes of these tests, “passive income” includes dividends, interest, gains from the sale
or exchange of investment property and rents and royalties other than rents and royalties that are received from unrelated parties in
connection with the active conduct of a trade or business. If we are treated as a PFIC, U.S. Holders of ADSs would be subject to a
special adverse U.S. federal income tax regime with respect to the income derived by us, the distributions they receive from us, and the
gain, if any, they derive from the sale or other disposition of their ADSs.
The market price of our ADSs has been, and may continue to be, highly volatile, and such volatility could cause the market price of
our ADSs to decrease and could cause you to lose some or all of your investment in our ADSs.
The stock market in general and the market prices of the ADSs on Nasdaq, in particular, are or will be subject to fluctuation, and changes
in these prices may be unrelated to our operating performance. During the first half of 2021, the market price of our ADSs fluctuated
from a high of $6.64 per ADS to a low of $2.77 per ADS, and the price of our ADSs continues to fluctuate. We anticipate that the market
prices of our securities will continue to be subject to wide fluctuations. The market price of our securities may be subject to a number
of factors, including:
● announcements of new products by us or others;
● announcements by us of significant acquisitions, strategic partnerships, in-licensing,
joint ventures or capital commitments;
● the developments of the businesses and projects of our various subsidiaries;
● expiration or terminations of licences, research contracts or other collaboration agreements;
● public concern as to the safety of the products we sell;
● the volatility of market prices for shares of companies with whom we compete;
● developments concerning intellectual property rights or regulatory approvals;
● variations in our and our competitors’ results of operations;
49
● changes in revenues, gross profits and earnings announced by us;
● changes in estimates or recommendations by securities analysts, if the ADSs are covered by analysts;
● fluctuations in the share price of our publicly traded subsidiaries;
● changes in government regulations or patent decisions; and
● general market conditions and other factors, including factors unrelated to our operating performance.
These factors may materially and adversely affect the market price of our securities and result in substantial losses by our investors.
We expect we will need additional capital in the future. If additional capital is not available, we may not be able to continue to operate
our business pursuant to our business plan or we may have to discontinue our operations entirely.
We expect we will require additional capital in the future. If we continue to incur losses or be called upon to repurchase our Exchangeable
Notes we will need significant additional financing, which we may seek through a combination of private and public equity offerings,
debt financings, and asset sales, etc. To the extent that we raise additional capital through the sale of equity or convertible debt securities,
the ownership interest of our shareholders will be diluted, and the terms of any such offerings may include liquidation or other
preferences that may adversely affect the then existing shareholders rights. Debt financing, if available, would result in increased fixed
payment obligations and may involve agreements that include covenants limiting or restricting our ability to take specific actions such
as incurring debt or making capital expenditures. If we raise additional funds through collaboration, strategic alliance or licensing
arrangements with third parties, we may have to relinquish valuable rights to our technologies, future revenue streams or product
candidates, or grant licences on terms that are not favorable to us.
Future sales of our ADSs could reduce the market price of the ADSs.
Substantial sales of our ADSs may cause the market price of our ADSs to decline. Sales by us or our security holders of substantial
amounts of our ADSs, or the perception that these sales may occur in the future, could cause a reduction in the market price of our
ADSs.
The issuance of any additional ADSs, or any securities that are exercisable for or convertible into our ADSs, may have an adverse effect
on the market price of our ADSs and will have a dilutive effect on our existing holders of ADSs.
The conversion of our outstanding employee share options would dilute the ownership interest of existing shareholders.
The total share options exercisable at December 31, 2020, as described in Note 22 to the consolidated financial statements, are
convertible into American Depository Shares (ADSs), 1 ADS representing 4 “A” Ordinary Shares. The exercise of the share options
exercisable will likely occur only when the conversion price is below the trading price of our ADSs and will dilute the ownership
interests of existing shareholders. For instance, should the options of the 7,959,323 “A” Ordinary Shares (1,989,831 ADSs) exercisable
at December 31, 2020 be exercised, Trinity Biotech would have to issue 7,959,323 additional “A” Ordinary Shares (1,989,831 ADSs).
On the basis of 96,162,410 “A” Ordinary Shares outstanding at December 31, 2020, this would effectively dilute the ownership interest
of the existing shareholders by approximately 8%.
It could be difficult for US holders of ADSs to enforce any securities laws claims against Trinity Biotech, its officers or directors in
Irish Courts.
At present, no treaty exists between the United States and Ireland for the reciprocal enforcement of foreign judgments. The laws of
Ireland do however, as a general rule, provide that the judgments of the courts of the United States have in Ireland the same validity as
if rendered by Irish Courts. Certain important requirements must be satisfied before the Irish Courts will recognise the United States
judgment. The originating court must have been a court of competent jurisdiction, the judgment may not be recognised if it is based on
public policy, was obtained by fraud or its recognition would be contrary to Irish public policy. Any judgment obtained in contravention
of the rules of natural justice will not be enforced in Ireland.
50
We have no plans to pay dividends on our ADSs, and you may not receive funds without selling the ADSs.
We do not expect to pay any cash dividends on our ADSs for the foreseeable future. We currently intend to retain any additional future
earnings to finance our operations and growth and, therefore, we have no plans to pay cash dividends at this time. Any future
determination to pay cash dividends will be at the discretion of our board of directors and will be dependent on our earnings, financial
condition, operating results, capital requirements, any contractual restrictions, and other factors that our board of directors deems
relevant. Accordingly, you may have to sell some or all of the ADSs in order to generate cash from your investment. You may not
receive a gain on your investment when you sell the ADSs and may lose the entire amount of your investment.
The voting rights of holders of ADSs are limited by the terms of the deposit agreement, and you may not be able to exercise your
right to direct the voting of your Class A ordinary shares underlying the ADSs.
Holders of ADSs do not have the same rights as our registered shareholders. As a holder of the ADSs, you will not have any direct right
to attend general meetings of our shareholders or to cast any votes at such meetings. You will only be able to exercise the voting rights
which attach to the Class A ordinary shares underlying the ADSs indirectly by giving voting instructions to the depositary in accordance
with the provisions of the deposit agreement. Under the deposit agreement, you may vote only by giving voting instructions to the
depositary, as the registered holder of the Class A ordinary shares underlying the ADSs. If we ask for your instructions, then upon receipt
of your voting instructions, the depositary will try to vote the underlying Class A ordinary shares in accordance with these instructions.
If we do not instruct the depositary to ask for your instructions, the depositary may still vote in accordance with instructions you give,
but it is not required to do so. You will not be able to directly exercise any right to vote with respect to the underlying Class A ordinary
shares unless you withdraw the shares underlying your ADSs and become the registered holder of such shares prior to the record date
for the general meeting. When a general meeting is convened, you may not receive sufficient advance notice of the meeting to enable
you to withdraw the shares underlying the ADSs and become the registered holder of such shares prior to the record date for such general
meeting to allow you to attend the general meeting and to vote directly with respect to any specific matter or resolution to be considered
and voted upon at the general meeting. Where any matter is to be put to a vote at a general meeting, upon our instruction, the depositary
will notify you of the upcoming vote and deliver our voting materials to you. We cannot assure you that you will receive the voting
materials in time to ensure you can direct the depositary to vote the Class A ordinary shares underlying your ADSs in accordance with
your instructions. In addition, the depositary and its agents are not responsible for failing to carry out your voting instructions or for
their manner of carrying out your voting instructions. This means that you may not be able to exercise your right to direct how the shares
underlying the ADSs are voted and you may have no legal remedy if the shares underlying the ADSs are not voted as you instructed.
51
Performance Review
Year ended December 31, 2020 compared to the year ended December 31, 2019
Our analysis is divided as follows:
1. Impact of Covid-19 Pandemic
2. Overview
3. Revenues
4. Operating Profit
5. Loss for the year
6. Discontinued operations
1. Impact of Covid-19 Pandemic
Revenues
Our revenues increased by 12.8% in 2020. The majority of our product lines were negatively impacted by the Covid-19 pandemic with
the greatest impact being seen from April to September. But these decreases were more than offset by demand for products within our
Covid-19 related portfolio of products, including very strong demand for our FDA-approved viral transport medium product which may
be used to transport Covid-19 patient samples in a stable environment.
In our non-Covid product lines, significant reductions occurred in:
Haemoglobins revenues – including both instrument and consumables revenues with the impact being greater on diabetes (A1c)
rather than on haemoglobin variant revenues.
Autoimmune revenues – testing volumes were particularly impacted at our reference laboratory in Buffalo, New York but there
were also lower product sales in all major markets.
HIV, Infectious Diseases and Clinical chemistry product sales.
Covid-19 products
The Group was well-positioned to respond to the Covid-19 pandemic with our established expertise in infectious disease products
including our existing Viral Transport Media product which could be used to transport testing samples for Covid-19 PCR tests.
We undertook development of three different Covid-19 diagnostic tests. Our first test, a Covid-19 antibody test using an ELISA platform,
was submitted to the FDA for Emergency Use Authorisation (“EUA”) in 2020 and the EUA review remains pending. We provided
notification of intent to distribute under FDA’s Notification Policy for COVID-19 serology tests. The FDA has agreed that this test be
listed on the Notification list by FDA, which permits distribution of this test in the US, pending review of the EUA. No assurance can
be given that the FDA review of the EUA, when completed, will result in authorization of this test. This test is CE marked to allow for
its sales in the EU.
We are developing a rapid Covid-19 antigen test, with which we intend will leverage our existing rapid infectious disease test design.
Operations and Employee Safety
Many governments have implemented restrictive lockdowns requiring non-essential businesses to shut down operations. Our business
is typically deemed “essential” and we have continued to operate, manufacture and distribute products to customers throughout most of
2020. We furloughed many of our work forces in the USA, Ireland and Canada in April 2020 but the majority of employees returned in
May.
We have implemented health and safety policies to help safeguard our on-site employees and maintain business continuity. We have
also enhanced cleaning procedures, provided additional personal hygiene supplies and protective equipment to employees, limited access
52
to our facilities to visitors, trained employees on social distancing and mask wearing. Where practical, we have facilitated many
employees to work remotely. These measures have created additional challenges from our work methods and on our infrastructure and
I.T. systems which may have resulted in decreased productivity and some increased operating costs. However, the various responses we
have put in place have to date resulted in limited disruption to our normal business operations. To date, we have been able to maintain
our operations without significant interruption and have been able to develop and quickly scale manufacturing capacity for new products
related to the Covid-19 pandemic.
We have availed of governmental supports. This included the receipt of forgivable loans under the U.S. government’s Paycheck
Protection Program. In Ireland, the company also availed of economic support mechanisms being provided by the Irish Government
mainly in the form of wage subsidies.
Supply Chains
The pandemic has caused delays in receipts for certain raw materials and components for our products, particularly those related to our
Viral Transport Media product. Such delays can result in disruption to our business operations. We are continuously evaluating our
supply chain to identify potential gaps and take steps intended to ensure continuity. Our inventory levels continue to fluctuate due to the
change in our sales mix and the increased size of customer orders for Covid-19 related products. We successfully increased our
production capacity for our viral transport media product, with the workforce mainly comprising of temporary staff.
Outlook
Management continues to monitor the pandemic situation closely and seeks to minimise the negative impacts on the business, while at
the same time, optimising the opportunities presented to us as a medical diagnostic company. We sell our products in approximately
100 countries and there can be a large variance globally in the impact of the virus, the virus infection rates and public healthcare measures
from country to country. It is therefore difficult to generalise about the recovery of demand for our products given the number of
variables.
While the outlook is subject to significant uncertainty, we expect demand for our non-Covid related products to increase in 2021
compared to 2020. We have already seen a partial recovery of these products in the fourth quarter of 2020 and we expect this trend to
continue as more patients present themselves for health tests. The extent to which demand for our Covid-19 portfolio of products is
sustained into 2021 is highly uncertain and very difficult to predict. Demand for these products depends on new information that may
emerge concerning the severity of the coronavirus, the incidence of Covid-19 variants and the vaccination programmes plus competition
from competing products.
2. Overview
In 2020, revenues increased by 12.8% from US$90.4 million in 2019 to US$102.0 million. The increase is mainly due to strong sales
within our Covid-19 related portfolio of products, with our Viral Transport Media product being the most significant contributor to
revenue within that portfolio. Offsetting these increases were decreases in our other product lines mainly due to the impact of the Covid-
19 pandemic.
Geographically, 69% of our sales were generated in the Americas, 22% in Africa/Asia and 9% in Europe.
The gross margin increased from 42.2% in 2019 to 47.6% in 2020 and this is largely due to the impact of strong sales within our Covid-
19 related portfolio of products, fewer instrument placements, lower depreciation and a range of cost saving measures implemented
during the year.
Other operating income increased from US$0.1 million in 2019 to US$1.9 million in 2020. The increase mainly relates to funding
received under the U.S. government’s Cares Act, principally its Paycheck Protection Program.
Selling General & Administrative Expenditure (excluding impairment charges, closure costs, recognition of contingent asset and tax
settlement) decreased from US$27.7 million in 2019 to US$26.4 million in 2020, which represents a decrease of 4.6%. The decrease is
mainly attributable to a range of cost saving measures implemented in response to the Covid-19 pandemic partially offset by foreign
currency losses mainly on Euro-denominated lease liabilities and increased performance-related pay due to higher revenues and profits.
The Group recognized a non-cash impairment charge of US$17.8 million in 2020 (2019: US$24.3 million).

53
The operating profit for continuing operations was US$0.1 million for the year, which compares to an operating loss of US$24.1 million
for 2019. Excluding the impairment charges, the plant closure costs and the recognition of contingent asset, the operating profit for
continuing operations for 2020 is US$19.0 million, compared to US$5.2 million (also excluding impairment charges and a once-off tax
settlement) in 2019. This increase in adjusted operating profit/loss is mainly attributable to higher revenues, higher gross margin and
income from the Paycheck Protection program.
In 2020, net financing expense was US$6.7 million compared to US$5.9 million in 2019. The increase of US$0.8 million was due to a
US$1.2 million increase in the fair value of the derivatives embedded in the Exchangeable Notes compared to a US$0.2 million decrease
in 2019, lower deposit interest of US$0.4 million, offset by the inclusion of interest on a tax audit settlement of US$1.0 million in the
prior year.
The loss for the year from continuing operations was US$6.0 million, compared to US$29.0 million in 2019. Before the impact of
impairment charges, plant closure costs and the recognition of contingent asset, the profit for 2020 from continuing operations would
have been US$12.9 million, compared to a US$0.4 million (excluding the tax settlement expense) for 2019.
3. Revenues
Revenues by Product Line
Trinity Biotech’s revenues for the year ended December 31, 2020 were US$101,980,000 compared to revenues of US$90,435,000 for
the year ended December 31, 2019, which represents an increase of US$11,545,000 or 12.8%. The following table sets forth selected
sales data for each of the periods indicated.
Year ended December 31,
2020 US$’000
2019 US$’000 % Change
Revenues
Clinical laboratory goods 84,280 68,127 23.7%
Clinical laboratory services 8,485 10,915 (22.3%)
Point-of-Care 9,215 11,393 (19.1%)
101,980 90,435 12.8%
Clinical Laboratory Goods
Clinical Laboratory goods revenues increased by US$16,153,000 in 2020, which represents an increase of 23.7%. The increase is mainly
due to strong sales within our Covid-19 related portfolio of products, with our Viral Transport Media product being the most significant
contributor to revenue within that portfolio. Due mainly to the impact of Covid-19, revenues for Haemoglobins and Autoimmune
products recorded decreases in 2020 compared to 2019. In our Haemoglobins business, revenues were affected by the deferral of
Diabetes instrument purchases as healthcare resources were stretched by the pandemic. Autoimmune revenues were affected by fewer
patients attending their doctors for consultations. Infectious Diseases revenues increased significantly due to the aforementioned Viral
Transport Media sales, but this was partly offset by lower Lyme sales attributable to the continued migration away from Western Blot
to other testing formats.
Clinical Laboratory Services
Our New York reference laboratory offers laboratory-testing services for autoimmune disorders, such as Sjogren’s syndrome, hearing
loss, celiac disease, lupus, rheumatoid arthritis and systemic sclerosis. Revenues for the laboratory decreased by 22.3% to US$8,485,000
due to lower testing volumes mainly on account of the pandemic.

54
Point-of-Care
Point-of-Care revenues decreased from US$11,393,000 in 2019 to US$9,215,000 in 2020, which is a decrease of US$2,178,000 (-
19.1%). This was driven by lower HIV sales in both the USA and Rest of World. The decline in the USA was attributable to the decision
to exit this market in 2019, which had been in decline for a number of years, whilst Rest of World sales were lower due to logistical and
testing constraints arising from Covid-19 in the second and third quarters, with normal trading patterns only being restored in the fourth
quarter of 2020.
Revenues by Geographical Region
The following table sets forth selected sales data, analysed by geographic region, based on location of customer:
Year ended December 31,
2020 US$‘000
2019 US$‘000 % Change
Revenues
Americas 70,408 52,183 34.9%
Asia/Africa 22,567 27,686 (18.5%)
Europe 9,005 10,566 (14.8%)
Total 101,980 90,435 12.8%
In the Americas, revenues increased US$18,225,000 or 34.9% mainly due to increased sales of our Viral Transport Media product which
was used in the Covid-19 testing programs in USA and Canada. This increase was partly offset by (i) the decision to exit the HIV point-
of-care testing market in USA during 2019, (ii) the continued migration of Lyme confirmatory testing away from Western Blot to
alternative testing platforms and (iii) lower haemoglobins revenues due to the negative impact of Covid-19 in USA and Brazil and also
due to a marked weakness in the Brazilian currency.
Asia/Africa revenues decreased by 18.5%, or US$5,119,000 compared to 2019. The decrease is due i) to lower Point-of-Care revenues
in Africa where logistical and testing constraints arose due to Covid-19 particularly in the second and third quarters and ii) a decrease
in haemoglobins revenues as patients’ scheduled diabetes tests in China and our other Asian markets were cancelled or postponed due
to government quarantine enforcement in response to the pandemic. Our haemoglobins customers also deferred their instrument
purchases as healthcare resources were stretched by the pandemic.
In Europe, revenues decreased by 14.8% or US$1,561,000, compared to 2019. The decrease was due to lower haemoglobin A1c and
infectious diseases revenues in the territory, mainly due to the reduction in patients attending their doctors for heath checks on account
of the public healthcare emergency. Similar to Asia/Africa, there was a drop in haemoglobins instrument sales in Europe as customers
postponed their instrument purchases due to uncertainty created by the pandemic.
For further information about the Group’s principal products, principal markets and competition please refer to “Business Overview”
on pages 6 to 10.
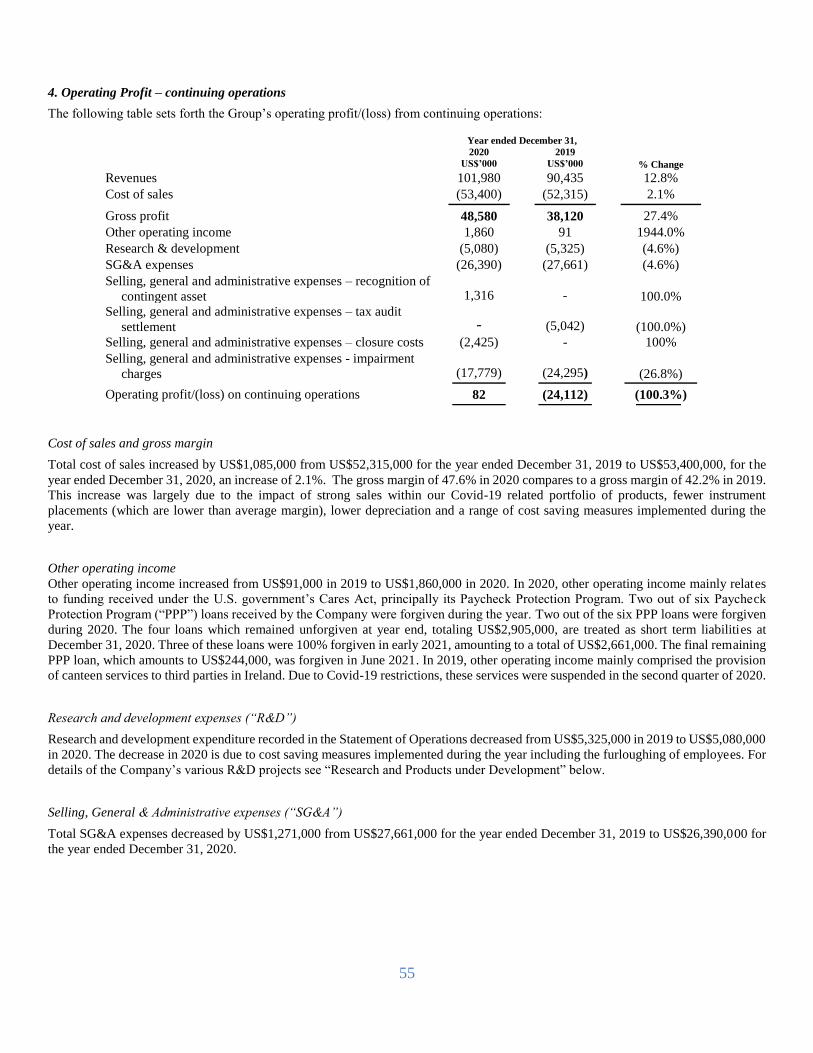
55
4. Operating Profit – continuing operations
The following table sets forth the Group’s operating profit/(loss) from continuing operations:
Year ended December 31,
2020 US$’000
2019 US$’000 % Change
Revenues 101,980 90,435 12.8%
Cost of sales (53,400) (52,315) 2.1%
Gross profit 48,580 38,120 27.4%
Other operating income 1,860 91 1944.0%
Research & development (5,080) (5,325) (4.6%)
SG&A expenses (26,390) (27,661) (4.6%)
Selling, general and administrative expenses – recognition of
contingent asset 1,316 -
100.0%
Selling, general and administrative expenses – tax audit
settlement - (5,042)
(100.0%)
Selling, general and administrative expenses – closure costs (2,425) - 100%
Selling, general and administrative expenses - impairment
charges (17,779) (24,295)
(26.8%)
Operating profit/(loss) on continuing operations 82 (24,112) (100.3%)
Cost of sales and gross margin
Total cost of sales increased by US$1,085,000 from US$52,315,000 for the year ended December 31, 2019 to US$53,400,000, for the
year ended December 31, 2020, an increase of 2.1%. The gross margin of 47.6% in 2020 compares to a gross margin of 42.2% in 2019.
This increase was largely due to the impact of strong sales within our Covid-19 related portfolio of products, fewer instrument
placements (which are lower than average margin), lower depreciation and a range of cost saving measures implemented during the
year.
Other operating income
Other operating income increased from US$91,000 in 2019 to US$1,860,000 in 2020. In 2020, other operating income mainly relates
to funding received under the U.S. government’s Cares Act, principally its Paycheck Protection Program. Two out of six Paycheck
Protection Program (“PPP”) loans received by the Company were forgiven during the year. Two out of the six PPP loans were forgiven
during 2020. The four loans which remained unforgiven at year end, totaling US$2,905,000, are treated as short term liabilities at
December 31, 2020. Three of these loans were 100% forgiven in early 2021, amounting to a total of US$2,661,000. The final remaining
PPP loan, which amounts to US$244,000, was forgiven in June 2021. In 2019, other operating income mainly comprised the provision
of canteen services to third parties in Ireland. Due to Covid-19 restrictions, these services were suspended in the second quarter of 2020.
Research and development expenses (“R&D”)
Research and development expenditure recorded in the Statement of Operations decreased from US$5,325,000 in 2019 to US$5,080,000
in 2020. The decrease in 2020 is due to cost saving measures implemented during the year including the furloughing of employees. For
details of the Company’s various R&D projects see “Research and Products under Development” below.
Selling, General & Administrative expenses (“SG&A”)
Total SG&A expenses decreased by US$1,271,000 from US$27,661,000 for the year ended December 31, 2019 to US$26,390,000 for
the year ended December 31, 2020.
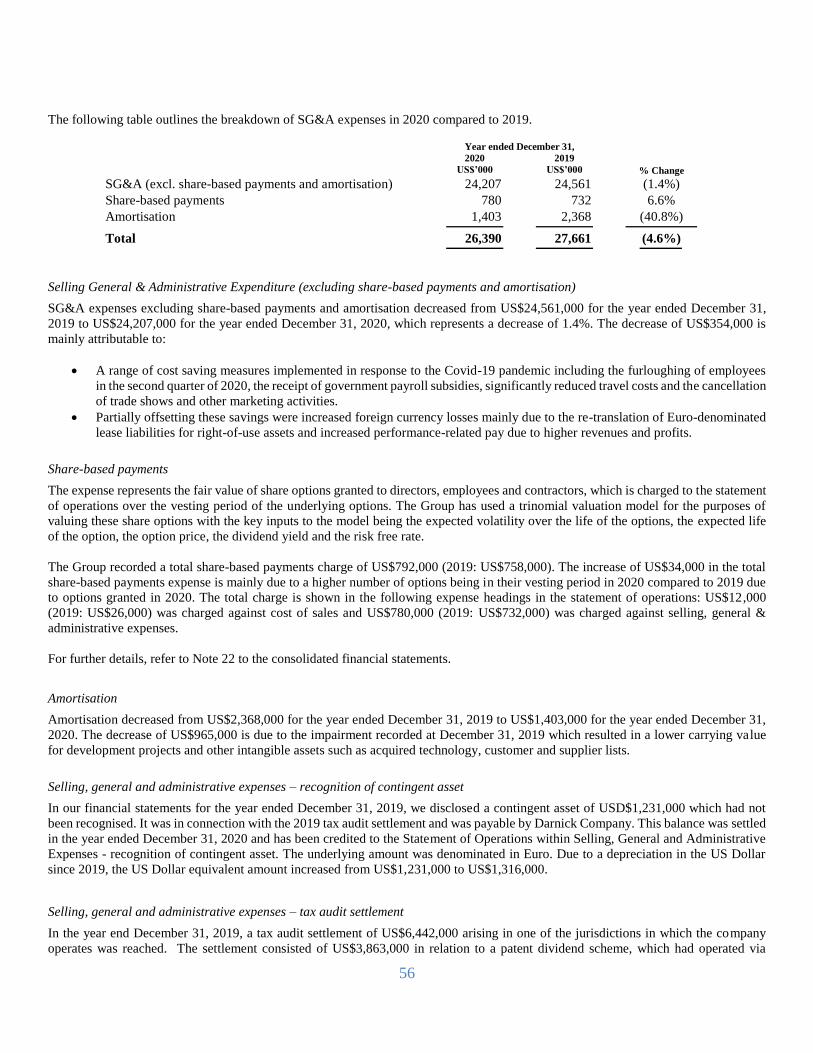
56
The following table outlines the breakdown of SG&A expenses in 2020 compared to 2019.
Year ended December 31,
2020 US$’000
2019 US$’000 % Change
SG&A (excl. share-based payments and amortisation) 24,207 24,561 (1.4%)
Share-based payments 780 732 6.6%
Amortisation 1,403 2,368 (40.8%)
Total 26,390 27,661 (4.6%)
Selling General & Administrative Expenditure (excluding share-based payments and amortisation)
SG&A expenses excluding share-based payments and amortisation decreased from US$24,561,000 for the year ended December 31,
2019 to US$24,207,000 for the year ended December 31, 2020, which represents a decrease of 1.4%. The decrease of US$354,000 is
mainly attributable to:
A range of cost saving measures implemented in response to the Covid-19 pandemic including the furloughing of employees
in the second quarter of 2020, the receipt of government payroll subsidies, significantly reduced travel costs and the cancellation
of trade shows and other marketing activities.
Partially offsetting these savings were increased foreign currency losses mainly due to the re-translation of Euro-denominated
lease liabilities for right-of-use assets and increased performance-related pay due to higher revenues and profits.
Share-based payments
The expense represents the fair value of share options granted to directors, employees and contractors, which is charged to the statement
of operations over the vesting period of the underlying options. The Group has used a trinomial valuation model for the purposes of
valuing these share options with the key inputs to the model being the expected volatility over the life of the options, the expected life
of the option, the option price, the dividend yield and the risk free rate.
The Group recorded a total share-based payments charge of US$792,000 (2019: US$758,000). The increase of US$34,000 in the total
share-based payments expense is mainly due to a higher number of options being in their vesting period in 2020 compared to 2019 due
to options granted in 2020. The total charge is shown in the following expense headings in the statement of operations: US$12,000
(2019: US$26,000) was charged against cost of sales and US$780,000 (2019: US$732,000) was charged against selling, general &
administrative expenses.
For further details, refer to Note 22 to the consolidated financial statements.
Amortisation
Amortisation decreased from US$2,368,000 for the year ended December 31, 2019 to US$1,403,000 for the year ended December 31,
2020. The decrease of US$965,000 is due to the impairment recorded at December 31, 2019 which resulted in a lower carrying value
for development projects and other intangible assets such as acquired technology, customer and supplier lists.
Selling, general and administrative expenses – recognition of contingent asset
In our financial statements for the year ended December 31, 2019, we disclosed a contingent asset of USD$1,231,000 which had not
been recognised. It was in connection with the 2019 tax audit settlement and was payable by Darnick Company. This balance was settled
in the year ended December 31, 2020 and has been credited to the Statement of Operations within Selling, General and Administrative
Expenses - recognition of contingent asset. The underlying amount was denominated in Euro. Due to a depreciation in the US Dollar
since 2019, the US Dollar equivalent amount increased from US$1,231,000 to US$1,316,000.
Selling, general and administrative expenses – tax audit settlement
In the year end December 31, 2019, a tax audit settlement of US$6,442,000 arising in one of the jurisdictions in which the company
operates was reached. The settlement consisted of US$3,863,000 in relation to a patent dividend scheme, which had operated via
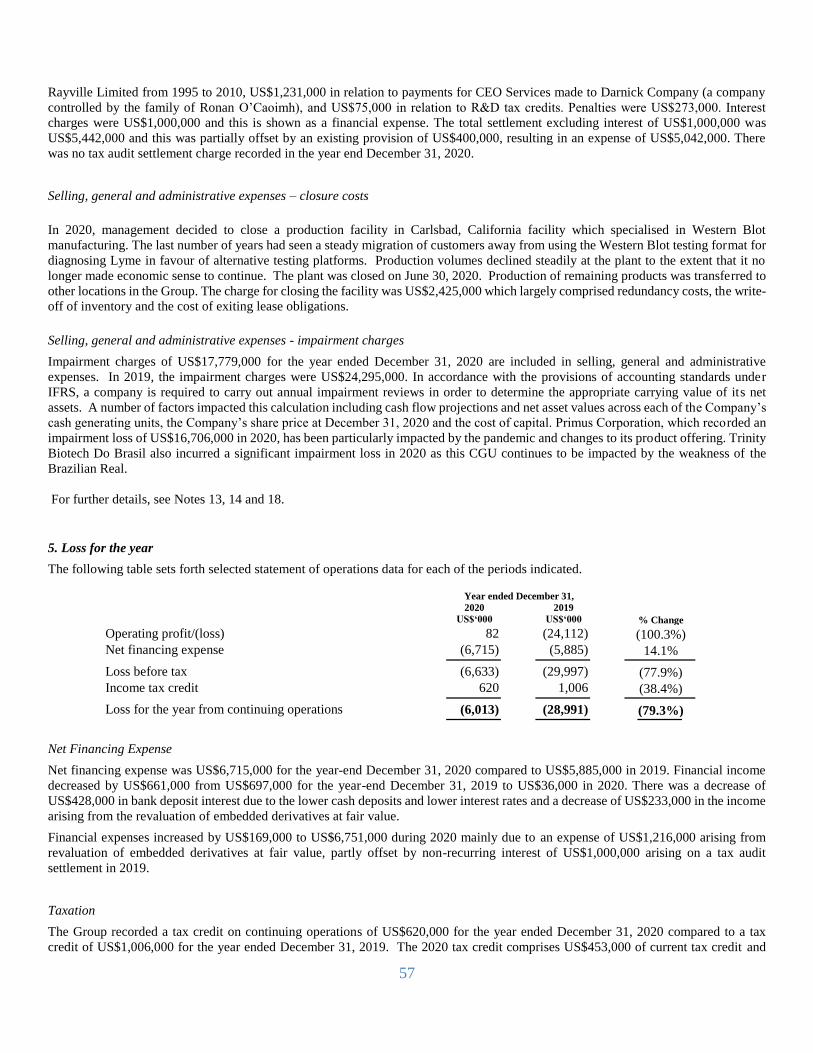
57
Rayville Limited from 1995 to 2010, US$1,231,000 in relation to payments for CEO Services made to Darnick Company (a company
controlled by the family of Ronan O’Caoimh), and US$75,000 in relation to R&D tax credits. Penalties were US$273,000. Interest
charges were US$1,000,000 and this is shown as a financial expense. The total settlement excluding interest of US$1,000,000 was
US$5,442,000 and this was partially offset by an existing provision of US$400,000, resulting in an expense of US$5,042,000. There
was no tax audit settlement charge recorded in the year end December 31, 2020.
Selling, general and administrative expenses – closure costs
In 2020, management decided to close a production facility in Carlsbad, California facility which specialised in Western Blot
manufacturing. The last number of years had seen a steady migration of customers away from using the Western Blot testing format for
diagnosing Lyme in favour of alternative testing platforms. Production volumes declined steadily at the plant to the extent that it no
longer made economic sense to continue. The plant was closed on June 30, 2020. Production of remaining products was transferred to
other locations in the Group. The charge for closing the facility was US$2,425,000 which largely comprised redundancy costs, the write-
off of inventory and the cost of exiting lease obligations.
Selling, general and administrative expenses - impairment charges
Impairment charges of US$17,779,000 for the year ended December 31, 2020 are included in selling, general and administrative
expenses. In 2019, the impairment charges were US$24,295,000. In accordance with the provisions of accounting standards under
IFRS, a company is required to carry out annual impairment reviews in order to determine the appropriate carrying value of its net
assets. A number of factors impacted this calculation including cash flow projections and net asset values across each of the Company’s
cash generating units, the Company’s share price at December 31, 2020 and the cost of capital. Primus Corporation, which recorded an
impairment loss of US$16,706,000 in 2020, has been particularly impacted by the pandemic and changes to its product offering. Trinity
Biotech Do Brasil also incurred a significant impairment loss in 2020 as this CGU continues to be impacted by the weakness of the
Brazilian Real.
For further details, see Notes 13, 14 and 18.
5. Loss for the year
The following table sets forth selected statement of operations data for each of the periods indicated.
Year ended December 31,
2020 US$‘000
2019 US$‘000 % Change
Operating profit/(loss) 82 (24,112) (100.3%)
Net financing expense (6,715) (5,885) 14.1%
Loss before tax (6,633) (29,997) (77.9%)
Income tax credit 620 1,006 (38.4%)
Loss for the year from continuing operations (6,013) (28,991) (79.3%)
Net Financing Expense
Net financing expense was US$6,715,000 for the year-end December 31, 2020 compared to US$5,885,000 in 2019. Financial income
decreased by US$661,000 from US$697,000 for the year-end December 31, 2019 to US$36,000 in 2020. There was a decrease of
US$428,000 in bank deposit interest due to the lower cash deposits and lower interest rates and a decrease of US$233,000 in the income
arising from the revaluation of embedded derivatives at fair value.
Financial expenses increased by US$169,000 to US$6,751,000 during 2020 mainly due to an expense of US$1,216,000 arising from
revaluation of embedded derivatives at fair value, partly offset by non-recurring interest of US$1,000,000 arising on a tax audit
settlement in 2019.
Taxation
The Group recorded a tax credit on continuing operations of US$620,000 for the year ended December 31, 2020 compared to a tax
credit of US$1,006,000 for the year ended December 31, 2019. The 2020 tax credit comprises US$453,000 of current tax credit and

58
US$167,000 of a deferred tax credit. For further details on the Group’s tax charge please refer to Note 9 and Note 15 to the consolidated
financial statements.
Loss for the year from continuing operations
The loss for the year amounted to US$6,013,000, compared to a loss of US$28,991,000 in 2020, representing a decrease of 79.3%.
6. Discontinued operations
The Cardiac Point-of-Care operation was discontinued during the year ended December 31, 2016. Expenses, gains and losses relating
to the discontinuation of the Cardiac point-of-care tests operation have been eliminated from profit or loss from the Group’s continuing
operations and are shown as a single line item on the face of the Consolidated Statement of Operations. The following table sets forth
selected statement of operations data for each of the periods indicated.
Year ended December 31,
2020 US$‘000
2019 US$‘000
(Loss)/Profit on discontinued operations (375) 77
The loss on discontinued operations is US$375,000 in year ended December 31, 2020, which is mainly due to the unwinding of closure
provisions and a change of estimate in relation to a tax receivable balance. The profit on discontinued operations is US$77,000 in year
ended December 31, 2019, which was mainly due to the release of Fiomi Diagnostic’s accumulated foreign currency translation reserve.
For further details, see Note 10.

59
Year ended December 31, 2019 compared to the year ended December 31, 2018
The following compares our results in the year ended December 31, 2019 to those of the year ended December 31, 2018 under IFRS.
Our analysis is divided as follows:
1. Overview 2. Revenues 3. Operating Loss 4. Loss for the year 5. Discontinued operations
1. Overview
In 2019, revenues decreased by 6.8% from US$97.0 million in 2018 to US$90.4 million. The three main factors behind the decrease in
revenues are:
i. Lyme disease revenues decreased following the loss of certain large customers that migrated their Lyme testing
away from Western Blot assays to alternative testing platforms,
ii. HIV point-of-care sales decreased following our decision to discontinue sales of the Unigold HIV test in the
USA and
iii. Revenues for our Fitzgerald business, which sells antibodies to the life sciences and research industries, reduced
following higher than average revenues in 2018.
These declines were partially offset by Haemoglobins and Autoimmunity revenues which continued to grow in 2019.
Geographically, 58% of our sales were generated in the Americas, 30% in Africa/Asia and 12% in Europe.
There was a slight decrease in gross margin in 2019 (42.2% versus 42.7%) and this is mainly due to the impact of lower revenues,
particularly in the context of our relatively high fixed cost base and the adverse currency movements. Selling General & Administrative
Expenditure (excluding impairment charges and tax settlement) decreased from US$29.5 million in 2018 to US$27.7 million in 2019,
which represents a decrease of 6.2%. The decrease is mainly attributable to a cost reduction programme, lower amortization charges
and the impact of foreign currency fluctuations.
The Group recognized an impairment charge of US$24.3 million in 2019 (2018: US$26.9 million). A number of factors contributed to
the impairment charges including the Company’s market capitalisation at the end of the year which was lower when compared to the
end of 2018, the inclusion of the latest cash flow projections and net asset values for each cash generating unit and increased volatility
in the Company’s share price and higher market interest rates which resulted in a higher discount factor being applied to the Company’s
expected future cash flows.
The settlement of a tax audit, mainly relating to payroll taxes, resulted in a charge of US$5.0m, excluding interest.
The operating loss for continuing operations was US$24.1 million for the year, which compares to US$20.2 million for 2018. Excluding
the impairment charge and the once-off tax settlement, the operating profit for continuing operations for 2019 is US$5.2 million,
compared to US$6.7 million in 2018. This decrease in operating profit before impairment charges and tax audit settlement in 2019 is
mainly attributable to lower revenues and to a lesser extent the lower gross margin.
In 2019, net financing expense was US$5.9 million compared to US$3.0 million in 2018. The increase of US$2.9 million was due to
the inclusion of notional interest expense on facility leases of US$0.9m due to the adoption of IFRS 16, Leases, interest on a tax audit
settlement of US$1.0 million and lower deposit interest, offset by a reduction in interest payable on our Exchangeable Notes of $0.4m
following the buyback of a portion of the notes in 2018.
The loss for the year from continuing operations amounted to US$29.0 million, compared to US$22.7 million in 2018. Before the impact
of impairment charges and the tax audit settlement, the loss for 2019 from continuing operations would have been US$0.3 million,
compared to a US$4.3 million profit for 2018.

60
2. Revenues
Trinity Biotech’s revenues consist of sales of diagnostic kits and related instrumentation, laboratory testing services sales and sales of
raw materials to the life sciences industry. The Group recognises revenue when it transfers control over a good or service to a customer.
Revenue is recognised to the extent that it is probable that economic benefit will flow to the Group and the revenue can be measured.
Revenue from products is generally recorded as of the date of shipment, consistent with typical ex-works shipment terms. Where the
shipment terms do not permit revenue to be recognised as of the date of shipment, revenue is recognised when the Group has satisfied
all of its performance obligations to the customer in accordance with the shipping terms. Some contracts oblige the Group to ship product
to the customer ahead of the agreed payment schedule. For these shipments, a contract asset is recognised when control over the goods
has transferred to the customer. Revenue from services rendered is recognised in the statement of operations in proportion to the stage
of completion of the transaction at the balance sheet date.
In some countries, the Group leases instruments to customers as part of a bundled package. Where a contract has multiple performance
obligations and its duration is greater than one year, the transaction price is allocated to the performance obligations in the contract by
reference to their relative standalone selling prices. For contracts where control of the instrument is transferred to the customer, the fair
value of the instrument is recognised as revenue at the commencement of the lease and is matched by the related cost of sale. Fair value
is determined based on standalone selling prices. In the case where control of the instrument does not transfer to the customer, revenue
is recognised on the basis of customer usage of the instrument.
Revenues by Product Line
Trinity Biotech’s revenues for the year ended December 31, 2019 were US$90,435,000 compared to revenues of US$97,035,000 for
the year ended December 31, 2018, which represents a decrease of US$6,600,000 or 6.8%. The following table sets forth selected sales
data for each of the periods indicated.
Year ended December 31,
2019 US$’000
2018 US$’000 % Change
Revenues
Clinical Laboratory 68,127 71,618 (4.9%)
Point-of-Care 11,393 14,836 (23.2%)
Laboratory Services 10,915 10,581 3.2%
Total 90,435 97,035 6.8%
Clinical Laboratory
Clinical Laboratory revenues decrease by US$3,491,000 in 2019, which represents a decrease of 4.9%. This decrease was mainly
attributable to a 16% decrease in Infectious Diseases revenues. Lower sales of Western Blot tests for Lyme disease in USA mainly
accounted for this decrease caused by the on-going migration of Lyme confirmatory testing to alternative testing platforms. Similarly,
revenues for our other infectious diseases tests on ELISA platforms have also been declining for several years, particularly in USA but
we have succeeded in partially making up for these declines by selling more to emerging markets, with China being the largest market.
Our Fitzgerald business, which sells antibodies to the life sciences and research industries, had a decrease in revenues of 14% following
a higher than average level of sales in 2018 driven by high sales in Asia. Partially offsetting these decreases was higher revenues for
haemoglobin A1c testing.
Point-of-Care
Point-of-Care revenues decreased from US$14,836,000 in 2018 to US$11,393,000 in 2019, which is a decrease of US$3,443,000 (-
23.2%). This decrease was mainly due to lower HIV revenues in USA following the decision during 2019 to discontinue sales of the
Unigold HIV test in that market. The reduction in funding for public health HIV testing programs in addition to the CDC’s
recommendations in favour of fourth generation antigen testing led to the decline of HIV Point-of-Care sales in the USA for the last
number of years. Volumes had declined to the extent that when manufacturing and marketing costs were taken into account it was no
longer an economically viable product. The remaining decrease is due to lower Syphilis Point-of-Care tests revenues.
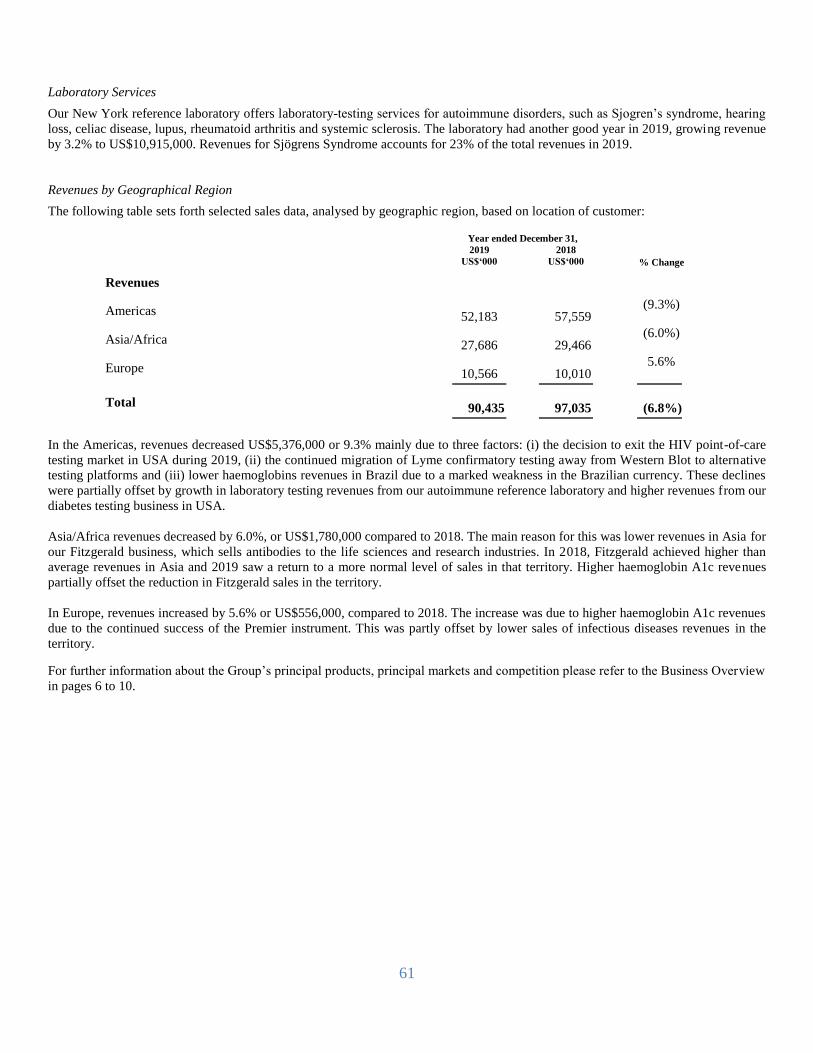
61
Laboratory Services
Our New York reference laboratory offers laboratory-testing services for autoimmune disorders, such as Sjogren’s syndrome, hearing
loss, celiac disease, lupus, rheumatoid arthritis and systemic sclerosis. The laboratory had another good year in 2019, growing revenue
by 3.2% to US$10,915,000. Revenues for Sjögrens Syndrome accounts for 23% of the total revenues in 2019.
Revenues by Geographical Region
The following table sets forth selected sales data, analysed by geographic region, based on location of customer:
Year ended December 31,
2019 US$‘000
2018 US$‘000 % Change
Revenues
Americas 52,183 57,559 (9.3%)
Asia/Africa 27,686 29,466 (6.0%)
Europe 10,566 10,010 5.6%
Total 90,435 97,035 (6.8%)
In the Americas, revenues decreased US$5,376,000 or 9.3% mainly due to three factors: (i) the decision to exit the HIV point-of-care
testing market in USA during 2019, (ii) the continued migration of Lyme confirmatory testing away from Western Blot to alternative
testing platforms and (iii) lower haemoglobins revenues in Brazil due to a marked weakness in the Brazilian currency. These declines
were partially offset by growth in laboratory testing revenues from our autoimmune reference laboratory and higher revenues from our
diabetes testing business in USA.
Asia/Africa revenues decreased by 6.0%, or US$1,780,000 compared to 2018. The main reason for this was lower revenues in Asia for
our Fitzgerald business, which sells antibodies to the life sciences and research industries. In 2018, Fitzgerald achieved higher than
average revenues in Asia and 2019 saw a return to a more normal level of sales in that territory. Higher haemoglobin A1c revenues
partially offset the reduction in Fitzgerald sales in the territory.
In Europe, revenues increased by 5.6% or US$556,000, compared to 2018. The increase was due to higher haemoglobin A1c revenues
due to the continued success of the Premier instrument. This was partly offset by lower sales of infectious diseases revenues in the
territory. For further information about the Group’s principal products, principal markets and competition please refer to the Business Overview
in pages 6 to 10.

62
3. Operating Loss – continuing operations
The following table sets forth the Group’s operating loss from continuing operations:
Year ended December 31,
2019 US$’000
2018 US$’000 % Change
Revenues 90,435 97,035 (6.8%)
Cost of sales (52,315) (55,586) (5.9%)
Gross profit 38,120 41,449 (8.0%)
Other operating income 91 102 (10.8%)
Research & development (5,325) (5,369) (0.8%)
SG&A expenses (27,661) (29,477) (6.2%)
Selling, general and administrative expenses – tax audit
settlement (5,042) — —
Selling, general and administrative expenses - impairment
charges (24,295) (26,932) (9.8%)
Operating loss on continuing operations (24,112) (20,227) 19.2%
Cost of sales and gross margin
Total cost of sales decreased by US$3,271,000 from US$55,586,000 for the year ended December 31, 2018 to US$52,315,000, for the
year ended December 31, 2019, a decrease of 5.9%. The gross margin of 42.2% in 2019 compares to a gross margin of 42.7% in 2018.
This decrease was mainly due to the impact of lower revenues, particularly in the context of our relatively high fixed cost base and the
adverse currency movements mentioned above. This was partly offset by cost savings that were implemented during the year and the
changes resulting from the adoption of IFRS 16, Leases.
Other operating income
In 2019, other operating income mainly comprises income from the provision of canteen services recognised under a Transitional
Services Agreement with Diagnostica Stago. Other operating income decreased by 10.8% to US$91,000 mainly due to currency
movements.
Research and development expenses (“R&D”)
Research and development expenditure recorded in the Statement of Operations decreased from US$5,369,000 in 2018 to US$5,325,000
in 2019. The decrease in 2019 is mainly due to lower salaries expenses resulting from a cost reduction programme. For details of the
Company’s various R&D projects see “Research and Products under Development” below.
Selling, General & Administrative expenses (“SG&A”)
Total SG&A expenses decreased by US$1,816,000 from US$29,477,000 for the year ended December 31, 2018 to US$27,661,000 for
the year ended December 31, 2019.
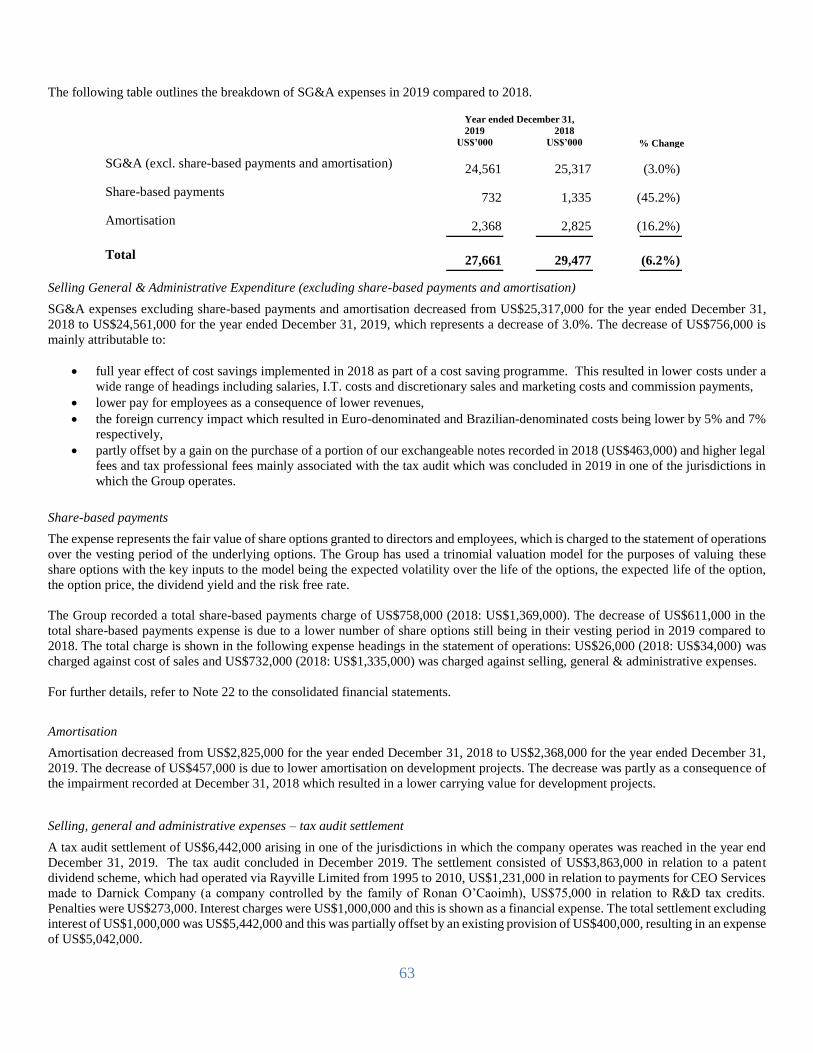
63
The following table outlines the breakdown of SG&A expenses in 2019 compared to 2018.
Year ended December 31,
2019 US$’000
2018 US$’000 % Change
SG&A (excl. share-based payments and amortisation) 24,561 25,317 (3.0%)
Share-based payments 732 1,335 (45.2%)
Amortisation 2,368 2,825 (16.2%)
Total 27,661 29,477 (6.2%)
Selling General & Administrative Expenditure (excluding share-based payments and amortisation)
SG&A expenses excluding share-based payments and amortisation decreased from US$25,317,000 for the year ended December 31,
2018 to US$24,561,000 for the year ended December 31, 2019, which represents a decrease of 3.0%. The decrease of US$756,000 is
mainly attributable to:
full year effect of cost savings implemented in 2018 as part of a cost saving programme. This resulted in lower costs under a
wide range of headings including salaries, I.T. costs and discretionary sales and marketing costs and commission payments,
lower pay for employees as a consequence of lower revenues,
the foreign currency impact which resulted in Euro-denominated and Brazilian-denominated costs being lower by 5% and 7%
respectively,
partly offset by a gain on the purchase of a portion of our exchangeable notes recorded in 2018 (US$463,000) and higher legal
fees and tax professional fees mainly associated with the tax audit which was concluded in 2019 in one of the jurisdictions in
which the Group operates.
Share-based payments
The expense represents the fair value of share options granted to directors and employees, which is charged to the statement of operations
over the vesting period of the underlying options. The Group has used a trinomial valuation model for the purposes of valuing these
share options with the key inputs to the model being the expected volatility over the life of the options, the expected life of the option,
the option price, the dividend yield and the risk free rate.
The Group recorded a total share-based payments charge of US$758,000 (2018: US$1,369,000). The decrease of US$611,000 in the
total share-based payments expense is due to a lower number of share options still being in their vesting period in 2019 compared to
2018. The total charge is shown in the following expense headings in the statement of operations: US$26,000 (2018: US$34,000) was
charged against cost of sales and US$732,000 (2018: US$1,335,000) was charged against selling, general & administrative expenses.
For further details, refer to Note 22 to the consolidated financial statements.
Amortisation
Amortisation decreased from US$2,825,000 for the year ended December 31, 2018 to US$2,368,000 for the year ended December 31,
2019. The decrease of US$457,000 is due to lower amortisation on development projects. The decrease was partly as a consequence of
the impairment recorded at December 31, 2018 which resulted in a lower carrying value for development projects.
Selling, general and administrative expenses – tax audit settlement
A tax audit settlement of US$6,442,000 arising in one of the jurisdictions in which the company operates was reached in the year end
December 31, 2019. The tax audit concluded in December 2019. The settlement consisted of US$3,863,000 in relation to a patent
dividend scheme, which had operated via Rayville Limited from 1995 to 2010, US$1,231,000 in relation to payments for CEO Services
made to Darnick Company (a company controlled by the family of Ronan O’Caoimh), US$75,000 in relation to R&D tax credits.
Penalties were US$273,000. Interest charges were US$1,000,000 and this is shown as a financial expense. The total settlement excluding
interest of US$1,000,000 was US$5,442,000 and this was partially offset by an existing provision of US$400,000, resulting in an expense
of US$5,042,000.
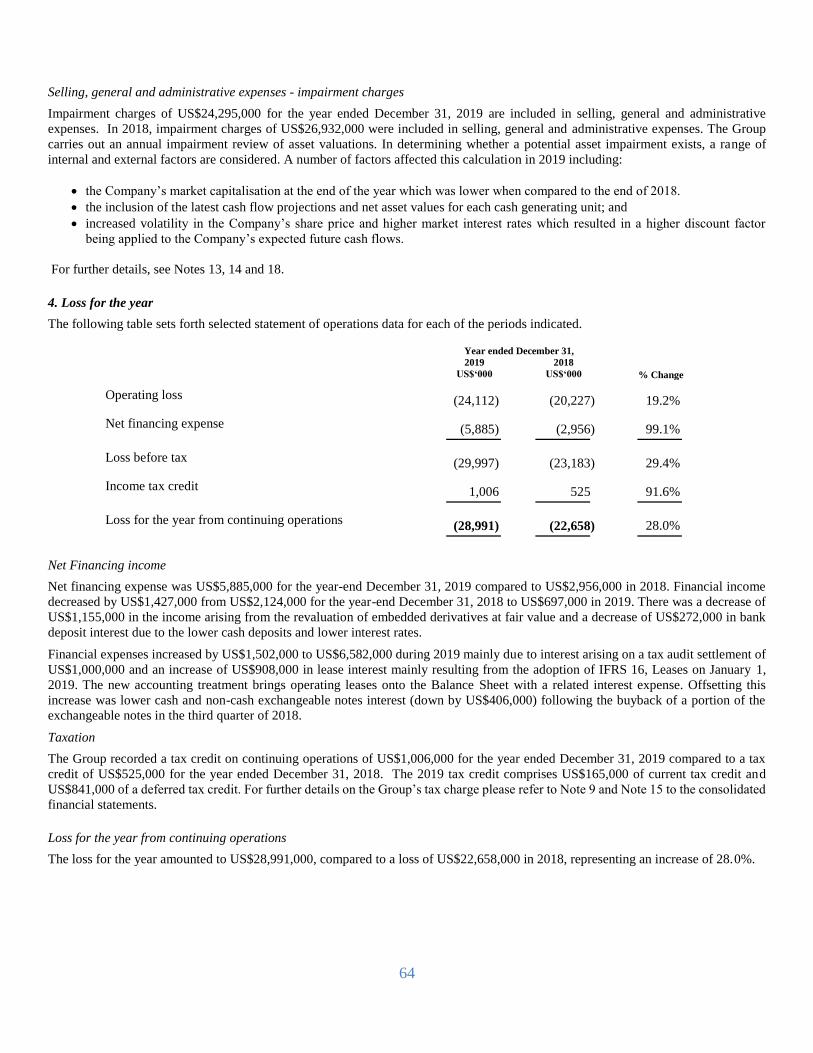
64
Selling, general and administrative expenses - impairment charges
Impairment charges of US$24,295,000 for the year ended December 31, 2019 are included in selling, general and administrative
expenses. In 2018, impairment charges of US$26,932,000 were included in selling, general and administrative expenses. The Group
carries out an annual impairment review of asset valuations. In determining whether a potential asset impairment exists, a range of
internal and external factors are considered. A number of factors affected this calculation in 2019 including:
the Company’s market capitalisation at the end of the year which was lower when compared to the end of 2018.
the inclusion of the latest cash flow projections and net asset values for each cash generating unit; and
increased volatility in the Company’s share price and higher market interest rates which resulted in a higher discount factor
being applied to the Company’s expected future cash flows.
For further details, see Notes 13, 14 and 18.
4. Loss for the year
The following table sets forth selected statement of operations data for each of the periods indicated.
Year ended December 31,
2019 US$‘000
2018 US$‘000 % Change
Operating loss (24,112) (20,227) 19.2%
Net financing expense (5,885) (2,956) 99.1%
Loss before tax (29,997) (23,183) 29.4%
Income tax credit 1,006 525 91.6%
Loss for the year from continuing operations (28,991) (22,658) 28.0%
Net Financing income
Net financing expense was US$5,885,000 for the year-end December 31, 2019 compared to US$2,956,000 in 2018. Financial income
decreased by US$1,427,000 from US$2,124,000 for the year-end December 31, 2018 to US$697,000 in 2019. There was a decrease of
US$1,155,000 in the income arising from the revaluation of embedded derivatives at fair value and a decrease of US$272,000 in bank
deposit interest due to the lower cash deposits and lower interest rates.
Financial expenses increased by US$1,502,000 to US$6,582,000 during 2019 mainly due to interest arising on a tax audit settlement of
US$1,000,000 and an increase of US$908,000 in lease interest mainly resulting from the adoption of IFRS 16, Leases on January 1,
2019. The new accounting treatment brings operating leases onto the Balance Sheet with a related interest expense. Offsetting this
increase was lower cash and non-cash exchangeable notes interest (down by US$406,000) following the buyback of a portion of the
exchangeable notes in the third quarter of 2018.
Taxation
The Group recorded a tax credit on continuing operations of US$1,006,000 for the year ended December 31, 2019 compared to a tax
credit of US$525,000 for the year ended December 31, 2018. The 2019 tax credit comprises US$165,000 of current tax credit and
US$841,000 of a deferred tax credit. For further details on the Group’s tax charge please refer to Note 9 and Note 15 to the consolidated
financial statements.
Loss for the year from continuing operations
The loss for the year amounted to US$28,991,000, compared to a loss of US$22,658,000 in 2018, representing an increase of 28.0%.
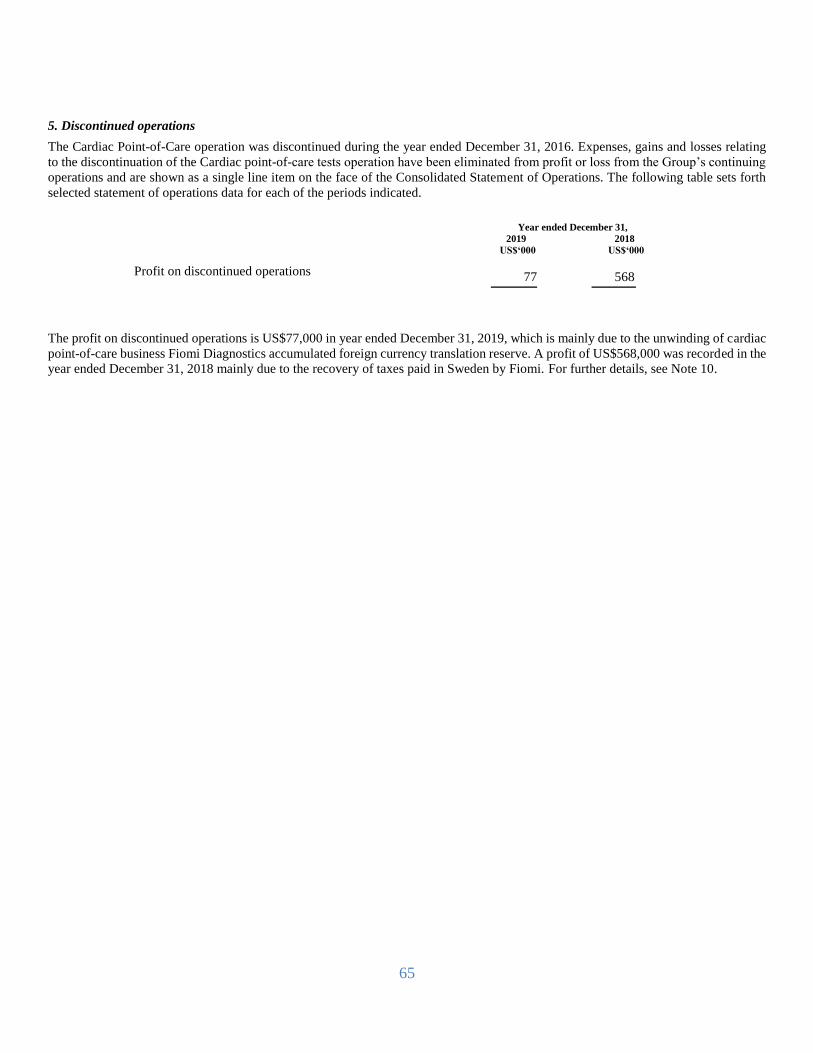
65
5. Discontinued operations
The Cardiac Point-of-Care operation was discontinued during the year ended December 31, 2016. Expenses, gains and losses relating
to the discontinuation of the Cardiac point-of-care tests operation have been eliminated from profit or loss from the Group’s continuing
operations and are shown as a single line item on the face of the Consolidated Statement of Operations. The following table sets forth
selected statement of operations data for each of the periods indicated.
Year ended December 31,
2019 US$‘000
2018 US$‘000
Profit on discontinued operations 77 568
The profit on discontinued operations is US$77,000 in year ended December 31, 2019, which is mainly due to the unwinding of cardiac
point-of-care business Fiomi Diagnostics accumulated foreign currency translation reserve. A profit of US$568,000 was recorded in the
year ended December 31, 2018 mainly due to the recovery of taxes paid in Sweden by Fiomi. For further details, see Note 10.
66
INDEPENDENT AUDITOR’S REPORT TO THE MEMBERS OF TRINITY BIOTECH PLC
Opinion
We have audited the group and parent company financial statements of Trinity Biotech plc, which comprise the consolidated and
parent company statement of operations, the consolidated and parent company statements of comprehensive income, the consolidated
and parent company balance sheets, the consolidated and parent company statements of changes in equity and the consolidated and
parent company statements of cash flows for the financial year ended December 31, 2020, and the related notes to the financial
statements, including the summary of significant accounting policies.
The financial reporting framework that has been applied in the preparation of the financial statements is Irish law and International
Financial Reporting Standards (IFRS) as adopted by the European Union.
In our opinion:
the consolidated financial statements give a true and fair view in accordance with IFRS as adopted by the European Union of
the assets, liabilities and financial position of the group as at December 31, 2020 and of its loss and cash flows for the
financial year then ended;
the parent company financial statements give a true and fair view, in accordance with IFRS as adopted by the European
Union, of the state of the parent company’s assets, liabilities and financial position of the company as at December 31, 2020
and of its loss and cash flows for the financial year then ended; and
the financial statements have been properly prepared in accordance with the requirements of the Companies Act 2014.
Basis for opinion
We conducted our audit in accordance with International Standards on Auditing (Ireland) (‘ISAs (Ireland)) and applicable law. Our
responsibilities under those standards are further described in the ‘Responsibilities of the auditor for the audit of the financial
statements’ section of our report. We are independent of the group and company in accordance with the ethical requirements that are
relevant to our audit of the financial statements in Ireland, namely the Irish Auditing and Accounting Supervisory Authority (IAASA)
Ethical Standard concerning the integrity, objectivity and independence of the auditor, and the ethical pronouncements established by
Chartered Accountants Ireland, applied as determined to be appropriate in the circumstances for the entity. We have fulfilled our other
ethical responsibilities in accordance with these requirements. We believe that the audit evidence we have obtained is sufficient and
appropriate to provide a basis for our opinion.
Conclusions relating to going concern
In auditing the financial statements, we have concluded that the director’s use of going concern basis of accounting in the preparation
of the financial statements is appropriate. Our evaluation of the directors’ assessment of the entity’s ability to continue as a going
concern basis of accounting included:
Examining management assessment on going concern and performed an independent assessment of the inputs and
assumptions used by management in preparing their assessment on going concern by comparing the assumptions and
estimates used elsewhere in the preparation of the financial statements;
Discussing with management the options being considered in relation to repayment plan of the loan notes;
Discussion with professional advisors engaged by the company to discuss the various options being considered by
management;
Evaluating management’s assessment of any liquidity issues with the Company by reviewing if the Company has enough
liquidity sources from operating activities;
Making inquiries with the Directors and reviewing board minutes available up to and including the date of authorisation of the
financial statements in order to understand the future plans of the Company;
Assessing the adequacy of the disclosures with respect to the going concern assertion; and
Obtaining a signed letter of representation from the Directors that it is appropriate to prepare the financial statements on a going
concern basis and the directors have considered various financing options to meet its repayment obligations under the
exchangeable notes over the next 12 months.
Based on the work we have performed, we have not identified any material uncertainties relating to events or conditions that,
individually or collectively, may cast significant doubt on the Group and Company’s ability to continue as a going concern for a
period of at least twelve months from the date when the financial statements are authorised for issue.
67
INDEPENDENT AUDITOR’S REPORT TO THE MEMBERS OF TRINITY BIOTECH PLC (CONTINUED)
Our responsibilities and the responsibilities of the directors with respect to going concern are described in the relevant sections of this
report.
Key audit matters
Key audit matters are those matters that, in our professional judgment, were of most significance in our audit of the financial
statements of the current financial period and include the most significant assessed risks of material misstatement (whether or not due
to fraud) we identified, including those which had the greatest effect on: the overall audit strategy, the allocation of resources in the
audit, and the directing of efforts of the engagement team. These matters were addressed in the context of our audit of the financial
statements as a whole, and in forming our opinion thereon, and therefore we do not provide a separate opinion on these matters.
Overall audit strategy
We designed our audit by determining materiality and assessing the risks of material misstatement in the financial statements. In
particular, we looked at where the directors made subjective judgments, for example, valuation of goodwill, capitalisation of
development costs, impairment considerations, and revenue recognition. We also addressed the risk of management override of
internal controls, including evaluating whether there was any evidence of potential bias that could result in a risk of material
misstatement due to fraud.
How we tailored the audit scope
Trinity Biotech plc develops, acquires, manufactures and markets medical diagnostic products for the clinical laboratory and point-of-
care segments of the diagnostic market. The company is also a significant provider of raw
materials to the life sciences and research industries globally. Revenues are mainly generated from the clinical laboratory segment and
from customers residing outside of the Republic of Ireland.
In establishing the overall approach to our audit we assessed the risk of material misstatement at a group level, taking into account the
nature, likelihood and potential magnitude of any misstatement. As part of our risk assessment, we considered the control environment
in place at the company.
In assessing the risk of material misstatement to the group financial statements and to ensure we had adequate quantitative coverage of
significant accounts in the financial statements, we selected eleven components covering entities across Europe and the Americas,
which represent the principal business units within the group.
Of the eleven components selected, we performed an audit of the complete financial information of six components (“full scope
components”) which were selected based on their size and risk characteristics. For the remaining five components (“specific scope
components”), we performed audit procedures on specific accounts within that component that we considered had the potential for the
greatest impact on the significant accounts in the financial statements either because of size of these accounts of their risk profile.
The reporting components within which audit procedures were conducted accounted for 97% of the group’s loss before tax, 97% of
the group’s revenue and 96% of the group’s total assets.
Materiality and audit approach
The scope of our audit is influenced by our application of materiality. We set certain quantitative thresholds for materiality. These,
together with qualitative considerations, helped us to determine the scope of our audit and the nature, timing and extent of our audit
procedures and to evaluate the effect of misstatements, both individually and on the financial statements as a whole.
Based on our professional judgment, we determined materiality for the group to be 1% of revenues earned from third-party sources at
December 31, 2020. We have applied this benchmark because revenues are the primary measure used by shareholders in assessing
performance of the entity. In situations where entities are in a loss position showing fluctuating losses (as is the case for the group),
revenues are the generally accepted auditing benchmark.

68
INDEPENDENT AUDITOR’S REPORT TO THE MEMBERS OF TRINITY BIOTECH PLC (CONTINUED)
We have set performance materiality at $594k, having considered our prior year experience of the risk of misstatements, business risks
and fraud risks associated with the entity and it’s the control environment. This is to reduce to an appropriately low level the
probability that the aggregate of uncorrected and undetected misstatements in the financial statements exceeds materiality for the
financial statements as a whole.
We agreed with the audit committee that we would report to them misstatements identified during our audit above 5% of materiality.
Significant matters identified
The risks of material misstatement that had the greatest effect on our audit, including the allocation of our resources and effort, are set
out below as significant matters together with an explanation of how we tailored our audit to address these specific areas in order to
provide an opinion on the financial statements as a whole. This is not a complete list of all risks identified by our audit.
Going Concern (Note 1)
As discussed in Note 1 to the financial statements, management assessed that it is appropriate to prepare the financial statements on a
going concern basis. In making this assessment, the directors have considered that the Group has been loss making and has net
liabilities at 31 December 2020 and the potential repayment of part or all of the $99.9m exchangeable notes that may arise in April
2022. The exchangeable notes include a number of put and call options and the first date on which holders can exercise their put
option is April 1, 2022. If the put options are exercised, the issuer has to repurchase the notes at par.
We identified management’s going concern assessment as a key audit matter as the Company’s ability to obtain additional funding
may determine its ability to continue as a going concern. These considerations require significant auditor judgment to conclude that
the Company will have the ability to settle its obligations when the holders of the exchangeable notes exercise their put option.
Audit Response to significant matter
Our audit procedures related to going concern are included in the Conclusions relating to going concern section of the Auditor’s report.
Assessment of goodwill and other long-lived assets valuation (Note 14)
As at December 31, 2020 prior to impairment analysis, the goodwill and intangible assets of the group totalled $49.28m, property,
plant and equipment of the group totalled $10.34m and prepayments of the group totalled $1.72m. The Company recognised
$17.78million impairment during the year ended December 31, 2020.
The group’s evaluation of the carrying value of goodwill and intangible assets for impairment involves the comparison of the
recoverable amount of goodwill and intangible assets of each cash generating unit (CGU) to its carrying value. The Company used the
value-in-use approach, which deploys a discounted cash flow model to estimate the recoverable amount. This requires management to
make significant estimates and assumptions related to discount rates, short-term forecasts of future revenues and margins, and long-
term growth rates which drive net cash flows. Changes in these assumptions could have a significant impact on the recoverable
amount, the amount of any impairment charge, or both.
We identified goodwill and intangible assets for certain CGUs as a key audit matter because of the significant judgements made by
management to estimate the recoverable value of certain CGUs and the difference between their recoverable amounts and carrying
values. We focused on CGUs where impairments were recognised in the current year, CGUs identified as sensitive by management
and CGUs with a significant change in cash flow forecasts in the current year (collectively the “selected CGUs”).
This required a high degree of auditor judgement and an increased extent of effort, when performing audit procedures to evaluate the
reasonableness of management’s estimates and assumptions as described above.
Audit Response to significant matter
Our audit procedures related to the assumptions, as described above, used by management to estimate the recoverable amounts of the
selected CGUs included the following, among others:
69
INDEPENDENT AUDITOR’S REPORT TO THE MEMBERS OF TRINITY BIOTECH PLC (CONTINUED)
We evaluated the design effectiveness of controls over management’s selection of the discount rates, short-term forecasts of
future revenues and margins, and long-term growth rates used to determine the recoverable amount of each selected CGU.
We agreed the underlying cash flow forecasts to the Board approved projections and we evaluated management’s ability to
accurately forecast future revenues and margins by:
performing a look-back analysis and comparing actual results to management’s historical forecasts; and
assessing the reasonableness of the impact of COVID-19 and other macroeconomic activity on short-term cash
flows;
We assessed the reasonableness of the valuation model used by the Company compared to generally accepted valuation
practices and accounting standards;
We tested the source information underlying the determination of the discount rates through use of observable inputs from
independent external sources;
We developed independent estimates and comparing those to the discount rates selected by management; and
We compared the long-term growth rates, used by management to grow cash flows in order to calculate a terminal value at
that point, to independent external sources to assess the reasonableness of these rates.
Accounting for capitalised development costs (Note 14):
As discussed in Note 14 to the consolidated financial statements, the Company capitalises certain internal development costs related to
the design, development and enhancement of the Company’s products. The Company capitalized $6.9 million of internal development
costs during the year ended December 31, 2020.
The principal consideration for our determination that capitalized development cost is a key audit matter is the degree of subjectivity
involved in assessing which projects meet the capitalization criteria, based on the development stage of the project and the costs being
capitalized.
Audit Response to significant matter Our audit procedures related to the capitalization of research and development costs included the following, among others:
We examined the supporting documents of internally generated intangible asset additions in the financial year to ensure they
constituted development phase costs allowable for capitalisation as stipulated by IAS 38.
We tested the key assumptions used by management in concluding that intangible projects capitalised at year-end demonstrate the
required characteristics to permit capitalisation, particularly the commercial and technical feasibility of on-going development
projects.
We conducted detailed discussions with senior intangible project personnel to understand their rationale for concluding on the
appropriateness of capitalisation of the development phase costs under IAS 38 and, where necessary, challenged the underlying
reasoning.
We obtained a detailed understanding of the role of the employees in the development of the intangibles whose salaries are
capitalized.

70
INDEPENDENT AUDITOR’S REPORT TO THE MEMBERS OF TRINITY BIOTECH PLC (CONTINUED)
Revenue recognition (Note 2):
Revenue recognition requires judgment by qualified personnel and often varies from contract to contract. The nature of such
judgments result in them being susceptible to fraud. The recognition of revenue earlier than permitted by IFRS 15 was a deemed key
audit risk.
The core principle of IFRS 15 is that an entity will recognise revenue to depict the transfer of promised goods or services to customers
in an amount that reflects the consideration to which the entity expects to be entitled in exchange for those goods or services, which
requires the use of management judgment and gives rise to the risk of management override. The core principle is delivered in a five-
step model framework: 1) identify the contract(s) with a customer, 2) identify the performance obligations in the contract, 3)
determine the transaction price, 4) allocate the transaction price to the performance obligations in the contract and 5) recognise
revenue when (or as) the entity satisfies a performance obligation.
The Company recognised significant revenues from its Covid-19 related portfolio of products in the second half of the year. Sales
orders for these products included those of large monetary value with both new and existing customers advanced on terms atypical to
the Company’s traditional revenue lines and some customer contracts could be regarded as offering the customer a right of return.
We determined this as a key audit matter due to the high subjectivity and significant management judgement on the level of deferral
related to returns to be reflected in the financial statement given the bulk orders, changing demands and varying customer acceptance
clauses.
Audit Response to significant matter Our audit procedures related to the rights of return reserves included the following, among others:
We tested the design and effectiveness of management review controls (including specific controls for review of revenue
recognition and year end cut-off analyses).
We selected a statistical sample of revenue transactions from the ship and bill revenue stream to vouch to underlying documents.
We examined contracts specific to the Company’s Covid-19 related portfolio of products; and
We examined post year-end sales activity, the assumptions made and the inputs used in the calculation of the return deferral.
Other information
Other information comprises information included in the annual report, other than the financial statements and the auditor’s report
thereon, such as the Directors’ report and Chairman’s statement. The directors are responsible for the other information. Our opinion
on the financial statements does not cover the other information and, except to the extent otherwise explicitly stated in our report, we
do not express any form of assurance conclusion thereon.
In connection with our audit of the financial statements, our responsibility is to read the other information and, in doing so, consider
whether the other information is materially inconsistent with the financial statements or our knowledge obtained in the audit, or
otherwise appears to be materially misstated. If we identify such material inconsistencies in the financial statements, we are required
to determine whether there is a material misstatement in the financial statements or a material misstatement of the other information.
If, based on the work we have performed, we conclude that there is a material misstatement of this other information, we are required
to report that fact.
We have nothing to report in this regard.

71
INDEPENDENT AUDITOR’S REPORT TO THE MEMBERS OF TRINITY BIOTECH PLC (CONTINUED)
Matters on which we are required to report by the Companies Act 2014
We have obtained all the information and explanations which we consider necessary for the purposes of our audit.
In our opinion the accounting records of the group were sufficient to permit the financial statements to be readily and
properly audited.
The financial statements are in agreement with the accounting records.
In our opinion the information given in the Directors’ report is consistent with the financial statements. Based solely on the
work undertaken in the course of our audit, in our opinion, the Directors’ report has been prepared in accordance with the
requirements of the Companies Act 2014
Matters on which we are required to report by exception
Based on our knowledge and understanding of the group and its environment obtained in the course of the audit, we have not
identified material misstatements in the Directors’ report.
Under the Companies Act 2014 we are required to report to you if, in our opinion, the disclosures of directors’ remuneration and
transactions specified by sections 305 to 312 of the Act have not been made. We have no exceptions to report arising from this
responsibility.
Responsibilities of management and those charged with governance for the financial statements
As explained more fully in the Directors’ responsibilities statement, management is responsible for the preparation of the financial
statements which give a true and fair view in accordance with IFRS as adopted by the European Union, and for such internal control
as they determine necessary to enable the preparation of financial statements that are free from material misstatement, whether due to
fraud or error.
In preparing the financial statements, management is responsible for assessing the group and company’s ability to continue as a going
concern, disclosing, as applicable, matters related to going concern and using the going concern basis of accounting unless
management either intends to liquidate the group or company or to cease operations, or has no realistic alternative but to do so.
Those charged with governance are responsible for overseeing the group and company’s financial reporting process.
72
INDEPENDENT AUDITOR’S REPORT TO THE MEMBERS OF TRINITY BIOTECH PLC (CONTINUED)
Responsibilities of the auditor for the audit of the financial statements
The auditor’s objectives are to obtain reasonable assurance about whether the financial statements as a whole are free from material
misstatement, whether due to fraud or error, and to issue an auditor’s report that includes their opinion. Reasonable assurance is a high
level of assurance, but is not a guarantee that an audit conducted in accordance with ISAs (Ireland) will always detect a material
misstatement when it exists. Misstatements can arise from fraud or error and are considered material if, individually or in the
aggregate, they could reasonably be expected to influence the economic decisions of users taken on the basis of these financial
statements.
As part of an audit in accordance with ISAs (Ireland), the auditor will exercise professional judgment and maintain professional
scepticism throughout the audit. The auditor will also:
Identify and assess the risks of material misstatement of the financial statements, whether due to fraud or error, design and
perform audit procedures responsive to those risks, and obtain audit evidence that is sufficient and appropriate to provide a
basis for their opinion. The risk of not detecting a material misstatement resulting from fraud is higher than for one resulting
from error, as fraud may involve collusion, forgery, intentional omissions, misrepresentations, or the override of internal
control.
Obtain an understanding of internal control relevant to the audit in order to design audit procedures that are appropriate in the
circumstances, but not for the purpose of expressing an opinion on the effectiveness of the group and company’s internal
control.
Evaluate the appropriateness of accounting policies used and the reasonableness of accounting estimates and related
disclosures made by management.
Conclude on the appropriateness of management’s use of the going concern basis of accounting and, based on the audit
evidence obtained, whether a material uncertainty exists related to events or conditions that may cast significant doubt on the
group and company’s ability to continue as a going concern. If they conclude that a material uncertainty exists, they are
required to draw attention in the auditor’s report to the related disclosures in the financial statements or, if such disclosures
are inadequate, to modify their opinion. Their conclusions are based on the audit evidence obtained up to the date of the
auditor’s report. However, future events or conditions may cause the group or company to cease to continue as a going
concern.
Evaluate the overall presentation, structure and content of the financial statements, including the disclosures, and whether the
financial statements represent the underlying transactions and events in a matter that achieves a true and fair view.
The auditor communicates with those charged with governance regarding, among other matters, the planned scope and timing of the
audit and significant audit findings, including any significant deficiencies in internal control that may be identified during the audit.
Where the auditor is reporting on the audit of a group, the auditor’s responsibilities are to obtain sufficient appropriate audit evidence
regarding the financial information of the entities or business activities within the group to express an opinion on the group financial
statements. The auditor is responsible for the direction, supervision and performance of the audit, and the auditor remains solely
responsible for the auditor’s opinion.
The auditor also provides those charged with governance with a statement that they have complied with relevant ethical requirements
regarding independence, and to communicate with them all relationships and other matters that may reasonably be thought to bear on
their independence, and where applicable, related safeguards.
From the matters communicated with those charged with governance, the auditor determines those matters that were of most
significance in the audit of the financial statements of the current period and are therefore the key audit matters. These matters are
described in the auditor’s report unless law or regulation precludes public disclosure about the matter or when, in extremely rare
circumstances, the auditor determines that a matter should not be communicated in the report because the adverse consequences of
doing so would reasonably be expected to outweigh the public interest benefits of such communication.
The purpose of our audit work and to whom we owe our responsibilities
This report is made solely to the group and company’s members, as a body, in accordance with section 391 of the Companies Act
2014. Our audit work has been undertaken so that we might state to the group and company’s members those matters we are required
to state to them in an auditor’s report and for no other purpose. To the fullest extent permitted by law, we do not accept or assume
responsibility to anyone other than the group and company and the group and company’s members as a body, for our audit work, for
this report, or for the opinions we have formed.

73
AIDAN CONNAUGHTON
For and on behalf of
Grant Thornton
Chartered Accountants & Statutory Audit Firm
Dublin
7 September 2021
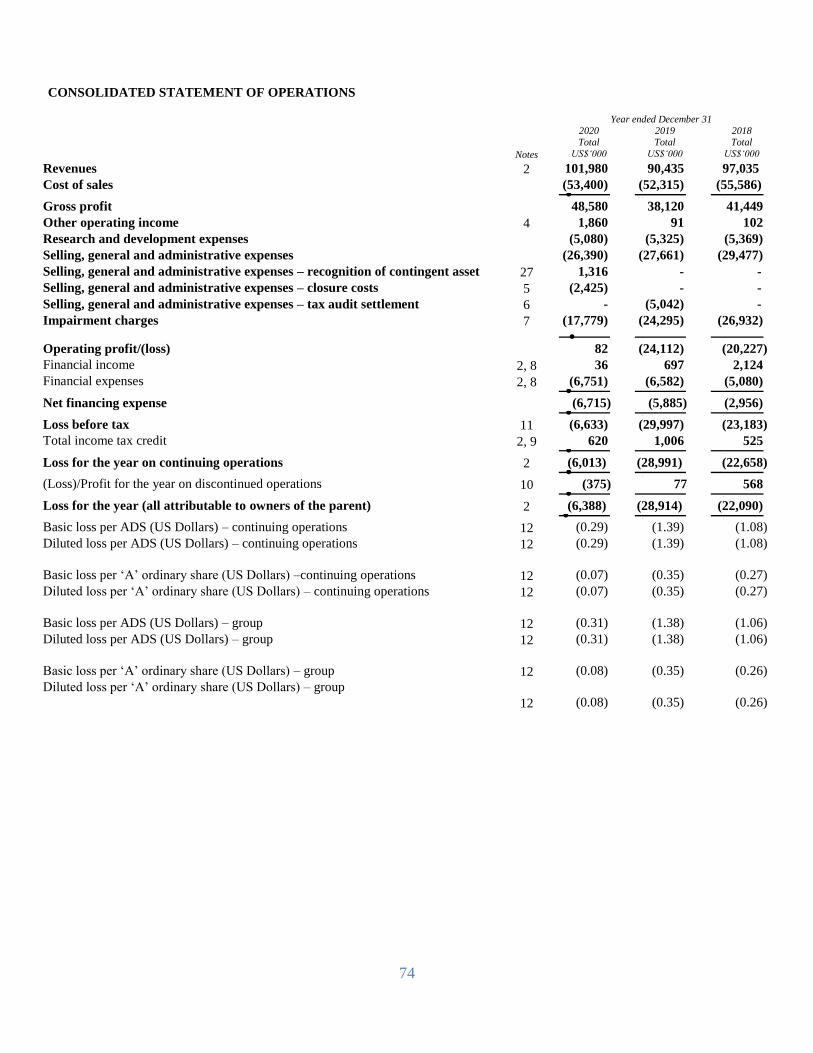
74
CONSOLIDATED STATEMENT OF OPERATIONS
Year ended December 31
Notes
2020 Total
US$‘000
2019 Total
US$‘000
2018 Total
US$‘000 Revenues 2 101,980 90,435 97,035 Cost of sales
(53,400) (52,315) (55,586)
Gross profit 48,580 38,120 41,449
Other operating income 4 1,860 91 102 Research and development expenses
(5,080) (5,325) (5,369) Selling, general and administrative expenses
(26,390) (27,661) (29,477)
Selling, general and administrative expenses – recognition of contingent asset 27 1,316 - -
Selling, general and administrative expenses – closure costs 5 (2,425) - -
Selling, general and administrative expenses – tax audit settlement 6 - (5,042) -
Impairment charges 7 (17,779) (24,295) (26,932)
Operating profit/(loss) 82 (24,112) (20,227)
Financial income 2, 8 36 697 2,124 Financial expenses 2, 8 (6,751) (6,582) (5,080)
Net financing expense (6,715) (5,885) (2,956)
Loss before tax 11 (6,633) (29,997) (23,183) Total income tax credit 2, 9 620 1,006 525
Loss for the year on continuing operations 2 (6,013) (28,991) (22,658)
(Loss)/Profit for the year on discontinued operations 10 (375) 77 568
Loss for the year (all attributable to owners of the parent) 2 (6,388) (28,914) (22,090)
Basic loss per ADS (US Dollars) – continuing operations 12 (0.29) (1.39) (1.08) Diluted loss per ADS (US Dollars) – continuing operations 12 (0.29) (1.39) (1.08)
Basic loss per ‘A’ ordinary share (US Dollars) –continuing operations 12 (0.07) (0.35) (0.27) Diluted loss per ‘A’ ordinary share (US Dollars) – continuing operations 12 (0.07) (0.35) (0.27)
Basic loss per ADS (US Dollars) – group 12 (0.31) (1.38) (1.06) Diluted loss per ADS (US Dollars) – group 12 (0.31) (1.38) (1.06)
Basic loss per ‘A’ ordinary share (US Dollars) – group 12 (0.08) (0.35) (0.26) Diluted loss per ‘A’ ordinary share (US Dollars) – group
12 (0.08)
(0.35) (0.26)
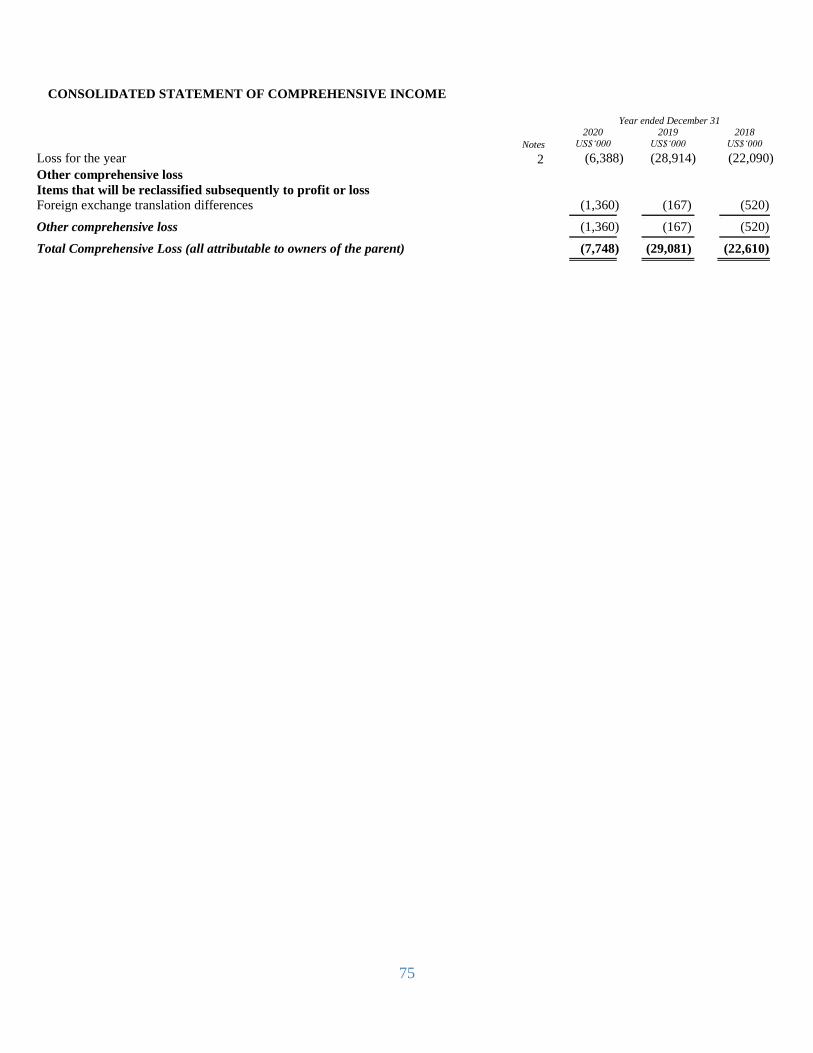
75
CONSOLIDATED STATEMENT OF COMPREHENSIVE INCOME
Year ended December 31
Notes 2020
US$‘000 2019
US$‘000 2018
US$‘000 Loss for the year 2 (6,388) (28,914) (22,090) Other comprehensive loss
Items that will be reclassified subsequently to profit or loss
Foreign exchange translation differences
(1,360) (167) (520)
Other comprehensive loss
(1,360) (167) (520)
Total Comprehensive Loss (all attributable to owners of the parent)
(7,748) (29,081) (22,610)
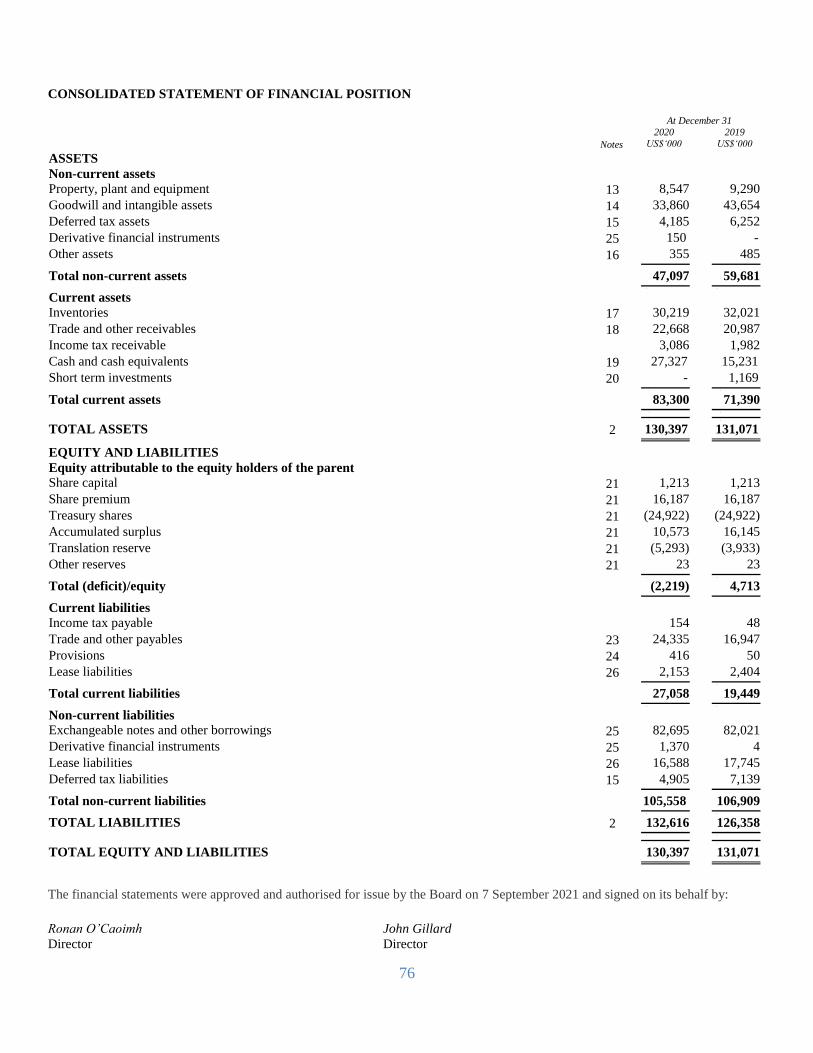
76
CONSOLIDATED STATEMENT OF FINANCIAL POSITION
At December 31
Notes 2020
US$‘000 2019
US$‘000 ASSETS
Non-current assets
Property, plant and equipment 13 8,547 9,290 Goodwill and intangible assets 14 33,860 43,654 Deferred tax assets 15 4,185 6,252 Derivative financial instruments 25 150 -
Other assets 16 355 485
Total non-current assets
47,097 59,681
Current assets
Inventories 17 30,219 32,021 Trade and other receivables 18 22,668 20,987 Income tax receivable
3,086 1,982
Cash and cash equivalents 19 27,327 15,231 Short term investments 20 - 1,169
Total current assets
83,300 71,390
TOTAL ASSETS 2 130,397 131,071
EQUITY AND LIABILITIES
Equity attributable to the equity holders of the parent
Share capital 21 1,213 1,213 Share premium 21 16,187 16,187 Treasury shares 21 (24,922) (24,922) Accumulated surplus 21 10,573 16,145 Translation reserve 21 (5,293) (3,933) Other reserves 21 23 23
Total (deficit)/equity
(2,219) 4,713
Current liabilities
Income tax payable
154 48 Trade and other payables 23 24,335 16,947 Provisions 24 416 50 Lease liabilities 26 2,153 2,404
Total current liabilities
27,058 19,449
Non-current liabilities
Exchangeable notes and other borrowings 25 82,695 82,021 Derivative financial instruments 25 1,370 4 Lease liabilities 26 16,588 17,745 Deferred tax liabilities 15 4,905 7,139
Total non-current liabilities
105,558 106,909
TOTAL LIABILITIES 2 132,616 126,358
TOTAL EQUITY AND LIABILITIES
130,397 131,071
The financial statements were approved and authorised for issue by the Board on 7 September 2021 and signed on its behalf by:
Ronan O’Caoimh John Gillard
Director Director

77
CONSOLIDATED STATEMENT OF CHANGES IN EQUITY
Share capital ‘A’ ordinary
shares US$’000
Share premium US$’000
Treasury Shares
US$’000
Translation reserve
US$’000
Hedging reserves US$’000
Accumulated surplus
US$’000
Total US$’000
Balance at January 1, 2018 1,213 16,187 (24,783) (3,246) 23 75,802 65,196 Loss for the period - - - - - (22,090) (22,090) Other comprehensive income - - - (520) - - (520)
Total comprehensive loss - - - (520) - (22,090) (22,610) Share-based payments (Note 22) - - - - - 1,607 1,607 Shares purchased (Note 21) - - (139) - - - (139)
Balance at December 31, 2018 1,213 16,187 (24,922) (3,766) 23 55,319 44,054
Balance at January 1, 2019 1,213 16,187 (24,922) (3,766) 23 55,319 44,054 Loss for the period - - - - - (28,914) (28,914) Other comprehensive income - - - (167) - - (167)
Total comprehensive loss - - - (167) - (28,914) (29,081) Share-based payments (Note 22) - - - - - 839 839 Adjustment on transition to IFRS 16 (Note 13) - - - - - (11,099) (11,099)
Balance at December 31, 2019 1,213 16,187 (24,922) (3,933) 23 16,145 4,713
Balance at January 1, 2020 1,213 16,187 (24,922) (3,933) 23 16,145 4,713 Loss for the period - - - - - (6,388) (6,388) Other comprehensive income - - - (1,360) - - (1,360)
- -
Total comprehensive loss - - - (1,360) - (6,388) (7,748) Share-based payments (Note 22) - - - - - 816 816
- -
Balance at December 31, 2020 1,213 16,187 (24,922) (5,293) 23 10,573 (2,219)
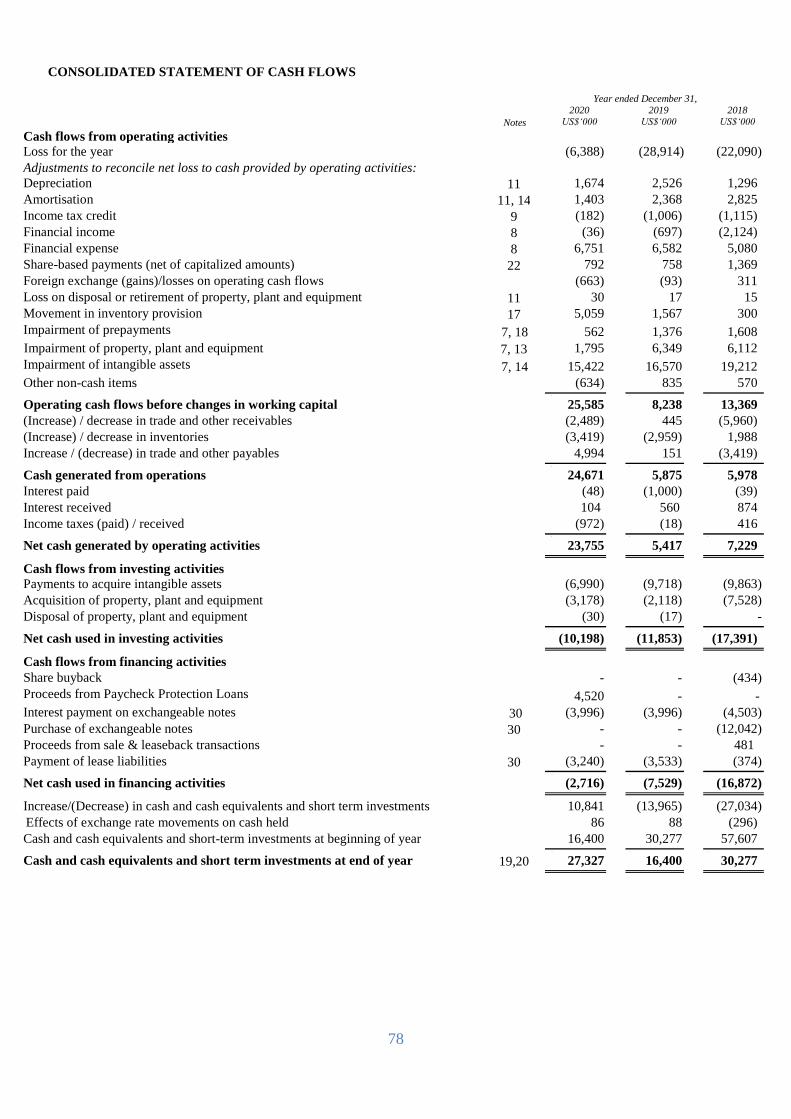
78
CONSOLIDATED STATEMENT OF CASH FLOWS
Year ended December 31,
Notes 2020
US$‘000 2019
US$‘000 2018
US$‘000 Cash flows from operating activities
Loss for the year
(6,388) (28,914) (22,090) Adjustments to reconcile net loss to cash provided by operating activities:
Depreciation 11 1,674 2,526 1,296 Amortisation 11, 14 1,403 2,368 2,825 Income tax credit 9 (182) (1,006) (1,115) Financial income 8 (36) (697) (2,124) Financial expense 8 6,751 6,582 5,080 Share-based payments (net of capitalized amounts) 22 792 758 1,369 Foreign exchange (gains)/losses on operating cash flows
(663) (93) 311
Loss on disposal or retirement of property, plant and equipment 11 30 17 15 Movement in inventory provision 17 5,059 1,567 300 Impairment of prepayments 7, 18 562 1,376 1,608 Impairment of property, plant and equipment 7, 13 1,795 6,349 6,112 Impairment of intangible assets 7, 14 15,422 16,570 19,212 Other non-cash items
(634) 835 570
Operating cash flows before changes in working capital
25,585 8,238 13,369 (Increase) / decrease in trade and other receivables
(2,489) 445 (5,960)
(Increase) / decrease in inventories
(3,419) (2,959) 1,988 Increase / (decrease) in trade and other payables
4,994 151 (3,419)
Cash generated from operations
24,671 5,875 5,978 Interest paid
(48) (1,000) (39)
Interest received
104 560 874 Income taxes (paid) / received (972) (18) 416
Net cash generated by operating activities
23,755 5,417 7,229
Cash flows from investing activities
Payments to acquire intangible assets (6,990 ) (9,718 ) (9,863) Acquisition of property, plant and equipment (3,178) (2,118) (7,528) Disposal of property, plant and equipment (30) (17) -
Net cash used in investing activities
(10,198) (11,853) (17,391)
Cash flows from financing activities
Share buyback - - (434) Proceeds from Paycheck Protection Loans 4,520 - -
Interest payment on exchangeable notes 30 (3,996) (3,996) (4,503)
Purchase of exchangeable notes 30 - - (12,042) Proceeds from sale & leaseback transactions - - 481
Payment of lease liabilities 30 (3,240) (3,533) (374)
Net cash used in financing activities
(2,716) (7,529) (16,872)
Increase/(Decrease) in cash and cash equivalents and short term investments
10,841 (13,965) (27,034) Effects of exchange rate movements on cash held
86 88 (296)
Cash and cash equivalents and short-term investments at beginning of year
16,400 30,277 57,607
Cash and cash equivalents and short term investments at end of year 19,20 27,327 16,400 30,277
79
NOTES TO THE CONSOLIDATED FINANCIAL STATEMENTS DECEMBER 31, 2020
1. BASIS OF PREPARATION AND SIGNIFICANT ACCOUNTING POLICIES
The principal accounting policies adopted by Trinity Biotech plc (“the Company”) and its subsidiaries (together the “the
Group”) are set out below.
i) General information
Trinity Biotech develops, acquires, manufactures and markets medical diagnostic products for the clinical laboratory and
point-of-care segments of the diagnostic market. These products are used to detect autoimmune, infectious and sexually
transmitted diseases, diabetes and disorders of the liver and intestine. Trinity Biotech is a significant provider of raw
materials to the life sciences and research industries globally. Trinity Biotech also operates a licenced reference laboratory
that specializes in diagnostics for autoimmune diseases.
ii) Statement of compliance
The consolidated financial statements have been prepared in accordance with International Financial Reporting Standards
(“IFRS”) both as issued by the International Accounting Standards Board (“IASB”) and as subsequently adopted by the
European Union (“EU”) (together “IFRS”). The IFRS applied are those effective for accounting periods beginning
January 1, 2020. Consolidated financial statements are required by Irish law to comply with IFRS as adopted by the EU
which differ in certain respects from IFRS as issued by the IASB. These differences predominantly relate to the timing of
adoption of new standards by the EU. However, in relation to the 2020 consolidated financial statements there are no
differences regarding the effective date of new IFRS relevant to Trinity Biotech as issued by the IASB and as adopted by
the EU. In relation to prior periods presented, none of the differences are relevant in the context of Trinity Biotech and the
consolidated financial statements comply with IFRS both as issued by the IASB and as adopted by the EU.
iii) Basis of preparation
The consolidated financial statements have been prepared in United States Dollars (US$), rounded to the nearest thousand,
under the historical cost basis of accounting, except for derivative financial instruments, certain balances arising on
acquisition of subsidiary entities and share-based payments which are initially recorded at fair value. Derivative financial
instruments are also subsequently revalued and carried at fair value.
The preparation of financial statements in conformity with IFRS requires management to make judgements, estimates and
assumptions that affect the application of policies and amounts reported in the financial statements and accompanying notes.
The estimates and associated assumptions are based on historical experience and various other factors that are believed to
be reasonable under the circumstances, the results of which form the basis of making the judgements about the carrying
value of assets and liabilities that are not readily apparent from other sources. Actual results may differ from these estimates.
The estimates and underlying assumptions are reviewed on an ongoing basis. Revisions to accounting estimates are
recognised in the period in which the estimate is revised if the revision affects only that period or in the period of the revision
and future periods if the revision affects both current and future periods.
Judgements made by management that have a significant effect on the financial statements and estimates with a significant
risk of material adjustment in the next year are discussed in Note 32.
The directors have considered the Group’s current financial position and cash flow projections, taking into account all known
events and developments including the Covid-19 pandemic. The directors believe that the Group will be able to continue
its operations for at least the next 12 months from the date of this report and that it is appropriate to continue to prepare the
consolidated financial statements on a going concern basis. In making this assessment, the directors have considered the
potential repayment in April 2022 of part or all of the US$99.9m exchangeable notes under the terms of the indenture for
such exchangeable notes.
The directors have considered the various financing options expected to be available to the Group to assist it in meeting any
repayment obligations under the exchangeable notes over the next 12 months, to the extent such obligations cannot be met
from cash on hand, including refinancing the debt, repaying the debt with the proceeds from equity or debt offerings and the
sale of assets. As with all such potential transactions, there are risks to successfully implement such transactions and the
directors have considered these risks when considering the financing options and the appropriateness of adopting a going
concern basis of accounting.
80
NOTES TO THE CONSOLIDATED FINANCIAL STATEMENTS DECEMBER 31, 2020
1. BASIS OF PREPARATION AND SIGNIFICANT ACCOUNTING POLICIES
The accounting policies set out below have been applied consistently to all periods presented in these consolidated
financial statements. The accounting policies have been applied consistently by all Group entities.
iv) Basis of consolidation
Subsidiaries
Subsidiaries are entities controlled by the Company. Control exists when the Company has the power, directly or indirectly,
to govern the financial and reporting policies of an entity so as to obtain benefits from its activities. In assessing control,
potential voting rights that presently are exercisable or convertible are taken into account. The financial statements of
subsidiaries are included in the consolidated financial statements from the date that control commences until the date that
control ceases.
Transactions eliminated on consolidation
Intra-group balances and any unrealised gains or losses or income and expenses arising from intra-group transactions are
eliminated in preparing the consolidated financial statements.
v) Property, plant and equipment
Owned assets
Items of property, plant and equipment are stated at cost less any accumulated depreciation and any impairment losses (see
Note 1(viii)). The cost of self-constructed assets includes the cost of materials, direct labour and attributable overheads. It is
not Group policy to revalue any items of property, plant and equipment.
Depreciation is charged to the statement of operations on a straight-line basis to write-off the cost of the assets over their
expected useful lives as follows:
• Leasehold improvements 5-15 years
• Buildings 50 years
• Office equipment and fittings 10 years
• Computer equipment 3-5 years
• Plant and equipment 2-15 years
Land is not depreciated. The residual values, if not insignificant, useful lives and depreciation methods of property, plant
and equipment are reviewed and adjusted if appropriate on a prospective basis, at each balance sheet date. There were no
changes to useful lives in the year.
Leased assets - as lessee
The Group has applied IFRS 16, Leases, using the modified retrospective approach and therefore comparative information
has not been restated.
Accounting policy applicable from 1 January 2019
For any new contracts entered into on or after 1 January 2019, the Group considers whether a contract is, or contains a lease.
A lease is defined as ‘a contract, or part of a contract, that conveys the right to use an asset (the underlying asset) for a period
of time in exchange for consideration’. To apply this definition the Group assesses whether the contract meets three key
evaluations which are whether:
81
NOTES TO THE CONSOLIDATED FINANCIAL STATEMENTS DECEMBER 31, 2020
1. BASIS OF PREPARATION AND SIGNIFICANT ACCOUNTING POLICIES (CONTINUED)
the contract contains an identified asset, which is either explicitly identified in the contract or implicitly specified
by being identified at the time the asset is made available to the Group
the Group has the right to obtain substantially all of the economic benefits from use of the identified asset
throughout the period of use, considering its rights within the defined scope of the contract
the Group has the right to direct the use of the identified asset throughout the period of use. The Group assess
whether it has the right to direct ‘how and for what purpose’ the asset is used throughout the period of use.
At lease commencement date, the Group recognises a right-of-use asset and a lease liability on the balance sheet. The right-
of-use asset is measured at cost, which is made up of the initial measurement of the lease liability, any initial direct costs
incurred by the Group, an estimate of any costs to dismantle and remove the asset at the end of the lease, and any lease
payments made in advance of the lease commencement date (net of any incentives received).
The Group depreciates the right-of-use assets on a straight-line basis from the lease commencement date to the earlier of the
end of the useful life of the right-of-use asset or the end of the lease term. The Group also assesses the right-of-use asset for
impairment when such indicators exist.
At the commencement date, the Group measures the lease liability at the present value of the lease payments unpaid at that
date, discounted using the interest rate implicit in the lease if that rate is readily available or the Group’s incremental
borrowing rate. Lease payments included in the measurement of the lease liability are made up of fixed payments (including
in substance fixed), variable payments based on an index or rate, amounts expected to be payable under a residual value
guarantee and payments arising from options reasonably certain to be exercised. Subsequent to initial measurement, the
liability will be reduced for payments made and increased for interest. It is remeasured to reflect any reassessment or
modification, or if there are changes in in-substance fixed payments. When the lease liability is remeasured, the
corresponding adjustment is reflected in the right-of-use asset, or profit and loss if the right-of-use asset is already reduced
to zero.
The Group has elected to account for short-term leases and leases of low-value assets using the practical expedients.
Instead of recognising a right-of-use asset and lease liability, the payments in relation to these are recognised as an
expense in profit or loss on a straight-line basis over the lease term. On the statement of financial position, right-of-use
assets have been included in property, plant and equipment and lease liabilities have been included in separate lines within
the current liabilities and non-current liabilities sections.
Leased assets - as lessor
The Group’s accounting policy under IFRS 16 has not changed from the comparative period. As a lessor, the Group classifies
its leases as either operating or finance leases. A lease is classified as a finance lease if it transfers substantially all the risks
and rewards incidental to ownership of the underlying asset, and classified as an operating lease if it does not.
Accounting policy applicable before 1 January 2019
Leased assets – as lessee
Leases under terms of which the Group assumes substantially all the risks and rewards of ownership are classified as finance
leases. Property, plant and equipment acquired by way of finance lease is stated at an amount equal to the lower of its fair
value and present value of the minimum lease payments at inception of the lease, less accumulated depreciation and any
impairment losses. Lease payments are apportioned between finance charges and reduction of the lease liability so as to
achieve a constant rate of interest on the remaining balance of the liability. Finance charges are recognised in financial
expenses in the statement of operations.
Depreciation is calculated in order to write-off the amounts capitalised over the estimated useful lives of the assets, or the
lease term if shorter, by equal annual instalments. The excess of the total rentals under a lease over the amount capitalised
is treated
82
NOTES TO THE CONSOLIDATED FINANCIAL STATEMENTS DECEMBER 31, 2020
1. BASIS OF PREPARATION AND SIGNIFICANT ACCOUNTING POLICIES (CONTINUED)
as interest, which is charged to the statement of operations in proportion to the amount outstanding under the lease. Leased
assets are reviewed for impairment (see Note 1(viii)).
Leases other than finance leases are classified as “operating leases”, and the rentals thereunder are charged to the statement
of operations on a straight-line basis over the period of the leases. Lease incentives are recognised in the statement of
operations on a straight-line basis over the lease term.
Leased assets – as lessor
Leases where the Group substantially transfers the risks and benefits of ownership of the asset to the customer are classified
as finance leases within finance lease receivables. The Group recognises the amount receivable from assets leased under
finance leases at an amount equal to the net investment in the lease. Finance lease income is recognised as revenue in the
statement of operations reflecting a constant periodic rate of return on the Group’s net investment in the lease.
Assets provided to customers under leases other than finance leases are classified as operating leases and carried in property,
plant and equipment at cost and are depreciated on a straight-line basis over the useful life of the asset or the lease term, if
shorter.
Subsequent costs
The Group recognises in the carrying amount of an item of property, plant and equipment the cost of replacing part of such
an item when that cost is incurred if it is probable that the future economic benefits embodied within the item will flow to
the Group and the cost of the replaced item can be measured reliably. All other costs are recognised in the statement of
operations as an expense as incurred. vi) Goodwill
In respect of business combinations that have occurred since January 1, 2004 (being the transition date to IFRS), goodwill
represents the difference between the cost of the acquisition and the fair value of the net identifiable assets acquired.
In respect of acquisitions prior to this date, goodwill is included on the basis of its deemed cost, which represents the amount
recorded under the old basis of accounting, Irish GAAP, (“Previous GAAP”). Save for retrospective restatement of deferred
tax as an adjustment to retained earnings in accordance with IAS 12, Income Taxes, the classification and accounting
treatment of business combinations undertaken prior to the transition date were not reconsidered in preparing the Group’s
opening IFRS balance sheet as at January 1, 2004.
To the extent that the Group’s interest in the net fair value of the identifiable assets, liabilities and contingent liabilities
acquired exceeds the cost of a business combination, the identification and measurement of the related assets, liabilities and
contingent liabilities are revisited accompanied by a reassessment of the cost of the transaction, and any remaining balance
is immediately recognised in the statement of operations.
At the acquisition date, any goodwill is allocated to each of the cash generating units expected to benefit from the
combination’s synergies. Following initial recognition, goodwill is stated at cost less any accumulated impairment losses
(see Note 1(viii)).
vii) Intangibles, including research and development (other than goodwill)
An intangible asset, which is an identifiable non-monetary asset without physical substance, is recognised to the extent that
it is probable that the expected future economic benefits attributable to the asset will flow to the Group and that its cost can
be measured reliably. The asset is deemed to be identifiable when it is separable (that is, capable of being divided from the
entity and sold, transferred, licenced, rented or exchanged, either individually or together with a related contract, asset or
liability) or when it arises from contractual or other legal rights, regardless of whether those rights are transferable or
separable from the Group or from other rights and obligations.
Intangible assets acquired as part of a business combination are capitalised separately from goodwill if the intangible asset
meets the definition of an asset and the fair value can be reliably measured on initial recognition. Subsequent to initial
recognition, these intangible assets are carried at cost less any accumulated amortisation and any accumulated impairment
losses (Note 1(viii)). Intangible assets with definite useful lives are reviewed for indicators of impairment annually while
intangible assets with indefinite useful lives and those not yet brought into use are tested for impairment annually, either
individually or at the cash generating unit level.
83
NOTES TO THE CONSOLIDATED FINANCIAL STATEMENTS DECEMBER 31, 2020
1. BASIS OF PREPARATION AND SIGNIFICANT ACCOUNTING POLICIES (CONTINUED)
Expenditure on development activities, whereby research findings are applied to a plan or design for the production of new
or substantially improved products and processes, is capitalised if the product or process is technically and commercially
feasible and the Group has sufficient resources to complete the development. The expenditure capitalised includes the cost
of materials, direct labour and attributable overheads and third party costs. Subsequent expenditure on capitalised intangible
assets is capitalised only when it increases the future economic benefits embodied in the specific asset to which it relates.
The technical feasibility of a new product is determined by a specific feasibility study undertaken at the first stage of any
development project. The majority of our new product developments involve the transfer of existing product know-how to
a new application. Since the technology is already proven in an existing product which is being used by customers, this
facilitates the proving of the technical feasibility of that same technology in a new product.
The results of the feasibility study are reviewed by a design review committee comprising senior managers. The feasibility
study occurs in the initial research phase of a project and costs in this phase are not capitalised.
The commercial feasibility of a new product is determined by preparing a discounted cash flow projection. This projection
compares the discounted sales revenues for future periods with the relevant costs. As part of preparing the cash flow
projection, the size of the relevant market is determined, feedback is sought from customers and the strength of the proposed
new product is assessed against competitors’ offerings. Once the technical and commercial feasibility has been established
and the project has been approved for commencement, the project moves into the development phase.
All other development expenditure is expensed as incurred. Subsequent to initial recognition, the capitalised development
expenditure is carried at cost less any accumulated amortisation and any accumulated impairment losses (Note 1(viii)).
Expenditure on research activities, undertaken with the prospect of gaining new scientific or technical knowledge and
understanding, is recognised in the statement of operations as an expense as incurred.
Expenditure on internally generated goodwill and brands is recognised in the statement of operations as an expense as
incurred.
Amortisation
Amortisation is charged to the statement of operations on a straight-line basis over the estimated useful lives of intangible
assets, unless such lives are indefinite. Intangible assets are amortised from the date they are available for use in its intended
market. The estimated useful lives are as follows:
• Capitalised development costs 15 years
• Patents and licences 6-15 years
• Other (including acquired customer and supplier lists) 6-15 years
The Group uses a useful economic life of 15 years for capitalised development costs. This is a conservative estimate of the
likely life of the products. The Group is confident that products have a minimum of 15 years life given the inertia that
characterizes the medical diagnostics industry and the barriers to enter into the industry. The following factors have been
considered in estimating the useful life of developed products:
(a) once a diagnostic test becomes established, customers are reluctant to change to new technology until it is fully proven,
thus resulting in relatively long product life cycles. There is also reluctance in customers to change to a new product
as it can be costly both in terms of the initial changeover cost and as new technology is typically more expensive.
(b) demand for the diagnostic tests is enduring and robust within a wide geographic base. The diseases that the products
diagnose are widely prevalent (HIV, Diabetes and Chlamydia being just three examples) in many countries. There is
a general consensus that these diseases will continue to be widely prevalent in the future.
(c) there are significant barriers to new entrants in this industry. Patents and/or licences are in place for many of our
products, though this is not the only barrier to entry. There is a significant cost and time to develop new products, it is
necessary to obtain regulatory approval and tests are protected by proprietary know-how, manufacturing techniques
and trade secrets.
84
NOTES TO THE CONSOLIDATED FINANCIAL STATEMENTS DECEMBER 31, 2020
1. BASIS OF PREPARATION AND SIGNIFICANT ACCOUNTING POLICIES (CONTINUED)
Certain trade names acquired are deemed to have an indefinite useful life as there is no foreseeable limit to the period over
which these assets are expected to generate cash inflows for the Group.
Where amortisation is charged on assets with finite lives, this expense is taken to the statement of operations through the
‘selling, general and administrative expenses’ line.
Useful lives are examined on an annual basis and adjustments, where applicable, are made on a prospective basis.
viii) Impairment
The carrying amount of the Group’s assets, other than inventories, accounts receivable, cash and cash equivalents, short-
term investments and deferred tax assets, are reviewed at each balance sheet date to determine whether there is any indication
of impairment. If any such indication exists, the asset’s recoverable amount (being the greater of fair value less costs to sell
and value in use) is assessed at each balance sheet date.
Fair value less costs to sell is defined as the amount obtainable from the sale of an asset or cash-generating unit in an arm’s
length transaction between knowledgeable and willing parties, less the costs that would be incurred on disposal. Value in
use is defined as the present value of the future cash flows expected to be derived through the continued use of an asset or
cash-generating unit. In assessing value in use, the estimated future cash flows are discounted to their present value using a
pre-tax discount rate that reflects current market assessments of the time value of money and the risks specific to the asset
for which the future cash flow estimates have not yet been adjusted. The estimates of future cash flows exclude cash inflows
or outflows attributable to financing activities. For an asset that does not generate largely independent cash flows, the
recoverable amount is determined by reference to the cash generating unit to which the asset belongs.
For goodwill, assets that have an indefinite useful life and intangible assets that are not yet available for use, the recoverable
amount is estimated at each balance sheet date at the cash generating unit level. The goodwill and indefinite-lived assets
were reviewed for impairment at December 31, 2019 and December 31, 2020. See Note 14.
In-process research and development (IPR&D) is tested for impairment on an annual basis, in the fourth quarter, or more
frequently if impairment indicators are present, using projected discounted cash flow models. If IPR&D becomes impaired
or is abandoned, the carrying value of the IPR&D is written down to its revised fair value with the related impairment charge
recognised in the period in which the impairment occurs. If the fair value of the asset becomes impaired as the result of
unfavorable data from any ongoing or future clinical trial, changes in assumptions that negatively impact projected cash
flows, or because of any other information regarding the prospects of successfully developing or commercializing our
programs, we could incur significant charges in the period in which the impairment occurs. The valuation techniques utilized
in performing impairment tests incorporate significant assumptions and judgments to estimate the fair value, as described
above. The use of different valuation techniques or different assumptions could result in materially different fair value
estimates.
An impairment loss is recognised whenever the carrying amount of an asset or its cash-generating unit exceeds its
recoverable amount. Impairment losses are recognised in the statement of operations.
Impairment losses recognised in respect of cash-generating units are allocated first to reduce the carrying amount of any
goodwill allocated to cash-generating units and then to reduce the carrying amount of other assets in the cash-generating
units on a pro-rata basis.
An impairment loss is reversed only to the extent that the asset’s carrying amount does not exceed the carrying amount that
would have been determined, net of depreciation or amortisation, if no impairment loss had been recognised.
An impairment loss in respect of goodwill is not reversed.
Following recognition of any impairment loss (and on recognition of an impairment loss reversal), the depreciation or
amortisation charge applicable to the asset or cash generating unit is adjusted prospectively with the objective of
systematically allocating the revised carrying amount, net of any residual value, over the remaining useful life.

85
NOTES TO THE CONSOLIDATED FINANCIAL STATEMENTS DECEMBER 31, 2020
1. BASIS OF PREPARATION AND SIGNIFICANT ACCOUNTING POLICIES (CONTINUED) ix) Inventories
Inventories are stated at the lower of cost and net realisable value. Cost is based on the first-in, first-out principle and includes
all expenditure which has been incurred in bringing the products to their present location and condition, and includes an
appropriate allocation of manufacturing overhead based on the normal level of operating capacity. Net realisable value is
the estimated selling price of inventory on hand in the ordinary course of business less all further costs to completion and
costs expected to be incurred in selling these products.
The Group provides for inventory, based on estimates of the expected realisability. The estimated realisability is evaluated
on a case-by-case basis and any inventory that is approaching its “use-by” date and for which no further re-processing can
be performed is written off. Any reversal of an inventory provision is recognised in the statement of operations in the year
in which the reversal occurs.
x) Trade and other receivables
Trade receivables are amounts due from customers for products sold or services provided in the ordinary course of business.
Trade and other receivables are stated at their amortised cost less impairment losses incurred. Cost approximates fair value
given the short term nature of these assets. The Group records the loss allowance as lifetime expected credit losses. These
are the expected shortfalls in contractual cash flows, considering the potential for default at any point during the life of the
financial instrument. Expected credit losses are recorded on all of trade receivables based on an assessment of each individual
debtor taking into account the probability of default or delinquency in payments and the probability that debtor will enter
into financial difficulties or bankruptcy.
xi) Trade and other payables
Trade payables are obligations to pay for goods or services that have been acquired in the ordinary course of business. Trade
and other payables are stated at cost. Cost approximates fair value given the short term nature of these liabilities.
xii) Cash and cash equivalents
Cash and cash equivalents comprise cash balances and short-term deposits which are readily available at year-end. Deposits
with maturities less than six months as at the year-end date are recognised as cash and cash equivalents and are carried at
fair value when there is no expected loss in value on early termination. The Group has no short-term bank overdraft facilities.
Where restrictions are imposed by third parties, such as lending institutions, on cash balances held by the Group these are
treated as financial assets in the financial statements.
xiii) Short-term investments
Short-term investments comprise short-term bank deposits which have maturities greater than six months as at the year-end
date. Short-term deposits made for varying periods depending on the immediate cash requirements of the Group and earn
interest at the respective deposit rates in place. Where restrictions are imposed by third parties, such as lending institutions,
on short-term deposits held by the Group these are treated as financial assets in the financial statements.
xiv) Share-based payments For equity-settled share-based payments (share options), the Group measures the services received and the corresponding
increase in equity at fair value at the measurement date (which is the grant date) using a trinomial model. Given that the
share options granted do not vest until the completion of a specified period of service, the fair value, which is assessed at
the grant date, is recognised on the basis that the services to be rendered by employees as consideration for the granting of
share options will be received over the vesting period.

86
NOTES TO THE CONSOLIDATED FINANCIAL STATEMENTS DECEMBER 31, 2020
1. BASIS OF PREPARATION AND SIGNIFICANT ACCOUNTING POLICIES (CONTINUED)
The share options issued by the Group are not subject to market-based vesting conditions as defined in IFRS 2, Share-based
Payment. Non-market vesting conditions are not taken into account when estimating the fair value of share options as at the
grant date; such conditions are taken into account through adjusting the number of equity instruments included in the
measurement of the transaction amount so that, ultimately, the amount recognised equates to the number of equity
instruments that actually vest. The expense in the statement of operations in relation to share options represents the product
of the total number of options anticipated to vest and the fair value of those options; this amount is allocated to accounting
periods on a straight-line basis over the vesting period. Given that the performance conditions underlying the Group’s share
options are non-market in nature, the cumulative charge to the statement of operations is only reversed where the
performance condition is not met or where an employee in receipt of share options relinquishes service prior to completion
of the expected vesting period. Share based payments, to the extent they relate to direct labour involved in development
activities, are capitalised, see Note 1(vii).
The proceeds received net of any directly attributable transaction costs are credited to share capital (nominal value) and
share premium when the options are exercised. The Group does not operate any cash-settled share-based payment schemes
or share-based payment transactions with cash alternatives as defined in IFRS 2.
xv) Government grants and financial support
The Group has received government-backed Covid-19 financial supports in the form of forgivable loans. Under IAS 20,
Accounting for Government Grants, a forgivable loan from government is treated as a government grant when there is
reasonable assurance that the terms for forgiveness of the loan will be met. Where a loan was received in the financial year
but not yet forgiven within the financial year, the loan is treated as a current liability. The Group has opted to present
government grant income for loans that have been forgiven as Other operating income in the Consolidated Statement of
Operations.
Grants that compensate the Group for expenses incurred such as research and development, employment and training are
recognised as income in the statement of operations on a systematic basis in the same periods in which the expenses are
incurred. Grants that compensate the Group for the cost of an asset are recognised in the statement of operations as other
operating income on a systematic basis over the useful life of the asset.
xvi) Revenue recognition
Goods sold and services rendered
The Group recognises revenue when it transfers control over a good or service to a customer. Revenue is recognised to the
extent that it is probable that economic benefit will flow to the Group and the revenue can be measured. No revenue is
recognised if there is uncertainty regarding recovery of the consideration due at the outset of the transaction. Revenue,
including any amounts invoiced for shipping and handling costs, represents the value of goods and services supplied to
external customers, net of discounts and rebates and excluding sales taxes.
Revenue from products is generally recorded as of the date of shipment, consistent with typical ex-works shipment terms.
Where the shipment terms do not permit revenue to be recognised as of the date of shipment, revenue is recognised when
the Group has satisfied all of its performance obligations to the customer in accordance with the shipping terms.
Some contracts oblige the Group to ship product to the customer ahead of the agreed payment schedule. For these shipments,
a contract asset is recognised when control over the goods has transferred to the customer. The financing component is
insignificant as invoicing for these shipments occurs within a short period of time after shipment has occurred and standard
30 day credit terms apply. Some contracts could be regarded as offering the customer a right of return. Due to the uncertainty
of the magnitude and likelihood of product returns, there is a level of estimation involved in assessing the amount of revenue
to be recognized for these type of contracts. In accordance with IFRS 15, when estimating the effect of an uncertainty on an
amount of variable consideration to which the Group will be entitled, all information that is reasonably available, including
historical, current and forecast, is considered.
The Group operates a licenced referenced laboratory in the US, which provides testing services to institutional customers
and insurance companies. In the US, there are rules requiring all insurance companies to be billed the same amount per test.
However, the amount that each insurance company pays for a particular test varies according to their own internal policies
and this can typically be considerably less than the amount invoiced. We recognise lab services revenue for insurance
companies by taking the invoiced amount and reducing it by an estimated percentage based on historical payment data. We
review the percentage
87
NOTES TO THE CONSOLIDATED FINANCIAL STATEMENTS DECEMBER 31, 2020
1. BASIS OF PREPARATION AND SIGNIFICANT ACCOUNTING POLICIES (CONTINUED)
reduction annually based on the latest data. As a practical expedient, and in accordance with IFRS, we apply a portfolio
approach to the insurance companies as they have similar characteristics. We judge that the effect on the financial statements
of using a portfolio approach for the insurance companies will not differ materially from applying IFRS 15 to the individual
contracts within that portfolio.
Revenue from services rendered is recognised in the statement of operations in proportion to the stage of completion of the
transaction at the balance sheet date.
The Group leases instruments to customers typically as part of a bundled package. Where a contract has multiple
performance obligations and its duration is greater than one year, the transaction price is allocated to the performance
obligations in the contract by reference to their relative standalone selling prices. For contracts where control of the
instrument is transferred to the customer, the fair value of the instrument is recognised as revenue at the commencement of
the lease and is matched by the related cost of sale. Fair value is determined on the basis of standalone selling price. In the
case where control of the instrument does not transfer to the customer, revenue is recognised on the basis of customer usage
of the instrument. See also Note 1(v).
In obtaining these contracts, the Group incurs a number of incremental costs, such as sales bonus paid to sales staff
commissions paid to distributors and royalty payments. As the amortisation period of these costs, if capitalised, would be
less than one year, the Group makes use of the practical expedient in IFRS 15.94 and expenses them as they incur.
A receivable is recognised when the goods are delivered as this is the point in time that the consideration is unconditional
because only the passage of time is required before the payment is due.
The Group’s obligation to provide a refund for faulty products under the standard warranty terms is recognised as a provision,
see Note 24 for details.
Other operating income
Other operating income includes income for the provision of canteen services. This income has not been treated as revenue
since the canteen activities are incidental to the main revenue-generating activities of the Group. Other operating income
also includes government-backed Covid-19 financial supports. The accounting policy for this income is described in Note 1
(xv).
xvii) Employee benefits
Defined contribution plans
The Group operates defined contribution schemes in various locations where its subsidiaries are based. Contributions to the
defined contribution schemes are recognised in the statement of operations in the period in which the related service is
received from the employee.
Other long-term benefits
Where employees participate in the Group’s other long-term benefit schemes (such as permanent health insurance schemes
under which the scheme insures the employees), or where the Group contributes to insurance schemes for employees, the
Group pays an annual fee to a service provider, and accordingly the Group expenses such payments as incurred.
Termination benefits
Termination benefits are recognised as an expense when the Group is demonstrably committed, without realistic possibility
of withdrawal, to a formal detailed plan to either terminate employment before normal retirement date, or to provide
termination benefits as a result of an offer made to encourage voluntary redundancy.
xviii) Foreign currency
A majority of the revenue of the Group is generated in US Dollars. The Group’s management has determined that the
US Dollar is the primary currency of the economic environment in which the Company and its subsidiaries (with the
exception of the Group’s subsidiaries in Brazil, Canada and Sweden) principally operate. Thus the functional currency of
the Company and its subsidiaries (other than the Brazilian, Canadian and Swedish subsidiaries) is the US Dollar. The
functional currency of the Brazilian entity is the Brazilian Real, the functional currency of the Canadian subsidiary, Nova
Century Scientific Inc, is the Canadian Dollar and the functional currency of the Swedish subsidiary is the Swedish Kroner.
The presentation currency of the
88
NOTES TO THE CONSOLIDATED FINANCIAL STATEMENTS DECEMBER 31, 2020
1. BASIS OF PREPARATION AND SIGNIFICANT ACCOUNTING POLICIES (CONTINUED)
Company and Group is the US Dollar. Monetary assets and liabilities denominated in foreign currencies are translated at the
rates of exchange ruling at the balance sheet date. The resulting gains and losses are included in the statement of operations.
Non-monetary assets and liabilities that are measured in terms of historical cost in a foreign currency are translated using
the exchange rate at the date of the transaction.
Results and cash flows of subsidiary undertakings, which have a functional currency other than the US Dollar, are translated
into US Dollars at average exchange rates for the year, and the related balance sheets have been translated at the rates of
exchange ruling on the balance sheet date. Any exchange differences arising from the translations are recognised in the
currency translation reserve via the statement of changes in equity.
Where Euro, Brazilian Real, Canadian Dollar or Swedish Kroner amounts have been referenced in this document, their
corresponding US Dollar equivalent has also been included and these equivalents have been calculated with reference to the
foreign exchange rates prevailing at December 31, 2020. xix) Hedging
The activities of the Group expose it primarily to changes in foreign exchange rates and interest rates. The Group uses
derivative financial instruments, from time to time, such as forward foreign exchange contracts to hedge these exposures.
The Group enters into forward contracts to sell US Dollars forward for Euro. The principal exchange risk identified by the
Group is with respect to fluctuations in the Euro as a substantial portion of its expenses are denominated in Euro but its
revenues are primarily denominated in US Dollars. Trinity Biotech monitors its exposure to foreign currency movements
and may use these forward contracts as cash flow hedging instruments whose objective is to cover a portion of this Euro
expense.
At the inception of a hedging transaction entailing the use of derivatives, the Group documents the relationship between the
hedged item and the hedging instrument together with its risk management objective and the strategy underlying the
proposed transaction. The Group also documents its quarterly assessment of the effectiveness of the hedge in offsetting
movements in the cash flows of the hedged items.
Derivative financial instruments are recognised at fair value. Where derivatives do not fulfil the criteria for hedge accounting,
they are classified as held-for-trading and changes in fair values are reported in the statement of operations. The fair value
of forward exchange contracts is calculated by reference to current forward exchange rates for contracts with similar maturity
profiles and equates to the current market price at the balance sheet date.
The portion of the gain or loss on a hedging instrument that is deemed to be an effective cash flow hedge is recognised
directly in the hedging reserve in equity and the ineffective portion is recognised in the statement of operations. As the
forward contracts are exercised the net cumulative gain or loss recognised in the hedging reserve is transferred to the
statement of operations and reflected in the same line as the hedged item.
xx) Exchangeable notes and derivative financial instruments
The Company’s exchangeable notes are treated as a host debt instrument with embedded derivatives attached. On initial
recognition, the host debt instrument is recognised at the residual value of the total net proceeds of the bond issue less fair
value of the embedded derivatives. Subsequently, the host debt instrument is measured at amortised cost using the effective
interest rate method.
The embedded derivatives are initially recognised at fair value and are restated at their fair value at each reporting date. The
fair value changes of the embedded derivatives are recognised in the statement of operations, except for changes in fair value
related to the Group’s own credit risk, which are recorded in the statement of comprehensive income.
Where the exchangeable notes are redeemed early or repurchased in a way that does not alter the original conversion
privileges, the consideration paid is allocated to the respective components and the amount of any gain or loss is recognised
in the consolidated statement of operations.
xxi) Segment reporting
Operating segments are reported in a manner consistent with the internal reporting provided to the chief operating decision-
maker. The chief operating decision-maker, who is responsible for allocating resources and assessing performance of the
operating segments, has been identified as the Board of Directors.
89
NOTES TO THE CONSOLIDATED FINANCIAL STATEMENTS DECEMBER 31, 2020
1. BASIS OF PREPARATION AND SIGNIFICANT ACCOUNTING POLICIES (CONTINUED)
xxii) Tax (current and deferred)
Income tax on the profit or loss for the year comprises current and deferred tax. Income tax is recognised in the statement
of operations except to the extent that it relates to items recognised directly in equity, in which case it is recognised in equity.
Current tax represents the expected tax payable or recoverable on the taxable profit for the year using tax rates enacted or
substantively enacted at the balance sheet date in the countries where the company and its subsidiaries operate and generate
income, and taking into account any adjustments stemming from prior years.
Deferred tax is provided on the basis of the balance sheet liability method on all temporary differences at the balance sheet
date which is defined as the difference between the tax bases of assets and liabilities and their carrying amounts in the
financial statements. Deferred tax assets and liabilities are not subject to discounting and are measured at the tax rates that
are anticipated to apply in the period in which the asset is realised or the liability is settled based on tax rates and tax laws
that have been enacted or substantively enacted at the balance sheet date. Deferred tax assets are recognised when it is
probable that future taxable profits will be available to utilize the associated losses or temporary differences. The amount of
deferred tax provided is based on the expected manner of realisation or settlement of the carrying amount of assets and
liabilities.
Deferred tax assets and liabilities are recognised for all temporary differences (that is, differences between the carrying
amount of the asset or liability and its tax base) with the exception of the following:
i. Where the deferred tax liability arises from goodwill not deductible for tax purposes or the initial recognition of an
asset or a liability in a transaction that is not a business combination and affects neither the accounting profit nor the
taxable profit or loss at the time of the transaction; and
ii. Where, in respect of temporary differences associated with investments in subsidiary undertakings, the timing of the
reversal of the temporary difference is subject to control and it is probable that the temporary difference will not
reverse in the foreseeable future.
Where goodwill is tax deductible, a deferred tax liability is not recognised on initial recognition of goodwill. It is recognised
subsequently for the taxable temporary difference which arises when the goodwill is amortised for tax with no corresponding
adjustment to the carrying value of the goodwill.
The carrying amounts of deferred tax assets are subject to review at each balance sheet date and are derecognised to the
extent that future taxable profits are considered to be inadequate to allow all or part of any deferred tax asset to be utilised.
xxiii) Provisions
A provision is recognised in the balance sheet when the Group has a present legal or constructive obligation as a result of a
past event, and it is probable that an outflow of economic benefits will be required to settle the obligation.
xxiv) Cost of sales
Cost of sales comprises product cost including manufacturing and payroll costs, quality control, shipping, handling, and
packaging costs and the cost of services provided.
xxv) Finance income and costs
Financing expenses comprise interest costs payable on leases and exchangeable notes. Interest payable on finance leases is
allocated to each period during the lease term so as to produce a constant periodic rate of interest on the remaining balance
of the liability. Financing expenses also includes the financing element of long term liabilities which have been discounted.
Finance income includes interest income on deposits and is recognised in the statement of operations as it accrues, using the
effective interest method. Finance income also includes fair value adjustments to embedded derivatives associated with
exchangeable notes.

90
NOTES TO THE CONSOLIDATED FINANCIAL STATEMENTS DECEMBER 31, 2020
1. BASIS OF PREPARATION AND SIGNIFICANT ACCOUNTING POLICIES (CONTINUED)
xxvi) Treasury shares
When the Group purchases its own equity instruments (treasury shares), the costs, including any directly attributable
incremental costs, are deducted from equity. No gain or loss is recognised in the statement of operations on the purchase,
sale, issue or cancellation of the Group’s own equity instruments. Any difference between the carrying amount and the
consideration, if reissued, is recognised in share premium. Voting rights related to treasury shares are nullified for the Group
and no dividends are allocated to them.
xxvii) Equity
Share capital represents the nominal (par) value of shares that have been issued. Share premium includes any premiums
received on issue of share capital. Any transaction costs associated with the issuing of shares are deducted from share
premium, net of any related income tax benefits.
xxviii) Profit or loss from discontinued operations
A discontinued operation is a component of the Group that either has been disposed of, or is classified as held for sale. Profit
or loss from discontinued operations comprises the post-tax profit or loss of discontinued operations and the post-tax gain
or loss resulting from the measurement and disposal of assets classified as held for sale.
xxix) Fair values
For financial reporting purposes, fair value measurements are categorized into Level 1, 2 or 3 based on the degree to which
inputs to the fair value measurements are observable and the significance of the inputs to the fair value measurement in its
entirety, which are described as follows:
Level 1: quoted prices (unadjusted) in active markets for identical assets or liabilities
Level 2: valuation techniques for which the lowest level of inputs which have a significant effect on the recorded fair value
are observable, either directly or indirectly
Level 3: valuation techniques for which the lowest level of inputs that have a significant effect on the recorded fair value
are not based on observable market data
xxx) New IFRS Standards and Interpretations not applied
The following new standards, interpretations and standard amendments became effective for the Group as of January 1,
2020 and did not result in a material impact on the Group’s results:
IFRS 3 Business Combinations – Definition of a business
Amendments to IFRS 9 Financial Instruments, IAS 39 Financial Instruments: Recognition and
Measurement and IFRS 7 Financial Instruments: Disclosures - Interest Rate Benchmark Reform
Amendments to References to the Conceptual Framework in IFRS Standards
Amendments to IAS 1 Presentation of Financial Statements and IAS 8 – Definition of material
The following standard amendment was issued in May 2020 effective for annual reporting periods beginning on
or after 1 June 2020 with earlier application permitted:
Amendments to IFRS 16 Leases – COVID-19-Related Rent Concessions. The amendment was adopted
effective 1 January 2020 and did not result in a material impact on the Group’s results.

91
NOTES TO THE CONSOLIDATED FINANCIAL STATEMENTS DECEMBER 31, 2020
2. SEGMENT INFORMATION
Operating segments are reported in a manner consistent with the internal reporting provided to the chief operating decision-
maker. The chief operating decision-maker, who is responsible for allocating resources and assessing the performance of
the operating segments, has been identified as the Board of Directors. Management has determined the operating segments
based on the reports reviewed by the Board of Directors, which are used to make strategic decisions. The Board considers
the business from a geographic perspective based on the Group’s management and internal reporting structure. Sales of
product between companies in the Group are made on commercial terms which reflect the nature of the relationship between
the relevant companies. Segment results, assets and liabilities include items directly attributable to a segment as well as
those that can be allocated on a reasonable basis. Unallocated items comprise interest-bearing loans, borrowings and
expenses and corporate expenses. Segment capital expenditure is the total cost during the year to acquire segment plant,
property and equipment and intangible assets that are expected to be used for more than one period, whether acquired on
acquisition of a business combination or through acquisitions as part of the current operations.
The Group comprises two main geographical segments (i) the Americas and (ii) Rest of World. The Group’s geographical
segments are determined by the location of the Group’s assets and operations. The Group has also presented a geographical
analysis of the segmental data for Ireland as is consistent with the information used by the Board of Directors.
The reportable operating segments derive their revenue primarily from one source (i.e. the market for diagnostic tests for a
range of diseases and other medical conditions). In determining the nature of its segmentation, the Group has considered the
nature of the products, their risks and rewards, the nature of the production base, the customer base and the nature of the
regulatory environment. The Group acquires, manufactures and markets a range of diagnostic products. The Group’s
products are sold to a similar customer base and the main body whose regulation the Group’s products must comply with is
the Food and Drug Administration (“FDA”) in the US.
The following presents revenue and profit information and certain asset and liability information regarding the Group’s
geographical segments.
i) The distribution of revenue by geographical area based on location of assets was as follows:
Rest of World
Revenue Americas Ireland Other Eliminations Total Year ended December 31, 2020 US$‘000 US$‘000 US$‘000 US$’000 US$‘000 Revenue from external customers 77,688 24,292 - - 101,980 Inter-segment revenue 59,304 1,095 - (60,399) -
Total revenue 136,992 25,387 - (60,399) 101,980
Rest of World
Revenue Americas Ireland Other Eliminations Total Year ended December 31, 2019 US$‘000 US$‘000 US$‘000 US$’000 US$‘000 Revenue from external customers 64,045 26,390 - - 90,435 Inter-segment revenue 39,563 1,629 - (41,192) -
Total revenue 103,608 28,019 - (41,192) 90,435
92
NOTES TO THE CONSOLIDATED FINANCIAL STATEMENTS DECEMBER 31, 2020
2. SEGMENT INFORMATION (CONTINUED)
Rest of World
Americas Ireland Other Eliminations Total Year ended December 31, 2018 US$‘000 US$‘000 US$‘000 US$’000 US$‘000 Revenue from external customers 65,863 31,172 - - 97,035 Inter-segment revenue 38,665 2,899 - (41,564) -
Total revenue 104,528 34,071 - (41,564) 97,035
ii) The distribution of revenue by customers’ geographical area was as follows:
Revenue December 31, 2020
US$‘000 December 31, 2019
US$‘000 December 31, 2018
US$‘000 Americas 70,408 52,183 57,559 Asia / Africa 22,567 27,686 29,466 Europe (including Ireland) * 9,005 10,566 10,010
101,980 90,435 97,035
* Revenue from customers in Ireland is not disclosed separately due to the immateriality of these revenues.
iii) The distribution of revenue by major product group was as follows:
Revenue December 31, 2020
US$‘000 December 31, 2019
US$‘000 December 31, 2018
US$‘000 Clinical laboratory goods 84,280 68,127 71,618 Clinical laboratory services 8,485 10,915 10,581
Point-of-Care 9,215 11,393 14,836
101,980 90,435 97,035
iv) The group has recognised the following amounts relating to revenue in the consolidated statement of operations:
Revenue December 31, 2020
US$‘000 December 31, 2019
US$‘000 December 31, 2018
US$‘000 Revenue from contracts with customers (a) 101,980 90,435 97,035 Revenue from other sources - - -
101,980 90,435 97,035
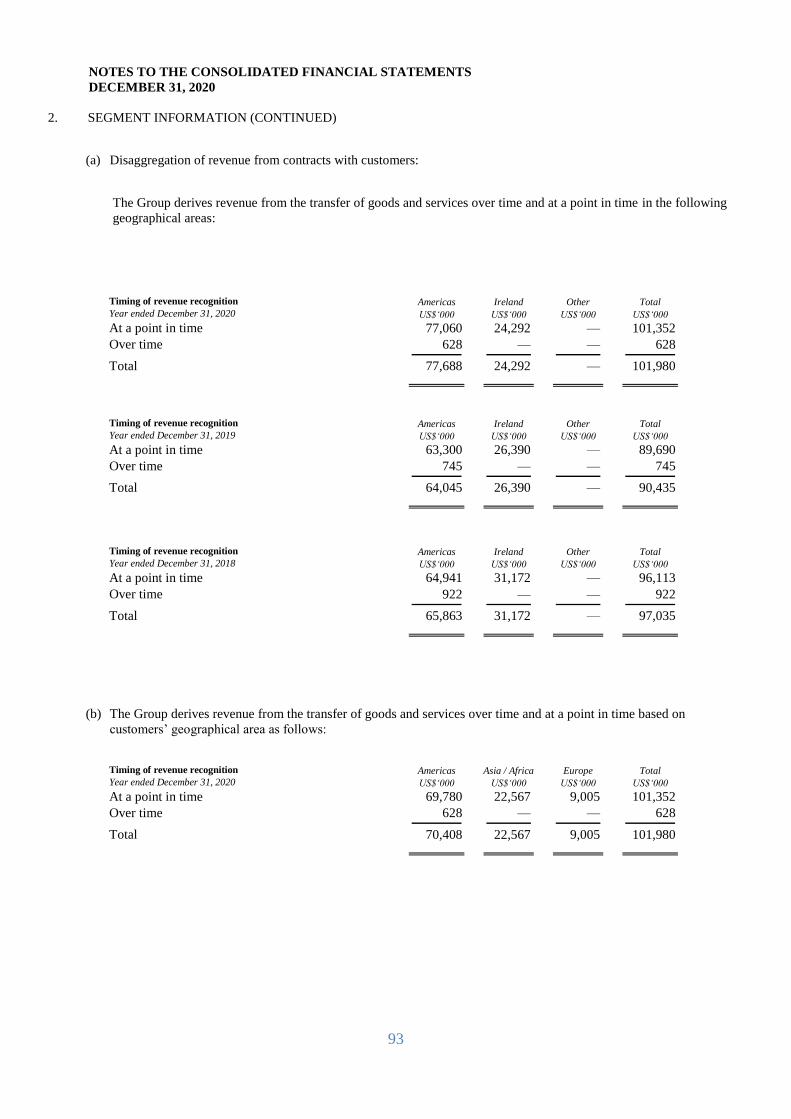
93
NOTES TO THE CONSOLIDATED FINANCIAL STATEMENTS
DECEMBER 31, 2020
2. SEGMENT INFORMATION (CONTINUED)
(a) Disaggregation of revenue from contracts with customers:
The Group derives revenue from the transfer of goods and services over time and at a point in time in the following
geographical areas:
Timing of revenue recognition Americas Ireland Other Total Year ended December 31, 2020 US$‘000 US$‘000 US$‘000 US$‘000 At a point in time 77,060 24,292 — 101,352 Over time 628 — — 628
Total 77,688 24,292 — 101,980
Timing of revenue recognition Americas Ireland Other Total Year ended December 31, 2019 US$‘000 US$‘000 US$‘000 US$‘000 At a point in time 63,300 26,390 — 89,690 Over time 745 — — 745
Total 64,045 26,390 — 90,435
Timing of revenue recognition Americas Ireland Other Total Year ended December 31, 2018 US$‘000 US$‘000 US$‘000 US$‘000 At a point in time 64,941 31,172 — 96,113 Over time 922 — — 922
Total 65,863 31,172 — 97,035
(b) The Group derives revenue from the transfer of goods and services over time and at a point in time based on
customers’ geographical area as follows:
Timing of revenue recognition Americas Asia / Africa Europe Total Year ended December 31, 2020 US$‘000 US$‘000 US$‘000 US$‘000 At a point in time 69,780 22,567 9,005 101,352 Over time 628 — — 628
Total 70,408 22,567 9,005 101,980
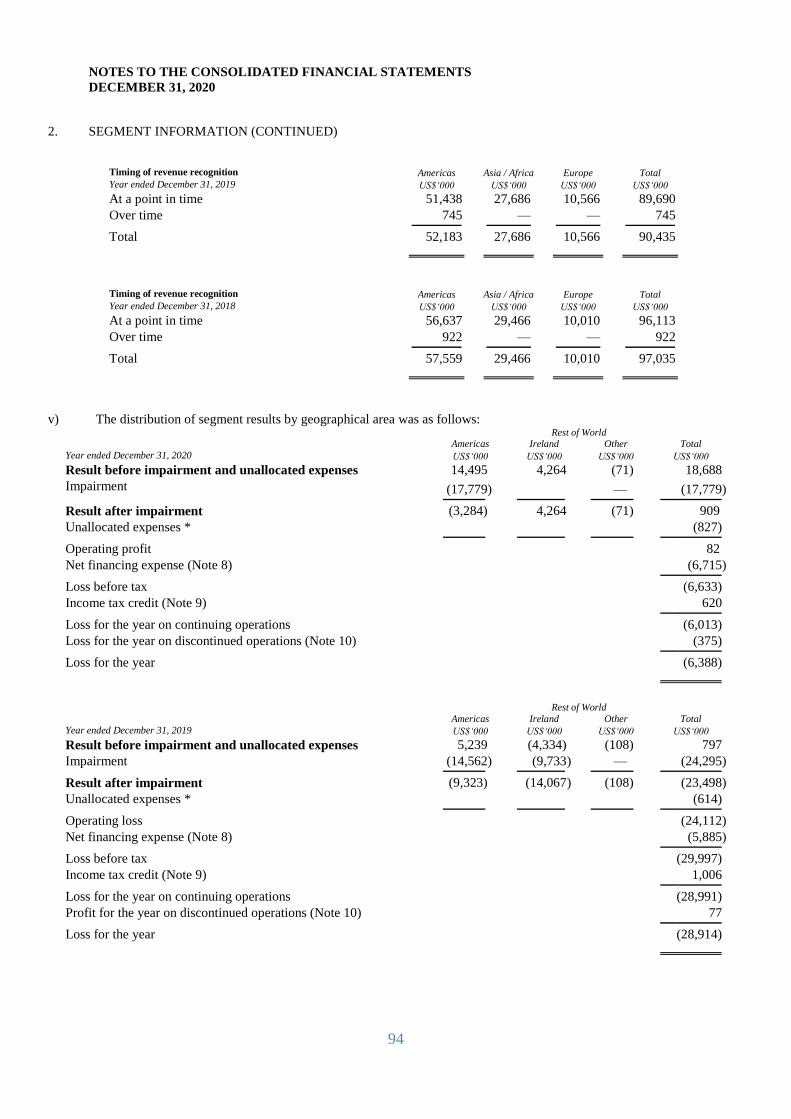
94
NOTES TO THE CONSOLIDATED FINANCIAL STATEMENTS
DECEMBER 31, 2020
2. SEGMENT INFORMATION (CONTINUED)
Timing of revenue recognition Americas Asia / Africa Europe Total Year ended December 31, 2019 US$‘000 US$‘000 US$‘000 US$‘000 At a point in time 51,438 27,686 10,566 89,690 Over time 745 — — 745
Total 52,183 27,686 10,566 90,435
Timing of revenue recognition Americas Asia / Africa Europe Total Year ended December 31, 2018 US$‘000 US$‘000 US$‘000 US$‘000 At a point in time 56,637 29,466 10,010 96,113 Over time 922 — — 922
Total 57,559 29,466 10,010 97,035
v) The distribution of segment results by geographical area was as follows: Rest of World
Americas Ireland Other Total Year ended December 31, 2020 US$‘000 US$‘000 US$‘000 US$‘000 Result before impairment and unallocated expenses 14,495 4,264 (71) 18,688 Impairment (17,779) — (17,779)
Result after impairment (3,284) 4,264 (71) 909 Unallocated expenses *
(827)
Operating profit
82 Net financing expense (Note 8)
(6,715)
Loss before tax
(6,633) Income tax credit (Note 9)
620
Loss for the year on continuing operations
(6,013) Loss for the year on discontinued operations (Note 10)
(375)
Loss for the year
(6,388)
Rest of World
Americas Ireland Other Total Year ended December 31, 2019 US$‘000 US$‘000 US$‘000 US$‘000 Result before impairment and unallocated expenses 5,239 (4,334) (108) 797 Impairment (14,562) (9,733 ) — (24,295)
Result after impairment (9,323) (14,067 ) (108) (23,498) Unallocated expenses *
(614)
Operating loss
(24,112) Net financing expense (Note 8)
(5,885)
Loss before tax
(29,997) Income tax credit (Note 9)
1,006
Loss for the year on continuing operations
(28,991) Profit for the year on discontinued operations (Note 10)
77
Loss for the year
(28,914)

95
NOTES TO THE CONSOLIDATED FINANCIAL STATEMENTS DECEMBER 31, 2020
2. SEGMENT INFORMATION (CONTINUED)
Rest of World
Americas Ireland Other Total Year ended December 31, 2018 US$‘000 US$‘000 US$‘000 US$‘000 Result before impairment and unallocated expenses 5,514 1,900 (44) 7,370 Impairment (19,095) (7,837 ) — (26,932)
Result after impairment (13,581) (5,937 ) (44) (19,562) Unallocated expenses *
(665)
Operating loss
(20,227) Net financing expense (Note 8)
(2,956)
Loss before tax
(23,183) Income tax credit (Note 9)
525
Loss for the year on continuing operations
(22,658) Loss for the year on discontinued operations (Note 10)
568
Loss for the year
(22,090)
* Unallocated expenses represent head office general and administration costs of the Group, which cannot be allocated to
the results of any specific geographical area.
vi) The distribution of segment assets and segment liabilities by geographical area was as follows:
Rest of World
Americas Ireland Other Total
As at December 31, 2020 US$‘000 US$‘000 US$‘000 US$‘000
Assets and liabilities Segment assets 58,164 37,632 3 95,799
Unallocated assets: Income tax assets (current and deferred) 7,271
Cash and cash equivalents and short-term investments 27,327
Total assets as reported in the Group balance sheet 130,397
Segment liabilities 20,431 107,080 46 127,557
Unallocated liabilities: Income tax liabilities (current and deferred) 5,059
Total liabilities as reported in the Group balance sheet 132,616
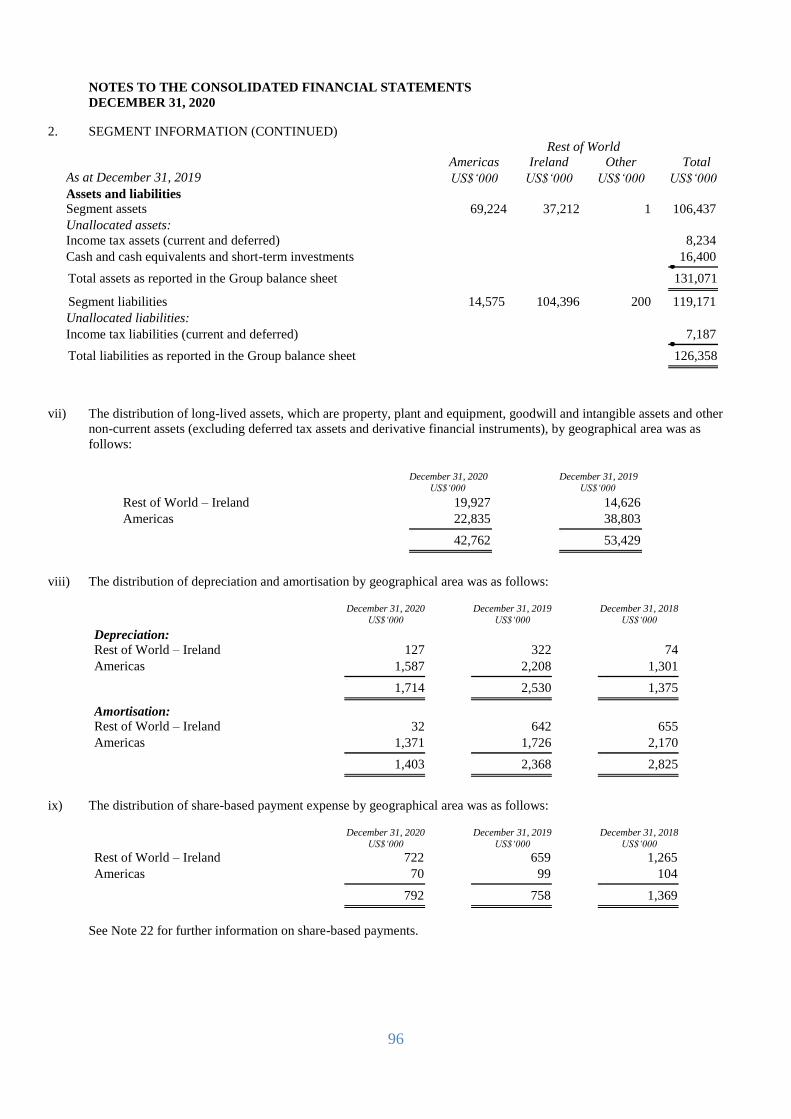
96
NOTES TO THE CONSOLIDATED FINANCIAL STATEMENTS DECEMBER 31, 2020
2. SEGMENT INFORMATION (CONTINUED) Rest of World
Americas Ireland Other Total
As at December 31, 2019 US$‘000 US$‘000 US$‘000 US$‘000
Assets and liabilities Segment assets 69,224 37,212 1 106,437
Unallocated assets: Income tax assets (current and deferred) 8,234
Cash and cash equivalents and short-term investments 16,400 Total assets as reported in the Group balance sheet 131,071 Segment liabilities 14,575 104,396 200 119,171
Unallocated liabilities: Income tax liabilities (current and deferred) 7,187 Total liabilities as reported in the Group balance sheet 126,358
vii) The distribution of long-lived assets, which are property, plant and equipment, goodwill and intangible assets and other
non-current assets (excluding deferred tax assets and derivative financial instruments), by geographical area was as
follows:
December 31, 2020 US$‘000
December 31, 2019 US$‘000
Rest of World – Ireland 19,927 14,626 Americas 22,835 38,803
42,762 53,429
viii) The distribution of depreciation and amortisation by geographical area was as follows:
December 31, 2020 US$‘000
December 31, 2019 US$‘000
December 31, 2018 US$‘000
Depreciation:
Rest of World – Ireland 127 322 74 Americas 1,587 2,208 1,301
1,714 2,530 1,375
Amortisation:
Rest of World – Ireland 32 642 655 Americas 1,371 1,726 2,170
1,403 2,368 2,825
ix) The distribution of share-based payment expense by geographical area was as follows:
December 31, 2020
US$‘000 December 31, 2019
US$‘000 December 31, 2018
US$‘000 Rest of World – Ireland 722 659 1,265 Americas 70 99 104
792 758 1,369
See Note 22 for further information on share-based payments.
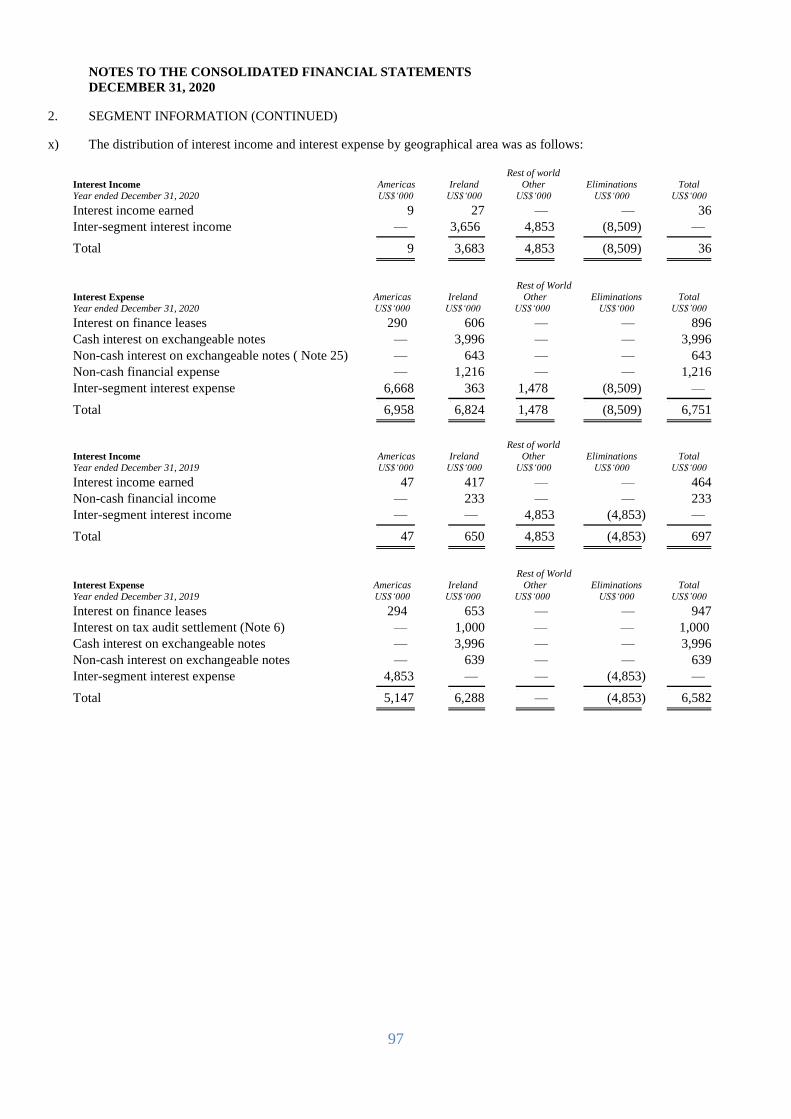
97
NOTES TO THE CONSOLIDATED FINANCIAL STATEMENTS DECEMBER 31, 2020
2. SEGMENT INFORMATION (CONTINUED)
x) The distribution of interest income and interest expense by geographical area was as follows:
Interest Income Year ended December 31, 2020
Americas US$‘000
Ireland US$‘000
Rest of world
Other US$‘000
Eliminations US$‘000
Total US$‘000
Interest income earned 9 27 — — 36 Inter-segment interest income — 3,656 4,853 (8,509) —
Total 9 3,683 4,853 (8,509) 36
Rest of World
Interest Expense Year ended December 31, 2020
Americas US$‘000
Ireland US$‘000
Other US$‘000
Eliminations US$‘000
Total US$’000
Interest on finance leases 290 606 — — 896 Cash interest on exchangeable notes — 3,996 — — 3,996 Non-cash interest on exchangeable notes ( Note 25) — 643 — — 643 Non-cash financial expense — 1,216 — — 1,216
Inter-segment interest expense 6,668 363 1,478 (8,509) —
Total 6,958 6,824 1,478 (8,509) 6,751
Interest Income Year ended December 31, 2019
Americas US$‘000
Ireland US$‘000
Rest of world
Other US$‘000
Eliminations US$‘000
Total US$‘000
Interest income earned 47 417 — — 464 Non-cash financial income — 233 — — 233 Inter-segment interest income — — 4,853 (4,853) —
Total 47 650 4,853 (4,853) 697
Rest of World
Interest Expense Year ended December 31, 2019
Americas US$‘000
Ireland US$‘000
Other US$‘000
Eliminations US$‘000
Total US$’000
Interest on finance leases 294 653 — — 947 Interest on tax audit settlement (Note 6) — 1,000 — — 1,000
Cash interest on exchangeable notes — 3,996 — — 3,996 Non-cash interest on exchangeable notes — 639 — — 639 Inter-segment interest expense 4,853 — — (4,853) —
Total 5,147 6,288 — (4,853) 6,582
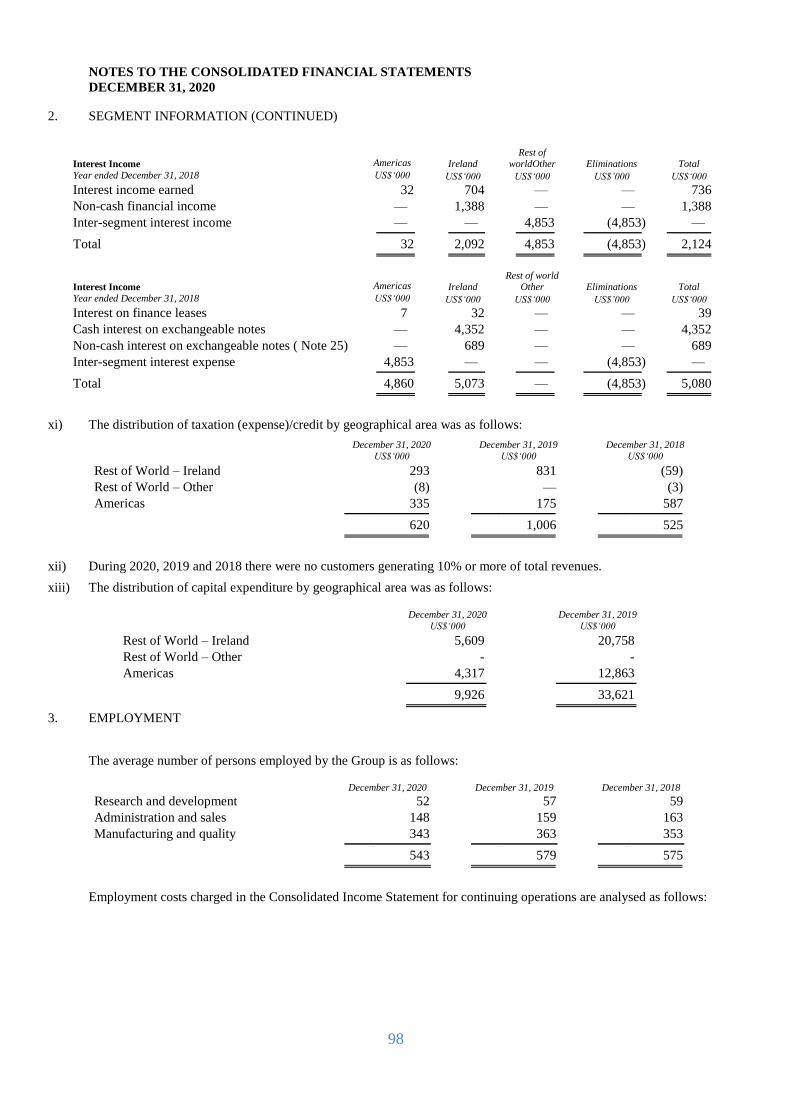
98
NOTES TO THE CONSOLIDATED FINANCIAL STATEMENTS DECEMBER 31, 2020
2. SEGMENT INFORMATION (CONTINUED)
Interest Income Year ended December 31, 2018
Americas Ireland Rest of
worldOther Eliminations Total US$‘000 US$‘000 US$‘000 US$’000 US$‘000
Interest income earned 32 704 — — 736 Non-cash financial income — 1,388 — — 1,388 Inter-segment interest income — — 4,853 (4,853) —
Total 32 2,092 4,853 (4,853) 2,124
Interest Income Year ended December 31, 2018
Americas Ireland Rest of world
Other Eliminations Total US$‘000 US$‘000 US$‘000 US$’000 US$‘000
Interest on finance leases 7 32 — — 39 Cash interest on exchangeable notes — 4,352 — — 4,352 Non-cash interest on exchangeable notes ( Note 25) — 689 — — 689 Inter-segment interest expense 4,853 — — (4,853) —
Total 4,860 5,073 — (4,853) 5,080
xi) The distribution of taxation (expense)/credit by geographical area was as follows:
December 31, 2020 US$‘000
December 31, 2019 US$‘000
December 31, 2018 US$‘000
Rest of World – Ireland 293 831 (59) Rest of World – Other (8) — (3) Americas 335 175 587
620 1,006 525
xii) During 2020, 2019 and 2018 there were no customers generating 10% or more of total revenues.
xiii) The distribution of capital expenditure by geographical area was as follows:
December 31, 2020 US$‘000
December 31, 2019 US$‘000
Rest of World – Ireland 5,609 20,758 Rest of World – Other - - Americas 4,317 12,863
9,926 33,621
3. EMPLOYMENT
The average number of persons employed by the Group is as follows:
December 31, 2020 December 31, 2019 December 31, 2018 Research and development 52 57 59 Administration and sales 148 159 163 Manufacturing and quality 343 363 353
543 579 575
Employment costs charged in the Consolidated Income Statement for continuing operations are analysed as follows:
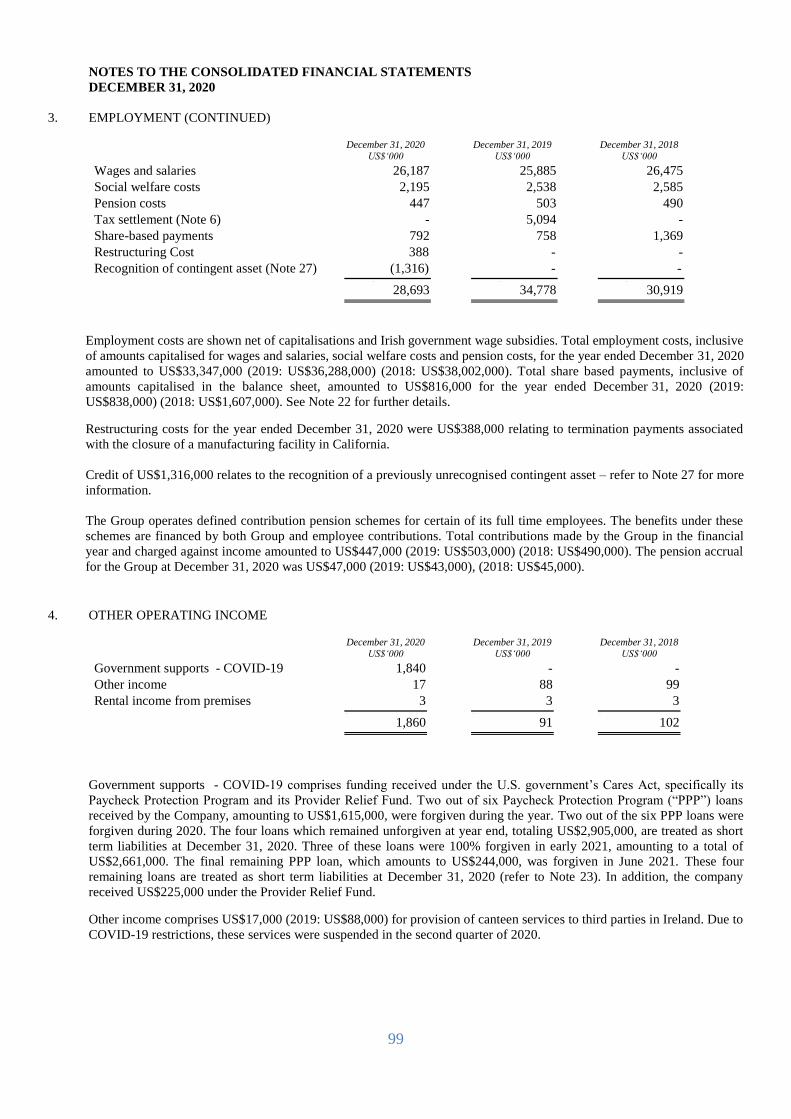
99
NOTES TO THE CONSOLIDATED FINANCIAL STATEMENTS DECEMBER 31, 2020
3. EMPLOYMENT (CONTINUED)
December 31, 2020 US$‘000
December 31, 2019 US$‘000
December 31, 2018 US$‘000
Wages and salaries 26,187 25,885 26,475 Social welfare costs 2,195 2,538 2,585 Pension costs 447 503 490
Tax settlement (Note 6) - 5,094 - Share-based payments 792 758 1,369 Restructuring Cost 388 - -
Recognition of contingent asset (Note 27) (1,316) - -
28,693 34,778 30,919
Employment costs are shown net of capitalisations and Irish government wage subsidies. Total employment costs, inclusive
of amounts capitalised for wages and salaries, social welfare costs and pension costs, for the year ended December 31, 2020
amounted to US$33,347,000 (2019: US$36,288,000) (2018: US$38,002,000). Total share based payments, inclusive of
amounts capitalised in the balance sheet, amounted to US$816,000 for the year ended December 31, 2020 (2019:
US$838,000) (2018: US$1,607,000). See Note 22 for further details.
Restructuring costs for the year ended December 31, 2020 were US$388,000 relating to termination payments associated
with the closure of a manufacturing facility in California.
Credit of US$1,316,000 relates to the recognition of a previously unrecognised contingent asset – refer to Note 27 for more
information.
The Group operates defined contribution pension schemes for certain of its full time employees. The benefits under these
schemes are financed by both Group and employee contributions. Total contributions made by the Group in the financial
year and charged against income amounted to US$447,000 (2019: US$503,000) (2018: US$490,000). The pension accrual
for the Group at December 31, 2020 was US$47,000 (2019: US$43,000), (2018: US$45,000).
4. OTHER OPERATING INCOME
December 31, 2020 US$‘000
December 31, 2019 US$‘000
December 31, 2018 US$‘000
Government supports - COVID-19 1,840 - -
Other income 17 88 99 Rental income from premises 3 3 3
1,860 91 102
Government supports - COVID-19 comprises funding received under the U.S. government’s Cares Act, specifically its
Paycheck Protection Program and its Provider Relief Fund. Two out of six Paycheck Protection Program (“PPP”) loans
received by the Company, amounting to US$1,615,000, were forgiven during the year. Two out of the six PPP loans were
forgiven during 2020. The four loans which remained unforgiven at year end, totaling US$2,905,000, are treated as short
term liabilities at December 31, 2020. Three of these loans were 100% forgiven in early 2021, amounting to a total of
US$2,661,000. The final remaining PPP loan, which amounts to US$244,000, was forgiven in June 2021. These four
remaining loans are treated as short term liabilities at December 31, 2020 (refer to Note 23). In addition, the company
received US$225,000 under the Provider Relief Fund.
Other income comprises US$17,000 (2019: US$88,000) for provision of canteen services to third parties in Ireland. Due to
COVID-19 restrictions, these services were suspended in the second quarter of 2020.

100
NOTES TO THE CONSOLIDATED FINANCIAL STATEMENTS DECEMBER 31, 2020
5. SELLING, GENERAL AND ADMINISTRATIVE EXPENSES – CLOSURE COSTS
In early 2020, management decided to close a production facility in Carlsbad, California facility which specialised in
Western Blot manufacturing. The last number of years had seen a steady migration of customers away from using the
Western Blot testing format for diagnosing Lyme in favour of alternative testing platforms. Production volumes declined
steadily at the plant to the extent that it no longer made economic sense to continue. The plant was closed on June 30, 2020.
Production of remaining products was transferred to other locations in the Group.
The charge for closing the facility was US$2.4 million which comprised redundancy costs, the write-off of inventory, the
cost of exiting lease obligations and other costs associated with the closure of the facility.
6. SELLING, GENERAL AND ADMINISTRATIVE EXPENSES – TAX AUDIT SETTLEMENT
In the year ended December 31, 2019, the Company reached a tax settlement of US$6,442,000 arising out of a tax audit in
one of the jurisdictions in which the company operates. The settlement consisted of US$3,863,000 in relation to a patent
dividend scheme, which had operated via Rayville Limited from 1995 to 2010, US$1,231,000 in relation to payments for
CEO Services made to Darnick Company (a company controlled by the family of Ronan O’Caoimh) and US$75,000 in
relation to R&D tax credits. Penalties were US$273,000. Interest was US$1,000,000 and this is shown as a financial expense.
The total settlement excluding interest of US$5,442,000 was partially offset by a provision of US$400,000, resulting in an
expense of US$5,042,000 in the year ended December 31, 2019, which is shown as Selling, general and administrative
expenses – tax audit settlement.
Darnick Company agreed to contribute US$1,231,000 to the above settlement and this amount was outstanding at December
31, 2019 and was treated as a contingent asset and not recognised in the 2019 financial statements. This balance was settled
in the year ended December 31, 2020 and has been credited to the Statement of Operations within Selling, General and
Administrative Expenses. The underlying amount was denominated in Euro. Due to a depreciation in the US Dollar since
2019, the US Dollar equivalent amount increased from US$1,231,000 to US$1,316,000. The settlement amount received by
the Company was US$177,000 more than the balance owed and this overpayment is recorded as a related party current
liability for the benefit of Ronan O’Caoimh as at December 31, 2020. The amount was settled by the Group in January 2021.
7. IMPAIRMENT CHARGES
In accordance with IAS 36, Impairment of Assets, the Group carries out an annual impairment review of the asset valuations.
A number of factors impacted this calculation including the Company’s market capitalisation at 31 December 2020, the cost
of capital, cash flow projections and net asset values across each of the Company’s cash generating units.
The impact of the above items on the statement of operations for the year ended December 31, 2020, December 31, 2019
and December 31, 2018 was as follows:
December December December
31, 2020 31, 2019 31, 2018
US$’000 US$’000 US$’000
Selling, general & administration expenses
Impairment of PP&E (Note 13) 1,795 6,349 6,112
Impairment of goodwill and other intangible assets (Note 14) 15,422 16,570 19,212
Impairment of prepayments (Note 18) 562 1,376 1,608
Total impairment loss 17,779 24,295 26,932
Income tax impact of impairment loss 0 148 (1,752)
Total impairment loss after tax 17,779 24,443 25,180
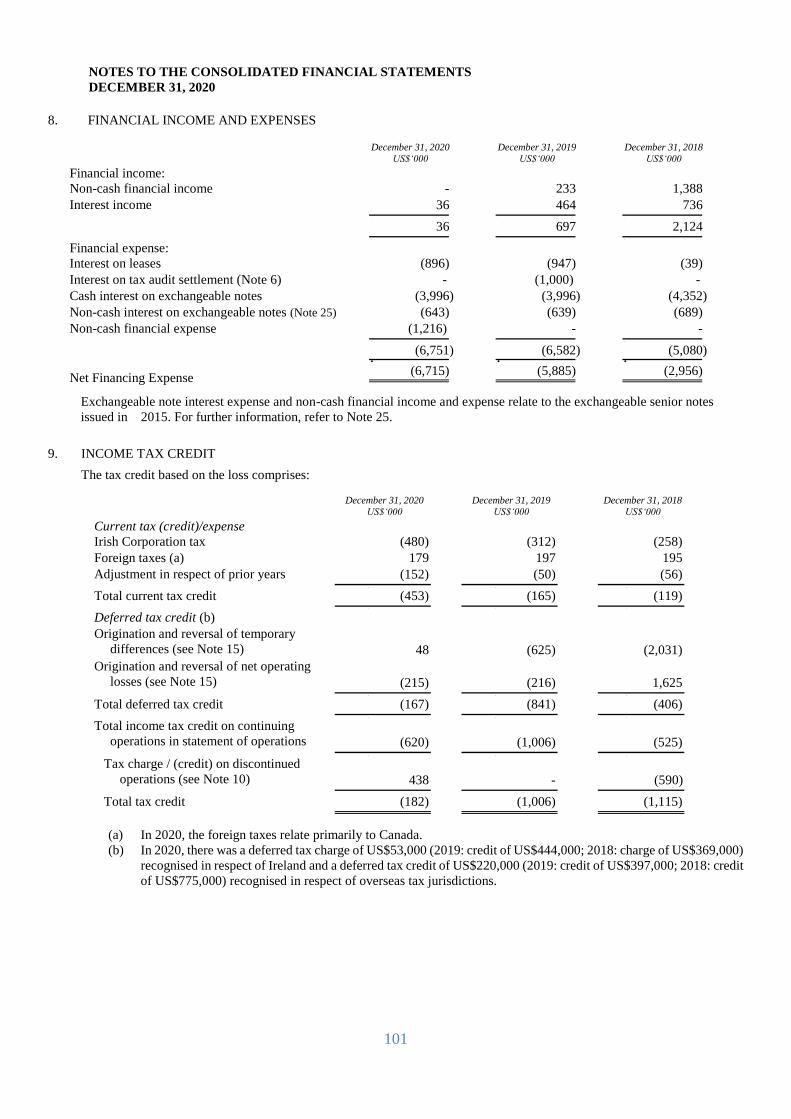
101
NOTES TO THE CONSOLIDATED FINANCIAL STATEMENTS DECEMBER 31, 2020
8. FINANCIAL INCOME AND EXPENSES
December 31, 2020 US$‘000
December 31, 2019 US$‘000
December 31, 2018 US$‘000
Financial income:
Non-cash financial income - 233 1,388 Interest income 36 464 736
36 697 2,124
Financial expense:
Interest on leases (896) (947) (39) Interest on tax audit settlement (Note 6) - (1,000) -
Cash interest on exchangeable notes (3,996) (3,996) (4,352) Non-cash interest on exchangeable notes (Note 25) (643) (639) (689) Non-cash financial expense (1,216) - -
(6,751)
(6,582)
(5,080)
Net Financing Expense (6,715)
(5,885)
(2,956)
Exchangeable note interest expense and non-cash financial income and expense relate to the exchangeable senior notes
issued in 2015. For further information, refer to Note 25.
9. INCOME TAX CREDIT
The tax credit based on the loss comprises:
December 31, 2020 US$‘000
December 31, 2019 US$‘000
December 31, 2018 US$‘000
Current tax (credit)/expense
Irish Corporation tax (480) (312) (258)
Foreign taxes (a) 179 197 195
Adjustment in respect of prior years (152) (50) (56)
Total current tax credit (453) (165) (119)
Deferred tax credit (b) Origination and reversal of temporary
differences (see Note 15)
48
(625) (2,031)
Origination and reversal of net operating
losses (see Note 15)
(215)
(216) 1,625
Total deferred tax credit (167) (841) (406)
Total income tax credit on continuing
operations in statement of operations
(620)
(1,006) (525)
Tax charge / (credit) on discontinued
operations (see Note 10)
438
- (590) 00
Total tax credit (182) (1,006) (1,115)
(a) In 2020, the foreign taxes relate primarily to Canada. (b) In 2020, there was a deferred tax charge of US$53,000 (2019: credit of US$444,000; 2018: charge of US$369,000)
recognised in respect of Ireland and a deferred tax credit of US$220,000 (2019: credit of US$397,000; 2018: credit
of US$775,000) recognised in respect of overseas tax jurisdictions.

102
NOTES TO THE CONSOLIDATED FINANCIAL STATEMENTS DECEMBER 31, 2020
9. INCOME TAX CREDIT (CONTINUED)
Effective tax rate December 31, 2020 December 31, 2019 December 31, 2018 Loss before taxation – continuing
operations (US$‘000)
(6,633) (29,997) (23,183) As a percentage of loss before tax:
Current tax % (6.83%) (0.55%) (0.51%) Total (current and deferred) % (9.35%) (3.36%) (2.26%)
The following table reconciles the applicable Republic of Ireland statutory tax rate to the effective total tax rate for the
Group:
December 31, 2020 December 31, 2019 December 31, 2018 Irish corporation tax (12.5%) (12.5%) (12.5%)
Effect of current year net operating
losses and temporary differences for
which no deferred tax asset was
recognised (a)
24.13%
13.21% 15.76%
Effect of tax rates on overseas earnings (9.92%) (3.05%) (6.10%)
Effect of Irish income taxable at higher
tax rate
5.92%
0.04% 0.05%
Adjustments in respect of prior years (10.66%) (0.17%) 0.94%
R&D tax credits (11.00%) (2.69%) (1.70%)
Other items (c) 4.68% 1.80% 1.29%
Effective tax rate (9.35%) (3.36%) (2.26%)
(a) The effect of current year net operating losses and temporary differences for which no deferred tax asset was
recognised is analyzed further in the table below (see also Note 15). No deferred tax asset was recognised because
there was no reversing deferred tax liability in the same jurisdiction reversing in the same period and no future taxable
income in the same jurisdiction.
(b) Other items comprise items not chargeable to tax/expenses not deductible for tax purposes. In 2020, this mainly
comprises the movement in the exchangeable notes’ embedded derivatives value and the accretion of notional interest
on the Loan Note’s host contract, both of which are exempt from deferred taxation recognition under IAS 12, Income
Taxes. In 2019, other items mainly comprise the tax audit settlement recorded in Selling, General and Administrative
expenses (see also Note 6), which is not deductible for tax and the movement in the exchangeable notes’ embedded
derivatives value and the accretion of notional interest.
Unrecognised deferred tax assets – continuing operations
Effect in 2020
US$’000
Percentage effect in
2020
Effect in 2019
US$’000
Percentage effect in
2019 Increase in net operating losses arising in US 1,105 16.66% 1,117 3.72%
Temporary differences arising in US - - 129 0.43%
(Decrease)/increase in net operating losses arising in
Brazil (502)
(7.57%) 608 2.03%
IncIncrease in net operating losses arising in Luxembourg
544
8.20% - -
Increase in net operating losses arising in UK 2 0.03% - -
Increase in net operating losses arising in Ireland 452 6.81% 2,110 7.03%
1,601 24.13% 3,964 13.21%

103
NOTES TO THE CONSOLIDATED FINANCIAL STATEMENTS DECEMBER 31, 2020
9. INCOME TAX CREDIT (CONTINUED)
The distribution of loss before taxes by geographical area was as follows:
December 31, 2020 US$‘000
December 31, 2019 US$‘000
December 31, 2018 US$‘000
Rest of World – Ireland 296 (20,318) (9,590) Rest of World – Other 3,304 4,760 4,809 Americas (10,233) (14,439) (18,402)
(6,633) (29,997) (23,183)
At December 31, 2020, the Group had unutilised net operating losses for continuing operations as follows:
December 31, 2020 US$‘000
December 31, 2019 US$‘000
December 31, 2018 US$‘000
Ireland 78,700 73,754 60,629 USA - 1,034 2,382 Luxembourg 2,175 - -
UK 10 - -
Brazil 4,313 5,789 4,001
85,198 80,577 67,012
At December 31, 2020, the Group had unrecognised deferred tax assets in respect of unused tax losses and unused tax
credits as follows:
December 31, 2020 US$‘000
December 31, 2019 US$‘000
December 31, 2018 US$‘000
Ireland – unused tax losses 12,514 12,062 9,953 US – unused tax losses - 3,291 2,174
US – unused tax credits 2,862 493 364 Luxembourg – unused tax losses 544 - -
UK – unused tax losses 2 - -
Brazil – unused tax losses 1,466 1,968 1,360 18,810
Unrecognised deferred tax asset 17,388 17,814 13,851
The accounting policy for deferred tax is to calculate the deferred tax asset that is deemed recoverable, considering all
sources for future taxable profits. The deferred tax assets in the above table have not been recognised due to uncertainty
regarding the full utilization of these losses in the related tax jurisdiction in future periods. Only when it is probable that
future profits will be available to utilize the forward losses or temporary differences is a deferred tax asset recognised. When
there is a reversing deferred tax liability in that jurisdiction that reverses in the same period, the deferred tax asset is restricted
so that it equals the reversing deferred tax liability.

104
NOTES TO THE CONSOLIDATED FINANCIAL STATEMENTS DECEMBER 31, 2020
10. (LOSS)/PROFIT FOR THE YEAR ON DISCONTINUED OPERATION
In 2016, management decided to cease the development of Cardiac point-of-care tests on the Meritas platform. These
products were being developed by the Group’s subsidiary Fiomi Diagnostics (“Fiomi”) located in Sweden. The decision to
cease the development work and to close the Swedish operation came after the company held a meeting with the U.S. Food
and Drug Administration (“FDA”) in order to obtain an update on the Meritas Troponin premarket submission. At that
meeting the FDA suggested that the submission should be withdrawn. The FDA made it known that any new point-of-care
Troponin product would be required to demonstrate performance equivalent to the most recently cleared laboratory-based
device. As there was no certainty that this level of performance could ever be achieved by the point-of-care Meritas product,
even with the benefit of further development efforts, management decided to cease the development work on Troponin I and
the analyzer and its sister products, BNP and D-dimer. Expenses, gains and losses relating to the discontinuation of the Cardiac point-of-care tests operation have been eliminated
from profit or loss from the Group’s continuing operations and are shown as a single line item (net of related taxes) on the
face of the Consolidated Statement of Operations. The discontinued operation had no revenues since commencement as the
products were still in their development phase. In 2016, the loss on discontinued operations included the write off of the
carrying value of all capitalised development costs, goodwill, property, plant and equipment, inventories and other assets
associated with the Meritas project. It also included a provision for the cost of closing the Swedish facility, mainly consisting
of contractual obligations associated with terminating premises and supplier contracts, as well as redundancy costs for 41
employees.
In 2018, taxes paid to the Swedish tax authorities were recovered and there was a resulting tax credit of US$590,000. In
2020, closure provisions were finalized and an excess provision of US$127,000 was released to the Consolidated Statement
of Operations. A tax receivable amount of US438,000 was expensed due to a change of estimate.
The operating loss for the Cardiac point-of-care tests operation in Sweden and the (loss)/profit on re-measurement of its
assets and liabilities are summarised as follows:
December 31, 2020 US$‘000
December 31, 2019 US$‘000
December 31, 2018 US$‘000
(Loss)/Profit on re-measurement of
assets and liabilities:
Closure provision 127 (8) (22) Foreign currency translation reserve (64) 85 — Tax (expense)/credit (438) — 590
Total (loss)/profit (375) 77 568 (Loss)/Profit for the year from
discontinued operations (375) 77 568
Basic earnings per ordinary share – discontinued operations
Basic (loss)/earnings per ordinary share for discontinued operations is computed by dividing the loss after taxation on
discontinued operations of US$375,000 (2019: profit US$77,000) (2018: profit US$568,000) for the financial year by the
weighted average number of ‘A’ ordinary shares in issue. As at December 31, 2020, this amounted to 83,606,810 shares
(2019: 83,606,810 shares) (2018: 83,612,908 shares), see note 12 for further details.
Diluted earnings per ordinary share – discontinued operations
Diluted (loss)/earnings per ordinary share for discontinued operations is computed by dividing the loss after taxation on
discontinued operations of US$375,000 (2019: profit US$77,000) (2018: profit US$568,000) for the financial year by the
diluted weighted average number of ordinary shares in issue of 105,024,732 (2019: 101,870,064) (2018: 103,508,820), see
note 12 for further details. Under IAS 33 Earnings per Share, diluted earnings per share cannot be anti-dilutive. Therefore,
diluted loss per ADS in accordance with IFRS is equal to basic earnings per ADS.
Earnings per ADS
In June 2005, Trinity Biotech adjusted its ADS ratio from 1 ADS: 1 ordinary share to 1 ADS: 4 ordinary shares. Earnings
per ADS for all periods presented have been restated to reflect this exchange ratio.
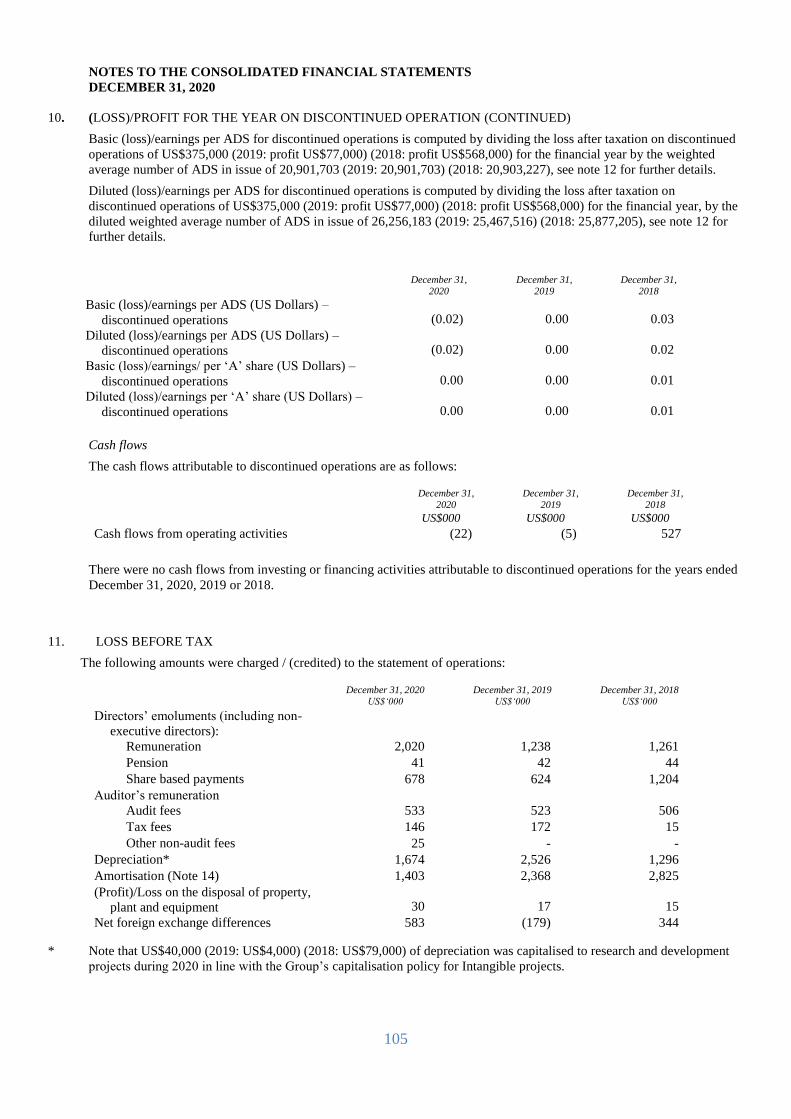
105
NOTES TO THE CONSOLIDATED FINANCIAL STATEMENTS DECEMBER 31, 2020
10. (LOSS)/PROFIT FOR THE YEAR ON DISCONTINUED OPERATION (CONTINUED)
Basic (loss)/earnings per ADS for discontinued operations is computed by dividing the loss after taxation on discontinued
operations of US$375,000 (2019: profit US$77,000) (2018: profit US$568,000) for the financial year by the weighted
average number of ADS in issue of 20,901,703 (2019: 20,901,703) (2018: 20,903,227), see note 12 for further details.
Diluted (loss)/earnings per ADS for discontinued operations is computed by dividing the loss after taxation on
discontinued operations of US$375,000 (2019: profit US$77,000) (2018: profit US$568,000) for the financial year, by the
diluted weighted average number of ADS in issue of 26,256,183 (2019: 25,467,516) (2018: 25,877,205), see note 12 for
further details.
December 31,
2020 December 31,
2019 December 31,
2018 Basic (loss)/earnings per ADS (US Dollars) –
discontinued operations (0.02) 0.00 0.03 Diluted (loss)/earnings per ADS (US Dollars) –
discontinued operations (0.02) 0.00 0.02 Basic (loss)/earnings/ per ‘A’ share (US Dollars) –
discontinued operations 0.00 0.00 0.01 Diluted (loss)/earnings per ‘A’ share (US Dollars) –
discontinued operations 0.00 0.00 0.01
Cash flows
The cash flows attributable to discontinued operations are as follows:
December 31,
2020 December 31,
2019 December 31,
2018 US$000 US$000 US$000
Cash flows from operating activities (22) (5) 527
There were no cash flows from investing or financing activities attributable to discontinued operations for the years ended
December 31, 2020, 2019 or 2018.
11. LOSS BEFORE TAX
The following amounts were charged / (credited) to the statement of operations:
December 31, 2020 US$‘000
December 31, 2019 US$‘000
December 31, 2018 US$‘000
Directors’ emoluments (including non-
executive directors):
Remuneration 2,020 1,238 1,261 Pension 41 42 44 Share based payments 678 624 1,204
Auditor’s remuneration
Audit fees 533 523 506 Tax fees 146 172 15 Other non-audit fees 25 - -
Depreciation* 1,674 2,526 1,296 Amortisation (Note 14) 1,403 2,368 2,825 (Profit)/Loss on the disposal of property,
plant and equipment 30 17 15 Net foreign exchange differences 583 (179) 344
* Note that US$40,000 (2019: US$4,000) (2018: US$79,000) of depreciation was capitalised to research and development
projects during 2020 in line with the Group’s capitalisation policy for Intangible projects.
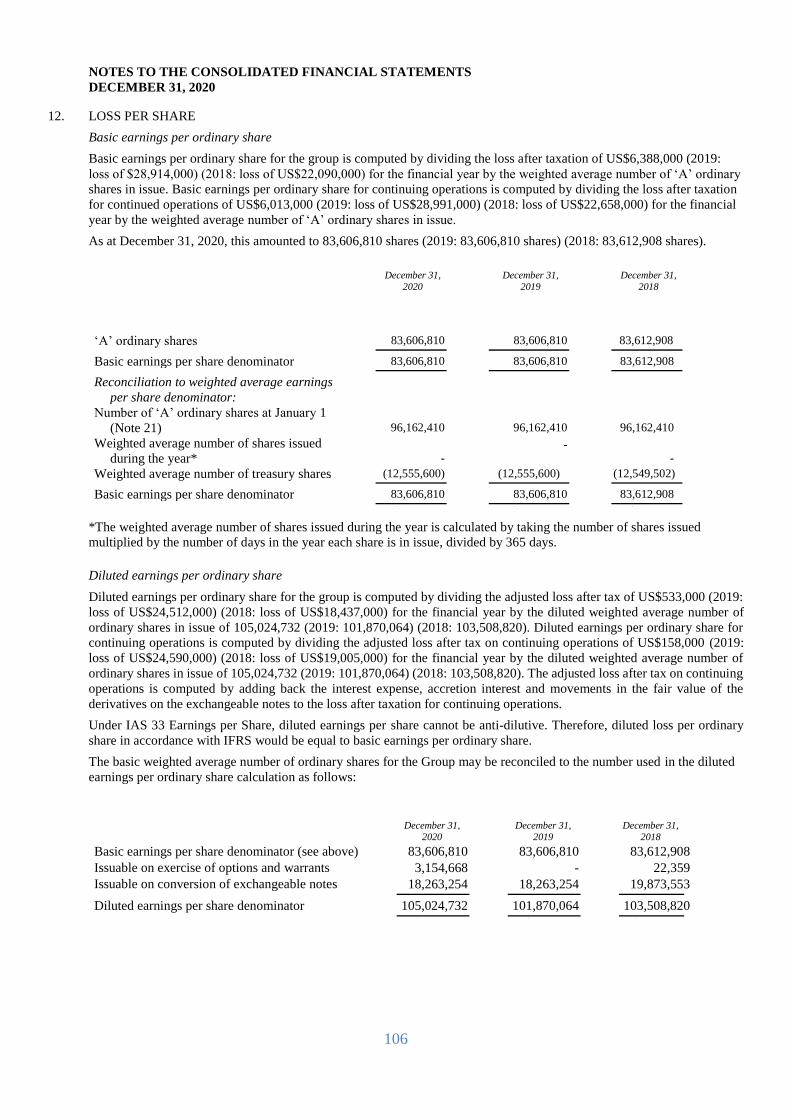
106
NOTES TO THE CONSOLIDATED FINANCIAL STATEMENTS DECEMBER 31, 2020
12. LOSS PER SHARE
Basic earnings per ordinary share
Basic earnings per ordinary share for the group is computed by dividing the loss after taxation of US$6,388,000 (2019:
loss of $28,914,000) (2018: loss of US$22,090,000) for the financial year by the weighted average number of ‘A’ ordinary
shares in issue. Basic earnings per ordinary share for continuing operations is computed by dividing the loss after taxation
for continued operations of US$6,013,000 (2019: loss of US$28,991,000) (2018: loss of US$22,658,000) for the financial
year by the weighted average number of ‘A’ ordinary shares in issue.
As at December 31, 2020, this amounted to 83,606,810 shares (2019: 83,606,810 shares) (2018: 83,612,908 shares).
December 31,
2020 December 31,
2019 December 31,
2018
‘A’ ordinary shares 83,606,810 83,606,810
83,612,908
Basic earnings per share denominator 83,606,810 83,606,810 83,612,908
Reconciliation to weighted average earnings
per share denominator: Number of ‘A’ ordinary shares at January 1
(Note 21) 96,162,410 96,162,410 96,162,410
Weighted average number of shares issued
during the year* -
-
-
Weighted average number of treasury shares (12,555,600) (12,555,600) (12,549,502)
Basic earnings per share denominator 83,606,810 83,606,810 83,612,908
*The weighted average number of shares issued during the year is calculated by taking the number of shares issued
multiplied by the number of days in the year each share is in issue, divided by 365 days.
Diluted earnings per ordinary share
Diluted earnings per ordinary share for the group is computed by dividing the adjusted loss after tax of US$533,000 (2019:
loss of US$24,512,000) (2018: loss of US$18,437,000) for the financial year by the diluted weighted average number of
ordinary shares in issue of 105,024,732 (2019: 101,870,064) (2018: 103,508,820). Diluted earnings per ordinary share for
continuing operations is computed by dividing the adjusted loss after tax on continuing operations of US$158,000 (2019:
loss of US$24,590,000) (2018: loss of US$19,005,000) for the financial year by the diluted weighted average number of
ordinary shares in issue of 105,024,732 (2019: 101,870,064) (2018: 103,508,820). The adjusted loss after tax on continuing
operations is computed by adding back the interest expense, accretion interest and movements in the fair value of the
derivatives on the exchangeable notes to the loss after taxation for continuing operations.
Under IAS 33 Earnings per Share, diluted earnings per share cannot be anti-dilutive. Therefore, diluted loss per ordinary
share in accordance with IFRS would be equal to basic earnings per ordinary share.
The basic weighted average number of ordinary shares for the Group may be reconciled to the number used in the diluted
earnings per ordinary share calculation as follows:
December 31, 2020
December 31, 2019
December 31, 2018
Basic earnings per share denominator (see above) 83,606,810 83,606,810 83,612,908 Issuable on exercise of options and warrants 3,154,668 - 22,359 Issuable on conversion of exchangeable notes 18,263,254 18,263,254 19,873,553
Diluted earnings per share denominator 105,024,732 101,870,064 103,508,820
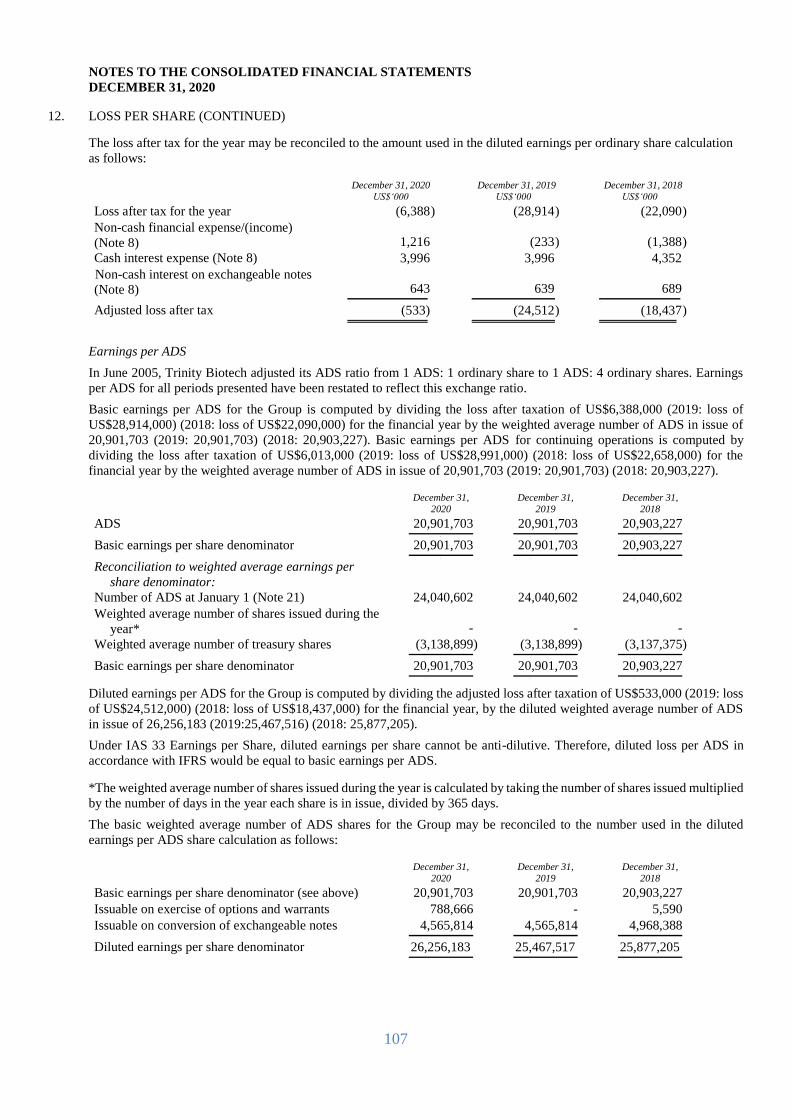
107
NOTES TO THE CONSOLIDATED FINANCIAL STATEMENTS DECEMBER 31, 2020
12. LOSS PER SHARE (CONTINUED)
The loss after tax for the year may be reconciled to the amount used in the diluted earnings per ordinary share calculation
as follows:
December 31, 2020 US$‘000
December 31, 2019 US$‘000
December 31, 2018 US$‘000
Loss after tax for the year (6,388 ) (28,914 ) (22,090 ) Non-cash financial expense/(income)
(Note 8) 1,216 (233 ) (1,388 ) Cash interest expense (Note 8) 3,996 3,996 4,352
Non-cash interest on exchangeable notes
(Note 8) 643 639 689
Adjusted loss after tax (533) (24,512 ) (18,437 )
Earnings per ADS
In June 2005, Trinity Biotech adjusted its ADS ratio from 1 ADS: 1 ordinary share to 1 ADS: 4 ordinary shares. Earnings
per ADS for all periods presented have been restated to reflect this exchange ratio.
Basic earnings per ADS for the Group is computed by dividing the loss after taxation of US$6,388,000 (2019: loss of
US$28,914,000) (2018: loss of US$22,090,000) for the financial year by the weighted average number of ADS in issue of
20,901,703 (2019: 20,901,703) (2018: 20,903,227). Basic earnings per ADS for continuing operations is computed by
dividing the loss after taxation of US$6,013,000 (2019: loss of US$28,991,000) (2018: loss of US$22,658,000) for the
financial year by the weighted average number of ADS in issue of 20,901,703 (2019: 20,901,703) (2018: 20,903,227).
December 31, 2020
December 31, 2019
December 31, 2018
ADS 20,901,703 20,901,703 20,903,227
Basic earnings per share denominator 20,901,703 20,901,703 20,903,227
Reconciliation to weighted average earnings per
share denominator:
Number of ADS at January 1 (Note 21) 24,040,602 24,040,602 24,040,602 Weighted average number of shares issued during the
year* - - - Weighted average number of treasury shares (3,138,899) (3,138,899) (3,137,375)
Basic earnings per share denominator 20,901,703 20,901,703 20,903,227
Diluted earnings per ADS for the Group is computed by dividing the adjusted loss after taxation of US$533,000 (2019: loss
of US$24,512,000) (2018: loss of US$18,437,000) for the financial year, by the diluted weighted average number of ADS
in issue of 26,256,183 (2019:25,467,516) (2018: 25,877,205).
Under IAS 33 Earnings per Share, diluted earnings per share cannot be anti-dilutive. Therefore, diluted loss per ADS in
accordance with IFRS would be equal to basic earnings per ADS.
*The weighted average number of shares issued during the year is calculated by taking the number of shares issued multiplied
by the number of days in the year each share is in issue, divided by 365 days.
The basic weighted average number of ADS shares for the Group may be reconciled to the number used in the diluted
earnings per ADS share calculation as follows:
December 31, 2020
December 31, 2019
December 31, 2018
Basic earnings per share denominator (see above) 20,901,703 20,901,703 20,903,227 Issuable on exercise of options and warrants 788,666 - 5,590 Issuable on conversion of exchangeable notes 4,565,814 4,565,814 4,968,388
Diluted earnings per share denominator 26,256,183 25,467,517 25,877,205
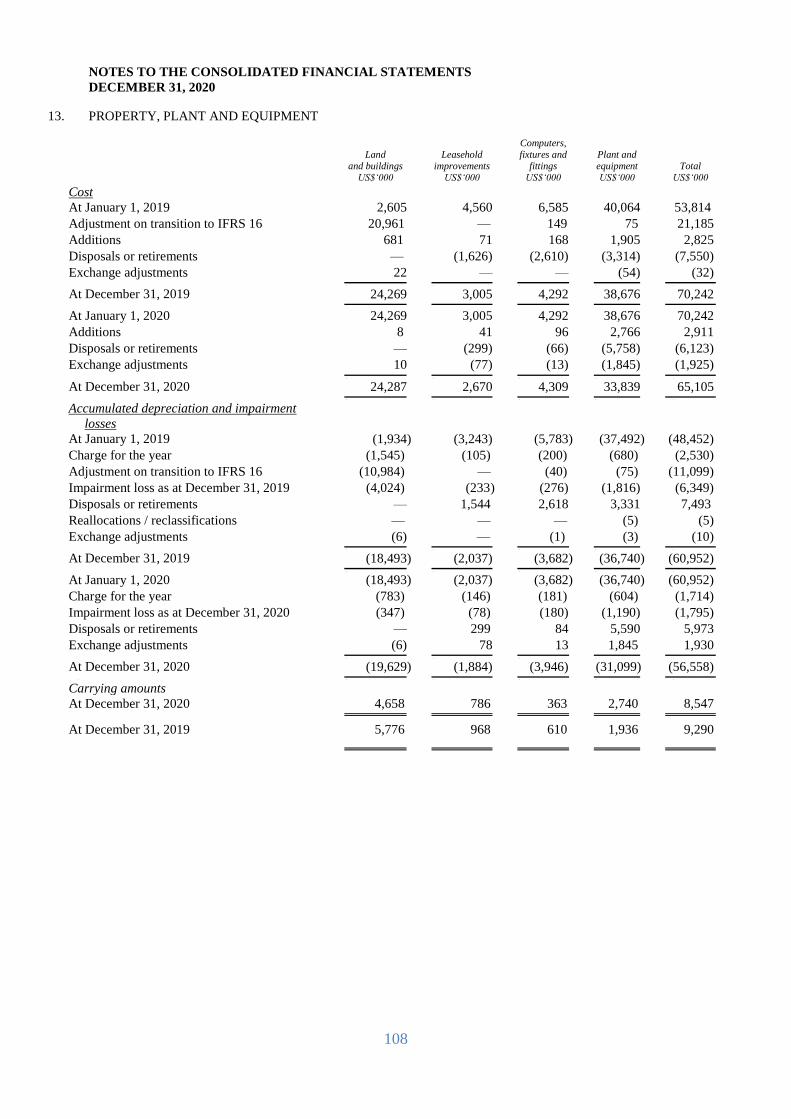
108
NOTES TO THE CONSOLIDATED FINANCIAL STATEMENTS DECEMBER 31, 2020
13. PROPERTY, PLANT AND EQUIPMENT
Land and buildings
US$‘000
Leasehold improvements
US$‘000
Computers, fixtures and
fittings US$‘000
Plant and equipment US$‘000
Total US$‘000
Cost
At January 1, 2019 2,605 4,560 6,585 40,064 53,814 Adjustment on transition to IFRS 16 20,961 — 149 75 21,185
Additions 681 71 168 1,905 2,825 Disposals or retirements — (1,626) (2,610) (3,314) (7,550) Exchange adjustments 22 — — (54) (32)
At December 31, 2019 24,269 3,005 4,292 38,676 70,242
At January 1, 2020 24,269 3,005 4,292 38,676 70,242 Additions 8 41 96 2,766 2,911 Disposals or retirements — (299) (66) (5,758) (6,123) Exchange adjustments 10 (77) (13) (1,845) (1,925)
At December 31, 2020 24,287 2,670 4,309 33,839 65,105
Accumulated depreciation and impairment
losses
At January 1, 2019 (1,934) (3,243) (5,783) (37,492) (48,452) Charge for the year (1,545) (105) (200) (680) (2,530) Adjustment on transition to IFRS 16 (10,984) — (40) (75) (11,099)
Impairment loss as at December 31, 2019 (4,024) (233 ) (276) (1,816) (6,349)
Disposals or retirements — 1,544 2,618 3,331 7,493
Reallocations / reclassifications — — — (5) (5) Exchange adjustments (6) — (1) (3) (10)
At December 31, 2019 (18,493) (2,037) (3,682) (36,740) (60,952)
At January 1, 2020 (18,493) (2,037) (3,682) (36,740) (60,952) Charge for the year (783) (146) (181) (604) (1,714) Impairment loss as at December 31, 2020 (347) (78) (180) (1,190) (1,795) Disposals or retirements — 299 84 5,590 5,973 Exchange adjustments (6) 78 13 1,845 1,930
At December 31, 2020 (19,629) (1,884) (3,946) (31,099) (56,558) 7
Carrying amounts At December 31, 2020 4,658 786 363 2,740 8,547
At December 31, 2019 5,776 968 610 1,936 9,290
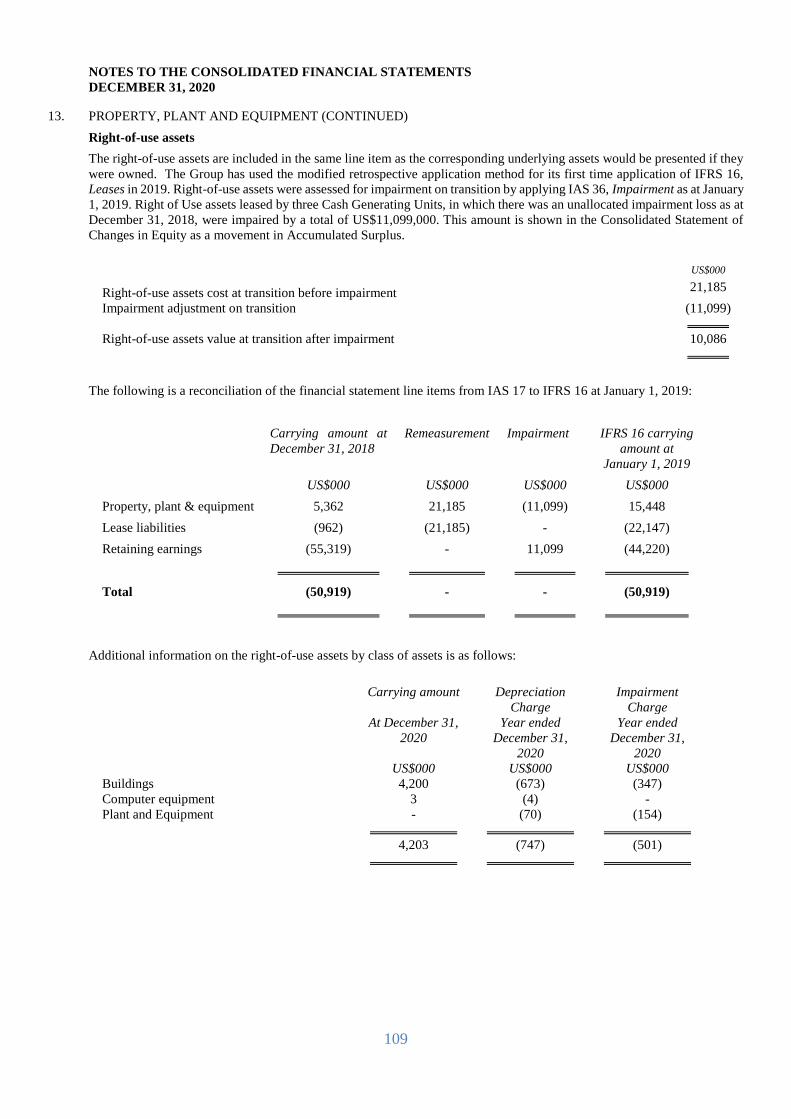
109
NOTES TO THE CONSOLIDATED FINANCIAL STATEMENTS DECEMBER 31, 2020
13. PROPERTY, PLANT AND EQUIPMENT (CONTINUED)
Right-of-use assets
The right-of-use assets are included in the same line item as the corresponding underlying assets would be presented if they
were owned. The Group has used the modified retrospective application method for its first time application of IFRS 16,
Leases in 2019. Right-of-use assets were assessed for impairment on transition by applying IAS 36, Impairment as at January
1, 2019. Right of Use assets leased by three Cash Generating Units, in which there was an unallocated impairment loss as at
December 31, 2018, were impaired by a total of US$11,099,000. This amount is shown in the Consolidated Statement of
Changes in Equity as a movement in Accumulated Surplus.
US$000
Right-of-use assets cost at transition before impairment 21,185
Impairment adjustment on transition (11,099)
Right-of-use assets value at transition after impairment 10,086
The following is a reconciliation of the financial statement line items from IAS 17 to IFRS 16 at January 1, 2019:
Carrying amount at
December 31, 2018
Remeasurement Impairment IFRS 16 carrying
amount at
January 1, 2019
US$000 US$000 US$000 US$000
Property, plant & equipment 5,362 21,185 (11,099) 15,448
Lease liabilities (962) (21,185) - (22,147)
Retaining earnings (55,319) - 11,099 (44,220)
Total (50,919) - - (50,919)
Additional information on the right-of-use assets by class of assets is as follows:
Carrying amount Depreciation
Charge
Impairment
Charge
At December 31,
2020
Year ended
December 31,
2020
Year ended
December 31,
2020
US$000 US$000 US$000
Buildings 4,200 (673) (347)
Computer equipment 3 (4) -
Plant and Equipment - (70) (154)
4,203 (747) (501)
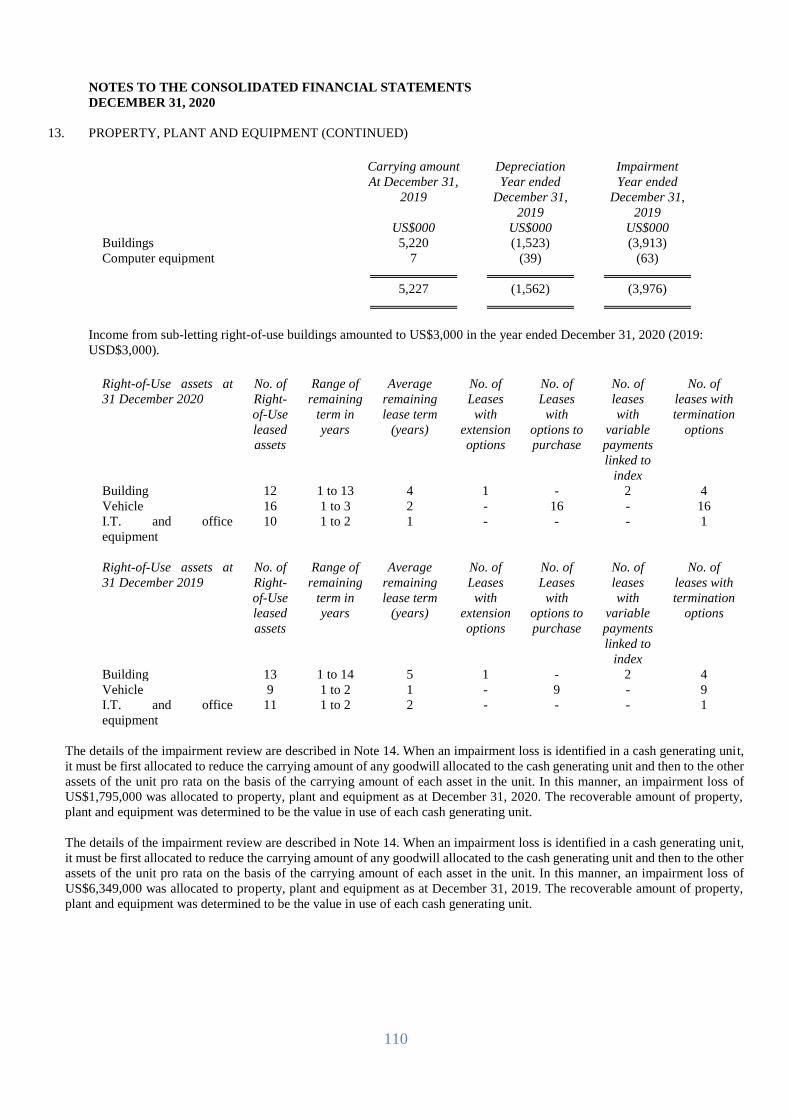
110
NOTES TO THE CONSOLIDATED FINANCIAL STATEMENTS
DECEMBER 31, 2020
13. PROPERTY, PLANT AND EQUIPMENT (CONTINUED)
Carrying amount Depreciation Impairment
At December 31,
2019
Year ended
December 31,
2019
Year ended
December 31,
2019
US$000 US$000 US$000
Buildings 5,220 (1,523) (3,913)
Computer equipment 7 (39) (63)
5,227 (1,562) (3,976)
Income from sub-letting right-of-use buildings amounted to US$3,000 in the year ended December 31, 2020 (2019:
USD$3,000).
Right-of-Use assets at
31 December 2020
No. of
Right-
of-Use
leased
assets
Range of
remaining
term in
years
Average
remaining
lease term
(years)
No. of
Leases
with
extension
options
No. of
Leases
with
options to
purchase
No. of
leases
with
variable
payments
linked to
index
No. of
leases with
termination
options
Building 12 1 to 13 4 1 - 2 4
Vehicle 16 1 to 3 2 - 16 - 16
I.T. and office
equipment
10 1 to 2 1 - - - 1
Right-of-Use assets at
31 December 2019
No. of
Right-
of-Use
leased
assets
Range of
remaining
term in
years
Average
remaining
lease term
(years)
No. of
Leases
with
extension
options
No. of
Leases
with
options to
purchase
No. of
leases
with
variable
payments
linked to
index
No. of
leases with
termination
options
Building 13 1 to 14 5 1 - 2 4
Vehicle 9 1 to 2 1 - 9 - 9
I.T. and office
equipment
11 1 to 2 2 - - - 1
The details of the impairment review are described in Note 14. When an impairment loss is identified in a cash generating unit,
it must be first allocated to reduce the carrying amount of any goodwill allocated to the cash generating unit and then to the other
assets of the unit pro rata on the basis of the carrying amount of each asset in the unit. In this manner, an impairment loss of
US$1,795,000 was allocated to property, plant and equipment as at December 31, 2020. The recoverable amount of property,
plant and equipment was determined to be the value in use of each cash generating unit.
The details of the impairment review are described in Note 14. When an impairment loss is identified in a cash generating unit,
it must be first allocated to reduce the carrying amount of any goodwill allocated to the cash generating unit and then to the other
assets of the unit pro rata on the basis of the carrying amount of each asset in the unit. In this manner, an impairment loss of
US$6,349,000 was allocated to property, plant and equipment as at December 31, 2019. The recoverable amount of property,
plant and equipment was determined to be the value in use of each cash generating unit.

111
NOTES TO THE CONSOLIDATED FINANCIAL STATEMENTS
DECEMBER 31, 2020
13. PROPERTY, PLANT AND EQUIPMENT (CONTINUED)
Assets held under operating leases (where the Company is the lessor)
The Company has a number of assets included in plant and equipment which generate operating lease revenue for the Group.
The net book value of these assets as at December 31, 2020 and 2019 is US$Nil following full write down of the assets due
to group impairment (refer to Note 14). Depreciation charged on these assets in 2020 amounted to US$21,000 (2019:
US$7,000).
Property, plant and equipment under construction
There were no assets under construction included in property, plant and equipment at December 31, 2020 (2019: US$Nil).
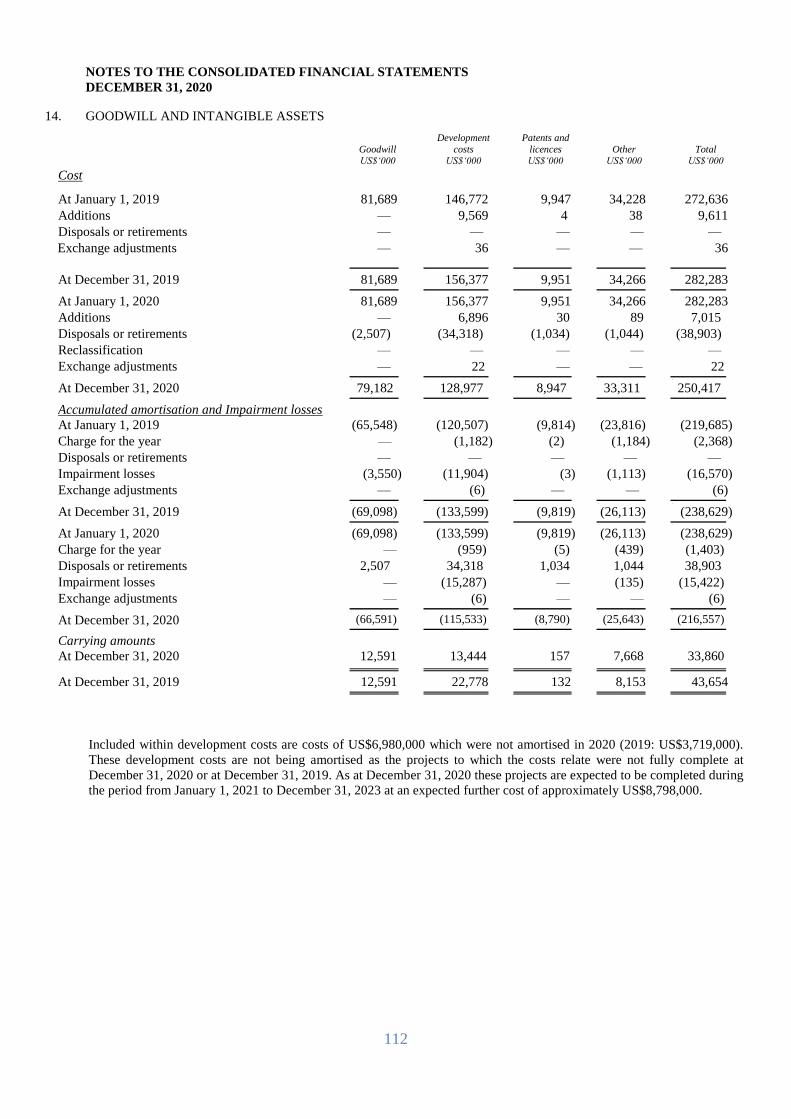
112
NOTES TO THE CONSOLIDATED FINANCIAL STATEMENTS DECEMBER 31, 2020
14. GOODWILL AND INTANGIBLE ASSETS
Goodwill US$‘000
Development costs
US$‘000
Patents and licences US$‘000
Other US$‘000
Total US$‘000
Cost
At January 1, 2019 81,689 146,772 9,947 34,228 272,636 Additions — 9,569 4 38 9,611 Disposals or retirements — — — — —
Exchange adjustments — 36 — — 36
At December 31, 2019 81,689 156,377 9,951 34,266 282,283
At January 1, 2020 81,689 156,377 9,951 34,266 282,283 Additions — 6,896 30 89 7,015 Disposals or retirements (2,507) (34,318) (1,034) (1,044) (38,903)
Reclassification — — — — —
Exchange adjustments — 22 — — 22
At December 31, 2020 79,182 128,977 8,947 33,311 250,417
Accumulated amortisation and Impairment losses
At January 1, 2019 (65,548) (120,507) (9,814) (23,816) (219,685) Charge for the year — (1,182) (2) (1,184) (2,368) Disposals or retirements — — — — —
Impairment losses (3,550) (11,904) (3) (1,113) (16,570) Exchange adjustments — (6) — — (6)
At December 31, 2019 (69,098) (133,599) (9,819) (26,113) (238,629)
At January 1, 2020 (69,098) (133,599) (9,819) (26,113) (238,629) Charge for the year — (959) (5) (439) (1,403) Disposals or retirements 2,507 34,318 1,034 1,044 38,903
Impairment losses — (15,287) — (135) (15,422) Exchange adjustments — (6) — — (6)
At December 31, 2020 (66,591) (115,533) (8,790) (25,643) (216,557)
Carrying amounts
At December 31, 2020 12,591 13,444 157 7,668 33,860
At December 31, 2019 12,591 22,778 132 8,153 43,654
Included within development costs are costs of US$6,980,000 which were not amortised in 2020 (2019: US$3,719,000).
These development costs are not being amortised as the projects to which the costs relate were not fully complete at
December 31, 2020 or at December 31, 2019. As at December 31, 2020 these projects are expected to be completed during
the period from January 1, 2021 to December 31, 2023 at an expected further cost of approximately US$8,798,000.
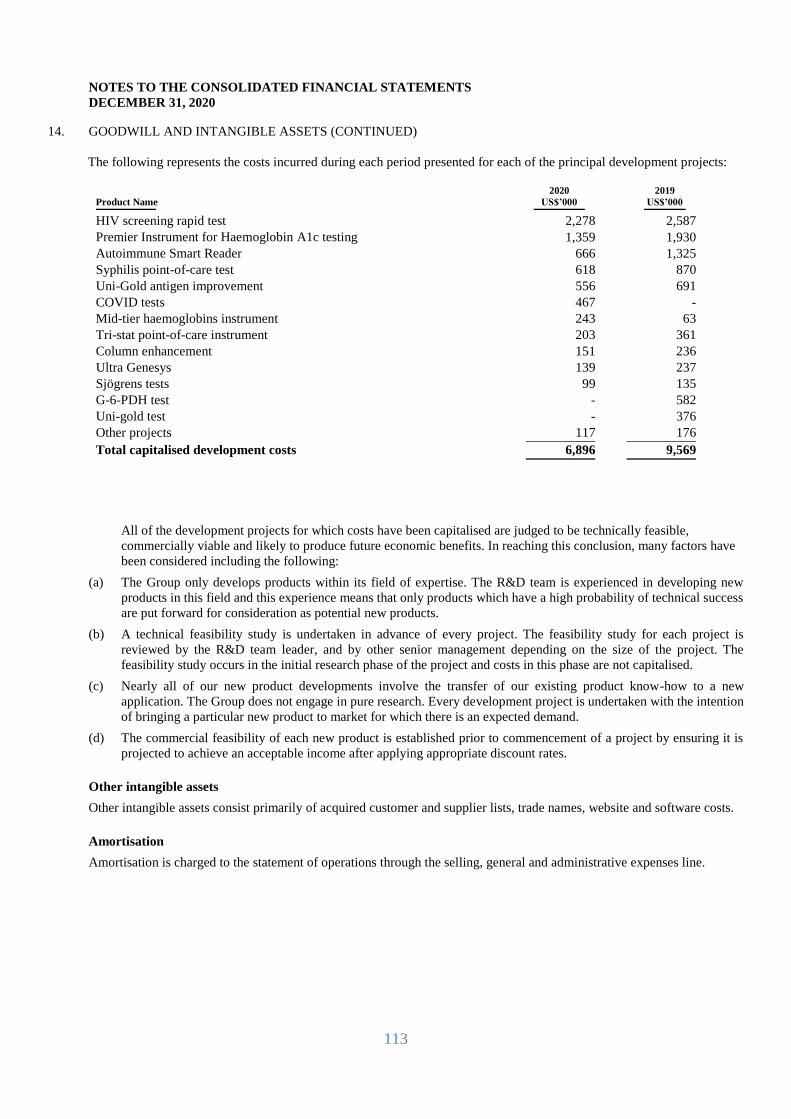
113
NOTES TO THE CONSOLIDATED FINANCIAL STATEMENTS DECEMBER 31, 2020
14. GOODWILL AND INTANGIBLE ASSETS (CONTINUED)
The following represents the costs incurred during each period presented for each of the principal development projects:
Product Name
2020
US$’000
2019
US$’000
HIV screening rapid test 2,278 2,587
Premier Instrument for Haemoglobin A1c testing 1,359 1,930
Autoimmune Smart Reader 666 1,325
Syphilis point-of-care test 618 870
Uni-Gold antigen improvement 556 691
COVID tests 467 -
Mid-tier haemoglobins instrument 243 63
Tri-stat point-of-care instrument 203 361
Column enhancement 151 236
Ultra Genesys 139 237
Sjögrens tests 99 135
G-6-PDH test - 582
Uni-gold test - 376
Other projects 117 176
Total capitalised development costs 6,896 9,569
All of the development projects for which costs have been capitalised are judged to be technically feasible,
commercially viable and likely to produce future economic benefits. In reaching this conclusion, many factors have
been considered including the following:
(a) The Group only develops products within its field of expertise. The R&D team is experienced in developing new
products in this field and this experience means that only products which have a high probability of technical success
are put forward for consideration as potential new products.
(b) A technical feasibility study is undertaken in advance of every project. The feasibility study for each project is
reviewed by the R&D team leader, and by other senior management depending on the size of the project. The
feasibility study occurs in the initial research phase of the project and costs in this phase are not capitalised.
(c) Nearly all of our new product developments involve the transfer of our existing product know-how to a new
application. The Group does not engage in pure research. Every development project is undertaken with the intention
of bringing a particular new product to market for which there is an expected demand.
(d) The commercial feasibility of each new product is established prior to commencement of a project by ensuring it is
projected to achieve an acceptable income after applying appropriate discount rates.
Other intangible assets
Other intangible assets consist primarily of acquired customer and supplier lists, trade names, website and software costs.
Amortisation
Amortisation is charged to the statement of operations through the selling, general and administrative expenses line.
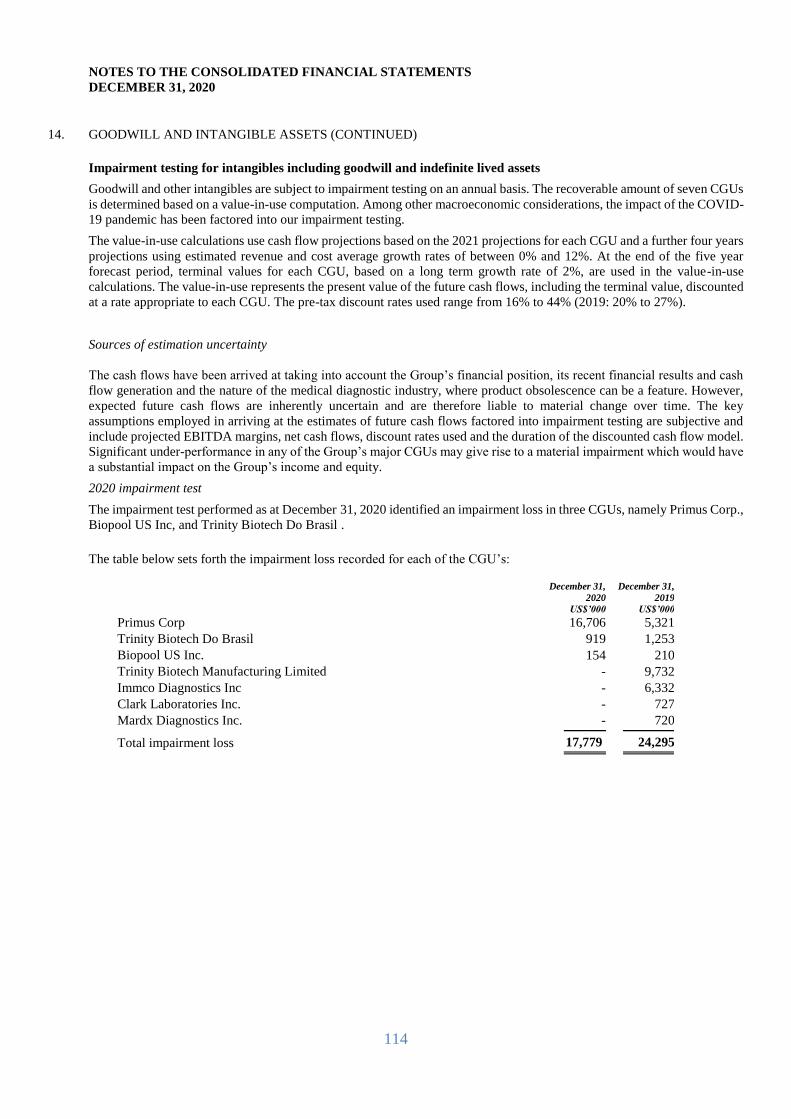
114
NOTES TO THE CONSOLIDATED FINANCIAL STATEMENTS DECEMBER 31, 2020
14. GOODWILL AND INTANGIBLE ASSETS (CONTINUED)
Impairment testing for intangibles including goodwill and indefinite lived assets
Goodwill and other intangibles are subject to impairment testing on an annual basis. The recoverable amount of seven CGUs
is determined based on a value-in-use computation. Among other macroeconomic considerations, the impact of the COVID-
19 pandemic has been factored into our impairment testing.
The value-in-use calculations use cash flow projections based on the 2021 projections for each CGU and a further four years
projections using estimated revenue and cost average growth rates of between 0% and 12%. At the end of the five year
forecast period, terminal values for each CGU, based on a long term growth rate of 2%, are used in the value-in-use
calculations. The value-in-use represents the present value of the future cash flows, including the terminal value, discounted
at a rate appropriate to each CGU. The pre-tax discount rates used range from 16% to 44% (2019: 20% to 27%).
Sources of estimation uncertainty
The cash flows have been arrived at taking into account the Group’s financial position, its recent financial results and cash
flow generation and the nature of the medical diagnostic industry, where product obsolescence can be a feature. However,
expected future cash flows are inherently uncertain and are therefore liable to material change over time. The key
assumptions employed in arriving at the estimates of future cash flows factored into impairment testing are subjective and
include projected EBITDA margins, net cash flows, discount rates used and the duration of the discounted cash flow model.
Significant under-performance in any of the Group’s major CGUs may give rise to a material impairment which would have
a substantial impact on the Group’s income and equity.
2020 impairment test
The impairment test performed as at December 31, 2020 identified an impairment loss in three CGUs, namely Primus Corp.,
Biopool US Inc, and Trinity Biotech Do Brasil .
The table below sets forth the impairment loss recorded for each of the CGU’s:
December 31,
2020
December 31,
2019
US$’000 US$’000
Primus Corp 16,706 5,321
Trinity Biotech Do Brasil 919 1,253
Biopool US Inc. 154 210
Trinity Biotech Manufacturing Limited - 9,732
Immco Diagnostics Inc - 6,332
Clark Laboratories Inc. - 727
Mardx Diagnostics Inc. - 720 17,
Total impairment loss 17,779 24,295
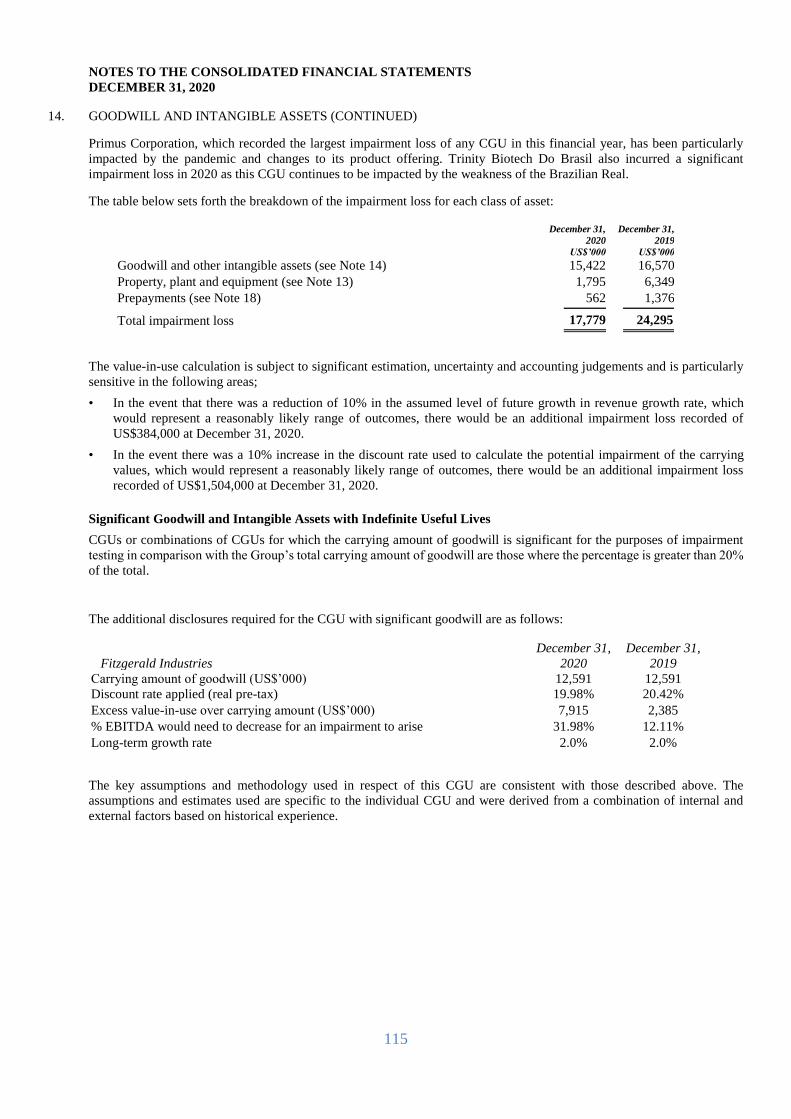
115
NOTES TO THE CONSOLIDATED FINANCIAL STATEMENTS DECEMBER 31, 2020
14. GOODWILL AND INTANGIBLE ASSETS (CONTINUED)
Primus Corporation, which recorded the largest impairment loss of any CGU in this financial year, has been particularly
impacted by the pandemic and changes to its product offering. Trinity Biotech Do Brasil also incurred a significant
impairment loss in 2020 as this CGU continues to be impacted by the weakness of the Brazilian Real.
The table below sets forth the breakdown of the impairment loss for each class of asset:
December 31,
2020
December 31,
2019 US$’000 US$’000
Goodwill and other intangible assets (see Note 14) 15,422 16,570 Property, plant and equipment (see Note 13) 1,795 6,349 Prepayments (see Note 18) 562 1,376
Total impairment loss 17,779 24,295
The value-in-use calculation is subject to significant estimation, uncertainty and accounting judgements and is particularly
sensitive in the following areas;
• In the event that there was a reduction of 10% in the assumed level of future growth in revenue growth rate, which
would represent a reasonably likely range of outcomes, there would be an additional impairment loss recorded of
US$384,000 at December 31, 2020.
• In the event there was a 10% increase in the discount rate used to calculate the potential impairment of the carrying
values, which would represent a reasonably likely range of outcomes, there would be an additional impairment loss
recorded of US$1,504,000 at December 31, 2020.
Significant Goodwill and Intangible Assets with Indefinite Useful Lives
CGUs or combinations of CGUs for which the carrying amount of goodwill is significant for the purposes of impairment
testing in comparison with the Group’s total carrying amount of goodwill are those where the percentage is greater than 20%
of the total.
The additional disclosures required for the CGU with significant goodwill are as follows:
Fitzgerald Industries
December 31,
2020
December 31,
2019
Carrying amount of goodwill (US$’000) 12,591 12,591
Discount rate applied (real pre-tax) 19.98% 20.42%
Excess value-in-use over carrying amount (US$’000) 7,915 2,385
% EBITDA would need to decrease for an impairment to arise 31.98% 12.11%
Long-term growth rate 2.0% 2.0%
The key assumptions and methodology used in respect of this CGU are consistent with those described above. The
assumptions and estimates used are specific to the individual CGU and were derived from a combination of internal and
external factors based on historical experience.
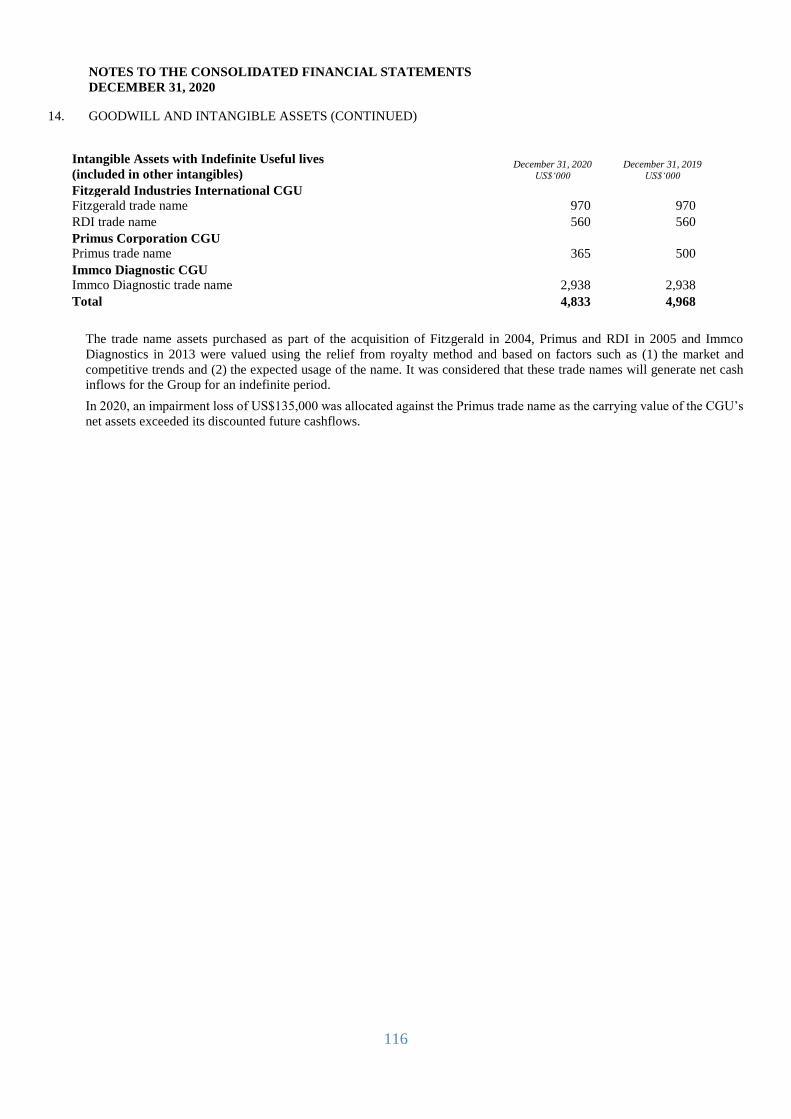
116
NOTES TO THE CONSOLIDATED FINANCIAL STATEMENTS DECEMBER 31, 2020
14. GOODWILL AND INTANGIBLE ASSETS (CONTINUED)
Intangible Assets with Indefinite Useful lives
(included in other intangibles) December 31, 2020
US$‘000 December 31, 2019
US$‘000 Fitzgerald Industries International CGU
Fitzgerald trade name 970 970 RDI trade name 560 560 Primus Corporation CGU
Primus trade name 365 500 Immco Diagnostic CGU
Immco Diagnostic trade name 2,938 2,938 Total 4,833 4,968
The trade name assets purchased as part of the acquisition of Fitzgerald in 2004, Primus and RDI in 2005 and Immco
Diagnostics in 2013 were valued using the relief from royalty method and based on factors such as (1) the market and
competitive trends and (2) the expected usage of the name. It was considered that these trade names will generate net cash
inflows for the Group for an indefinite period.
In 2020, an impairment loss of US$135,000 was allocated against the Primus trade name as the carrying value of the CGU’s
net assets exceeded its discounted future cashflows.
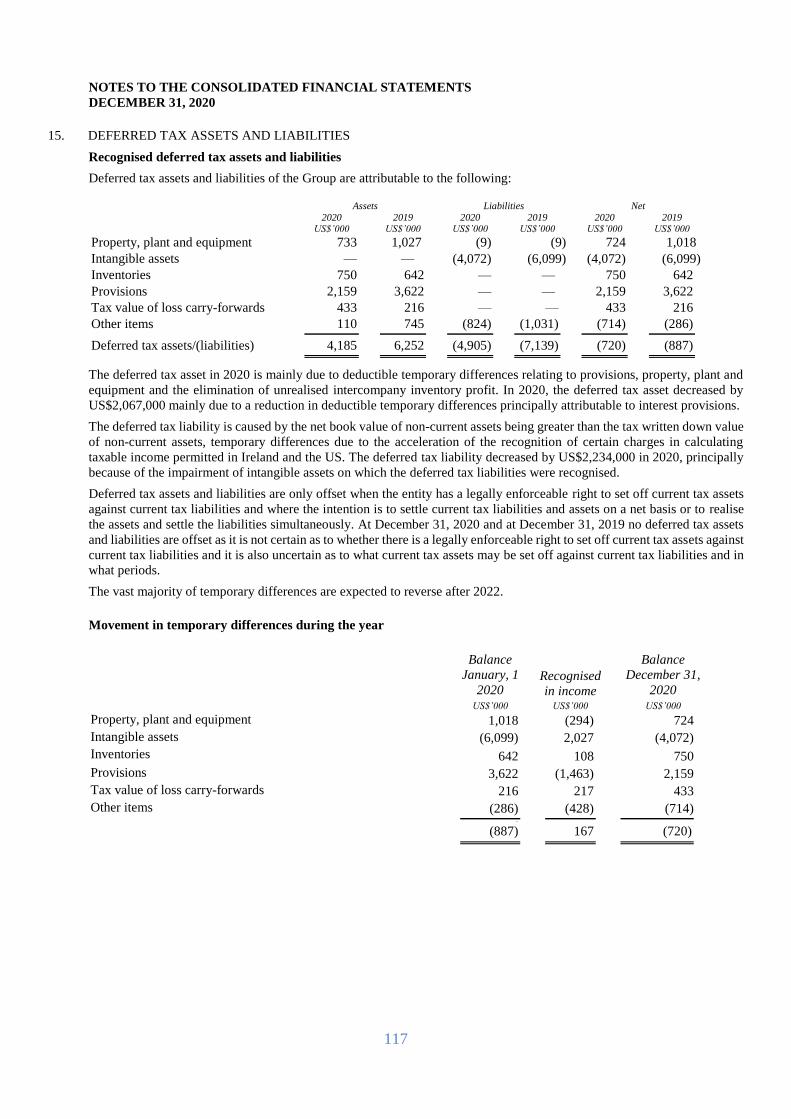
117
NOTES TO THE CONSOLIDATED FINANCIAL STATEMENTS DECEMBER 31, 2020
15. DEFERRED TAX ASSETS AND LIABILITIES
Recognised deferred tax assets and liabilities
Deferred tax assets and liabilities of the Group are attributable to the following:
Assets Liabilities Net
2020 US$’000
2019 US$’000
2020 US$’000
2019 US$’000
2020 US$’000
2019 US$’000
Property, plant and equipment 733 1,027 (9) (9) 724 1,018 Intangible assets — — (4,072) (6,099) (4,072) (6,099) Inventories 750 642 — — 750 642
Provisions 2,159 3,622 — — 2,159 3,622
Tax value of loss carry-forwards 433 216 — — 433 216
Other items 110 745 (824) (1,031) (714) (286)
Deferred tax assets/(liabilities) 4,185 6,252 (4,905) (7,139) (720) (887)
The deferred tax asset in 2020 is mainly due to deductible temporary differences relating to provisions, property, plant and
equipment and the elimination of unrealised intercompany inventory profit. In 2020, the deferred tax asset decreased by
US$2,067,000 mainly due to a reduction in deductible temporary differences principally attributable to interest provisions.
The deferred tax liability is caused by the net book value of non-current assets being greater than the tax written down value
of non-current assets, temporary differences due to the acceleration of the recognition of certain charges in calculating
taxable income permitted in Ireland and the US. The deferred tax liability decreased by US$2,234,000 in 2020, principally
because of the impairment of intangible assets on which the deferred tax liabilities were recognised.
Deferred tax assets and liabilities are only offset when the entity has a legally enforceable right to set off current tax assets
against current tax liabilities and where the intention is to settle current tax liabilities and assets on a net basis or to realise
the assets and settle the liabilities simultaneously. At December 31, 2020 and at December 31, 2019 no deferred tax assets
and liabilities are offset as it is not certain as to whether there is a legally enforceable right to set off current tax assets against
current tax liabilities and it is also uncertain as to what current tax assets may be set off against current tax liabilities and in
what periods.
The vast majority of temporary differences are expected to reverse after 2022.
Movement in temporary differences during the year
Balance
January, 1
2020 Recognised
in income
Balance
December 31,
2020
US$’000 US$’000 US$’000 Property, plant and equipment 1,018 (294) 724
Intangible assets (6,099) 2,027 (4,072)
Inventories 642 108 750
Provisions 3,622 (1,463) 2,159
Tax value of loss carry-forwards 216 217 433
Other items (286) (428) (714) (887
(887) 167 (720)
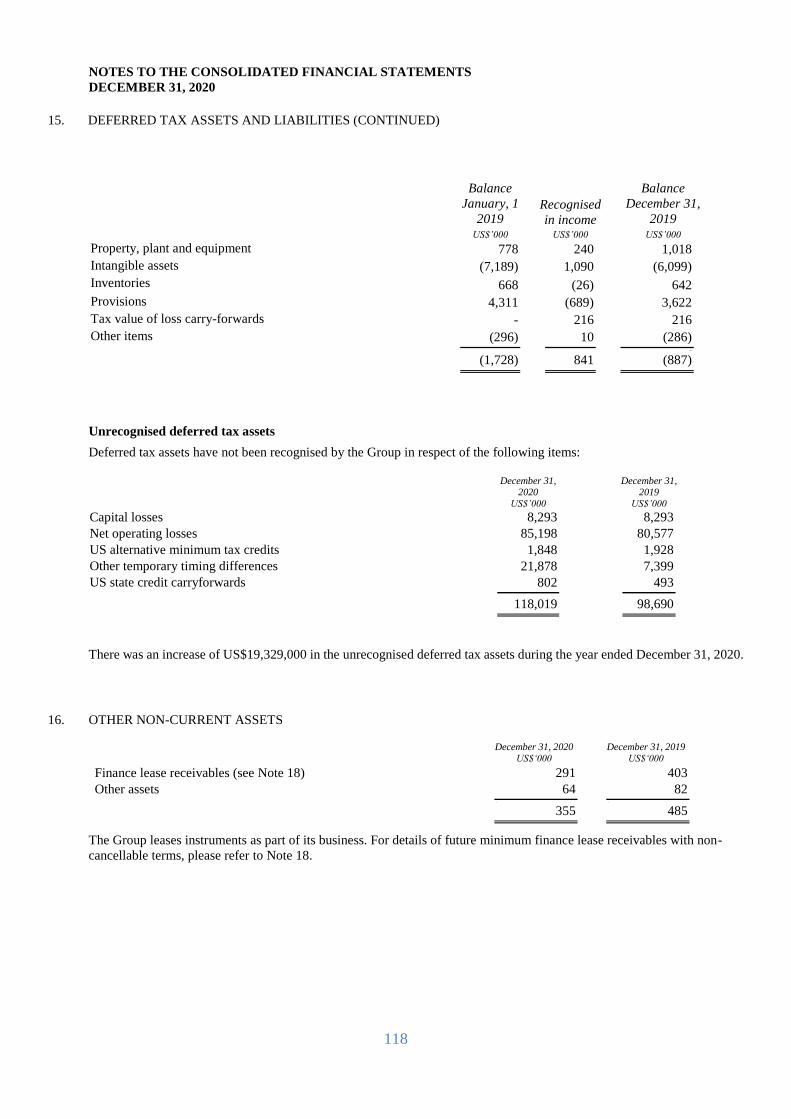
118
NOTES TO THE CONSOLIDATED FINANCIAL STATEMENTS DECEMBER 31, 2020
15. DEFERRED TAX ASSETS AND LIABILITIES (CONTINUED)
Balance
January, 1
2019 Recognised
in income
Balance
December 31,
2019
US$’000 US$’000 US$’000 Property, plant and equipment 778 240 1,018
Intangible assets (7,189) 1,090 (6,099)
Inventories 668 (26) 642
Provisions 4,311 (689) 3,622
Tax value of loss carry-forwards - 216 216
Other items (296) 10 (286) (887
(1,728) 841 (887)
Unrecognised deferred tax assets
Deferred tax assets have not been recognised by the Group in respect of the following items:
December 31, 2020
December 31, 2019
US$’000 US$’000
Capital losses 8,293 8,293
Net operating losses 85,198 80,577
US alternative minimum tax credits 1,848 1,928
Other temporary timing differences 21,878 7,399
US state credit carryforwards 802 493
118,019 98,690
There was an increase of US$19,329,000 in the unrecognised deferred tax assets during the year ended December 31, 2020.
16. OTHER NON-CURRENT ASSETS
December 31, 2020 US$‘000
December 31, 2019 US$‘000
Finance lease receivables (see Note 18) 291 403 Other assets 64 82
355 485
The Group leases instruments as part of its business. For details of future minimum finance lease receivables with non-
cancellable terms, please refer to Note 18.
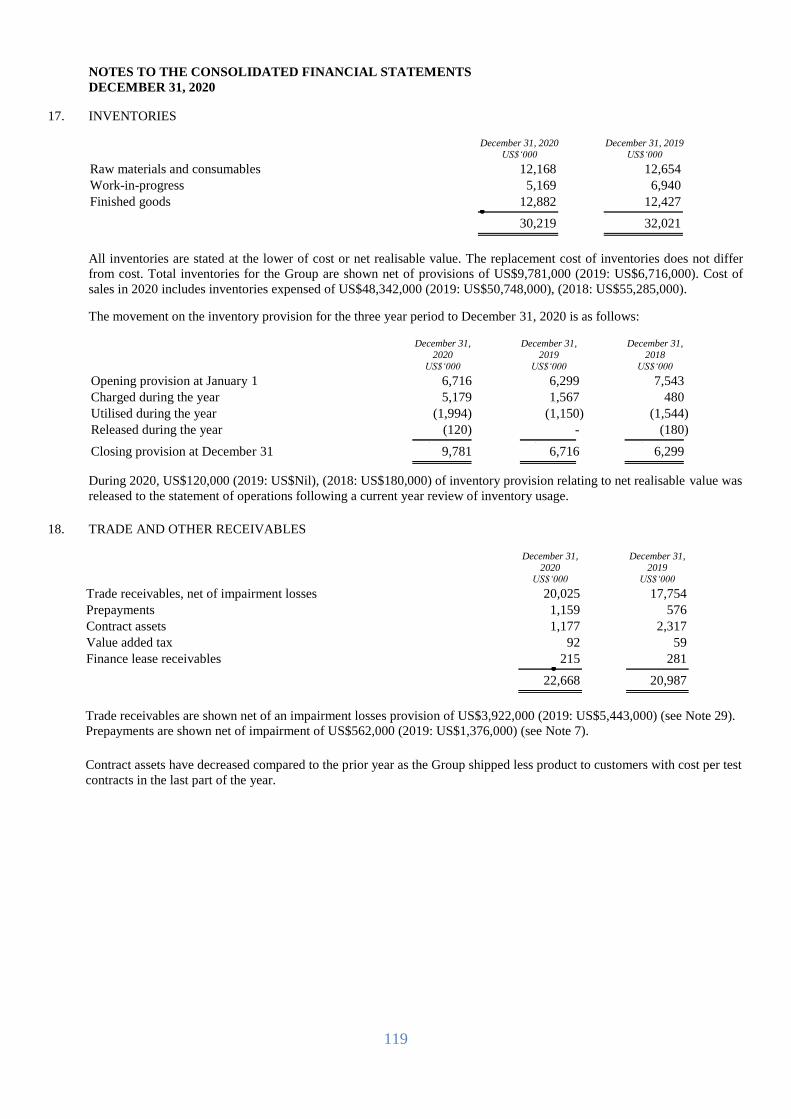
119
NOTES TO THE CONSOLIDATED FINANCIAL STATEMENTS DECEMBER 31, 2020
17. INVENTORIES
December 31, 2020 US$‘000
December 31, 2019 US$‘000
Raw materials and consumables 12,168 12,654 Work-in-progress 5,169 6,940 Finished goods 12,882 12,427
30,219 32,021
All inventories are stated at the lower of cost or net realisable value. The replacement cost of inventories does not differ
from cost. Total inventories for the Group are shown net of provisions of US$9,781,000 (2019: US$6,716,000). Cost of
sales in 2020 includes inventories expensed of US$48,342,000 (2019: US$50,748,000), (2018: US$55,285,000).
The movement on the inventory provision for the three year period to December 31, 2020 is as follows:
December 31, 2020
US$‘000
December 31, 2019
US$‘000
December 31, 2018
US$‘000 Opening provision at January 1 6,716 6,299 7,543 Charged during the year 5,179 1,567 480 Utilised during the year (1,994) (1,150) (1,544) Released during the year (120) - (180)
Closing provision at December 31 9,781 6,716 6,299
During 2020, US$120,000 (2019: US$Nil), (2018: US$180,000) of inventory provision relating to net realisable value was
released to the statement of operations following a current year review of inventory usage.
18. TRADE AND OTHER RECEIVABLES
December 31, 2020
US$‘000
December 31, 2019
US$‘000 Trade receivables, net of impairment losses 20,025 17,754 Prepayments 1,159 576 Contract assets 1,177 2,317 Value added tax 92 59 Finance lease receivables 215 281
22,668 20,987
Trade receivables are shown net of an impairment losses provision of US$3,922,000 (2019: US$5,443,000) (see Note 29).
Prepayments are shown net of impairment of US$562,000 (2019: US$1,376,000) (see Note 7).
Contract assets have decreased compared to the prior year as the Group shipped less product to customers with cost per test
contracts in the last part of the year.
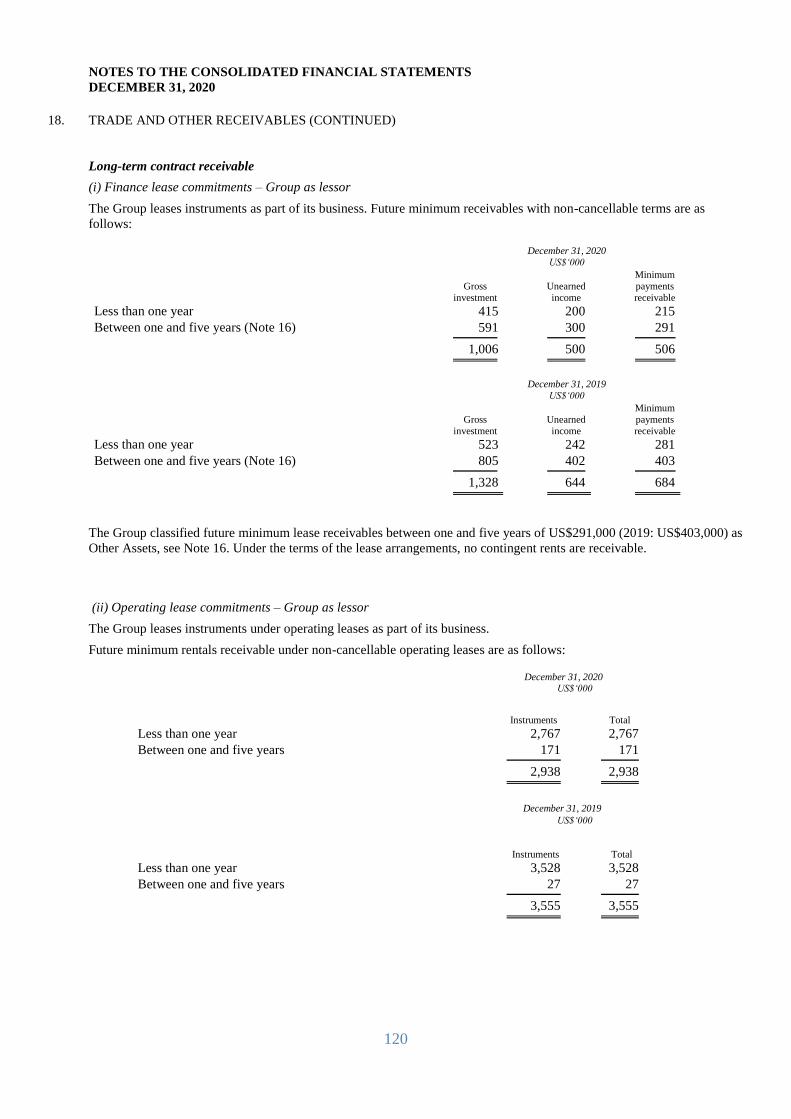
120
NOTES TO THE CONSOLIDATED FINANCIAL STATEMENTS DECEMBER 31, 2020
18. TRADE AND OTHER RECEIVABLES (CONTINUED)
Long-term contract receivable
(i) Finance lease commitments – Group as lessor
The Group leases instruments as part of its business. Future minimum receivables with non-cancellable terms are as
follows:
December 31, 2020 US$‘000
Gross
investment Unearned
income
Minimum
payments
receivable Less than one year 415 200 215 Between one and five years (Note 16) 591 300 291
1,006 500 506
December 31, 2019 US$‘000
Gross
investment Unearned
income
Minimum
payments
receivable Less than one year 523 242 281 Between one and five years (Note 16) 805 402 403
1,328 644 684
The Group classified future minimum lease receivables between one and five years of US$291,000 (2019: US$403,000) as
Other Assets, see Note 16. Under the terms of the lease arrangements, no contingent rents are receivable.
(ii) Operating lease commitments – Group as lessor
The Group leases instruments under operating leases as part of its business.
Future minimum rentals receivable under non-cancellable operating leases are as follows:
December 31, 2020 US$‘000
Instruments Total Less than one year 2,767 2,767 Between one and five years 171 171
2,938 2,938
December 31, 2019 US$‘000
Instruments Total Less than one year 3,528 3,528 Between one and five years 27 27
3,555 3,555

121
NOTES TO THE CONSOLIDATED FINANCIAL STATEMENTS DECEMBER 31, 2020
19. CASH AND CASH EQUIVALENTS
December 31, 2020 US$’000
December 31, 2019 US$’000
Cash at bank and in hand 24,209 6,275 Short-term deposits 3,118 8,956
Cash and cash equivalents 27,327 15,231
20. SHORT-TERM INVESTMENTS
All liquid investments with a maturity greater than six months are considered to be short-term investments.
December 31, 2020 US$’000
December 31, 2019 US$’000
Investments (deposits) - 1,169
- 1,169
21. CAPITAL AND RESERVES
Share capital
Class ‘A’
Ordinary shares Class ‘A’
Ordinary shares In thousands of shares 2020 2019 In issue at January 1 96,162 96,162 Issued for cash - -
In issue at December 31 96,162 96,162
ADS ADS In thousands of ADSs 2020 2019 Balance at January 1 24,041 24,041 Issued for cash - -
Balance at December 31 24,041 24,041
ADS
Treasury shares
ADS
Treasury shares
In thousands of ADSs 2017 2016 Balance at January 1 1,768 659
Purchased during the year 1,344 1,109
Balance at December 31 3,112 1,768
Class ‘A’
Treasury shares Class ‘A’
Treasury shares In thousands of shares 2020 2019 Balance at January 1 12,556 12,556 Purchased during the year - -
Balance at December 31 12,556 12,556
ADS Treasury shares
ADS Treasury shares
In thousands of ADSs 2020 2019 Balance at January 1 3,139 3,139 Purchased during the year - -
Balance at December 31 3,139 3,139
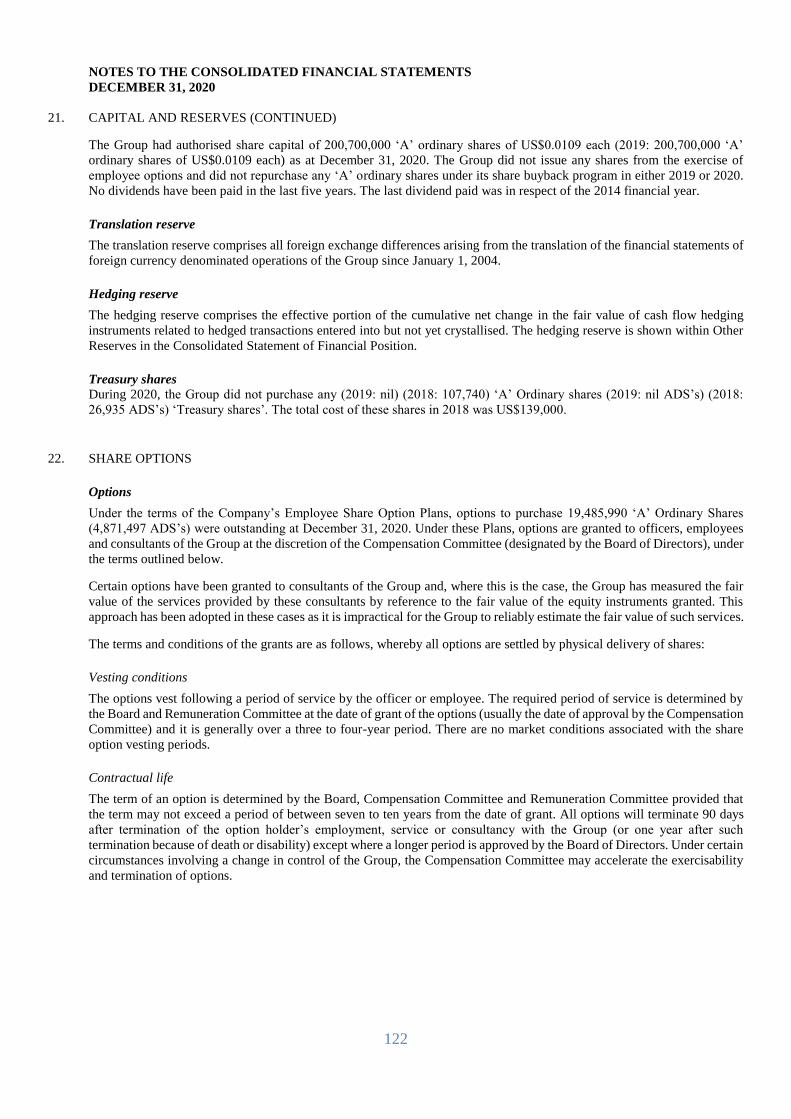
122
NOTES TO THE CONSOLIDATED FINANCIAL STATEMENTS DECEMBER 31, 2020
21. CAPITAL AND RESERVES (CONTINUED)
The Group had authorised share capital of 200,700,000 ‘A’ ordinary shares of US$0.0109 each (2019: 200,700,000 ‘A’
ordinary shares of US$0.0109 each) as at December 31, 2020. The Group did not issue any shares from the exercise of
employee options and did not repurchase any ‘A’ ordinary shares under its share buyback program in either 2019 or 2020.
No dividends have been paid in the last five years. The last dividend paid was in respect of the 2014 financial year.
Translation reserve
The translation reserve comprises all foreign exchange differences arising from the translation of the financial statements of
foreign currency denominated operations of the Group since January 1, 2004.
Hedging reserve
The hedging reserve comprises the effective portion of the cumulative net change in the fair value of cash flow hedging
instruments related to hedged transactions entered into but not yet crystallised. The hedging reserve is shown within Other
Reserves in the Consolidated Statement of Financial Position.
Treasury shares During 2020, the Group did not purchase any (2019: nil) (2018: 107,740) ‘A’ Ordinary shares (2019: nil ADS’s) (2018:
26,935 ADS’s) ‘Treasury shares’. The total cost of these shares in 2018 was US$139,000.
22. SHARE OPTIONS
Options
Under the terms of the Company’s Employee Share Option Plans, options to purchase 19,485,990 ‘A’ Ordinary Shares
(4,871,497 ADS’s) were outstanding at December 31, 2020. Under these Plans, options are granted to officers, employees
and consultants of the Group at the discretion of the Compensation Committee (designated by the Board of Directors), under
the terms outlined below.
Certain options have been granted to consultants of the Group and, where this is the case, the Group has measured the fair
value of the services provided by these consultants by reference to the fair value of the equity instruments granted. This
approach has been adopted in these cases as it is impractical for the Group to reliably estimate the fair value of such services.
The terms and conditions of the grants are as follows, whereby all options are settled by physical delivery of shares:
Vesting conditions
The options vest following a period of service by the officer or employee. The required period of service is determined by
the Board and Remuneration Committee at the date of grant of the options (usually the date of approval by the Compensation
Committee) and it is generally over a three to four-year period. There are no market conditions associated with the share
option vesting periods.
Contractual life
The term of an option is determined by the Board, Compensation Committee and Remuneration Committee provided that
the term may not exceed a period of between seven to ten years from the date of grant. All options will terminate 90 days
after termination of the option holder’s employment, service or consultancy with the Group (or one year after such
termination because of death or disability) except where a longer period is approved by the Board of Directors. Under certain
circumstances involving a change in control of the Group, the Compensation Committee may accelerate the exercisability
and termination of options.
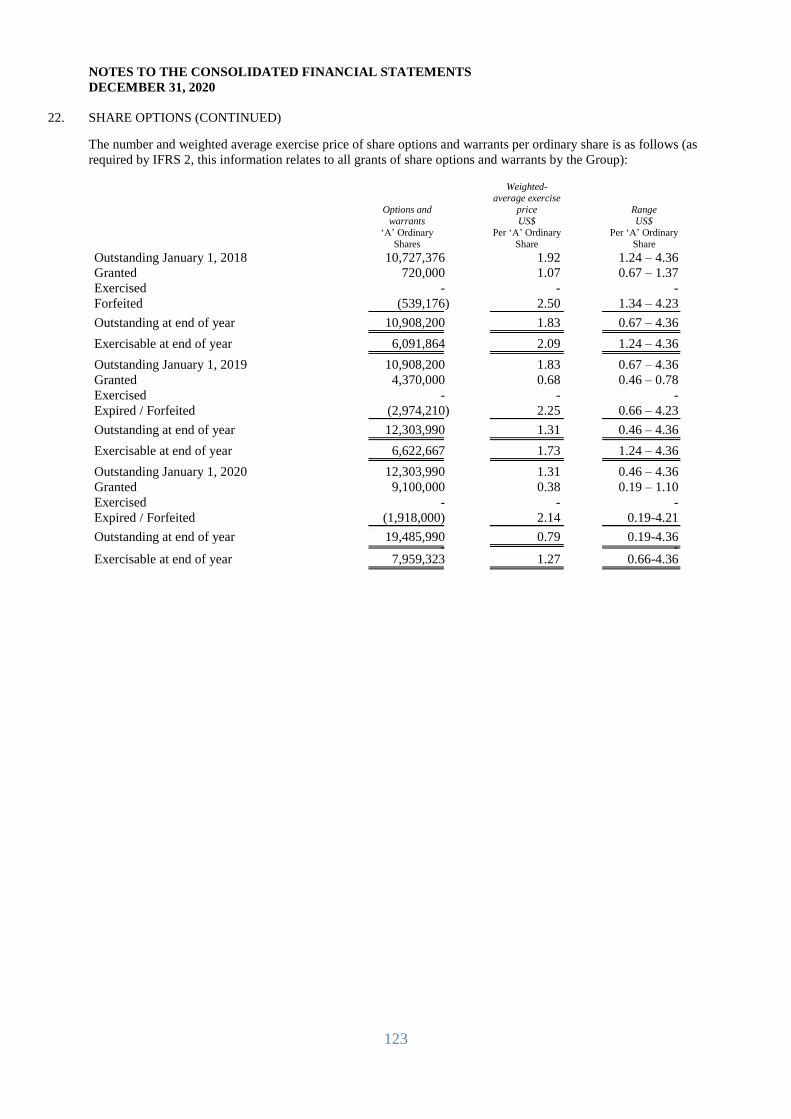
123
NOTES TO THE CONSOLIDATED FINANCIAL STATEMENTS DECEMBER 31, 2020
22. SHARE OPTIONS (CONTINUED)
The number and weighted average exercise price of share options and warrants per ordinary share is as follows (as
required by IFRS 2, this information relates to all grants of share options and warrants by the Group):
Options and
warrants
Weighted-
average exercise
price US$
Range US$
‘A’ Ordinary
Shares Per ‘A’ Ordinary
Share Per ‘A’ Ordinary
Share Outstanding January 1, 2018 10,727,376 1.92 1.24 – 4.36 Granted 720,000 1.07 0.67 – 1.37 Exercised - - - Forfeited (539,176) 2.50 1.34 – 4.23
Outstanding at end of year 10,908,200 1.83 0.67 – 4.36
Exercisable at end of year 6,091,864 2.09 1.24 – 4.36
Outstanding January 1, 2019 10,908,200 1.83 0.67 – 4.36 Granted 4,370,000 0.68 0.46 – 0.78 Exercised - - - Expired / Forfeited (2,974,210) 2.25 0.66 – 4.23
Outstanding at end of year 12,303,990 1.31 0.46 – 4.36
Exercisable at end of year 6,622,667 1.73 1.24 – 4.36
Outstanding January 1, 2020 12,303,990 1.31 0.46 – 4.36 Granted 9,100,000 0.38 0.19 – 1.10 Exercised - - - Expired / Forfeited (1,918,000) 2.14 0.19-4.21
Outstanding at end of year 19,485,990 0.79 0.19-4.36 -
- -
Exercisable at end of year 7,959,323 1.27 0.66-4.36

124
NOTES TO THE CONSOLIDATED FINANCIAL STATEMENTS DECEMBER 31, 2020
22. SHARE OPTIONS (CONTINUED)
Options and
warrants
Weighted-
average exercise
price US$
Range US$
‘ADS’ Equivalent Per ‘ADS’ Per ‘ADS’ Outstanding January 1, 2018 2,681,844 7.69 4.96 - 17.44 Granted 180,000 4.28 2.68 – 5.48 Exercised - - - Expired / Forfeited (134,794) 10.00 5.36 – 16.92
Outstanding at end of year 2,727,050 7.32 2.68– 17.44
Exercisable at end of year 1,522,966 8.36 4.96 – 17.44
Outstanding January 1, 2019 2,727,050 7.32 2.68– 17.44 Granted 1,092,500 2.72 1.83 - 3.10 Exercised - - - Expired / Forfeited (743,552) 8.99 2.64 – 16.92
Outstanding at end of year 3,075,998 5.24 1.83 – 17.45
Exercisable at end of year 1,655,667 6.92 4.95 – 17.45
Outstanding January 1, 2020 3,075,998 5.24 1.83 – 17.45 Granted 2,275,000 1.52 0.77-4.41 Exercised - - - Expired / Forfeited (479,500) 8.56 0.77-16.84
-
- -
Outstanding at end of year 4,871,498 3.15 0.77-17.45 - - -
Exercisable at end of year 1,989,831 5.08 2.64-17.45
There were no share options exercised during 2020, 2019 or 2018.
The opening share price per ‘A’ Ordinary share at the start of the financial year was US$0.27 or US$1.07 per ADS (2019:
US$0.57 or US$2.29 per ADS) (2018: US$1.28 or US$5.10 per ADS) and the closing share price at December 31, 2020
was US$0.95 or US$3.81 per ADS (2019: US$0.26 or US$1.03 per ADS) (2018: US$0.57 or US$2.29 per ADS). The
average share price for the year ended December 31, 2019 was US$0.52 per ‘A’ Ordinary share or US$2.06 per ADS.
A summary of the range of prices for the Company’s stock options for the year ended December 31, 2020 follows:
Outstanding
Exercisable
Exercise price range
No. of
options
‘A’ ordinary
shares
Weighted–
average
exercise
price
Weighted-
average contractual
life
remaining
(years)
No. of
options
‘A’ ordinary
shares
Weighted–
average
exercise
price
Weighted-
average contractual
life
remaining
(years)
US$0.19-US$0.99 13,260,006 0.48 4.14 2,106,673 0.69 1.44
US$1.00-US$2.05 5,664,000 1.34 1.11 5,290,667 1.35 2.44
US$2.06- US$2.99 499,984 2.52 0.05 499,984 2.52 0.13
US$3.00 -US$4.36 62,000 4.17 0.00 62,000 4.17 0.01
19,485,990
7,959,324
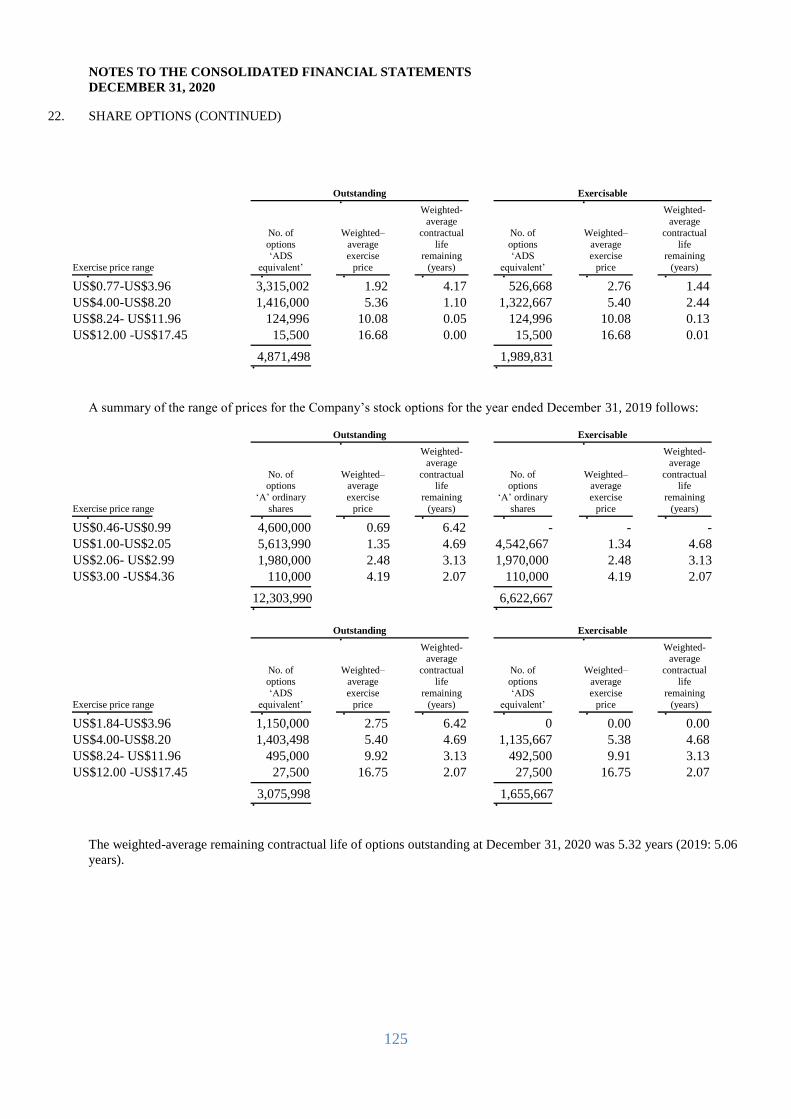
125
NOTES TO THE CONSOLIDATED FINANCIAL STATEMENTS DECEMBER 31, 2020
22. SHARE OPTIONS (CONTINUED)
Outstanding
Exercisable
Exercise price range
No. of
options ‘ADS
equivalent’
Weighted–
average
exercise
price
Weighted-
average
contractual
life
remaining
(years)
No. of
options ‘ADS
equivalent’
Weighted–
average
exercise
price
Weighted-
average
contractual
life
remaining
(years)
US$0.77-US$3.96 3,315,002 1.92 4.17 526,668 2.76 1.44
US$4.00-US$8.20 1,416,000 5.36 1.10 1,322,667 5.40 2.44
US$8.24- US$11.96 124,996 10.08 0.05 124,996 10.08 0.13
US$12.00 -US$17.45 15,500 16.68 0.00 15,500 16.68 0.01
4,871,498
1,989,831
A summary of the range of prices for the Company’s stock options for the year ended December 31, 2019 follows:
Outstanding
Exercisable
Exercise price range
No. of options
‘A’ ordinary
shares
Weighted– average
exercise
price
Weighted-
average
contractual life
remaining
(years)
No. of options
‘A’ ordinary
shares
Weighted– average
exercise
price
Weighted-
average
contractual life
remaining
(years)
US$0.46-US$0.99 4,600,000 0.69 6.42 - - - US$1.00-US$2.05 5,613,990 1.35 4.69 4,542,667 1.34 4.68 US$2.06- US$2.99 1,980,000 2.48 3.13 1,970,000 2.48 3.13 US$3.00 -US$4.36 110,000 4.19 2.07 110,000 4.19 2.07
12,303,990
6,622,667
Outstanding
Exercisable
Exercise price range
No. of
options ‘ADS
equivalent’
Weighted–
average
exercise
price
Weighted- average
contractual
life
remaining
(years)
No. of
options ‘ADS
equivalent’
Weighted–
average
exercise
price
Weighted- average
contractual
life
remaining
(years)
US$1.84-US$3.96 1,150,000 2.75 6.42 0 0.00 0.00
US$4.00-US$8.20 1,403,498 5.40 4.69 1,135,667 5.38 4.68
US$8.24- US$11.96 495,000 9.92 3.13 492,500 9.91 3.13
US$12.00 -US$17.45 27,500 16.75 2.07 27,500 16.75 2.07
3,075,998
1,655,667
The weighted-average remaining contractual life of options outstanding at December 31, 2020 was 5.32 years (2019: 5.06
years).
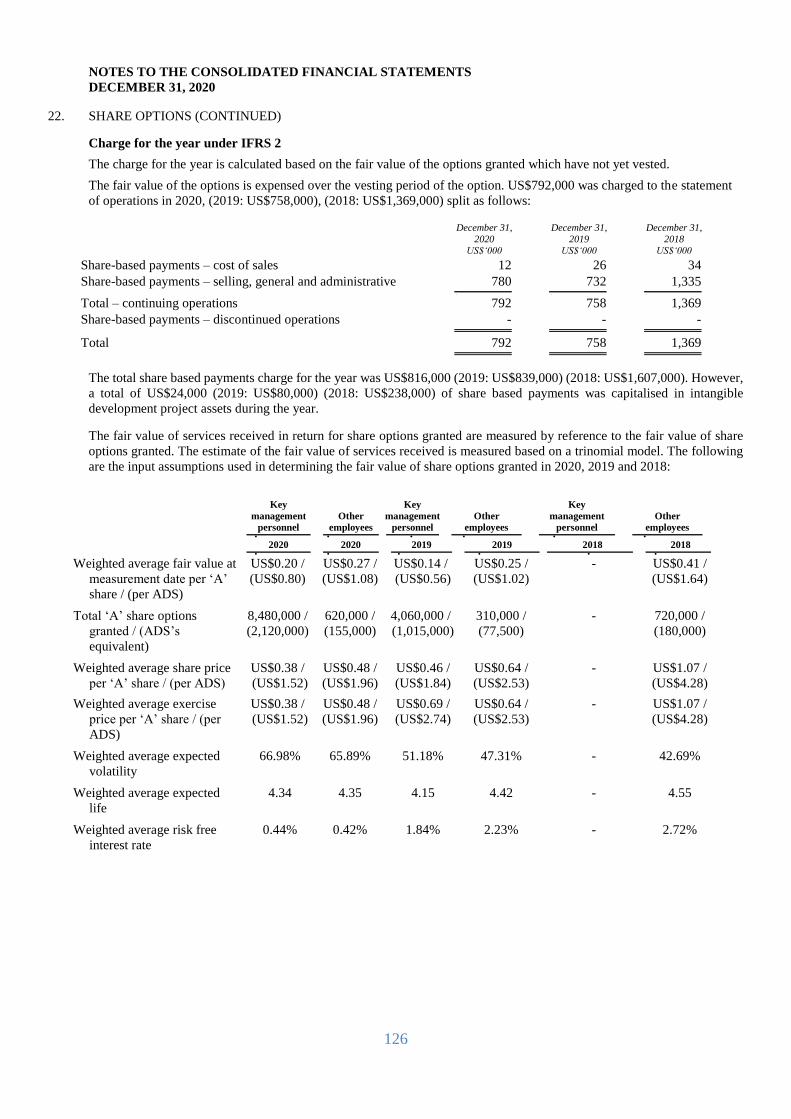
126
NOTES TO THE CONSOLIDATED FINANCIAL STATEMENTS DECEMBER 31, 2020
22. SHARE OPTIONS (CONTINUED)
Charge for the year under IFRS 2
The charge for the year is calculated based on the fair value of the options granted which have not yet vested.
The fair value of the options is expensed over the vesting period of the option. US$792,000 was charged to the statement
of operations in 2020, (2019: US$758,000), (2018: US$1,369,000) split as follows:
December 31, 2020
US$‘000
December 31, 2019
US$‘000
December 31, 2018
US$‘000 Share-based payments – cost of sales 12 26 34 Share-based payments – selling, general and administrative 780 732 1,335
Total – continuing operations 792 758 1,369 Share-based payments – discontinued operations - - -
Total 792 758 1,369
The total share based payments charge for the year was US$816,000 (2019: US$839,000) (2018: US$1,607,000). However,
a total of US$24,000 (2019: US$80,000) (2018: US$238,000) of share based payments was capitalised in intangible
development project assets during the year.
The fair value of services received in return for share options granted are measured by reference to the fair value of share
options granted. The estimate of the fair value of services received is measured based on a trinomial model. The following
are the input assumptions used in determining the fair value of share options granted in 2020, 2019 and 2018:
Key
management
personnel
Other
employees
Key
management
personnel
Other
employees
Key
management
personnel
Other
employees
2020
2020
2019
2019
2018
2018
Weighted average fair value at
measurement date per ‘A’
share / (per ADS)
US$0.20 /
(US$0.80)
US$0.27 /
(US$1.08)
US$0.14 /
(US$0.56)
US$0.25 /
(US$1.02)
-
US$0.41 /
(US$1.64)
Total ‘A’ share options
granted / (ADS’s
equivalent)
8,480,000 /
(2,120,000)
620,000 /
(155,000)
4,060,000 /
(1,015,000)
310,000 /
(77,500)
-
720,000 /
(180,000)
Weighted average share price
per ‘A’ share / (per ADS)
US$0.38 /
(US$1.52)
US$0.48 /
(US$1.96)
US$0.46 /
(US$1.84)
US$0.64 /
(US$2.53)
- US$1.07 /
(US$4.28) Weighted average exercise
price per ‘A’ share / (per
ADS)
US$0.38 /
(US$1.52)
US$0.48 /
(US$1.96)
US$0.69 /
(US$2.74)
US$0.64 /
(US$2.53)
-
US$1.07 /
(US$4.28)
Weighted average expected
volatility
66.98% 65.89% 51.18% 47.31% - 42.69%
Weighted average expected
life
4.34 4.35 4.15 4.42 - 4.55
Weighted average risk free
interest rate
0.44% 0.42% 1.84% 2.23% - 2.72%
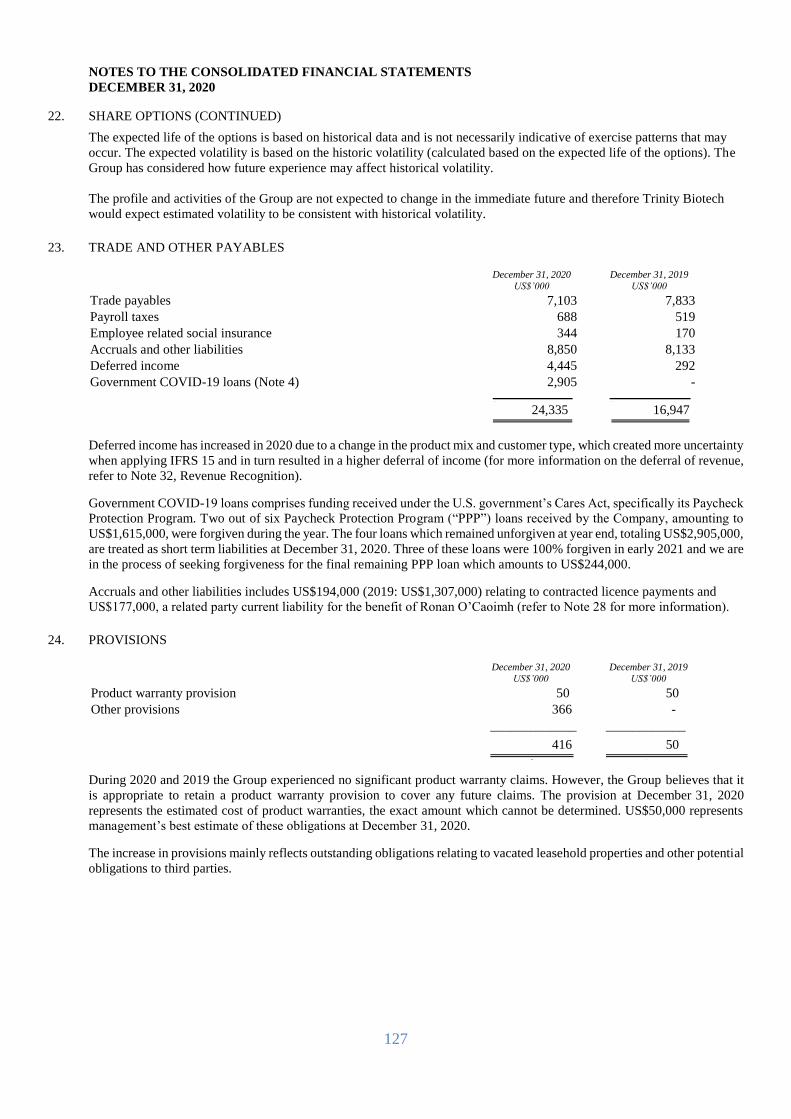
127
NOTES TO THE CONSOLIDATED FINANCIAL STATEMENTS DECEMBER 31, 2020
22. SHARE OPTIONS (CONTINUED)
The expected life of the options is based on historical data and is not necessarily indicative of exercise patterns that may
occur. The expected volatility is based on the historic volatility (calculated based on the expected life of the options). The
Group has considered how future experience may affect historical volatility.
The profile and activities of the Group are not expected to change in the immediate future and therefore Trinity Biotech
would expect estimated volatility to be consistent with historical volatility. 23. TRADE AND OTHER PAYABLES
December 31, 2020 US$’000
December 31, 2019 US$’000
Trade payables 7,103 7,833 Payroll taxes 688 519 Employee related social insurance 344 170 Accruals and other liabilities 8,850 8,133 Deferred income 4,445 292 Government COVID-19 loans (Note 4) 2,905 -
24,335 16,947
Deferred income has increased in 2020 due to a change in the product mix and customer type, which created more uncertainty
when applying IFRS 15 and in turn resulted in a higher deferral of income (for more information on the deferral of revenue,
refer to Note 32, Revenue Recognition).
Government COVID-19 loans comprises funding received under the U.S. government’s Cares Act, specifically its Paycheck
Protection Program. Two out of six Paycheck Protection Program (“PPP”) loans received by the Company, amounting to
US$1,615,000, were forgiven during the year. The four loans which remained unforgiven at year end, totaling US$2,905,000,
are treated as short term liabilities at December 31, 2020. Three of these loans were 100% forgiven in early 2021 and we are
in the process of seeking forgiveness for the final remaining PPP loan which amounts to US$244,000.
Accruals and other liabilities includes US$194,000 (2019: US$1,307,000) relating to contracted licence payments and
US$177,000, a related party current liability for the benefit of Ronan O’Caoimh (refer to Note 28 for more information).
24. PROVISIONS
December 31, 2020 US$’000
December 31, 2019 US$’000
Product warranty provision 50 50 Other provisions 366 -
_____________ ____________
416 50
During 2020 and 2019 the Group experienced no significant product warranty claims. However, the Group believes that it
is appropriate to retain a product warranty provision to cover any future claims. The provision at December 31, 2020
represents the estimated cost of product warranties, the exact amount which cannot be determined. US$50,000 represents
management’s best estimate of these obligations at December 31, 2020.
The increase in provisions mainly reflects outstanding obligations relating to vacated leasehold properties and other potential
obligations to third parties.
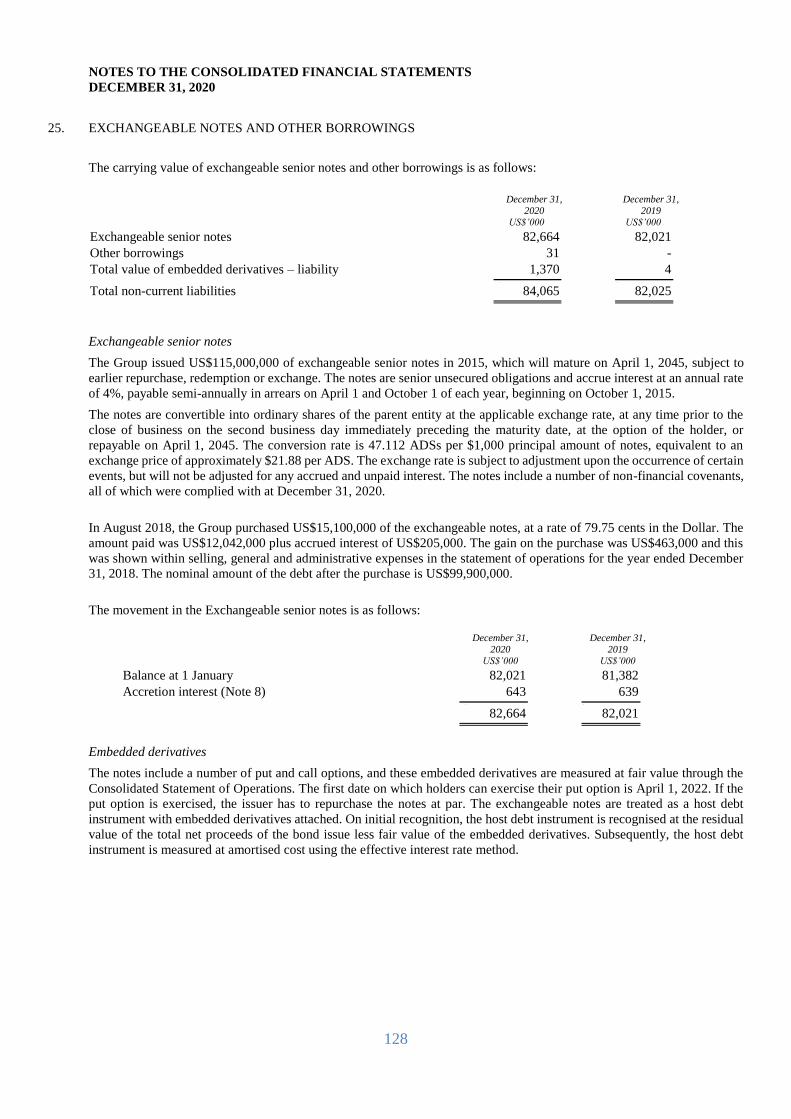
128
NOTES TO THE CONSOLIDATED FINANCIAL STATEMENTS DECEMBER 31, 2020
25. EXCHANGEABLE NOTES AND OTHER BORROWINGS
The carrying value of exchangeable senior notes and other borrowings is as follows:
December 31,
2020 US$’000
December 31,
2019 US$’000
Exchangeable senior notes 82,664 82,021 Other borrowings 31 -
Total value of embedded derivatives – liability 1,370 4
Total non-current liabilities 84,065 82,025
Exchangeable senior notes
The Group issued US$115,000,000 of exchangeable senior notes in 2015, which will mature on April 1, 2045, subject to
earlier repurchase, redemption or exchange. The notes are senior unsecured obligations and accrue interest at an annual rate
of 4%, payable semi-annually in arrears on April 1 and October 1 of each year, beginning on October 1, 2015.
The notes are convertible into ordinary shares of the parent entity at the applicable exchange rate, at any time prior to the
close of business on the second business day immediately preceding the maturity date, at the option of the holder, or
repayable on April 1, 2045. The conversion rate is 47.112 ADSs per $1,000 principal amount of notes, equivalent to an
exchange price of approximately $21.88 per ADS. The exchange rate is subject to adjustment upon the occurrence of certain
events, but will not be adjusted for any accrued and unpaid interest. The notes include a number of non-financial covenants,
all of which were complied with at December 31, 2020.
In August 2018, the Group purchased US$15,100,000 of the exchangeable notes, at a rate of 79.75 cents in the Dollar. The
amount paid was US$12,042,000 plus accrued interest of US$205,000. The gain on the purchase was US$463,000 and this
was shown within selling, general and administrative expenses in the statement of operations for the year ended December
31, 2018. The nominal amount of the debt after the purchase is US$99,900,000.
The movement in the Exchangeable senior notes is as follows:
December 31,
2020 US$’000
December 31,
2019 US$’000
Balance at 1 January 82,021 81,382 Accretion interest (Note 8) 643 639
82,664 82,021
Embedded derivatives
The notes include a number of put and call options, and these embedded derivatives are measured at fair value through the
Consolidated Statement of Operations. The first date on which holders can exercise their put option is April 1, 2022. If the
put option is exercised, the issuer has to repurchase the notes at par. The exchangeable notes are treated as a host debt
instrument with embedded derivatives attached. On initial recognition, the host debt instrument is recognised at the residual
value of the total net proceeds of the bond issue less fair value of the embedded derivatives. Subsequently, the host debt
instrument is measured at amortised cost using the effective interest rate method.
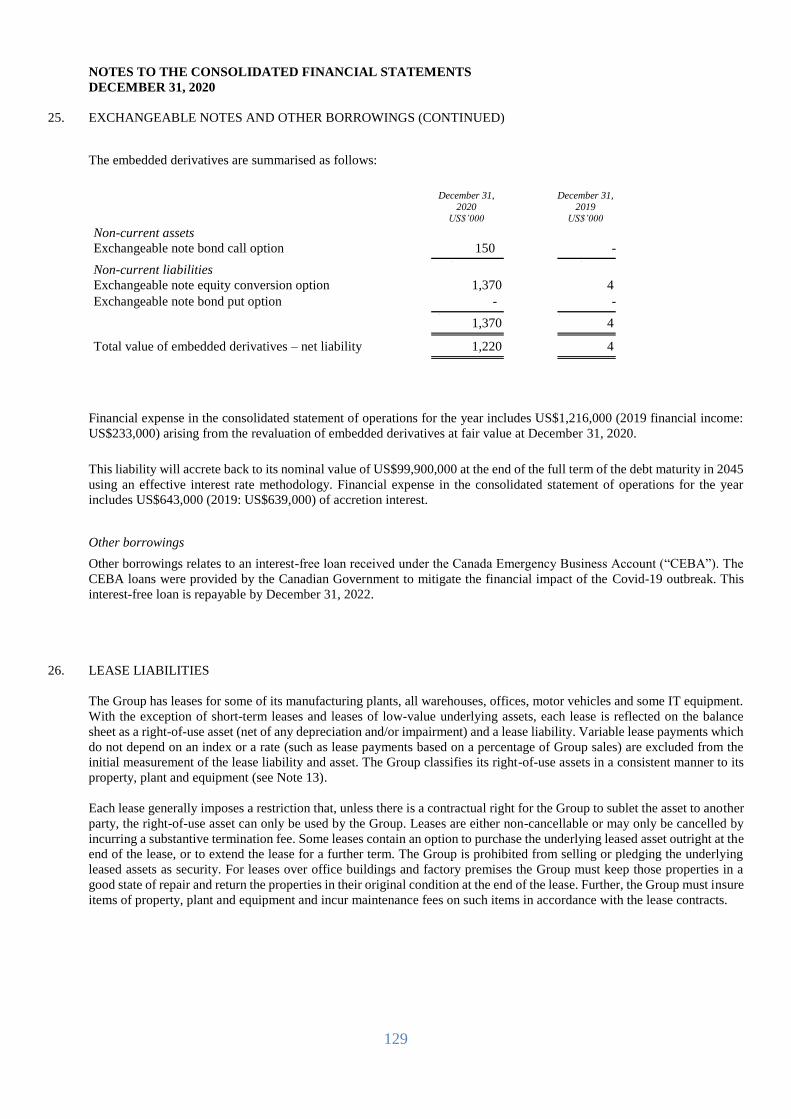
129
NOTES TO THE CONSOLIDATED FINANCIAL STATEMENTS DECEMBER 31, 2020
25. EXCHANGEABLE NOTES AND OTHER BORROWINGS (CONTINUED)
The embedded derivatives are summarised as follows:
December 31,
2020 US$’000
December 31,
2019 US$’000
Non-current assets
Exchangeable note bond call option 150 -
Non-current liabilities
Exchangeable note equity conversion option 1,370 4 Exchangeable note bond put option - -
1,370 4
Total value of embedded derivatives – net liability 1,220 4
Financial expense in the consolidated statement of operations for the year includes US$1,216,000 (2019 financial income:
US$233,000) arising from the revaluation of embedded derivatives at fair value at December 31, 2020.
This liability will accrete back to its nominal value of US$99,900,000 at the end of the full term of the debt maturity in 2045
using an effective interest rate methodology. Financial expense in the consolidated statement of operations for the year
includes US$643,000 (2019: US$639,000) of accretion interest.
Other borrowings
Other borrowings relates to an interest-free loan received under the Canada Emergency Business Account (“CEBA”). The
CEBA loans were provided by the Canadian Government to mitigate the financial impact of the Covid-19 outbreak. This
interest-free loan is repayable by December 31, 2022.
26. LEASE LIABILITIES
The Group has leases for some of its manufacturing plants, all warehouses, offices, motor vehicles and some IT equipment.
With the exception of short-term leases and leases of low-value underlying assets, each lease is reflected on the balance
sheet as a right-of-use asset (net of any depreciation and/or impairment) and a lease liability. Variable lease payments which
do not depend on an index or a rate (such as lease payments based on a percentage of Group sales) are excluded from the
initial measurement of the lease liability and asset. The Group classifies its right-of-use assets in a consistent manner to its
property, plant and equipment (see Note 13).
Each lease generally imposes a restriction that, unless there is a contractual right for the Group to sublet the asset to another
party, the right-of-use asset can only be used by the Group. Leases are either non-cancellable or may only be cancelled by
incurring a substantive termination fee. Some leases contain an option to purchase the underlying leased asset outright at the
end of the lease, or to extend the lease for a further term. The Group is prohibited from selling or pledging the underlying
leased assets as security. For leases over office buildings and factory premises the Group must keep those properties in a
good state of repair and return the properties in their original condition at the end of the lease. Further, the Group must insure
items of property, plant and equipment and incur maintenance fees on such items in accordance with the lease contracts.
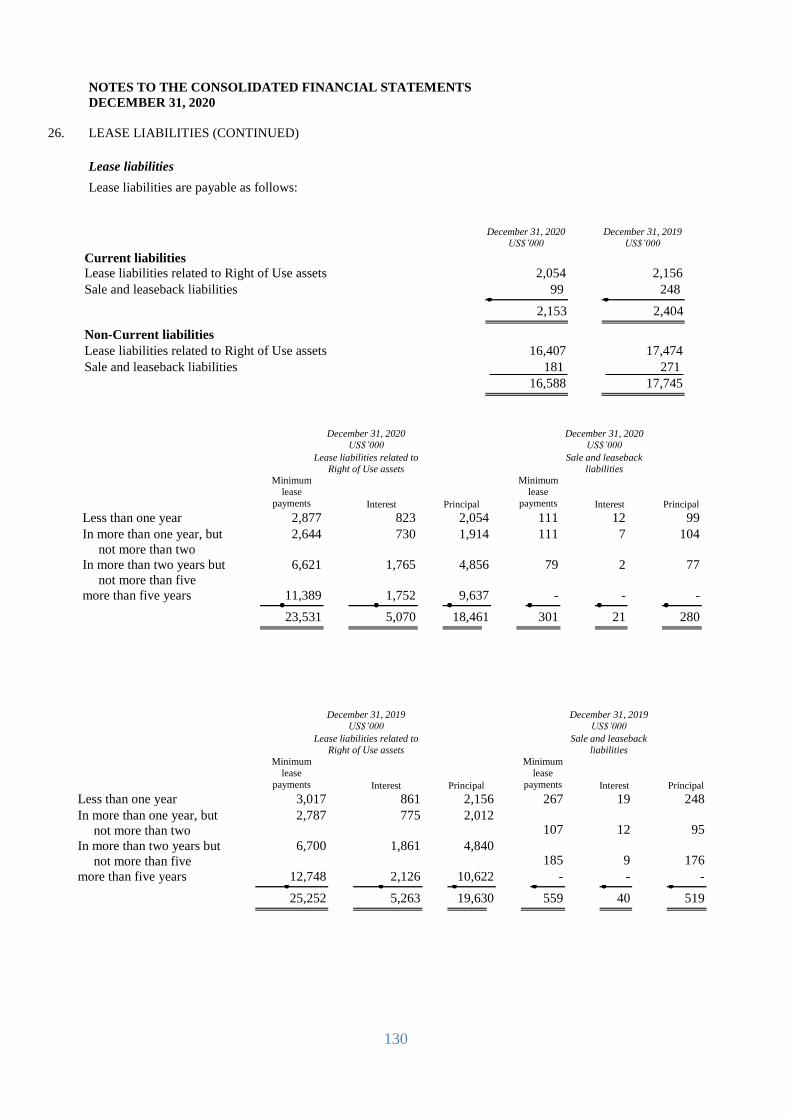
130
NOTES TO THE CONSOLIDATED FINANCIAL STATEMENTS DECEMBER 31, 2020
26. LEASE LIABILITIES (CONTINUED)
Lease liabilities
Lease liabilities are payable as follows:
December 31, 2020 US$’000
December 31, 2019 US$’000
Current liabilities
Lease liabilities related to Right of Use assets 2,054 2,156
Sale and leaseback liabilities 99 248
2,153 2,404
Non-Current liabilities
Lease liabilities related to Right of Use assets 16,407 17,474
Sale and leaseback liabilities 181 271 16,588 17,745
December 31, 2020
US$’000
December 31, 2020
US$’000
Lease liabilities related to
Right of Use assets
Sale and leaseback
liabilities
Minimum
lease
payments Interest Principal
Minimum
lease
payments Interest Principal
Less than one year 2,877 823 2,054 111 12 99
In more than one year, but
not more than two
2,644 730 1,914 111 7 104
In more than two years but
not more than five
6,621 1,765 4,856 79 2 77
more than five years 11,389 1,752 9,637 - - -
23,531 5,070 18,461 301 21 280
December 31, 2019 US$’000
December 31, 2019 US$’000
Lease liabilities related to
Right of Use assets
Sale and leaseback
liabilities
Minimum lease
payments Interest Principal
Minimum lease
payments Interest Principal Less than one year 3,017 861 2,156 267 19 248
In more than one year, but
not more than two 2,787 775 2,012
107 12 95
In more than two years but
not more than five 6,700 1,861 4,840
185 9 176
more than five years 12,748 2,126 10,622 - - -
25,252 5,263 19,630 559 40 519
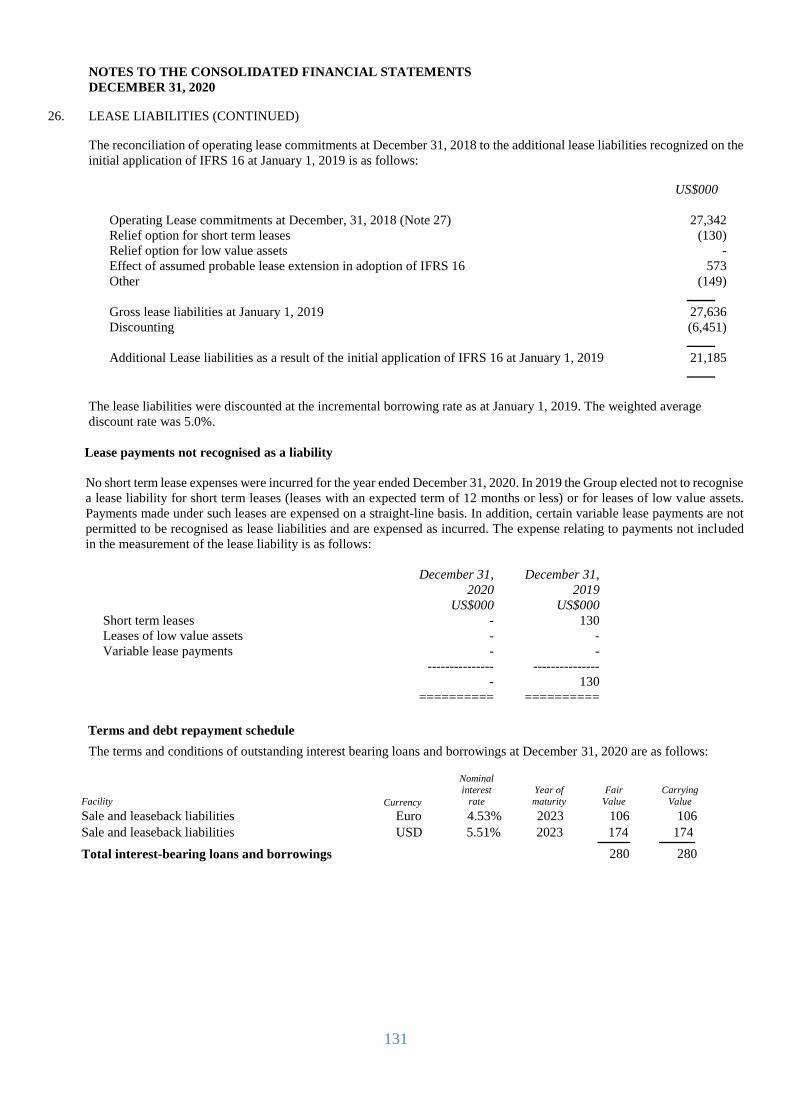
131
NOTES TO THE CONSOLIDATED FINANCIAL STATEMENTS DECEMBER 31, 2020
26. LEASE LIABILITIES (CONTINUED)
The reconciliation of operating lease commitments at December 31, 2018 to the additional lease liabilities recognized on the
initial application of IFRS 16 at January 1, 2019 is as follows:
US$000
Operating Lease commitments at December, 31, 2018 (Note 27) 27,342
Relief option for short term leases (130)
Relief option for low value assets -
Effect of assumed probable lease extension in adoption of IFRS 16 573
Other (149)
Gross lease liabilities at January 1, 2019 27,636
Discounting (6,451)
Additional Lease liabilities as a result of the initial application of IFRS 16 at January 1, 2019 21,185
The lease liabilities were discounted at the incremental borrowing rate as at January 1, 2019. The weighted average
discount rate was 5.0%.
Lease payments not recognised as a liability
No short term lease expenses were incurred for the year ended December 31, 2020. In 2019 the Group elected not to recognise
a lease liability for short term leases (leases with an expected term of 12 months or less) or for leases of low value assets.
Payments made under such leases are expensed on a straight-line basis. In addition, certain variable lease payments are not
permitted to be recognised as lease liabilities and are expensed as incurred. The expense relating to payments not included
in the measurement of the lease liability is as follows:
December 31,
2020
December 31,
2019
US$000 US$000
Short term leases - 130
Leases of low value assets - -
Variable lease payments - -
--------------- ---------------
- 130
========== ==========
Terms and debt repayment schedule
The terms and conditions of outstanding interest bearing loans and borrowings at December 31, 2020 are as follows:
Facility Currency
Nominal interest
rate Year of maturity
Fair Value
Carrying Value
Sale and leaseback liabilities Euro 4.53 % 2023 106 106 Sale and leaseback liabilities USD 5.51% 2023 174 174
Total interest-bearing loans and borrowings
280 280
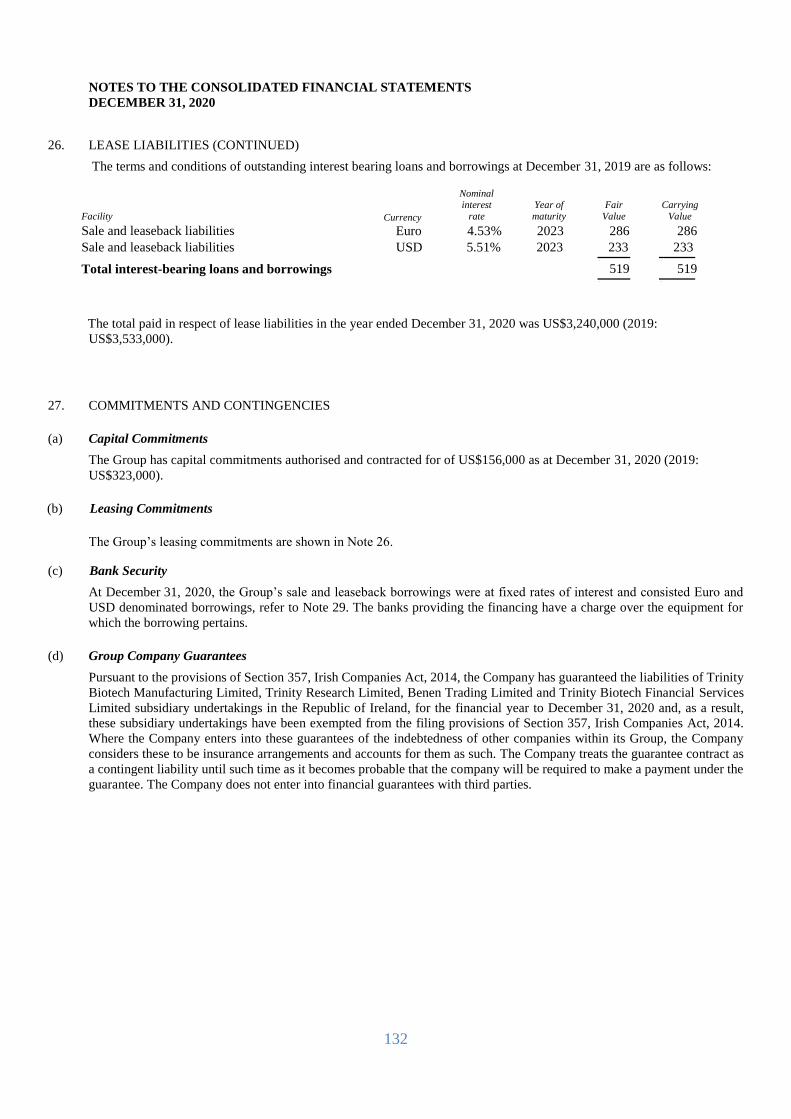
132
NOTES TO THE CONSOLIDATED FINANCIAL STATEMENTS DECEMBER 31, 2020
26. LEASE LIABILITIES (CONTINUED)
The terms and conditions of outstanding interest bearing loans and borrowings at December 31, 2019 are as follows:
Facility Currency
Nominal interest
rate Year of maturity
Fair Value
Carrying Value
Sale and leaseback liabilities Euro 4.53 % 2023 286 286 Sale and leaseback liabilities USD 5.51% 2023 233 233
Total interest-bearing loans and borrowings
519 519
The total paid in respect of lease liabilities in the year ended December 31, 2020 was US$3,240,000 (2019:
US$3,533,000).
27. COMMITMENTS AND CONTINGENCIES
(a) Capital Commitments
The Group has capital commitments authorised and contracted for of US$156,000 as at December 31, 2020 (2019:
US$323,000).
(b) Leasing Commitments
The Group’s leasing commitments are shown in Note 26.
(c) Bank Security
At December 31, 2020, the Group’s sale and leaseback borrowings were at fixed rates of interest and consisted Euro and
USD denominated borrowings, refer to Note 29. The banks providing the financing have a charge over the equipment for
which the borrowing pertains.
(d) Group Company Guarantees
Pursuant to the provisions of Section 357, Irish Companies Act, 2014, the Company has guaranteed the liabilities of Trinity
Biotech Manufacturing Limited, Trinity Research Limited, Benen Trading Limited and Trinity Biotech Financial Services
Limited subsidiary undertakings in the Republic of Ireland, for the financial year to December 31, 2020 and, as a result,
these subsidiary undertakings have been exempted from the filing provisions of Section 357, Irish Companies Act, 2014.
Where the Company enters into these guarantees of the indebtedness of other companies within its Group, the Company
considers these to be insurance arrangements and accounts for them as such. The Company treats the guarantee contract as
a contingent liability until such time as it becomes probable that the company will be required to make a payment under the
guarantee. The Company does not enter into financial guarantees with third parties.
133
NOTES TO THE CONSOLIDATED FINANCIAL STATEMENTS DECEMBER 31, 2020
27. COMMITMENTS AND CONTINGENCIES (CONTINUED)
(e) Contingent Asset
In the 2019 financial statements, a contingent asset of US$1,231,000 was disclosed in connection with the 2019 tax audit
settlement payable by Darnick Company. This balance was settled in the year ended December 31, 2020 and has been
credited to the Statement of Operations within Selling, General and Administrative Expenses. The underlying amount was
denominated in Euro. Due to a depreciation in the US Dollar since 2019, the US Dollar equivalent amount increased from
US$1,231,000 to US$1,316,000. The settlement amount received by the Company was US$177,000 more than the balance
owed and this overpayment is recorded as a related party current liability for the benefit of Ronan O’Caoimh as at December
31, 2020. The amount was settled by the Group in January 2021. There are no contingent assets as of December 31, 2020.
(f) Government Grant Contingencies
The Group has received training and employment grant income from Irish development agencies. Subject to existence of
certain conditions specified in the grant agreements, this income may become repayable. No such conditions existed as at
December 31, 2020. However, if the income were to become repayable, the maximum amounts repayable as at December 31,
2020 would amount to US$3,130,000 (2019: US$2,834,000).
The Company also received funds from the U.S. government as part of its Paycheck Protection Program in 2020. A total of
US$4,520,000 was received under this program. As at December 31, 2020, US$1,615,000 of the loans had been forgiven,
as referenced in Note 4. The four loans which remained unforgiven at year end, totaling US$2,905,000, are treated as short
term liabilities at December 31, 2020. Three of these loans were 100% forgiven in early 2021 and we are in the process of
seeking forgiveness for the final remaining PPP loan which amounts to US$244,000. The maximum amounts repayable as
at December 31, 2020 would amount to US$2,905,000 and this contingent liability has been recorded on the balance sheet
at December 31, 2020.
(g) Other Contingencies
The Company has other contingencies primarily relating to claims and legal proceedings, onerous contracts, product
warranties and employee related provisions. The status of each significant claim and legal proceeding in which the Company
is involved is reviewed by management on a periodic basis and the Group’s potential financial exposure is assessed. If the
potential loss from any claim or legal proceeding is considered probable, and the amount can be reliably estimated, a liability
is recognised for the estimated loss. Because of the uncertainties inherent in such matters, the related provisions are based
on the best information available at the time; the issues taken into account by management and factored into the assessment
of legal contingencies include, as applicable, the status of settlement negotiations, interpretations of contractual obligations,
prior experience with similar contingencies/claims, and advice obtained from legal counsel and other third parties. The
Group expects the majority of these provisions will be utilised within one to three years of the balance sheet date; however
due to the nature of the legal provisions there is a level of uncertainty in the timing of settlement as the Group generally
cannot determine the extent and duration of the legal process.
28. RELATED PARTY TRANSACTIONS
The Group has related party relationships with its subsidiaries, and with its directors and executive officers.
Leasing arrangements with related parties
The Group has entered into various arrangements with JRJ Investments (“JRJ”), a partnership owned by Mr O’Caoimh and
Dr Walsh, directors of Trinity Biotech, and directly with Mr O’Caoimh, to provide for current and potential future needs to
extend its premises at IDA Business Park, Bray, Co. Wicklow, Ireland.
The Group has entered into an agreement for a 25-year lease with JRJ for offices that adjacent to its then premises at IDA
Business Park, Bray, Co. Wicklow, Ireland. The annual rent of €381,000 (US$466,000) is payable from January 1, 2004.
Upward-only rent reviews are carried out every five years and there have been no increases arising from these rent reviews.
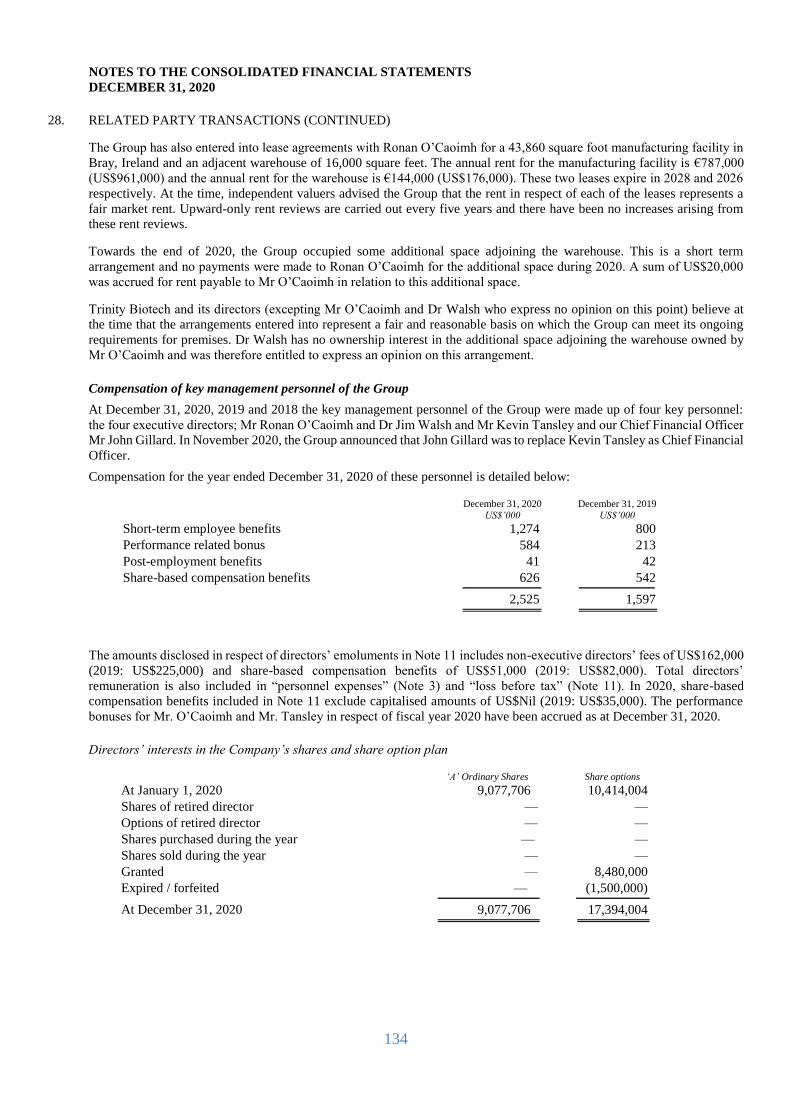
134
NOTES TO THE CONSOLIDATED FINANCIAL STATEMENTS DECEMBER 31, 2020
28. RELATED PARTY TRANSACTIONS (CONTINUED)
The Group has also entered into lease agreements with Ronan O’Caoimh for a 43,860 square foot manufacturing facility in
Bray, Ireland and an adjacent warehouse of 16,000 square feet. The annual rent for the manufacturing facility is €787,000
(US$961,000) and the annual rent for the warehouse is €144,000 (US$176,000). These two leases expire in 2028 and 2026
respectively. At the time, independent valuers advised the Group that the rent in respect of each of the leases represents a
fair market rent. Upward-only rent reviews are carried out every five years and there have been no increases arising from
these rent reviews.
Towards the end of 2020, the Group occupied some additional space adjoining the warehouse. This is a short term
arrangement and no payments were made to Ronan O’Caoimh for the additional space during 2020. A sum of US$20,000
was accrued for rent payable to Mr O’Caoimh in relation to this additional space.
Trinity Biotech and its directors (excepting Mr O’Caoimh and Dr Walsh who express no opinion on this point) believe at
the time that the arrangements entered into represent a fair and reasonable basis on which the Group can meet its ongoing
requirements for premises. Dr Walsh has no ownership interest in the additional space adjoining the warehouse owned by
Mr O’Caoimh and was therefore entitled to express an opinion on this arrangement.
Compensation of key management personnel of the Group
At December 31, 2020, 2019 and 2018 the key management personnel of the Group were made up of four key personnel:
the four executive directors; Mr Ronan O’Caoimh and Dr Jim Walsh and Mr Kevin Tansley and our Chief Financial Officer
Mr John Gillard. In November 2020, the Group announced that John Gillard was to replace Kevin Tansley as Chief Financial
Officer.
Compensation for the year ended December 31, 2020 of these personnel is detailed below:
December 31, 2020 December 31, 2019 US$’000 US$’000
Short-term employee benefits 1,274 800 Performance related bonus 584 213 Post-employment benefits 41 42 Share-based compensation benefits 626 542
2,525 1,597
The amounts disclosed in respect of directors’ emoluments in Note 11 includes non-executive directors’ fees of US$162,000
(2019: US$225,000) and share-based compensation benefits of US$51,000 (2019: US$82,000). Total directors’
remuneration is also included in “personnel expenses” (Note 3) and “loss before tax” (Note 11). In 2020, share-based
compensation benefits included in Note 11 exclude capitalised amounts of US$Nil (2019: US$35,000). The performance
bonuses for Mr. O’Caoimh and Mr. Tansley in respect of fiscal year 2020 have been accrued as at December 31, 2020.
Directors’ interests in the Company’s shares and share option plan
‘A’ Ordinary Shares Share options At January 1, 2020 9,077,706 10,414,004 Shares of retired director — —
Options of retired director — —
Shares purchased during the year — —
Shares sold during the year — —
Granted — 8,480,000
Expired / forfeited — (1,500,000)
At December 31, 2020 9,077,706 17,394,004

135
NOTES TO THE CONSOLIDATED FINANCIAL STATEMENTS DECEMBER 31, 2020
28. RELATED PARTY TRANSACTIONS (CONTINUED)
‘A’ Ordinary Shares Share options
At January 1, 2019 9,139,706 8,655,004 Shares of retired director (30,000) —
Options of retired director — (215,000)
Shares purchased during the year — —
Shares sold during the year (32,000) —
Granted — 4,060,000
Expired / forfeited — (2,086,000)
At December 31, 2019 9,077,706 10,414,004
Rayville Limited, an Irish registered company, which is wholly owned by three executive directors and certain other former
executives of the Group, owns all of the ‘B’ non-voting Ordinary Shares in Trinity Research Limited, one of the Group’s
subsidiaries. The ‘B’ shares do not entitle the holders thereof to receive any assets of the company on a winding up. All of
the ‘A’ voting ordinary shares in Trinity Research Limited are held by the Group. Trinity Research Limited may, from time
to time, declare dividends to Rayville Limited and Rayville Limited may declare dividends to its shareholders out of those
amounts.
Any such dividends paid by Trinity Research Limited are ordinarily treated as a compensation expense by the Group in the
consolidated financial statements prepared in accordance with IFRS, notwithstanding their legal form of dividends to
minority interests, as this best represents the substance of the transactions.
The last dividend paid by Trinity Research Limited to Rayville Limited was in June 2009 for US$2,830,000. At the time
this amount was immediately lent back by Rayville Limited to Trinity Research Limited. Since then US$1,788,000 of these
loans have been repaid and recognised as a compensation expense by the Group. As of December 31, 2019 and December
31, 2020, the remaining amount of the loan was US$1,042,000. As this remaining amount of the original dividend is matched
by a loan from Rayville Limited to Trinity Research Limited which is repayable solely at the discretion of the Remuneration
Committee of the Board and is unsecured and interest free, the Group netted the dividend paid to Rayville Limited against
the corresponding loan from Rayville Limited in the 2019 and 2020 consolidated financial statements. During 2019, Trinity
Research Limited repaid loans to Rayville Limited of US$159,000 in order to meet its obligations under a tax settlement
arising from a tax audit.
As described in Note 6, in the year ended December 31, 2019 a tax audit settlement was reached which included the payment
of US$3,863,000 in relation to payments made by Trinity Research Limited to Rayville Limited and US$1,231,000 in
relation to payments for CEO services made to Darnick Company. Darnick Company agreed to contribute US$1,231,000
to the above settlement and this amount was outstanding at December 31, 2019 and was treated as a contingent asset and
not recognised in the consolidated statement of financial position at December 31, 2019 (refer to Note 27).
This balance was settled in the year ended December 31, 2020 and has been credited to the Statement of Operations within
Selling, General and Administrative Expenses. The underlying amount was denominated in Euro. Due to a depreciation in
the US Dollar since 2019, the US Dollar equivalent amount increased from US$1,231,000 to US$1,316,000. The settlement
amount received by the Company was US$177,000 more than the balance owed and this overpayment is recorded as a
related party current liability for the benefit of Ronan O’Caoimh as at December 31, 2020. The amount was settled by the
Group in January 2021.
29. CAPITAL AND FINANCIAL RISK MANAGEMENT
Capital Management
The Group’s policy is to maintain a strong capital base so as to maintain investor, creditor and market confidence and to
sustain future development of the business. The Board of Directors monitors earnings per share as a measure of performance,
which the Group defines as profit after tax divided by the weighted average number of shares in issue.
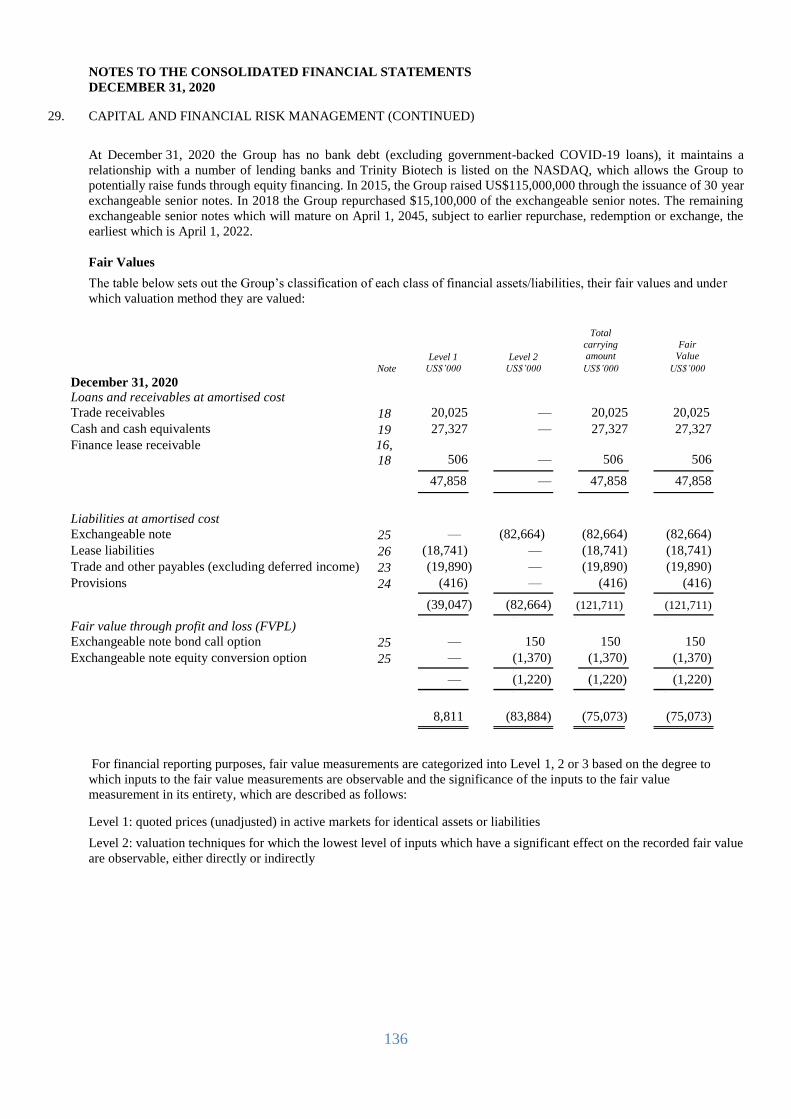
136
NOTES TO THE CONSOLIDATED FINANCIAL STATEMENTS DECEMBER 31, 2020
29. CAPITAL AND FINANCIAL RISK MANAGEMENT (CONTINUED)
At December 31, 2020 the Group has no bank debt (excluding government-backed COVID-19 loans), it maintains a
relationship with a number of lending banks and Trinity Biotech is listed on the NASDAQ, which allows the Group to
potentially raise funds through equity financing. In 2015, the Group raised US$115,000,000 through the issuance of 30 year
exchangeable senior notes. In 2018 the Group repurchased $15,100,000 of the exchangeable senior notes. The remaining
exchangeable senior notes which will mature on April 1, 2045, subject to earlier repurchase, redemption or exchange, the
earliest which is April 1, 2022.
Fair Values
The table below sets out the Group’s classification of each class of financial assets/liabilities, their fair values and under
which valuation method they are valued:
Level 1 Level 2
Total carrying amount
Fair Value
Note US$’000 US$’000 US$’000 US$’000 December 31, 2020
Loans and receivables at amortised cost
Trade receivables 18 20,025 — 20,025 20,025
Cash and cash equivalents 19 27,327 — 27,327 27,327 Finance lease receivable 16,
18 506 — 506 506
47,858 — 47,858 47,858
Liabilities at amortised cost
Exchangeable note 25 — (82,664) (82,664) (82,664) Lease liabilities 26 (18,741) — (18,741) (18,741) Trade and other payables (excluding deferred income) 23 (19,890) — (19,890) (19,890) Provisions 24 (416) — (416) (416)
(39,047) (82,664) (121,711) (121,711)
Fair value through profit and loss (FVPL)
Exchangeable note bond call option 25 — 150 150 150 Exchangeable note equity conversion option 25 — (1,370) (1,370) (1,370)
— (1,220) (1,220) (1,220)
8,811
(83,884) (75,073) (75,073)
For financial reporting purposes, fair value measurements are categorized into Level 1, 2 or 3 based on the degree to
which inputs to the fair value measurements are observable and the significance of the inputs to the fair value
measurement in its entirety, which are described as follows:
Level 1: quoted prices (unadjusted) in active markets for identical assets or liabilities
Level 2: valuation techniques for which the lowest level of inputs which have a significant effect on the recorded fair value
are observable, either directly or indirectly
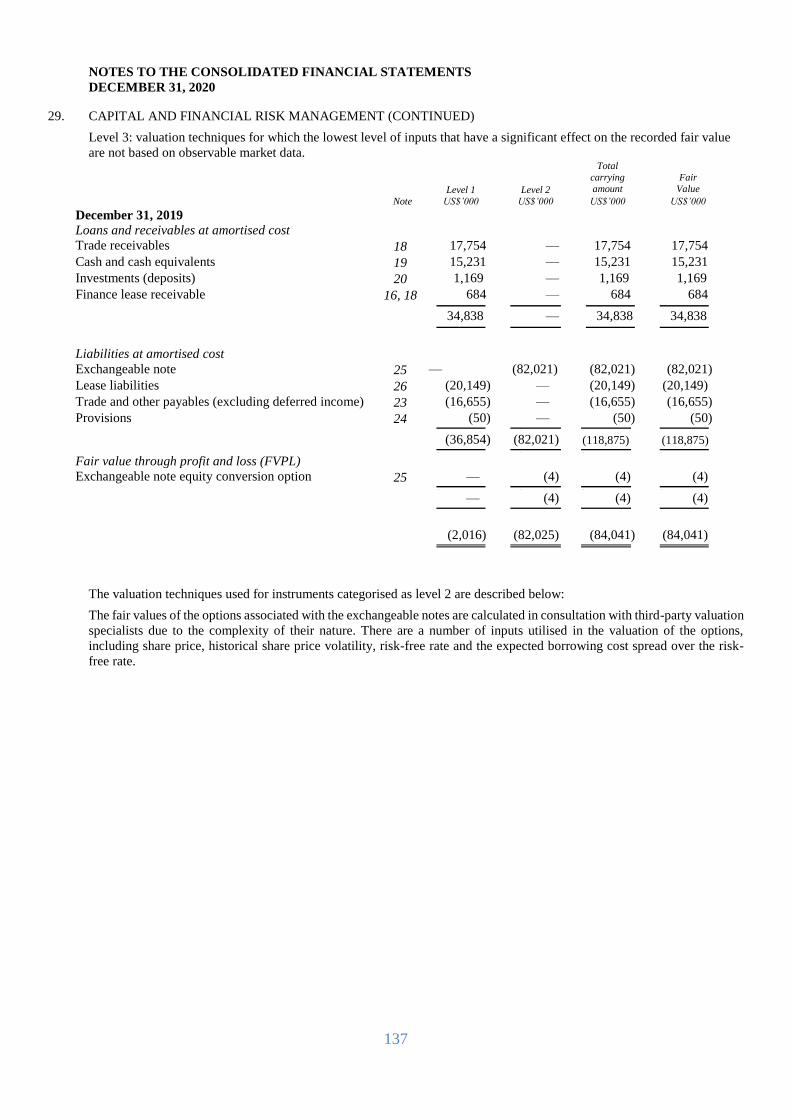
137
NOTES TO THE CONSOLIDATED FINANCIAL STATEMENTS DECEMBER 31, 2020
29. CAPITAL AND FINANCIAL RISK MANAGEMENT (CONTINUED)
Level 3: valuation techniques for which the lowest level of inputs that have a significant effect on the recorded fair value
are not based on observable market data.
Level 1 Level 2
Total carrying amount
Fair Value
Note US$’000 US$’000 US$’000 US$’000 December 31, 2019
Loans and receivables at amortised cost
Trade receivables 18 17,754 — 17,754 17,754 Cash and cash equivalents 19 15,231 — 15,231 15,231 Investments (deposits) 20 1,169 — 1,169 1,169
Finance lease receivable 16, 18 684 — 684 684
34,838 — 34,838 34,838
Liabilities at amortised cost
Exchangeable note 25 — (82,021) (82,021) (82,021) Lease liabilities 26 (20,149) — (20,149) (20,149) Trade and other payables (excluding deferred income) 23 (16,655) — (16,655) (16,655) Provisions 24 (50) — (50) (50)
(36,854) (82,021) (118,875) (118,875)
Fair value through profit and loss (FVPL)
Exchangeable note equity conversion option 25 — (4) (4) (4)
— (4) (4) (4)
(2,016)
(82,025) (84,041) (84,041)
The valuation techniques used for instruments categorised as level 2 are described below:
The fair values of the options associated with the exchangeable notes are calculated in consultation with third-party valuation
specialists due to the complexity of their nature. There are a number of inputs utilised in the valuation of the options,
including share price, historical share price volatility, risk-free rate and the expected borrowing cost spread over the risk-
free rate.

138
NOTES TO THE CONSOLIDATED FINANCIAL STATEMENTS DECEMBER 31, 2020
29. CAPITAL AND FINANCIAL RISK MANAGEMENT (CONTINUED)
Financial Risk Management
The Group uses a range of financial instruments (including cash, finance leases, receivables, payables and derivatives) to
fund its operations. These instruments are used to manage the liquidity of the Group. Working capital management is a key
additional element in the effective management of overall liquidity. The Group does not trade in financial instruments or
derivatives. The main risks arising from the utilization of these financial instruments are interest rate risk, liquidity risk and
credit risk.
Interest rate risk
Effective and repricing analysis
The following table sets out all interest-earning financial assets and interest bearing financial liabilities held by the Group
at December 31, indicating their effective interest rates and the period in which they re-price:
As at December 31, 2020 Note
Effective interest
rate Total
US$’000 6 mths or less
US$’000 6 –12 mths US$’000
1-2 years US$’000
2-5 years US$’000
> 5 years US$’000
Cash and cash equivalents 19 0.1% 27,327 27,327 — — — —
Lease receivable 16,18 4.0% 506 120 95 142 149 —
Licence payments 23 8.1% (194) (194) — — — —
Exchangeable note 25 4.8% (82,664) — — — — (82,664)
Other borrowings 25 0% (31) — — (31) — —
Lease payable on Right of
Use assets 26
5.0% (18,461) (1,022) (1,032) (1,914) (4,856) (9,637)
Lease payable on sale &
leaseback transactions 26
5.0% (280) (49) (50) (104) (77) —
Total
(73,797) 26,182 (987) (1,907) (4,784) (92,301)
As at December 31, 2019 Note
Effective interest
rate Total
US$’000 6 mths or less
US$’000 6 –12 mths US$’000
1-2 years US$’000
2-5 years US$’000
> 5 years US$’000
Cash and cash equivalents 19 1.1% 15,231 15,231 — — — —
Short-term investments 20 1.3% 1,169 — 1,169 — — —
Lease receivable 16,18 4.0% 684 157 124 202 201 —
Licence payments 23 8.1% (1,307) (1,307) — — — —
Exchangeable note 25 4.8% (82,021) — — — — (82,021)
Lease payable on Right of
Use assets 26
5.0% (19,630) (1,136) (1,020) (2,012) (4,840) (10,622)
Lease payable on sale &
leaseback transactions 26
5.0% (519) (122) (125) (95) (177) —
Total
(86,393) 12,823 148 (1,905) (4,816) (92,643)
In broad terms, a one-percentage point increase in interest rates would increase interest income by US$31,000 (2019:
US$101,000) and would not affect the interest expense (2019: nil) resulting in an increase in net interest income of
US$31,000 (2019: increase in net interest income of US$101,000).
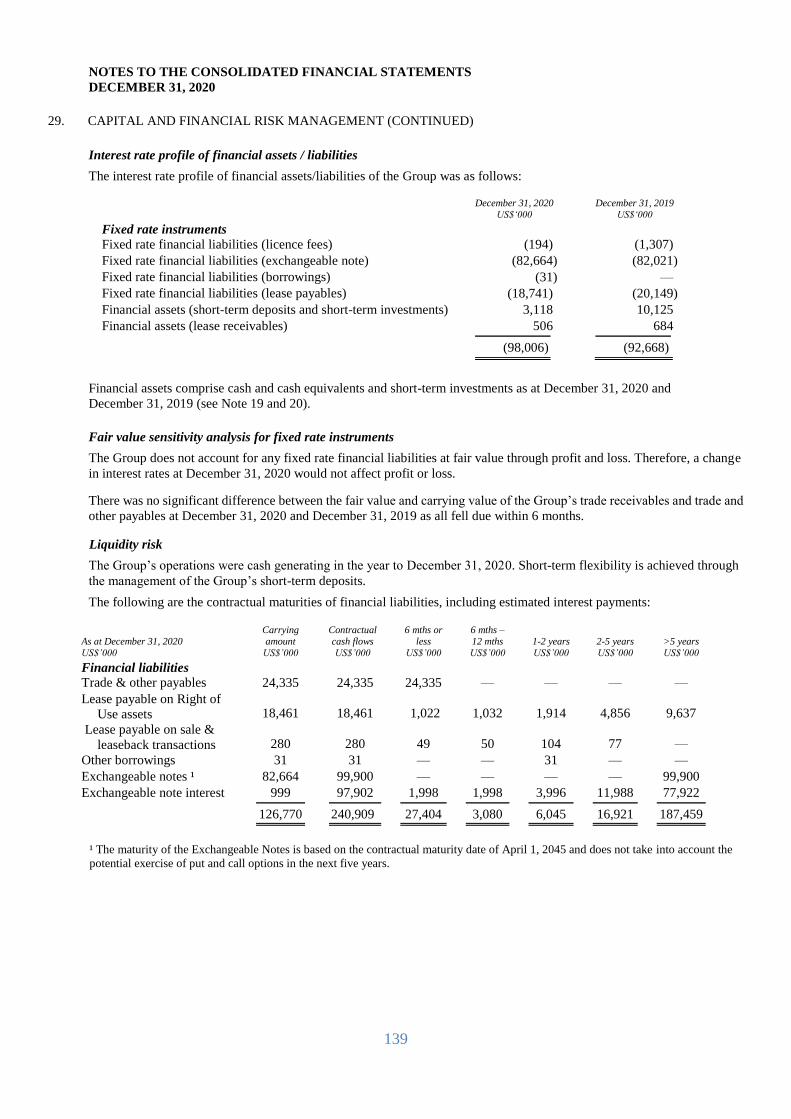
139
NOTES TO THE CONSOLIDATED FINANCIAL STATEMENTS DECEMBER 31, 2020
29. CAPITAL AND FINANCIAL RISK MANAGEMENT (CONTINUED)
Interest rate profile of financial assets / liabilities
The interest rate profile of financial assets/liabilities of the Group was as follows:
December 31, 2020 US$‘000
December 31, 2019 US$‘000
Fixed rate instruments
Fixed rate financial liabilities (licence fees) (194) (1,307) Fixed rate financial liabilities (exchangeable note) (82,664) (82,021) Fixed rate financial liabilities (borrowings) (31) —
Fixed rate financial liabilities (lease payables) (18,741) (20,149) Financial assets (short-term deposits and short-term investments) 3,118 10,125 Financial assets (lease receivables) 506 684
(98,006) (92,668)
Financial assets comprise cash and cash equivalents and short-term investments as at December 31, 2020 and
December 31, 2019 (see Note 19 and 20).
Fair value sensitivity analysis for fixed rate instruments
The Group does not account for any fixed rate financial liabilities at fair value through profit and loss. Therefore, a change
in interest rates at December 31, 2020 would not affect profit or loss.
There was no significant difference between the fair value and carrying value of the Group’s trade receivables and trade and
other payables at December 31, 2020 and December 31, 2019 as all fell due within 6 months.
Liquidity risk
The Group’s operations were cash generating in the year to December 31, 2020. Short-term flexibility is achieved through
the management of the Group’s short-term deposits.
The following are the contractual maturities of financial liabilities, including estimated interest payments:
As at December 31, 2020 US$’000
Carrying
amount US$’000
Contractual
cash flows US$’000
6 mths or
less US$’000
6 mths – 12 mths US$’000
1-2 years US$’000
2-5 years US$’000
>5 years US$’000
Financial liabilities
Trade & other payables 24,335 24,335 24,335 — — — — Lease payable on Right of
Use assets 18,461 18,461 1,022 1,032 1,914 4,856 9,637
Lease payable on sale &
leaseback transactions 280 280 49 50 104 77 —
Other borrowings 31 31 — — 31 — —
Exchangeable notes ¹ 82,664 99,900 — — — — 99,900 Exchangeable note interest 999 97,902 1,998 1,998 3,996 11,988 77,922
126,770 240,909 27,404 3,080 6,045 16,921 187,459
¹ The maturity of the Exchangeable Notes is based on the contractual maturity date of April 1, 2045 and does not take into account the
potential exercise of put and call options in the next five years.

140
NOTES TO THE CONSOLIDATED FINANCIAL STATEMENTS DECEMBER 31, 2020
29. CAPITAL AND FINANCIAL RISK MANAGEMENT (CONTINUED)
As at December 31, 2019 US$’000
Carrying
amount US$’000
Contractual
cash flows US$’000
6 mths or
less US$’000
6 mths – 12 mths US$’000
1-2 years US$’000
2-5 years US$’000
>5 years US$’000
Financial liabilities
Trade & other payables 16,947 16,947 16,947 — — — — Lease payable on Right of
Use assets 19,630 19,630 1,136 1,020 2,012 4,840 10,622
Lease payable on sale &
leaseback transactions 519 519 122 125 95 177 —
Exchangeable notes¹ 82,021 99,900 — — — — 99,900 Exchangeable note interest 999 101,898 1,998 1,998 3,996 11,988 81,918
120,116 238,894 20,203 3,143 6,103 17,005 192,440
¹ The maturity of the Exchangeable Notes is based on the contractual maturity date of April 1, 2045 and does not take into account the
potential exercise of put and call options in the next five years.
Foreign exchange risk
The majority of the Group’s activities are conducted in US Dollars. Foreign exchange risk arises from the fluctuating value
of the Group’s Euro denominated expenses as a result of the movement in the exchange rate between the US Dollar and the
Euro. Arising from this, where considered necessary, the Group pursues a treasury policy which periodically aims to sell US
Dollars forward to match a portion of its uncovered Euro expenses at exchange rates lower than budgeted exchange rates.
These forward contracts are primarily cashflow hedging instruments whose objective is to cover a portion of these Euro
forecasted transactions. Forward contracts normally have maturities of less than one year after the balance sheet date. There
were no forward contracts in place as at December 31, 2020.
Foreign currency short term financial assets and liabilities which expose the Group to currency risk are disclosed below.
The amounts shown are those reported to key management translated into US Dollars at the closing rate:
As at December 31, 2020 EUR GBP SEK CAD BRL Other
US$‘000 US$‘000 US$‘000 US$‘000 US$‘000 US$‘000 Cash 1,229 152 9 2,859 776 —
Trade and other receivable 1,105 63 — 3,191 1,357 —
Trade and other payables (2,821) (57) (1) (449) (529) —
Total exposure (487) 158 8 5,601 1,604 —
As at December 31, 2019 EUR GBP SEK CAD BRL Other
US$‘000 US$‘000 US$‘000 US$‘000 US$‘000 US$‘000 Cash 394 138 10 3,265 238 —
Trade and other receivable 1,247 71 — 337 1,871 —
Trade and other payables (2,350) (27) (142) (47) (796) —
Total exposure (709) 182 (132) 3,555 1,313 —
The Group states its forward exchange contracts at fair value in the balance sheet. The Group classifies its forward
exchange contracts as hedging forecasted transactions and thus accounts for them as cash flow hedges. There were no
forward exchange contracts in place at December 31, 2020 or December 31, 2019.
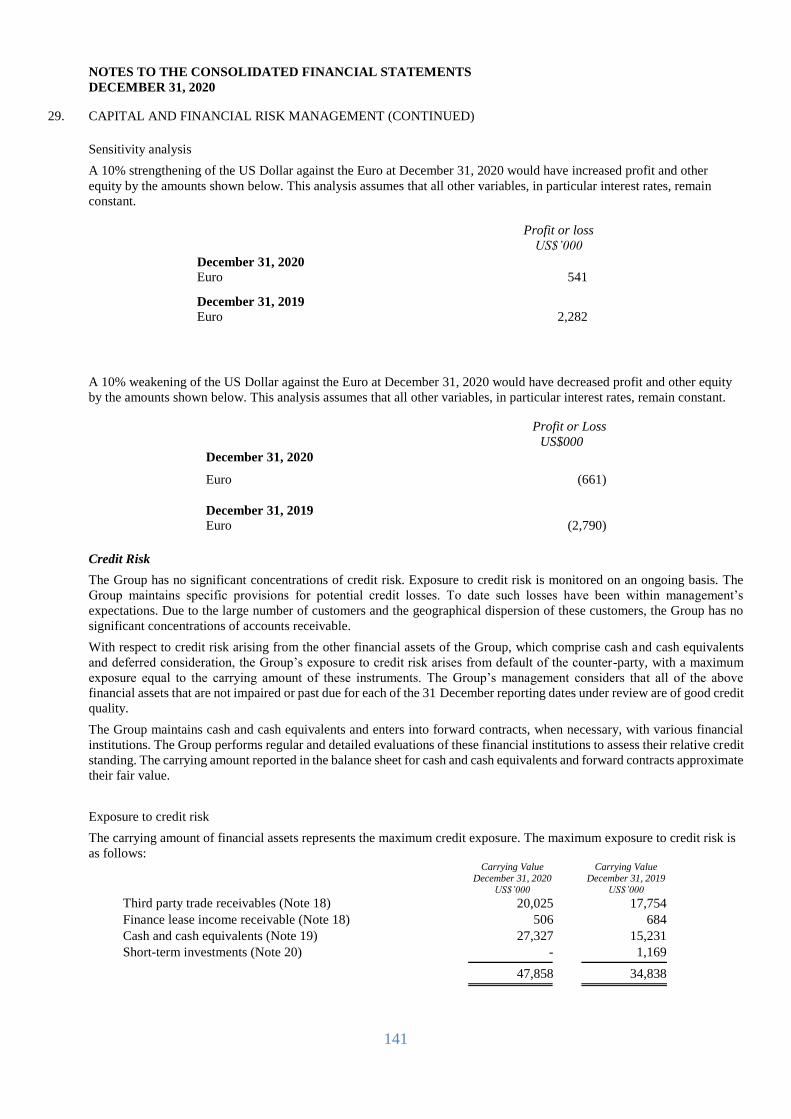
141
NOTES TO THE CONSOLIDATED FINANCIAL STATEMENTS DECEMBER 31, 2020
29. CAPITAL AND FINANCIAL RISK MANAGEMENT (CONTINUED)
Sensitivity analysis
A 10% strengthening of the US Dollar against the Euro at December 31, 2020 would have increased profit and other
equity by the amounts shown below. This analysis assumes that all other variables, in particular interest rates, remain
constant.
Profit or loss
US$’000 December 31, 2020
Euro 541
December 31, 2019
Euro 2,282
A 10% weakening of the US Dollar against the Euro at December 31, 2020 would have decreased profit and other equity
by the amounts shown below. This analysis assumes that all other variables, in particular interest rates, remain constant.
Profit or Loss
US$000
December 31, 2020
Euro (661)
December 31, 2019
Euro (2,790)
Credit Risk
The Group has no significant concentrations of credit risk. Exposure to credit risk is monitored on an ongoing basis. The
Group maintains specific provisions for potential credit losses. To date such losses have been within management’s
expectations. Due to the large number of customers and the geographical dispersion of these customers, the Group has no
significant concentrations of accounts receivable.
With respect to credit risk arising from the other financial assets of the Group, which comprise cash and cash equivalents
and deferred consideration, the Group’s exposure to credit risk arises from default of the counter-party, with a maximum
exposure equal to the carrying amount of these instruments. The Group’s management considers that all of the above
financial assets that are not impaired or past due for each of the 31 December reporting dates under review are of good credit
quality.
The Group maintains cash and cash equivalents and enters into forward contracts, when necessary, with various financial
institutions. The Group performs regular and detailed evaluations of these financial institutions to assess their relative credit
standing. The carrying amount reported in the balance sheet for cash and cash equivalents and forward contracts approximate
their fair value.
Exposure to credit risk
The carrying amount of financial assets represents the maximum credit exposure. The maximum exposure to credit risk is
as follows:
Carrying Value
December 31, 2020
US$’000
Carrying Value
December 31, 2019
US$’000 Third party trade receivables (Note 18) 20,025 17,754 Finance lease income receivable (Note 18) 506 684 Cash and cash equivalents (Note 19) 27,327 15,231 Short-term investments (Note 20) - 1,169
47,858 34,838
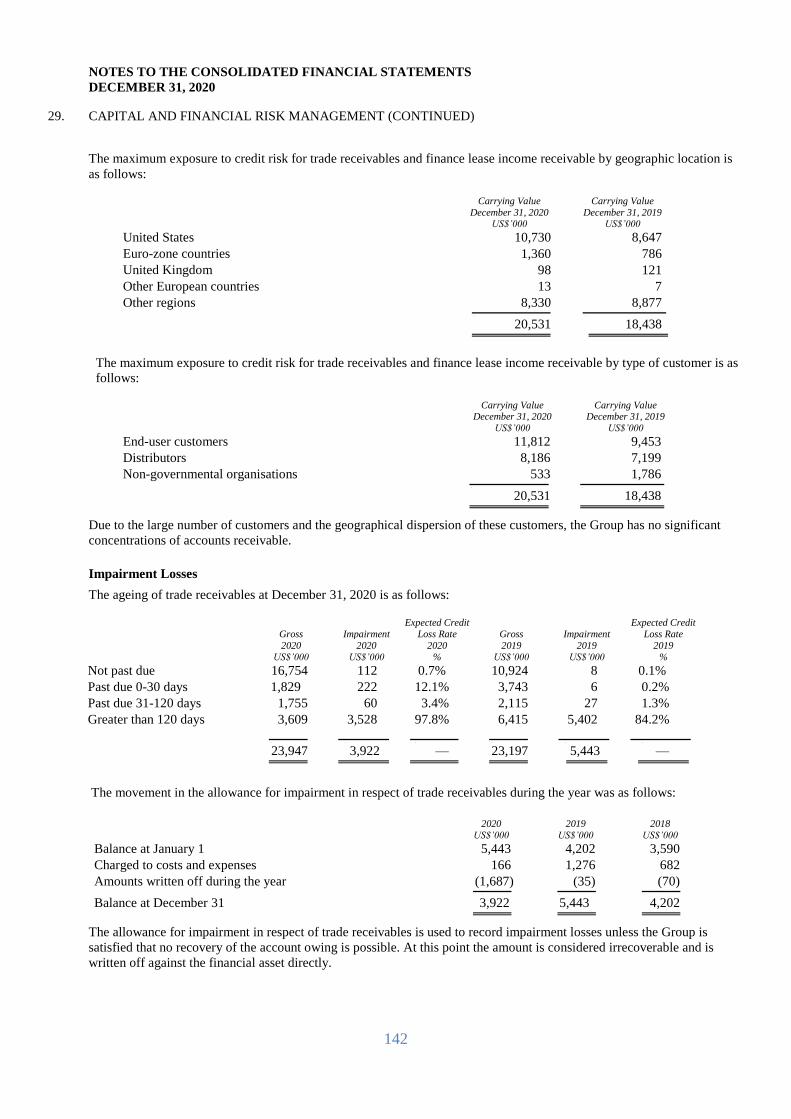
142
NOTES TO THE CONSOLIDATED FINANCIAL STATEMENTS DECEMBER 31, 2020
29. CAPITAL AND FINANCIAL RISK MANAGEMENT (CONTINUED)
The maximum exposure to credit risk for trade receivables and finance lease income receivable by geographic location is
as follows:
Carrying Value
December 31, 2020 US$’000
Carrying Value
December 31, 2019 US$’000
United States 10,730 8,647 Euro-zone countries 1,360 786 United Kingdom 98 121 Other European countries 13 7 Other regions 8,330 8,877
20,531 18,438
The maximum exposure to credit risk for trade receivables and finance lease income receivable by type of customer is as
follows:
Carrying Value December 31, 2020
US$’000
Carrying Value December 31, 2019
US$’000 End-user customers 11,812 9,453 Distributors 8,186 7,199 Non-governmental organisations 533 1,786
20,531 18,438
Due to the large number of customers and the geographical dispersion of these customers, the Group has no significant
concentrations of accounts receivable.
Impairment Losses
The ageing of trade receivables at December 31, 2020 is as follows:
Gross Impairment Expected Credit
Loss Rate Gross Impairment Expected Credit
Loss Rate
2020 2020 2020 2019 2019 2019
US$’000 US$’000 % US$’000 US$’000 %
Not past due 16,754 112 0.7% 10,924 8 0.1% Past due 0-30 days 1,829 222 12.1% 3,743 6 0.2% Past due 31-120 days 1,755 60 3.4% 2,115 27 1.3% Greater than 120 days 3,609 3,528 97.8% 6,415 5,402 84.2%
23,947 3,922 — 23,197 5,443 —
The movement in the allowance for impairment in respect of trade receivables during the year was as follows:
2020 2019 2018 US$’000 US$’000 US$’000
Balance at January 1 5,443 4,202 3,590 Charged to costs and expenses 166 1,276 682 Amounts written off during the year (1,687) (35) (70)
Balance at December 31 3,922 5,443 4,202
The allowance for impairment in respect of trade receivables is used to record impairment losses unless the Group is
satisfied that no recovery of the account owing is possible. At this point the amount is considered irrecoverable and is
written off against the financial asset directly.
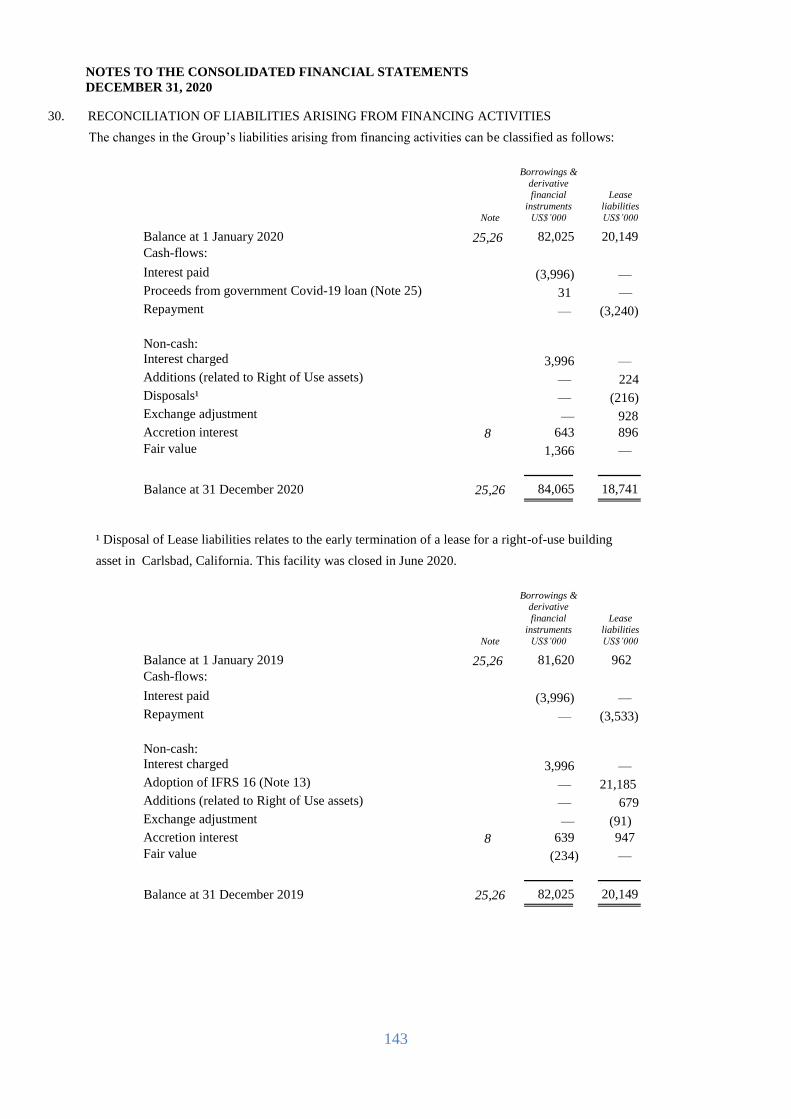
143
NOTES TO THE CONSOLIDATED FINANCIAL STATEMENTS DECEMBER 31, 2020
30. RECONCILIATION OF LIABILITIES ARISING FROM FINANCING ACTIVITIES
The changes in the Group’s liabilities arising from financing activities can be classified as follows:
Note
Borrowings &
derivative financial
instruments
US$’000
Lease
liabilities
US$’000
Balance at 1 January 2020 25,26 82,025 20,149 Cash-flows:
Interest paid (3,996) — Proceeds from government Covid-19 loan (Note 25) 31 —
Repayment — (3,240)
Non-cash:
Interest charged 3,996 — Additions (related to Right of Use assets) — 224
Disposals¹ — (216)
Exchange adjustment — 928 Accretion interest 8 643 896
Fair value 1,366 —
Balance at 31 December 2020 25,26 84,065 18,741
¹ Disposal of Lease liabilities relates to the early termination of a lease for a right-of-use building
asset in Carlsbad, California. This facility was closed in June 2020.
Note
Borrowings & derivative
financial
instruments
US$’000
Lease
liabilities
US$’000
Balance at 1 January 2019 25,26 81,620 962 Cash-flows:
Interest paid (3,996) — Repayment — (3,533)
Non-cash:
Interest charged 3,996 — Adoption of IFRS 16 (Note 13) — 21,185
Additions (related to Right of Use assets) — 679
Exchange adjustment — (91) Accretion interest 8 639 947
Fair value (234) —
Balance at 31 December 2019 25,26 82,025 20,149
144
NOTES TO THE CONSOLIDATED FINANCIAL STATEMENTS DECEMBER 31, 2020
31. POST BALANCE SHEET EVENTS
Forgiveness of Paycheck Protection loans
In 2020, six of the Group’s subsidiaries located in USA applied for and received loans under the U.S. government’s
Paycheck Protection Program (“PPP”). The loans were intended to offer support for businesses during the Covid-19
pandemic and were forgivable subject to meeting certain criteria. Two out of the six PPP loans were forgiven during 2020.
The four loans which remained unforgiven at year end, totaling US$2,905,000, are treated as short term liabilities at
December 31, 2020. Three of these loans were 100% forgiven in early 2021, amounting to a total of US$2,661,000. The
final remaining PPP loan, which amounts to US$244,000, was forgiven in June 2021.
Director Indemnifications
In 2021, the Company and certain of its subsidiaries entered into indemnification agreements with each of the Directors in
respect of their involvement with the Company. Such arrangements are adjudged to be necessary to attract and retain highly
qualified individuals.
Submission of TrinScreen test to World Health Organisation
In March 2021, the Group submitted its new HIV screening product, TrinScreen HIV, to the World Health Organisation for
approval. This product is a strategic priority for the Group. It is expected that the addition of a HIV screening test to our
product range will drive future growth in Point-of-Care revenues.
Covid-19 pandemic
The COVID-19 pandemic has not yet abated and the situation in 2021 remains fluid. The speed and nature of economic
recovery is uncertain and depends on several factors including the rollout of vaccines, the continuation of lockdown
restrictions and the existence of new variants of the disease. Management continues to monitor the pandemic situation
closely and seeks to minimise the negative impacts on the business, while at the same time, optimising the opportunities that
a pandemic affords to a medical diagnostic company. The continued uncertainty created by the pandemic increases the
uncertainty in deciding on estimates and judgements underpinning the financial statements. For more information on the
impact of the Covid-19 pandemic, refer to the Management Discussion and Analysis section.
32. ACCOUNTING ESTIMATES AND JUDGEMENTS
The preparation of these financial statements requires the Group to make estimates and judgements that affect the reported
amount of assets, liabilities, revenues and expenses, and related disclosure of contingent assets and liabilities.
On an on-going basis, the Group evaluates these estimates, including those related to intangible assets, contingencies and
litigation. The estimates are based on historical experience and on various other assumptions that are believed to be
reasonable under the circumstances, the results of which form the basis for making judgements about the carrying values of
assets and liabilities that are not readily apparent from other sources. Actual results may differ from these estimates under
different assumptions or conditions.
Key sources of estimation uncertainty
Note 14 contains information about the assumptions and the risk factors relating to goodwill impairment. Note 22 outlines
information regarding the valuation of share options and warrants. Note 25 outlines the valuation techniques used by the
Company in determining the fair value of exchangeable notes and the associated embedded derivatives. In Note 29, detailed
analysis is given about the interest rate risk, credit risk, liquidity risk and foreign exchange risk of the Group.
145
NOTES TO THE CONSOLIDATED FINANCIAL STATEMENTS DECEMBER 31, 2020
32. ACCOUNTING ESTIMATES AND JUDGEMENTS (CONTINUED)
Critical accounting judgements in applying the Group’s accounting policies
Certain critical accounting judgements in applying the Group’s accounting policies are described below:
Revenue Recognition
No revenue is recognised if there is uncertainty regarding recovery of the consideration due at the outset of the transaction.
We make a judgement as to the collectability of invoiced sales based on an assessment of the individual debtor taking into
account past payment history, the probability of default or delinquency in payments and the probability that debtor will enter
into financial difficulties or bankruptcy.
Some customer contracts could be regarded as offering the customer a right of return. Due to the uncertainty of the magnitude
and likelihood of product returns, there is a level of estimation involved in assessing the amount of revenue to be recognized
for these type of contracts. In accordance with IFRS 15, when estimating the effect of an uncertainty on an amount of variable
consideration to which the Group will be entitled, all information that is reasonably available, including historical, current
and forecast, is considered.
We operate a licenced reference laboratory in New York, USA that specializes in diagnostics for autoimmune diseases. The
laboratory provides testing services to two types of customers. Firstly, institutional customers, such as hospitals and
commercial diagnostic testing providers, and secondly insurance companies on behalf of their policyholders. The revenue
recognition for services provided to insurance companies requires some judgement. In the US, there are rules requiring all
insurance companies to be billed the same amount per test. However, the amount that each insurance company pays for a
particular test varies according to their own internal policies and this can typically be considerably less than the amount
invoiced. We recognise lab services revenue for insurance companies by taking the invoiced amount and reducing it by an
estimated percentage based on historical payment data. We review the percentage reduction annually based on the latest
data. As a practical expedient, and in accordance with IFRS, we apply a portfolio approach to the insurance companies as
they have similar characteristics. We judge that the effect on the financial statements of using a portfolio approach for the
insurance companies will not differ materially from applying IFRS 15 to the individual contracts within that portfolio.
At December 31, 2020 US$4,445,000 (2019: US$292,000) of revenue was deferred in accordance with IFRS15. For further
information, refer to Note 23.
Research and development expenditure
Under IFRS as issued by IASB, the Group writes off research and development expenditure as incurred, with the exception
of expenditure on projects whose outcome has been assessed with reasonable certainty as to technical feasibility, commercial
viability and recovery of costs through future revenues. Such expenditure is capitalised at cost within intangible assets and
amortised over its expected useful life of 15 years, which commences when commercial production starts. For further
information, refer to Note 14.
Acquired in-process research and development (IPR&D) is valued at its fair value at acquisition date in accordance with
IFRS 3. The Company determines this fair value by adopting the income approach valuation technique. Once the fair value
has been determined, the Company will recognise the IPR&D as an intangible asset when it: (a) meets the definition of an
asset and (b) is identifiable (i.e. is separable or arises from contractual or other legal rights).
Factors which impact our judgement to capitalise certain research and development expenditure include the degree of
regulatory approval for products and the results of any market research to determine the likely future commercial success of
products being developed. We review these factors each year to determine whether our previous estimates as to feasibility,
viability and recovery should be changed.
At December 31, 2020 the carrying value of capitalised development costs was US$13,444,000 (2019: US$22,778,000) (see
Note 14 to the consolidated financial statements). The decrease in 2020 was mainly as a result of an impairment loss charge
of US$15,287,000. This charge was partially offset by additions of US$6,896,000 and amortisation of US$959,000.
146
NOTES TO THE CONSOLIDATED FINANCIAL STATEMENTS DECEMBER 31, 2020
32. ACCOUNTING ESTIMATES AND JUDGEMENTS (CONTINUED) Impairment of intangible assets and goodwill
Definite lived intangible assets are reviewed for indicators of impairment annually while goodwill and indefinite lived assets
are tested for impairment annually, individually or at the cash generating unit level.
Factors considered important, as part of an impairment review, include the following:
• Significant underperformance relative to expected historical or projected future operating results;
• Significant changes in the manner of our use of the acquired assets or the strategy for our overall business;
• Obsolescence of products;
• Significant decline in our stock price for a sustained period; and
• Our market capitalisation relative to net book value.
When we determine that the carrying value of intangibles, non-current assets and related goodwill may not be recoverable
based upon the existence of one or more of the above indicators of impairment, any impairment is measured based on our
estimates of projected net discounted cash flows expected to result from that asset, including eventual disposition. Our
estimated impairment could prove insufficient if our analysis overestimated the cash flows or conditions change in the future.
The impairment test performed as at December 31, 2020 identified an impairment loss in three CGUs, namely Primus Corp.,
Biopool US Inc, and Trinity Biotech Do Brasil. For further information, refer to Note 14.
Allowance for slow-moving and obsolete inventory
We evaluate the realisability of our inventory on a case-by-case basis and make adjustments to our inventory provision based
on our estimates of expected losses. We write-off any inventory that is approaching its “use-by” date and for which no
further re-processing can be performed. We also consider recent trends in revenues for various inventory items and instances
where the realisable value of inventory is likely to be less than its carrying value. At December 31, 2020 our allowance for
slow moving and obsolete inventory was US$9,781,000 which represents approximately 24.45% of gross inventory value.
This compares with US$6,716,000, or approximately 17.33% of gross inventory value, at December 31, 2019 and
US$6,299,000, or approximately 17.18% of gross inventory value, at December 31, 2018. In the event that the estimate of
the provision required for slow moving and obsolete inventory was to increase or decrease by 2% of gross inventory, which
would represent a reasonably likely range of outcomes, then a change in allowance of US$800,000 at December 31, 2020
(2019: US$774,000) (2018: US$733,000) would result. For further information, refer to Note 17.
Allowance for impairment of receivables
Revenue is recognised to the extent that it is probable that economic benefit will flow to the Group and the revenue can be
measured. No revenue is recognised if there is uncertainty regarding recovery of the consideration due at the outset of the
transaction or the possible return of goods. We make judgements as to our ability to collect outstanding receivables and
where necessary make allowances for impairment. Such impairments are made based upon a specific review of all significant
outstanding receivables. In determining the allowance, we analyse our historical collection experience and current economic
trends. If the historical data we use to calculate the allowance for impairment of receivables does not reflect the future ability
to collect outstanding receivables, additional allowances for impairment of receivables may be needed and the future results
of operations could be materially affected. At December 31, 2020, the allowance was US$3,922,000 which represents
approximately 3.8% of Group revenues. This compares with US$5,443,000 at December 31, 2019 which represented
approximately 6.0% of Group revenues and to US$4,202,000 at December 31, 2018 which represented approximately 4.3%
of Group revenues. In the event that the estimate of impairment was to increase or decrease by 0.5% of Group revenues,
which would represent a reasonably likely range of outcomes, then a change in the allowance of US$510,000 at December
31, 2020 (2019: US$452,000) (2018: US$485,000) would result. For further information, refer to Note 29.
147
NOTES TO THE CONSOLIDATED FINANCIAL STATEMENTS DECEMBER 31, 2020
32. ACCOUNTING ESTIMATES AND JUDGEMENTS (CONTINUED)
Accounting for income taxes
Significant judgement is required in determining our worldwide income tax expense provision. In the ordinary course of a
global business, there are many transactions and calculations where the ultimate tax outcome is uncertain. Some of these
uncertainties arise as a consequence of revenue sharing and cost reimbursement arrangements among related entities, the
process of identifying items of revenue and expense that qualify for preferential tax treatment and segregation of foreign
and domestic income and expense to avoid double taxation. In addition, we operate within multiple taxing jurisdictions and
are subject to periodic audits in these jurisdictions.
Deferred tax assets and liabilities are determined for the effects of net operating losses and temporary differences between
the book and tax bases of assets and liabilities, using tax rates projected to be in effect for the year in which the differences
are expected to reverse. While we have considered future taxable income and ongoing prudent and feasible tax planning
strategies in assessing whether deferred tax assets can be recognised, there is no assurance that these deferred tax assets may
be realisable. The extent to which recognised deferred tax assets are not realisable could have a material adverse impact on
our income tax provision and net income in the period in which such determination is made.
Note 15 to the consolidated financial statements outlines the basis for the deferred tax assets and liabilities and includes
details of the unrecognised deferred tax assets at year end. The Group derecognised deferred tax assets arising on unused
tax losses except to the extent that there are sufficient taxable temporary differences relating to the same taxation authority
and the same taxable entity which will result in taxable amounts against which the unused tax losses can be utilized before
they expire. The derecognition of these deferred tax assets was considered appropriate due to the uncertainty over the timing
of the utilization of the tax losses. Except for the derecognition of deferred tax assets there were no material changes in
estimates used to calculate the income tax expense provision during 2020, 2019 or 2018.
IFRS 16
IFRS 16, Leases, requires entities to make certain judgements and estimations. Critical judgements were required by the
Company in the following areas:
Determining whether or not a contract contains a lease. Company assessed if the contract conveys the right to
control the use of an identified asset for a period of time in exchange for consideration.
Significant judgement is also required in establishing whether or not it is reasonably certain that an extension option
will be exercised, considering whether or not it is reasonably certain that a termination option will not be exercised.
In making this decision, management considered the facts and circumstances that create a significant economic
incentive. Factors specific to the asset, the entity and the wider market were also considered. Further, critical judgement is involved in determining whether or not variable lease payments are truly variable, or
in-substance fixed. In-substance variable lease payments are treated as fixed lease payments.
Key source of estimation and uncertainty is calculation of the appropriate discount rate to use. When making the
determination, the company considered the rate of interest that they would have to pay to borrow over a similar term, and
with a similar security, the funds necessary to obtain an asset of a similar value to the right-of-use asset in a similar economic
environment.
Going Concern The directors have considered the Group’s current financial position and cash flow projections, taking into account all
known events and developments including the Covid-19 pandemic. The directors believe that the Group will be able to
continue its operations for at least the next 12 months from the date of this report and that it is appropriate to continue to
prepare the consolidated financial statements on a going concern basis. In making this assessment, the directors have
considered the potential repayment in April 2022 of part or all of the US$99.9m exchangeable notes under the terms of the
indenture for such exchangeable notes.
The directors have considered the various financing options expected to be available to the Group to assist it in meeting any
repayment obligations under the exchangeable notes over the next 12 months, to the extent such obligations cannot be met
from cash on hand, including refinancing the debt, repaying the debt with the proceeds from equity or debt offerings and the
sale of assets. As with all such potential transactions, there are risks to successfully implement such transactions and the
directors have considered these risks when considering the financing options and the appropriateness of adopting a going
concern basis of accounting.
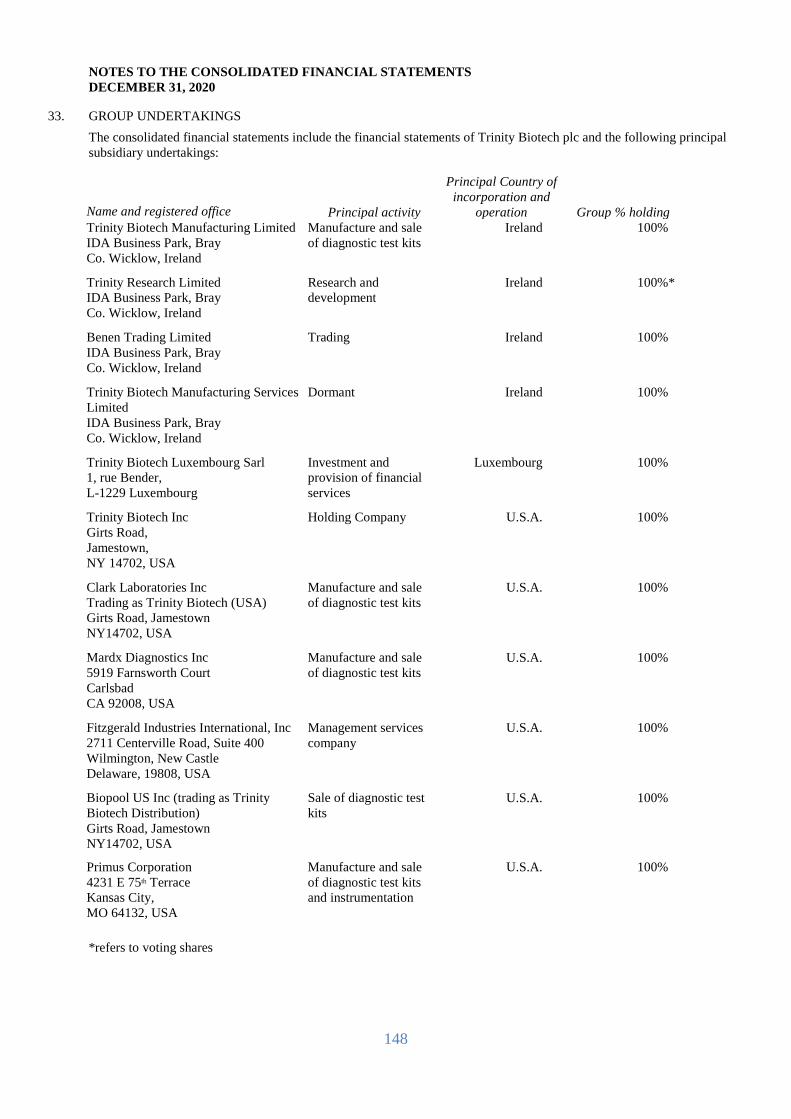
148
NOTES TO THE CONSOLIDATED FINANCIAL STATEMENTS DECEMBER 31, 2020
33. GROUP UNDERTAKINGS
The consolidated financial statements include the financial statements of Trinity Biotech plc and the following principal
subsidiary undertakings:
Name and registered office Principal activity
Principal Country of
incorporation and
operation Group % holding
Trinity Biotech Manufacturing Limited IDA Business Park, Bray Co. Wicklow, Ireland
Manufacture and sale
of diagnostic test kits Ireland 100%
Trinity Research Limited IDA Business Park, Bray Co. Wicklow, Ireland
Research and
development Ireland 100%*
Benen Trading Limited IDA Business Park, Bray Co. Wicklow, Ireland
Trading Ireland 100%
Trinity Biotech Manufacturing Services
Limited IDA Business Park, Bray Co. Wicklow, Ireland
Dormant Ireland 100%
Trinity Biotech Luxembourg Sarl 1, rue Bender, L-1229 Luxembourg
Investment and
provision of financial
services
Luxembourg 100%
Trinity Biotech Inc Girts Road, Jamestown, NY 14702, USA
Holding Company U.S.A. 100%
Clark Laboratories Inc Trading as Trinity Biotech (USA) Girts Road, Jamestown NY14702, USA
Manufacture and sale
of diagnostic test kits U.S.A. 100%
Mardx Diagnostics Inc 5919 Farnsworth Court Carlsbad CA 92008, USA
Manufacture and sale
of diagnostic test kits U.S.A. 100%
Fitzgerald Industries International, Inc 2711 Centerville Road, Suite 400 Wilmington, New Castle Delaware, 19808, USA
Management services
company U.S.A. 100%
Biopool US Inc (trading as Trinity
Biotech Distribution)
Girts Road, Jamestown
NY14702, USA
Sale of diagnostic test
kits U.S.A. 100%
Primus Corporation 4231 E 75th Terrace Kansas City, MO 64132, USA
Manufacture and sale
of diagnostic test kits
and instrumentation
U.S.A. 100%
*refers to voting shares
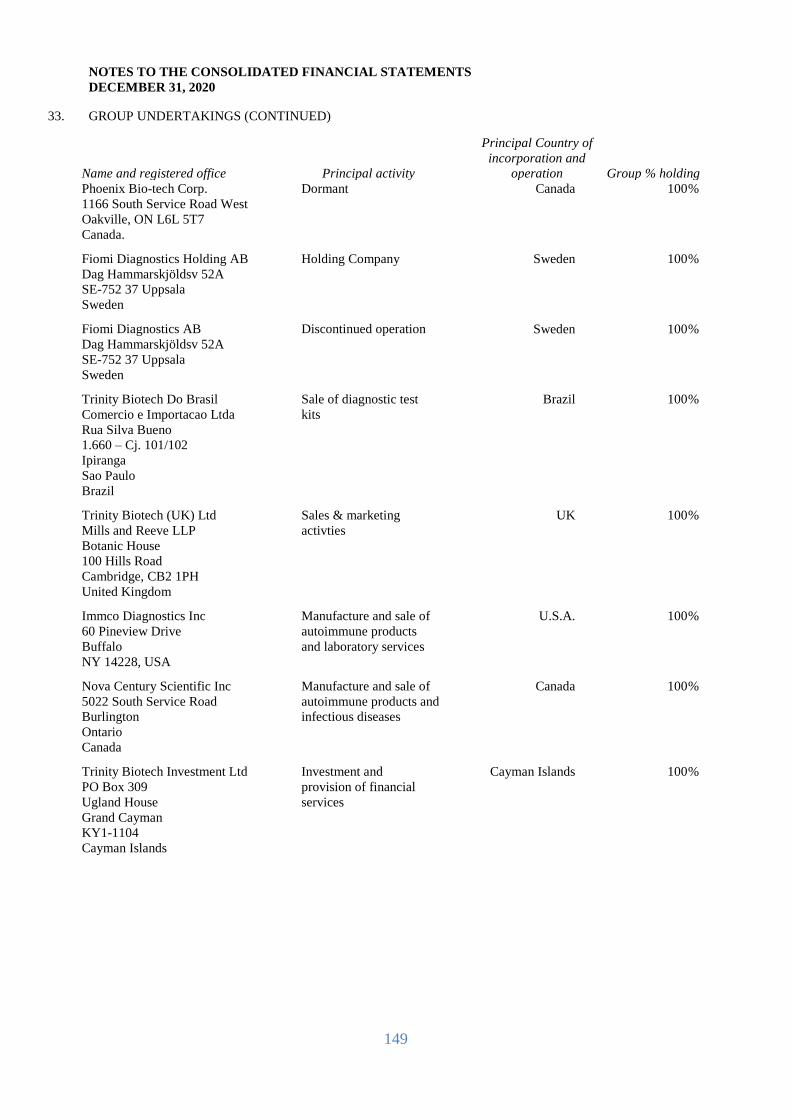
149
NOTES TO THE CONSOLIDATED FINANCIAL STATEMENTS DECEMBER 31, 2020
33. GROUP UNDERTAKINGS (CONTINUED)
Name and registered office Principal activity
Principal Country of
incorporation and
operation Group % holding
Phoenix Bio-tech Corp. 1166 South Service Road West Oakville, ON L6L 5T7 Canada.
Dormant Canada 100 %
Fiomi Diagnostics Holding AB Dag Hammarskjöldsv 52A SE-752 37 Uppsala Sweden
Holding Company Sweden 100 %
Fiomi Diagnostics AB Dag Hammarskjöldsv 52A SE-752 37 Uppsala Sweden
Discontinued operation Sweden 100 %
Trinity Biotech Do Brasil Comercio e Importacao Ltda
Rua Silva Bueno
1.660 – Cj. 101/102
Ipiranga
Sao Paulo Brazil
Sale of diagnostic test
kits Brazil 100 %
Trinity Biotech (UK) Ltd Mills and Reeve LLP Botanic House
100 Hills Road
Cambridge, CB2 1PH United Kingdom
Sales & marketing
activties UK 100 %
Immco Diagnostics Inc 60 Pineview Drive Buffalo NY 14228, USA
Manufacture and sale of
autoimmune products
and laboratory services
U.S.A. 100 %
Nova Century Scientific Inc 5022 South Service Road Burlington Ontario Canada
Manufacture and sale of
autoimmune products and
infectious diseases
Canada 100 %
Trinity Biotech Investment Ltd PO Box 309 Ugland House Grand Cayman KY1-1104 Cayman Islands
Investment and
provision of financial
services
Cayman Islands
100 %

150
COMPANY STATEMENT OF COMPREHENSIVE INCOME
Year ended December 31,
2020
US$‘000
2019
US$‘000
(Loss)/Profit for the year (2,255) 1,895
Total comprehensive (loss)/income (all attributable to
equity holders)
(2,255) 1,895

151
COMPANY STATEMENT OF FINANCIAL POSITION
Notes
December 31,
2020
US$‘000
December 31,
2019
US$‘000
ASSETS
Non-current assets
Investment in subsidiaries 36 19,939 18,732
Advances to subsidiaries 37 36,755 42,862
Deferred tax asset 38 - 2,681
Total non-current assets 56,694 64,275
Current assets
Trade and other receivables 31 61
Cash and cash equivalents 39 11,452 163
Total current assets 11,483 224
TOTAL ASSETS 68,177 64,499
EQUITY AND LIABILITIES
Equity attributable to the equity holders of the parent
Share capital 1,213 1,213
Share premium 16,187 16,187
Treasury Shares 41 (24,922) (24,922)
Retained earnings 40 6,324 7,763
Total (deficit)/equity (1,198) 241
Current liabilities
Other payables 42 69,316 64,258
Total current liabilities 69,316 64,258
Non-Current liabilities
Deferred tax liability 38 59 -
TOTAL LIABILITIES 69,375 64,258
TOTAL EQUITY AND LIABILITIES 68,177 64,499
The Group is availing of the exemption in Section 304 of the Companies Act 2014 from filing its Company Statement of
Comprehensive Income. The loss for the financial year generated by the Company is US$2,255,000 (profit 2019: US$1,895,000).
The financial statements were approved and authorised for issue by the Board on 7 September 2021 and signed on its behalf by:
Ronan O’Caoimh John Gillard
Director Director
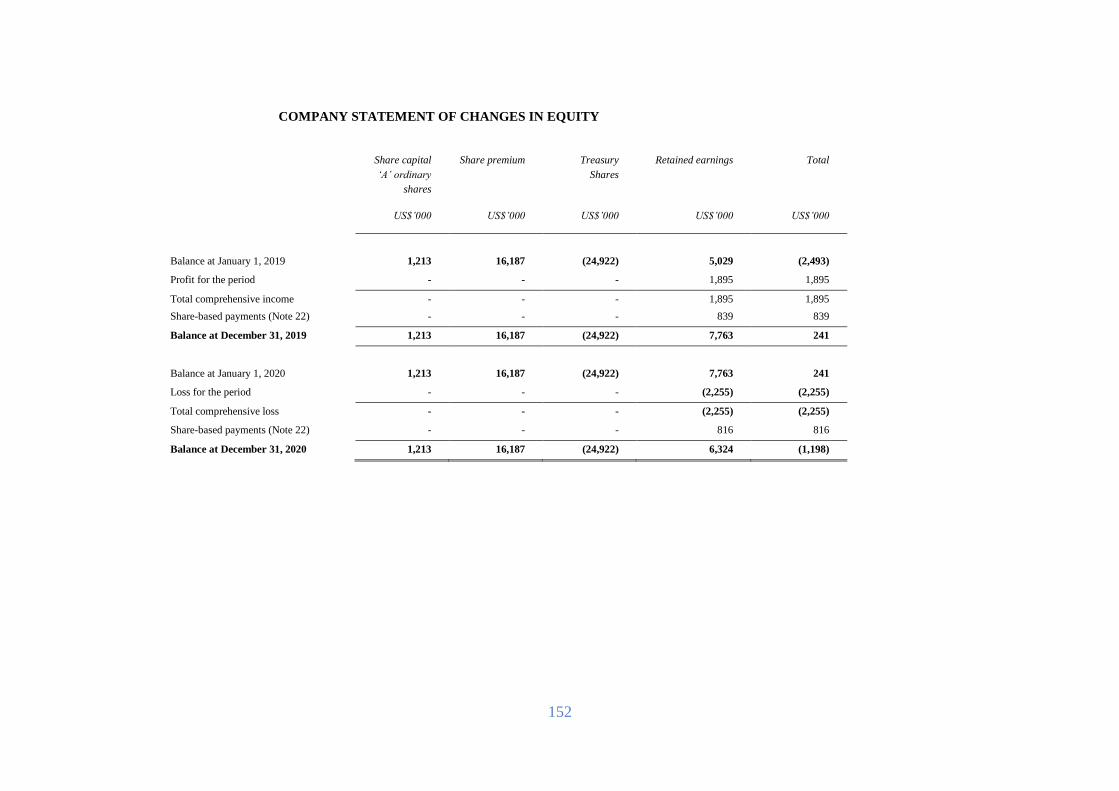
152
COMPANY STATEMENT OF CHANGES IN EQUITY
Share capital
‘A’ ordinary
shares
Share premium Treasury
Shares
Retained earnings Total
US$’000 US$’000 US$’000 US$’000 US$’000
Balance at January 1, 2019 1,213 16,187 (24,922) 5,029 (2,493)
Profit for the period - - - 1,895 1,895
Total comprehensive income - - - 1,895 1,895
Share-based payments (Note 22) - - - 839 839
Balance at December 31, 2019 1,213 16,187 (24,922) 7,763 241
Balance at January 1, 2020 1,213 16,187 (24,922) 7,763 241
Loss for the period - - - (2,255) (2,255)
Total comprehensive loss - - - (2,255) (2,255)
Share-based payments (Note 22) - - - 816 816
Balance at December 31, 2020 1,213 16,187 (24,922) 6,324 (1,198)
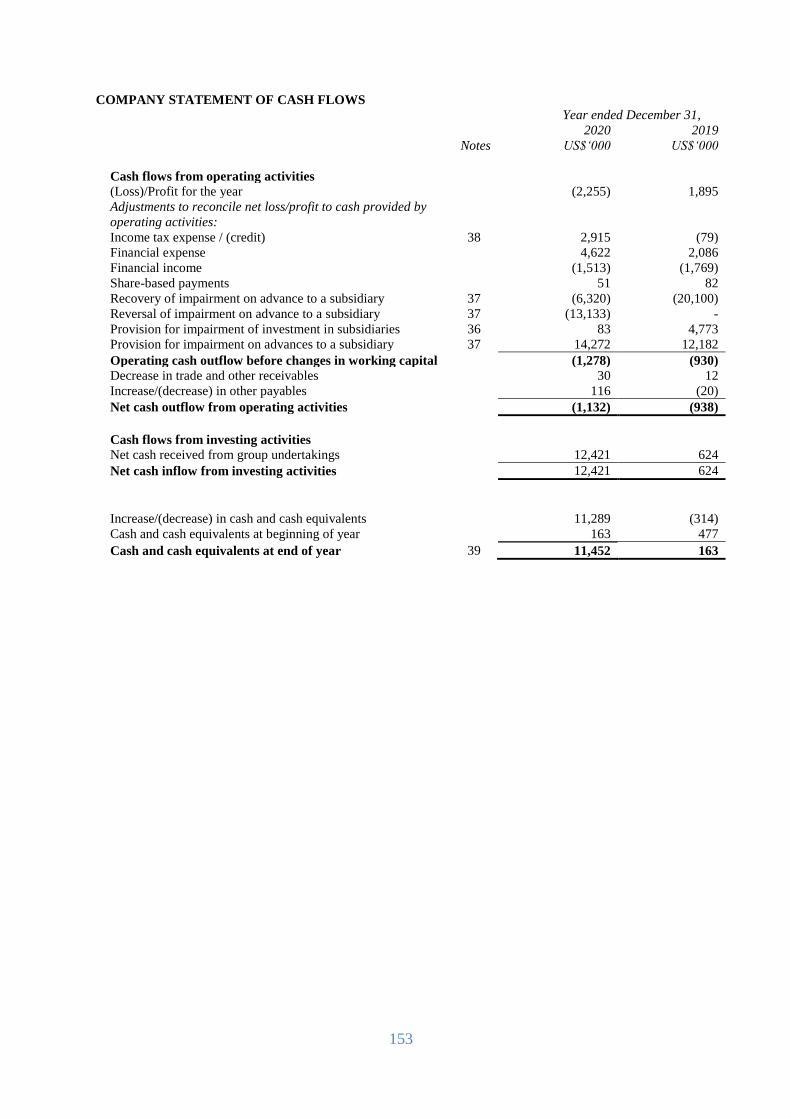
153
COMPANY STATEMENT OF CASH FLOWS
Year ended December 31,
Notes
2020
US$‘000
2019
US$‘000
Cash flows from operating activities
(Loss)/Profit for the year (2,255) 1,895
Adjustments to reconcile net loss/profit to cash provided by
operating activities:
Income tax expense / (credit) 38 2,915 (79)
Financial expense 4,622 2,086
Financial income (1,513) (1,769)
Share-based payments 51 82
Recovery of impairment on advance to a subsidiary 37 (6,320) (20,100)
Reversal of impairment on advance to a subsidiary 37 (13,133) -
Provision for impairment of investment in subsidiaries 36 83 4,773
Provision for impairment on advances to a subsidiary 37 14,272 12,182
Operating cash outflow before changes in working capital (1,278) (930)
Decrease in trade and other receivables 30 12
Increase/(decrease) in other payables 116 (20)
Net cash outflow from operating activities (1,132) (938)
Cash flows from investing activities
Net cash received from group undertakings 12,421 624
Net cash inflow from investing activities 12,421 624
Increase/(decrease) in cash and cash equivalents 11,289 (314)
Cash and cash equivalents at beginning of year 163 477
Cash and cash equivalents at end of year 39 11,452 163
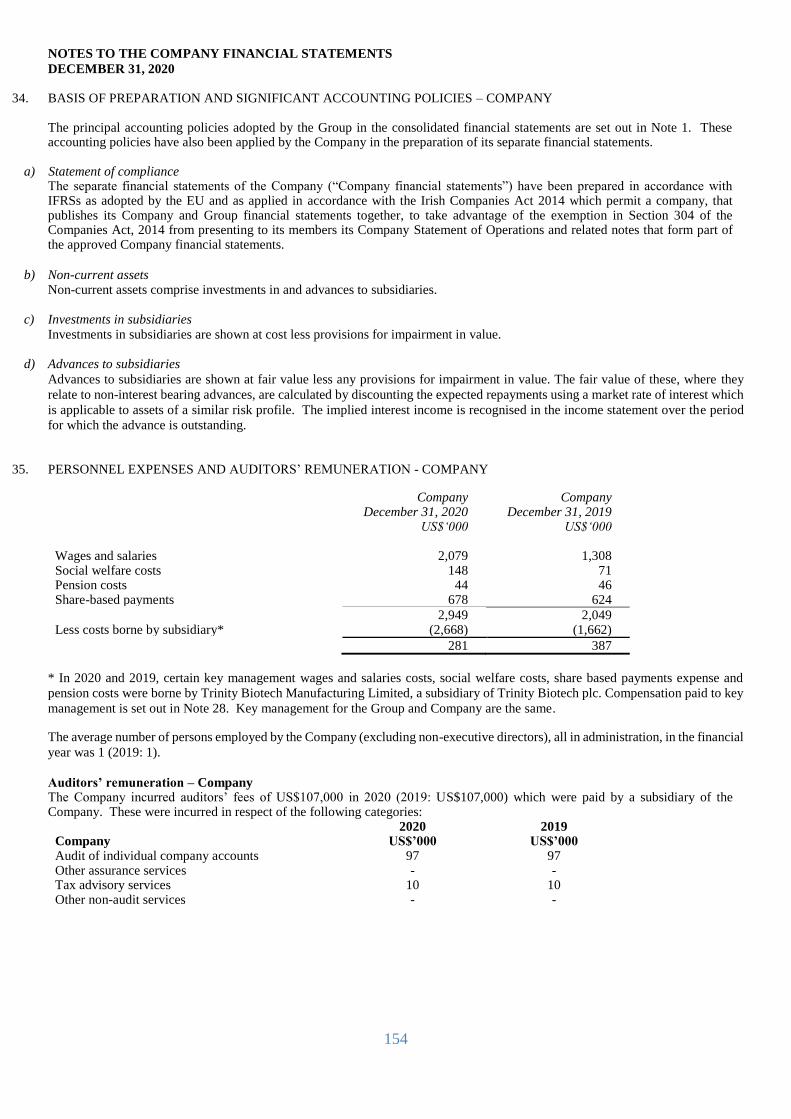
NOTES TO THE COMPANY FINANCIAL STATEMENTS
DECEMBER 31, 2020
154
34. BASIS OF PREPARATION AND SIGNIFICANT ACCOUNTING POLICIES – COMPANY
The principal accounting policies adopted by the Group in the consolidated financial statements are set out in Note 1. These accounting policies have also been applied by the Company in the preparation of its separate financial statements.
a) Statement of compliance The separate financial statements of the Company (“Company financial statements”) have been prepared in accordance with IFRSs as adopted by the EU and as applied in accordance with the Irish Companies Act 2014 which permit a company, that publishes its Company and Group financial statements together, to take advantage of the exemption in Section 304 of the Companies Act, 2014 from presenting to its members its Company Statement of Operations and related notes that form part of the approved Company financial statements.
b) Non-current assets Non-current assets comprise investments in and advances to subsidiaries.
c) Investments in subsidiaries Investments in subsidiaries are shown at cost less provisions for impairment in value.
d) Advances to subsidiaries
Advances to subsidiaries are shown at fair value less any provisions for impairment in value. The fair value of these, where they
relate to non-interest bearing advances, are calculated by discounting the expected repayments using a market rate of interest which
is applicable to assets of a similar risk profile. The implied interest income is recognised in the income statement over the period
for which the advance is outstanding.
35. PERSONNEL EXPENSES AND AUDITORS’ REMUNERATION - COMPANY
Company December 31, 2020
US$‘000
Company December 31, 2019
US$‘000 Wages and salaries 2,079 1,308 Social welfare costs 148 71 Pension costs 44 46 Share-based payments 678 624
2,949 2,049 Less costs borne by subsidiary* (2,668) (1,662)
281 387
* In 2020 and 2019, certain key management wages and salaries costs, social welfare costs, share based payments expense and
pension costs were borne by Trinity Biotech Manufacturing Limited, a subsidiary of Trinity Biotech plc. Compensation paid to key
management is set out in Note 28. Key management for the Group and Company are the same. The average number of persons employed by the Company (excluding non-executive directors), all in administration, in the financial
year was 1 (2019: 1).
Auditors’ remuneration – Company
The Company incurred auditors’ fees of US$107,000 in 2020 (2019: US$107,000) which were paid by a subsidiary of the Company. These were incurred in respect of the following categories:
2020 2019 Company US$’000 US$’000 Audit of individual company accounts 97 97 Other assurance services - - Tax advisory services 10 10 Other non-audit services - -
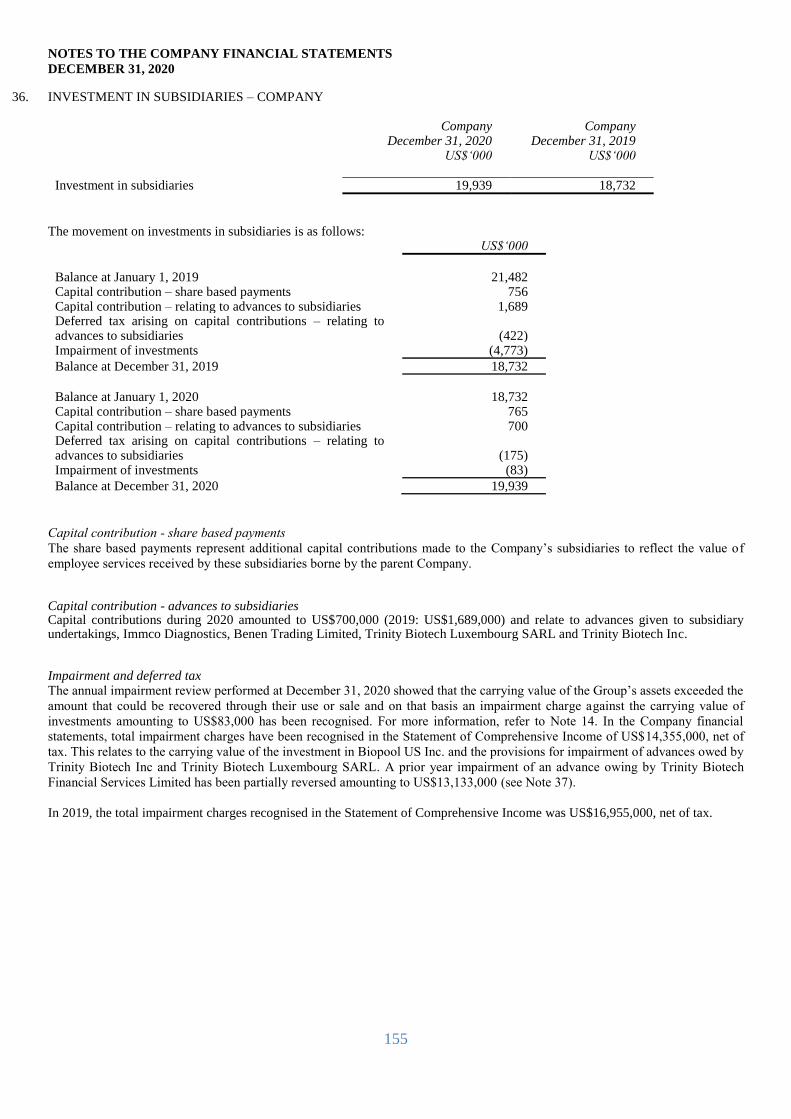
NOTES TO THE COMPANY FINANCIAL STATEMENTS
DECEMBER 31, 2020
155
36. INVESTMENT IN SUBSIDIARIES – COMPANY
Company December 31, 2020
US$‘000
Company December 31, 2019
US$‘000
Investment in subsidiaries 19,939 18,732
The movement on investments in subsidiaries is as follows:
US$‘000
Balance at January 1, 2019 21,482 Capital contribution – share based payments 756 Capital contribution – relating to advances to subsidiaries 1,689 Deferred tax arising on capital contributions – relating to advances to subsidiaries
(422)
Impairment of investments (4,773)
Balance at December 31, 2019 18,732
Balance at January 1, 2020 18,732 Capital contribution – share based payments 765 Capital contribution – relating to advances to subsidiaries 700 Deferred tax arising on capital contributions – relating to advances to subsidiaries
(175)
Impairment of investments (83)
Balance at December 31, 2020 19,939
Capital contribution - share based payments
The share based payments represent additional capital contributions made to the Company’s subsidiaries to reflect the value of
employee services received by these subsidiaries borne by the parent Company. Capital contribution - advances to subsidiaries Capital contributions during 2020 amounted to US$700,000 (2019: US$1,689,000) and relate to advances given to subsidiary undertakings, Immco Diagnostics, Benen Trading Limited, Trinity Biotech Luxembourg SARL and Trinity Biotech Inc. Impairment and deferred tax The annual impairment review performed at December 31, 2020 showed that the carrying value of the Group’s assets exceeded the
amount that could be recovered through their use or sale and on that basis an impairment charge against the carrying value of
investments amounting to US$83,000 has been recognised. For more information, refer to Note 14. In the Company financial
statements, total impairment charges have been recognised in the Statement of Comprehensive Income of US$14,355,000, net of
tax. This relates to the carrying value of the investment in Biopool US Inc. and the provisions for impairment of advances owed by
Trinity Biotech Inc and Trinity Biotech Luxembourg SARL. A prior year impairment of an advance owing by Trinity Biotech
Financial Services Limited has been partially reversed amounting to US$13,133,000 (see Note 37).
In 2019, the total impairment charges recognised in the Statement of Comprehensive Income was US$16,955,000, net of tax.

NOTES TO THE COMPANY FINANCIAL STATEMENTS
DECEMBER 31, 2020
156
37. ADVANCES TO SUBSIDIARIES - COMPANY
Company December 31, 2020
US$‘000
Company December 31, 2019
US$‘000 Advances to subsidiaries 36,755 42,862
The movement on advances to subsidiaries is as follows:
US$ ‘000 Balance at January 1, 2019 45,098 Advances to subsidiaries 27,734 Repayment of advances to subsidiaries (39,657) Provision for impairment (12,182) Recovery of impaired balance 20,100 Imputed Interest on advances to subsidiaries 1,769
Balance at December 31, 2019 42,862
Balance at January 1, 2020 42,862 Advances to subsidiaries 15,131 Repayment of advances to subsidiaries (27,932) Reversal of prior year impairment 13,133 Provision for impairment (14,272) Recovery of impaired balances 6,320 Imputed Interest on advances to subsidiaries 1,513
Balance at December 31, 2020 36,755
In addition to providing permanent investment capital, the Company also provides advances to certain of its subsidiary undertakings
on a periodic basis with a view to them being repaid from future cash flows.
The provision for impairment of US$14,272,000 recorded in the financial year ended December 31, 2020 relates to loans owing by
the subsidiary entity Trinity Biotech Inc and Trinity Biotech Luxembourg SARL. The impairment provision has been recorded to
reduce the balances to the expected recoverable amount from these subsidiaries. A prior year impairment of an advance owing by
Trinity Biotech Financial Services Limited has been partially reversed in the financial year ended December 31, 2020 based on the
fair value of this balance. The balance is now stated at US$13,133,000. The recovery of impaired balances during the year of
US$6,320,000 relates to Trinity Biotech Manufacturing Limited and Biopool US Inc.
The provision for impairment recorded in the financial year ended December 31, 2019 related to loans owing by the subsidiary
entity Trinity Biotech Manufacturing Limited. The impairment arose because this subsidiary’s net liability to Trinity Biotech plc
exceeded the value of its net assets plus its projected discounted cash flows.
38. DEFERRED TAX ASSETS AND LIABILITIES - COMPANY Recognised deferred tax assets
Deferred tax assets of the Company are attributable to the following: Assets Liabilities 2020 2019 2020 2019 Deductible temporary differences US$’000 US$’000 US$’000 US$’000 Investment in subsidiaries and interest-bearing loans to subsidiaries
-
2,681
(59)
-
Total - 2,681 (59) -

NOTES TO THE COMPANY FINANCIAL STATEMENTS
DECEMBER 31, 2020
157
38. DEFERRED TAX ASSETS AND LIABILITIES - COMPANY (CONTINUED)
Unrecognised deferred tax assets Deferred tax assets have not been recognised by the Company in respect of the following items:
December 31, 2020
December 31, 2019
US$’000 US$’000 Management expenses carried forward 398 381 Timing difference related to interest expenses 3,693 - Total 4,091 381 Capital losses 8,293 8,293
The deferred tax assets relating to management expenses carried forward and timing differences for interest expenses have not been recognised due to uncertainty that there will be sufficient taxable profit available against which the timing differences can be utilised. No deferred tax asset is recognised in 2020 or 2019 in respect of a capital loss of US$8,293,000 (2019: US$8,293,000) in Trinity Biotech plc as it was not probable that there will be future capital gains against which to offset these capital losses.
Movement in temporary differences during the year
Balance
January 1,
2020
Recognised in
income
Recognised in
investment in
subsidiaries
Balance
December 31,
2020
US$’000 US$’000 US$’000 US$’000 Investment in subsidiaries and advances to subsidiaries
2,681
(2,915)
175
(59)
Balance
January 1,
2019
Recognised in
income
Recognised in
investment in
subsidiaries
Balance
December 31,
2019
US$’000 US$’000 US$’000 US$’000 Tax value of loss carryforwards recognised
1
(1)
-
- Investment in subsidiaries and advances to subsidiaries
2,179
80
422
2,681
2,180 79 422 2,681
39. CASH AND CASH EQUIVALENTS - COMPANY
Company December 31, 2020
US$ ‘000
Company December 31, 2019
US$ ‘000 Cash at bank and in hand 11,452 163
Cash relates to all cash balances which are readily available for use at year end. Cash equivalents relate to all cash balances on
deposit.

NOTES TO THE COMPANY FINANCIAL STATEMENTS
DECEMBER 31, 2020
158
40. RETAINED EARNINGS - COMPANY
Retained earnings US$’000
Balance at January 1, 2019 5,029 Total comprehensive income 1,895 Share-based payments 839
Balance at December 31, 2019 7,763
Balance at January 1, 2020 7,763 Total comprehensive loss (2,255) Share-based payments 816
Balance at December 31, 2020 6,324
41. OTHER RESERVES - COMPANY
December 31, 2020
US$ ‘000 December 31, 2019
US$ ‘000 Treasury shares (24,922) (24,922)
Treasury Shares
No shares were repurchased by the Group in 2020 or 2019.
42. OTHER PAYABLES - COMPANY
December 31, 2020 US$ ‘000
December 31, 2019 US$ ‘000
Amounts owed to group undertakings 69,197 64,255 Accrued liabilities 119 3
69,316 64,258
Amounts owed to group undertakings are unsecured and are repayable on demand. Accrued liabilities are payable at various dates over the coming months in accordance with the suppliers’ usual and customary credit terms.

NOTES TO THE COMPANY FINANCIAL STATEMENTS
DECEMBER 31, 2020
159
43. DERIVATIVES AND FINANCIAL INSTRUMENTS - COMPANY
The Company uses a range of financial instruments (including cash, receivables and payables) to fund its operations. These
instruments are used to manage the liquidity of the Company and Group in a cost effective, low-risk manner. Working capital
management is a key additional element in the effective management of overall liquidity. The Company does not trade in financial
instruments or derivatives. The main risks arising from the utilisation of these financial instruments are interest rate risk, liquidity
risk and credit risk.
Effective interest rate and repricing analysis
The following table sets out all interest-earning financial assets held by the Company at December 31, indicating their effective
interest rates and the period in which they re-price:
Company
As at
December 31,
2020
US$’000
Note
Effective
interest
rate
Total
Gross
US$’000
6 mths
or less
US$’000
6 – 12
mths
US$’000
1-2
years
US$’000
2-5
years
US$’000
5 years
or more
US$’000
Impairment
US$’000
Net
US$’000
Cash and
cash equivalents
39
0%
11,452
11,452
-
-
-
-
-
11,452
Advances to
subsidiaries
37
3%
51,027
8,216
8,213
27,863
6,735
-
(14,272)
36,755
Total 62,479 19,668 8,213 27,863 6,735 (14,272) 48,207
Company
As at
December 31,
2019
US$’000
Note
Effective
interest
rate
Total
Gross
US$’000
6 mths
or less
US$’000
6 – 12
mths
US$’000
1-2
years
US$’000
2-5
years
US$’000
5 years
or more
US$’000
Impairment
US$’000
Net
US$’000
Cash and
cash equivalents
39
0%
0%
163
163
-
-
-
-
163
Advances to
subsidiaries
37
3.0%
3.0%
55,044
14,231
14,231
15,003
11,579
(12,182)
42,862
Total 55,207 14,394 14,231 15,003 11,579 (12,182) 43,025
Interest rate risk
At December 31, 2020, the Company had no third party borrowings and had cash and cash equivalents of US$11,452,000 (2019:
US$163,000).
Interest rate profile of financial assets and liabilities
The interest rate profile of the financial assets and liabilities of the Company was as follows:
December 31, 2020
US$ ‘000 December 31, 2019
US$ ‘000 Variable rate instruments Financial assets 11,452 163 Amounts owed to group undertakings (69,197) (64,255)
(57,745) (64,092)
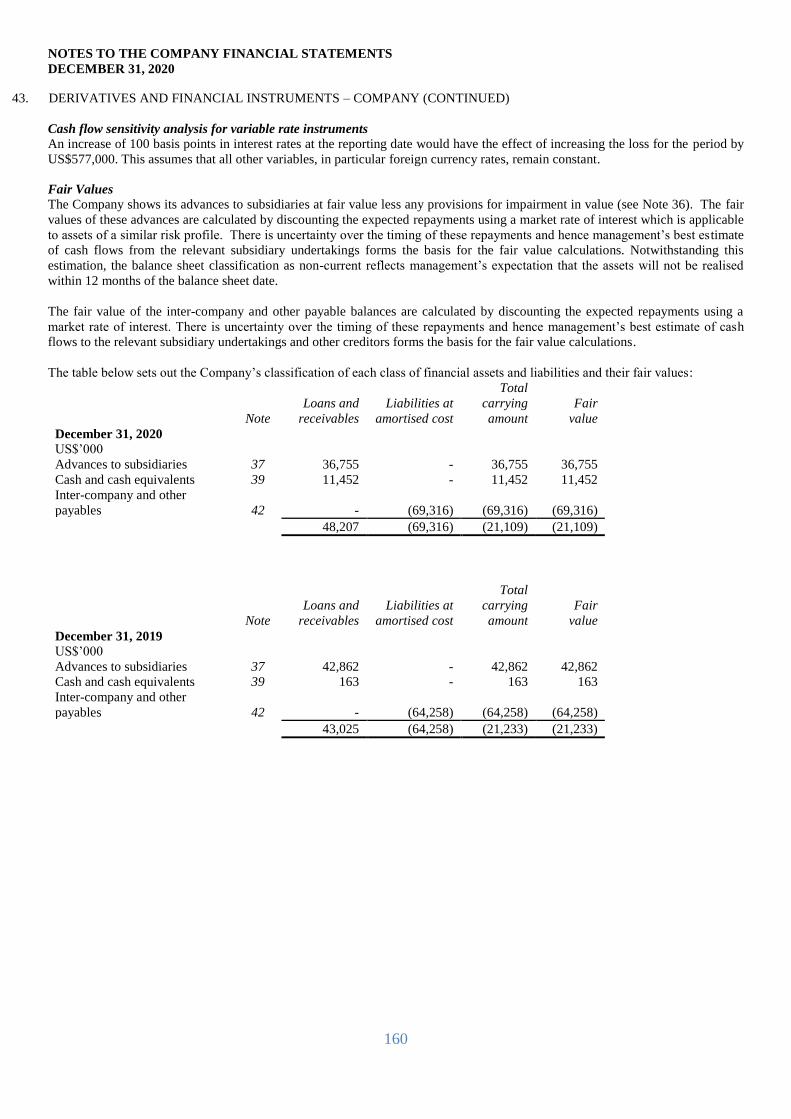
NOTES TO THE COMPANY FINANCIAL STATEMENTS
DECEMBER 31, 2020
160
43. DERIVATIVES AND FINANCIAL INSTRUMENTS – COMPANY (CONTINUED)
Cash flow sensitivity analysis for variable rate instruments
An increase of 100 basis points in interest rates at the reporting date would have the effect of increasing the loss for the period by
US$577,000. This assumes that all other variables, in particular foreign currency rates, remain constant.
Fair Values
The Company shows its advances to subsidiaries at fair value less any provisions for impairment in value (see Note 36). The fair
values of these advances are calculated by discounting the expected repayments using a market rate of interest which is applicable
to assets of a similar risk profile. There is uncertainty over the timing of these repayments and hence management’s best estimate
of cash flows from the relevant subsidiary undertakings forms the basis for the fair value calculations. Notwithstanding this
estimation, the balance sheet classification as non-current reflects management’s expectation that the assets will not be realised
within 12 months of the balance sheet date.
The fair value of the inter-company and other payable balances are calculated by discounting the expected repayments using a
market rate of interest. There is uncertainty over the timing of these repayments and hence management’s best estimate of cash
flows to the relevant subsidiary undertakings and other creditors forms the basis for the fair value calculations.
The table below sets out the Company’s classification of each class of financial assets and liabilities and their fair values:
Note
Loans and
receivables
Liabilities at
amortised cost
Total
carrying
amount
Fair
value
December 31, 2020
US$’000
Advances to subsidiaries 37 36,755 - 36,755 36,755
Cash and cash equivalents 39 11,452 - 11,452 11,452
Inter-company and other
payables
42
-
(69,316)
(69,316)
(69,316)
48,207 (69,316) (21,109) (21,109)
Note
Loans and
receivables
Liabilities at
amortised cost
Total
carrying
amount
Fair
value
December 31, 2019
US$’000
Advances to subsidiaries 37 42,862 - 42,862 42,862
Cash and cash equivalents 39 163 - 163 163
Inter-company and other
payables
42
-
(64,258)
(64,258)
(64,258)
43,025 (64,258) (21,233) (21,233)
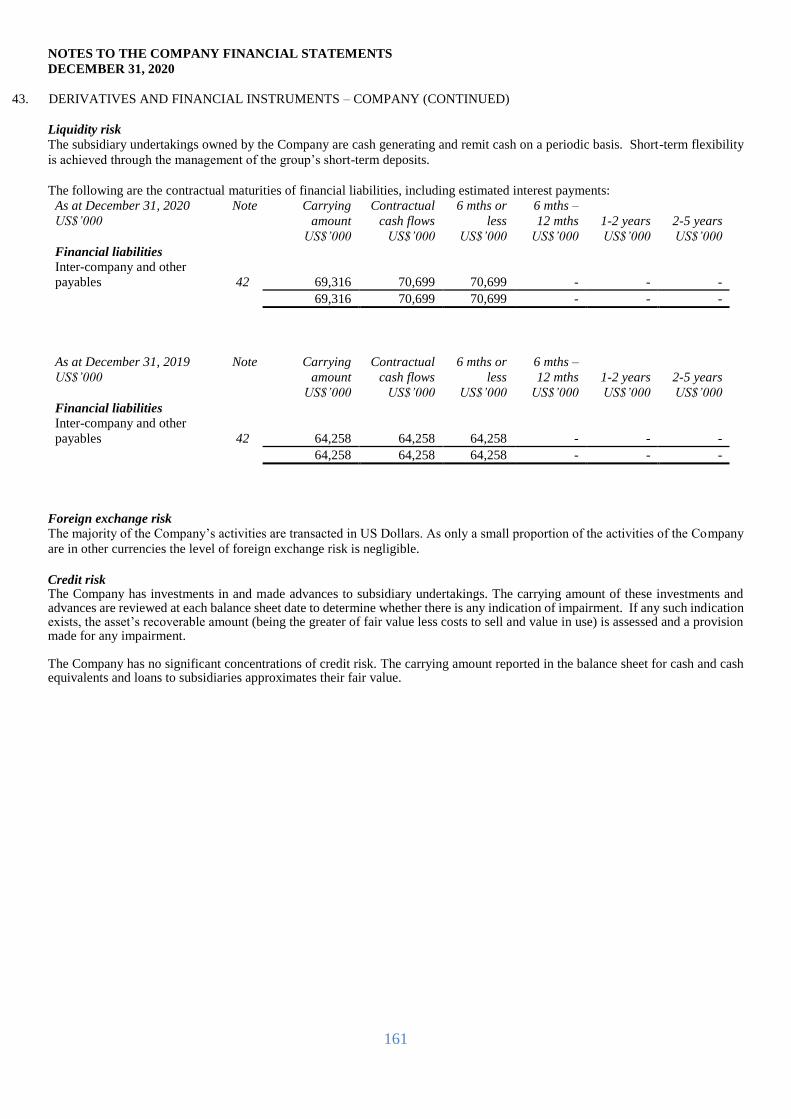
NOTES TO THE COMPANY FINANCIAL STATEMENTS
DECEMBER 31, 2020
161
43. DERIVATIVES AND FINANCIAL INSTRUMENTS – COMPANY (CONTINUED)
Liquidity risk
The subsidiary undertakings owned by the Company are cash generating and remit cash on a periodic basis. Short-term flexibility
is achieved through the management of the group’s short-term deposits.
The following are the contractual maturities of financial liabilities, including estimated interest payments:
As at December 31, 2020
US$’000
Note Carrying
amount
US$’000
Contractual
cash flows
US$’000
6 mths or
less
US$’000
6 mths –
12 mths
US$’000
1-2 years
US$’000
2-5 years
US$’000
Financial liabilities
Inter-company and other
payables
42
69,316
70,699
70,699
-
-
-
69,316 70,699 70,699 - - -
As at December 31, 2019
US$’000
Note Carrying
amount
US$’000
Contractual
cash flows
US$’000
6 mths or
less
US$’000
6 mths –
12 mths
US$’000
1-2 years
US$’000
2-5 years
US$’000
Financial liabilities
Inter-company and other
payables
42
64,258
64,258
64,258
-
-
-
64,258 64,258 64,258 - - -
Foreign exchange risk
The majority of the Company’s activities are transacted in US Dollars. As only a small proportion of the activities of the Company
are in other currencies the level of foreign exchange risk is negligible.
Credit risk The Company has investments in and made advances to subsidiary undertakings. The carrying amount of these investments and advances are reviewed at each balance sheet date to determine whether there is any indication of impairment. If any such indication exists, the asset’s recoverable amount (being the greater of fair value less costs to sell and value in use) is assessed and a provision made for any impairment. The Company has no significant concentrations of credit risk. The carrying amount reported in the balance sheet for cash and cash equivalents and loans to subsidiaries approximates their fair value.
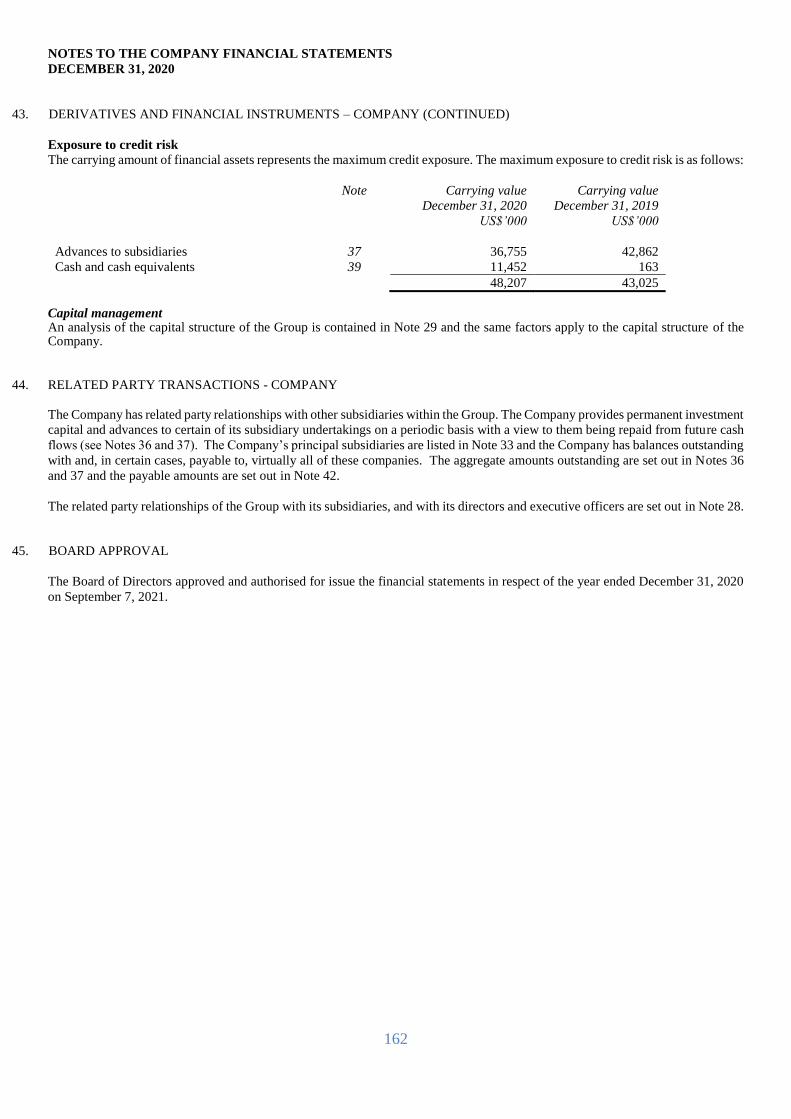
NOTES TO THE COMPANY FINANCIAL STATEMENTS
DECEMBER 31, 2020
162
43. DERIVATIVES AND FINANCIAL INSTRUMENTS – COMPANY (CONTINUED)
Exposure to credit risk
The carrying amount of financial assets represents the maximum credit exposure. The maximum exposure to credit risk is as follows:
Note Carrying value
December 31, 2020
US$’000
Carrying value
December 31, 2019
US$’000
Advances to subsidiaries 37 36,755 42,862
Cash and cash equivalents 39 11,452 163
48,207 43,025
Capital management An analysis of the capital structure of the Group is contained in Note 29 and the same factors apply to the capital structure of the Company.
44. RELATED PARTY TRANSACTIONS - COMPANY
The Company has related party relationships with other subsidiaries within the Group. The Company provides permanent investment
capital and advances to certain of its subsidiary undertakings on a periodic basis with a view to them being repaid from future cash
flows (see Notes 36 and 37). The Company’s principal subsidiaries are listed in Note 33 and the Company has balances outstanding
with and, in certain cases, payable to, virtually all of these companies. The aggregate amounts outstanding are set out in Notes 36
and 37 and the payable amounts are set out in Note 42.
The related party relationships of the Group with its subsidiaries, and with its directors and executive officers are set out in Note 28.
45. BOARD APPROVAL
The Board of Directors approved and authorised for issue the financial statements in respect of the year ended December 31, 2020
on September 7, 2021.