Embed Size (px)
Citation preview
Trinity River Authority QAPP Page 1
TRINITY RIVER AUTHORITY FY 2012-2013 QUALITY ASSURANCE PROJECT PLAN
TRINITY RIVER AUTHORITY 5300 SOUTH COLLINS ARLINGTON, TX 76018
P.O. BOX 60 ARLINGTON, TX 76004
CLEAN RIVERS PROGRAM WATER QUALITY PLANNING DIVISION
TEXAS COMMISSION ON ENVIRONMENTAL QUALITY P.O. BOX 13087, MC 234
AUSTIN, TEXAS 78711-3087
EFFECTIVE PERIOD: FY 2012 TO FY 2013
QUESTIONS CONCERNING THIS QAPP SHOULD BE DIRECTED TO:
ANGELA KILPATRICK TRINITY RIVER AUTHORITY
CLEAN RIVERS PROGRAM COORDINATOR 5300 SOUTH COLLINS
ARLINGTON, TX 76018 PHONE 817-493-5179
FAX 817-417-0367 [email protected]
Trinity River Authority QAPP Page 2
A1 APPROVALPAGE
TEXASCOMMISSIONONENVIRONMENTALQUALITY
WaterQualityPlanningDivision ___________________________________ ___________________________________ Laurie Curra, Manager Date Allison Woodall, Work Leader Date Water Quality Monitoring & Assessment Section Clean Rivers Program ___________________________________ ___________________________________ Jennifer Delk Date Nancy Ragland, Team Leader Date Project QA Specialist & Project Manager Data Management and Analysis Clean Rivers Program
FieldOperationsSupportDivision ___________________________________ ___________________________________ Stephen Stubbs Date Daniel R. Burke Date TCEQ Quality Assurance Manager Lead CRP Quality Assurance Specialist Quality Assurance Section
Trinity River Authority QAPP Page 3
TRINITYRIVERAUTHORITY ___________________________________ _____________________________________ Glenn Clingenpeel Date Angela Kilpatrick Date TRA Senior Project Manager TRA Project Manager ___________________________________ Webster Mangham Date TRA Quality Assurance Officer
LABORATORIES ___________________________________ _____________________________________ Craig Harvey Date Cathy Henderson-Sieger Date TRA CRWS Lab Manager TRA CRWS Quality Assurance Officer ___________________________________ _____________________________________ Mike Knight Date Thresa Aquayo Date TRA LLP Lab Manager TRA LLP Lab Quality Assurance Officer ___________________________________ _____________________________________ Brenda Wiles Date Mary Thrasher Date Talem, Inc. Lab Manager Talem, Inc. Quality Assurance Officer ___________________________________ _____________________________________ Richard Rodriguez Date Tonia King-Cormier Date Accutest Lab Manager Accutest Lab Quality Assurance Officer ___________________________________ ___________________________________ Ted Yen Date Bill Gase Date Accutest Lab Quality Assurance Officer City of Arlington Lab Manager and Quality
Assurance Officer
Trinity River Authority QAPP Page 4
___________________________________ _____________________________________ Howard Hayden Date Hardey Pabley Date Xenco Lab Manager & Quality Assurance Officer TTI Lab Manager & Quality Assurance Officer
WITHINBASINPARTICIPATINGAGENCIESPROJECTMANAGERS ___________________________________ _____________________________________ Mike Knight Date Terry Hodgins Date TRA LLP Project Manager City of Dallas Project Manager ___________________________________ _____________________________________ Vicki Stokes Date T. Sury Date City of Fort Worth Project Manager City of Grand Prairie Project Manager ___________________________________ _____________________________________ Bill Brown Date Jeffrey Shiflet Date City of Arlington Project Manager City of Irving Project Manager ___________________________________ _____________________________________ Mark Ernst Date Susan G. Alvarez, PE, CFM Date TRWD Project Manager City of Dallas Trinity Watershed Management Senior Project Manager ___________________________________ Paul White Date City of Dallas Trinity Watershed Management Project Manager The Trinity River Authority will secure written documentation by way of signature above from each sub-tier project participant (e.g., subcontractors, other units of government) stating the organization’s awareness of and commitment to requirements contained in this quality assurance project plan and any amendments or added appendices of this plan.
Trinity River Authority QAPP Page 5
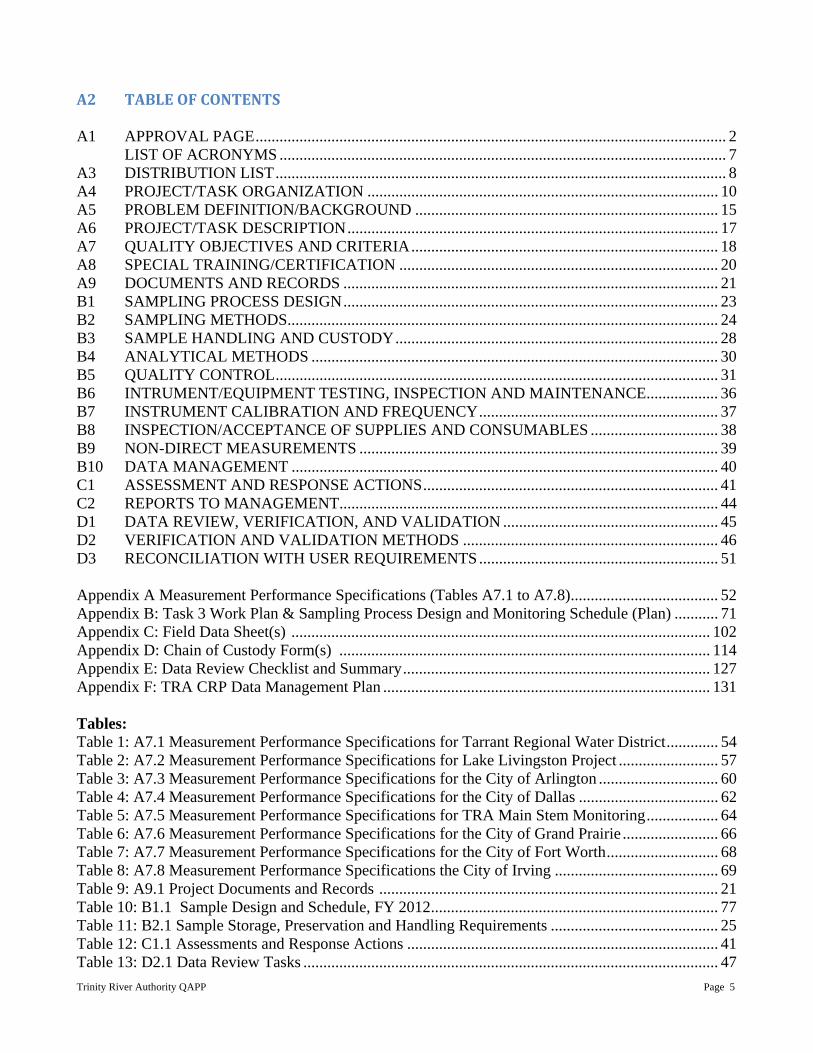
A2 TABLEOFCONTENTS A1 APPROVAL PAGE ...................................................................................................................... 2 LIST OF ACRONYMS ................................................................................................................ 7 A3 DISTRIBUTION LIST ................................................................................................................. 8 A4 PROJECT/TASK ORGANIZATION ........................................................................................ 10 A5 PROBLEM DEFINITION/BACKGROUND ............................................................................ 15 A6 PROJECT/TASK DESCRIPTION ............................................................................................. 17 A7 QUALITY OBJECTIVES AND CRITERIA ............................................................................. 18 A8 SPECIAL TRAINING/CERTIFICATION ................................................................................ 20 A9 DOCUMENTS AND RECORDS .............................................................................................. 21 B1 SAMPLING PROCESS DESIGN .............................................................................................. 23 B2 SAMPLING METHODS ............................................................................................................ 24 B3 SAMPLE HANDLING AND CUSTODY ................................................................................. 28 B4 ANALYTICAL METHODS ...................................................................................................... 30 B5 QUALITY CONTROL ............................................................................................................... 31 B6 INTRUMENT/EQUIPMENT TESTING, INSPECTION AND MAINTENANCE .................. 36 B7 INSTRUMENT CALIBRATION AND FREQUENCY ............................................................ 37 B8 INSPECTION/ACCEPTANCE OF SUPPLIES AND CONSUMABLES ................................ 38 B9 NON-DIRECT MEASUREMENTS .......................................................................................... 39 B10 DATA MANAGEMENT ........................................................................................................... 40 C1 ASSESSMENT AND RESPONSE ACTIONS .......................................................................... 41 C2 REPORTS TO MANAGEMENT ............................................................................................... 44 D1 DATA REVIEW, VERIFICATION, AND VALIDATION ...................................................... 45 D2 VERIFICATION AND VALIDATION METHODS ................................................................ 46 D3 RECONCILIATION WITH USER REQUIREMENTS ............................................................ 51 Appendix A Measurement Performance Specifications (Tables A7.1 to A7.8) ..................................... 52 Appendix B: Task 3 Work Plan & Sampling Process Design and Monitoring Schedule (Plan) ........... 71 Appendix C: Field Data Sheet(s) ......................................................................................................... 102 Appendix D: Chain of Custody Form(s) ............................................................................................. 114 Appendix E: Data Review Checklist and Summary ............................................................................. 127 Appendix F: TRA CRP Data Management Plan .................................................................................. 131 Tables: Table 1: A7.1 Measurement Performance Specifications for Tarrant Regional Water District ............. 54 Table 2: A7.2 Measurement Performance Specifications for Lake Livingston Project ......................... 57 Table 3: A7.3 Measurement Performance Specifications for the City of Arlington .............................. 60 Table 4: A7.4 Measurement Performance Specifications for the City of Dallas ................................... 62 Table 5: A7.5 Measurement Performance Specifications for TRA Main Stem Monitoring .................. 64 Table 6: A7.6 Measurement Performance Specifications for the City of Grand Prairie ........................ 66 Table 7: A7.7 Measurement Performance Specifications for the City of Fort Worth ............................ 68 Table 8: A7.8 Measurement Performance Specifications the City of Irving ......................................... 69 Table 9: A9.1 Project Documents and Records ..................................................................................... 21 Table 10: B1.1 Sample Design and Schedule, FY 2012 ........................................................................ 77 Table 11: B2.1 Sample Storage, Preservation and Handling Requirements .......................................... 25 Table 12: C1.1 Assessments and Response Actions .............................................................................. 41 Table 13: D2.1 Data Review Tasks ........................................................................................................ 47
Trinity River Authority QAPP Page 6
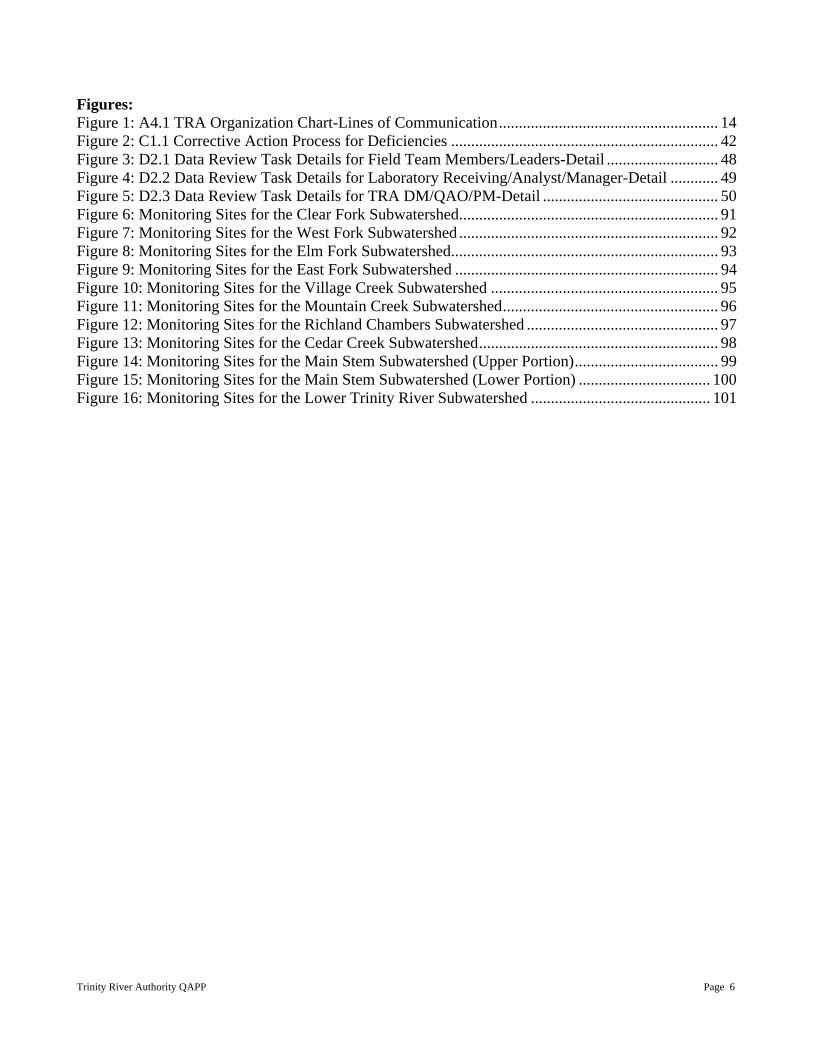
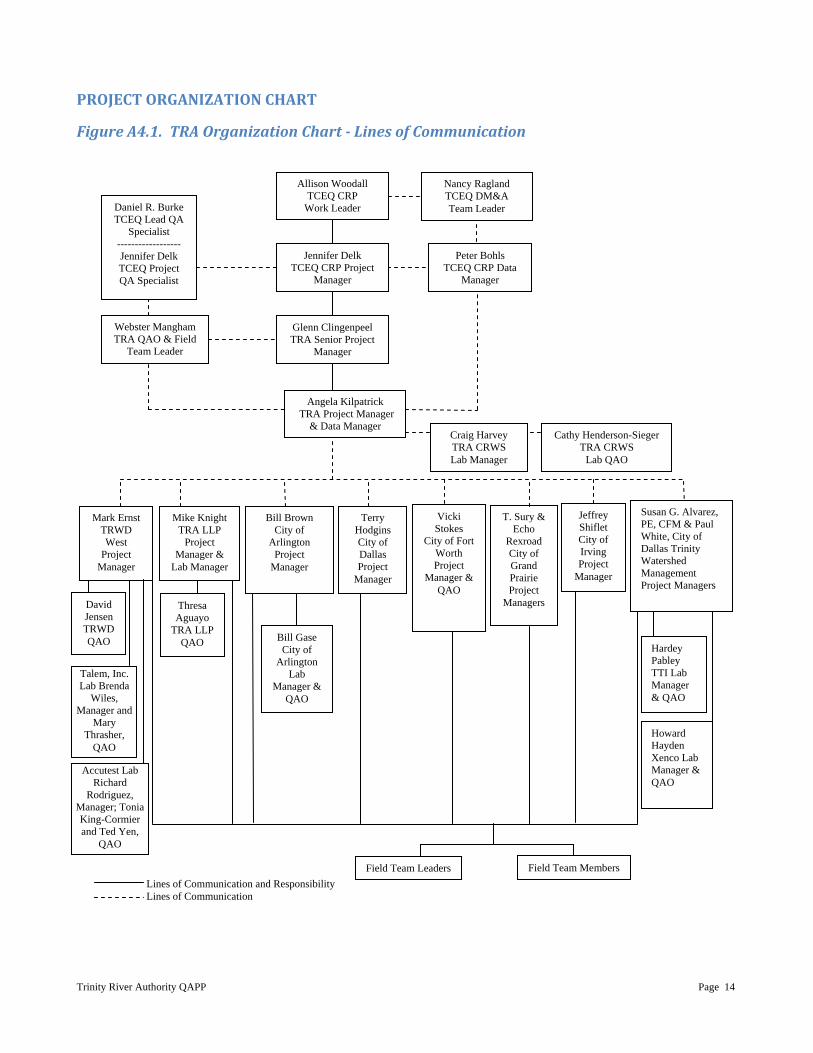
Figures: Figure 1: A4.1 TRA Organization Chart-Lines of Communication ....................................................... 14 Figure 2: C1.1 Corrective Action Process for Deficiencies ................................................................... 42 Figure 3: D2.1 Data Review Task Details for Field Team Members/Leaders-Detail ............................ 48 Figure 4: D2.2 Data Review Task Details for Laboratory Receiving/Analyst/Manager-Detail ............ 49 Figure 5: D2.3 Data Review Task Details for TRA DM/QAO/PM-Detail ............................................ 50 Figure 6: Monitoring Sites for the Clear Fork Subwatershed ................................................................. 91 Figure 7: Monitoring Sites for the West Fork Subwatershed ................................................................. 92 Figure 8: Monitoring Sites for the Elm Fork Subwatershed................................................................... 93 Figure 9: Monitoring Sites for the East Fork Subwatershed .................................................................. 94 Figure 10: Monitoring Sites for the Village Creek Subwatershed ......................................................... 95 Figure 11: Monitoring Sites for the Mountain Creek Subwatershed ...................................................... 96 Figure 12: Monitoring Sites for the Richland Chambers Subwatershed ................................................ 97 Figure 13: Monitoring Sites for the Cedar Creek Subwatershed ............................................................ 98 Figure 14: Monitoring Sites for the Main Stem Subwatershed (Upper Portion) .................................... 99 Figure 15: Monitoring Sites for the Main Stem Subwatershed (Lower Portion) ................................. 100 Figure 16: Monitoring Sites for the Lower Trinity River Subwatershed ............................................. 101
Trinity River Authority QAPP Page 7
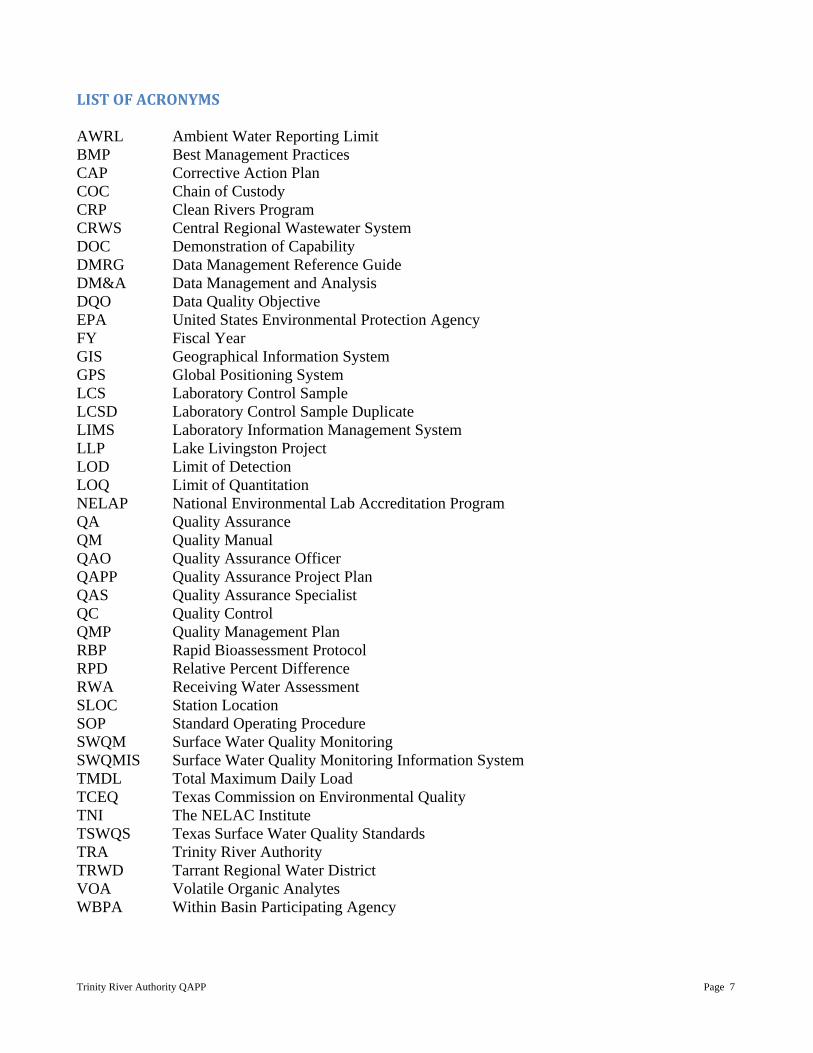
LISTOFACRONYMS AWRL Ambient Water Reporting Limit BMP Best Management Practices CAP Corrective Action Plan COC Chain of Custody CRP Clean Rivers Program CRWS Central Regional Wastewater System DOC Demonstration of Capability DMRG Data Management Reference Guide DM&A Data Management and Analysis DQO Data Quality Objective EPA United States Environmental Protection Agency FY Fiscal Year GIS Geographical Information System GPS Global Positioning System LCS Laboratory Control Sample LCSD Laboratory Control Sample Duplicate LIMS Laboratory Information Management System LLP Lake Livingston Project LOD Limit of Detection LOQ Limit of Quantitation NELAP National Environmental Lab Accreditation Program QA Quality Assurance QM Quality Manual QAO Quality Assurance Officer QAPP Quality Assurance Project Plan QAS Quality Assurance Specialist QC Quality Control QMP Quality Management Plan RBP Rapid Bioassessment Protocol RPD Relative Percent Difference RWA Receiving Water Assessment SLOC Station Location SOP Standard Operating Procedure SWQM Surface Water Quality Monitoring SWQMIS Surface Water Quality Monitoring Information System TMDL Total Maximum Daily Load TCEQ Texas Commission on Environmental Quality TNI The NELAC Institute TSWQS Texas Surface Water Quality Standards TRA Trinity River Authority TRWD Tarrant Regional Water District VOA Volatile Organic Analytes WBPA Within Basin Participating Agency
Trinity River Authority QAPP Page 8
A3 DISTRIBUTIONLIST Texas Commission on Environmental Quality P.O. Box 13087 Austin, Texas 78711-3087 Jennifer Delk, Project Manager Clean Rivers Program MC-234 (512) 239-4712 Daniel R. Burke Lead CRP Quality Assurance Specialist MC-165 (512) 239-0011 Nancy Ragland Team Leader, Data Management and Analysis MC-234 (512) 239-6546 Trinity River Authority 5300 South Collins Arlington, Texas 76018 P.O. Box 60 Arlington, Texas 76004 Glenn Clingenpeel, Senior Project Manager Angela Kilpatrick, Project Manager 817-493-5176 817-493-5179 Webster Mangham, Quality Assurance Officer 817-493-5127 City of Arlington Laboratory Services 1901B Lakewood Drive Arlington, Texas 76013 Bill Gase, Manager and Quality Assurance Officer 817-575-8974 TRA CRWS Laboratory 6500 Singleton Boulevard Dallas, Texas 75212 Craig Harvey, Manager Cathy Henderson-Sieger, Quality Assurance Officer 972-263-2251 972-263-2251
Trinity River Authority QAPP Page 9
TRA LLP Laboratory 5170 South FM 1988 P.O. Box 360 Livingston, Texas 77351 Mike Knight, Manager Thresa Aguayo, Quality Assurance Officer 936-365-2292 936-365-2292 Talem, Inc. Laboratory 610 S. Jennings Ave Fort Worth, TX 76014 Brenda Wiles, Manager Mary Thrasher, Quality Assurance Officer 817-335-1186 x 1025 817-335-1186 x 1012 Accutest Laboratory 10165 Hardwin Dr. Houston, TX 77036 Richard Rodriguez, Manager Tonia King-Cormier and Ted Yen, Quality Assurance 713-271-4700 Officers 713-271-4700 T.T.I. Environmental Laboratories 2117 Arlington Downs Road Arlington, Texas 76011 Hardey Pabley, Manager 817-861-5332 Xenco Laboratories 9701 Harry Hines Boulevard Dallas, Texas 75220 Howard Hayden, Manager 214-902-0300 The Trinity River Authority will provide copies of this project plan and any amendments or appendices of this plan to each person on this list and to each sub-tier project participant, e.g., subcontractors, other units of government. The Trinity River Authority will document distribution of the plan and any amendments and appendices, maintain this documentation as part of the project’s quality assurance records, and will ensure the documentation is available for review.
Trinity River Authority QAPP Page 10
A4 PROJECT/TASKORGANIZATION
DescriptionofResponsibilities
TCEQ Allison Woodall CRP Work Leader Responsible for TCEQ activities supporting the development and implementation of the Texas Clean Rivers Program. Responsible for verifying that the QMP is followed by CRP staff. Supervises TCEQ CRP staff. Reviews and responds to any deficiencies, corrective actions, or findings related to the area of responsibility. Oversees the development of QA guidance for the CRP. Reviews and approves all QA audits, corrective actions, reviews, reports, work plans, contracts, QAPPs, and TCEQ QMP. Enforces corrective action, as required, where QA protocols are not met. Ensures CRP personnel are fully trained. Daniel R. Burke CRP Lead Quality Assurance Specialist Participates in the development, approval, implementation, and maintenance of written quality assurance standards (e.g., Program Guidance, SOPs, QAPPs, QMP). Assists program and project manager in developing and implementing quality system. Serves on planning team for CRP special projects. Coordinates the review and approval of CRP QAPPs. Prepares and distributes annual audit plans. Conducts monitoring systems audits of Planning Agencies. Concurs with and monitors implementation of corrective actions. Conveys QA problems to appropriate management. Recommends that work be stopped in order to safeguard programmatic objectives, worker safety, public health, or environmental protection. Ensures maintenance of QAPPs and audit records for the CRP. Jennifer Delk CRP Project Manager Responsible for the development, implementation, and maintenance of CRP contracts. Tracks, reviews, and approves deliverables. Participates in the development, approval, implementation, and maintenance of written quality assurance standards (e.g., Program Guidance, SOPs, QAPPs, QMP). Assists CRP Lead QA Specialist in conducting Basin Planning Agency audits. Verifies QAPPs are being followed by contractors and that projects are producing data of known quality. Coordinates project planning with the Basin Planning Agency Project Manager. Reviews and approves data and reports produced by contractors. Notifies QA Specialists of circumstances which may adversely affect the quality of data derived from the collection and analysis of samples. Develops, enforces, and monitors corrective action measures to ensure contractors meet deadlines and scheduled commitments. Nancy Ragland Team Leader, Data Management and Analysis Team Participates in the development, approval, implementation, and maintenance of written quality assurance standards (e.g., Program Guidance, SOPs, QAPPs, QMP). Ensures DM&A staff perform data management related tasks, including coordination and tracking of CRP data sets from initial submittal through CRP Project Manager review and approval; ensuring that data is reported following instructions in the Surface Water Quality Monitoring Data Management Reference Guide (January 2010, or most current version); running automated data validation checks in SWQMIS and coordinating data verification and error correction with CRP Project Managers; generating SWQMIS
Trinity River Authority QAPP Page 11
summary reports to assist CRP Project Managers' data review; identifying data anomalies and inconsistencies; providing training and guidance to CRP and Planning Agencies on technical data issues to ensure that data are submitted according to documented procedures; reviewing QAPPS for valid stream monitoring stations, validity of parameter codes, submitting entity code(s), collecting entity code(s), and monitoring type code(s); developing and maintaining data management-related standard operating procedures for CRP data management; and coordinating and processing data correction requests. Peter Bohls CRP Data Manager, Data Management and Analysis Team Responsible for coordination and tracking of CRP data sets from initial submittal through CRP Project Manager review and approval. Ensures that data is reported following instructions in the Surface Water Quality Monitoring Data Management Reference Guide (January 2010, or most current version). Runs automated data validation checks in SWQMIS and coordinates data verification and error correction with CRP Project Managers. Generates SWQMIS summary reports to assist CRP Project Managers’ data review. Identifies data anomalies and inconsistencies. Provides training and guidance to CRP and Planning Agencies on technical data issues to ensure that data are submitted according to documented procedures. Reviews QAPPS for valid stream monitoring stations. Checks validity of parameter codes, submitting entity code(s), collecting entity code(s), and monitoring type code(s). Develops and maintains data management-related standard operating procedures for CRP data management. Coordinates and processes data correction requests. Participates in the development, implementation, and maintenance of written quality assurance standards (e.g., Program Guidance, SOPs, QAPPs, QMP). Jennifer Delk CRP Project Quality Assurance Specialist Serves as liaison between CRP management and TCEQ QA management. Participates in the development, approval, implementation, and maintenance of written quality assurance standards (e.g., Program Guidance, SOPs, QAPPs, QMP). Serves on planning team for CRP special projects and reviews QAPPs in coordination with other CRP staff. Coordinates documentation and implementation of corrective action for the CRP.
TRINITYRIVERAUTHORITY Glenn Clingenpeel TRA Senior Project Manager Responsible for implementing CRP requirements in the contract. Angela Kilpatrick TRA Project Manager Responsible for implementing and monitoring CRP requirements in contracts, QAPPs, and QAPP amendments and appendices. Coordinates basin planning activities and work of basin partners. Ensures monitoring systems audits are conducted to ensure QAPPs are followed by basin planning agency participants and that projects are producing data of known quality. Ensures that subcontractors are qualified to perform contracted work. Ensures CRP project managers and/or QA Specialists are notified of deficiencies and corrective actions, and that issues are resolved. Responsible for validating that data collected are acceptable for reporting to the TCEQ. Responsible for coordinating the
Trinity River Authority QAPP Page 12
implementation of the QA program. Responsible for writing and maintaining the QAPP and monitoring its implementation. Responsible for maintaining records of QAPP distribution, including appendices and amendments. Responsible for maintaining written records of sub-tier commitment to requirements specified in this QAPP. Responsible for identifying, receiving, and maintaining project quality assurance records. Responsible for coordinating with the TCEQ QAS to resolve QA-related issues. Coordinates and monitors deficiencies and corrective action. Coordinates and maintains records of data verification and validation. Coordinates the research and review of technical QA material and data related to water quality monitoring system design and analytical techniques. Conducts monitoring systems audits on project participants to determine compliance with project and program specifications, issues written reports, and follows through on findings. Ensures that field staff are properly trained and that training records for in-house staff are maintained. Webster Mangham TRA Quality Assurance Officer Notifies the Trinity River Authority Project Manager of particular circumstances which may adversely affect the quality of data. Coordinates with the TRA Project Manager to conduct monitoring systems audits on project participants to determine compliance with project and program specifications, issue written reports, and follow through on findings. Coordinates with the TRA Project Manager to ensure that field staff are properly trained and that training records for in-house staff are maintained. Angela Kilpatrick TRA Data Manager Responsible for ensuring that field data are properly reviewed and verified. Responsible for the transfer of basin quality-assured water quality data to the TCEQ in a format compatible with SWQMIS. Maintains quality-assured data on Trinity River Authority internet sites. Within Basin Participating Agencies Field Team Leaders (To Remain Unnamed) Field team leaders are responsible for ensuring that field samples and measurements are collected and recorded according to methodologies detailed in this QAPP. Field team leaders will be instructed on appropriate sampling techniques, and will ensure that such techniques are utilized. They will have primary responsibility for initiating corrective actions in the field in support of data completeness goals of 90%. Field team leaders will ensure proper use of field notebooks, proper calibration of equipment, and that chain of custody forms are correctly completed and received by the laboratory. Field Team Members (To Remain Unnamed) Will work under the direction of field team leaders as necessary to ensure integrity of samples and field measurements. Will be responsible for following sampling and field measurement methodologies detailed in this QAPP.
Trinity River Authority QAPP Page 13
Project Managers Mike Knight, TRA Lake Livingston (LLP) Mark Ernst, Tarrant Regional Water District (TRWD) Bill Brown, City of Arlington Terry Hodgins, City of Dallas Vicki Stokes, City of Fort Worth T. Sury, City of Grand Prairie Jeffrey Shiflet, City of Irving Susan G. Alvarez and Paul White, City of Dallas Trinity Watershed Management The project managers are responsible for all CRP related activities conducted by their respective agencies. The project managers will oversee field teams, assuring that all are properly trained and that CRP related sampling activities are conducted in manners consistent with procedures detailed in this QAPP. The project managers will also oversee submittal of water quality samples to the contract laboratory as appropriate and will be responsible for confirming that requested analyses are carried out. Ensures that field staff are properly trained and that training records are maintained in accordance with their entity’s policies and are sent to the TRA Project Manager. Laboratory Managers Craig Harvey, TRA Central Regional Wastewater System (CRWS) Laboratory Mike Knight, TRA LLP Brenda Wiles, Talem, Inc. Laboratory (contract laboratory for TRWD) Mary Thrasher, Accutest Laboratory (contract laboratory for TRWD) Bill Gase, City of Arlington Laboratory Howard Hayden, Xenco Laboratory (contract lab for City of Dallas Trinity Watershed Management) Hardey Pabley, T.T.I. Laboratory (contract lab for City of Dallas Trinity Watershed Management) The laboratory managers will oversee all analytical work performed at their respective laboratories to assure that proper and appropriate clean analytical techniques are utilized. When quality assurance issues arise in the laboratory, the laboratory managers will be responsible for initiating corrective actions and for notifying the QAO of any such issues. The laboratory managers will also maintain the laboratory’s QA records and analysts’ training records. Sub-Tier Quality Assurance Officers Cathy Henderson-Sieger, TRA CRWS Laboratory Thresa Aguayo, TRA LLP David Jensen, TRWD Bill Gase, City of Arlington Laboratory Brenda Wiles, Talem, Inc. Laboratory (contract laboratory for TRWD) Tonia King-Cormier, Accutest Laboratory (contract laboratory for TRWD) Ted Yen, Accutest Laboratory (contract laboratory for TRWD) Vicki Stokes, City of Fort Worth Monica Tobar, Xenco Laboratory Hardey Pabley, T.T.I. Laboratory The quality assurance officers are responsible for ensuring the quality of data submitted to the TRA by their respective agencies. The quality assurance officers are also responsible for validation of data prior to submission to the TRA and will coordinate with TRA QAO to resolve QA related issues.
Trinity River Authority QAPP Page 14
PROJECTORGANIZATIONCHART
FigureA4.1.TRAOrganizationChart‐LinesofCommunication
Craig Harvey TRA CRWS Lab Manager
Cathy Henderson-Sieger TRA CRWS
Lab QAO
Glenn Clingenpeel TRA Senior Project
Manager
Angela Kilpatrick TRA Project Manager
& Data Manager
Webster Mangham TRA QAO & Field
Team Leader
Daniel R. Burke TCEQ Lead QA
Specialist ------------------ Jennifer Delk TCEQ Project QA Specialist
Allison Woodall TCEQ CRP
Work Leader
Jennifer Delk TCEQ CRP Project
Manager
Peter Bohls TCEQ CRP Data
Manager
Nancy Ragland TCEQ DM&A Team Leader
David Jensen TRWD QAO
Talem, Inc. Lab Brenda
Wiles, Manager and
Mary Thrasher,
QAO
Lines of Communication and Responsibility Lines of Communication
Field Team Members Field Team Leaders
Bill Gase City of
Arlington Lab
Manager & QAO
Vicki Stokes
City of Fort Worth Project
Manager & QAO
T. Sury & Echo
Rexroad City of Grand Prairie Project
Managers
Bill Brown City of
Arlington Project
Manager
Jeffrey Shiflet City of Irving Project
Manager
Susan G. Alvarez, PE, CFM & Paul White, City of Dallas Trinity Watershed Management Project Managers
Hardey Pabley TTI Lab Manager & QAO
Howard Hayden Xenco Lab Manager & QAO
Terry Hodgins City of Dallas Project
Manager Thresa Aguayo
TRA LLP QAO
Mike Knight TRA LLP
Project Manager &
Lab Manager
Mark Ernst TRWD West
Project Manager
Accutest Lab Richard
Rodriguez, Manager; Tonia King-Cormier and Ted Yen,
QAO
Trinity River Authority QAPP Page 15
A5 PROBLEMDEFINITION/BACKGROUND In 1991, the Texas Legislature passed the Texas Clean River Act (Senate Bill 818) in response to growing concerns that water resource issues were not being pursued in an integrated, systematic manner. The act requires that ongoing water quality assessments be conducted for each river basin in Texas, an approach that integrates water quality issues within the watershed. The CRP legislation mandates that “each river authority (or local governing entity) shall submit quality-assured data collected in the river basin to the commission.” “Quality-assured data” in the context of the legislation means “data that comply with commission rules for surface water quality monitoring programs, including rules governing the methods under which water samples are collected and analyzed and data from those samples are assessed and maintained.” This QAPP addresses the program developed between the Trinity River Authority and the TCEQ to carry out the activities mandated by the legislation. The QAPP was developed and will be implemented in accordance with provisions of the TCEQ Quality Management Plan (most recent version). The purpose of this QAPP is to clearly delineate TRA QA policy, management structure, and procedures which will be used to implement the QA requirements necessary to verify and validate the surface water quality data collected. The QAPP is reviewed by the TCEQ to help ensure that data generated for the purposes described above are scientifically valid and legally defensible. This process will ensure that data collected under this QAPP and submitted to SWQMIS have been collected and managed in a way that guarantees its reliability and therefore can be used in water quality assessments, total maximum daily load development, establishing water quality standards, making permit decisions and used by other programs deemed appropriate by the TCEQ. Project results will be used to support the achievement of Clean Rivers Program objectives as contained in the Clean Rivers Program Guidance and Reference Guide FY 2012 -2013. The Trinity River Authority recognizes that there exists, within the Trinity River basin, a great number of agencies performing routine water quality sampling for their own objectives outside of the Clean Rivers Program. Basin maps can be found in Appendix B. These agencies generate a wealth of data concerning Trinity River water quality. It is therefore the objective of this agency to seek to obtain data from existing programs in lieu of establishing a basin-wide CRP water quality sampling program. This avoids duplication of effort and fosters communication and sharing of data between basin water agencies. Towards this end, the TRA CRP will coordinate closely with local agencies conducting water quality sampling programs. Although the sampling conducted by the Within-Basin Participating Agencies (WBPAs) is quite comprehensive, the Main Stem of the Trinity River from Fort Worth to Oakwood was left relatively unsampled. TRA began monitoring this stretch of the river in-house in order to more completely monitor the basin. The participation of the Within-Basin Participating Agencies is strictly voluntary, and it is recognized by both the Trinity River Authority of Texas and the Texas Commission on Environmental Quality that the programs conducted by WBPAs exist for purposes independent of the Clean Rivers Program. At the same time, it is recognized that the CRP must generate data of a known quality in order for such data to be used by the TCEQ in a regulatory capacity. This QAPP details the standards which will be maintained in order to ensure quality data is being generated for and by this program. Procedures not directly specified as varying between sampling entities will hold true for all WBPAs and subcontractors. It is not the desire of the TRA CRP to dictate policy, only establish minimum criteria for acceptability of data under the Clean Rivers Program. Should WBPAs or the TRA Project Manager or the TCEQ CRP Project Manager determine that minimum criteria established by this QAPP are not being met for specific parameters, data generated concerning those parameters will not be submitted to TCEQ. WBPAs are under no obligation whatsoever to modify their current practices in order to comply with criteria herein set forth
Trinity River Authority QAPP Page 16
although failure to do so may result in data not being submitted to TCEQ. This QAPP will initially address the routine water quality monitoring practices of the Tarrant Regional Water District, the Lake Livingston Project, the City of Arlington, the City of Dallas, the City of Dallas Trinity Watershed Management, the City of Fort Worth, the City of Grand Prairie, the City of Irving, and TRA’s In-House Monitoring; other WBPAs may be added at a later date in the form of amendments to this QAPP. It shall be the responsibility of the Project Manager of WBPAs or subcontractors employed by the Trinity River Authority to ensure that laboratories used maintain adequate quality controls as specified in this document. Towards the end of assuring that guidelines set forth in this QAPP are being met, the TRA CRP QAO shall conduct monitoring system audits on subcontractors and WBPAs. Such audits will be limited to activities generating data covered by this QAPP. Any non-compliance issues will be presented in writing to appropriate personnel. WBPAs are under no obligations to adopt suggested changes resulting from an audit. Failure to address compliance issues could however, invalidate some or all data being generated for the CRP. Such data, at the discretion of the TRA Project Manager, may be withheld from the TCEQ’s SWQMIS database.
Trinity River Authority QAPP Page 17
A6 PROJECT/TASKDESCRIPTION Entities which will be collecting routine data include Tarrant Regional Water District, TRA’s Lake Livingston Project, the City of Arlington, the City of Dallas Trinity Watershed Management, the City of Dallas, the City of Fort Worth, the City of Irving, the City of Grand Prairie, and TRA’s Main Stem Monitoring. In all, this QAPP covers sampling activities at approximately 180 sites with a total of more than 80 different parameters. These parameters are sampled at various locations and frequencies (see Appendix B for a detailed list of routine monitoring stations and parameter groups to be monitored this fiscal year). See Appendix B for the project-related work plan tasks and schedule of deliverables for a description of work defined in this QAPP. Attach work plan tasks pertaining to this QAPP. See Appendix B for sampling design and monitoring pertaining to this QAPP. Amendments to the QAPP Revisions to the QAPP may be necessary to address incorrectly documented information or to reflect changes in project organization, tasks, schedules, objectives, and methods. Requests for amendments will be directed from the TRA Project Manager to the CRP Project Manager electronically. Amendments are effective immediately upon approval by the TRA Project Manager, the TRA QAO, the CRP Project Manager, the CRP Lead QA Specialist, the CRP Project QA Specialist, and additional parties affected by the amendment. Amendments are not retroactive. They will be incorporated into the QAPP by way of attachment and distributed to personnel on the distribution list by the TRA Project Manager. Special Project Appendices Projects requiring QAPP appendices will be planned in consultation with the TRA and the TCEQ Project Manager and TCEQ technical staff. Appendices will be written in an abbreviated format and will reference the Basin QAPP where appropriate. Appendices will be approved by the TRA Project Manager, the TRA QAO, the Laboratory, the CRP Project Manager, the CRP Project QA Specialist, the CRP Lead QA Specialist and other TCEQ personnel as appropriate. Copies of approved QAPPs appendices will be distributed by the TRA to project participants before data collection activities commence.
Trinity River Authority QAPP Page 18
A7 QUALITYOBJECTIVESANDCRITERIA The purpose of routine water quality monitoring is to collect surface water quality data that can be used to characterize water quality conditions, identify significant long-term water quality trends, support water quality standards development, support the permitting process, and conduct water quality assessments in accordance with TCEQs Guidance for Assessing Texas Surface and Finished Drinking Water Quality Data. These water quality data, and data collected by other organizations (e.g., USGS, TCEQ, etc.), will be subsequently reconciled for use and assessed by the TCEQ. Parameters other than those needed for assessments (metals, diel monitoring, other nutrients and conventionals) will be collected by WBPAs and submitted to TCEQ under this QAPP. These parameters are collected due to the fact that the WBPAs have monitoring objectives outside of the Clean Rivers Program, such as watershed protection and stormwater permitting. Systematic watershed monitoring is defined by sampling that is planned for a short duration (1 to 2 years) and is designed to: screen waters that would not normally be included in the routine monitoring program, monitor at sites to check the water quality situation, and investigate areas of potential concern. Due to the limitations regarding these data (e.g., not temporally representative, limited number of samples, biological sampling does not meet the specimen vouchering requirements), the data will be used to determine whether any locations have values exceeding the TCEQ’s water quality criteria and/or screening levels (or in some cases values elevated above normal). The TRA will use this information to determine future monitoring priorities. These water quality data, and data collected by other organizations (e.g., USGS, TCEQ, etc.), will be subsequently reconciled for use and assessed by the TCEQ. The measurement performance specifications to support the project purpose for a minimum data set are specified in Appendix A Table A7.1 and in the text following. Ambient Water Reporting Limits (AWRLs) The AWRL establishes the reporting specification at or below which data for a parameter must be reported to be compared with freshwater screening criteria. The AWRLs specified in Appendix A Tables A7.1 to A7.8 are the program-defined reporting specifications for each analyte and yield data acceptable for the TCEQ’s water quality assessment. A full listing of AWRLs can be found at http://www.tceq.state.tx.us/compliance/monitoring/crp/qa/index.html. The limit of quantitation is the minimum level, concentration, or quantity of a target variable (e.g., target analyte) that can be reported with a specified degree of confidence. The following requirements must be met in order to report results to the CRP:
• The laboratory’s LOQ for each analyte must be at or below the AWRL as a matter of routine practice.
• The laboratory must demonstrate its ability to quantitate at its LOQ for each analyte by running an LOQ check sample for each analytical batch of CRP Samples analyzed.
Laboratory Measurement Quality Control Requirements and Acceptability Criteria are provided in Section B5. Precision Precision is the degree to which a set of observations or measurements of the same property, obtained under similar conditions, conform to themselves. It is a measure of agreement among replicate measurements of the same property, under prescribed similar conditions, and is an indication of random error.
Trinity River Authority QAPP Page 19
Field splits are used to assess the variability of sample handling, preservation, and storage, as well as the analytical process, and are prepared by splitting samples in the field. Control limits for field splits are defined in Section B5. Laboratory precision is assessed by comparing replicate analyses of laboratory control samples in the sample matrix (e.g. deionized water, sand, commercially available tissue) or sample/duplicate pairs in the case of bacterial analysis. Precision results are compared against measurement performance specifications and used during evaluation of analytical performance. Program-defined measurement performance specifications for precision are defined in Appendix A Tables A7.1 to A7.8. Bias Bias is a statistical measurement of correctness and includes multiple components of systematic error. A measurement is considered unbiased when the value reported does not differ from the true value. Bias is determined through the analysis of laboratory control samples and LOQ Check Samples prepared with verified and known amounts of all target analytes in the sample matrix (e.g. deionized water, sand, commercially available tissue) and by calculating percent recovery. Results are compared against measurement performance specifications and used during evaluation of analytical performance. Program-defined measurement performance specifications for bias are specified in Appendix A Tables A7.1 to A7.8. Representativeness Site selection, the appropriate sampling regime, the sampling of all pertinent media according to TCEQ SOPs, and use of only approved analytical methods will assure that the measurement data represents the conditions at the site. Routine data collected under the Clean Rivers Program for water quality assessment are considered to be spatially and temporally representative of routine water quality conditions. Water Quality data are collected on a routine frequency and are separated by approximately even time intervals. At a minimum, samples are collected over at least two seasons (to include inter-seasonal variation) and over two years (to include inter-year variation) and include some data collected during an index period (March 15- October 15). Although data may be collected during varying regimes of weather and flow, the data sets will not be biased toward unusual conditions of flow, runoff, or season. The goal for meeting total representation of the water body will be tempered by the potential funding for complete representativeness. Comparability Confidence in the comparability of routine data sets for this project and for water quality assessments is based on the commitment of project staff to use only approved sampling and analysis methods and QA/QC protocols in accordance with quality system requirements and as described in this QAPP and in TCEQ SOPs. Comparability is also guaranteed by reporting data in standard units, by using accepted rules for rounding figures, and by reporting data in a standard format as specified in the Data Management Plan Section B10. Completeness The completeness of the data is basically a relationship of how much of the data is available for use compared to the total potential data. Ideally, 100% of the data should be available. However, the possibility of unavailable data due to accidents, insufficient sample volume, broken or lost samples, etc. is to be expected. Therefore, it will be a general goal of the project(s) that 90% data completion is achieved.
Trinity River Authority QAPP Page 20
A8 SPECIALTRAINING/CERTIFICATION New field personnel receive training in proper sampling and field analysis. Before actual sampling or field analysis occurs, they will demonstrate to the QA Officer (or designee) their ability to properly calibrate field equipment and perform field sampling and analysis procedures. Field personnel training is documented and retained in the personnel file and will be available during a monitoring systems audit. The requirements for Global Positioning System (GPS) certification are located in Section B10, Data Management. Contractors and subcontractors must ensure that laboratories analyzing samples under this QAPP meet the requirements contained in section TNI Volume 1 Module 2, Section 4.5.5 (concerning Review of Requests, Tenders and Contracts).
Trinity River Authority QAPP Page 21
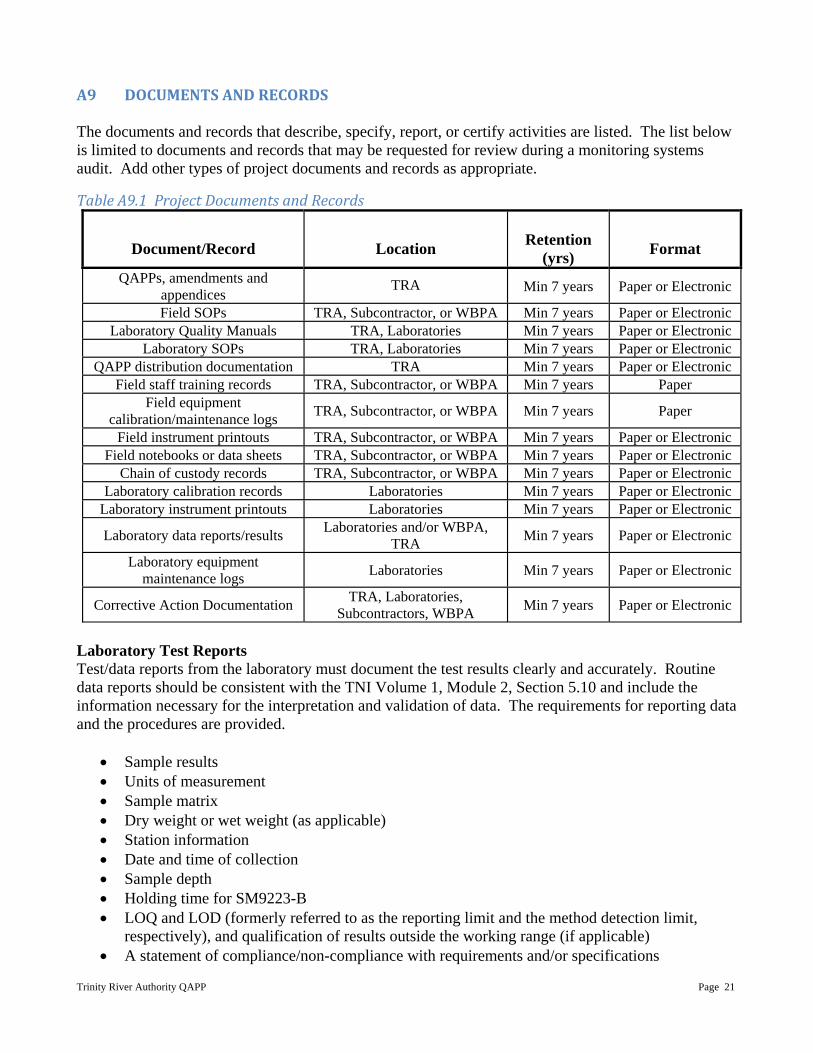
A9 DOCUMENTSANDRECORDS The documents and records that describe, specify, report, or certify activities are listed. The list below is limited to documents and records that may be requested for review during a monitoring systems audit. Add other types of project documents and records as appropriate.
TableA9.1ProjectDocumentsandRecords
Document/Record
Location
Retention
(yrs)
Format
QAPPs, amendments and appendices
TRA Min 7 years Paper or Electronic
Field SOPs TRA, Subcontractor, or WBPA Min 7 years Paper or ElectronicLaboratory Quality Manuals TRA, Laboratories Min 7 years Paper or Electronic
Laboratory SOPs TRA, Laboratories Min 7 years Paper or ElectronicQAPP distribution documentation TRA Min 7 years Paper or Electronic
Field staff training records TRA, Subcontractor, or WBPA Min 7 years PaperField equipment
calibration/maintenance logs TRA, Subcontractor, or WBPA Min 7 years Paper
Field instrument printouts TRA, Subcontractor, or WBPA Min 7 years Paper or ElectronicField notebooks or data sheets TRA, Subcontractor, or WBPA Min 7 years Paper or Electronic
Chain of custody records TRA, Subcontractor, or WBPA Min 7 years Paper or ElectronicLaboratory calibration records Laboratories Min 7 years Paper or Electronic
Laboratory instrument printouts Laboratories Min 7 years Paper or Electronic
Laboratory data reports/results Laboratories and/or WBPA, TRA Min 7 years Paper or Electronic
Laboratory equipment maintenance logs Laboratories Min 7 years Paper or Electronic
Corrective Action Documentation TRA, Laboratories, Subcontractors, WBPA Min 7 years Paper or Electronic
Laboratory Test Reports Test/data reports from the laboratory must document the test results clearly and accurately. Routine data reports should be consistent with the TNI Volume 1, Module 2, Section 5.10 and include the information necessary for the interpretation and validation of data. The requirements for reporting data and the procedures are provided.
• Sample results • Units of measurement • Sample matrix • Dry weight or wet weight (as applicable) • Station information • Date and time of collection • Sample depth • Holding time for SM9223-B • LOQ and LOD (formerly referred to as the reporting limit and the method detection limit,
respectively), and qualification of results outside the working range (if applicable) • A statement of compliance/non-compliance with requirements and/or specifications
Trinity River Authority QAPP Page 22
• Title of report and unique identifiers on each page • Name/address of the laboratory • Name/address of the client • A clear indication of the sample(s) analyzed • Date and time of sample receipt • Identification of method used • Identification of samples that did not meet QA requirements and why (e.g. holding times
exceeded) • Cleary identified subcontract laboratory results (as applicable) • Name/title of person accepting responsibility for the report • Project-specific quality control results to include field split results (as applicable); equipment,
trip, and field blank results (as applicable); and precision, bias, and LOQ check standard results • Narrative information on QC failures or derivations from requirements that may affect the
quality of results or is necessary for verification and validation of data Electronic Data Data will be submitted electronically to the TCEQ in the Event/Result file format described in the most current version of the Surface Water Quality Monitoring Data Management Reference Guide (http://www.tceq.state.tx.us/compliance/monitoring/water/quality/data/wdma/dmrg_index.html). A completed Data Review Checklist and Data Summary (see Appendix E) will be submitted with each data submittal. Data from WBPAs will be received in a variety of formats and layouts (hardcopy, Excel, Text, Access) which will then be converted by the TRA to the Event/Result file format specified in the TCEQ’s SWQM Data Management Reference Guide. See Section C2 Reports to TRA Project Management for a description of data formats received from WBPAs.
Trinity River Authority QAPP Page 23
B1 SAMPLINGPROCESSDESIGN See Appendix B for sampling process design information and monitoring tables associated with data collected under this QAPP.
Trinity River Authority QAPP Page 24
B2 SAMPLINGMETHODS Field Sampling Procedures Field sampling will be conducted according to procedures documented in the TCEQ Surface Water Quality Monitoring Procedures Volume 1: Physical and Chemical Monitoring Methods for Water, Sediment, and Tissue, 2008.(RG-415) and Volume 2: Methods for Collecting and Analyzing Biological Community and Habitat Data (RG-416). Additional aspects outlined in Section B below reflect specific requirements for sampling under the Clean Rivers Program and/or provide additional clarification. Sample Containers Sample containers (cubitainers) are purchased pre-cleaned for conventional parameters and are disposable. TRWD reuses all containers except bacteria sample bottles -- rigid plastic containers, nalgene, and glass containers are acid rinsed at the lab with the appropriate acid solution, rinsed with DI water, and air dried. TRWD does not use cubitainers for samples covered under this QAPP. Sample containers used for bacteriological samples may have 1% sodium thiosulfate tablets added. Amber glass or plastic bottles or foil wrapped cubitainers are used routinely for chlorophyll samples. The sample containers for metals are new, certified glass or plastic bottles, or glass or plastic bottles cleaned and documented according to EPA method 1669. Certificates are maintained in a notebook by the TRA, WBPA, or by the laboratory depending on the source of the sample containers. Processes to Prevent Contamination Procedures outlined in the TCEQ Surface Water Quality Monitoring Procedures outline the necessary steps to prevent contamination of samples. These include: direct collection into sample containers, when possible; triple rinsing equipment such as buckets used for sample collection with ambient water or deionized water when the use of ambient water for rinsing is not feasible; clean sampling techniques for metals; and certified containers for organics. Field QC samples (identified in Section B5) are collected to verify that contamination has not occurred.
Trinity River Authority QAPP Page 25
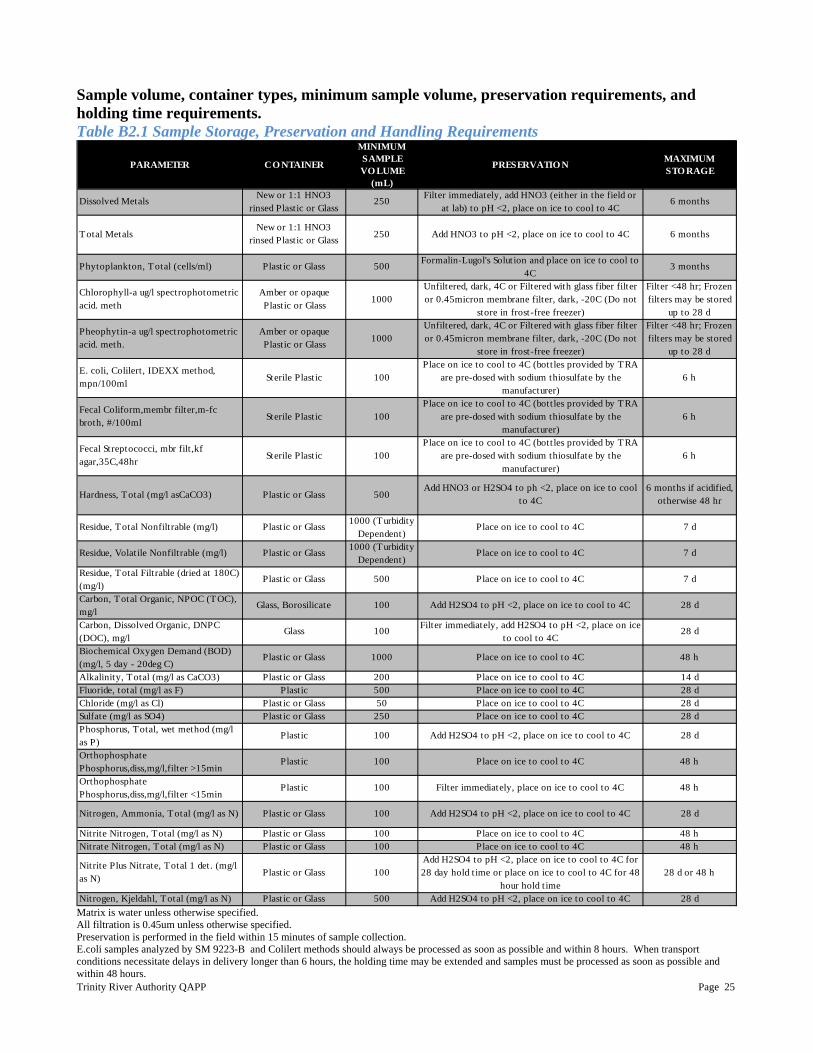
Sample volume, container types, minimum sample volume, preservation requirements, and holding time requirements. Table B2.1 Sample Storage, Preservation and Handling Requirements
Matrix is water unless otherwise specified. All filtration is 0.45um unless otherwise specified. Preservation is performed in the field within 15 minutes of sample collection. E.coli samples analyzed by SM 9223-B and Colilert methods should always be processed as soon as possible and within 8 hours. When transport conditions necessitate delays in delivery longer than 6 hours, the holding time may be extended and samples must be processed as soon as possible and within 48 hours.
PARAMETER CO NTAINER
MINIMUM SAMPLE VO LUME
(mL)
PRESERVATIO N MAXIMUM STO RAGE
Dissolved Metals New or 1:1 HNO3 rinsed Plastic or Glass
250 Filter immediately, add HNO3 (either in the field or at lab) to pH <2, place on ice to cool to 4C
6 months
Total MetalsNew or 1:1 HNO3
rinsed Plastic or Glass 250 Add HNO3 to pH <2, place on ice to cool to 4C 6 months
Phytoplankton, Total (cells/ml) Plastic or Glass 500 Formalin-Lugol's Solution and place on ice to cool to 4C
3 months
Chlorophyll-a ug/l spectrophotometric acid. meth
Amber or opaque Plastic or Glass 1000
Unfiltered, dark, 4C or Filtered with glass fiber filter or 0.45micron membrane filter, dark, -20C (Do not
store in frost-free freezer)
Filter <48 hr; Frozen filters may be stored
up to 28 d
Pheophytin-a ug/l spectrophotometric acid. meth.
Amber or opaque Plastic or Glass 1000
Unfiltered, dark, 4C or Filtered with glass fiber filter or 0.45micron membrane filter, dark, -20C (Do not
store in frost-free freezer)
Filter <48 hr; Frozen filters may be stored
up to 28 d
E. coli, Colilert, IDEXX method, mpn/100ml Sterile Plastic 100
Place on ice to cool to 4C (bottles provided by TRA are pre-dosed with sodium thiosulfate by the
manufacturer)6 h
Fecal Coliform,membr filter,m-fc broth, #/100ml Sterile Plastic 100
Place on ice to cool to 4C (bottles provided by TRA are pre-dosed with sodium thiosulfate by the
manufacturer)6 h
Fecal Streptococci, mbr filt ,kf agar,35C,48hr Sterile Plastic 100
Place on ice to cool to 4C (bottles provided by TRA are pre-dosed with sodium thiosulfate by the
manufacturer)6 h
Hardness, Total (mg/l asCaCO3) Plastic or Glass 500Add HNO3 or H2SO4 to ph <2, place on ice to cool
to 4C6 months if acidified,
otherwise 48 hr
Residue, Total Nonfiltrable (mg/l) Plastic or Glass 1000 (Turbidity Dependent)
Place on ice to cool to 4C 7 d
Residue, Volatile Nonfiltrable (mg/l) Plastic or Glass 1000 (Turbidity Dependent)
Place on ice to cool to 4C 7 d
Residue, Total Filtrable (dried at 180C) (mg/l)
Plastic or Glass 500 Place on ice to cool to 4C 7 d
Carbon, Total Organic, NPOC (TOC), mg/l
Glass, Borosilicate 100 Add H2SO4 to pH <2, place on ice to cool to 4C 28 d
Carbon, Dissolved Organic, DNPC (DOC), mg/l
Glass 100 Filter immediately, add H2SO4 to pH <2, place on ice to cool to 4C
28 d
Biochemical Oxygen Demand (BOD) (mg/l, 5 day - 20deg C)
Plastic or Glass 1000 Place on ice to cool to 4C 48 h
Alkalinity, Total (mg/l as CaCO3) Plastic or Glass 200 Place on ice to cool to 4C 14 dFluoride, total (mg/l as F) Plastic 500 Place on ice to cool to 4C 28 dChloride (mg/l as Cl) Plastic or Glass 50 Place on ice to cool to 4C 28 dSulfate (mg/l as SO4) Plastic or Glass 250 Place on ice to cool to 4C 28 dPhosphorus, Total, wet method (mg/l as P)
Plastic 100 Add H2SO4 to pH <2, place on ice to cool to 4C 28 d
Orthophosphate Phosphorus,diss,mg/l,filter >15min
Plastic 100 Place on ice to cool to 4C 48 h
Orthophosphate Phosphorus,diss,mg/l,filter <15min
Plastic 100 Filter immediately, place on ice to cool to 4C 48 h
Nitrogen, Ammonia, Total (mg/l as N) Plastic or Glass 100 Add H2SO4 to pH <2, place on ice to cool to 4C 28 d
Nitrite Nitrogen, Total (mg/l as N) Plastic or Glass 100 Place on ice to cool to 4C 48 hNitrate Nitrogen, Total (mg/l as N) Plastic or Glass 100 Place on ice to cool to 4C 48 h
Nitrite Plus Nitrate, Total 1 det. (mg/l as N) Plastic or Glass 100
Add H2SO4 to pH <2, place on ice to cool to 4C for 28 day hold t ime or place on ice to cool to 4C for 48
hour hold t ime28 d or 48 h
Nitrogen, Kjeldahl, Total (mg/l as N) Plastic or Glass 500 Add H2SO4 to pH <2, place on ice to cool to 4C 28 d
Trinity River Authority QAPP Page 26
Documentation of Field Sampling Activities Field sampling activities are documented on field data sheets as presented in Appendix C. The following will be recorded for all visits as negotiated with each WBPA: 1. Station ID 2. Sampling Date 3. Location 4. Sampling depth 5. Sampling time 6. Sample collector’s name/signature 7. Values for all field parameters 8. Detailed observational data, including:
• water appearance • weather • biological activity • unusual odors • flow severity • flow estimation calculation or instantaneous flow from gage, flow meter, or weir • pertinent observations related to water quality or stream uses (e.g., exceptionally poor water
quality conditions/standards not met; stream uses such as swimming, boating, fishing, irrigation pumps, etc.)
• watershed or instream activities (events impacting water quality, e.g., bridge construction, livestock watering upstream, etc.)
• specific sample information (number of sediments grabs, type/number of fish in a tissue sample, etc.)
• missing parameters (i.e., when a scheduled parameter or group of parameters is not collected)
Recording Data For the purposes of this section and subsequent sections, all field and laboratory personnel follow the basic rules for recording information as documented below: 1. Write legibly in indelible ink 2. Changes should be made by crossing out original entries with a single line, entering the changes,
and initialing and dating the corrections. 3. Close-out incomplete pages with an initialed and dated diagonal line. Sampling Method Requirements or Sampling Process Design Deficiencies, and Corrective Action Examples of sampling method requirements or sample design deficiencies include but are not limited to such things as inadequate sample volume due to spillage or container leaks, failure to preserve samples appropriately, contamination of a sample bottle during collection, storage temperature and holding time exceedance, sampling at the wrong site, etc. Any deviations from the QAPP and appropriate sampling procedures may invalidate resulting data and may require corrective action. Corrective action may include for samples to be discarded and re-collected. Deviations will be communicated from the WBPA or TRA field or laboratory staff to the WBPA or TRA Project Managers. WBPA Project Managers will forward information about deviations to the TRA Project Manager. It is the responsibility of the TRA Project Manager, in consultation with the TRA QAO, to ensure that the actions and resolutions to the problems are documented and that records are maintained
Trinity River Authority QAPP Page 27
in accordance with this QAPP. In addition, these actions and resolutions will be conveyed to the CRP Project Manager both verbally and in writing in the project progress reports and by completion of a corrective action plan (CAP). The definition of and process for handling deficiencies and corrective action are defined in Section C1.
Trinity River Authority QAPP Page 28
B3 SAMPLEHANDLINGANDCUSTODY Sample Tracking Proper sample handling and custody procedures ensure the custody and integrity of samples beginning at the time of sampling and continuing through transport, sample receipt, preparation, and analysis. A sample is in custody if it is in actual physical possession or in a secured area that is restricted to authorized personnel. The Chain of Custody (COC) form is a record that documents the possession of the samples from the time of collection to receipt in the laboratory. The following information concerning the sample is recorded on the COC form (See Appendix D). The following list of items matches the COC form in Appendix D as negotiated with each WBPA. 1. Date and time of collection 2. Site identification 3. Sample matrix 4. Number of containers 5. Preservative used 6. Was the sample filtered 7. Analyses required 8. Name of collector 9. Custody transfer signatures and dates and time of transfer 10. Bill of lading (if applicable) Sample Labeling Samples from the field are labeled on the container or on a label with an indelible marker as negotiated with each WBPA. Label information includes: 1. Site identification 2. Date and time of collection 3. Preservative added, if applicable 4. Indication of field-filtration (for metals and/or orthophosphate) as applicable 5. Sample type (i.e., analysis(es)) to be performed Sample Handling Field data sheets will be used by all participants to document field conditions and sample collection. Electronic data loggers may also be used for this purpose. Examples of field data sheets used by all WBPAs and subcontractors can be found in Appendix C. All samples are handled and transported under chain of custody forms from the sampling location to the laboratory. Chain of custody forms from all sampling entities can be found in Appendix D. In some cases, a combined field data sheet and chain of custody form is used. Samples are collected by field crews using appropriate sampling methodologies, preserved by acidification or other appropriate methods if necessary (preservation requirements are documented on field data sheets and labels), placed in coolers packed with ice and delivered to laboratories within holding times. This basic methodology is followed by all sampling personnel. Except for the instances listed below, all samples are delivered to laboratories the same day they are collected. Exceptions include:
Trinity River Authority QAPP Page 29
1. TRWD Eastern Division non-E. coli samples which are driven to the lab the day after collection (E. coli is collected during specific sampling events and delivered to the lab on the same day within the 6 hour holding time);
2. City of Dallas metals which are delivered to the lab at the end of sampling; and 3. On rare occasions when shipment of samples is required (LLP personnel ship samples to TRA
Central for analysis), samples will be packed in ice and shipped in coolers using express delivery.
Upon arrival at the laboratory, transfer of custody is documented on chain of custody forms and samples are placed in coolers and logged into the laboratories’ LIM Systems. Laboratory personnel accepting samples will confirm that samples were placed on ice, and that there is still ice remaining around sample containers, indicating that an attempt was made to maintain the temperature of the samples at 4C. Samples which are required to be cooled but are not received on ice will not be analyzed. In addition, laboratory personnel will confirm that all samples were received as indicated on the COC forms and that they are preserved as needed (i.e. they will confirm that acidified samples have been lowered to pH <2). Sample Tracking Procedure Deficiencies and Corrective Action All deficiencies associated with chain-of-custody procedures as described in this QAPP are immediately reported to the TRA Project Manager. These include such items as delays in transfer, resulting in holding time violations; violations of sample preservation requirements; incomplete documentation, including signatures; possible tampering of samples; broken or spilled samples, etc. Deficiencies will be communicated from the WBPA or TRA field or laboratory staff to the WBPA or TRA Project Managers. WBPA Project Managers will forward information about deficiencies to the TRA Project Manager. The TRA Project Manager in consultation with the TRA QAO will determine if the procedural violation may have compromised the validity of the resulting data. Any failures that have reasonable potential to compromise data validity will invalidate data, and the sampling event should be repeated. The resolution of the situation will be reported to the TCEQ CRP Project Manager in the project progress report. Corrective Action Plans will be prepared by the TRA QAO and submitted to TCEQ CRP Project Manager along with project progress report. The definition of and process for handling deficiencies and corrective action are defined in Section C1.
Trinity River Authority QAPP Page 30
B4 ANALYTICALMETHODS The analytical methods, associated matrices, and performing laboratories are listed in Appendix A. The authority for analysis methodologies under the Clean Rivers Program is derived from the TSWQS (§§307.1 - 307.10) in that data generally are generated for comparison to those standards and/or criteria. The Standards state that “Procedures for laboratory analysis must be in accordance with the most recently published edition of the book entitled Standard Methods for the Examination of Water and Wastewater, the TCEQ Surface Water Quality Monitoring Procedures as amended, 40 CFR 136, or other reliable procedures acceptable to the commission, and in accordance with chapter 25 of this title.” Laboratories collecting data under this QAPP are compliant with the TNI Standards. Copies of laboratory QMs and SOPs are available for review by the TCEQ. Standards Traceability All standards used in the field and laboratory are traceable to certified reference materials. Standards preparation is fully documented and maintained in a standards log book. Each documentation includes information concerning the standard identification, starting materials, including concentration, amount used and lot number; date prepared, expiration date and preparer’s initials/signature. The reagent bottle is labeled in a way that will trace the reagent back to preparation. Analytical Method Deficiencies and Corrective Actions Deficiencies in field and laboratory measurement systems involve, but are not limited to such things as instrument malfunctions, failures in calibration, blank contamination, quality control samples outside QAPP defined limits, etc. In many cases, the field technician or lab analyst will be able to correct the problem. If the problem is resolvable by the field technician or lab analyst, then they will document the problem on the field data sheet or laboratory record and complete the analysis. If the problem is not resolvable, then it is conveyed to the TRA or WBPA Laboratory Supervisor, who will make the determination and notify the TRA QAO. If the analytical system failure may compromise the sample results, the resulting data will not be reported to the TCEQ. The nature and disposition of the problem is reported on the data report which is sent to the TRA Project Manager. The TRA Project Manager will include this information in the CAP and submit with the Progress Report which is sent to the TCEQ CRP Project Manager. The definition of and process for handling deficiencies and corrective action are defined in Section C1. The TCEQ has determined that analyses associated with the qualifier codes “holding time exceedance”, “sample received unpreserved”, “estimated value”, etc... may have unacceptable measurement uncertainty associated with them. This will immediately disqualify analyses from submittal to SWQMIS. Therefore, data with these types of problems should not be reported to the TCEQ. Additionally, any data collected or analyzed by means other than those stated in the QAPP, or data suspect for any reason should not be submitted for loading and storage in SWQMIS.
Trinity River Authority QAPP Page 31
B5 QUALITYCONTROL Sampling Quality Control Requirements and Acceptability Criteria The minimum Field QC Requirements are outlined in the TCEQ Surface Water Quality Monitoring Procedures. Specific requirements are outlined below. Field QC sample results are submitted with the laboratory data report (see Section A9.). Field blank - Field blanks are required for total metals-in-water samples when collected without sample equipment (i.e., as direct grab samples). A field blank is prepared in the field by filling a clean container with pure deionized water and appropriate preservative, if any, for the specific sampling activity being undertaken. Field blanks are used to assess the contamination from field sources such as airborne materials, containers, and preservatives. Field blanks will be collected on a 10% basis, except in the case of TRWD which will collect them on a 5% basis as needed. The analysis of field blanks should yield values lower than the LOQ. When target analyte concentrations are high, blank values should be lower than 5% of the lowest value of the batch. Field equipment blank - Field equipment blanks are required for metals-in-water samples when collected using sampling equipment. A field equipment blank is a sample of analyte-free media which has been used to rinse common sampling equipment to check the effectiveness of decontamination procedures. It is collected in the same type of container as the environmental sample, preserved in the same manner and analyzed for the same parameter. Field equipment blanks will be collected at the last site of the day for each day of sampling or on a 10% basis with the exceptions of the City of Arlington and TRWD. The City of Arlington will only collect a field equipment blank at one site during each quarterly sampling event and TRWD will collect them on a 5% basis. The analysis of field equipment blanks should yield values lower than the LOQ, or, when target analyte concentrations are very high, blank values must be less than 5% of the lowest value of the batch, or corrective action will be implemented. Field Split - A field split is a single sample subdivided by field staff immediately following collection and submitted to the laboratory as two separately identified samples according to procedures specified in the SWQM Procedures. Split samples are preserved, handled, shipped, and analyzed identically and are used to assess variability in all of these processes. Field splits apply to conventional samples only. To the extent possible, field splits prepared and analyzed over the course of the project should be performed on samples from different sites. Field splits are collected on a 10% basis except as noted above for the City of Arlington and TRWD. The precision of field split results is calculated by relative percent difference (RPD) using the following equation:
RPD = |(X1 - X2)/{(X1+X2)/2} * 100| A 30% RPD criteria will be used to screen field split results as a possible indicator of excessive variability in the sample handling and analytical system. If it is determined that elevated quantities of analyte (i.e., > 5 times the LOQ) were measured and analytical variability can be eliminated as a factor, than variability in field split results will primarily be used as a trigger for discussion with field
Trinity River Authority QAPP Page 32
staff to ensure samples are being handled in the field correctly. Some individual sample results may be invalidated based on the examination of all extenuating information. The information derived from field splits is generally considered to be event specific and would not normally be used to determine the validity of an entire batch; however, some batches of samples may be invalidated depending on the situation. Professional judgment during data validation will be relied upon to interpret the results and take appropriate action. The qualification (i.e., invalidation) of data will be documented on the Data Summary. Deficiencies will be addressed as specified in this section under Quality Control or Acceptability Requirements Deficiencies and Corrective Actions. Laboratory Measurement Quality Control Requirements and Acceptability Criteria Batch – A batch is defined as environmental samples that are prepared and/or analyzed together with the same process and personnel, using the same lot(s) of reagents. A preparation batch is composed of one to 20 environmental samples of the same NELAP-defined matrix, meeting the above mentioned criteria and with a maximum time between the start of processing of the first and last sample in the batch to be 25 hours. An analytical batch is composed of prepared environmental samples (extract, digestates or concentrates) which are analyzed together as a group. An analytical batch can include prepared samples originating from various environmental matrices and can exceed 20 samples. Method Specific QC requirements – QC samples, other than those specified later this section, are run (e.g., sample duplicates, surrogates, internal standards, continuing calibration samples, interference check samples, positive control, negative control, and media blank) as specified in the methods. The requirements for these samples, their acceptance criteria or instructions for establishing criteria, and corrective actions are method-specific. Detailed laboratory QC requirements and corrective action procedures are contained within the individual laboratory quality manuals (QMs). The minimum requirements that all participants abide by are stated below. Limit of Quantitation (LOQ) – The laboratory will analyze a calibration standard (if applicable) at the LOQs published in Appendix A on each day calibrations are performed. In addition, an LOQ check sample will be analyzed with each analytical batch. Calibrations including the standard at the LOQs listed in the tables in Appendix A will meet the calibration requirements of the analytical method or corrective action will be implemented. LOQ Check Sample – An LOQ check sample consists of a sample matrix (e.g., deionized water, sand, commercially available tissue) free from the analytes of interest spiked with verified known amounts of analytes or a material containing known and verified amounts of analytes. It is used to establish intra-laboratory bias to assess the performance of the measurement system at the lower limits of analysis. The LOQ check sample is spiked into the sample matrix at a level less than or near the LOQs published in in the tables in Appendix A for each analyte for each analytical batch of CRP samples run. If it is determined that samples have exceeded the high range of the calibration curve, samples should be diluted or run on another curve. For samples run on batches with calibration curves that do not include the LOQs published in the tables in Appendix A, a check sample will be run at the low end of the calibration curve. The LOQ check sample is carried through the complete preparation and analytical process. LOQ Check Samples are run at a rate of one per analytical batch.
Trinity River Authority QAPP Page 33
The percent recovery of the LOQ check sample is calculated using the following equation in which %R is percent recovery, SR is the sample result, and SA is the reference concentration for the check sample:
%R = SR/SA * 100 Measurement performance specifications are used to determine the acceptability of LOQ Check Sample analyses as specified in the tables in Appendix A. Laboratory Control Sample (LCS) - An LCS consists of a sample matrix (e.g., deionized water, sand, commercially available tissue) free from the analytes of interest spiked with verified known amounts of analytes or a material containing known and verified amounts of analytes. It is used to establish intra-laboratory bias to assess the performance of the measurement system. The LCS is spiked into the sample matrix at a level less than or near the mid-point of the calibration for each analyte. In cases of test methods with very long lists of analytes, LCSs are prepared with all the target analytes and not just a representative number, except in cases of organic analytes with multipeak responses. The LCS is carried through the complete preparation and analytical process. LCSs are run at a rate of one per preparation batch. Results of LCSs are calculated by percent recovery (%R), which is defined as 100 times the measured concentration, divided by the true concentration of the spiked sample. The following formula is used to calculate percent recovery, where %R is percent recovery; SR is the measured result; and SA is the true result:
%R = SR/SA * 100 Measurement performance specifications are used to determine the acceptability of LCS analyses as specified in the tables in Appendix A. Laboratory Duplicates – A laboratory duplicate is an aliquot taken from the same container as an original sample under laboratory conditions and processed and analyzed independently. A laboratory control sample duplicate (LCSD) is prepared in the laboratory by splitting aliquots of an LCS. Both samples are carried through the entire preparation and analytical process. LCSDs are used to assess precision and are performed at a rate of one per preparation batch. For most parameters except bacteria, precision is evaluated by the relative percent difference (RPD) between duplicate LCS results as defined by 100 times the difference (range) of each duplicate set, divided by the average value (mean) of the set. For duplicate results, X1 and X2, the RPD is calculated from the following equation:
RPD = |(X1 - X2)/{(X1+X2)/2} * 100| For bacteriological parameters, precision is evaluated using the results from laboratory duplicates. Bacteriological duplicates are collected on a 10% frequency (or once per sampling run, whichever is
Trinity River Authority QAPP Page 34
more frequent). These duplicates will be collected in sufficient volume (200 mL or more) for analysis of the sample and its laboratory duplicate from the same container. The base-10 logarithms of the result from the original sample and the result from its duplicate will be calculated. The absolute value of the difference between the two logarithms will be calculated, and that difference will be compared to the precision criterion in the tables in Appendix A. If the difference in logarithms is greater than the precision criterion, the data are not acceptable for use under this project and will not be reported to TCEQ. Results from all samples associated with that failed duplicate (usually a maximum of 10 samples) will be considered to have excessive analytical variability and will be qualified as not meeting project QC requirements. The precision criterion in the tables in Appendix A for bacteriological duplicates applies only to samples with concentrations >10 MPN/100mL. Field splits will not be collected for bacteriological analyses. TRA WBPA’s may collect samples in a 100mL container that will be split at the laboratory and diluted. The samples and laboratory duplicates will be run on the diluted samples and the LOQ will be increased by the dilution factor. Laboratory equipment blank - Laboratory equipment blanks are prepared at the laboratory where collection materials for metals sampling equipment are cleaned between uses. These blanks document that the materials provided by the laboratory are free of contamination. The QC check is performed before the metals sampling equipment is sent to the field. The analysis of laboratory equipment blanks should yield values less than the LOQ. Otherwise, the equipment should not be used. Matrix spike (MS) – Matrix spikes are prepared by adding a known mass of target analyte to a specified amount of matrix sample for which an independent estimate of target analyte concentration is available. Matrix spikes indicate the effect of the sample on the precision and accuracy of the results generated using the selected method. The frequency of matrix spikes is specified by the analytical method, or a minimum of one per preparation batch, whichever is greater. To the extent possible, matrix spikes prepared and analyzed over the course of the project should be performed on samples from different sites. The components to be spiked shall be as specified by the mandated analytical method. The results from matrix spikes are primarily designed to assess the validity of analytical results in a given matrix, and are expressed as percent recovery (%R). The percent recovery of the matrix spike is calculated using the following equation, where %R is percent recovery, SSR is the concentration measured in the matrix spike, SR is the concentration in the unspiked sample, and SA is the concentration of analyte that was added:
%R= (SSR-SR)/SA*100 Matrix spike recoveries are compared to the acceptance criteria published in the mandated test method. If the matrix spike results are outside established criteria, the data for the analyte that failed in the parent sample is not acceptable for use under this project and will not be reported to TCEQ. The result from the parent sample associated with that failed matrix spike will be considered to have excessive analytical variability and will be qualified by the laboratory as not meeting project QC requirements. Depending on
Trinity River Authority QAPP Page 35
the similarities in composition of the samples in the batch, the TRA may consider excluding all of the results in the batch related to the analyte that failed recovery. Method blank –A method blank is a sample of matrix similar to the batch of associated samples (when available) that is free from the analytes of interest and is processed simultaneously with and under the same conditions as the samples through all steps of the analytical procedures, and in which no target analytes or interferences are present at concentrations that impact the analytical results for sample analyses. The method blanks are performed at a rate of once per preparation batch. The method blank is used to document contamination from the analytical process. The analysis of method blanks should yield values less than the LOQ. For very high-level analyses, the blank value should be less than 5% of the lowest value of the batch, or corrective action will be implemented. Samples associated with a contaminated blank shall be evaluated as to the best corrective action for the samples (e.g. reprocessing or data qualifying codes). In all cases the corrective action must be documented. The method blank shall be analyzed at a minimum of one per preparation batch. In those instances for which no separate preparation method is used (example: volatiles in water) the batch shall be defined as environmental samples that are analyzed together with the same method and personnel, using the same lots of reagents, not to exceed the analysis of 20 environmental samples. Quality Control or Acceptability Requirements Deficiencies and Corrective Actions Sampling QC excursions are evaluated by the TRA Project Manager, in consultation with the TRA QAO. In that differences in sample results are used to assess the entire sampling process, including environmental variability, the arbitrary rejection of results based on pre-determined limits is not practical. Therefore, the professional judgment of the TRA Project Manager and QAO will be relied upon in evaluating results. Rejecting sample results based on wide variability is a possibility. Field blanks for trace elements and trace organics are scrutinized very closely. Field blank values exceeding the acceptability criteria may automatically invalidate the sample, especially in cases where high blank values may be indicative of contamination which may be causal in putting a value above the standard. Notations of field split excursions and blank contamination are noted in the quarterly report and the final QC Report. Equipment blanks for metals analysis are also scrutinized very closely. Laboratory measurement quality control failures are evaluated by the laboratory staff. The disposition of such failures and the nature and disposition of the problem is reported to the TRA or WBPA Laboratory QAO. The Laboratory QAO will discuss with the TRA Project Manager. If applicable, the TRA Project Manager will include this information in the CAP and submit with the Progress Report which is sent to the TCEQ CRP Project Manager. The definition of and process for handling deficiencies and corrective action are defined in Section C1.
Trinity River Authority QAPP Page 36
B6 INSTRUMENT/EQUIPMENTTESTING,INSPECTIONANDMAINTENANCE All sampling equipment testing and maintenance requirements are detailed in the TCEQ Surface Water Quality Monitoring Procedures. Sampling equipment is inspected and tested upon receipt and is assured appropriate for use. Equipment records are kept on all field equipment and a supply of critical spare parts is maintained. All laboratory tools, gauges, instrument, and equipment testing and maintenance requirements are contained within laboratory QM(s).
Trinity River Authority QAPP Page 37
B7 INSTRUMENTCALIBRATIONANDFREQUENCY Field equipment calibration requirements are contained in the TCEQ Surface Water Quality Monitoring Procedures. Post-calibration error limits and the disposition resulting from error are adhered to. Data not meeting post-error limit requirements invalidate associated data collected subsequent to the pre-calibration and are not submitted to the TCEQ. Detailed laboratory calibrations are contained within the QM(s).
Trinity River Authority QAPP Page 38
B8 INSPECTION/ACCEPTANCEOFSUPPLIESANDCONSUMABLES Supplies and consumables which affect the quality of the sampling and analysis programs are specified and approved for use by the appropriate WBPA or TRA Project Managers. Those items include, but are not limited to: sample bottles, calibration gases, reagents, hoses, materials for decontamination of sampling equipment, deionized water, and potable water. Sample containers are either new and purchased precleaned to EPA specifications, or are cleaned to appropriate specifications by the laboratory. Calibration gases are purchased having known concentrations, and the documentation is maintained on file by the WBPA or TRA Project managers. Reagents are analytical grade or better. Hoses and sampling equipment are made of impervious materials that are suited for the materials being sampled. Deionized water is used for rinsing sampling equipment between samples, is typically obtained from the laboratory, and is shown to be free of contamination through daily conductivity testing; monthly bacteria, pH, and residual Chlorine testing; and annual heavy metals testing. Refer to the laboratory QMs for all laboratory related items.
Trinity River Authority QAPP Page 39
B9 NON‐DIRECTMEASUREMENTS The following non-direct measurement source(s) will be used for this project: USGS gage station data will be used throughout the project to aid in determining gage height and flow. Rigorous QA checks are completed on gage data by the USGS and the data is approved by the USGS and permanently stored at the USGS. This data will be submitted to the TCEQ under parameter code 00061 Flow, Instantaneous or parameter 74069 Flow Estimate depending on the proximity of the monitoring station to the USGS gage station.
Trinity River Authority QAPP Page 40
B10 DATAMANAGEMENT Data Management Protocols are addressed in the TRA CRP Data Management Plan which is located in Appendix F of this document. Data will be managed in accordance with the TCEQ Surface Water Quality Monitoring Data Management Reference Guide and applicable TRA information resource management policies (as described in Appendix F). Global Positioning System (GPS) equipment may be used as a component of the information required by the Station Location (SLOC) request process for creating the certified positional data that will ultimately be entered into the TCEQ’s SWQMIS database. Positional data obtained by the Clean Rivers Program grantees using a Global Positioning System will follow the TCEQ’s OPP 8.11 and 8.12 policy regarding the collection and management of positional data. All positional data entered into SWQMIS will be collected by a GPS certified individual with an agency approved GPS device to ensure that the agency receives reliable and accurate positional data. Certification can be obtained in any of three ways: completing a TCEQ training class, completing a suitable training class offered by an outside vendor, or by providing documentation of sufficient GPS expertise and experience. Contractors must agree to adhere to relevant TCEQ policies when entering GPS-collected data. In lieu of entering certified GPS coordinates, positional data may be acquired with a GPS and verified with photo interpolation using a certified source, such as Google Earth or Google Maps. The verified coordinates and map interface can then be used to develop a new station location. In lieu of entering certified GPS coordinates, positional data may be acquired with a GPS and verified with photo interpolation using a certified source, such as Google Earth or Google Maps. The verified coordinates and map interface can then be used to develop a new station location.
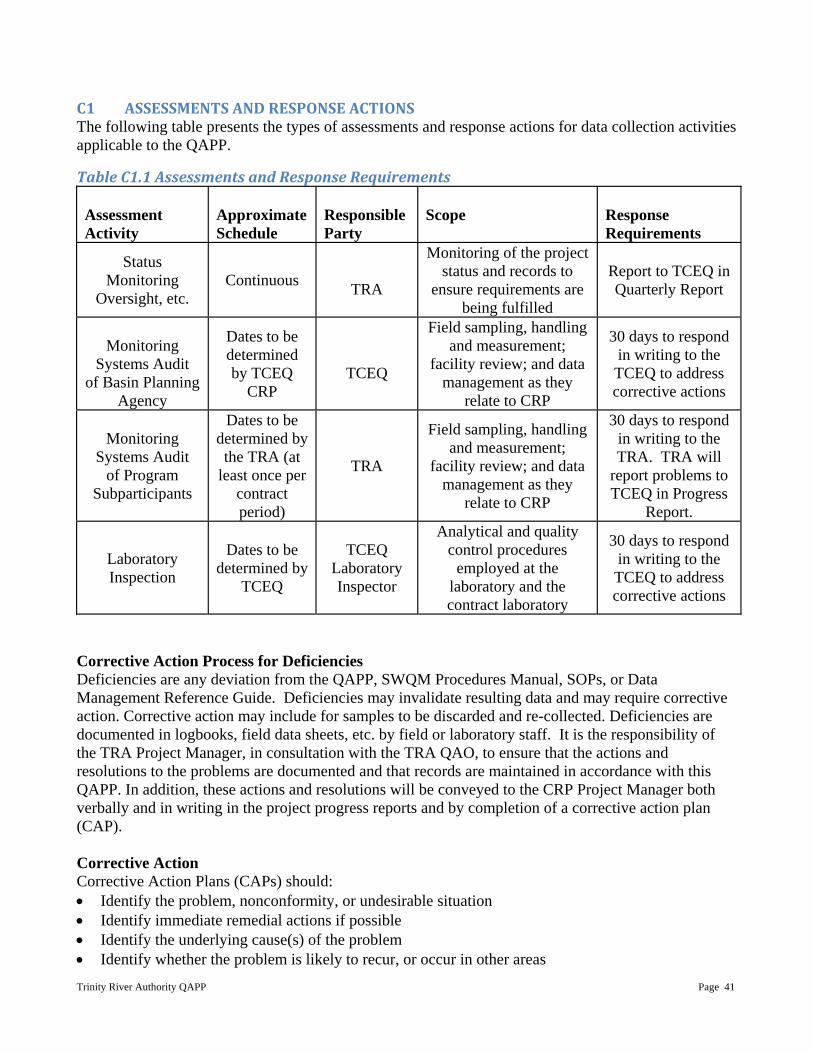
Trinity River Authority QAPP Page 41
C1 ASSESSMENTSANDRESPONSEACTIONSThe following table presents the types of assessments and response actions for data collection activities applicable to the QAPP.
TableC1.1AssessmentsandResponseRequirements Assessment Activity
Approximate Schedule
Responsible Party
Scope
Response Requirements
Status Monitoring
Oversight, etc. Continuous
TRA
Monitoring of the project status and records to
ensure requirements are being fulfilled
Report to TCEQ in Quarterly Report
Monitoring
Systems Audit of Basin Planning
Agency
Dates to be determined by TCEQ
CRP
TCEQ
Field sampling, handling and measurement;
facility review; and data management as they
relate to CRP
30 days to respond in writing to the TCEQ to address corrective actions
Monitoring Systems Audit
of Program Subparticipants
Dates to be determined by the TRA (at
least once per contract period)
TRA
Field sampling, handling and measurement;
facility review; and data management as they
relate to CRP
30 days to respond in writing to the TRA. TRA will
report problems to TCEQ in Progress
Report.
Laboratory Inspection
Dates to be determined by
TCEQ
TCEQ Laboratory Inspector
Analytical and quality control procedures
employed at the laboratory and the contract laboratory
30 days to respond in writing to the TCEQ to address corrective actions
Corrective Action Process for Deficiencies Deficiencies are any deviation from the QAPP, SWQM Procedures Manual, SOPs, or Data Management Reference Guide. Deficiencies may invalidate resulting data and may require corrective action. Corrective action may include for samples to be discarded and re-collected. Deficiencies are documented in logbooks, field data sheets, etc. by field or laboratory staff. It is the responsibility of the TRA Project Manager, in consultation with the TRA QAO, to ensure that the actions and resolutions to the problems are documented and that records are maintained in accordance with this QAPP. In addition, these actions and resolutions will be conveyed to the CRP Project Manager both verbally and in writing in the project progress reports and by completion of a corrective action plan (CAP). Corrective Action Corrective Action Plans (CAPs) should: • Identify the problem, nonconformity, or undesirable situation • Identify immediate remedial actions if possible • Identify the underlying cause(s) of the problem • Identify whether the problem is likely to recur, or occur in other areas
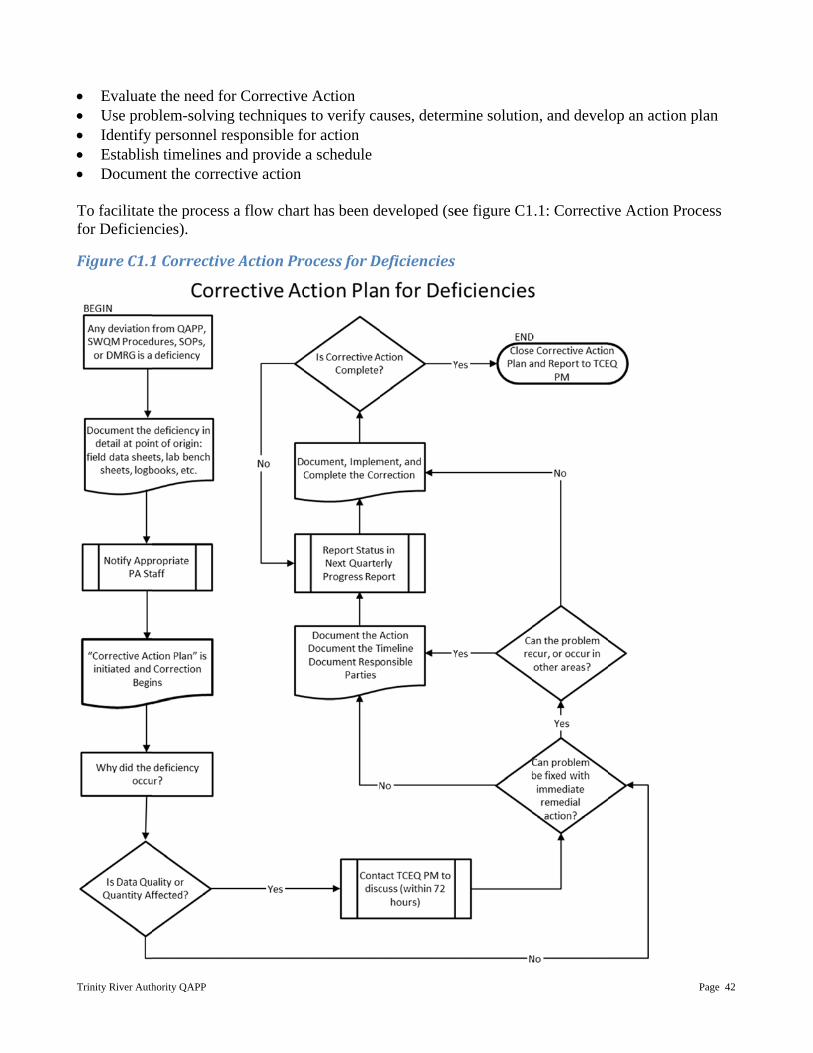
Trinity River Auth
• Evaluate• Use prob• Identify • Establish• Docume To facilitatefor Deficien
FigureC1.1
hority QAPP
e the need foblem-solvingpersonnel reh timelines aent the correc
e the processncies).
1Corrective
or Correctiveg techniquesesponsible foand provide ctive action
s a flow char
eActionPr
e Action s to verify cafor action a schedule
rt has been d
rocessforD
auses, determ
developed (se
Deficiencies
mine solution
ee figure C1
n, and devel
.1: Correctiv
op an action
ve Action Pr
Page 42
n plan
rocess
Trinity River Authority QAPP Page 43
Status of Corrective Action Plans will be included with quarterly progress reports. In addition, significant conditions (i.e., situations which, if uncorrected, could have a serious effect on safety or on the validity or integrity of data) will be reported to the TCEQ immediately. The TRA Project Manager is responsible for implementing and tracking corrective actions. Records of audit findings and corrective actions are maintained by the TRA Project Manager. Audit reports and corrective action documentation will be submitted to the TCEQ with the Progress Report. If audit findings and corrective actions cannot be resolved, then the authority and responsibility for terminating work are specified in the TCEQ QMP and in agreements in contracts between participating organizations.
Trinity River Authority QAPP Page 44
C2 REPORTSTOMANAGEMENT Reports to TRA Project Management WBPAs routinely submit water quality data and associated information such as field data sheets, chain of custody forms and data management checklists to TRA CRP staff. The frequency of submittals from the WBPAs to TRA ranges from monthly to annually based on the entity. In most cases, data transmittals include both field and laboratory quality assurance information (e.g. results of field and laboratory duplicate analyses). Copies of combination field data sheets/chain of custody forms are made upon submittal of samples to TRA CRWS laboratory, and are forwarded to TRA CRP staff with lab data reports or are given directly to TRA CRP staff. Field data sheets are not obtained from TRWD, LLP, the City of Fort Worth, or the City of Dallas, but are available upon request from those entities. TRWD submits field and lab data in Excel format along with hardcopy lab QC information. CRWS submits lab data and lab QC information in both CSV format and in hardcopy for TRA, the City of Dallas metals, the City of Grand Prairie, the City of Irving, the City of Arlington conventionals and bacteria, and LLP TKN. The City of Fort Worth sends field and lab data and lab QC data in Excel format. The Cities of Grand Prairie and Irving submit their Field Data Sheets/COC Forms in hardcopy and Excel format. The City of Dallas sends field results in Excel format. The City of Arlington submits their Field Data Sheets/COC Forms in hardcopy and Excel format and the metals results and lab QC in both Excel format and hardcopy. Reports to TCEQ Project Management All reports detailed in this section are contract deliverables and are transferred to the TCEQ in accordance with contract requirements. Progress Report - Summarizes the TRA’s activities for each task; reports monitoring status, problems, delays, and status of corrective actions; and outlines the status of each task’s deliverables. Monitoring Systems Audit Report and Response - Following any audit performed by the TRA, a report of findings, recommendations and response is sent to the TCEQ in the quarterly progress report. Data Summary – Contains basic identifying information about the data set and comments regarding inconsistencies and errors identified during data verification and validation steps or problems with data collection efforts (e.g. Deficiencies). Reports by TCEQ Project Management Contractor Evaluation - The TRA participates in a Contractor Evaluation by the TCEQ annually for compliance with administrative and programmatic standards. Results of the evaluation are submitted to the TCEQ Financial Administration Division, Procurement and Contracts Section.
Trinity River Authority QAPP Page 45
D1 DATAREVIEW,VERIFICATION,ANDVALIDATION All field and laboratory data will be reviewed and verified for integrity and continuity, reasonableness, and conformance to project requirements, and then validated against the project objectives and measurement performance specifications which are listed in Section A7. Only those data which are supported by appropriate quality control data and meet the measurement performance specifications defined for this project will be considered acceptable, and will be reported to the TCEQ for entry into SWQMIS.
Trinity River Authority QAPP Page 46
D2 VERIFICATIONANDVALIDATIONMETHODS All field and laboratory data will be reviewed, verified and validated to ensure they conform to project specifications and meet the conditions of end use as described in Section A7 of this document. Data review, verification, and validation will be performed using self-assessments and peer and management review as appropriate to the project task. The data review tasks to be performed by field and laboratory staff are listed in Figures D2.1 and D2.2, respectively. Potential errors are identified by examination of documentation and by manual and/or computer-assisted examination of corollary or unreasonable data. If a question arises or an error is identified, the manager of the task responsible for generating the data is contacted to resolve the issue. Issues which can be corrected are corrected and documented. If an issue cannot be corrected, the task manager consults with the higher level project management to establish the appropriate course of action, or the data associated with the issue are rejected and not reported to the TCEQ for storage in SWQMIS. Field and laboratory reviews, verifications, and validations are documented. After the field and laboratory data are reviewed, another level of review is performed once the data are combined into a data set. This review step as specified in Figure D2.3 is performed by the TRA Data Manager and QAO. Data review, verification, and validation tasks to be performed on the data set include, but are not limited to, the confirmation of laboratory and field data review, evaluation of field QC results, additional evaluation of anomalies and outliers, analysis of sampling and analytical gaps, and confirmation that all parameters and sampling sites are included in the QAPP. The Data Review Checklist (See Appendix E) covers three main types of review: data format and structure, data quality review, and documentation review. The Data Review Checklist is transferred with the water quality data submitted to the TCEQ to ensure that the review process is being performed. Another element of the data validation process is consideration of any findings identified during the monitoring systems audit conducted by the TCEQ CRP Lead Quality Assurance Specialist. Any issues requiring corrective action must be addressed, and the potential impact of these issues on previously collected data will be assessed. After the data are reviewed and documented, the TRA Project Manager validates that the data meet the data quality objectives of the project and are suitable for reporting to TCEQ. If any requirements or specifications of the CRP are not met, based on any part of the data review, the responsible party should document the nonconforming activities and submit the information to the TRA Data Manager with the data. This information is communicated to the TCEQ by the TRA in the Data Summary (See Appendix E).
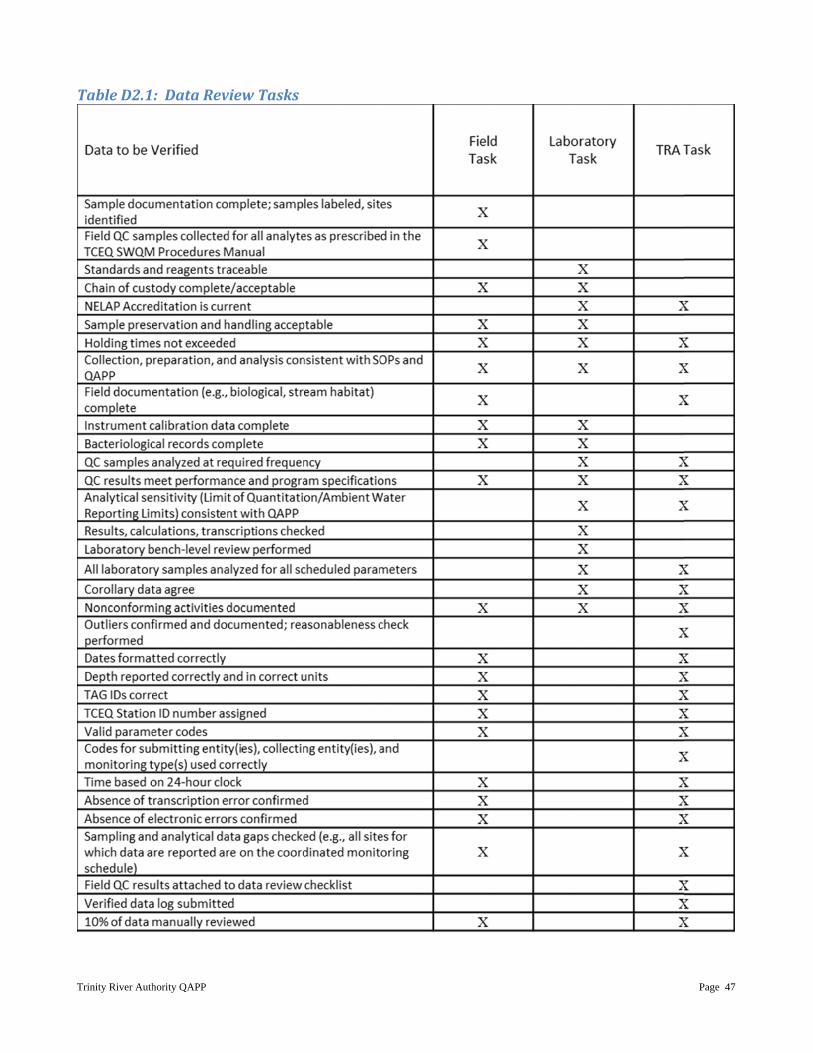
Trinity River Auth
TableD2.1
hority QAPP
:DataRevviewTasks
Page 47
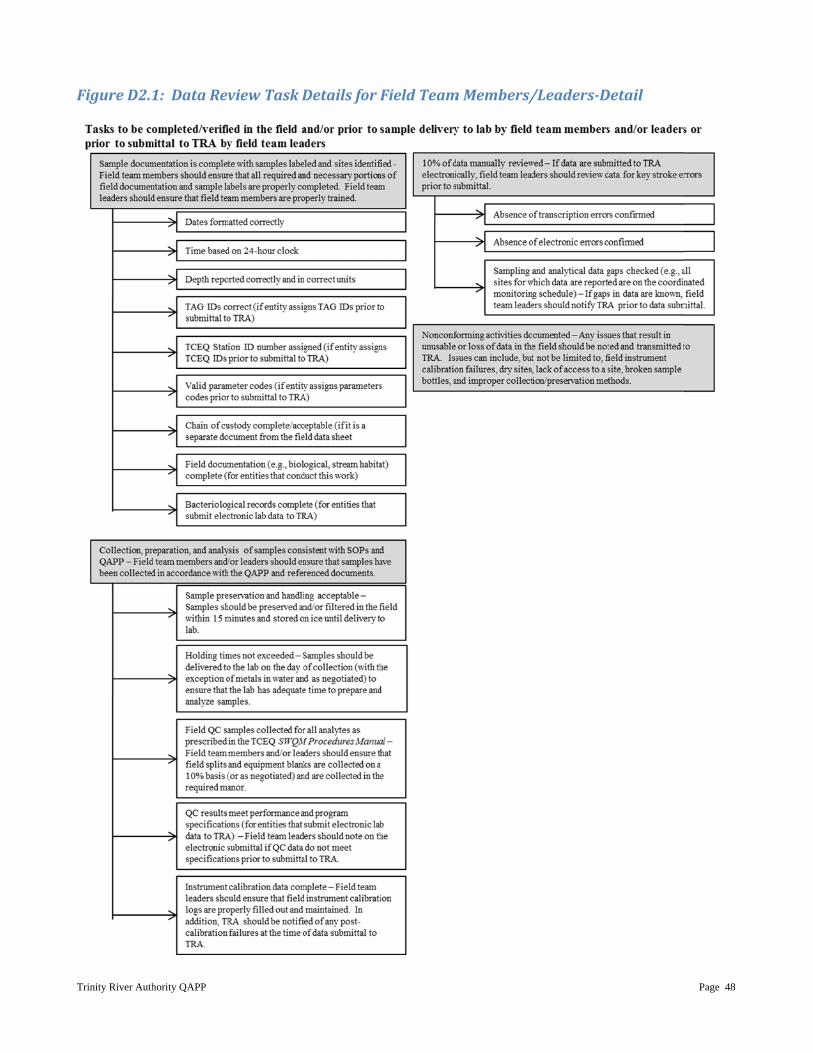
Trinity River Auth
FigureD2.1
hority QAPP
1:DataRevviewTaskD
DetailsforFFieldTeammMembers//Leaders‐DDetail
Page 48
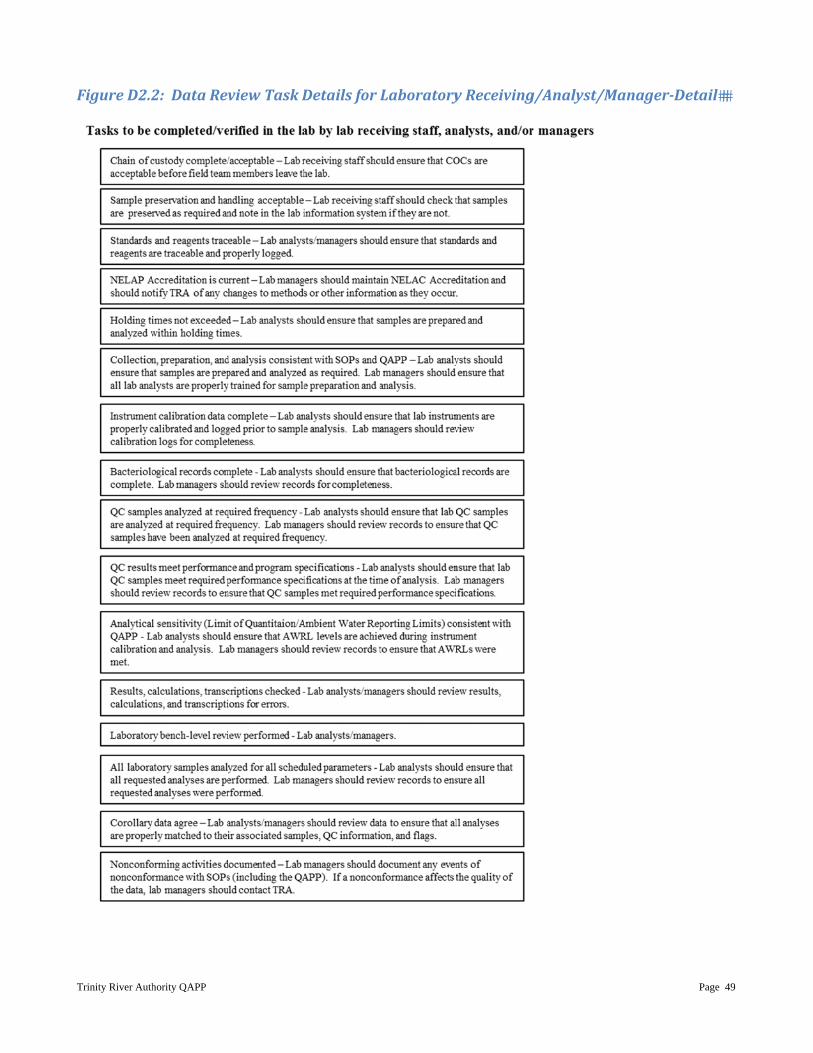
Trinity River Auth
FigureD2.2
hority QAPP
2:DataRevviewTaskD
DetailsforLLaboratoryyReceivingg/Analyst/MManager‐D
Page 49
Detail���
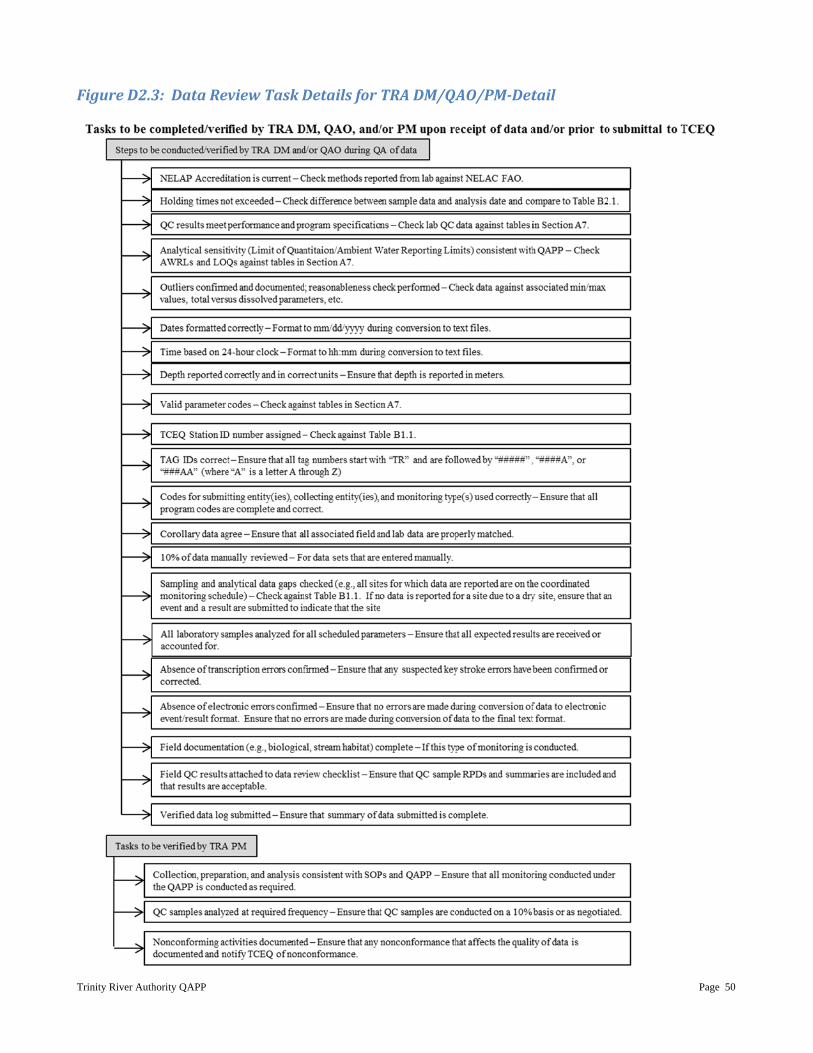
Trinity River Auth
FigureD2.3
hority QAPP
3:DataRevviewTaskDDetailsforTRADM/QAAO/PM‐Dettail
Page 50
Trinity River Authority QAPP Page 51
D3 RECONCILIATIONWITHUSERREQUIREMENTS Data produced in this project, and data collected by other organizations (e.g., USGS, TCEQ, etc.), will be analyzed and reconciled with project data quality requirements. Data meeting project requirements will be used by the TCEQ for the Texas Water Quality Integrated Report in accordance with TCEQ's Guidance for Assessing Texas Surface and Finished Drinking Water Quality Data, and for TMDL development, water quality standards development, and permit decisions as appropriate. Data which do not meet requirements will not be submitted to SWQMIS nor will be considered appropriate for any of the uses noted above.
Trinity River Authority QAPP Page 52
APPENDIX A: MEASUREMENT PERFORMANCE SPECIFICATIONS (TABLES A7.1 TO A7.8)
Trinity River Authority QAPP Page 53
Measurement performance specifications define the data quality needed to satisfy project objectives. To this end, measurement performance specifications are qualitative and quantitative statements that: • clarify the intended use of the data • define the type of data needed to support the end use • identify the conditions under which the data should be collected Appendix A of the QAPP addresses measurement performance specifications, including: • analytical methodologies • AWRLs • limits of quantitation • bias limits for laboratory control samples • precision limits for laboratory control sample duplicates • completeness goals • qualitative statements regarding representativeness and comparability
The items identified above need to be considered for each type of monitoring activity. The CRP emphasizes that data should be collected to address multiple objectives, if possible, thereby maximizing the expenditure of resources. Caution should be applied when attempting to collect data for multiple purposes because measurement performance specifications may vary according to the purpose. For example, limits of quantitation may differ for data used to assess standards attainment and for trend analysis. When planning projects, first priority should be given to the main use of the project data and the data quality needed to support that use, then secondary goals should be considered. Tables A7.1 to A7.8 should be modified to reflect actual parameters, methods, etc. employed by the TRA and its participants. Alternative methods than those listed in the following table may be used. Procedures for laboratory analysis must be in accordance with the most recently published edition of Standard Methods for the Examination of Water and Wastewater, 40 CFR 136, or otherwise approved independently. Only data collected that have a valid TCEQ parameter code assigned in Tables A7.1 to A7.8 are stored in SWQMIS. Any parameters listed in Tables A7.1 to A7.8 that do not have a valid TCEQ parameter code assigned will not be stored in SWQMIS. Based on a general review of available information regarding achievable recoveries of additional parameters, use the following bias limits (percent recovery of the LCS and LOQ Check Sample) in Tables A7.1 to A7.8: metals-in solid samples (i.e., sediment and tissue) 60-140%; organics-in-water samples 65-135%; organics-in-solid samples (i.e., sediment and tissue) 40-160%. There may be poor performing analytes within these groups that do not perform well with specific methods and usually recover poorly. Before these compounds are included in the list of analytes to be submitted to the TCEQ, the TRA should discuss the situation with the TCEQ and we will discuss if they are project-specific analytes of concern, if low recoveries are acceptable or alternative methods should be run.
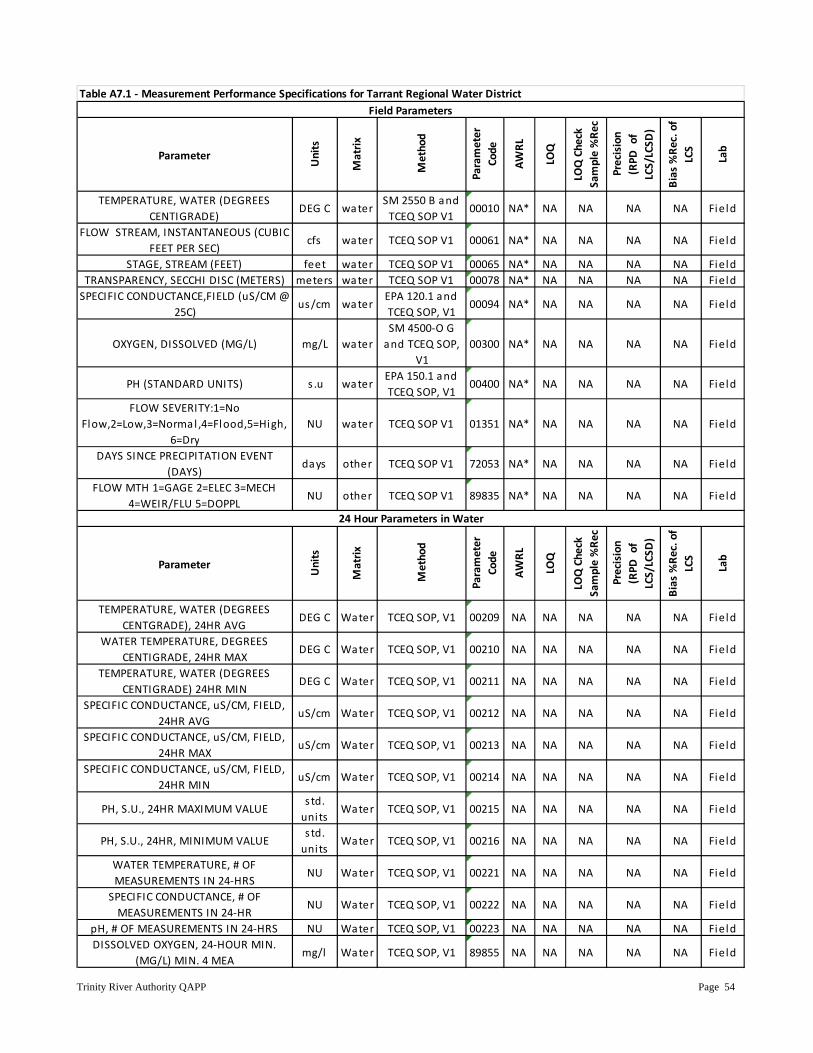
Trinity River Authority QAPP Page 54
Parameter
Units
Matrix
Method
Parameter
Code
AWRL
LOQ
LOQ Check
Sample %Re
c
Precision
(RPD
of
LCS/LCSD
)
Bias %Re
c. of
LCS
Lab
TEMPERATURE, WATER (DEGREES CENTIGRADE)
DEG C waterSM 2550 B and TCEQ SOP V1
00010 NA* NA NA NA NA Field
FLOW STREAM, INSTANTANEOUS (CUBIC FEET PER SEC)
cfs water TCEQ SOP V1 00061 NA* NA NA NA NA Field
STAGE, STREAM (FEET) feet water TCEQ SOP V1 00065 NA* NA NA NA NA FieldTRANSPARENCY, SECCHI DISC (METERS) meters water TCEQ SOP V1 00078 NA* NA NA NA NA FieldSPECIFIC CONDUCTANCE,FIELD (uS/CM @
25C)us/cm water
EPA 120.1 and TCEQ SOP, V1
00094 NA* NA NA NA NA Field
OXYGEN, DISSOLVED (MG/L) mg/L waterSM 4500‐O G and TCEQ SOP,
V100300 NA* NA NA NA NA Field
PH (STANDARD UNITS) s .u waterEPA 150.1 and TCEQ SOP, V1
00400 NA* NA NA NA NA Field
FLOW SEVERITY:1=No Flow,2=Low,3=Normal ,4=Flood,5=High,
6=DryNU water TCEQ SOP V1 01351 NA* NA NA NA NA Field
DAYS SINCE PRECIPITATION EVENT (DAYS)
days other TCEQ SOP V1 72053 NA* NA NA NA NA Field
FLOW MTH 1=GAGE 2=ELEC 3=MECH 4=WEIR/FLU 5=DOPPL
NU other TCEQ SOP V1 89835 NA* NA NA NA NA Field
Parameter
Units
Matrix
Method
Parameter
Code
AWRL
LOQ
LOQ Check
Sample %Re
c
Precision
(RPD
of
LCS/LCSD
)
Bias %Re
c. of
LCS
Lab
TEMPERATURE, WATER (DEGREES CENTGRADE), 24HR AVG
DEG C Water TCEQ SOP, V1 00209 NA NA NA NA NA Field
WATER TEMPERATURE, DEGREES CENTIGRADE, 24HR MAX
DEG C Water TCEQ SOP, V1 00210 NA NA NA NA NA Field
TEMPERATURE, WATER (DEGREES CENTIGRADE) 24HR MIN
DEG C Water TCEQ SOP, V1 00211 NA NA NA NA NA Field
SPECIFIC CONDUCTANCE, uS/CM, FIELD, 24HR AVG
uS/cm Water TCEQ SOP, V1 00212 NA NA NA NA NA Field
SPECIFIC CONDUCTANCE, uS/CM, FIELD, 24HR MAX
uS/cm Water TCEQ SOP, V1 00213 NA NA NA NA NA Field
SPECIFIC CONDUCTANCE, uS/CM, FIELD, 24HR MIN
uS/cm Water TCEQ SOP, V1 00214 NA NA NA NA NA Field
PH, S.U., 24HR MAXIMUM VALUEstd. units
Water TCEQ SOP, V1 00215 NA NA NA NA NA Field
PH, S.U., 24HR, MINIMUM VALUEstd. units
Water TCEQ SOP, V1 00216 NA NA NA NA NA Field
WATER TEMPERATURE, # OF MEASUREMENTS IN 24‐HRS
NU Water TCEQ SOP, V1 00221 NA NA NA NA NA Field
SPECIFIC CONDUCTANCE, # OF MEASUREMENTS IN 24‐HR
NU Water TCEQ SOP, V1 00222 NA NA NA NA NA Field
pH, # OF MEASUREMENTS IN 24‐HRS NU Water TCEQ SOP, V1 00223 NA NA NA NA NA FieldDISSOLVED OXYGEN, 24‐HOUR MIN.
(MG/L) MIN. 4 MEAmg/l Water TCEQ SOP, V1 89855 NA NA NA NA NA Field
Table A7.1 ‐ Measurement Performance Specifications for Tarrant Regional Water DistrictField Parameters
24 Hour Parameters in Water
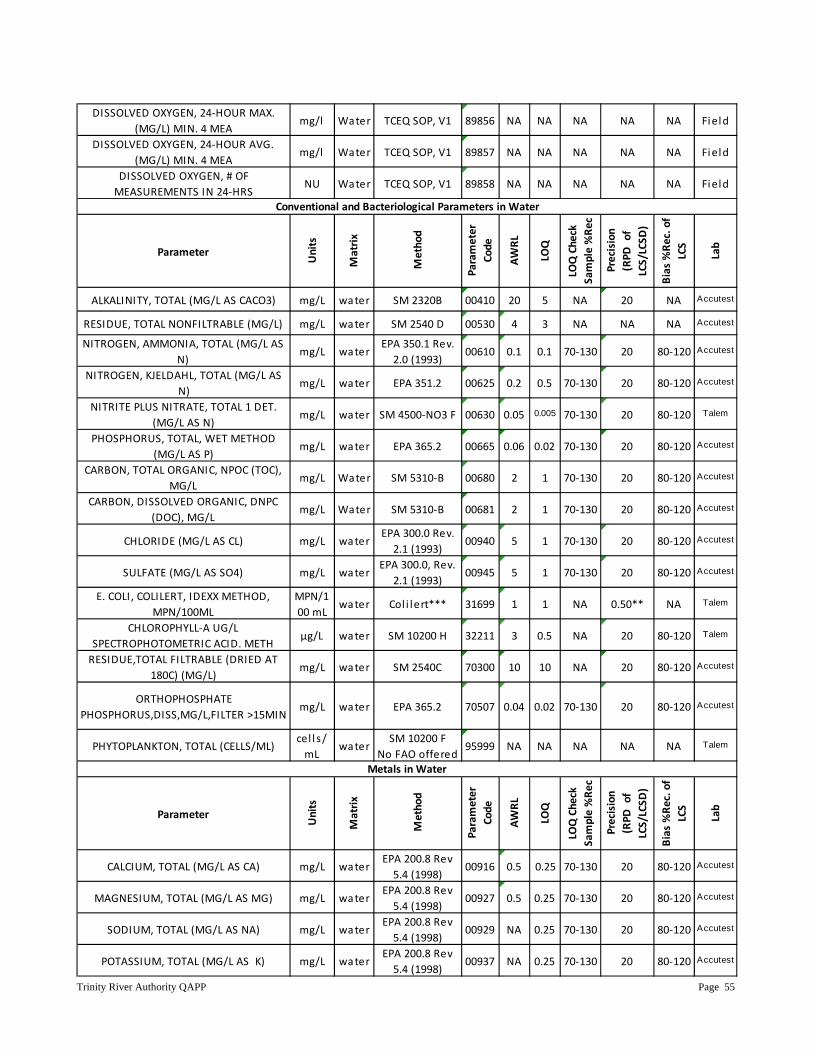
Trinity River Authority QAPP Page 55
DISSOLVED OXYGEN, 24‐HOUR MAX. (MG/L) MIN. 4 MEA
mg/l Water TCEQ SOP, V1 89856 NA NA NA NA NA Field
DISSOLVED OXYGEN, 24‐HOUR AVG. (MG/L) MIN. 4 MEA
mg/l Water TCEQ SOP, V1 89857 NA NA NA NA NA Field
DISSOLVED OXYGEN, # OF MEASUREMENTS IN 24‐HRS
NU Water TCEQ SOP, V1 89858 NA NA NA NA NA Field
Parameter
Units
Matrix
Method
Parameter
Code
AWRL
LOQ
LOQ Check
Sample %Re
c
Precision
(RPD
of
LCS/LCSD
)
Bias %Re
c. of
LCS
Lab
ALKALINITY, TOTAL (MG/L AS CACO3) mg/L water SM 2320B 00410 20 5 NA 20 NA Accutest
RESIDUE, TOTAL NONFILTRABLE (MG/L) mg/L water SM 2540 D 00530 4 3 NA NA NA Accutest
NITROGEN, AMMONIA, TOTAL (MG/L AS N)
mg/L waterEPA 350.1 Rev. 2.0 (1993)
00610 0.1 0.1 70‐130 20 80‐120 Accutest
NITROGEN, KJELDAHL, TOTAL (MG/L AS N)
mg/L water EPA 351.2 00625 0.2 0.5 70‐130 20 80‐120 Accutest
NITRITE PLUS NITRATE, TOTAL 1 DET. (MG/L AS N)
mg/L water SM 4500‐NO3 F 00630 0.05 0.005 70‐130 20 80‐120 Talem
PHOSPHORUS, TOTAL, WET METHOD (MG/L AS P)
mg/L water EPA 365.2 00665 0.06 0.02 70‐130 20 80‐120 Accutest
CARBON, TOTAL ORGANIC, NPOC (TOC), MG/L
mg/L Water SM 5310‐B 00680 2 1 70‐130 20 80‐120 Accutest
CARBON, DISSOLVED ORGANIC, DNPC (DOC), MG/L
mg/L Water SM 5310‐B 00681 2 1 70‐130 20 80‐120 Accutest
CHLORIDE (MG/L AS CL) mg/L waterEPA 300.0 Rev. 2.1 (1993)
00940 5 1 70‐130 20 80‐120 Accutest
SULFATE (MG/L AS SO4) mg/L waterEPA 300.0, Rev.
2.1 (1993)00945 5 1 70‐130 20 80‐120 Accutest
E. COLI, COLILERT, IDEXX METHOD, MPN/100ML
MPN/100 mL
water Col i lert*** 31699 1 1 NA 0.50** NA Talem
CHLOROPHYLL‐A UG/L SPECTROPHOTOMETRIC ACID. METH
μg/L water SM 10200 H 32211 3 0.5 NA 20 80‐120 Talem
RESIDUE,TOTAL FILTRABLE (DRIED AT 180C) (MG/L)
mg/L water SM 2540C 70300 10 10 NA 20 80‐120 Accutest
ORTHOPHOSPHATE PHOSPHORUS,DISS,MG/L,FILTER >15MIN
mg/L water EPA 365.2 70507 0.04 0.02 70‐130 20 80‐120 Accutest
PHYTOPLANKTON, TOTAL (CELLS/ML)cel l s /mL
waterSM 10200 F
No FAO offered95999 NA NA NA NA NA Talem
Parameter
Units
Matrix
Method
Parameter
Code
AWRL
LOQ
LOQ Check
Sample %Re
c
Precision
(RPD
of
LCS/LCSD
)
Bias %Re
c. of
LCS
Lab
CALCIUM, TOTAL (MG/L AS CA) mg/L waterEPA 200.8 Rev 5.4 (1998)
00916 0.5 0.25 70‐130 20 80‐120 Accutest
MAGNESIUM, TOTAL (MG/L AS MG) mg/L waterEPA 200.8 Rev 5.4 (1998)
00927 0.5 0.25 70‐130 20 80‐120 Accutest
SODIUM, TOTAL (MG/L AS NA) mg/L waterEPA 200.8 Rev 5.4 (1998)
00929 NA 0.25 70‐130 20 80‐120 Accutest
POTASSIUM, TOTAL (MG/L AS K) mg/L waterEPA 200.8 Rev 5.4 (1998)
00937 NA 0.25 70‐130 20 80‐120 Accutest
Conventional and Bacteriological Parameters in Water
Metals in Water
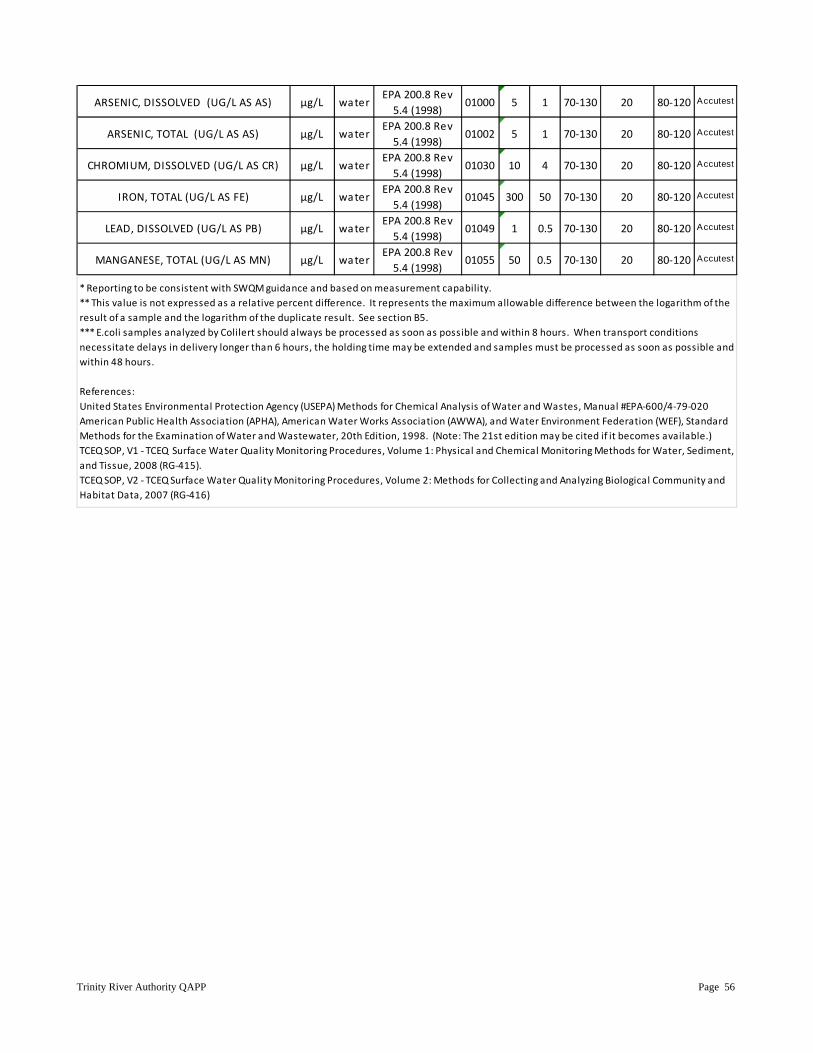
Trinity River Authority QAPP Page 56
ARSENIC, DISSOLVED (UG/L AS AS) μg/L waterEPA 200.8 Rev 5.4 (1998)
01000 5 1 70‐130 20 80‐120 Accutest
ARSENIC, TOTAL (UG/L AS AS) μg/L waterEPA 200.8 Rev 5.4 (1998)
01002 5 1 70‐130 20 80‐120 Accutest
CHROMIUM, DISSOLVED (UG/L AS CR) μg/L waterEPA 200.8 Rev 5.4 (1998)
01030 10 4 70‐130 20 80‐120 Accutest
IRON, TOTAL (UG/L AS FE) μg/L waterEPA 200.8 Rev 5.4 (1998)
01045 300 50 70‐130 20 80‐120 Accutest
LEAD, DISSOLVED (UG/L AS PB) μg/L waterEPA 200.8 Rev 5.4 (1998)
01049 1 0.5 70‐130 20 80‐120 Accutest
MANGANESE, TOTAL (UG/L AS MN) μg/L waterEPA 200.8 Rev 5.4 (1998)
01055 50 0.5 70‐130 20 80‐120 Accutest
* Reporting to be consistent with SWQM guidance and based on measurement capability. ** This value is not expressed as a relative percent difference. It represents the maximum allowable difference between the logarithm of the result of a sample and the logarithm of the duplicate result. See section B5.*** E.coli samples analyzed by Colilert should always be processed as soon as possible and within 8 hours. When transport conditions necessitate delays in delivery longer than 6 hours, the holding time may be extended and samples must be processed as soon as possible and within 48 hours.
References:United States Environmental Protection Agency (USEPA) Methods for Chemical Analysis of Water and Wastes, Manual #EPA‐600/4‐79‐020American Public Health Association (APHA), American Water Works Association (AWWA), and Water Environment Federation (WEF), Standard Methods for the Examination of Water and Wastewater, 20th Edition, 1998. (Note: The 21st edition may be cited if it becomes available.)TCEQ SOP, V1 ‐ TCEQ Surface Water Quality Monitoring Procedures, Volume 1: Physical and Chemical Monitoring Methods for Water, Sediment, and Tissue, 2008 (RG‐415).TCEQ SOP, V2 ‐ TCEQ Surface Water Quality Monitoring Procedures, Volume 2: Methods for Collecting and Analyzing Biological Community and Habitat Data, 2007 (RG‐416)
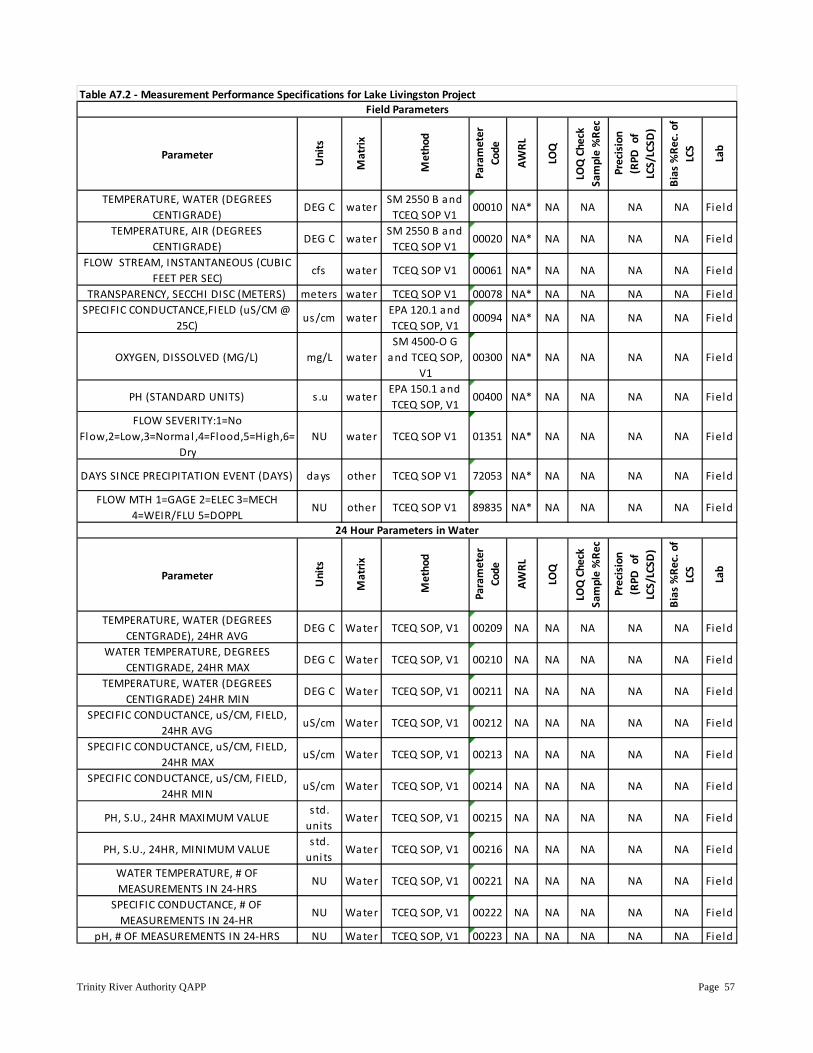
Trinity River Authority QAPP Page 57
Parameter
Units
Matrix
Method
Parameter
Code
AWRL
LOQ
LOQ Check
Sample %Re
c
Precision
(RPD
of
LCS/LCSD
)
Bias %Re
c. of
LCS
Lab
TEMPERATURE, WATER (DEGREES CENTIGRADE)
DEG C waterSM 2550 B and TCEQ SOP V1
00010 NA* NA NA NA NA Field
TEMPERATURE, AIR (DEGREES CENTIGRADE)
DEG C waterSM 2550 B and TCEQ SOP V1
00020 NA* NA NA NA NA Field
FLOW STREAM, INSTANTANEOUS (CUBIC FEET PER SEC)
cfs water TCEQ SOP V1 00061 NA* NA NA NA NA Field
TRANSPARENCY, SECCHI DISC (METERS) meters water TCEQ SOP V1 00078 NA* NA NA NA NA FieldSPECIFIC CONDUCTANCE,FIELD (uS/CM @
25C)us/cm water
EPA 120.1 and TCEQ SOP, V1
00094 NA* NA NA NA NA Field
OXYGEN, DISSOLVED (MG/L) mg/L waterSM 4500‐O G and TCEQ SOP,
V100300 NA* NA NA NA NA Field
PH (STANDARD UNITS) s .u waterEPA 150.1 and TCEQ SOP, V1
00400 NA* NA NA NA NA Field
FLOW SEVERITY:1=No Flow,2=Low,3=Normal ,4=Flood,5=High,6=
DryNU water TCEQ SOP V1 01351 NA* NA NA NA NA Field
DAYS SINCE PRECIPITATION EVENT (DAYS) days other TCEQ SOP V1 72053 NA* NA NA NA NA Field
FLOW MTH 1=GAGE 2=ELEC 3=MECH 4=WEIR/FLU 5=DOPPL
NU other TCEQ SOP V1 89835 NA* NA NA NA NA Field
Parameter
Units
Matrix
Method
Parameter
Code
AWRL
LOQ
LOQ Check
Sample %Re
c
Precision
(RPD
of
LCS/LCSD
)
Bias %Re
c. of
LCS
Lab
TEMPERATURE, WATER (DEGREES CENTGRADE), 24HR AVG
DEG C Water TCEQ SOP, V1 00209 NA NA NA NA NA Field
WATER TEMPERATURE, DEGREES CENTIGRADE, 24HR MAX
DEG C Water TCEQ SOP, V1 00210 NA NA NA NA NA Field
TEMPERATURE, WATER (DEGREES CENTIGRADE) 24HR MIN
DEG C Water TCEQ SOP, V1 00211 NA NA NA NA NA Field
SPECIFIC CONDUCTANCE, uS/CM, FIELD, 24HR AVG
uS/cm Water TCEQ SOP, V1 00212 NA NA NA NA NA Field
SPECIFIC CONDUCTANCE, uS/CM, FIELD, 24HR MAX
uS/cm Water TCEQ SOP, V1 00213 NA NA NA NA NA Field
SPECIFIC CONDUCTANCE, uS/CM, FIELD, 24HR MIN
uS/cm Water TCEQ SOP, V1 00214 NA NA NA NA NA Field
PH, S.U., 24HR MAXIMUM VALUEstd. uni ts
Water TCEQ SOP, V1 00215 NA NA NA NA NA Field
PH, S.U., 24HR, MINIMUM VALUEstd. uni ts
Water TCEQ SOP, V1 00216 NA NA NA NA NA Field
WATER TEMPERATURE, # OF MEASUREMENTS IN 24‐HRS
NU Water TCEQ SOP, V1 00221 NA NA NA NA NA Field
SPECIFIC CONDUCTANCE, # OF MEASUREMENTS IN 24‐HR
NU Water TCEQ SOP, V1 00222 NA NA NA NA NA Field
pH, # OF MEASUREMENTS IN 24‐HRS NU Water TCEQ SOP, V1 00223 NA NA NA NA NA Field
Table A7.2 ‐ Measurement Performance Specifications for Lake Livingston Project
24 Hour Parameters in Water
Field Parameters
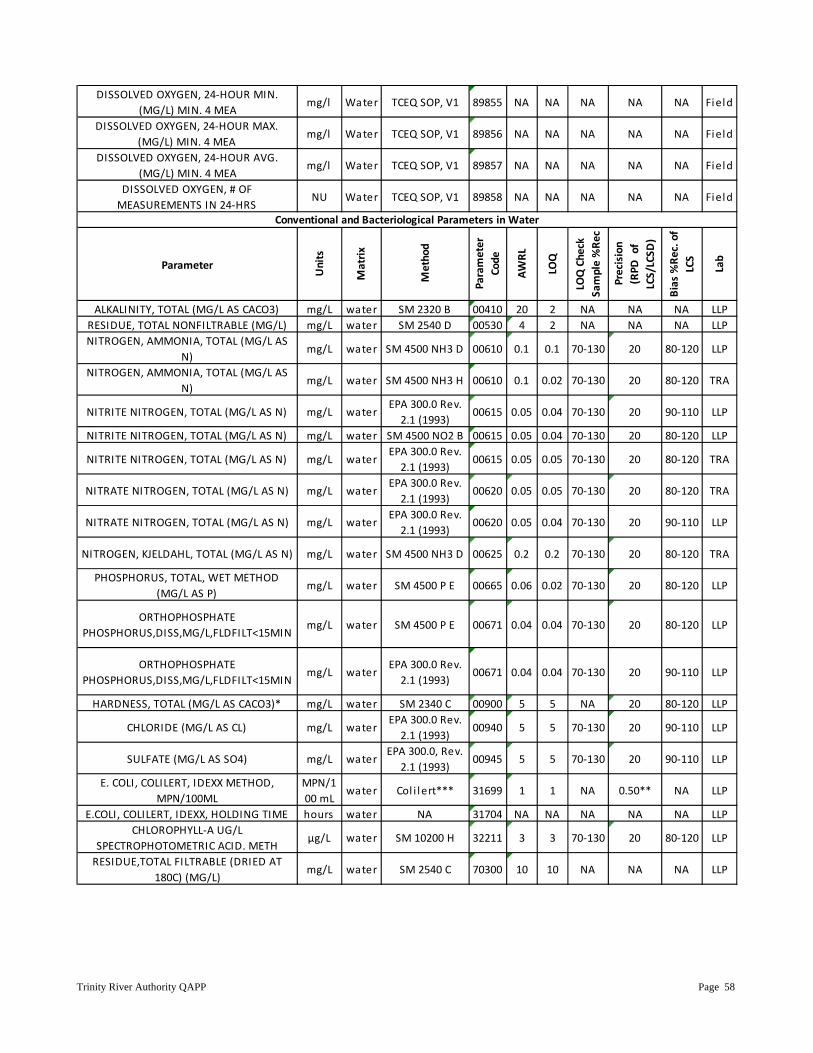
Trinity River Authority QAPP Page 58
DISSOLVED OXYGEN, 24‐HOUR MIN. (MG/L) MIN. 4 MEA
mg/l Water TCEQ SOP, V1 89855 NA NA NA NA NA Field
DISSOLVED OXYGEN, 24‐HOUR MAX. (MG/L) MIN. 4 MEA
mg/l Water TCEQ SOP, V1 89856 NA NA NA NA NA Field
DISSOLVED OXYGEN, 24‐HOUR AVG. (MG/L) MIN. 4 MEA
mg/l Water TCEQ SOP, V1 89857 NA NA NA NA NA Field
DISSOLVED OXYGEN, # OF MEASUREMENTS IN 24‐HRS
NU Water TCEQ SOP, V1 89858 NA NA NA NA NA Field
Parameter
Units
Matrix
Method
Parameter
Code
AWRL
LOQ
LOQ Check
Sample %Re
c
Precision
(RPD
of
LCS/LCSD
)
Bias %Re
c. of
LCS
Lab
ALKALINITY, TOTAL (MG/L AS CACO3) mg/L water SM 2320 B 00410 20 2 NA NA NA LLPRESIDUE, TOTAL NONFILTRABLE (MG/L) mg/L water SM 2540 D 00530 4 2 NA NA NA LLPNITROGEN, AMMONIA, TOTAL (MG/L AS
N)mg/L water SM 4500 NH3 D 00610 0.1 0.1 70‐130 20 80‐120 LLP
NITROGEN, AMMONIA, TOTAL (MG/L AS N)
mg/L water SM 4500 NH3 H 00610 0.1 0.02 70‐130 20 80‐120 TRA
NITRITE NITROGEN, TOTAL (MG/L AS N) mg/L waterEPA 300.0 Rev. 2.1 (1993)
00615 0.05 0.04 70‐130 20 90‐110 LLP
NITRITE NITROGEN, TOTAL (MG/L AS N) mg/L water SM 4500 NO2 B 00615 0.05 0.04 70‐130 20 80‐120 LLP
NITRITE NITROGEN, TOTAL (MG/L AS N) mg/L waterEPA 300.0 Rev. 2.1 (1993)
00615 0.05 0.05 70‐130 20 80‐120 TRA
NITRATE NITROGEN, TOTAL (MG/L AS N) mg/L waterEPA 300.0 Rev. 2.1 (1993)
00620 0.05 0.05 70‐130 20 80‐120 TRA
NITRATE NITROGEN, TOTAL (MG/L AS N) mg/L waterEPA 300.0 Rev. 2.1 (1993)
00620 0.05 0.04 70‐130 20 90‐110 LLP
NITROGEN, KJELDAHL, TOTAL (MG/L AS N) mg/L water SM 4500 NH3 D 00625 0.2 0.2 70‐130 20 80‐120 TRA
PHOSPHORUS, TOTAL, WET METHOD (MG/L AS P)
mg/L water SM 4500 P E 00665 0.06 0.02 70‐130 20 80‐120 LLP
ORTHOPHOSPHATE PHOSPHORUS,DISS,MG/L,FLDFILT<15MIN
mg/L water SM 4500 P E 00671 0.04 0.04 70‐130 20 80‐120 LLP
ORTHOPHOSPHATE PHOSPHORUS,DISS,MG/L,FLDFILT<15MIN
mg/L waterEPA 300.0 Rev. 2.1 (1993)
00671 0.04 0.04 70‐130 20 90‐110 LLP
HARDNESS, TOTAL (MG/L AS CACO3)* mg/L water SM 2340 C 00900 5 5 NA 20 80‐120 LLP
CHLORIDE (MG/L AS CL) mg/L waterEPA 300.0 Rev. 2.1 (1993)
00940 5 5 70‐130 20 90‐110 LLP
SULFATE (MG/L AS SO4) mg/L waterEPA 300.0, Rev.
2.1 (1993)00945 5 5 70‐130 20 90‐110 LLP
E. COLI, COLILERT, IDEXX METHOD, MPN/100ML
MPN/100 mL
water Col i lert*** 31699 1 1 NA 0.50** NA LLP
E.COLI, COLILERT, IDEXX, HOLDING TIME hours water NA 31704 NA NA NA NA NA LLPCHLOROPHYLL‐A UG/L
SPECTROPHOTOMETRIC ACID. METHμg/L water SM 10200 H 32211 3 3 70‐130 20 80‐120 LLP
RESIDUE,TOTAL FILTRABLE (DRIED AT 180C) (MG/L)
mg/L water SM 2540 C 70300 10 10 NA NA NA LLP
Conventional and Bacteriological Parameters in Water
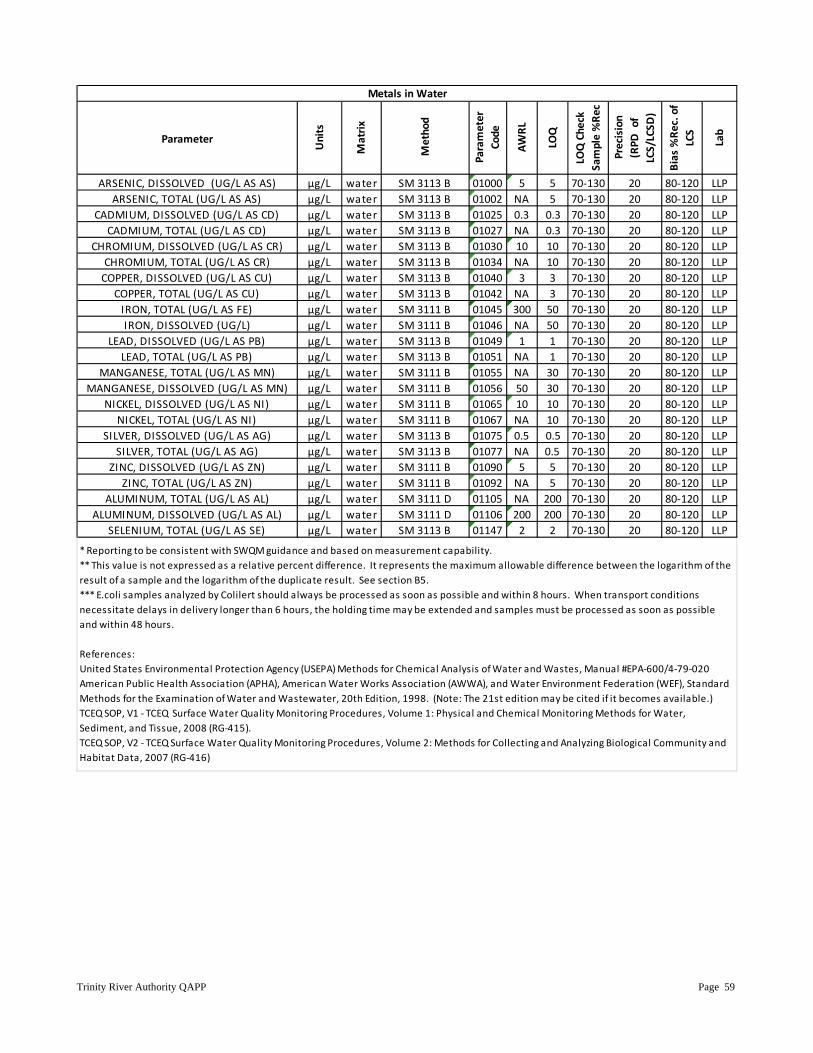
Trinity River Authority QAPP Page 59
Parameter
Units
Matrix
Method
Parameter
Code
AWRL
LOQ
LOQ Check
Sample %Re
c
Precision
(RPD
of
LCS/LCSD
)
Bias %Re
c. of
LCS
Lab
ARSENIC, DISSOLVED (UG/L AS AS) μg/L water SM 3113 B 01000 5 5 70‐130 20 80‐120 LLPARSENIC, TOTAL (UG/L AS AS) μg/L water SM 3113 B 01002 NA 5 70‐130 20 80‐120 LLP
CADMIUM, DISSOLVED (UG/L AS CD) μg/L water SM 3113 B 01025 0.3 0.3 70‐130 20 80‐120 LLPCADMIUM, TOTAL (UG/L AS CD) μg/L water SM 3113 B 01027 NA 0.3 70‐130 20 80‐120 LLP
CHROMIUM, DISSOLVED (UG/L AS CR) μg/L water SM 3113 B 01030 10 10 70‐130 20 80‐120 LLPCHROMIUM, TOTAL (UG/L AS CR) μg/L water SM 3113 B 01034 NA 10 70‐130 20 80‐120 LLPCOPPER, DISSOLVED (UG/L AS CU) μg/L water SM 3113 B 01040 3 3 70‐130 20 80‐120 LLP
COPPER, TOTAL (UG/L AS CU) μg/L water SM 3113 B 01042 NA 3 70‐130 20 80‐120 LLPIRON, TOTAL (UG/L AS FE) μg/L water SM 3111 B 01045 300 50 70‐130 20 80‐120 LLPIRON, DISSOLVED (UG/L) μg/L water SM 3111 B 01046 NA 50 70‐130 20 80‐120 LLP
LEAD, DISSOLVED (UG/L AS PB) μg/L water SM 3113 B 01049 1 1 70‐130 20 80‐120 LLPLEAD, TOTAL (UG/L AS PB) μg/L water SM 3113 B 01051 NA 1 70‐130 20 80‐120 LLP
MANGANESE, TOTAL (UG/L AS MN) μg/L water SM 3111 B 01055 NA 30 70‐130 20 80‐120 LLPMANGANESE, DISSOLVED (UG/L AS MN) μg/L water SM 3111 B 01056 50 30 70‐130 20 80‐120 LLP
NICKEL, DISSOLVED (UG/L AS NI) μg/L water SM 3111 B 01065 10 10 70‐130 20 80‐120 LLPNICKEL, TOTAL (UG/L AS NI) μg/L water SM 3111 B 01067 NA 10 70‐130 20 80‐120 LLP
SILVER, DISSOLVED (UG/L AS AG) μg/L water SM 3113 B 01075 0.5 0.5 70‐130 20 80‐120 LLPSILVER, TOTAL (UG/L AS AG) μg/L water SM 3113 B 01077 NA 0.5 70‐130 20 80‐120 LLP
ZINC, DISSOLVED (UG/L AS ZN) μg/L water SM 3111 B 01090 5 5 70‐130 20 80‐120 LLPZINC, TOTAL (UG/L AS ZN) μg/L water SM 3111 B 01092 NA 5 70‐130 20 80‐120 LLP
ALUMINUM, TOTAL (UG/L AS AL) μg/L water SM 3111 D 01105 NA 200 70‐130 20 80‐120 LLPALUMINUM, DISSOLVED (UG/L AS AL) μg/L water SM 3111 D 01106 200 200 70‐130 20 80‐120 LLP
SELENIUM, TOTAL (UG/L AS SE) μg/L water SM 3113 B 01147 2 2 70‐130 20 80‐120 LLP
* Reporting to be consistent with SWQM guidance and based on measurement capability. ** This value is not expressed as a relative percent difference. It represents the maximum allowable difference between the logarithm of the result of a sample and the logarithm of the duplicate result. See section B5.*** E.coli samples analyzed by Colilert should always be processed as soon as possible and within 8 hours. When transport conditions necessitate delays in delivery longer than 6 hours, the holding time may be extended and samples must be processed as soon as possible and within 48 hours.
References:United States Environmental Protection Agency (USEPA) Methods for Chemical Analysis of Water and Wastes, Manual #EPA‐600/4‐79‐020American Public Health Association (APHA), American Water Works Association (AWWA), and Water Environment Federation (WEF), Standard Methods for the Examination of Water and Wastewater, 20th Edition, 1998. (Note: The 21st edition may be cited if it becomes available.)TCEQ SOP, V1 ‐ TCEQ Surface Water Quality Monitoring Procedures, Volume 1: Physical and Chemical Monitoring Methods for Water, Sediment, and Tissue, 2008 (RG‐415).TCEQ SOP, V2 ‐ TCEQ Surface Water Quality Monitoring Procedures, Volume 2: Methods for Collecting and Analyzing Biological Community and Habitat Data, 2007 (RG‐416)
Metals in Water
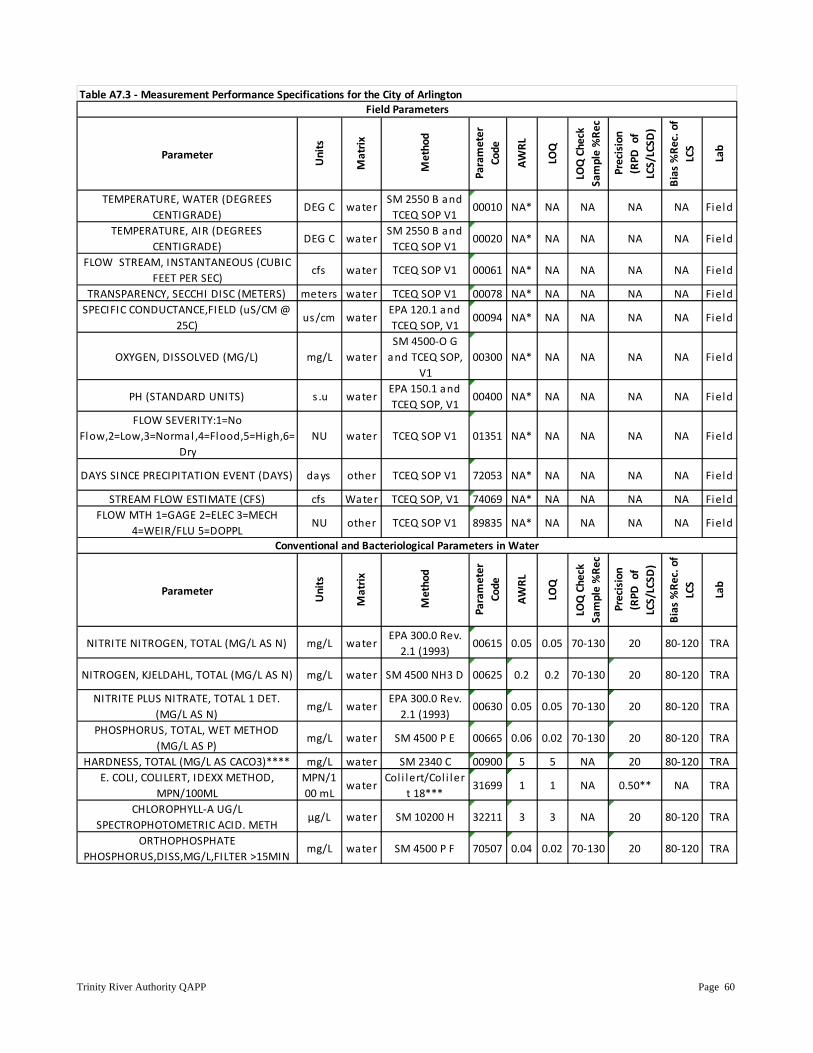
Trinity River Authority QAPP Page 60
Parameter
Units
Matrix
Method
Parameter
Code
AWRL
LOQ
LOQ Check
Sample %Re
c
Precision
(RPD
of
LCS/LCSD
)
Bias %Re
c. of
LCS
Lab
TEMPERATURE, WATER (DEGREES CENTIGRADE)
DEG C waterSM 2550 B and TCEQ SOP V1
00010 NA* NA NA NA NA Field
TEMPERATURE, AIR (DEGREES CENTIGRADE)
DEG C waterSM 2550 B and TCEQ SOP V1
00020 NA* NA NA NA NA Field
FLOW STREAM, INSTANTANEOUS (CUBIC FEET PER SEC)
cfs water TCEQ SOP V1 00061 NA* NA NA NA NA Field
TRANSPARENCY, SECCHI DISC (METERS) meters water TCEQ SOP V1 00078 NA* NA NA NA NA FieldSPECIFIC CONDUCTANCE,FIELD (uS/CM @
25C)us/cm water
EPA 120.1 and TCEQ SOP, V1
00094 NA* NA NA NA NA Field
OXYGEN, DISSOLVED (MG/L) mg/L waterSM 4500‐O G and TCEQ SOP,
V100300 NA* NA NA NA NA Field
PH (STANDARD UNITS) s .u waterEPA 150.1 and TCEQ SOP, V1
00400 NA* NA NA NA NA Field
FLOW SEVERITY:1=No Flow,2=Low,3=Normal ,4=Flood,5=High,6=
DryNU water TCEQ SOP V1 01351 NA* NA NA NA NA Field
DAYS SINCE PRECIPITATION EVENT (DAYS) days other TCEQ SOP V1 72053 NA* NA NA NA NA Field
STREAM FLOW ESTIMATE (CFS) cfs Water TCEQ SOP, V1 74069 NA* NA NA NA NA FieldFLOW MTH 1=GAGE 2=ELEC 3=MECH
4=WEIR/FLU 5=DOPPLNU other TCEQ SOP V1 89835 NA* NA NA NA NA Field
Parameter
Units
Matrix
Method
Parameter
Code
AWRL
LOQ
LOQ Check
Sample %Re
c
Precision
(RPD
of
LCS/LCSD
)
Bias %Re
c. of
LCS
Lab
NITRITE NITROGEN, TOTAL (MG/L AS N) mg/L waterEPA 300.0 Rev. 2.1 (1993)
00615 0.05 0.05 70‐130 20 80‐120 TRA
NITROGEN, KJELDAHL, TOTAL (MG/L AS N) mg/L water SM 4500 NH3 D 00625 0.2 0.2 70‐130 20 80‐120 TRA
NITRITE PLUS NITRATE, TOTAL 1 DET. (MG/L AS N)
mg/L waterEPA 300.0 Rev. 2.1 (1993)
00630 0.05 0.05 70‐130 20 80‐120 TRA
PHOSPHORUS, TOTAL, WET METHOD (MG/L AS P)
mg/L water SM 4500 P E 00665 0.06 0.02 70‐130 20 80‐120 TRA
HARDNESS, TOTAL (MG/L AS CACO3)**** mg/L water SM 2340 C 00900 5 5 NA 20 80‐120 TRAE. COLI, COLILERT, IDEXX METHOD,
MPN/100MLMPN/100 mL
waterCol i lert/Col i ler
t 18***31699 1 1 NA 0.50** NA TRA
CHLOROPHYLL‐A UG/L SPECTROPHOTOMETRIC ACID. METH
μg/L water SM 10200 H 32211 3 3 NA 20 80‐120 TRA
ORTHOPHOSPHATE PHOSPHORUS,DISS,MG/L,FILTER >15MIN
mg/L water SM 4500 P F 70507 0.04 0.02 70‐130 20 80‐120 TRA
Field Parameters
Conventional and Bacteriological Parameters in Water
Table A7.3 ‐ Measurement Performance Specifications for the City of Arlington
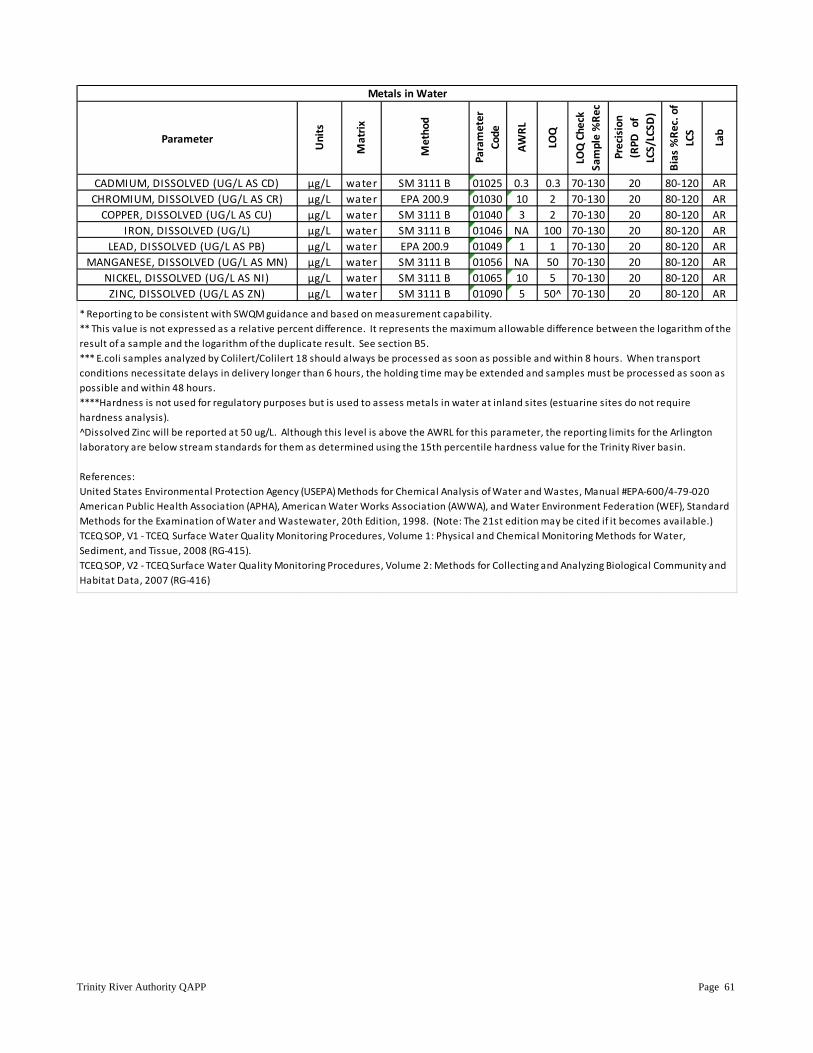
Trinity River Authority QAPP Page 61
Parameter
Units
Matrix
Method
Parameter
Code
AWRL
LOQ
LOQ Check
Sample %Re
c
Precision
(RPD
of
LCS/LCSD
)
Bias %Re
c. of
LCS
Lab
CADMIUM, DISSOLVED (UG/L AS CD) μg/L water SM 3111 B 01025 0.3 0.3 70‐130 20 80‐120 ARCHROMIUM, DISSOLVED (UG/L AS CR) μg/L water EPA 200.9 01030 10 2 70‐130 20 80‐120 ARCOPPER, DISSOLVED (UG/L AS CU) μg/L water SM 3111 B 01040 3 2 70‐130 20 80‐120 AR
IRON, DISSOLVED (UG/L) μg/L water SM 3111 B 01046 NA 100 70‐130 20 80‐120 ARLEAD, DISSOLVED (UG/L AS PB) μg/L water EPA 200.9 01049 1 1 70‐130 20 80‐120 AR
MANGANESE, DISSOLVED (UG/L AS MN) μg/L water SM 3111 B 01056 NA 50 70‐130 20 80‐120 ARNICKEL, DISSOLVED (UG/L AS NI) μg/L water SM 3111 B 01065 10 5 70‐130 20 80‐120 ARZINC, DISSOLVED (UG/L AS ZN) μg/L water SM 3111 B 01090 5 50^ 70‐130 20 80‐120 AR
Metals in Water
* Reporting to be consistent with SWQM guidance and based on measurement capability. ** This value is not expressed as a relative percent difference. It represents the maximum allowable difference between the logarithm of the result of a sample and the logarithm of the duplicate result. See section B5.*** E.coli samples analyzed by Colilert/Colilert 18 should always be processed as soon as possible and within 8 hours. When transport conditions necessitate delays in delivery longer than 6 hours, the holding time may be extended and samples must be processed as soon as possible and within 48 hours.****Hardness is not used for regulatory purposes but is used to assess metals in water at inland sites (estuarine sites do not require hardness analysis).^Dissolved Zinc will be reported at 50 ug/L. Although this level is above the AWRL for this parameter, the reporting limits for the Arlington laboratory are below stream standards for them as determined using the 15th percentile hardness value for the Trinity River basin.
References:United States Environmental Protection Agency (USEPA) Methods for Chemical Analysis of Water and Wastes, Manual #EPA‐600/4‐79‐020American Public Health Association (APHA), American Water Works Association (AWWA), and Water Environment Federation (WEF), Standard Methods for the Examination of Water and Wastewater, 20th Edition, 1998. (Note: The 21st edition may be cited if it becomes available.)TCEQ SOP, V1 ‐ TCEQ Surface Water Quality Monitoring Procedures, Volume 1: Physical and Chemical Monitoring Methods for Water, Sediment, and Tissue, 2008 (RG‐415).TCEQ SOP, V2 ‐ TCEQ Surface Water Quality Monitoring Procedures, Volume 2: Methods for Collecting and Analyzing Biological Community and Habitat Data, 2007 (RG‐416)
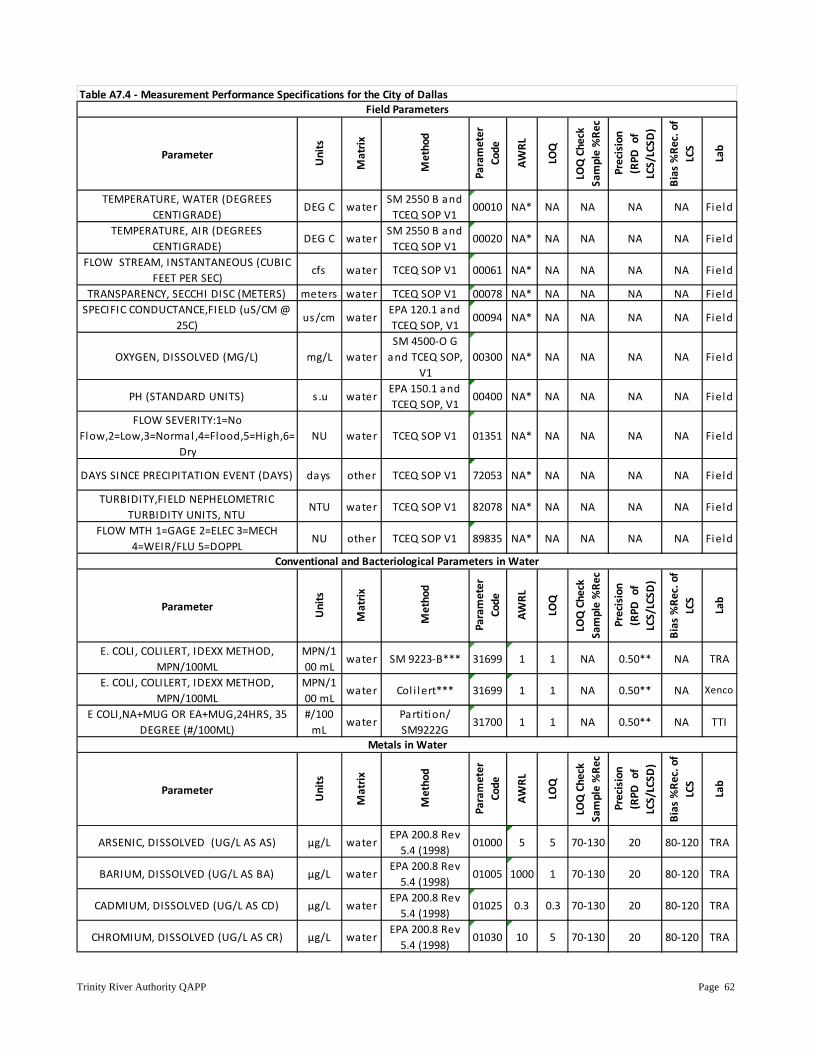
Trinity River Authority QAPP Page 62
Parameter
Units
Matrix
Method
Parameter
Code
AWRL
LOQ
LOQ Check
Sample %Re
c
Precision
(RPD
of
LCS/LCSD
)
Bias %Re
c. of
LCS
Lab
TEMPERATURE, WATER (DEGREES CENTIGRADE)
DEG C waterSM 2550 B and TCEQ SOP V1
00010 NA* NA NA NA NA Field
TEMPERATURE, AIR (DEGREES CENTIGRADE)
DEG C waterSM 2550 B and TCEQ SOP V1
00020 NA* NA NA NA NA Field
FLOW STREAM, INSTANTANEOUS (CUBIC FEET PER SEC)
cfs water TCEQ SOP V1 00061 NA* NA NA NA NA Field
TRANSPARENCY, SECCHI DISC (METERS) meters water TCEQ SOP V1 00078 NA* NA NA NA NA FieldSPECIFIC CONDUCTANCE,FIELD (uS/CM @
25C)us/cm water
EPA 120.1 and TCEQ SOP, V1
00094 NA* NA NA NA NA Field
OXYGEN, DISSOLVED (MG/L) mg/L waterSM 4500‐O G and TCEQ SOP,
V100300 NA* NA NA NA NA Field
PH (STANDARD UNITS) s .u waterEPA 150.1 and TCEQ SOP, V1
00400 NA* NA NA NA NA Field
FLOW SEVERITY:1=No Flow,2=Low,3=Normal ,4=Flood,5=High,6=
DryNU water TCEQ SOP V1 01351 NA* NA NA NA NA Field
DAYS SINCE PRECIPITATION EVENT (DAYS) days other TCEQ SOP V1 72053 NA* NA NA NA NA Field
TURBIDITY,FIELD NEPHELOMETRIC TURBIDITY UNITS, NTU
NTU water TCEQ SOP V1 82078 NA* NA NA NA NA Field
FLOW MTH 1=GAGE 2=ELEC 3=MECH 4=WEIR/FLU 5=DOPPL
NU other TCEQ SOP V1 89835 NA* NA NA NA NA Field
Parameter
Units
Matrix
Method
Parameter
Code
AWRL
LOQ
LOQ Check
Sample %Re
c
Precision
(RPD
of
LCS/LCSD
)
Bias %Re
c. of
LCS
Lab
E. COLI, COLILERT, IDEXX METHOD, MPN/100ML
MPN/100 mL
water SM 9223‐B*** 31699 1 1 NA 0.50** NA TRA
E. COLI, COLILERT, IDEXX METHOD, MPN/100ML
MPN/100 mL
water Col i lert*** 31699 1 1 NA 0.50** NA Xenco
E COLI,NA+MUG OR EA+MUG,24HRS, 35 DEGREE (#/100ML)
#/100 mL
waterParti tion/ SM9222G
31700 1 1 NA 0.50** NA TTI
Parameter
Units
Matrix
Method
Parameter
Code
AWRL
LOQ
LOQ Check
Sample %Re
c
Precision
(RPD
of
LCS/LCSD
)
Bias %Re
c. of
LCS
Lab
ARSENIC, DISSOLVED (UG/L AS AS) μg/L waterEPA 200.8 Rev 5.4 (1998)
01000 5 5 70‐130 20 80‐120 TRA
BARIUM, DISSOLVED (UG/L AS BA) μg/L waterEPA 200.8 Rev 5.4 (1998)
01005 1000 1 70‐130 20 80‐120 TRA
CADMIUM, DISSOLVED (UG/L AS CD) μg/L waterEPA 200.8 Rev 5.4 (1998)
01025 0.3 0.3 70‐130 20 80‐120 TRA
CHROMIUM, DISSOLVED (UG/L AS CR) μg/L waterEPA 200.8 Rev 5.4 (1998)
01030 10 5 70‐130 20 80‐120 TRA
Field Parameters
Conventional and Bacteriological Parameters in Water
Metals in Water
Table A7.4 ‐ Measurement Performance Specifications for the City of Dallas
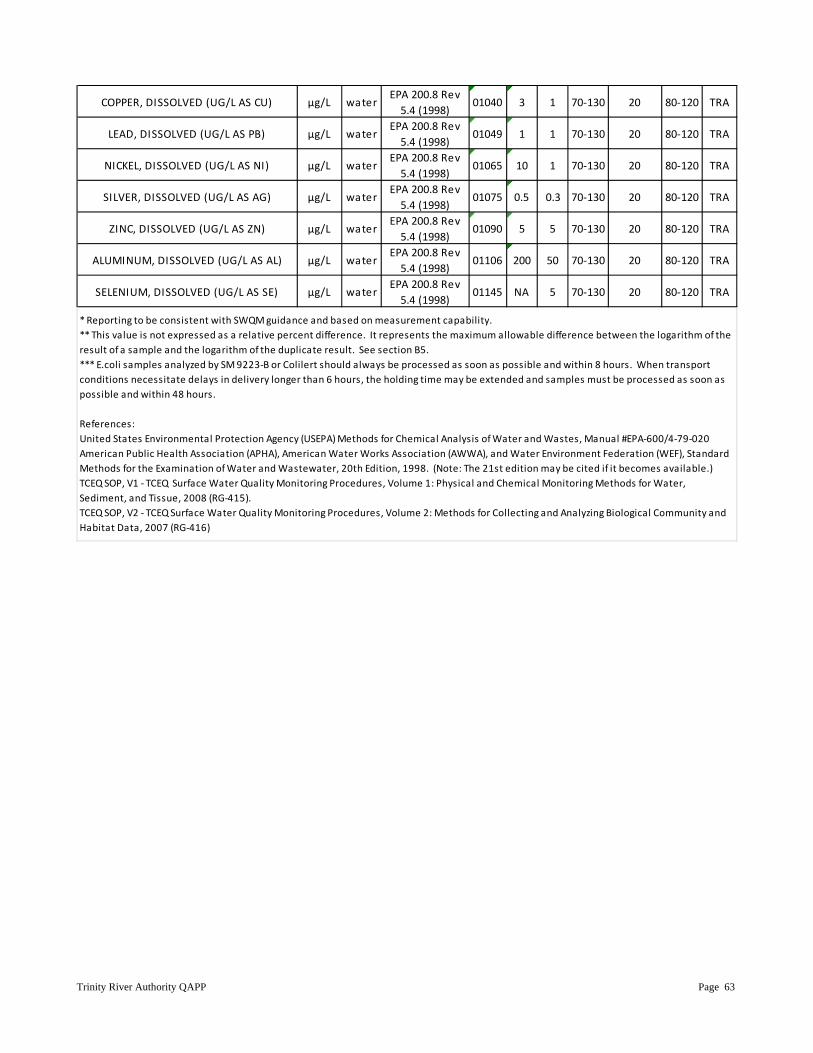
Trinity River Authority QAPP Page 63
COPPER, DISSOLVED (UG/L AS CU) μg/L waterEPA 200.8 Rev 5.4 (1998)
01040 3 1 70‐130 20 80‐120 TRA
LEAD, DISSOLVED (UG/L AS PB) μg/L waterEPA 200.8 Rev 5.4 (1998)
01049 1 1 70‐130 20 80‐120 TRA
NICKEL, DISSOLVED (UG/L AS NI) μg/L waterEPA 200.8 Rev 5.4 (1998)
01065 10 1 70‐130 20 80‐120 TRA
SILVER, DISSOLVED (UG/L AS AG) μg/L waterEPA 200.8 Rev 5.4 (1998)
01075 0.5 0.3 70‐130 20 80‐120 TRA
ZINC, DISSOLVED (UG/L AS ZN) μg/L waterEPA 200.8 Rev 5.4 (1998)
01090 5 5 70‐130 20 80‐120 TRA
ALUMINUM, DISSOLVED (UG/L AS AL) μg/L waterEPA 200.8 Rev 5.4 (1998)
01106 200 50 70‐130 20 80‐120 TRA
SELENIUM, DISSOLVED (UG/L AS SE) μg/L waterEPA 200.8 Rev 5.4 (1998)
01145 NA 5 70‐130 20 80‐120 TRA
* Reporting to be consistent with SWQM guidance and based on measurement capability. ** This value is not expressed as a relative percent difference. It represents the maximum allowable difference between the logarithm of the result of a sample and the logarithm of the duplicate result. See section B5. *** E.coli samples analyzed by SM 9223‐B or Colilert should always be processed as soon as possible and within 8 hours. When transport conditions necessitate delays in delivery longer than 6 hours, the holding time may be extended and samples must be processed as soon as possible and within 48 hours.
References:United States Environmental Protection Agency (USEPA) Methods for Chemical Analysis of Water and Wastes, Manual #EPA‐600/4‐79‐020American Public Health Association (APHA), American Water Works Association (AWWA), and Water Environment Federation (WEF), Standard Methods for the Examination of Water and Wastewater, 20th Edition, 1998. (Note: The 21st edition may be cited if it becomes available.)TCEQ SOP, V1 ‐ TCEQ Surface Water Quality Monitoring Procedures, Volume 1: Physical and Chemical Monitoring Methods for Water, Sediment, and Tissue, 2008 (RG‐415).TCEQ SOP, V2 ‐ TCEQ Surface Water Quality Monitoring Procedures, Volume 2: Methods for Collecting and Analyzing Biological Community and Habitat Data, 2007 (RG‐416)
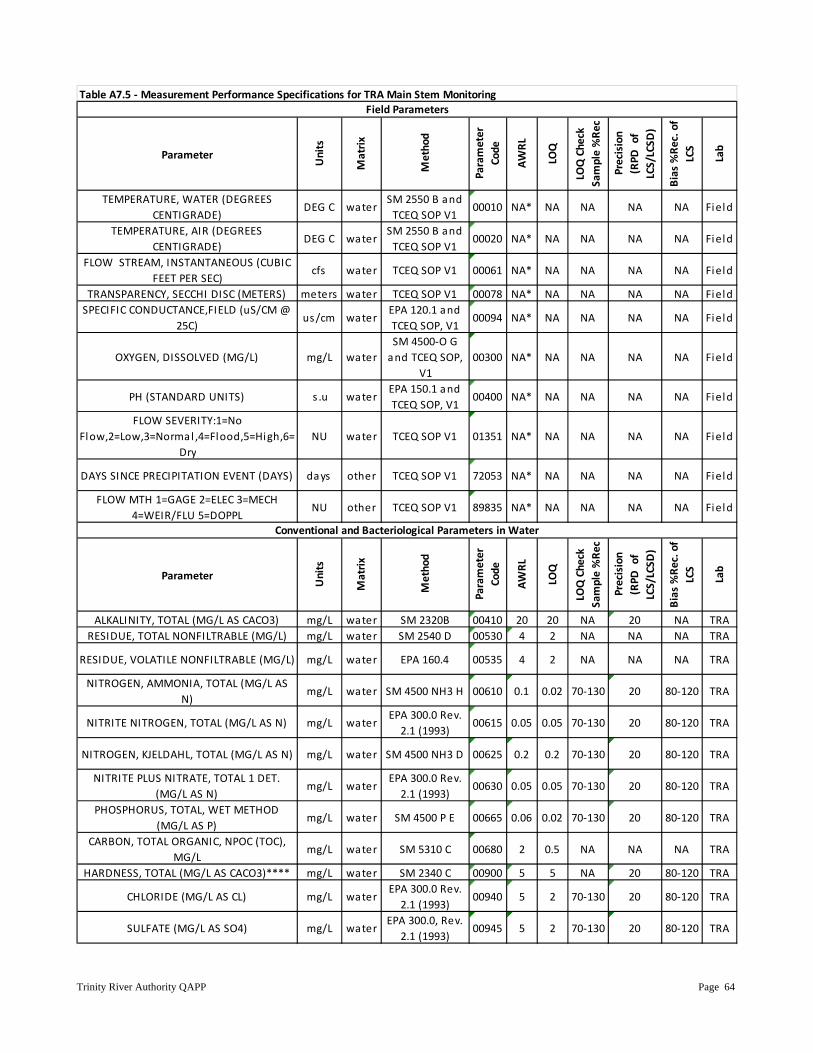
Trinity River Authority QAPP Page 64
Parameter
Units
Matrix
Method
Parameter
Code
AWRL
LOQ
LOQ Check
Sample %Re
c
Precision
(RPD
of
LCS/LCSD
)
Bias %Re
c. of
LCS
Lab
TEMPERATURE, WATER (DEGREES CENTIGRADE)
DEG C waterSM 2550 B and TCEQ SOP V1
00010 NA* NA NA NA NA Field
TEMPERATURE, AIR (DEGREES CENTIGRADE)
DEG C waterSM 2550 B and TCEQ SOP V1
00020 NA* NA NA NA NA Field
FLOW STREAM, INSTANTANEOUS (CUBIC FEET PER SEC)
cfs water TCEQ SOP V1 00061 NA* NA NA NA NA Field
TRANSPARENCY, SECCHI DISC (METERS) meters water TCEQ SOP V1 00078 NA* NA NA NA NA FieldSPECIFIC CONDUCTANCE,FIELD (uS/CM @
25C)us/cm water
EPA 120.1 and TCEQ SOP, V1
00094 NA* NA NA NA NA Field
OXYGEN, DISSOLVED (MG/L) mg/L waterSM 4500‐O G and TCEQ SOP,
V100300 NA* NA NA NA NA Field
PH (STANDARD UNITS) s .u waterEPA 150.1 and TCEQ SOP, V1
00400 NA* NA NA NA NA Field
FLOW SEVERITY:1=No Flow,2=Low,3=Normal ,4=Flood,5=High,6=
DryNU water TCEQ SOP V1 01351 NA* NA NA NA NA Field
DAYS SINCE PRECIPITATION EVENT (DAYS) days other TCEQ SOP V1 72053 NA* NA NA NA NA Field
FLOW MTH 1=GAGE 2=ELEC 3=MECH 4=WEIR/FLU 5=DOPPL
NU other TCEQ SOP V1 89835 NA* NA NA NA NA Field
Parameter
Units
Matrix
Method
Parameter
Code
AWRL
LOQ
LOQ Check
Sample %Re
c
Precision
(RPD
of
LCS/LCSD
)
Bias %Re
c. of
LCS
Lab
ALKALINITY, TOTAL (MG/L AS CACO3) mg/L water SM 2320B 00410 20 20 NA 20 NA TRARESIDUE, TOTAL NONFILTRABLE (MG/L) mg/L water SM 2540 D 00530 4 2 NA NA NA TRA
RESIDUE, VOLATILE NONFILTRABLE (MG/L) mg/L water EPA 160.4 00535 4 2 NA NA NA TRA
NITROGEN, AMMONIA, TOTAL (MG/L AS N)
mg/L water SM 4500 NH3 H 00610 0.1 0.02 70‐130 20 80‐120 TRA
NITRITE NITROGEN, TOTAL (MG/L AS N) mg/L waterEPA 300.0 Rev. 2.1 (1993)
00615 0.05 0.05 70‐130 20 80‐120 TRA
NITROGEN, KJELDAHL, TOTAL (MG/L AS N) mg/L water SM 4500 NH3 D 00625 0.2 0.2 70‐130 20 80‐120 TRA
NITRITE PLUS NITRATE, TOTAL 1 DET. (MG/L AS N)
mg/L waterEPA 300.0 Rev. 2.1 (1993)
00630 0.05 0.05 70‐130 20 80‐120 TRA
PHOSPHORUS, TOTAL, WET METHOD (MG/L AS P)
mg/L water SM 4500 P E 00665 0.06 0.02 70‐130 20 80‐120 TRA
CARBON, TOTAL ORGANIC, NPOC (TOC), MG/L
mg/L water SM 5310 C 00680 2 0.5 NA NA NA TRA
HARDNESS, TOTAL (MG/L AS CACO3)**** mg/L water SM 2340 C 00900 5 5 NA 20 80‐120 TRA
CHLORIDE (MG/L AS CL) mg/L waterEPA 300.0 Rev. 2.1 (1993)
00940 5 2 70‐130 20 80‐120 TRA
SULFATE (MG/L AS SO4) mg/L waterEPA 300.0, Rev.
2.1 (1993)00945 5 2 70‐130 20 80‐120 TRA
Field Parameters
Conventional and Bacteriological Parameters in Water
Table A7.5 ‐ Measurement Performance Specifications for TRA Main Stem Monitoring
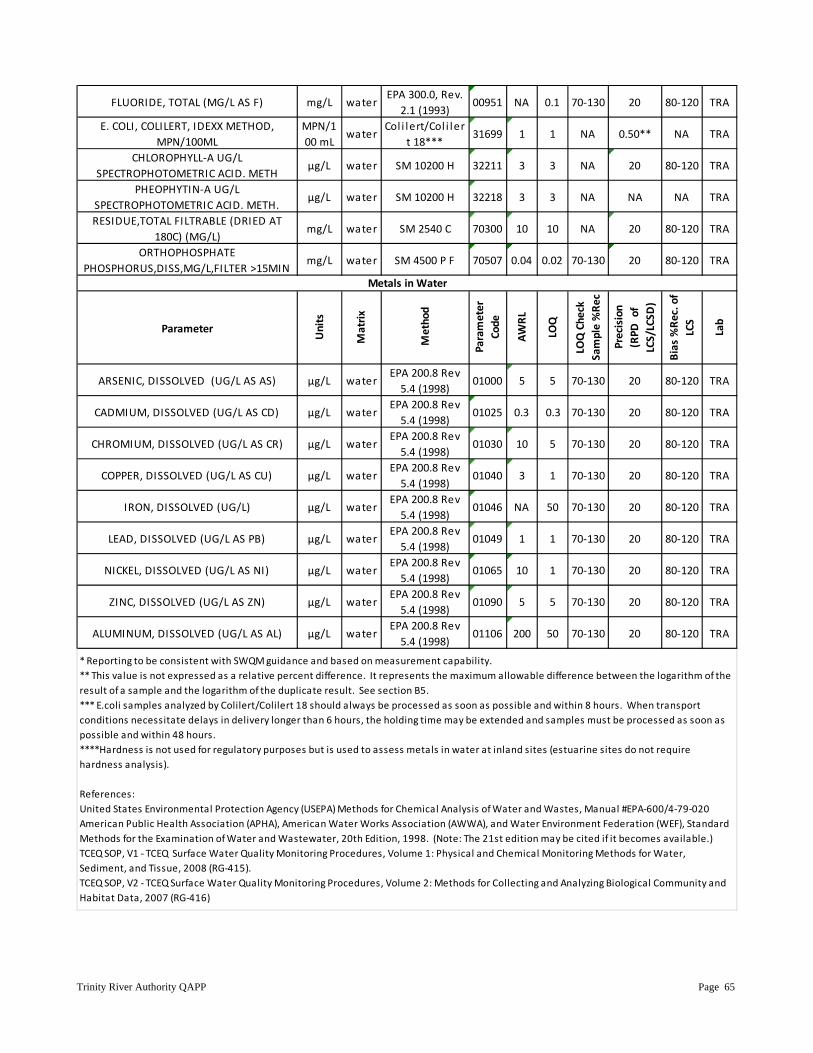
Trinity River Authority QAPP Page 65
FLUORIDE, TOTAL (MG/L AS F) mg/L waterEPA 300.0, Rev.
2.1 (1993)00951 NA 0.1 70‐130 20 80‐120 TRA
E. COLI, COLILERT, IDEXX METHOD, MPN/100ML
MPN/100 mL
waterCol i lert/Col i ler
t 18***31699 1 1 NA 0.50** NA TRA
CHLOROPHYLL‐A UG/L SPECTROPHOTOMETRIC ACID. METH
μg/L water SM 10200 H 32211 3 3 NA 20 80‐120 TRA
PHEOPHYTIN‐A UG/L SPECTROPHOTOMETRIC ACID. METH.
μg/L water SM 10200 H 32218 3 3 NA NA NA TRA
RESIDUE,TOTAL FILTRABLE (DRIED AT 180C) (MG/L)
mg/L water SM 2540 C 70300 10 10 NA 20 80‐120 TRA
ORTHOPHOSPHATE PHOSPHORUS,DISS,MG/L,FILTER >15MIN
mg/L water SM 4500 P F 70507 0.04 0.02 70‐130 20 80‐120 TRA
ParameterUnits
Matrix
Method
Parameter
Code
AWRL
LOQ
LOQ Check
Sample %Re
c
Precision
(RPD
of
LCS/LCSD
)
Bias %Re
c. of
LCS
Lab
ARSENIC, DISSOLVED (UG/L AS AS) μg/L waterEPA 200.8 Rev 5.4 (1998)
01000 5 5 70‐130 20 80‐120 TRA
CADMIUM, DISSOLVED (UG/L AS CD) μg/L waterEPA 200.8 Rev 5.4 (1998)
01025 0.3 0.3 70‐130 20 80‐120 TRA
CHROMIUM, DISSOLVED (UG/L AS CR) μg/L waterEPA 200.8 Rev 5.4 (1998)
01030 10 5 70‐130 20 80‐120 TRA
COPPER, DISSOLVED (UG/L AS CU) μg/L waterEPA 200.8 Rev 5.4 (1998)
01040 3 1 70‐130 20 80‐120 TRA
IRON, DISSOLVED (UG/L) μg/L waterEPA 200.8 Rev 5.4 (1998)
01046 NA 50 70‐130 20 80‐120 TRA
LEAD, DISSOLVED (UG/L AS PB) μg/L waterEPA 200.8 Rev 5.4 (1998)
01049 1 1 70‐130 20 80‐120 TRA
NICKEL, DISSOLVED (UG/L AS NI) μg/L waterEPA 200.8 Rev 5.4 (1998)
01065 10 1 70‐130 20 80‐120 TRA
ZINC, DISSOLVED (UG/L AS ZN) μg/L waterEPA 200.8 Rev 5.4 (1998)
01090 5 5 70‐130 20 80‐120 TRA
ALUMINUM, DISSOLVED (UG/L AS AL) μg/L waterEPA 200.8 Rev 5.4 (1998)
01106 200 50 70‐130 20 80‐120 TRA
Metals in Water
* Reporting to be consistent with SWQM guidance and based on measurement capability. ** This value is not expressed as a relative percent difference. It represents the maximum allowable difference between the logarithm of the result of a sample and the logarithm of the duplicate result. See section B5.*** E.coli samples analyzed by Colilert/Colilert 18 should always be processed as soon as possible and within 8 hours. When transport conditions necessitate delays in delivery longer than 6 hours, the holding time may be extended and samples must be processed as soon as possible and within 48 hours.****Hardness is not used for regulatory purposes but is used to assess metals in water at inland sites (estuarine sites do not require hardness analysis).
References:United States Environmental Protection Agency (USEPA) Methods for Chemical Analysis of Water and Wastes, Manual #EPA‐600/4‐79‐020American Public Health Association (APHA), American Water Works Association (AWWA), and Water Environment Federation (WEF), Standard Methods for the Examination of Water and Wastewater, 20th Edition, 1998. (Note: The 21st edition may be cited if it becomes available.)TCEQ SOP, V1 ‐ TCEQ Surface Water Quality Monitoring Procedures, Volume 1: Physical and Chemical Monitoring Methods for Water, Sediment, and Tissue, 2008 (RG‐415).TCEQ SOP, V2 ‐ TCEQ Surface Water Quality Monitoring Procedures, Volume 2: Methods for Collecting and Analyzing Biological Community and Habitat Data, 2007 (RG‐416)
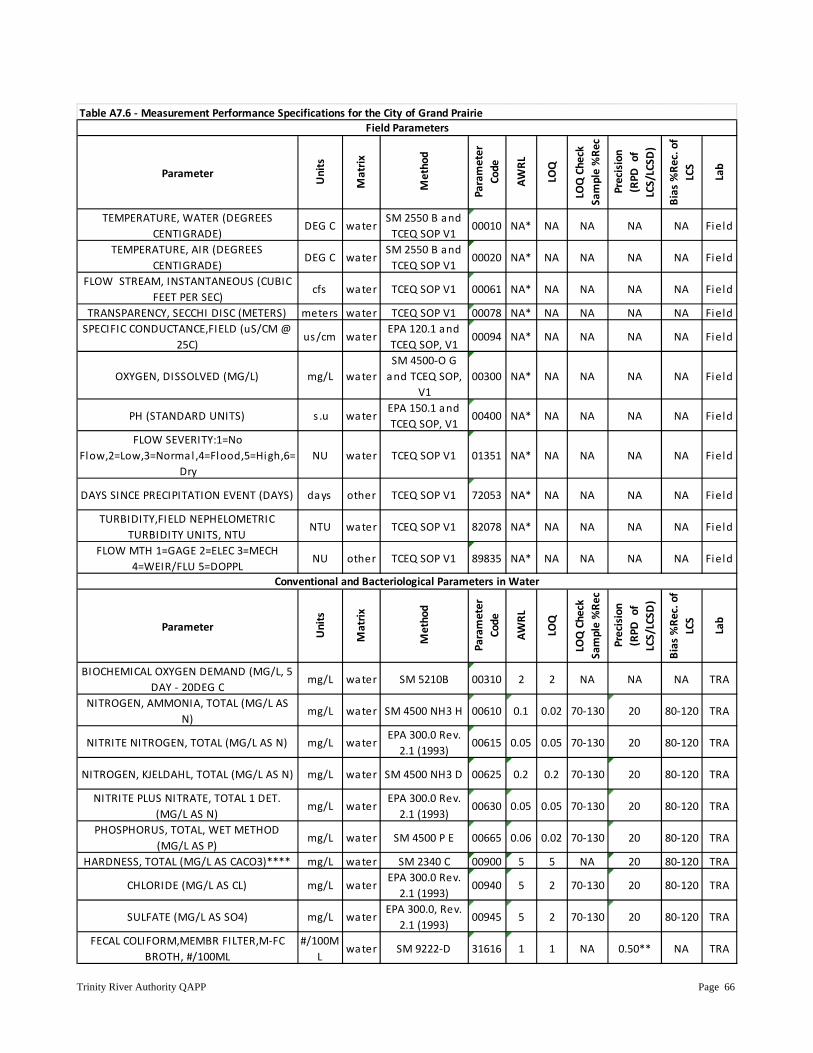
Trinity River Authority QAPP Page 66
Parameter
Units
Matrix
Method
Parameter
Code
AWRL
LOQ
LOQ Check
Sample %Re
c
Precision
(RPD
of
LCS/LCSD
)
Bias %Re
c. of
LCS
Lab
TEMPERATURE, WATER (DEGREES CENTIGRADE)
DEG C waterSM 2550 B and TCEQ SOP V1
00010 NA* NA NA NA NA Field
TEMPERATURE, AIR (DEGREES CENTIGRADE)
DEG C waterSM 2550 B and TCEQ SOP V1
00020 NA* NA NA NA NA Field
FLOW STREAM, INSTANTANEOUS (CUBIC FEET PER SEC)
cfs water TCEQ SOP V1 00061 NA* NA NA NA NA Field
TRANSPARENCY, SECCHI DISC (METERS) meters water TCEQ SOP V1 00078 NA* NA NA NA NA FieldSPECIFIC CONDUCTANCE,FIELD (uS/CM @
25C)us/cm water
EPA 120.1 and TCEQ SOP, V1
00094 NA* NA NA NA NA Field
OXYGEN, DISSOLVED (MG/L) mg/L waterSM 4500‐O G and TCEQ SOP,
V100300 NA* NA NA NA NA Field
PH (STANDARD UNITS) s .u waterEPA 150.1 and TCEQ SOP, V1
00400 NA* NA NA NA NA Field
FLOW SEVERITY:1=No Flow,2=Low,3=Normal ,4=Flood,5=High,6=
DryNU water TCEQ SOP V1 01351 NA* NA NA NA NA Field
DAYS SINCE PRECIPITATION EVENT (DAYS) days other TCEQ SOP V1 72053 NA* NA NA NA NA Field
TURBIDITY,FIELD NEPHELOMETRIC TURBIDITY UNITS, NTU
NTU water TCEQ SOP V1 82078 NA* NA NA NA NA Field
FLOW MTH 1=GAGE 2=ELEC 3=MECH 4=WEIR/FLU 5=DOPPL
NU other TCEQ SOP V1 89835 NA* NA NA NA NA Field
Parameter
Units
Matrix
Method
Parameter
Code
AWRL
LOQ
LOQ Check
Sample %Re
c
Precision
(RPD
of
LCS/LCSD
)
Bias %Re
c. of
LCS
Lab
BIOCHEMICAL OXYGEN DEMAND (MG/L, 5 DAY ‐ 20DEG C
mg/L water SM 5210B 00310 2 2 NA NA NA TRA
NITROGEN, AMMONIA, TOTAL (MG/L AS N)
mg/L water SM 4500 NH3 H 00610 0.1 0.02 70‐130 20 80‐120 TRA
NITRITE NITROGEN, TOTAL (MG/L AS N) mg/L waterEPA 300.0 Rev. 2.1 (1993)
00615 0.05 0.05 70‐130 20 80‐120 TRA
NITROGEN, KJELDAHL, TOTAL (MG/L AS N) mg/L water SM 4500 NH3 D 00625 0.2 0.2 70‐130 20 80‐120 TRA
NITRITE PLUS NITRATE, TOTAL 1 DET. (MG/L AS N)
mg/L waterEPA 300.0 Rev. 2.1 (1993)
00630 0.05 0.05 70‐130 20 80‐120 TRA
PHOSPHORUS, TOTAL, WET METHOD (MG/L AS P)
mg/L water SM 4500 P E 00665 0.06 0.02 70‐130 20 80‐120 TRA
HARDNESS, TOTAL (MG/L AS CACO3)**** mg/L water SM 2340 C 00900 5 5 NA 20 80‐120 TRA
CHLORIDE (MG/L AS CL) mg/L waterEPA 300.0 Rev. 2.1 (1993)
00940 5 2 70‐130 20 80‐120 TRA
SULFATE (MG/L AS SO4) mg/L waterEPA 300.0, Rev.
2.1 (1993)00945 5 2 70‐130 20 80‐120 TRA
FECAL COLIFORM,MEMBR FILTER,M‐FC BROTH, #/100ML
#/100ML
water SM 9222‐D 31616 1 1 NA 0.50** NA TRA
Field Parameters
Conventional and Bacteriological Parameters in Water
Table A7.6 ‐ Measurement Performance Specifications for the City of Grand Prairie
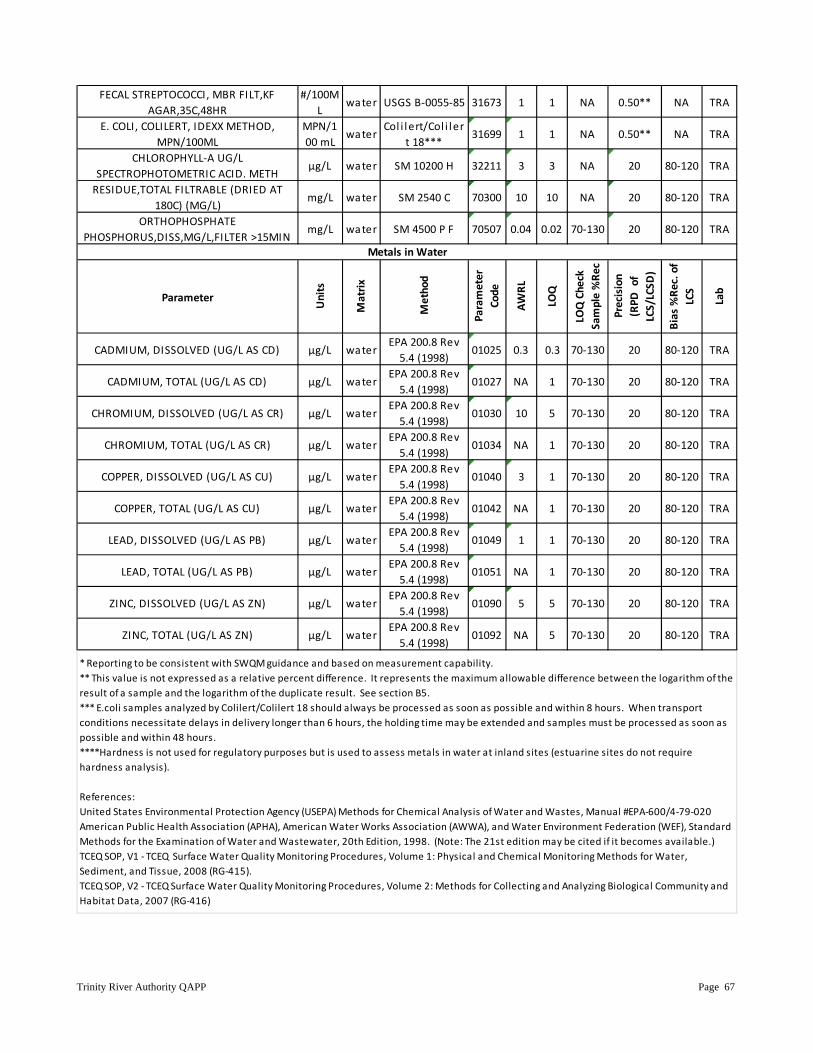
Trinity River Authority QAPP Page 67
FECAL STREPTOCOCCI, MBR FILT,KF AGAR,35C,48HR
#/100ML
water USGS B‐0055‐85 31673 1 1 NA 0.50** NA TRA
E. COLI, COLILERT, IDEXX METHOD, MPN/100ML
MPN/100 mL
waterCol i lert/Col i ler
t 18***31699 1 1 NA 0.50** NA TRA
CHLOROPHYLL‐A UG/L SPECTROPHOTOMETRIC ACID. METH
μg/L water SM 10200 H 32211 3 3 NA 20 80‐120 TRA
RESIDUE,TOTAL FILTRABLE (DRIED AT 180C) (MG/L)
mg/L water SM 2540 C 70300 10 10 NA 20 80‐120 TRA
ORTHOPHOSPHATE PHOSPHORUS,DISS,MG/L,FILTER >15MIN
mg/L water SM 4500 P F 70507 0.04 0.02 70‐130 20 80‐120 TRA
Parameter
Units
Matrix
Method
Parameter
Code
AWRL
LOQ
LOQ Check
Sample %Re
c
Precision
(RPD
of
LCS/LCSD
)
Bias %Re
c. of
LCS
Lab
CADMIUM, DISSOLVED (UG/L AS CD) μg/L waterEPA 200.8 Rev 5.4 (1998)
01025 0.3 0.3 70‐130 20 80‐120 TRA
CADMIUM, TOTAL (UG/L AS CD) μg/L waterEPA 200.8 Rev 5.4 (1998)
01027 NA 1 70‐130 20 80‐120 TRA
CHROMIUM, DISSOLVED (UG/L AS CR) μg/L waterEPA 200.8 Rev 5.4 (1998)
01030 10 5 70‐130 20 80‐120 TRA
CHROMIUM, TOTAL (UG/L AS CR) μg/L waterEPA 200.8 Rev 5.4 (1998)
01034 NA 1 70‐130 20 80‐120 TRA
COPPER, DISSOLVED (UG/L AS CU) μg/L waterEPA 200.8 Rev 5.4 (1998)
01040 3 1 70‐130 20 80‐120 TRA
COPPER, TOTAL (UG/L AS CU) μg/L waterEPA 200.8 Rev 5.4 (1998)
01042 NA 1 70‐130 20 80‐120 TRA
LEAD, DISSOLVED (UG/L AS PB) μg/L waterEPA 200.8 Rev 5.4 (1998)
01049 1 1 70‐130 20 80‐120 TRA
LEAD, TOTAL (UG/L AS PB) μg/L waterEPA 200.8 Rev 5.4 (1998)
01051 NA 1 70‐130 20 80‐120 TRA
ZINC, DISSOLVED (UG/L AS ZN) μg/L waterEPA 200.8 Rev 5.4 (1998)
01090 5 5 70‐130 20 80‐120 TRA
ZINC, TOTAL (UG/L AS ZN) μg/L waterEPA 200.8 Rev 5.4 (1998)
01092 NA 5 70‐130 20 80‐120 TRA
Metals in Water
* Reporting to be consistent with SWQM guidance and based on measurement capability. ** This value is not expressed as a relative percent difference. It represents the maximum allowable difference between the logarithm of the result of a sample and the logarithm of the duplicate result. See section B5.*** E.coli samples analyzed by Colilert/Colilert 18 should always be processed as soon as possible and within 8 hours. When transport conditions necessitate delays in delivery longer than 6 hours, the holding time may be extended and samples must be processed as soon as possible and within 48 hours.****Hardness is not used for regulatory purposes but is used to assess metals in water at inland sites (estuarine sites do not require hardness analysis).
References:United States Environmental Protection Agency (USEPA) Methods for Chemical Analysis of Water and Wastes, Manual #EPA‐600/4‐79‐020American Public Health Association (APHA), American Water Works Association (AWWA), and Water Environment Federation (WEF), Standard Methods for the Examination of Water and Wastewater, 20th Edition, 1998. (Note: The 21st edition may be cited if it becomes available.)TCEQ SOP, V1 ‐ TCEQ Surface Water Quality Monitoring Procedures, Volume 1: Physical and Chemical Monitoring Methods for Water, Sediment, and Tissue, 2008 (RG‐415).TCEQ SOP, V2 ‐ TCEQ Surface Water Quality Monitoring Procedures, Volume 2: Methods for Collecting and Analyzing Biological Community and Habitat Data, 2007 (RG‐416)
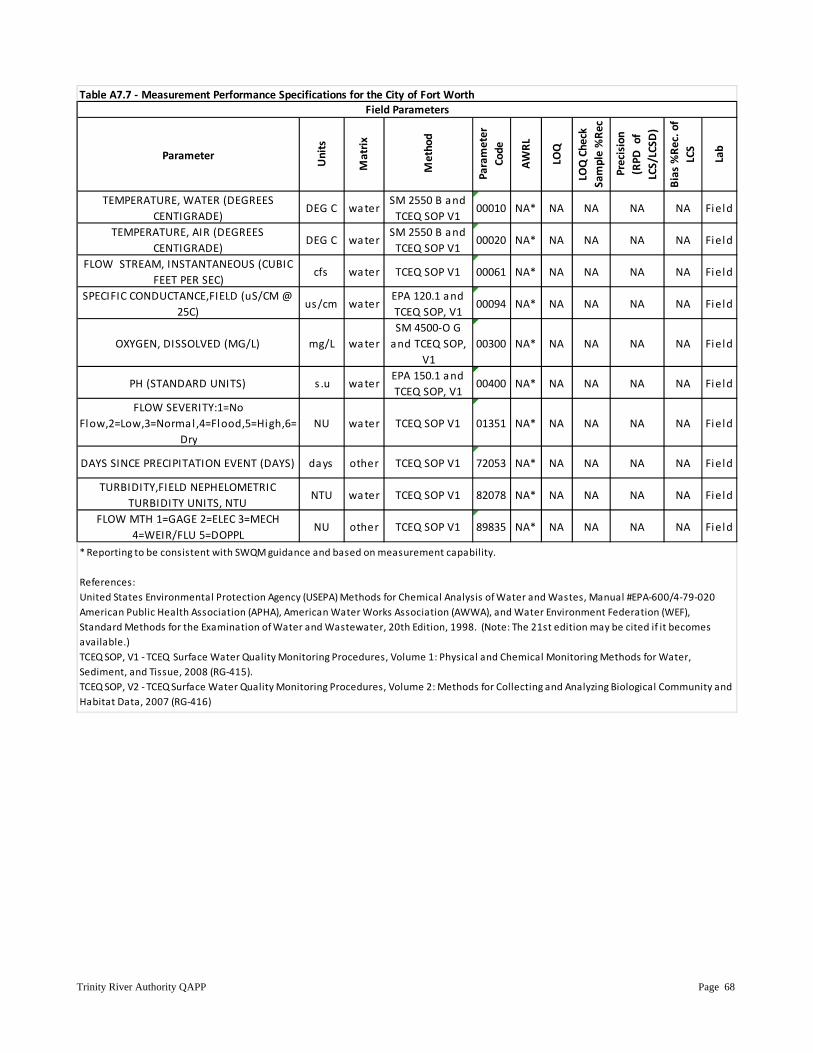
Trinity River Authority QAPP Page 68
Parameter
Units
Matrix
Method
Parameter
Code
AWRL
LOQ
LOQ Check
Sample %Re
c
Precision
(RPD
of
LCS/LCSD
)
Bias %Re
c. of
LCS
Lab
TEMPERATURE, WATER (DEGREES CENTIGRADE)
DEG C waterSM 2550 B and TCEQ SOP V1
00010 NA* NA NA NA NA Field
TEMPERATURE, AIR (DEGREES CENTIGRADE)
DEG C waterSM 2550 B and TCEQ SOP V1
00020 NA* NA NA NA NA Field
FLOW STREAM, INSTANTANEOUS (CUBIC FEET PER SEC)
cfs water TCEQ SOP V1 00061 NA* NA NA NA NA Field
SPECIFIC CONDUCTANCE,FIELD (uS/CM @ 25C)
us/cm waterEPA 120.1 and TCEQ SOP, V1
00094 NA* NA NA NA NA Field
OXYGEN, DISSOLVED (MG/L) mg/L waterSM 4500‐O G and TCEQ SOP,
V100300 NA* NA NA NA NA Field
PH (STANDARD UNITS) s .u waterEPA 150.1 and TCEQ SOP, V1
00400 NA* NA NA NA NA Field
FLOW SEVERITY:1=No Flow,2=Low,3=Normal ,4=Flood,5=High,6=
DryNU water TCEQ SOP V1 01351 NA* NA NA NA NA Field
DAYS SINCE PRECIPITATION EVENT (DAYS) days other TCEQ SOP V1 72053 NA* NA NA NA NA Field
TURBIDITY,FIELD NEPHELOMETRIC TURBIDITY UNITS, NTU
NTU water TCEQ SOP V1 82078 NA* NA NA NA NA Field
FLOW MTH 1=GAGE 2=ELEC 3=MECH 4=WEIR/FLU 5=DOPPL
NU other TCEQ SOP V1 89835 NA* NA NA NA NA Field
* Reporting to be consistent with SWQM guidance and based on measurement capability.
References:United States Environmental Protection Agency (USEPA) Methods for Chemical Analysis of Water and Wastes, Manual #EPA‐600/4‐79‐020American Public Health Association (APHA), American Water Works Association (AWWA), and Water Environment Federation (WEF), Standard Methods for the Examination of Water and Wastewater, 20th Edition, 1998. (Note: The 21st edition may be cited if it becomes available.)TCEQ SOP, V1 ‐ TCEQ Surface Water Quality Monitoring Procedures, Volume 1: Physical and Chemical Monitoring Methods for Water, Sediment, and Tissue, 2008 (RG‐415).TCEQ SOP, V2 ‐ TCEQ Surface Water Quality Monitoring Procedures, Volume 2: Methods for Collecting and Analyzing Biological Community and Habitat Data, 2007 (RG‐416)
Field ParametersTable A7.7 ‐ Measurement Performance Specifications for the City of Fort Worth

Trinity River Authority QAPP Page 69
Parameter
Units
Matrix
Method
Parameter
Code
AWRL
LOQ
LOQ Check
Sample %Re
c
Precision
(RPD
of
LCS/LCSD
)
Bias %Re
c. of
LCS
Lab
TEMPERATURE, WATER (DEGREES CENTIGRADE)
DEG C waterSM 2550 B and TCEQ SOP V1
00010 NA* NA NA NA NA Field
TEMPERATURE, AIR (DEGREES CENTIGRADE)
DEG C waterSM 2550 B and TCEQ SOP V1
00020 NA* NA NA NA NA Field
FLOW STREAM, INSTANTANEOUS (CUBIC FEET PER SEC)
cfs water TCEQ SOP V1 00061 NA* NA NA NA NA Field
TRANSPARENCY, SECCHI DISC (METERS) meters water TCEQ SOP V1 00078 NA* NA NA NA NA FieldSPECIFIC CONDUCTANCE,FIELD (uS/CM @
25C)us/cm water
EPA 120.1 and TCEQ SOP, V1
00094 NA* NA NA NA NA Field
OXYGEN, DISSOLVED (MG/L) mg/L waterSM 4500‐O G and TCEQ SOP,
V100300 NA* NA NA NA NA Field
PH (STANDARD UNITS) s .u waterEPA 150.1 and TCEQ SOP, V1
00400 NA* NA NA NA NA Field
FLOW SEVERITY:1=No Flow,2=Low,3=Normal ,4=Flood,5=High,6=
DryNU water TCEQ SOP V1 01351 NA* NA NA NA NA Field
DAYS SINCE PRECIPITATION EVENT (DAYS) days other TCEQ SOP V1 72053 NA* NA NA NA NA Field
STREAM FLOW ESTIMATE (CFS) cfs Water TCEQ SOP, V1 74069 NA* NA NA NA NA FieldFLOW MTH 1=GAGE 2=ELEC 3=MECH
4=WEIR/FLU 5=DOPPLNU other TCEQ SOP V1 89835 NA* NA NA NA NA Field
Parameter
Units
Matrix
Method
Parameter
Code
AWRL
LOQ
LOQ Check
Sample %Re
c
Precision
(RPD
of
LCS/LCSD
)
Bias %Re
c. of
LCS
Lab
NITROGEN, AMMONIA, TOTAL (MG/L AS N)
mg/L water SM 4500 NH3 H 00610 0.1 0.02 70‐130 20 80‐120 TRA
NITROGEN, KJELDAHL, TOTAL (MG/L AS N) mg/L water SM 4500 NH3 D 00625 0.2 0.2 70‐130 20 80‐120 TRA
NITRITE PLUS NITRATE, TOTAL 1 DET. (MG/L AS N)
mg/L waterEPA 300.0 Rev. 2.1 (1993)
00630 0.05 0.05 70‐130 20 80‐120 TRA
PHOSPHORUS, TOTAL, WET METHOD (MG/L AS P)
mg/L water SM 4500 P E 00665 0.06 0.02 70‐130 20 80‐120 TRA
HARDNESS, TOTAL (MG/L AS CACO3)**** mg/L water SM 2340 C 00900 5 5 NA 20 80‐120 TRAE. COLI, COLILERT, IDEXX METHOD,
MPN/100MLMPN/100 mL
waterCol i lert/Col i ler
t 18***31699 1 1 NA 0.50** NA TRA
CHLOROPHYLL‐A UG/L SPECTROPHOTOMETRIC ACID. METH
μg/L water SM 10200 H 32211 3 3 NA 20 80‐120 TRA
ORTHOPHOSPHATE PHOSPHORUS,DISS,MG/L,FILTER >15MIN
mg/L water SM 4500 P F 70507 0.04 0.02 70‐130 20 80‐120 TRA
Field Parameters
Conventional and Bacteriological Parameters in Water
Table A7.8 ‐ Measurement Performance Specifications for the City of Irving
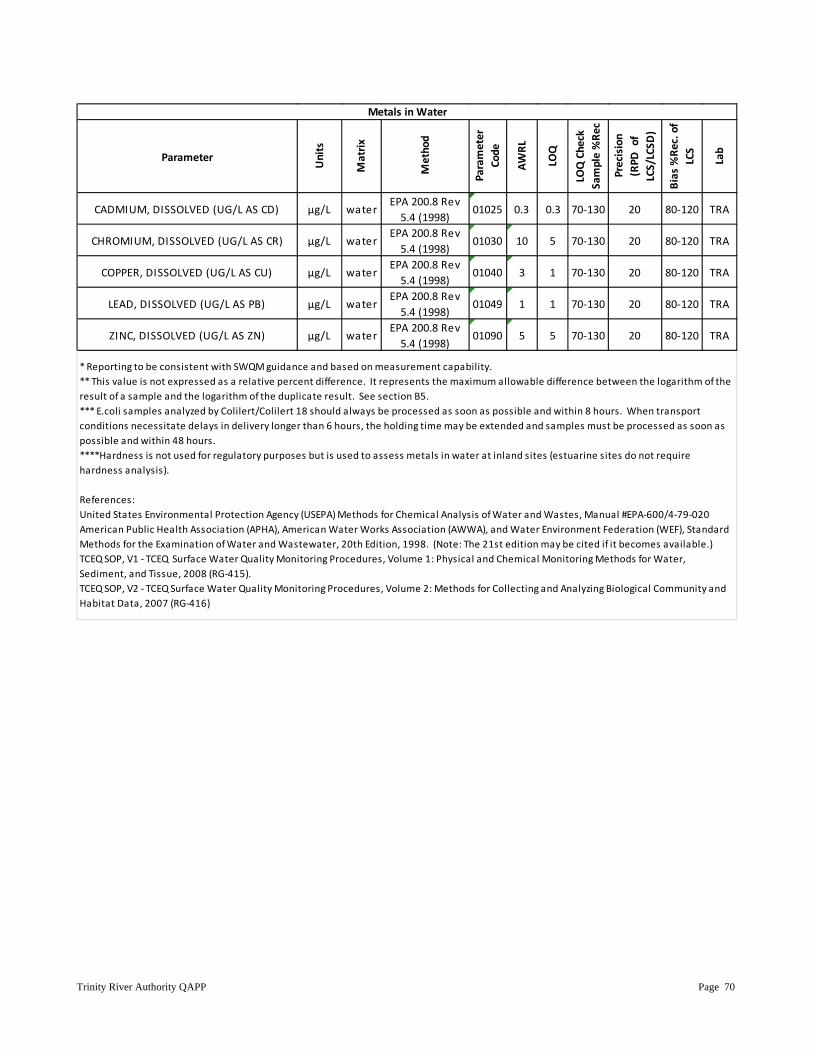
Trinity River Authority QAPP Page 70
Parameter
Units
Matrix
Method
Parameter
Code
AWRL
LOQ
LOQ Check
Sample %Re
c
Precision
(RPD
of
LCS/LCSD
)
Bias %Re
c. of
LCS
Lab
CADMIUM, DISSOLVED (UG/L AS CD) μg/L waterEPA 200.8 Rev 5.4 (1998)
01025 0.3 0.3 70‐130 20 80‐120 TRA
CHROMIUM, DISSOLVED (UG/L AS CR) μg/L waterEPA 200.8 Rev 5.4 (1998)
01030 10 5 70‐130 20 80‐120 TRA
COPPER, DISSOLVED (UG/L AS CU) μg/L waterEPA 200.8 Rev 5.4 (1998)
01040 3 1 70‐130 20 80‐120 TRA
LEAD, DISSOLVED (UG/L AS PB) μg/L waterEPA 200.8 Rev 5.4 (1998)
01049 1 1 70‐130 20 80‐120 TRA
ZINC, DISSOLVED (UG/L AS ZN) μg/L waterEPA 200.8 Rev 5.4 (1998)
01090 5 5 70‐130 20 80‐120 TRA
Metals in Water
* Reporting to be consistent with SWQM guidance and based on measurement capability. ** This value is not expressed as a relative percent difference. It represents the maximum allowable difference between the logarithm of the result of a sample and the logarithm of the duplicate result. See section B5.*** E.coli samples analyzed by Colilert/Colilert 18 should always be processed as soon as possible and within 8 hours. When transport conditions necessitate delays in delivery longer than 6 hours, the holding time may be extended and samples must be processed as soon as possible and within 48 hours.****Hardness is not used for regulatory purposes but is used to assess metals in water at inland sites (estuarine sites do not require hardness analysis).
References:United States Environmental Protection Agency (USEPA) Methods for Chemical Analysis of Water and Wastes, Manual #EPA‐600/4‐79‐020American Public Health Association (APHA), American Water Works Association (AWWA), and Water Environment Federation (WEF), Standard Methods for the Examination of Water and Wastewater, 20th Edition, 1998. (Note: The 21st edition may be cited if it becomes available.)TCEQ SOP, V1 ‐ TCEQ Surface Water Quality Monitoring Procedures, Volume 1: Physical and Chemical Monitoring Methods for Water, Sediment, and Tissue, 2008 (RG‐415).TCEQ SOP, V2 ‐ TCEQ Surface Water Quality Monitoring Procedures, Volume 2: Methods for Collecting and Analyzing Biological Community and Habitat Data, 2007 (RG‐416)
Trinity River Authority QAPP Page 71
TRA CLEAN RIVERS PROGRAM
APPENDIX B TASK 3 WORK PLAN & SAMPLING PROCESS DESIGN AND MONITORING
SCHEDULE (PLAN)
Trinity River Authority QAPP Page 72
TASK3:WATERQUALITYMONITORING Objectives: Water quality monitoring will focus on collecting information to characterize water quality in a variety of locations and conditions. These efforts will include a combination of:
• planning and coordinating basin-wide monitoring, • routine, regularly-scheduled monitoring to collect long-term information and support statewide
assessment of water quality, • systematic, regularly-scheduled short-term monitoring to screen water bodies for issues, • permit support monitoring to provide information for setting permit effluent limits, and • special study, intensive monitoring targeted to:
o identify sources and causes of pollution, o assess priority water quality issues, o obtain background water quality information, o provide information for setting site-specific permit effluent limits, and o evaluate statewide, regional, and site-specific water quality standards.
Task Description: The focus of routine monitoring in the Trinity basin will continue to be on working with participating agencies and gaining new participating agencies to obtain their data on a voluntary basis. TRA CRP staff will collect a limited number of samples as described below. Monitoring Description - TRA CRP staff will routinely monitor water quality conditions at approximately 14 stations in the Trinity basin. Samples to be collected at these stations will include flow (from USGS gages), field, nutrients, conventionals, bacteriological, and dissolved metals. Samples will be collected quarterly and semiannually for dissolved metals. All monitoring procedures and methods used by within-basin participating agencies as well as TRA CRP staff will follow the guidelines prescribed in the Trinity River Authority QAPP, the TCEQ Surface Water Quality Monitoring Procedures, Volume 1: Physical and Chemical Monitoring Methods for Water, Sediment, and Tissue (RG-415) and the TCEQ Surface Water Quality Monitoring Procedures, Volume 2: Methods for Collecting and Analyzing Biological Community and Habitat Data (RG-416). TRA provides assistance to participating agencies contributing data to the Clean Rivers Program by paying for CRP quality assurance requirements as well as additional parameters collected at TRA’s request on behalf of the Clean Rivers Program as negotiated with each participating agency. Quality Assurance requirements funded by the program include: analysis of duplicate samples, equipment blanks and blanks as required under SWQM guidance and as negotiated with participating agencies; nitric and sulfuric acid for field preservation of parameters as required under the SWQM guidance; filter apparatuses and membranes or filter capsules for field filtration as required under SWQM guidance (i.e. for dissolved metals). TRA also provides other sampling equipment as may be deemed beneficial to the program or as necessitated by quality assurance requirements (e.g. pumps for collection and filtration of water samples, Secchi tubes for recording turbidity measurements, etc.). Stations monitored by participating agencies are detailed in Appendix B of the Basin-Wide QAPP. General descriptions of routine water quality monitoring by participating agencies are listed below, but may be updated in future amendment and appendices.
1) City of Arlington – 12 sites monitored quarterly for field parameters, dissolved metals, and bacteria. 4 of these sites are also monitored for nutrients and conventionals.
2) City of Dallas – 30 sites monitored monthly for field parameters. Dissolved metals are collected semiannually.
Trinity River Authority QAPP Page 73
3) City of Fort Worth – 6 sites monitored monthly for field parameters. 4) City of Grand Prairie – 22 sites monitored monthly for field parameters and bacteria. Nutrients
and conventionals will be monitored quarterly. Dissolved metals and organics will be monitored annually.
5) City of Irving – 6 sites monitored quarterly for field parameters, bacteria, metals, nutrients, and conventionals. 2 additional sites are monitored quarterly for field parameters and bacteria only.
6) Lake Livingston Project – 6 sites feeding Trinity Bay are monitored for field parameters, nutrients, and conventionals. 5 of these sites are monitored quarterly, while 1 site is monitored monthly. 16 sites in the southern basin are monitored from monthly, quarterly, or semiannually for field parameters, bacteria, nutrients, conventionals, and metals. 6 sites are monitored approximately twice a year for diurnal DO.
7) Tarrant Regional Water District – 58 sites monitored in and around reservoirs from monthly to semiannually for field parameters, bacteria, nutrients, conventionals, and metals. 10 sites on the West Fork Trinity and its tributaries monitored quarterly for field parameter and bacteria. 7 sites monitored approximately twice a year for diurnal DO.
TRA CRP staff may begin an intensive watershed monitoring program to rotate quarterly and monitor water quality in less represented watersheds. This monitoring may be conducted in response to assessment findings, changes in landuse, or other conditions as deemed appropriate. Sites, parameters, and frequencies will be determined at a later date. Coordinated Monitoring Meeting - The Trinity River Authority will hold an annual coordinated monitoring meeting. Qualified monitoring organizations will be invited to attend the working meeting in which monitoring needs and purposes will be discussed segment by segment and station by station. Information from participants and stakeholders will be used to select stations and parameters that will enhance overall water quality monitoring coverage, eliminate duplication of effort, and address basin priorities. The changes to the monitoring schedule will be entered into the statewide database on the Internet (http://cms.lcra.org) and communicated to meeting attendees. Changes to monitoring that occur during the course of the year will be entered into the statewide database on the Internet and communicated to meeting attendees. Progress Report - Each Progress Report will indicate the number of sampling events and the types of monitoring conducted in the quarter, to include all types of monitoring. Biological Data Reports - Biological/habitat data collected under an approved QAPP will be submitted in a pdf document using the Biological Data Reporting Packet outlined in Exhibit 3D in the CRP Guidance. Permit Support Monitoring - A summary report of permit support flow monitoring will be submitted at the end of each sampling year. The summary report will include a map, photos, a summary of the flow monitoring data, and a summary of other water quality data collected during the flow monitoring event(s). The summary report must include copies of flow monitoring data sheets (see Exhibit 3A of the CRP Guidance). Receiving Water Assessment (RWA) Reports with color photos (see the Biological Data Reporting Packet, Exhibit 3D in the CRP Guidance, for more information) will be submitted no later than six (6) months before the permit renewal date. Special Studies - Status reports of each special study will describe activities during the quarter. The status reports will be submitted along with the Progress Report. To help keep the public and basin
Trinity River Authority QAPP Page 74
stakeholders informed, the Web site will be updated in a timely manner to include key elements of Special Studies’ Reports or Summaries (e.g., status reports, executive summary, maps, data analysis). Deliverables & Dues Dates: September 1, 2011 through August 31, 2012
A. Conduct water quality monitoring, summarize activities, and submit with Progress Report - December 15, 2011; March 15 and June 15, 2012
B. Coordinated Monitoring Meeting - between March 15 and April 30, 2012 C. Coordinated Monitoring Meeting Summary of Changes - May 15, 2012 D. Email notification that Coordinated Monitoring Schedule updates are complete - May 31, 2012 E. Biological Data Report - coordinate due date(s) with TCEQ Project Manager F. Permit Support Data Report - coordinate due date(s) with TCEQ Project Manager G. Special Study - Status Reports - December 15, 2011; March 15 and June 15, 2012 H. Special Study - Draft Report - coordinate due date with TCEQ Project Manager I. Special Study - Final Report - coordinate due date with TCEQ Project Manager J. Special Study - post Final Report to Web - coordinate due date with TCEQ Project Manager
September 1, 2012 through August 31, 2013
A. Conduct water quality monitoring, summarize activities, and submit with Progress Report - September 15 and December 15, 2012; March 15 and June 15 and August 31, 2013
B. Coordinated Monitoring Meeting - between March 15 and April 30, 2013 C. Coordinated Monitoring Meeting Summary of Changes – May 15, 2013 D. Email notification that Coordinated Monitoring Schedule updates are complete - May 31, 2013 E. Biological Data Report - coordinate due date(s) with TCEQ Project Manager F. Permit Support Data Report - coordinate due date(s) with TCEQ Project Manager G. Special Study - Status Reports - September 15 and December 15, 2012; March 15 and June 15,
2013 H. Special Study - Draft Report - coordinate due date with TCEQ Project Manager I. Special Study - Final Report - coordinate due date with TCEQ Project Manager J. Special Study - post Final Report to Web - coordinate due date with TCEQ Project Manager
Trinity River Authority QAPP Page 75
APPENDIXBSAMPLINGPROCESSDESIGNANDMONITORINGSCHEDULE(PLAN) Sample Design Rationale FY 2012 The sample design is based on the legislative intent of the Clean Rivers Program. Under the legislation, the Basin Planning Agencies have been tasked with providing data to characterize water quality conditions in support of the Texas Water Quality Integrated Report, and to identify significant long-term water quality trends. Based on Steering Committee input, achievable water quality objectives and priorities and the identification of water quality issues are used to develop work plans which are in accord with available resources. As part of the Steering Committee process, the TRA coordinates closely with the TCEQ and other participants to ensure a comprehensive water monitoring strategy within the watershed. A discussion of past or ongoing water quality issues should be provided here to justify the monitoring schedule. FY2010 Monitoring Schedule Changes The following changes were made to the FY2012 Monitoring Schedule as a result of the FY2012 Coordinated Monitoring Meeting and represent differences from the FY2011 Monitoring Schedule:
1. City of Irving – Frequency of monitoring at sites 10865, 10869, 17162, 17166, 17170, 17178, 18310, 20311 was increased from quarterly to bimonthly in order to increase the number of bacteria samples available to possibly delist the sites faster. Data shows improvement with low bacteria samples.
2. City of Dallas – Sites for the Trinity Watershed Management department were added. Sites 20444, 20933, 20934 were added in response to possible TMDL’s in the area and plans for increased contact recreation.
3. Tarrant Regional Water District – Four sites were moved upstream or downstream to USGS gage locations, the monitoring frequencies were not changed. 18572 was moved to 10705, 10975 was moved to 10977, 16778 was moved to 21000, and 13691 was moved to 16414. Routine monitoring (not related to the West Fork E. Coli monitoring) at 17844 was moved to 10969 to take over the monitoring activities that were previously conducted by TCEQ field office staff at 10969.
4. Trinity River Authority – Sites 21001 and 10765 were added for monthly permit support flow monitoring at the request of TCEQ.
Site Selection Criteria The intent of the TRA Clean Rivers Program monitoring network is to develop and maintain a basin-wide water quality monitoring program that minimizes duplicative monitoring, facilitates the assessment process, and targets monitoring to support the permits and standards process. This data collection effort involves monitoring routine water quality, using procedures that are consistent with the TCEQ SWQM program, for the purpose of data entry into the SWQMIS database maintained by the TCEQ. To this end, some general guidelines are followed when selecting sampling sites, as basically outlined below, and discussed thoroughly in the TCEQ Surface Water Quality Monitoring Procedures, Volume 1 (RG-415). Overall consideration is given to accessibility and safety. All monitoring activities have been developed in coordination with the CRP Steering Committee and with the TCEQ. 1. Locate stream sites so that samples can be safely collected from the centroid of flow. Centroid is
defined as the midpoint of that portion of stream width which contains 50 percent of the total flow. If few sites are available for a stream segment, choose one that would best represent the water body, and not an unusual condition or contaminant source. Avoid backwater areas or eddies when
Trinity River Authority QAPP Page 76
selecting a stream site.
2. At a minimum for reservoirs, locate sites near the dam (reservoirs) and in the major arms. Larger reservoirs might also include stations in the middle and upper (riverine) areas. Select sites that best represent the water body by avoiding coves and back water areas. A single monitoring site is considered representative of 25 percent of the total reservoir acres, but not more than 5,120 acres.
3. Routine monitoring sites are selected to maximize stream coverage or basin coverage. Very long segments may require more stations. As a rule of thumb, stream segments between 25 and 50 miles long require two stations, and longer than 50 miles require three or more depending on the existence of areas with significantly different sources of contamination or potential water quality concerns. Major hydrological features, such as the confluence of a major tributary or an instream dam, may also limit the spatial extent of an assessment based on one station.
4. Because historical water quality data can be very useful in assessing use attainment or impairment, it may be best to use sites that are on current or past monitoring schedules.
5. All classified segments (including reservoirs) should have at least one routine monitoring site that adequately characterizes the water body, and should be coordinated with the TCEQ or other qualified monitoring entities reporting routine data to TCEQ.
6. Routine monitoring sites may be selected to bracket sources of pollution, influence of tributaries, changes in land uses, and hydrological modifications.
7. Sites should be accessible. When possible, stream sites should have a USGS stream flow gauge. If not, it should be possible to conduct flow measurement during routine visits.
Monitoring Sites Monitoring Tables for fiscal year 2012 are presented on the following page.
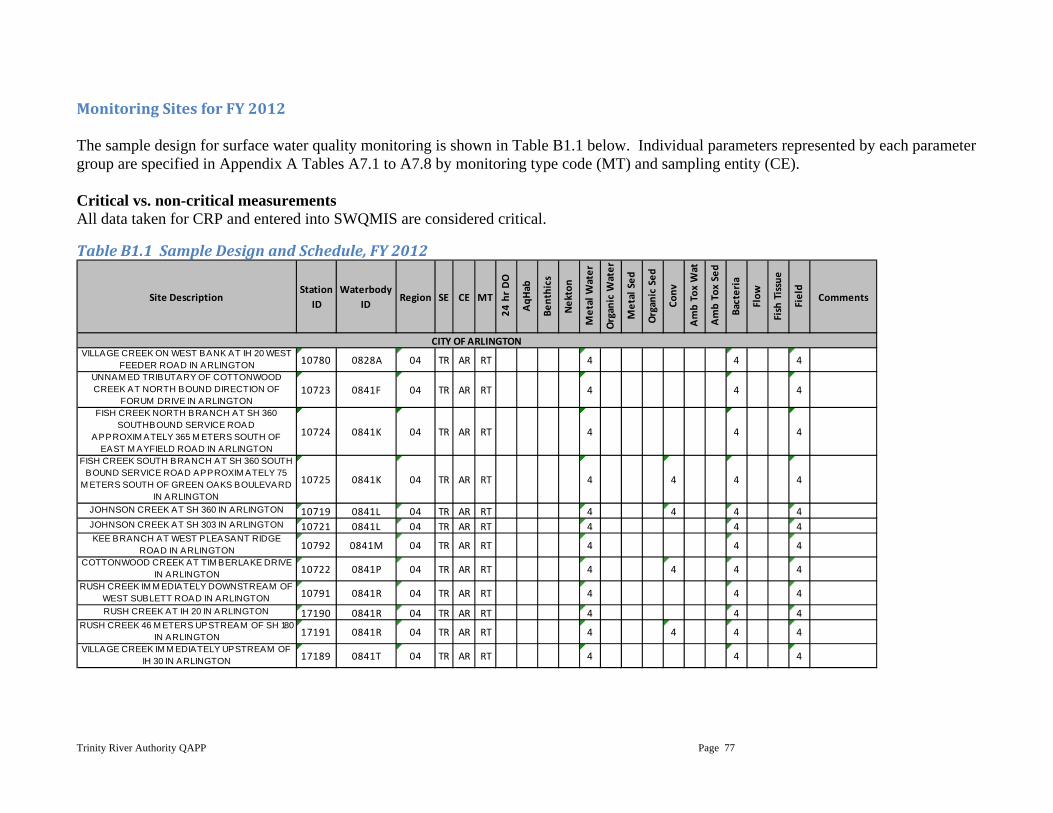
Trinity River Authority QAPP Page 77
MonitoringSitesforFY2012 The sample design for surface water quality monitoring is shown in Table B1.1 below. Individual parameters represented by each parameter group are specified in Appendix A Tables A7.1 to A7.8 by monitoring type code (MT) and sampling entity (CE). Critical vs. non-critical measurements All data taken for CRP and entered into SWQMIS are considered critical.
TableB1.1SampleDesignandSchedule,FY2012
Site DescriptionStation
IDWaterbody
IDRegion SE CE MT
24 hr DO
AqH
ab
Benthics
Nekton
Metal W
ater
Organic W
ater
Metal Sed
Organic Sed
Conv
Amb Tox Wat
Amb Tox Sed
Bacteria
Flow
Fish Tissue
Field
Comments
VILLAGE CREEK ON WEST BANK AT IH 20 WEST FEEDER ROAD IN ARLINGTON 10780 0828A 04 TR AR RT 4 4 4
UNNAM ED TRIBUTARY OF COTTONWOOD CREEK AT NORTH BOUND DIRECTION OF
FORUM DRIVE IN ARLINGTON10723 0841F 04 TR AR RT 4 4 4
FISH CREEK NORTH BRANCH AT SH 360 SOUTHBOUND SERVICE ROAD
APPROXIM ATELY 365 M ETERS SOUTH OF EAST M AYFIELD ROAD IN ARLINGTON
10724 0841K 04 TR AR RT 4 4 4
FISH CREEK SOUTH BRANCH AT SH 360 SOUTH BOUND SERVICE ROAD APPROXIM ATELY 75
M ETERS SOUTH OF GREEN OAKS BOULEVARD IN ARLINGTON
10725 0841K 04 TR AR RT 4 4 4 4
JOHNSON CREEK AT SH 360 IN ARLINGTON 10719 0841L 04 TR AR RT 4 4 4 4JOHNSON CREEK AT SH 303 IN ARLINGTON 10721 0841L 04 TR AR RT 4 4 4KEE BRANCH AT WEST PLEASANT RIDGE
ROAD IN ARLINGTON 10792 0841M 04 TR AR RT 4 4 4COTTONWOOD CREEK AT TIM BERLAKE DRIVE
IN ARLINGTON 10722 0841P 04 TR AR RT 4 4 4 4RUSH CREEK IM M EDIATELY DOWNSTREAM OF
WEST SUBLETT ROAD IN ARLINGTON 10791 0841R 04 TR AR RT 4 4 4
RUSH CREEK AT IH 20 IN ARLINGTON 17190 0841R 04 TR AR RT 4 4 4RUSH CREEK 46 M ETERS UPSTREAM OF SH 180
IN ARLINGTON 17191 0841R 04 TR AR RT 4 4 4 4VILLAGE CREEK IM M EDIATELY UPSTREAM OF
IH 30 IN ARLINGTON 17189 0841T 04 TR AR RT 4 4 4
CITY OF ARLINGTON
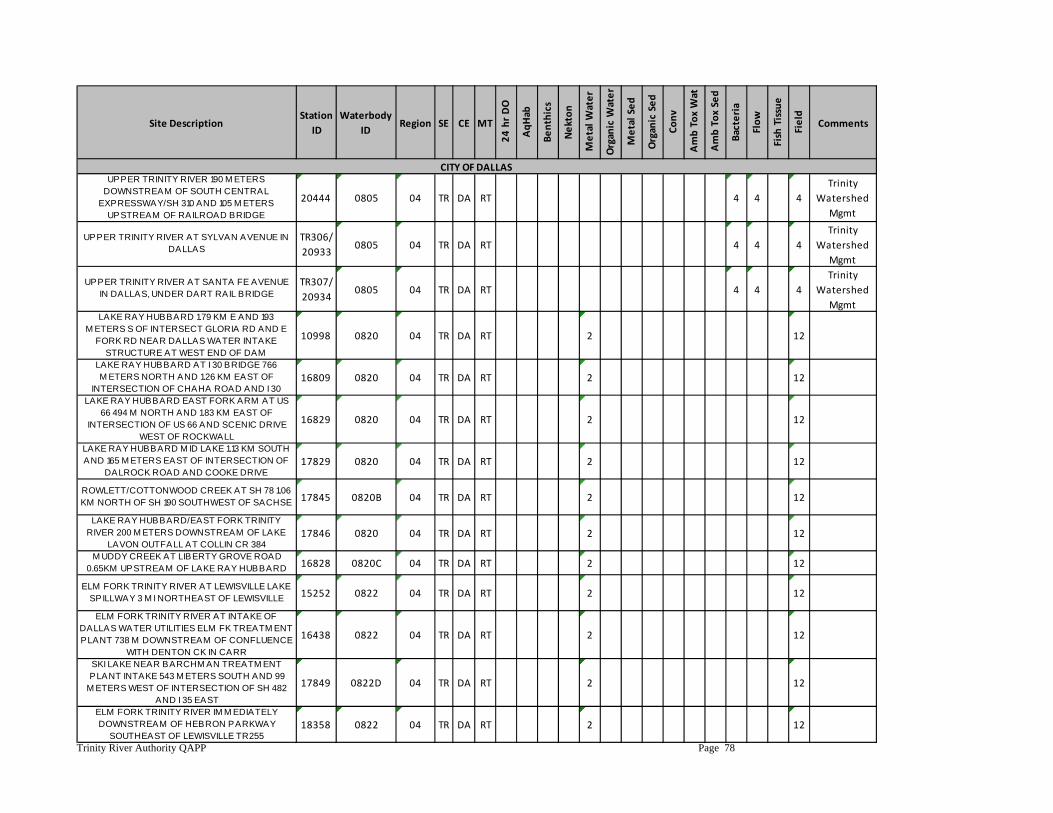
Trinity River Authority QAPP Page 78
Site DescriptionStation
IDWaterbody
IDRegion SE CE MT
24 hr DO
AqH
ab
Benthics
Nekton
Metal W
ater
Organic W
ater
Metal Sed
Organic Sed
Conv
Amb Tox Wat
Amb Tox Sed
Bacteria
Flow
Fish Tissue
Field
Comments
UPPER TRINITY RIVER 190 M ETERS DOWNSTREAM OF SOUTH CENTRAL
EXPRESSWAY/SH 310 AND 105 M ETERS UPSTREAM OF RAILROAD BRIDGE
20444 0805 04 TR DA RT 4 4 4Trinity
Watershed Mgmt
UPPER TRINITY RIVER AT SYLVAN AVENUE IN DALLAS
TR306/ 20933
0805 04 TR DA RT 4 4 4Trinity
Watershed Mgmt
UPPER TRINITY RIVER AT SANTA FE AVENUE IN DALLAS, UNDER DART RAIL BRIDGE
TR307/ 20934
0805 04 TR DA RT 4 4 4Trinity
Watershed Mgmt
LAKE RAY HUBBARD 1.79 KM E AND 193 M ETERS S OF INTERSECT GLORIA RD AND E
FORK RD NEAR DALLAS WATER INTAKE STRUCTURE AT WEST END OF DAM
10998 0820 04 TR DA RT 2 12
LAKE RAY HUBBARD AT I 30 BRIDGE 766 M ETERS NORTH AND 1.26 KM EAST OF
INTERSECTION OF CHAHA ROAD AND I 3016809 0820 04 TR DA RT 2 12
LAKE RAY HUBBARD EAST FORK ARM AT US 66 494 M NORTH AND 1.83 KM EAST OF
INTERSECTION OF US 66 AND SCENIC DRIVE WEST OF ROCKWALL
16829 0820 04 TR DA RT 2 12
LAKE RAY HUBBARD M ID LAKE 1.13 KM SOUTH AND 165 M ETERS EAST OF INTERSECTION OF
DALROCK ROAD AND COOKE DRIVE17829 0820 04 TR DA RT 2 12
ROWLETT/COTTONWOOD CREEK AT SH 78 1.06 KM NORTH OF SH 190 SOUTHWEST OF SACHSE 17845 0820B 04 TR DA RT 2 12
LAKE RAY HUBBARD/EAST FORK TRINITY RIVER 200 M ETERS DOWNSTREAM OF LAKE
LAVON OUTFALL AT COLLIN CR 38417846 0820 04 TR DA RT 2 12
M UDDY CREEK AT LIBERTY GROVE ROAD 0.65KM UPSTREAM OF LAKE RAY HUBBARD 16828 0820C 04 TR DA RT 2 12
ELM FORK TRINITY RIVER AT LEWISVILLE LAKE SPILLWAY 3 M I NORTHEAST OF LEWISVILLE 15252 0822 04 TR DA RT 2 12
ELM FORK TRINITY RIVER AT INTAKE OF DALLAS WATER UTILITIES ELM FK TREATM ENT PLANT 738 M DOWNSTREAM OF CONFLUENCE
WITH DENTON CK IN CARR
16438 0822 04 TR DA RT 2 12
SKI LAKE NEAR BARCHM AN TREATM ENT PLANT INTAKE 543 M ETERS SOUTH AND 99
M ETERS WEST OF INTERSECTION OF SH 482 AND I 35 EAST
17849 0822D 04 TR DA RT 2 12
ELM FORK TRINITY RIVER IM M EDIATELY DOWNSTREAM OF HEBRON PARKWAY
SOUTHEAST OF LEWISVILLE TR25518358 0822 04 TR DA RT 2 12
CITY OF DALLAS
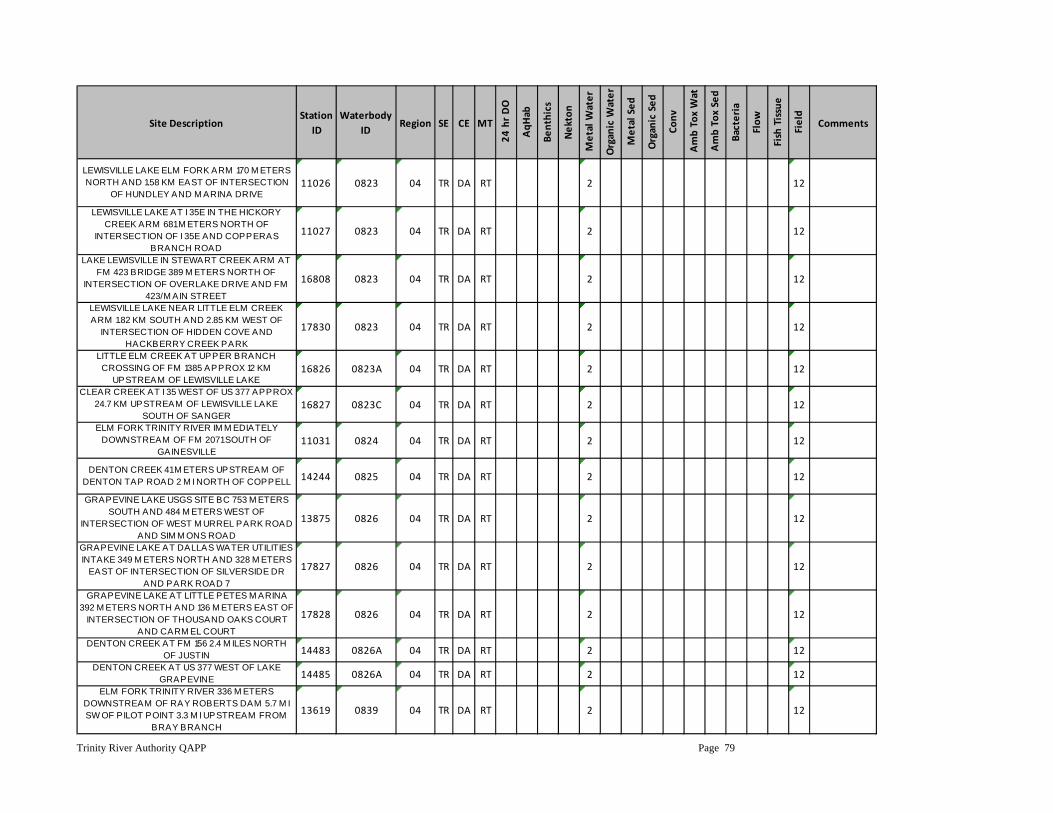
Trinity River Authority QAPP Page 79
Site DescriptionStation
IDWaterbody
IDRegion SE CE MT
24 hr DO
AqH
ab
Benthics
Nekton
Metal W
ater
Organic W
ater
Metal Sed
Organic Sed
Conv
Amb Tox Wat
Amb Tox Sed
Bacteria
Flow
Fish Tissue
Field
Comments
LEWISVILLE LAKE ELM FORK ARM 170 M ETERS NORTH AND 1.58 KM EAST OF INTERSECTION
OF HUNDLEY AND M ARINA DRIVE11026 0823 04 TR DA RT 2 12
LEWISVILLE LAKE AT I 35E IN THE HICKORY CREEK ARM 681 M ETERS NORTH OF
INTERSECTION OF I 35E AND COPPERAS BRANCH ROAD
11027 0823 04 TR DA RT 2 12
LAKE LEWISVILLE IN STEWART CREEK ARM AT FM 423 BRIDGE 389 M ETERS NORTH OF
INTERSECTION OF OVERLAKE DRIVE AND FM 423/M AIN STREET
16808 0823 04 TR DA RT 2 12
LEWISVILLE LAKE NEAR LITTLE ELM CREEK ARM 1.82 KM SOUTH AND 2.85 KM WEST OF
INTERSECTION OF HIDDEN COVE AND HACKBERRY CREEK PARK
17830 0823 04 TR DA RT 2 12
LITTLE ELM CREEK AT UPPER BRANCH CROSSING OF FM 1385 APPROX 12 KM
UPSTREAM OF LEWISVILLE LAKE16826 0823A 04 TR DA RT 2 12
CLEAR CREEK AT I 35 WEST OF US 377 APPROX 24.7 KM UPSTREAM OF LEWISVILLE LAKE
SOUTH OF SANGER16827 0823C 04 TR DA RT 2 12
ELM FORK TRINITY RIVER IM M EDIATELY DOWNSTREAM OF FM 2071 SOUTH OF
GAINESVILLE11031 0824 04 TR DA RT 2 12
DENTON CREEK 41 M ETERS UPSTREAM OF DENTON TAP ROAD 2 M I NORTH OF COPPELL 14244 0825 04 TR DA RT 2 12
GRAPEVINE LAKE USGS SITE BC 753 M ETERS SOUTH AND 484 M ETERS WEST OF
INTERSECTION OF WEST M URREL PARK ROAD AND SIM M ONS ROAD
13875 0826 04 TR DA RT 2 12
GRAPEVINE LAKE AT DALLAS WATER UTILITIES INTAKE 349 M ETERS NORTH AND 328 M ETERS
EAST OF INTERSECTION OF SILVERSIDE DR AND PARK ROAD 7
17827 0826 04 TR DA RT 2 12
GRAPEVINE LAKE AT LITTLE PETES M ARINA 392 M ETERS NORTH AND 136 M ETERS EAST OF
INTERSECTION OF THOUSAND OAKS COURT AND CARM EL COURT
17828 0826 04 TR DA RT 2 12
DENTON CREEK AT FM 156 2.4 M ILES NORTH OF JUSTIN 14483 0826A 04 TR DA RT 2 12
DENTON CREEK AT US 377 WEST OF LAKE GRAPEVINE 14485 0826A 04 TR DA RT 2 12
ELM FORK TRINITY RIVER 336 M ETERS DOWNSTREAM OF RAY ROBERTS DAM 5.7 M I SW OF PILOT POINT 3.3 M I UPSTREAM FROM
BRAY BRANCH
13619 0839 04 TR DA RT 2 12
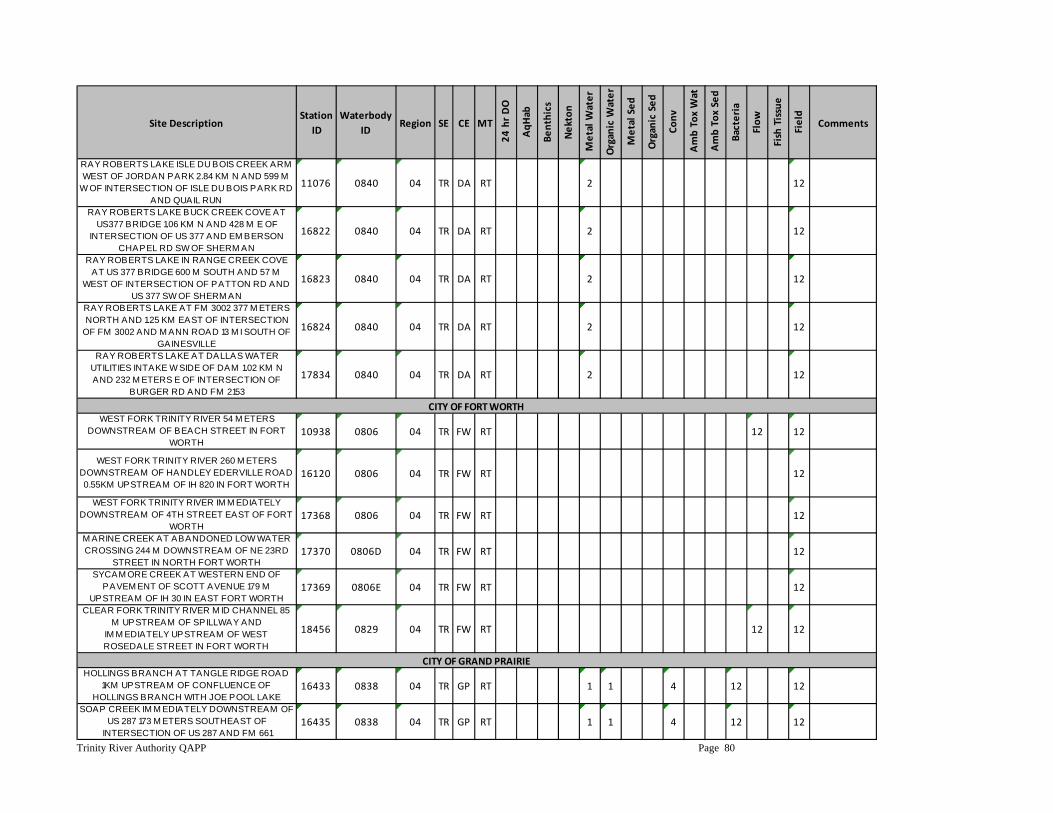
Trinity River Authority QAPP Page 80
Site DescriptionStation
IDWaterbody
IDRegion SE CE MT
24 hr DO
AqH
ab
Benthics
Nekton
Metal W
ater
Organic W
ater
Metal Sed
Organic Sed
Conv
Amb Tox Wat
Amb Tox Sed
Bacteria
Flow
Fish Tissue
Field
Comments
RAY ROBERTS LAKE ISLE DU BOIS CREEK ARM WEST OF JORDAN PARK 2.84 KM N AND 599 M
W OF INTERSECTION OF ISLE DU BOIS PARK RD AND QUAIL RUN
11076 0840 04 TR DA RT 2 12
RAY ROBERTS LAKE BUCK CREEK COVE AT US377 BRIDGE 1.06 KM N AND 428 M E OF
INTERSECTION OF US 377 AND EM BERSON CHAPEL RD SW OF SHERM AN
16822 0840 04 TR DA RT 2 12
RAY ROBERTS LAKE IN RANGE CREEK COVE AT US 377 BRIDGE 600 M SOUTH AND 57 M
WEST OF INTERSECTION OF PATTON RD AND US 377 SW OF SHERM AN
16823 0840 04 TR DA RT 2 12
RAY ROBERTS LAKE AT FM 3002 377 M ETERS NORTH AND 1.25 KM EAST OF INTERSECTION
OF FM 3002 AND M ANN ROAD 13 M I SOUTH OF GAINESVILLE
16824 0840 04 TR DA RT 2 12
RAY ROBERTS LAKE AT DALLAS WATER UTILITIES INTAKE W SIDE OF DAM 1.02 KM N AND 232 M ETERS E OF INTERSECTION OF
BURGER RD AND FM 2153
17834 0840 04 TR DA RT 2 12
WEST FORK TRINITY RIVER 54 M ETERS DOWNSTREAM OF BEACH STREET IN FORT
WORTH10938 0806 04 TR FW RT 12 12
WEST FORK TRINITY RIVER 260 M ETERS DOWNSTREAM OF HANDLEY EDERVILLE ROAD 0.55KM UPSTREAM OF IH 820 IN FORT WORTH
16120 0806 04 TR FW RT 12
WEST FORK TRINITY RIVER IM M EDIATELY DOWNSTREAM OF 4TH STREET EAST OF FORT
WORTH17368 0806 04 TR FW RT 12
M ARINE CREEK AT ABANDONED LOW WATER CROSSING 244 M DOWNSTREAM OF NE 23RD
STREET IN NORTH FORT WORTH17370 0806D 04 TR FW RT 12
SYCAM ORE CREEK AT WESTERN END OF PAVEM ENT OF SCOTT AVENUE 179 M
UPSTREAM OF IH 30 IN EAST FORT WORTH17369 0806E 04 TR FW RT 12
CLEAR FORK TRINITY RIVER M ID CHANNEL 85 M UPSTREAM OF SPILLWAY AND
IM M EDIATELY UPSTREAM OF WEST ROSEDALE STREET IN FORT WORTH
18456 0829 04 TR FW RT 12 12
HOLLINGS BRANCH AT TANGLE RIDGE ROAD 1KM UPSTREAM OF CONFLUENCE OF
HOLLINGS BRANCH WITH JOE POOL LAKE16433 0838 04 TR GP RT 1 1 4 12 12
SOAP CREEK IM M EDIATELY DOWNSTREAM OF US 287 173 M ETERS SOUTHEAST OF
INTERSECTION OF US 287 AND FM 66116435 0838 04 TR GP RT 1 1 4 12 12
CITY OF FORT WORTH
CITY OF GRAND PRAIRIE
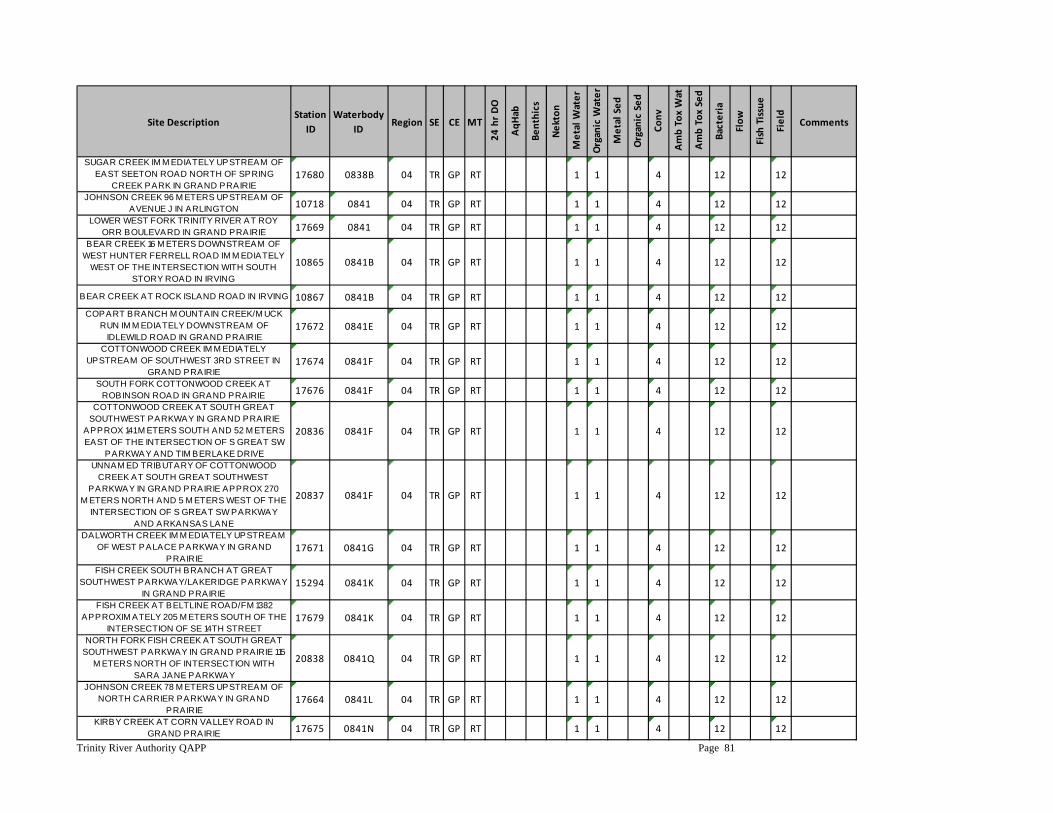
Trinity River Authority QAPP Page 81
Site DescriptionStation
IDWaterbody
IDRegion SE CE MT
24 hr DO
AqH
ab
Benthics
Nekton
Metal W
ater
Organic W
ater
Metal Sed
Organic Sed
Conv
Amb Tox Wat
Amb Tox Sed
Bacteria
Flow
Fish Tissue
Field
Comments
SUGAR CREEK IM M EDIATELY UPSTREAM OF EAST SEETON ROAD NORTH OF SPRING
CREEK PARK IN GRAND PRAIRIE17680 0838B 04 TR GP RT 1 1 4 12 12
JOHNSON CREEK 96 M ETERS UPSTREAM OF AVENUE J IN ARLINGTON 10718 0841 04 TR GP RT 1 1 4 12 12
LOWER WEST FORK TRINITY RIVER AT ROY ORR BOULEVARD IN GRAND PRAIRIE 17669 0841 04 TR GP RT 1 1 4 12 12
BEAR CREEK 16 M ETERS DOWNSTREAM OF WEST HUNTER FERRELL ROAD IM M EDIATELY
WEST OF THE INTERSECTION WITH SOUTH STORY ROAD IN IRVING
10865 0841B 04 TR GP RT 1 1 4 12 12
BEAR CREEK AT ROCK ISLAND ROAD IN IRVING 10867 0841B 04 TR GP RT 1 1 4 12 12COPART BRANCH M OUNTAIN CREEK/M UCK
RUN IM M EDIATELY DOWNSTREAM OF IDLEWILD ROAD IN GRAND PRAIRIE
17672 0841E 04 TR GP RT 1 1 4 12 12
COTTONWOOD CREEK IM M EDIATELY UPSTREAM OF SOUTHWEST 3RD STREET IN
GRAND PRAIRIE17674 0841F 04 TR GP RT 1 1 4 12 12
SOUTH FORK COTTONWOOD CREEK AT ROBINSON ROAD IN GRAND PRAIRIE 17676 0841F 04 TR GP RT 1 1 4 12 12
COTTONWOOD CREEK AT SOUTH GREAT SOUTHWEST PARKWAY IN GRAND PRAIRIE
APPROX 141 M ETERS SOUTH AND 52 M ETERS EAST OF THE INTERSECTION OF S GREAT SW
PARKWAY AND TIM BERLAKE DRIVE
20836 0841F 04 TR GP RT 1 1 4 12 12
UNNAM ED TRIBUTARY OF COTTONWOOD CREEK AT SOUTH GREAT SOUTHWEST
PARKWAY IN GRAND PRAIRIE APPROX 270 M ETERS NORTH AND 5 M ETERS WEST OF THE
INTERSECTION OF S GREAT SW PARKWAY AND ARKANSAS LANE
20837 0841F 04 TR GP RT 1 1 4 12 12
DALWORTH CREEK IM M EDIATELY UPSTREAM OF WEST PALACE PARKWAY IN GRAND
PRAIRIE17671 0841G 04 TR GP RT 1 1 4 12 12
FISH CREEK SOUTH BRANCH AT GREAT SOUTHWEST PARKWAY/LAKERIDGE PARKWAY
IN GRAND PRAIRIE15294 0841K 04 TR GP RT 1 1 4 12 12
FISH CREEK AT BELTLINE ROAD/FM 1382 APPROXIM ATELY 205 M ETERS SOUTH OF THE
INTERSECTION OF SE 14TH STREET17679 0841K 04 TR GP RT 1 1 4 12 12
NORTH FORK FISH CREEK AT SOUTH GREAT SOUTHWEST PARKWAY IN GRAND PRAIRIE 115
M ETERS NORTH OF INTERSECTION WITH SARA JANE PARKWAY
20838 0841Q 04 TR GP RT 1 1 4 12 12
JOHNSON CREEK 78 M ETERS UPSTREAM OF NORTH CARRIER PARKWAY IN GRAND
PRAIRIE17664 0841L 04 TR GP RT 1 1 4 12 12
KIRBY CREEK AT CORN VALLEY ROAD IN GRAND PRAIRIE 17675 0841N 04 TR GP RT 1 1 4 12 12
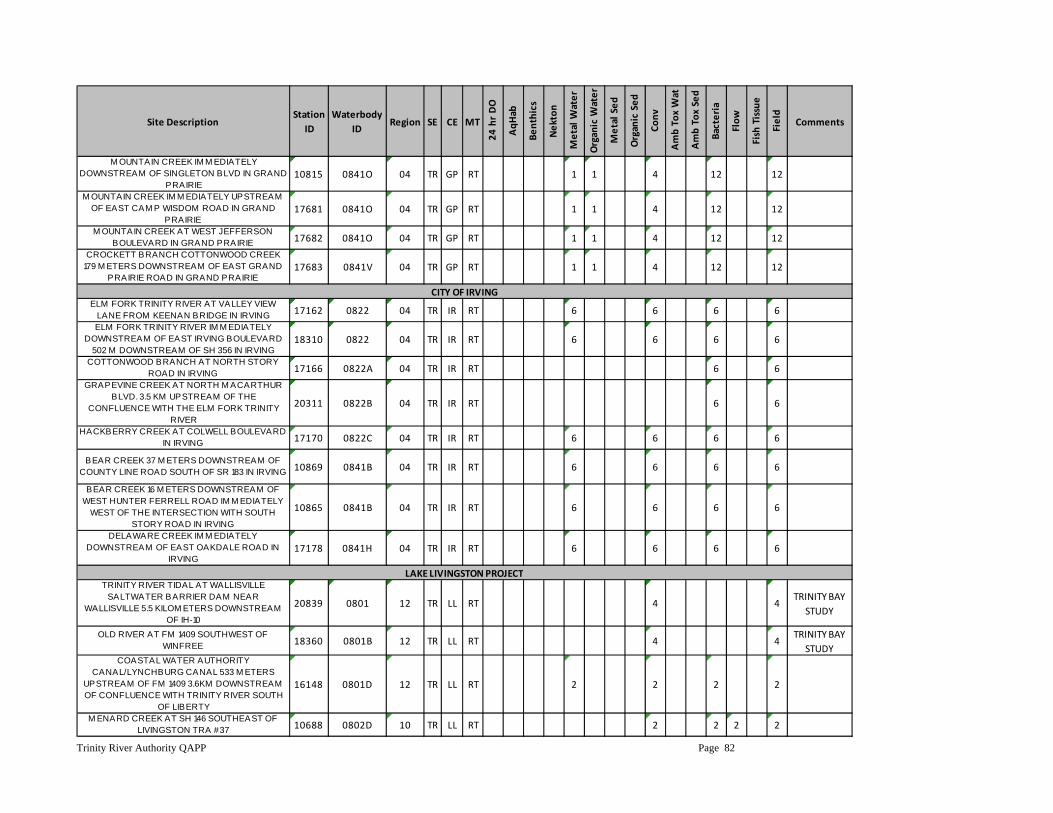
Trinity River Authority QAPP Page 82
Site DescriptionStation
IDWaterbody
IDRegion SE CE MT
24 hr DO
AqH
ab
Benthics
Nekton
Metal W
ater
Organic W
ater
Metal Sed
Organic Sed
Conv
Amb Tox Wat
Amb Tox Sed
Bacteria
Flow
Fish Tissue
Field
Comments
M OUNTAIN CREEK IM M EDIATELY DOWNSTREAM OF SINGLETON BLVD IN GRAND
PRAIRIE10815 0841O 04 TR GP RT 1 1 4 12 12
M OUNTAIN CREEK IM M EDIATELY UPSTREAM OF EAST CAM P WISDOM ROAD IN GRAND
PRAIRIE17681 0841O 04 TR GP RT 1 1 4 12 12
M OUNTAIN CREEK AT WEST JEFFERSON BOULEVARD IN GRAND PRAIRIE 17682 0841O 04 TR GP RT 1 1 4 12 12
CROCKETT BRANCH COTTONWOOD CREEK 179 M ETERS DOWNSTREAM OF EAST GRAND
PRAIRIE ROAD IN GRAND PRAIRIE17683 0841V 04 TR GP RT 1 1 4 12 12
ELM FORK TRINITY RIVER AT VALLEY VIEW LANE FROM KEENAN BRIDGE IN IRVING 17162 0822 04 TR IR RT 6 6 6 6ELM FORK TRINITY RIVER IM M EDIATELY
DOWNSTREAM OF EAST IRVING BOULEVARD 502 M DOWNSTREAM OF SH 356 IN IRVING
18310 0822 04 TR IR RT 6 6 6 6
COTTONWOOD BRANCH AT NORTH STORY ROAD IN IRVING 17166 0822A 04 TR IR RT 6 6
GRAPEVINE CREEK AT NORTH M ACARTHUR BLVD. 3.5 KM UPSTREAM OF THE
CONFLUENCE WITH THE ELM FORK TRINITY RIVER
20311 0822B 04 TR IR RT 6 6
HACKBERRY CREEK AT COLWELL BOULEVARD IN IRVING 17170 0822C 04 TR IR RT 6 6 6 6
BEAR CREEK 37 M ETERS DOWNSTREAM OF COUNTY LINE ROAD SOUTH OF SR 183 IN IRVING 10869 0841B 04 TR IR RT 6 6 6 6
BEAR CREEK 16 M ETERS DOWNSTREAM OF WEST HUNTER FERRELL ROAD IM M EDIATELY
WEST OF THE INTERSECTION WITH SOUTH STORY ROAD IN IRVING
10865 0841B 04 TR IR RT 6 6 6 6
DELAWARE CREEK IM M EDIATELY DOWNSTREAM OF EAST OAKDALE ROAD IN
IRVING17178 0841H 04 TR IR RT 6 6 6 6
TRINITY RIVER TIDAL AT WALLISVILLE SALTWATER BARRIER DAM NEAR
WALLISVILLE 5.5 KILOM ETERS DOWNSTREAM OF IH-10
20839 0801 12 TR LL RT 4 4TRINITY BAY
STUDY
OLD RIVER AT FM 1409 SOUTHWEST OF WINFREE 18360 0801B 12 TR LL RT 4 4
TRINITY BAY STUDY
COASTAL WATER AUTHORITY CANAL/LYNCHBURG CANAL 533 M ETERS
UPSTREAM OF FM 1409 3.6KM DOWNSTREAM OF CONFLUENCE WITH TRINITY RIVER SOUTH
OF LIBERTY
16148 0801D 12 TR LL RT 2 2 2 2
M ENARD CREEK AT SH 146 SOUTHEAST OF LIVINGSTON TRA #37 10688 0802D 10 TR LL RT 2 2 2 2
CITY OF IRVING
LAKE LIVINGSTON PROJECT
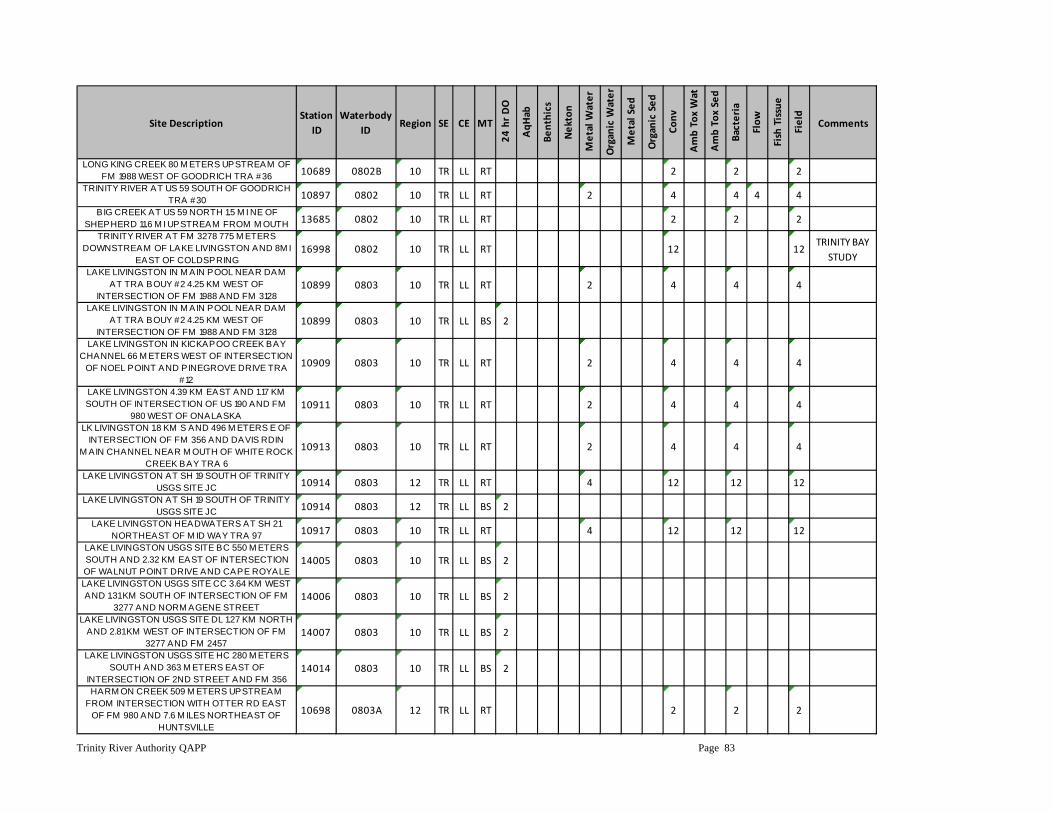
Trinity River Authority QAPP Page 83
Site DescriptionStation
IDWaterbody
IDRegion SE CE MT
24 hr DO
AqH
ab
Benthics
Nekton
Metal W
ater
Organic W
ater
Metal Sed
Organic Sed
Conv
Amb Tox Wat
Amb Tox Sed
Bacteria
Flow
Fish Tissue
Field
Comments
LONG KING CREEK 80 M ETERS UPSTREAM OF FM 1988 WEST OF GOODRICH TRA #36 10689 0802B 10 TR LL RT 2 2 2
TRINITY RIVER AT US 59 SOUTH OF GOODRICH TRA #30 10897 0802 10 TR LL RT 2 4 4 4 4
BIG CREEK AT US 59 NORTH 1.5 M I NE OF SHEPHERD 11.6 M I UPSTREAM FROM M OUTH 13685 0802 10 TR LL RT 2 2 2
TRINITY RIVER AT FM 3278 775 M ETERS DOWNSTREAM OF LAKE LIVINGSTON AND 8M I
EAST OF COLDSPRING16998 0802 10 TR LL RT 12 12
TRINITY BAY STUDY
LAKE LIVINGSTON IN M AIN POOL NEAR DAM AT TRA BOUY #2 4.25 KM WEST OF
INTERSECTION OF FM 1988 AND FM 312810899 0803 10 TR LL RT 2 4 4 4
LAKE LIVINGSTON IN M AIN POOL NEAR DAM AT TRA BOUY #2 4.25 KM WEST OF
INTERSECTION OF FM 1988 AND FM 312810899 0803 10 TR LL BS 2
LAKE LIVINGSTON IN KICKAPOO CREEK BAY CHANNEL 66 M ETERS WEST OF INTERSECTION
OF NOEL POINT AND PINEGROVE DRIVE TRA #12
10909 0803 10 TR LL RT 2 4 4 4
LAKE LIVINGSTON 4.39 KM EAST AND 1.17 KM SOUTH OF INTERSECTION OF US 190 AND FM
980 WEST OF ONALASKA10911 0803 10 TR LL RT 2 4 4 4
LK LIVINGSTON 1.8 KM S AND 496 M ETERS E OF INTERSECTION OF FM 356 AND DAVIS RDIN
M AIN CHANNEL NEAR M OUTH OF WHITE ROCK CREEK BAY TRA 6
10913 0803 10 TR LL RT 2 4 4 4
LAKE LIVINGSTON AT SH 19 SOUTH OF TRINITY USGS SITE JC 10914 0803 12 TR LL RT 4 12 12 12
LAKE LIVINGSTON AT SH 19 SOUTH OF TRINITY USGS SITE JC 10914 0803 12 TR LL BS 2
LAKE LIVINGSTON HEADWATERS AT SH 21 NORTHEAST OF M ID WAY TRA 97 10917 0803 10 TR LL RT 4 12 12 12
LAKE LIVINGSTON USGS SITE BC 550 M ETERS SOUTH AND 2.32 KM EAST OF INTERSECTION OF WALNUT POINT DRIVE AND CAPE ROYALE
14005 0803 10 TR LL BS 2
LAKE LIVINGSTON USGS SITE CC 3.64 KM WEST AND 1.31 KM SOUTH OF INTERSECTION OF FM
3277 AND NORM AGENE STREET14006 0803 10 TR LL BS 2
LAKE LIVINGSTON USGS SITE DL 1.27 KM NORTH AND 2.81 KM WEST OF INTERSECTION OF FM
3277 AND FM 245714007 0803 10 TR LL BS 2
LAKE LIVINGSTON USGS SITE HC 280 M ETERS SOUTH AND 363 M ETERS EAST OF
INTERSECTION OF 2ND STREET AND FM 35614014 0803 10 TR LL BS 2
HARM ON CREEK 509 M ETERS UPSTREAM FROM INTERSECTION WITH OTTER RD EAST
OF FM 980 AND 7.6 M ILES NORTHEAST OF HUNTSVILLE
10698 0803A 12 TR LL RT 2 2 2
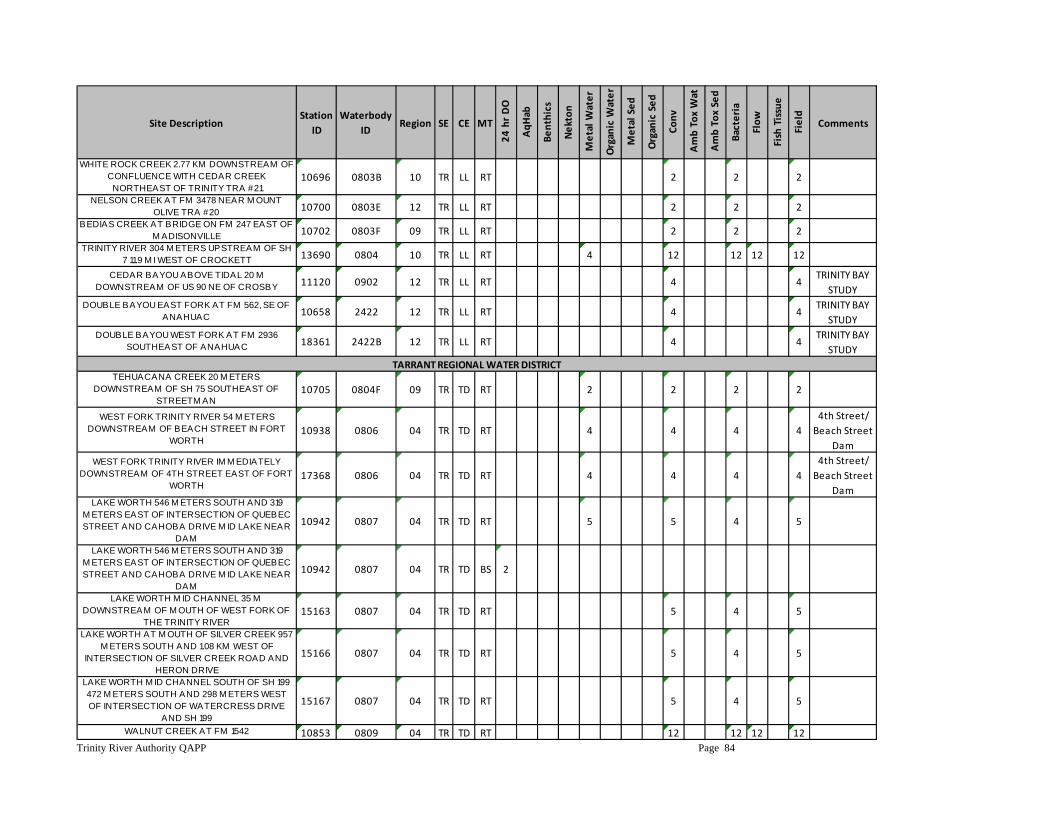
Trinity River Authority QAPP Page 84
Site DescriptionStation
IDWaterbody
IDRegion SE CE MT
24 hr DO
AqH
ab
Benthics
Nekton
Metal W
ater
Organic W
ater
Metal Sed
Organic Sed
Conv
Amb Tox Wat
Amb Tox Sed
Bacteria
Flow
Fish Tissue
Field
Comments
WHITE ROCK CREEK 2.77 KM DOWNSTREAM OF CONFLUENCE WITH CEDAR CREEK
NORTHEAST OF TRINITY TRA #2110696 0803B 10 TR LL RT 2 2 2
NELSON CREEK AT FM 3478 NEAR M OUNT OLIVE TRA #20 10700 0803E 12 TR LL RT 2 2 2
BEDIAS CREEK AT BRIDGE ON FM 247 EAST OF M ADISONVILLE 10702 0803F 09 TR LL RT 2 2 2
TRINITY RIVER 304 M ETERS UPSTREAM OF SH 7 11.9 M I WEST OF CROCKETT 13690 0804 10 TR LL RT 4 12 12 12 12
CEDAR BAYOU ABOVE TIDAL 20 M DOWNSTREAM OF US 90 NE OF CROSBY 11120 0902 12 TR LL RT 4 4
TRINITY BAY STUDY
DOUBLE BAYOU EAST FORK AT FM 562, SE OF ANAHUAC 10658 2422 12 TR LL RT 4 4
TRINITY BAY STUDY
DOUBLE BAYOU WEST FORK AT FM 2936 SOUTHEAST OF ANAHUAC 18361 2422B 12 TR LL RT 4 4
TRINITY BAY STUDY
TEHUACANA CREEK 20 M ETERS DOWNSTREAM OF SH 75 SOUTHEAST OF
STREETM AN10705 0804F 09 TR TD RT 2 2 2 2
WEST FORK TRINITY RIVER 54 M ETERS DOWNSTREAM OF BEACH STREET IN FORT
WORTH10938 0806 04 TR TD RT 4 4 4 4
4th Street/ Beach Street
DamWEST FORK TRINITY RIVER IM M EDIATELY
DOWNSTREAM OF 4TH STREET EAST OF FORT WORTH
17368 0806 04 TR TD RT 4 4 4 44th Street/ Beach Street
DamLAKE WORTH 546 M ETERS SOUTH AND 319
M ETERS EAST OF INTERSECTION OF QUEBEC STREET AND CAHOBA DRIVE M ID LAKE NEAR
DAM
10942 0807 04 TR TD RT 5 5 4 5
LAKE WORTH 546 M ETERS SOUTH AND 319 M ETERS EAST OF INTERSECTION OF QUEBEC STREET AND CAHOBA DRIVE M ID LAKE NEAR
DAM
10942 0807 04 TR TD BS 2
LAKE WORTH M ID CHANNEL 35 M DOWNSTREAM OF M OUTH OF WEST FORK OF
THE TRINITY RIVER15163 0807 04 TR TD RT 5 4 5
LAKE WORTH AT M OUTH OF SILVER CREEK 957 M ETERS SOUTH AND 1.08 KM WEST OF
INTERSECTION OF SILVER CREEK ROAD AND HERON DRIVE
15166 0807 04 TR TD RT 5 4 5
LAKE WORTH M ID CHANNEL SOUTH OF SH 199 472 M ETERS SOUTH AND 298 M ETERS WEST OF INTERSECTION OF WATERCRESS DRIVE
AND SH 199
15167 0807 04 TR TD RT 5 4 5
WALNUT CREEK AT FM 1542 10853 0809 04 TR TD RT 12 12 12 12
TARRANT REGIONAL WATER DISTRICT
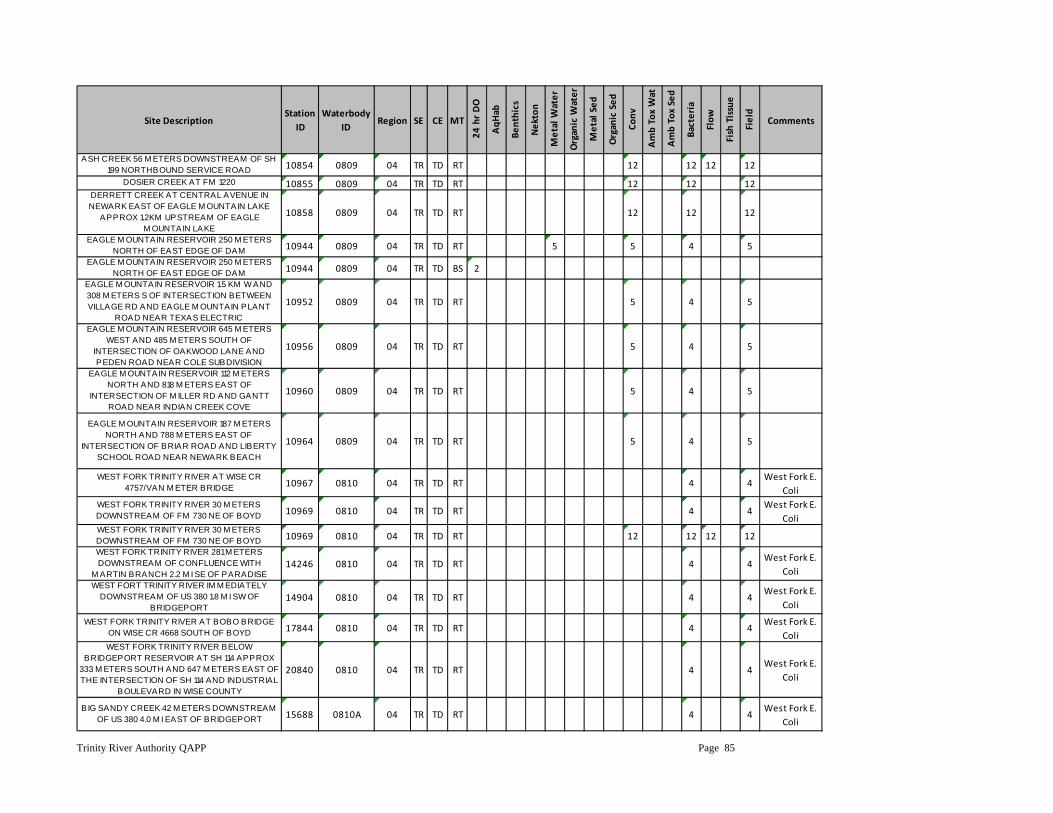
Trinity River Authority QAPP Page 85
Site DescriptionStation
IDWaterbody
IDRegion SE CE MT
24 hr DO
AqH
ab
Benthics
Nekton
Metal W
ater
Organic W
ater
Metal Sed
Organic Sed
Conv
Amb Tox Wat
Amb Tox Sed
Bacteria
Flow
Fish Tissue
Field
Comments
ASH CREEK 56 M ETERS DOWNSTREAM OF SH 199 NORTHBOUND SERVICE ROAD 10854 0809 04 TR TD RT 12 12 12 12
DOSIER CREEK AT FM 1220 10855 0809 04 TR TD RT 12 12 12DERRETT CREEK AT CENTRAL AVENUE IN NEWARK EAST OF EAGLE M OUNTAIN LAKE
APPROX 1.2KM UPSTREAM OF EAGLE M OUNTAIN LAKE
10858 0809 04 TR TD RT 12 12 12
EAGLE M OUNTAIN RESERVOIR 250 M ETERS NORTH OF EAST EDGE OF DAM 10944 0809 04 TR TD RT 5 5 4 5
EAGLE M OUNTAIN RESERVOIR 250 M ETERS NORTH OF EAST EDGE OF DAM 10944 0809 04 TR TD BS 2
EAGLE M OUNTAIN RESERVOIR 1.5 KM W AND 308 M ETERS S OF INTERSECTION BETWEEN VILLAGE RD AND EAGLE M OUNTAIN PLANT
ROAD NEAR TEXAS ELECTRIC
10952 0809 04 TR TD RT 5 4 5
EAGLE M OUNTAIN RESERVOIR 645 M ETERS WEST AND 485 M ETERS SOUTH OF
INTERSECTION OF OAKWOOD LANE AND PEDEN ROAD NEAR COLE SUBDIVISION
10956 0809 04 TR TD RT 5 4 5
EAGLE M OUNTAIN RESERVOIR 112 M ETERS NORTH AND 818 M ETERS EAST OF
INTERSECTION OF M ILLER RD AND GANTT ROAD NEAR INDIAN CREEK COVE
10960 0809 04 TR TD RT 5 4 5
EAGLE M OUNTAIN RESERVOIR 187 M ETERS NORTH AND 788 M ETERS EAST OF
INTERSECTION OF BRIAR ROAD AND LIBERTY SCHOOL ROAD NEAR NEWARK BEACH
10964 0809 04 TR TD RT 5 4 5
WEST FORK TRINITY RIVER AT WISE CR 4757/VAN M ETER BRIDGE 10967 0810 04 TR TD RT 4 4
West Fork E. Coli
WEST FORK TRINITY RIVER 30 M ETERS DOWNSTREAM OF FM 730 NE OF BOYD 10969 0810 04 TR TD RT 4 4
West Fork E. Coli
WEST FORK TRINITY RIVER 30 M ETERS DOWNSTREAM OF FM 730 NE OF BOYD 10969 0810 04 TR TD RT 12 12 12 12WEST FORK TRINITY RIVER 281 M ETERS DOWNSTREAM OF CONFLUENCE WITH
M ARTIN BRANCH 2.2 M I SE OF PARADISE14246 0810 04 TR TD RT 4 4
West Fork E. Coli
WEST FORT TRINITY RIVER IM M EDIATELY DOWNSTREAM OF US 380 1.8 M I SW OF
BRIDGEPORT14904 0810 04 TR TD RT 4 4
West Fork E. Coli
WEST FORK TRINITY RIVER AT BOBO BRIDGE ON WISE CR 4668 SOUTH OF BOYD 17844 0810 04 TR TD RT 4 4
West Fork E. Coli
WEST FORK TRINITY RIVER BELOW BRIDGEPORT RESERVOIR AT SH 114 APPROX
333 M ETERS SOUTH AND 647 M ETERS EAST OF THE INTERSECTION OF SH 114 AND INDUSTRIAL
BOULEVARD IN WISE COUNTY
20840 0810 04 TR TD RT 4 4West Fork E.
Coli
BIG SANDY CREEK 42 M ETERS DOWNSTREAM OF US 380 4.0 M I EAST OF BRIDGEPORT 15688 0810A 04 TR TD RT 4 4
West Fork E. Coli
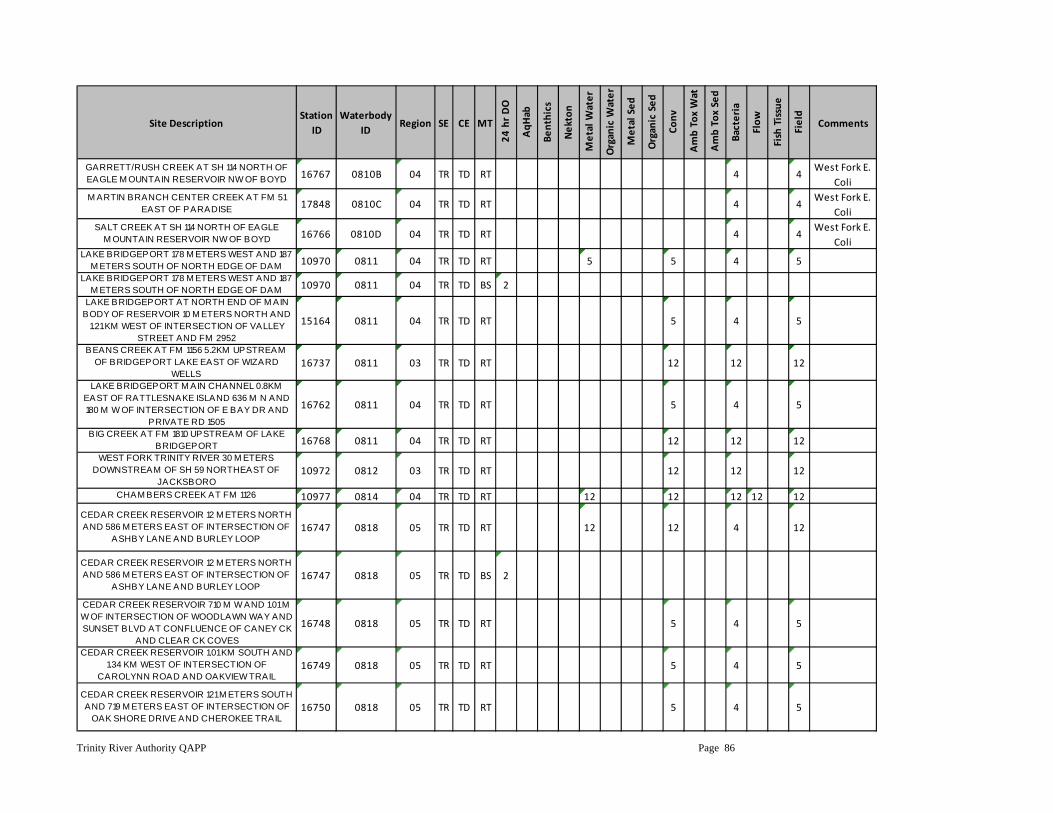
Trinity River Authority QAPP Page 86
Site DescriptionStation
IDWaterbody
IDRegion SE CE MT
24 hr DO
AqH
ab
Benthics
Nekton
Metal W
ater
Organic W
ater
Metal Sed
Organic Sed
Conv
Amb Tox Wat
Amb Tox Sed
Bacteria
Flow
Fish Tissue
Field
Comments
GARRETT/RUSH CREEK AT SH 114 NORTH OF EAGLE M OUNTAIN RESERVOIR NW OF BOYD 16767 0810B 04 TR TD RT 4 4
West Fork E. Coli
M ARTIN BRANCH CENTER CREEK AT FM 51 EAST OF PARADISE 17848 0810C 04 TR TD RT 4 4
West Fork E. Coli
SALT CREEK AT SH 114 NORTH OF EAGLE M OUNTAIN RESERVOIR NW OF BOYD 16766 0810D 04 TR TD RT 4 4
West Fork E. Coli
LAKE BRIDGEPORT 178 M ETERS WEST AND 187 M ETERS SOUTH OF NORTH EDGE OF DAM 10970 0811 04 TR TD RT 5 5 4 5
LAKE BRIDGEPORT 178 M ETERS WEST AND 187 M ETERS SOUTH OF NORTH EDGE OF DAM 10970 0811 04 TR TD BS 2
LAKE BRIDGEPORT AT NORTH END OF M AIN BODY OF RESERVOIR 10 M ETERS NORTH AND
1.21 KM WEST OF INTERSECTION OF VALLEY STREET AND FM 2952
15164 0811 04 TR TD RT 5 4 5
BEANS CREEK AT FM 1156 5.2KM UPSTREAM OF BRIDGEPORT LAKE EAST OF WIZARD
WELLS16737 0811 03 TR TD RT 12 12 12
LAKE BRIDGEPORT M AIN CHANNEL 0.8KM EAST OF RATTLESNAKE ISLAND 636 M N AND 180 M W OF INTERSECTION OF E BAY DR AND
PRIVATE RD 1505
16762 0811 04 TR TD RT 5 4 5
BIG CREEK AT FM 1810 UPSTREAM OF LAKE BRIDGEPORT 16768 0811 04 TR TD RT 12 12 12
WEST FORK TRINITY RIVER 30 M ETERS DOWNSTREAM OF SH 59 NORTHEAST OF
JACKSBORO10972 0812 03 TR TD RT 12 12 12
CHAM BERS CREEK AT FM 1126 10977 0814 04 TR TD RT 12 12 12 12 12
CEDAR CREEK RESERVOIR 12 M ETERS NORTH AND 586 M ETERS EAST OF INTERSECTION OF
ASHBY LANE AND BURLEY LOOP16747 0818 05 TR TD RT 12 12 4 12
CEDAR CREEK RESERVOIR 12 M ETERS NORTH AND 586 M ETERS EAST OF INTERSECTION OF
ASHBY LANE AND BURLEY LOOP16747 0818 05 TR TD BS 2
CEDAR CREEK RESERVOIR 710 M W AND 1.01 M W OF INTERSECTION OF WOODLAWN WAY AND SUNSET BLVD AT CONFLUENCE OF CANEY CK
AND CLEAR CK COVES
16748 0818 05 TR TD RT 5 4 5
CEDAR CREEK RESERVOIR 1.01 KM SOUTH AND 1.34 KM WEST OF INTERSECTION OF
CAROLYNN ROAD AND OAKVIEW TRAIL16749 0818 05 TR TD RT 5 4 5
CEDAR CREEK RESERVOIR 121 M ETERS SOUTH AND 719 M ETERS EAST OF INTERSECTION OF
OAK SHORE DRIVE AND CHEROKEE TRAIL16750 0818 05 TR TD RT 5 4 5
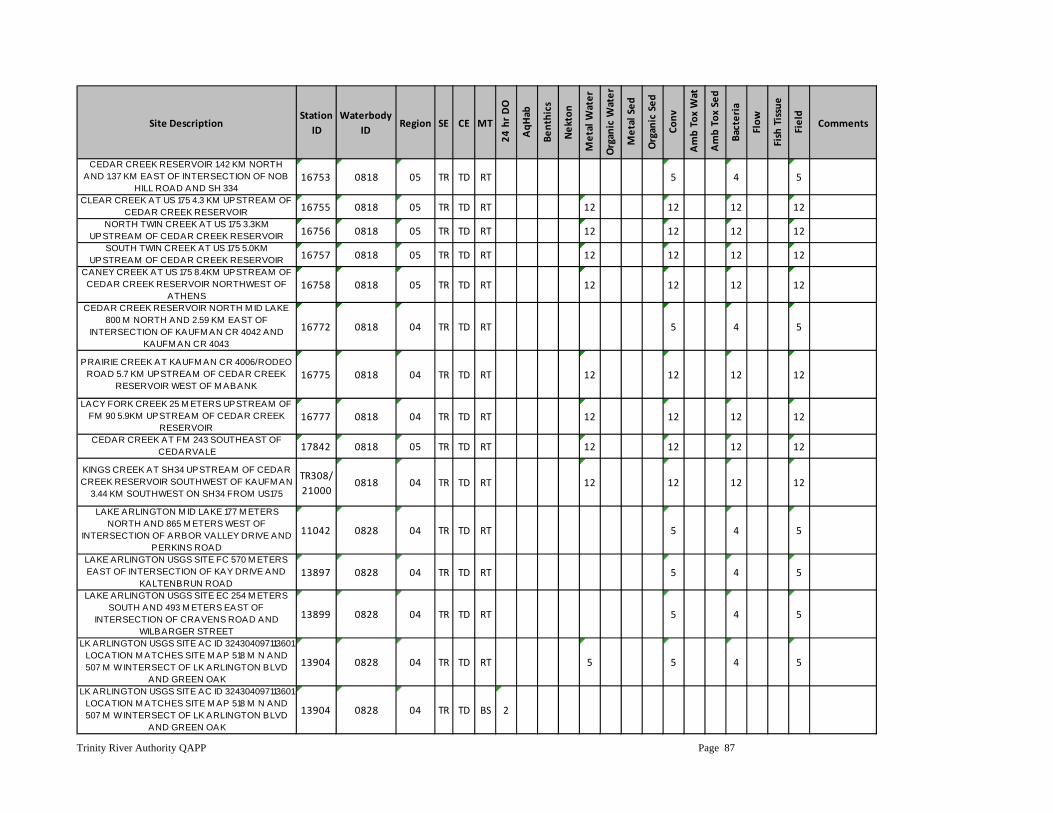
Trinity River Authority QAPP Page 87
Site DescriptionStation
IDWaterbody
IDRegion SE CE MT
24 hr DO
AqH
ab
Benthics
Nekton
Metal W
ater
Organic W
ater
Metal Sed
Organic Sed
Conv
Amb Tox Wat
Amb Tox Sed
Bacteria
Flow
Fish Tissue
Field
Comments
CEDAR CREEK RESERVOIR 1.42 KM NORTH AND 1.37 KM EAST OF INTERSECTION OF NOB
HILL ROAD AND SH 33416753 0818 05 TR TD RT 5 4 5
CLEAR CREEK AT US 175 4.3 KM UPSTREAM OF CEDAR CREEK RESERVOIR 16755 0818 05 TR TD RT 12 12 12 12
NORTH TWIN CREEK AT US 175 3.3KM UPSTREAM OF CEDAR CREEK RESERVOIR 16756 0818 05 TR TD RT 12 12 12 12
SOUTH TWIN CREEK AT US 175 5.0KM UPSTREAM OF CEDAR CREEK RESERVOIR 16757 0818 05 TR TD RT 12 12 12 12
CANEY CREEK AT US 175 8.4KM UPSTREAM OF CEDAR CREEK RESERVOIR NORTHWEST OF
ATHENS16758 0818 05 TR TD RT 12 12 12 12
CEDAR CREEK RESERVOIR NORTH M ID LAKE 800 M NORTH AND 2.59 KM EAST OF
INTERSECTION OF KAUFM AN CR 4042 AND KAUFM AN CR 4043
16772 0818 04 TR TD RT 5 4 5
PRAIRIE CREEK AT KAUFM AN CR 4006/RODEO ROAD 5.7 KM UPSTREAM OF CEDAR CREEK
RESERVOIR WEST OF M ABANK16775 0818 04 TR TD RT 12 12 12 12
LACY FORK CREEK 25 M ETERS UPSTREAM OF FM 90 5.9KM UPSTREAM OF CEDAR CREEK
RESERVOIR16777 0818 04 TR TD RT 12 12 12 12
CEDAR CREEK AT FM 243 SOUTHEAST OF CEDARVALE 17842 0818 05 TR TD RT 12 12 12 12
KINGS CREEK AT SH34 UPSTREAM OF CEDAR CREEK RESERVOIR SOUTHWEST OF KAUFM AN
3.44 KM SOUTHWEST ON SH34 FROM US175
TR308/21000
0818 04 TR TD RT 12 12 12 12
LAKE ARLINGTON M ID LAKE 177 M ETERS NORTH AND 865 M ETERS WEST OF
INTERSECTION OF ARBOR VALLEY DRIVE AND PERKINS ROAD
11042 0828 04 TR TD RT 5 4 5
LAKE ARLINGTON USGS SITE FC 570 M ETERS EAST OF INTERSECTION OF KAY DRIVE AND
KALTENBRUN ROAD13897 0828 04 TR TD RT 5 4 5
LAKE ARLINGTON USGS SITE EC 254 M ETERS SOUTH AND 493 M ETERS EAST OF
INTERSECTION OF CRAVENS ROAD AND WILBARGER STREET
13899 0828 04 TR TD RT 5 4 5
LK ARLINGTON USGS SITE AC ID 324304097113601 LOCATION M ATCHES SITE M AP 518 M N AND 507 M W INTERSECT OF LK ARLINGTON BLVD
AND GREEN OAK
13904 0828 04 TR TD RT 5 5 4 5
LK ARLINGTON USGS SITE AC ID 324304097113601 LOCATION M ATCHES SITE M AP 518 M N AND 507 M W INTERSECT OF LK ARLINGTON BLVD
AND GREEN OAK
13904 0828 04 TR TD BS 2
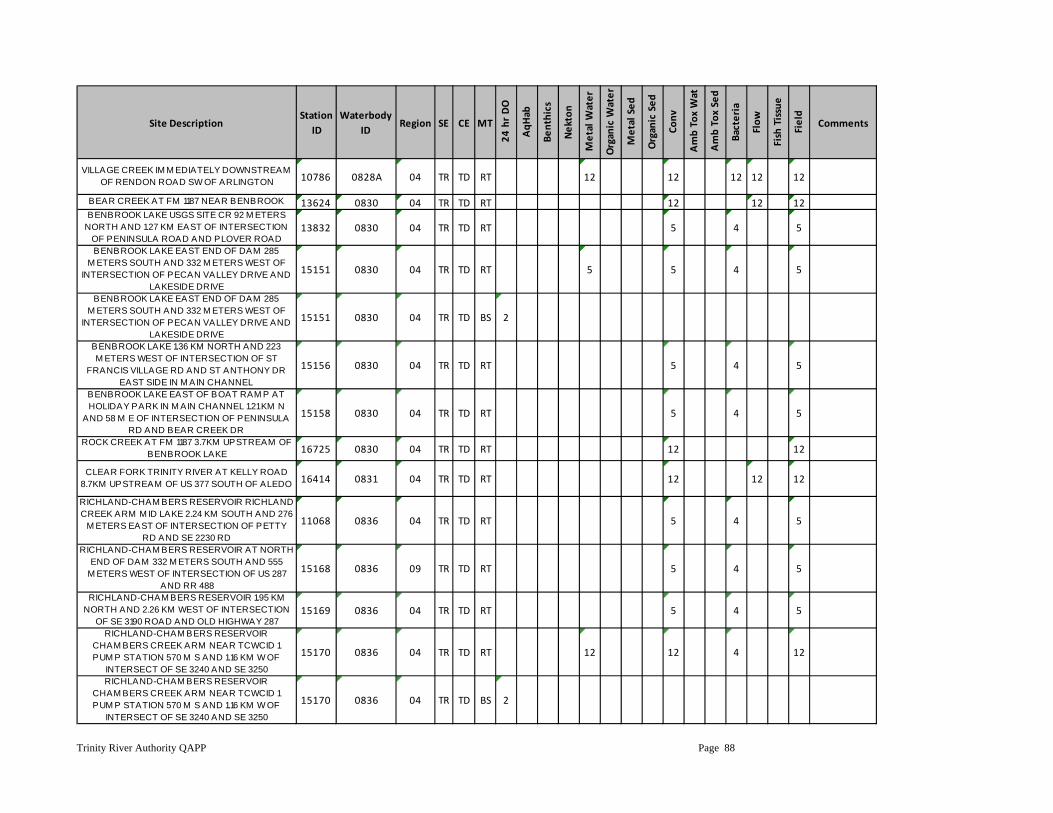
Trinity River Authority QAPP Page 88
Site DescriptionStation
IDWaterbody
IDRegion SE CE MT
24 hr DO
AqH
ab
Benthics
Nekton
Metal W
ater
Organic W
ater
Metal Sed
Organic Sed
Conv
Amb Tox Wat
Amb Tox Sed
Bacteria
Flow
Fish Tissue
Field
Comments
VILLAGE CREEK IM M EDIATELY DOWNSTREAM OF RENDON ROAD SW OF ARLINGTON 10786 0828A 04 TR TD RT 12 12 12 12 12
BEAR CREEK AT FM 1187 NEAR BENBROOK 13624 0830 04 TR TD RT 12 12 12BENBROOK LAKE USGS SITE CR 92 M ETERS
NORTH AND 1.27 KM EAST OF INTERSECTION OF PENINSULA ROAD AND PLOVER ROAD
13832 0830 04 TR TD RT 5 4 5
BENBROOK LAKE EAST END OF DAM 285 M ETERS SOUTH AND 332 M ETERS WEST OF
INTERSECTION OF PECAN VALLEY DRIVE AND LAKESIDE DRIVE
15151 0830 04 TR TD RT 5 5 4 5
BENBROOK LAKE EAST END OF DAM 285 M ETERS SOUTH AND 332 M ETERS WEST OF
INTERSECTION OF PECAN VALLEY DRIVE AND LAKESIDE DRIVE
15151 0830 04 TR TD BS 2
BENBROOK LAKE 1.36 KM NORTH AND 223 M ETERS WEST OF INTERSECTION OF ST
FRANCIS VILLAGE RD AND ST ANTHONY DR EAST SIDE IN M AIN CHANNEL
15156 0830 04 TR TD RT 5 4 5
BENBROOK LAKE EAST OF BOAT RAM P AT HOLIDAY PARK IN M AIN CHANNEL 1.21 KM N
AND 58 M E OF INTERSECTION OF PENINSULA RD AND BEAR CREEK DR
15158 0830 04 TR TD RT 5 4 5
ROCK CREEK AT FM 1187 3.7KM UPSTREAM OF BENBROOK LAKE 16725 0830 04 TR TD RT 12 12
CLEAR FORK TRINITY RIVER AT KELLY ROAD 8.7KM UPSTREAM OF US 377 SOUTH OF ALEDO 16414 0831 04 TR TD RT 12 12 12
RICHLAND-CHAM BERS RESERVOIR RICHLAND CREEK ARM M ID LAKE 2.24 KM SOUTH AND 276
M ETERS EAST OF INTERSECTION OF PETTY RD AND SE 2230 RD
11068 0836 04 TR TD RT 5 4 5
RICHLAND-CHAM BERS RESERVOIR AT NORTH END OF DAM 332 M ETERS SOUTH AND 555
M ETERS WEST OF INTERSECTION OF US 287 AND RR 488
15168 0836 09 TR TD RT 5 4 5
RICHLAND-CHAM BERS RESERVOIR 1.95 KM NORTH AND 2.26 KM WEST OF INTERSECTION
OF SE 3190 ROAD AND OLD HIGHWAY 28715169 0836 04 TR TD RT 5 4 5
RICHLAND-CHAM BERS RESERVOIR CHAM BERS CREEK ARM NEAR TCWCID 1 PUM P STATION 570 M S AND 1.16 KM W OF
INTERSECT OF SE 3240 AND SE 3250
15170 0836 04 TR TD RT 12 12 4 12
RICHLAND-CHAM BERS RESERVOIR CHAM BERS CREEK ARM NEAR TCWCID 1 PUM P STATION 570 M S AND 1.16 KM W OF
INTERSECT OF SE 3240 AND SE 3250
15170 0836 04 TR TD BS 2
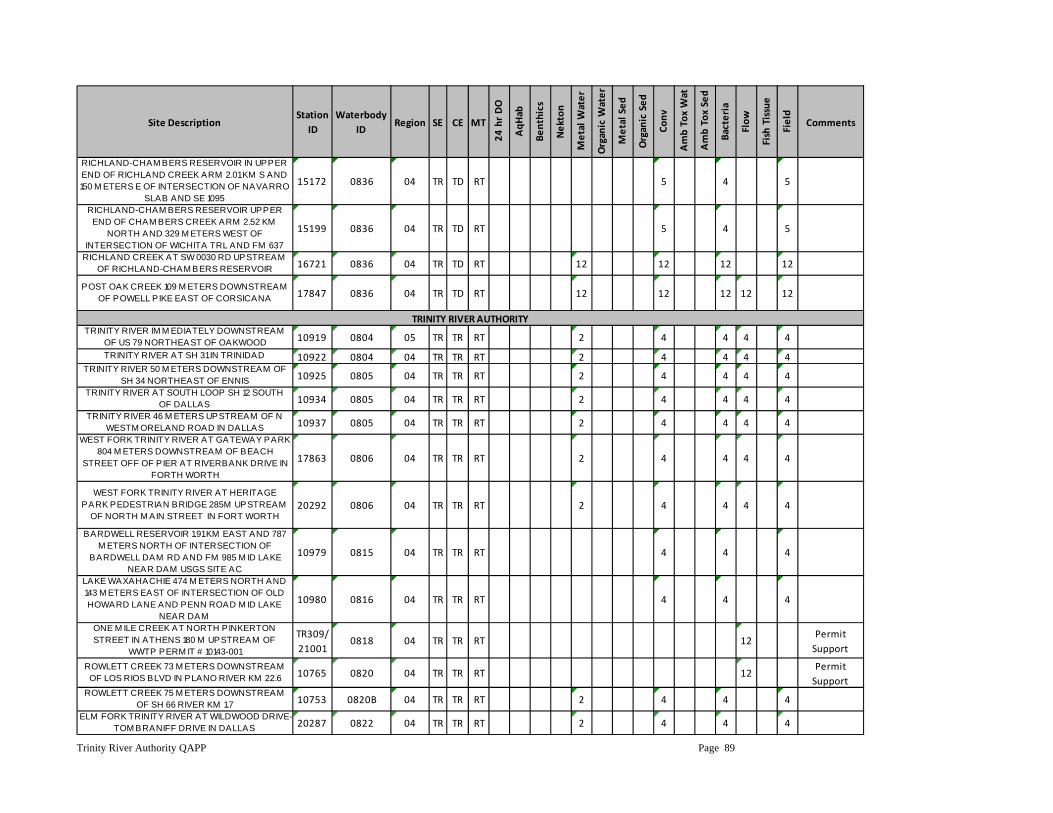
Trinity River Authority QAPP Page 89
Site DescriptionStation
IDWaterbody
IDRegion SE CE MT
24 hr DO
AqH
ab
Benthics
Nekton
Metal W
ater
Organic W
ater
Metal Sed
Organic Sed
Conv
Amb Tox Wat
Amb Tox Sed
Bacteria
Flow
Fish Tissue
Field
Comments
RICHLAND-CHAM BERS RESERVOIR IN UPPER END OF RICHLAND CREEK ARM 2.01 KM S AND 150 M ETERS E OF INTERSECTION OF NAVARRO
SLAB AND SE 1095
15172 0836 04 TR TD RT 5 4 5
RICHLAND-CHAM BERS RESERVOIR UPPER END OF CHAM BERS CREEK ARM 2.52 KM
NORTH AND 329 M ETERS WEST OF INTERSECTION OF WICHITA TRL AND FM 637
15199 0836 04 TR TD RT 5 4 5
RICHLAND CREEK AT SW 0030 RD UPSTREAM OF RICHLAND-CHAM BERS RESERVOIR 16721 0836 04 TR TD RT 12 12 12 12
POST OAK CREEK 109 M ETERS DOWNSTREAM OF POWELL PIKE EAST OF CORSICANA 17847 0836 04 TR TD RT 12 12 12 12 12
TRINITY RIVER IM M EDIATELY DOWNSTREAM OF US 79 NORTHEAST OF OAKWOOD 10919 0804 05 TR TR RT 2 4 4 4 4
TRINITY RIVER AT SH 31 IN TRINIDAD 10922 0804 04 TR TR RT 2 4 4 4 4TRINITY RIVER 50 M ETERS DOWNSTREAM OF
SH 34 NORTHEAST OF ENNIS 10925 0805 04 TR TR RT 2 4 4 4 4TRINITY RIVER AT SOUTH LOOP SH 12 SOUTH
OF DALLAS 10934 0805 04 TR TR RT 2 4 4 4 4TRINITY RIVER 46 M ETERS UPSTREAM OF N
WESTM ORELAND ROAD IN DALLAS 10937 0805 04 TR TR RT 2 4 4 4 4WEST FORK TRINITY RIVER AT GATEWAY PARK
804 M ETERS DOWNSTREAM OF BEACH STREET OFF OF PIER AT RIVERBANK DRIVE IN
FORTH WORTH
17863 0806 04 TR TR RT 2 4 4 4 4
WEST FORK TRINITY RIVER AT HERITAGE PARK PEDESTRIAN BRIDGE 285M UPSTREAM
OF NORTH M AIN STREET IN FORT WORTH20292 0806 04 TR TR RT 2 4 4 4 4
BARDWELL RESERVOIR 1.91 KM EAST AND 787 M ETERS NORTH OF INTERSECTION OF
BARDWELL DAM RD AND FM 985 M ID LAKE NEAR DAM USGS SITE AC
10979 0815 04 TR TR RT 4 4 4
LAKE WAXAHACHIE 474 M ETERS NORTH AND 143 M ETERS EAST OF INTERSECTION OF OLD HOWARD LANE AND PENN ROAD M ID LAKE
NEAR DAM
10980 0816 04 TR TR RT 4 4 4
ONE M ILE CREEK AT NORTH PINKERTON STREET IN ATHENS 180 M UPSTREAM OF
WWTP PERM IT # 10143-001
TR309/21001
0818 04 TR TR RT 12Permit Support
ROWLETT CREEK 73 M ETERS DOWNSTREAM OF LOS RIOS BLVD IN PLANO RIVER KM 22.6 10765 0820 04 TR TR RT 12
Permit Support
ROWLETT CREEK 75 M ETERS DOWNSTREAM OF SH 66 RIVER KM 1.7 10753 0820B 04 TR TR RT 2 4 4 4
ELM FORK TRINITY RIVER AT WILDWOOD DRIVE-TOM BRANIFF DRIVE IN DALLAS 20287 0822 04 TR TR RT 2 4 4 4
TRINITY RIVER AUTHORITY
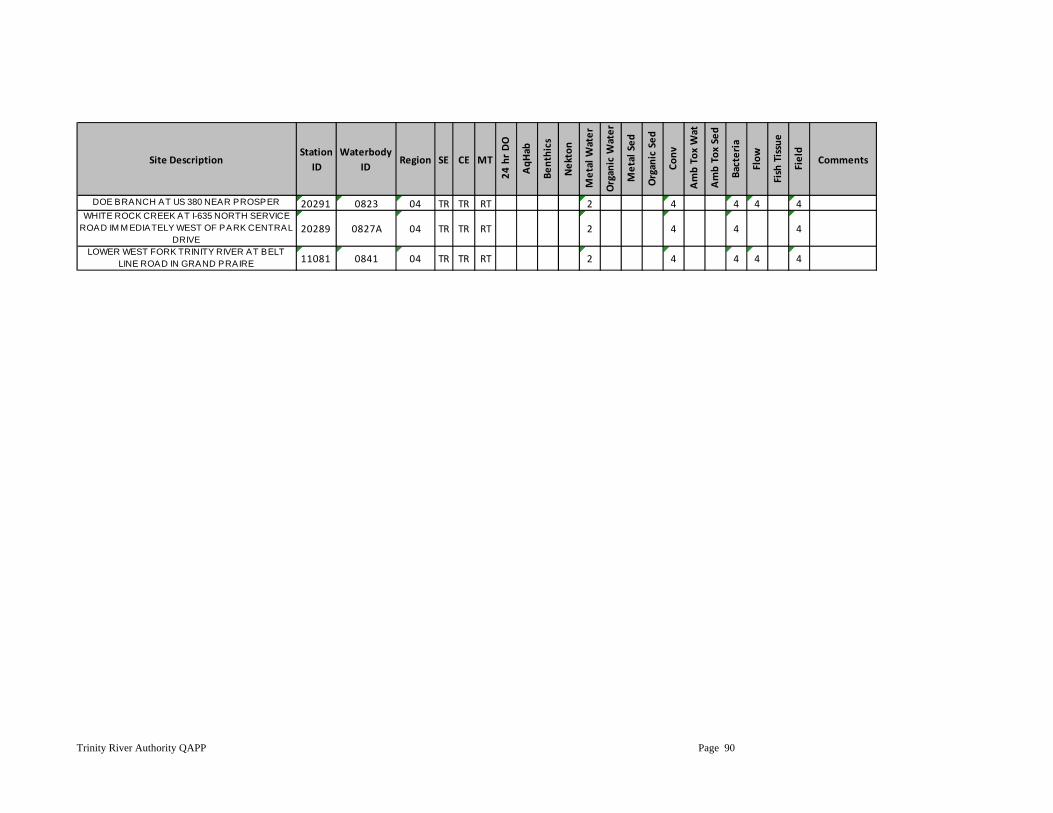
Trinity River Authority QAPP Page 90
Site DescriptionStation
IDWaterbody
IDRegion SE CE MT
24 hr DO
AqH
ab
Benthics
Nekton
Metal W
ater
Organic W
ater
Metal Sed
Organic Sed
Conv
Amb Tox Wat
Amb Tox Sed
Bacteria
Flow
Fish Tissue
Field
Comments
DOE BRANCH AT US 380 NEAR PROSPER 20291 0823 04 TR TR RT 2 4 4 4 4WHITE ROCK CREEK AT I-635 NORTH SERVICE
ROAD IM M EDIATELY WEST OF PARK CENTRAL DRIVE
20289 0827A 04 TR TR RT 2 4 4 4
LOWER WEST FORK TRINITY RIVER AT BELT LINE ROAD IN GRAND PRAIRE 11081 0841 04 TR TR RT 2 4 4 4 4
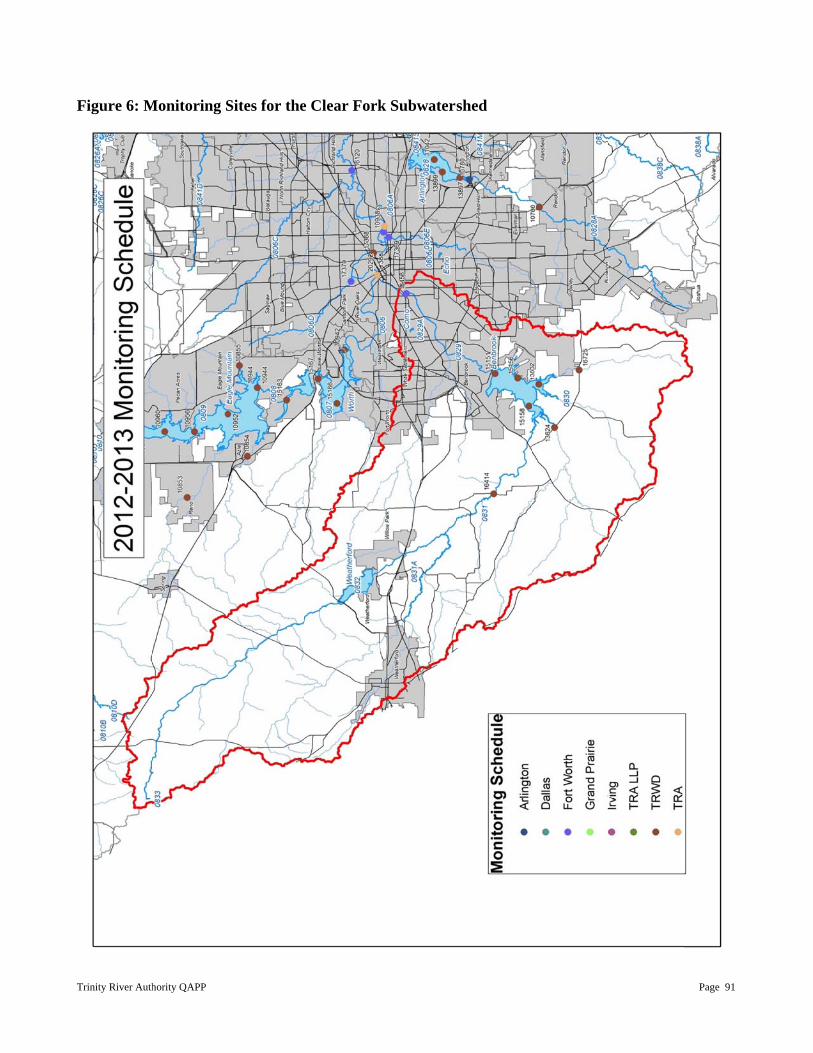
Trinity River Auth
Figure 6: M
hority QAPP
Monitoring SSites for thee Clear Forkk Subwatershed
Page 91
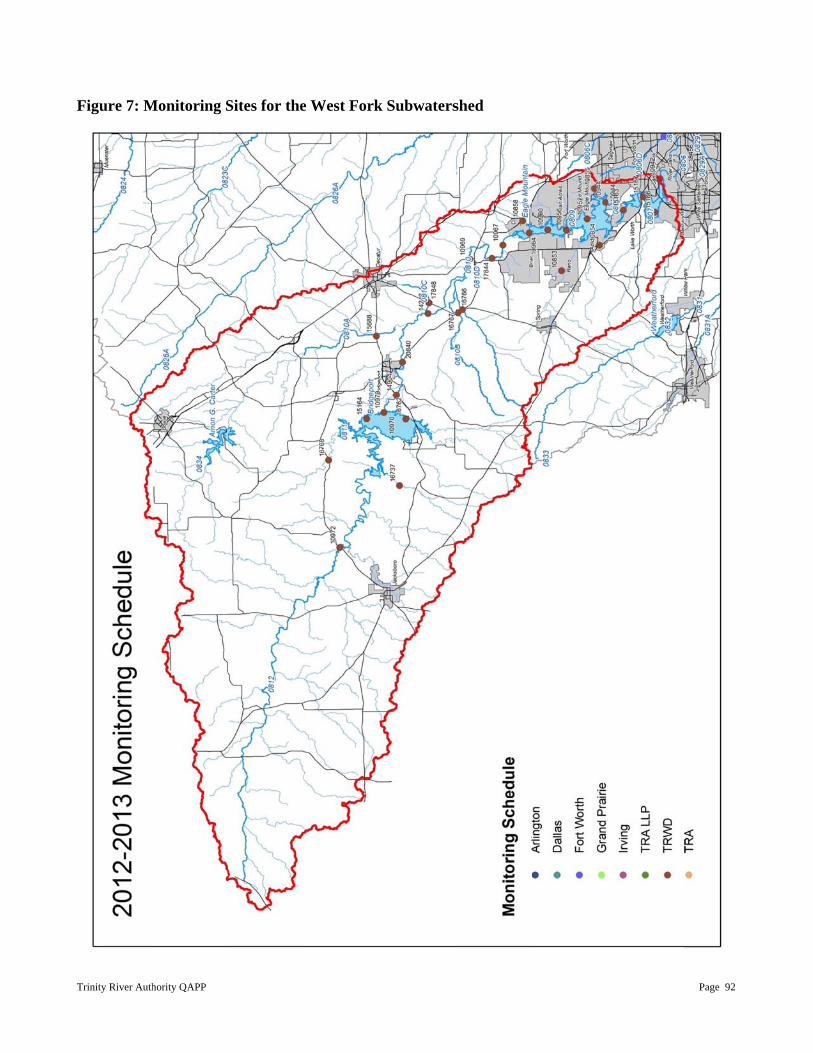
Trinity River Auth
Figure 7: M
hority QAPP
Monitoring SSites for thee West Forkk Subwatersshed
Page 92
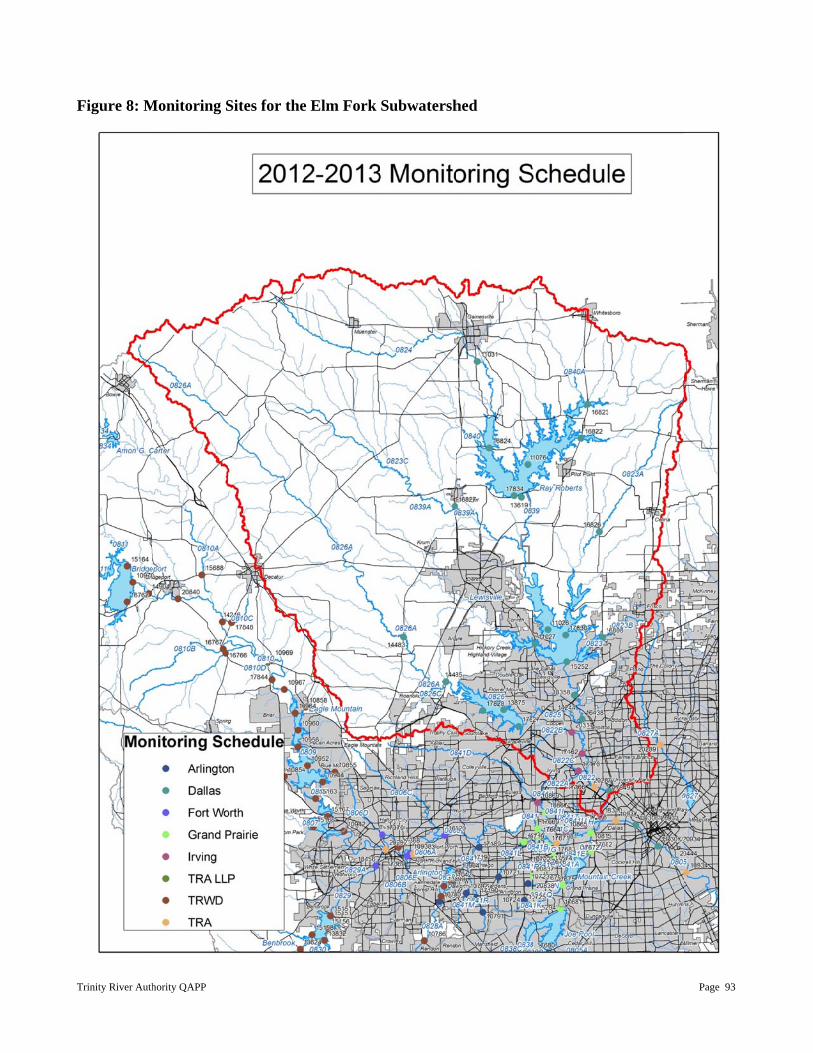
Trinity River Auth
Figure 8: M
hority QAPP
Monitoring SSites for thee Elm Fork Subwatershhed
Page 93
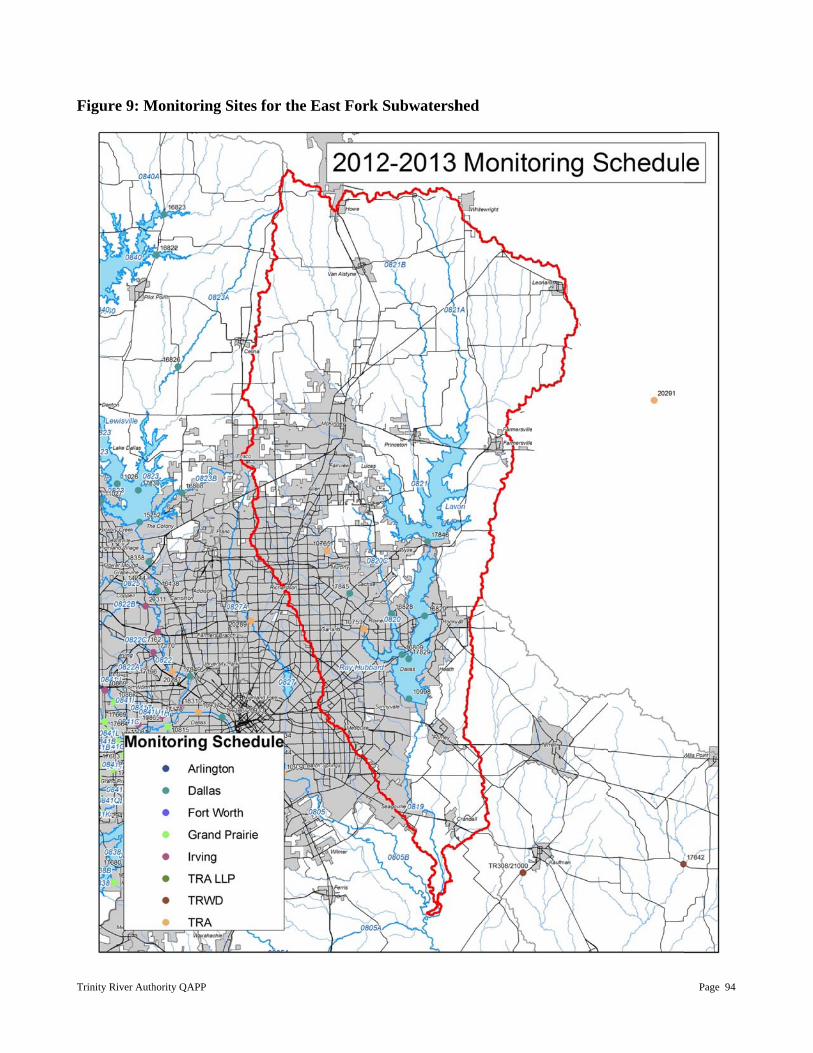
Trinity River Auth
Figure 9: M
hority QAPP
Monitoring SSites for thee East Fork Subwatershhed
Page 94
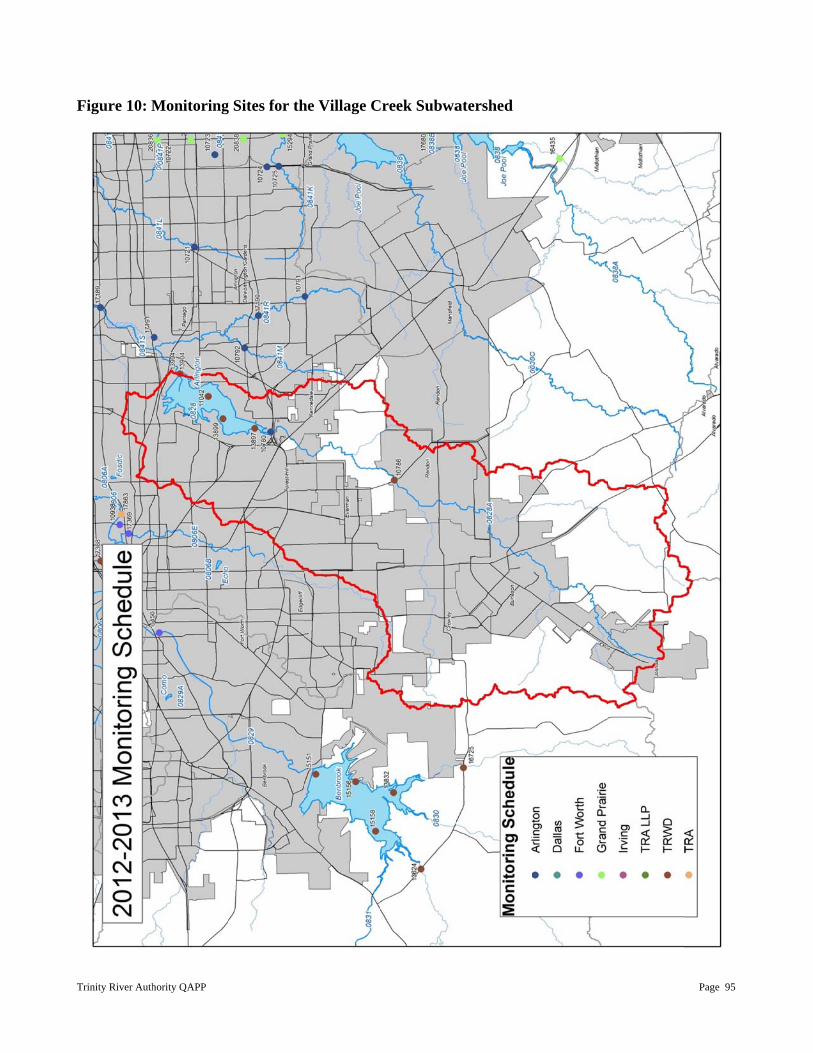
Trinity River Auth
Figure 10: M
hority QAPP
Monitoringg Sites for thhe Village CCreek Subwaatershed
Page 95
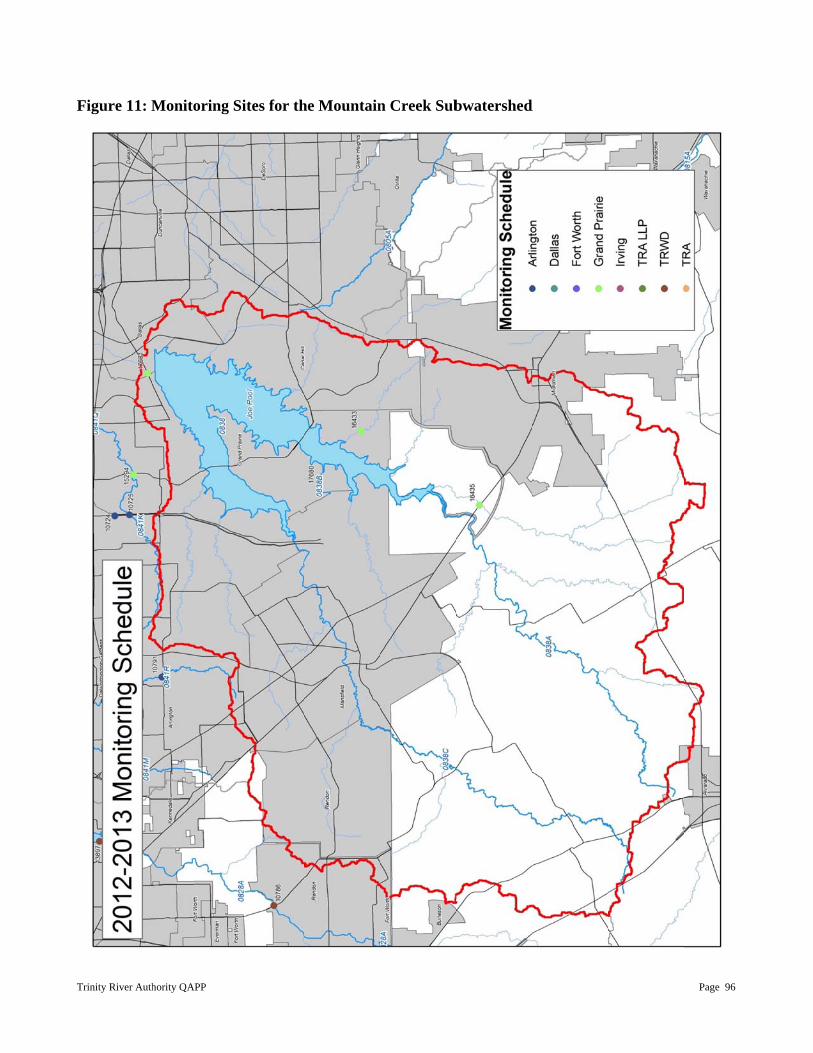
Trinity River Auth
Figure 11: M
hority QAPP
Monitoringg Sites for thhe Mountainn Creek Subbwatershedd
Page 96
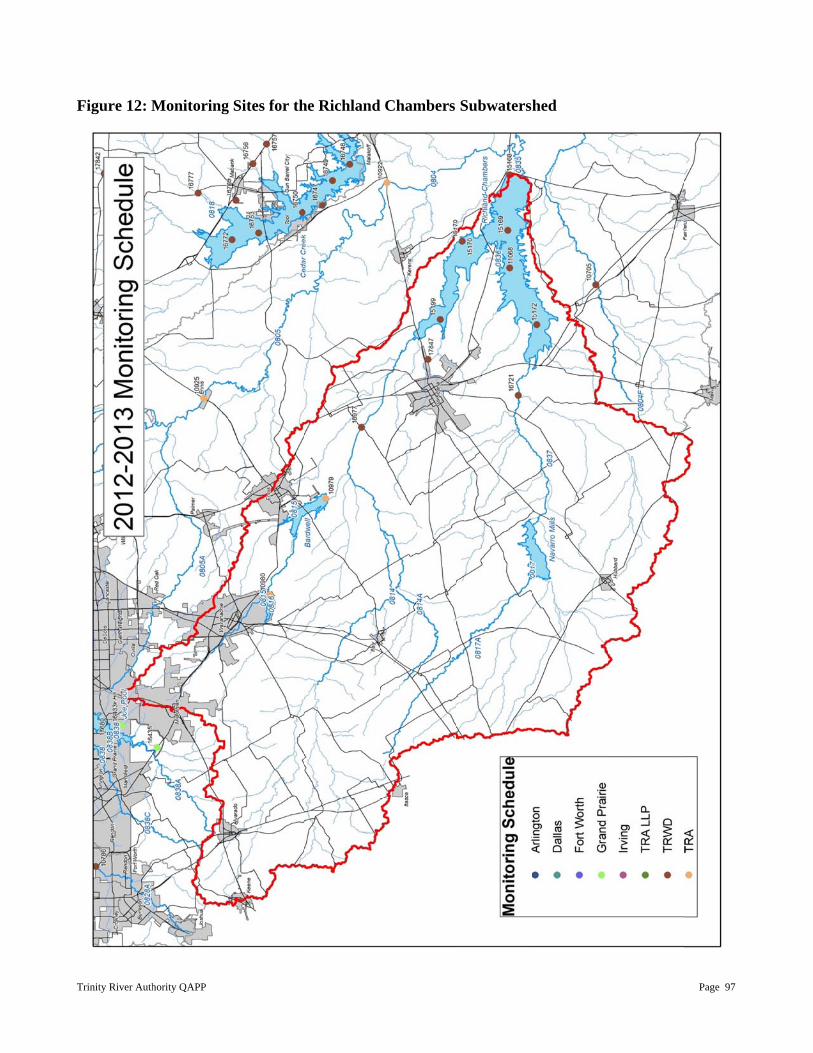
Trinity River Auth
Figure 12: M
hority QAPP
Monitoringg Sites for thhe Richland Chambers Subwatershhed
Page 97
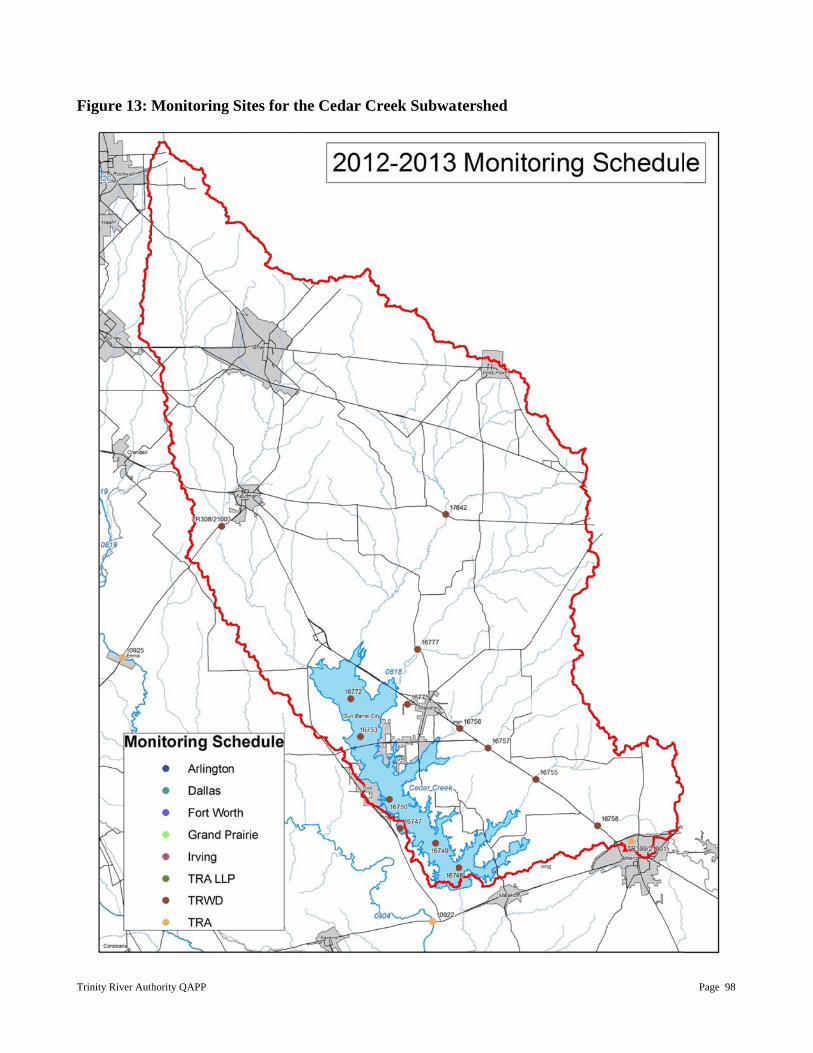
Trinity River Auth
Figure 13: M
hority QAPP
Monitoringg Sites for thhe Cedar Crreek Subwaatershed
Page 98
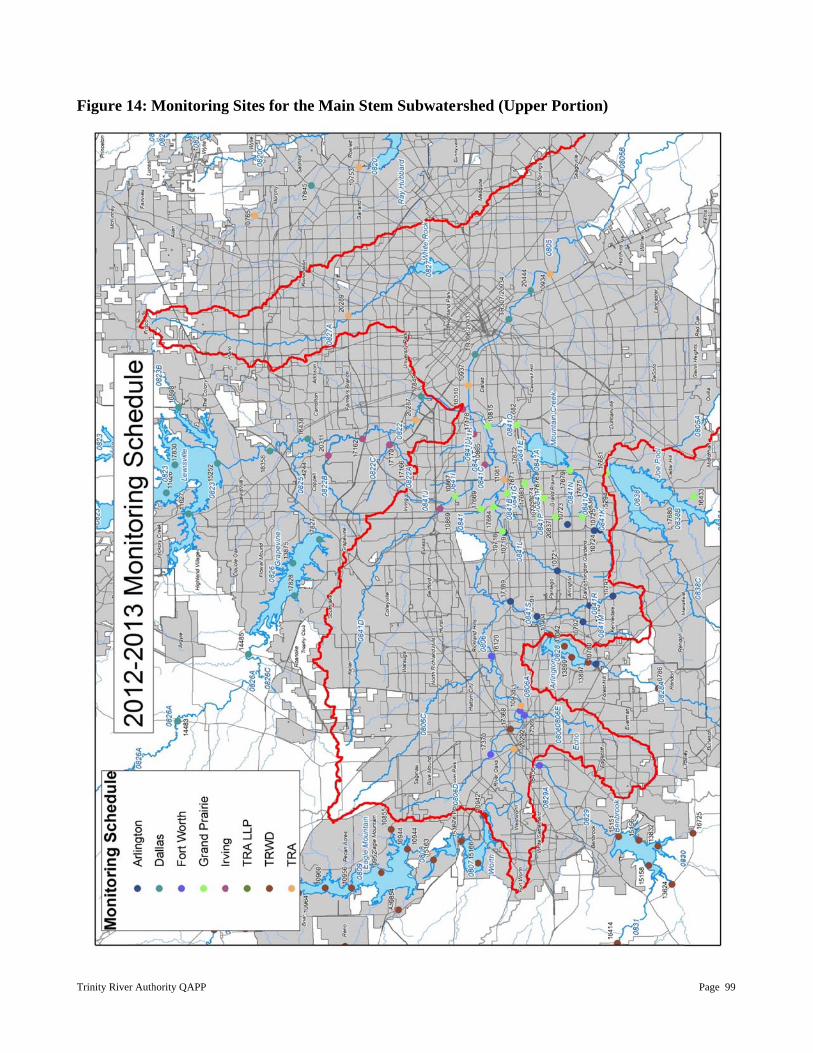
Trinity River Auth
Figure 14: M
hority QAPP
Monitoringg Sites for thhe Main Stem Subwatershed (Uppper Portion)
Page 99
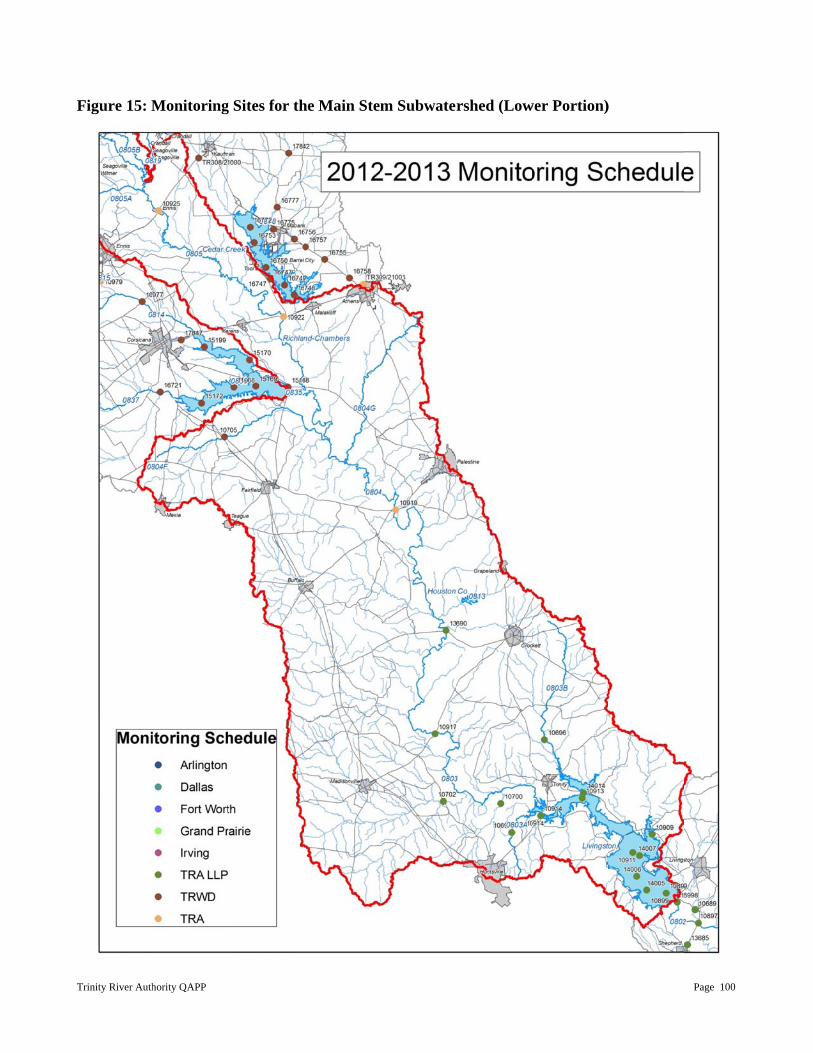
Trinity River Auth
Figure 15: M
hority QAPP
Monitoringg Sites for thhe Main Stem Subwatershed (Lowwer Portion))
Page 100
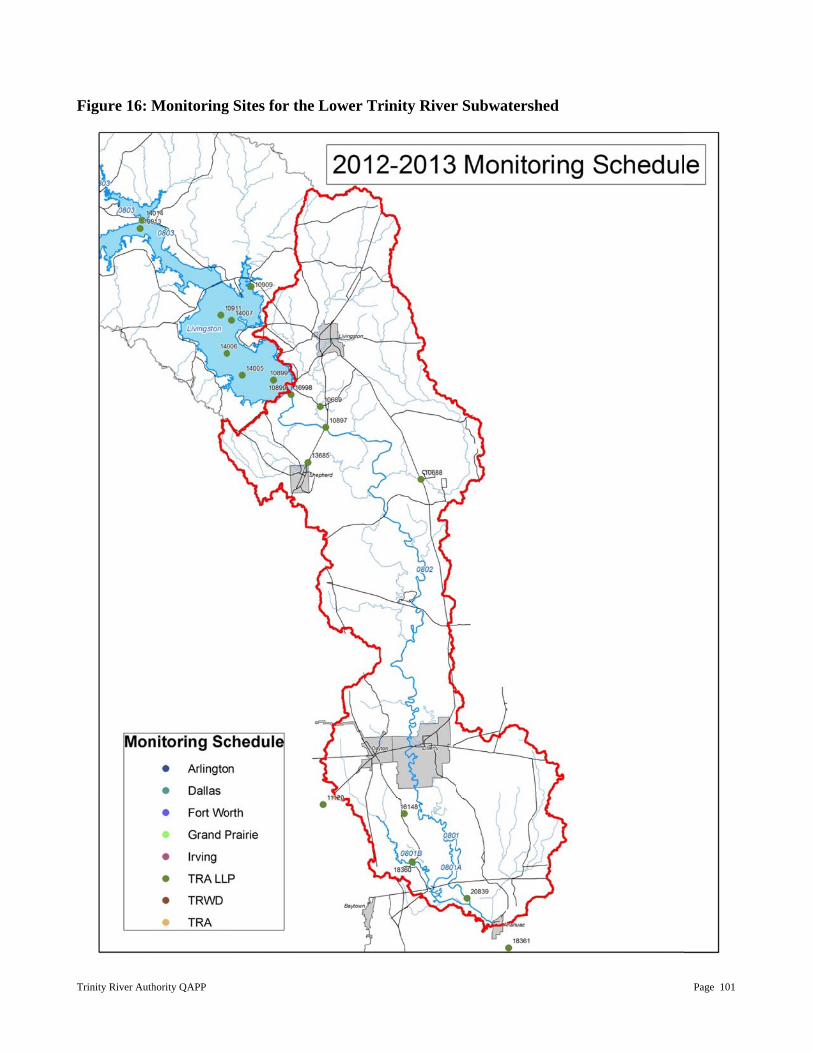
Trinity River Auth
Figure 16: M
hority QAPP
Monitoringg Sites for thhe Lower Trrinity Riverr Subwatersshed
Page 101
Trinity River Authority QAPP Page 102
APPENDIX C: FIELD DATA SHEETS
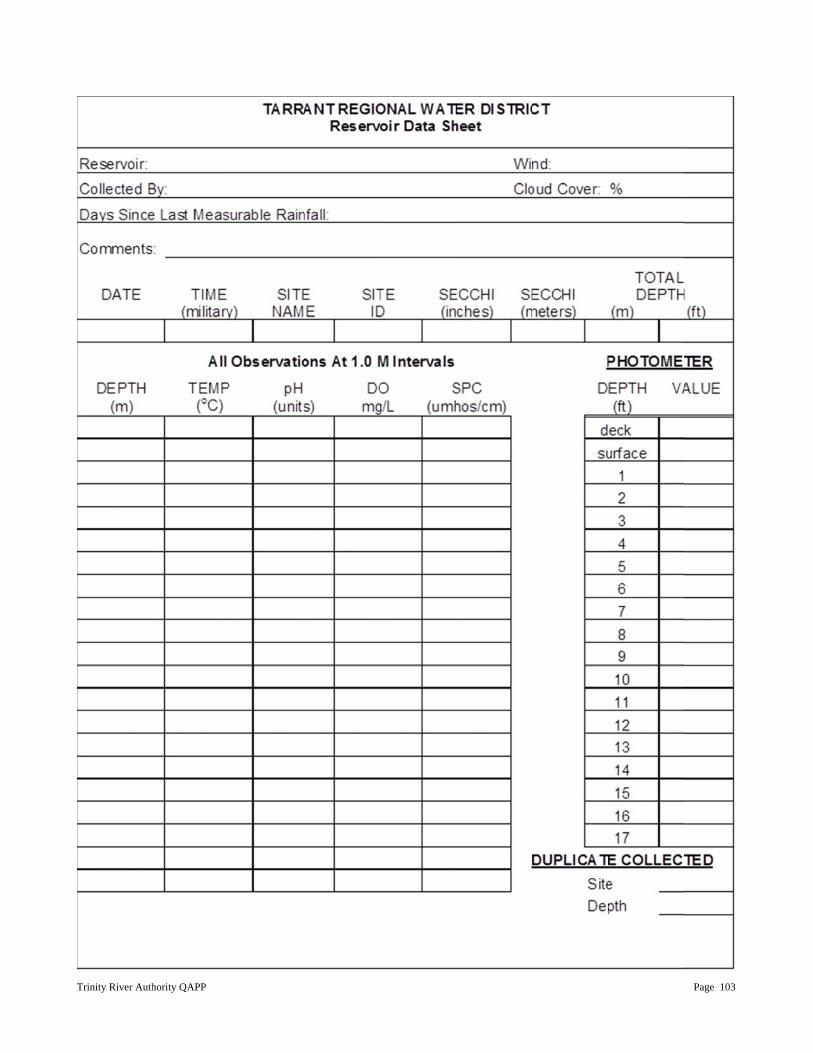
Trinity River Auth
hority QAPP Page 103
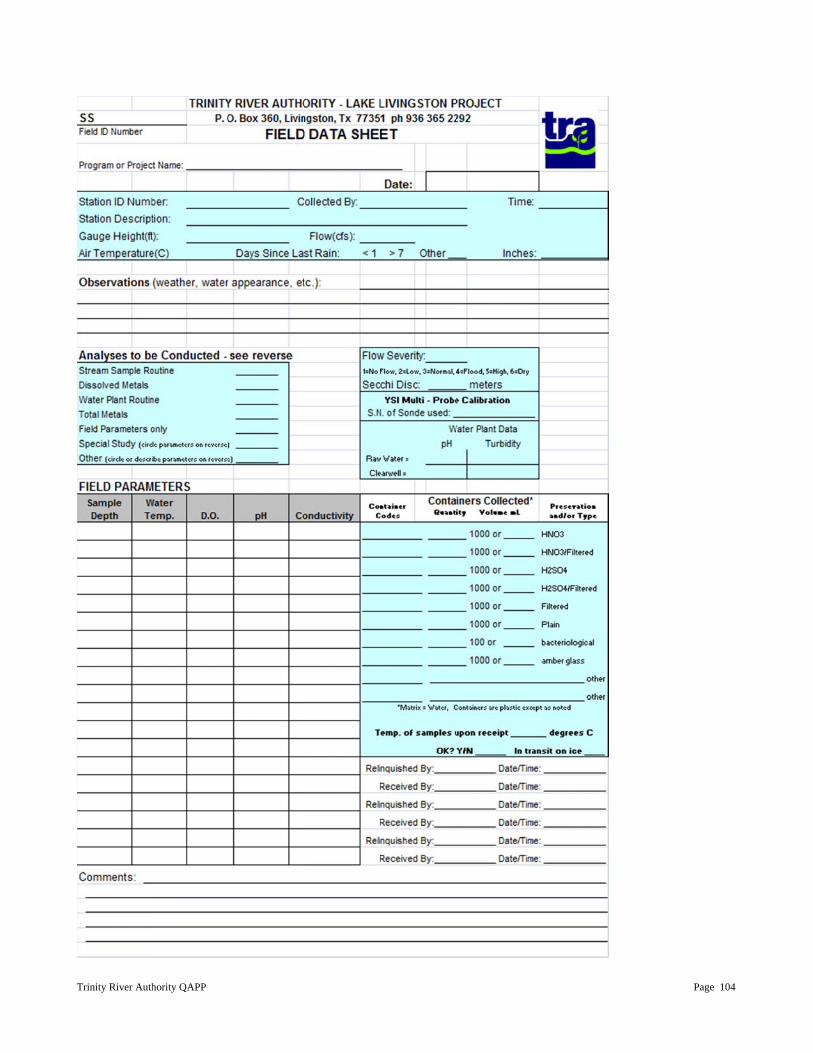
Trinity River Auth
hority QAPP
Page 104
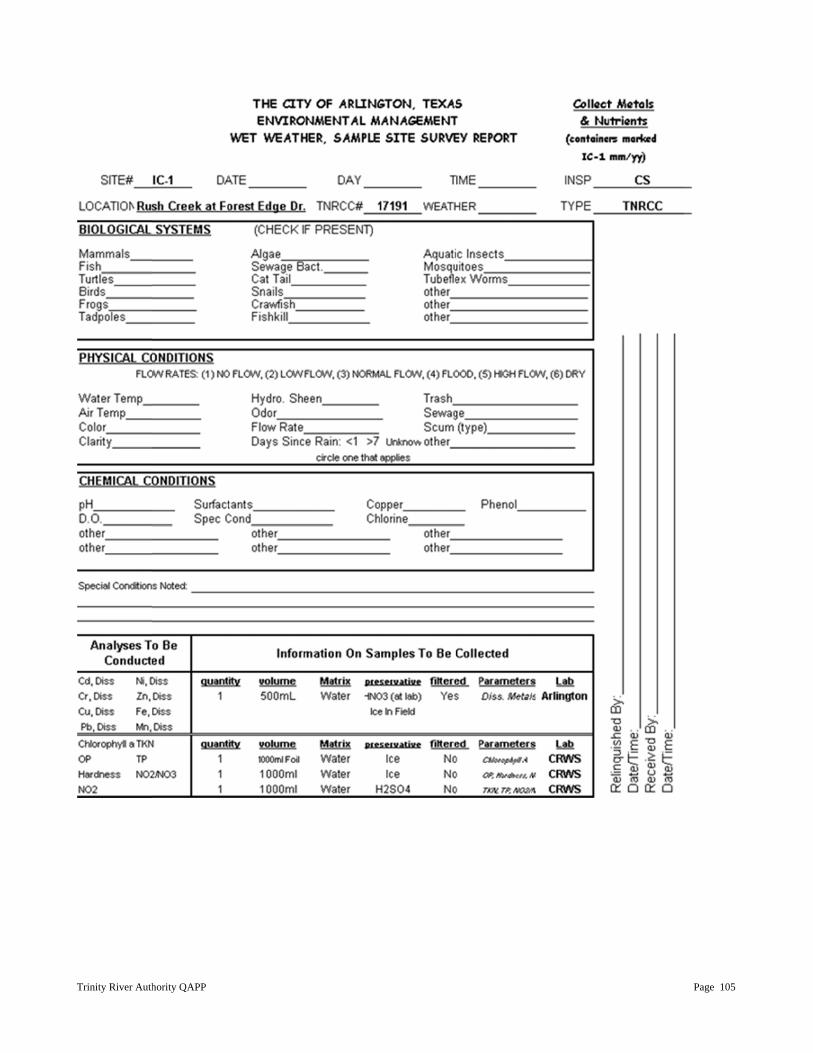
Trinity River Auth
hority QAPP Page 105
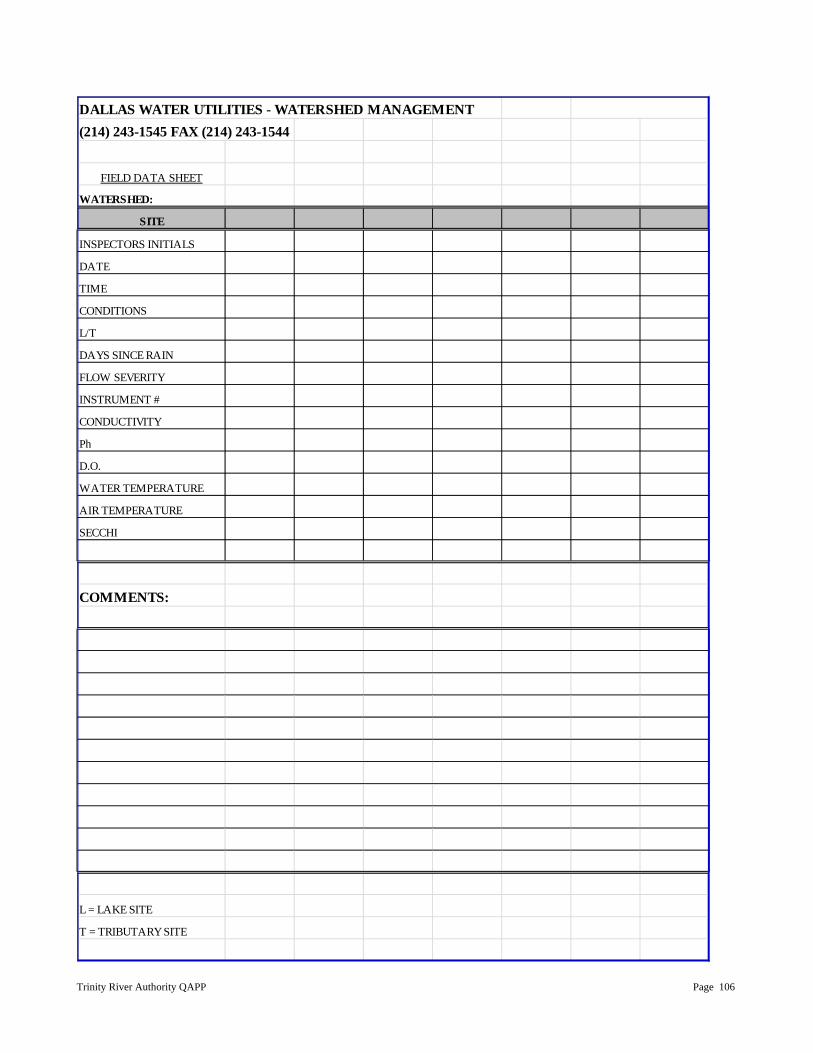
Trinity River Authority QAPP Page 106
DALLAS WATER UTILITIES - WATERSHED MANAGEMENT(214) 243-1545 FAX (214) 243-1544
FIELD DATA SHEET
WATERSHED:
SITE
INSPECTORS INITIALS
DATE
TIME
CONDITIONS
L/T
DAYS SINCE RAIN
FLOW SEVERITY
INSTRUMENT #
CONDUCTIVITY
Ph
D.O.
WATER TEMPERATURE
AIR TEMPERATURE
SECCHI
COMMENTS:
L = LAKE SITE
T = TRIBUTARY SITE
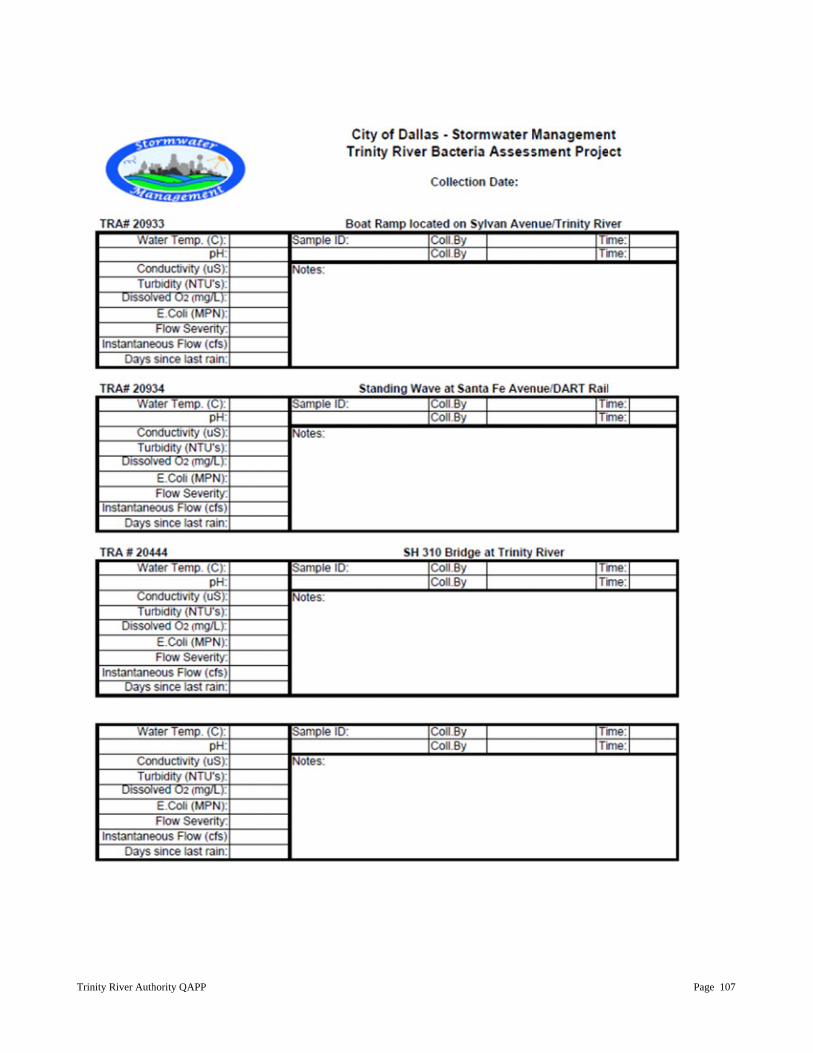
Trinity River Auth
hority QAPP
Page 107
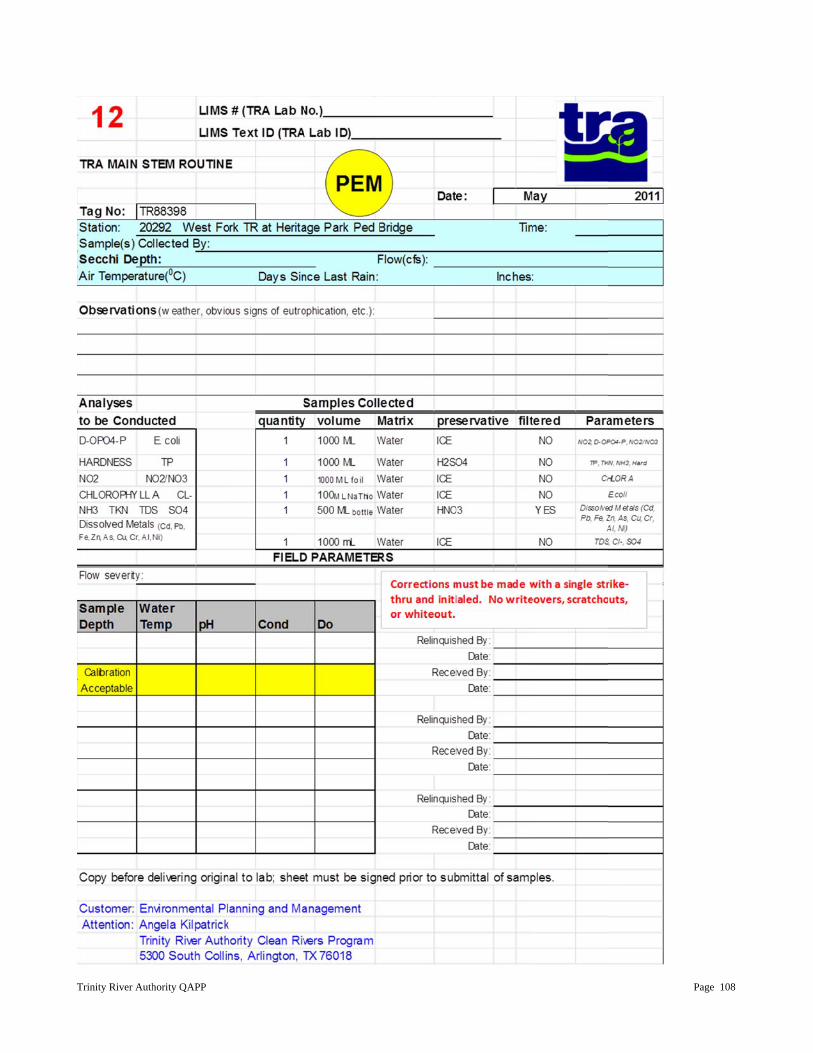
Trinity River Auth
hority QAPP
Page 108
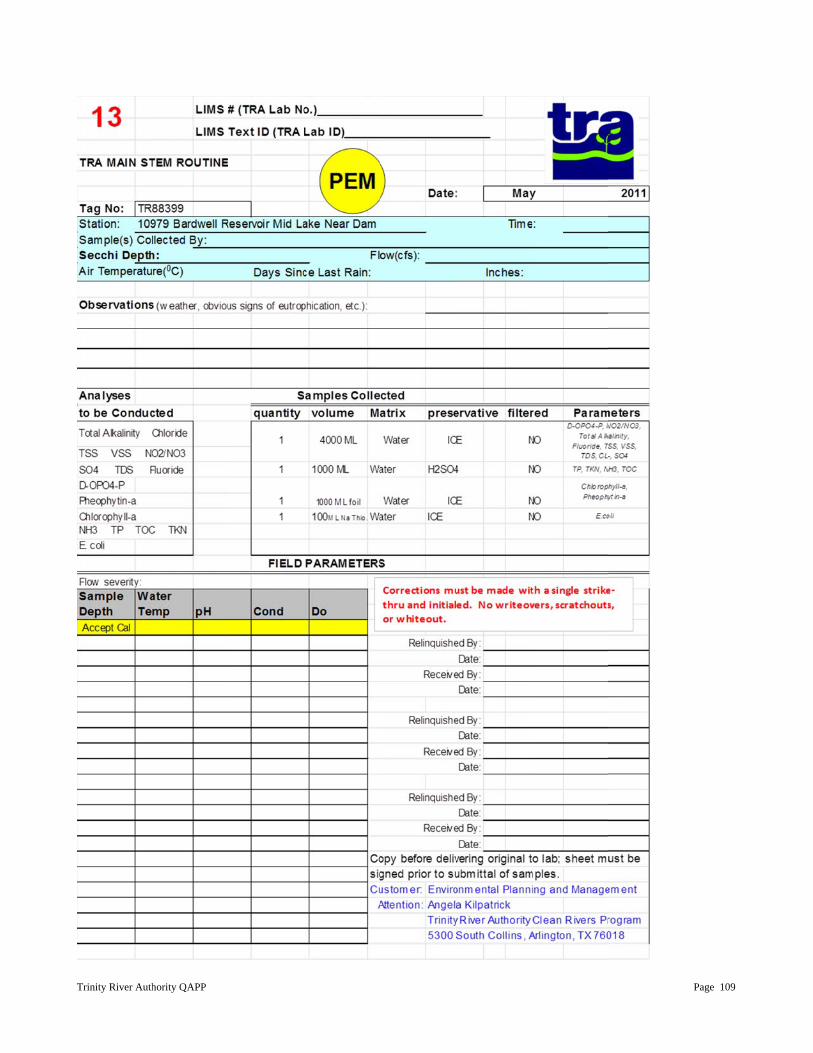
Trinity River Auth
hority QAPP
Page 109
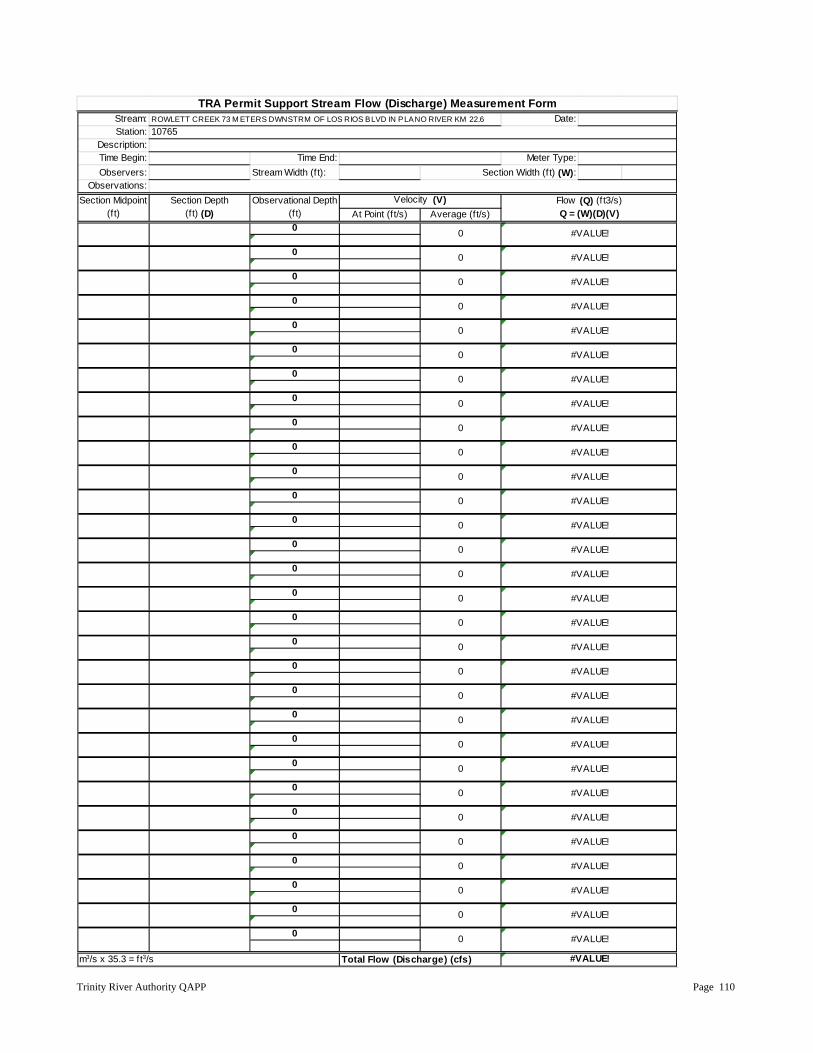
Trinity River Authority QAPP Page 110
Stream: Date:Station:
Description:Time Begin: Time End: Meter Type:Observers: Stream Width (f t):
Observations:
At Point (f t/s) Average (ft/s) 0
0
0
0
0
0
0
0
0
0
0
0
0
0
0
0
0
0
0
0
0
0
0
0
0
0
0
0
0
0
m3/s x 35.3 = ft3/s Total Flow (Discharge) (cfs) #VALUE!
0 #VALUE!
0 #VALUE!
0 #VALUE!
0 #VALUE!
0 #VALUE!
0 #VALUE!
0 #VALUE!
0 #VALUE!
0 #VALUE!
0 #VALUE!
0 #VALUE!
0 #VALUE!
0 #VALUE!
0 #VALUE!
0 #VALUE!
0 #VALUE!
0 #VALUE!
0 #VALUE!
0 #VALUE!
0 #VALUE!
0 #VALUE!
0 #VALUE!
0 #VALUE!
0 #VALUE!
0 #VALUE!
0 #VALUE!
0 #VALUE!
0 #VALUE!
0 #VALUE!
0 #VALUE!
Section Width (f t) (W):
Section Midpoint(ft)
Section Depth(ft) (D)
Observational Depth(ft)
Velocity (V) Flow (Q) (f t3/s)Q = (W)(D)(V)
TRA Permit Support Stream Flow (Discharge) Measurement FormROWLETT CREEK 73 M ETERS DWNSTRM OF LOS RIOS BLVD IN PLANO RIVER KM 22.610765
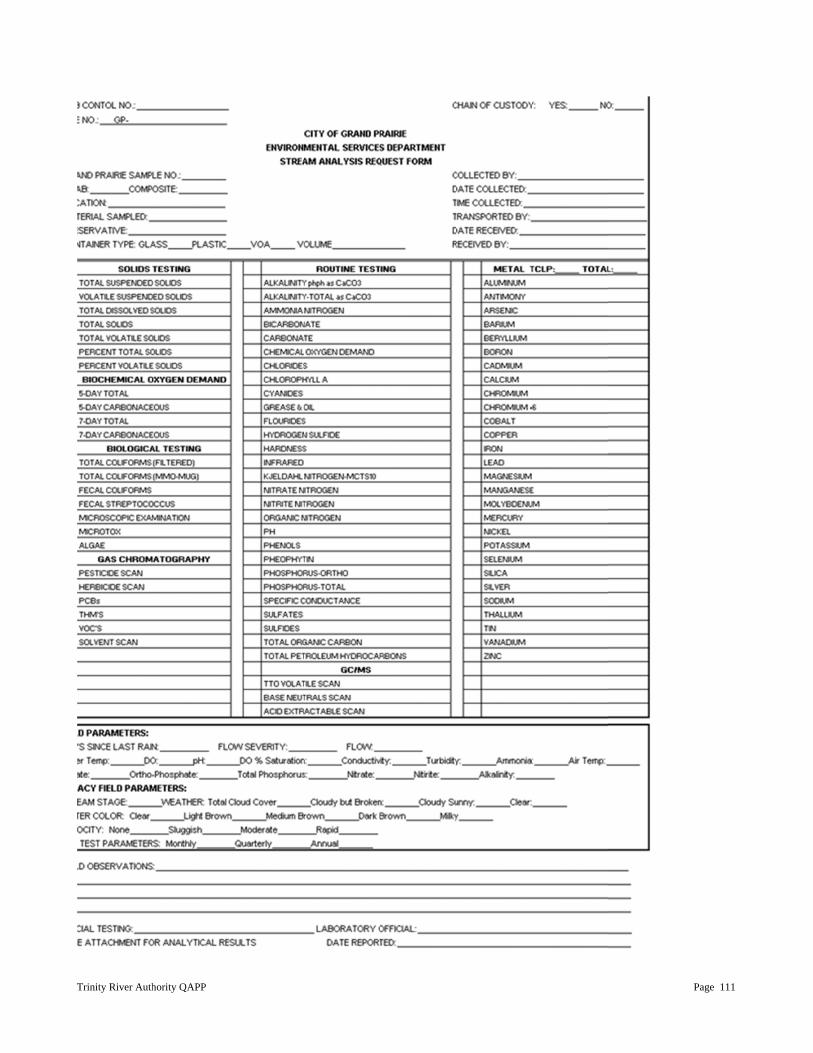
Trinity River Auth
hority QAPP
Page 111
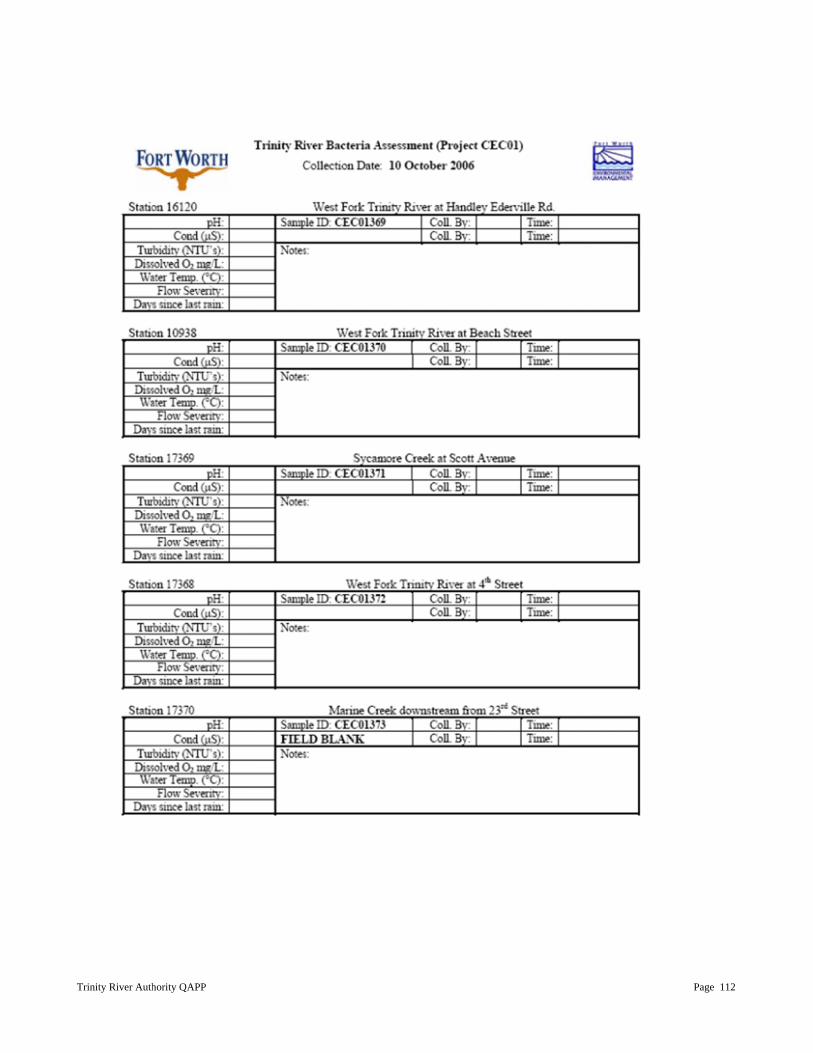
Trinity River Auth
hority QAPP
Page 112
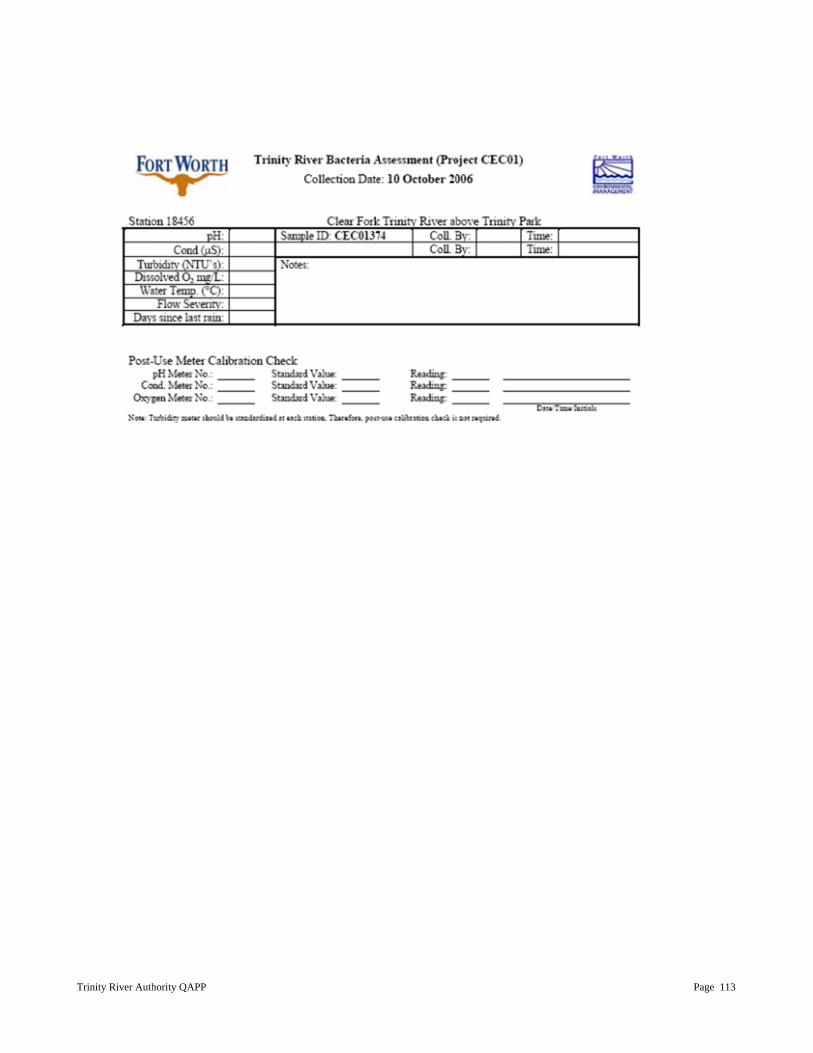
Trinity River Auth
hority QAPP Page 113

Trinity River Auth
hority QAPP Page 114
Trinity River Authority QAPP Page 115
APPENDIX D:
CHAIN OF CUSTODY FORMS
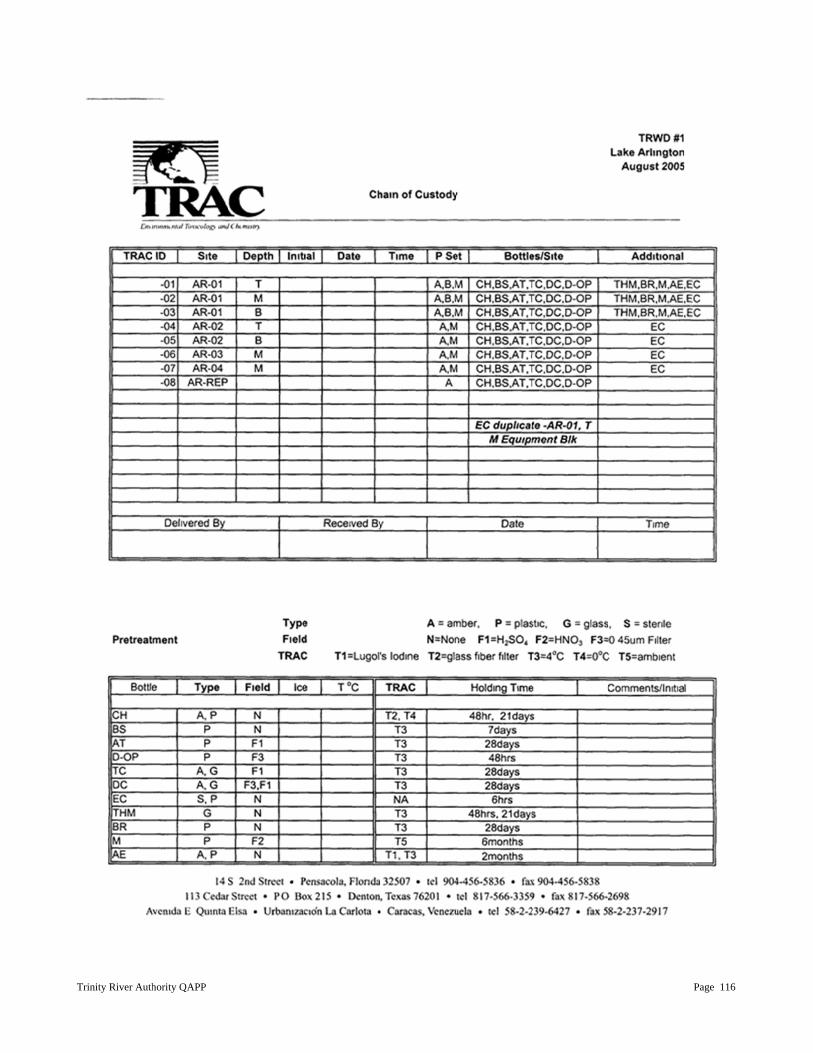
Trinity River Auth
hority QAPP
Page 116

Trinity River Auth
hority QAPP
Page 117

Trinity River Auth
hority QAPP Page 118
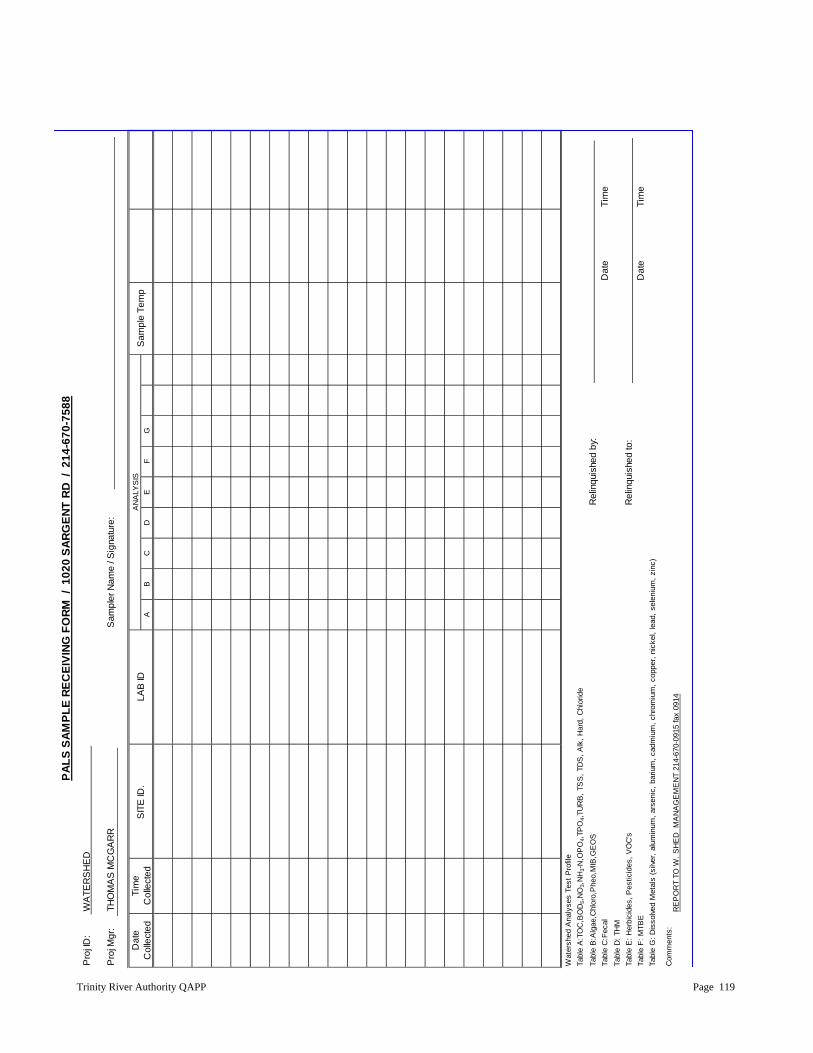
Trinity River Authority QAPP Page 119
P
roj ID
:W
ATE
RS
HE
D
Pro
j Mgr
:TH
OM
AS
MC
GA
RR
Sam
pler
Nam
e / S
igna
ture
:
Dat
eTi
me
Col
lect
edC
olle
cted
AB
CD
EF
G
Wat
ersh
ed A
naly
ses
Test
Pro
file
Tabl
e A
:TO
C,B
OD
5,N
O3,
NH
3-N
,OP
O4,
TPO
4,TU
RB
, TS
S, T
DS
, Alk
, Har
d, C
hlor
ide
Tabl
e B
:Alg
ae,C
hlor
o,P
heo,
MIB
,GE
OS
Rel
inqu
ishe
d by
: Ta
ble
C:F
ecal
D
ate
Tim
eTa
ble
D: T
HM
Tabl
e E
: Her
bici
des,
Pes
ticid
es, V
OC
'sR
elin
quis
hed
to:
Tabl
e F:
MTB
ED
ate
Tim
eTa
ble
G: D
isso
lved
Met
als
(silv
er, a
lum
inum
, ars
enic
, bar
ium
, cad
miu
m, c
hrom
ium
, cop
per,
nick
el, l
ead,
sel
eniu
m, z
inc)
RE
PO
RT
TO W
. SH
ED
MA
NA
GE
ME
NT
214-
670-
0915
fax
0914
AN
ALY
SIS
SIT
E ID
. LA
B ID
Sam
ple
Tem
p
PALS
SAM
PLE
REC
EIVI
NG F
ORM
/ 1
020
SARG
ENT
RD /
214
-670
-758
8
Com
men
ts:
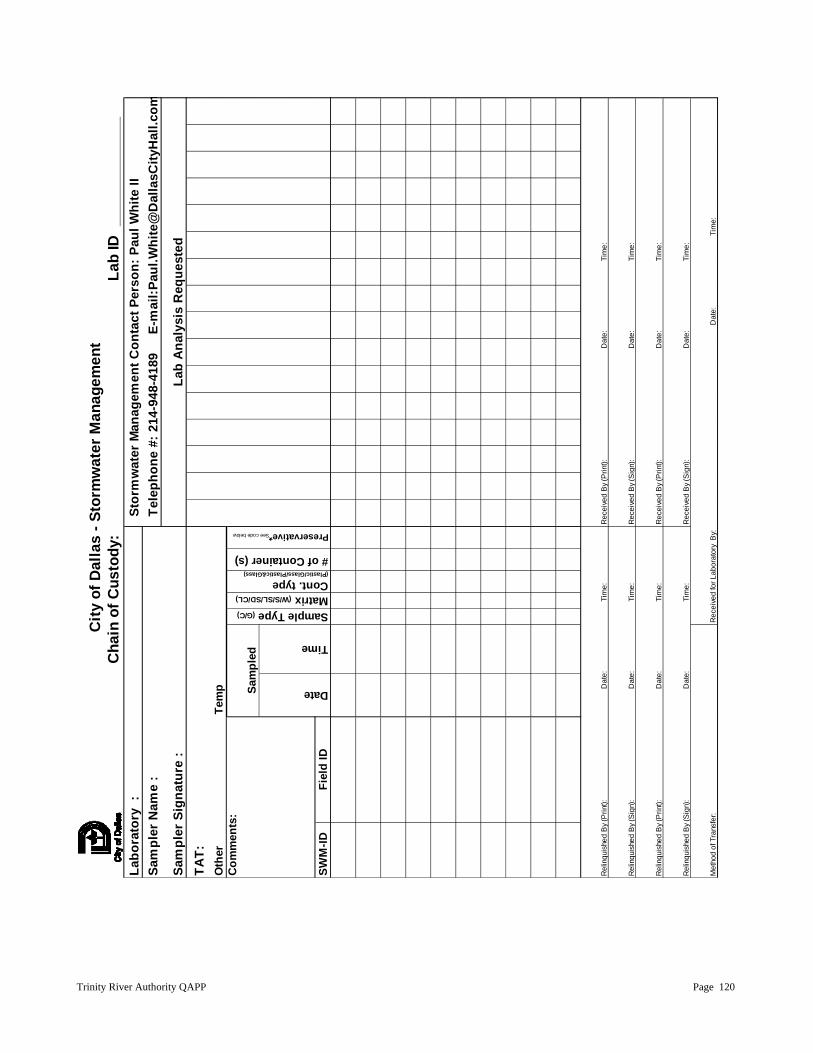
Trinity River Authority QAPP Page 120
Labo
rato
ry :
Sto
rmw
ater
Man
agem
ent C
onta
ct P
erso
n: P
aul W
hite
II
Sam
pler
Sig
natu
re :
TAT:
O
ther
Tem
p
SWM
-ID
Rel
inqu
ishe
d B
y (S
ign)
:
Dat
e:
T
ime:
Rel
inqu
ishe
d B
y (P
rint):
D
ate:
Tim
e:
Rec
eive
d B
y (S
ign)
:
Dat
e:
T
ime:
Lab
Ana
lysi
s R
eque
sted
Rec
eive
d B
y (P
rint):
D
ate:
Tim
e:
Rec
eive
d B
y (S
ign)
:
Dat
e:
T
ime:
Rec
eive
d B
y (P
rint):
D
ate:
Tim
e:
Rel
inqu
ishe
d B
y (P
rint):
D
ate:
Tim
e:
Sam
pled
Sam
pler
Nam
e :
Met
hod
of T
rans
fer:
Rec
eive
d fo
r Lab
orat
ory
By:
Dat
e:
T
ime:
Rel
inqu
ishe
d B
y (S
ign)
:
Dat
e:
T
ime:
Date
Time
City
of D
alla
s - S
torm
wat
er M
anag
emen
t
Cont. type (Plastic/Glass/Plastic&Glass)
Matrix (W/S/SL/SD/CL)
Preservative*See code below
# of Container (s)
Tel
epho
ne #
: 214
-948
-418
9
E-m
ail:P
aul.W
hite
@D
alla
sCity
Hal
l.com
Fiel
d ID
Sample Type (G/C)
Com
men
ts:
Cha
in o
f Cus
tody
:La
b ID
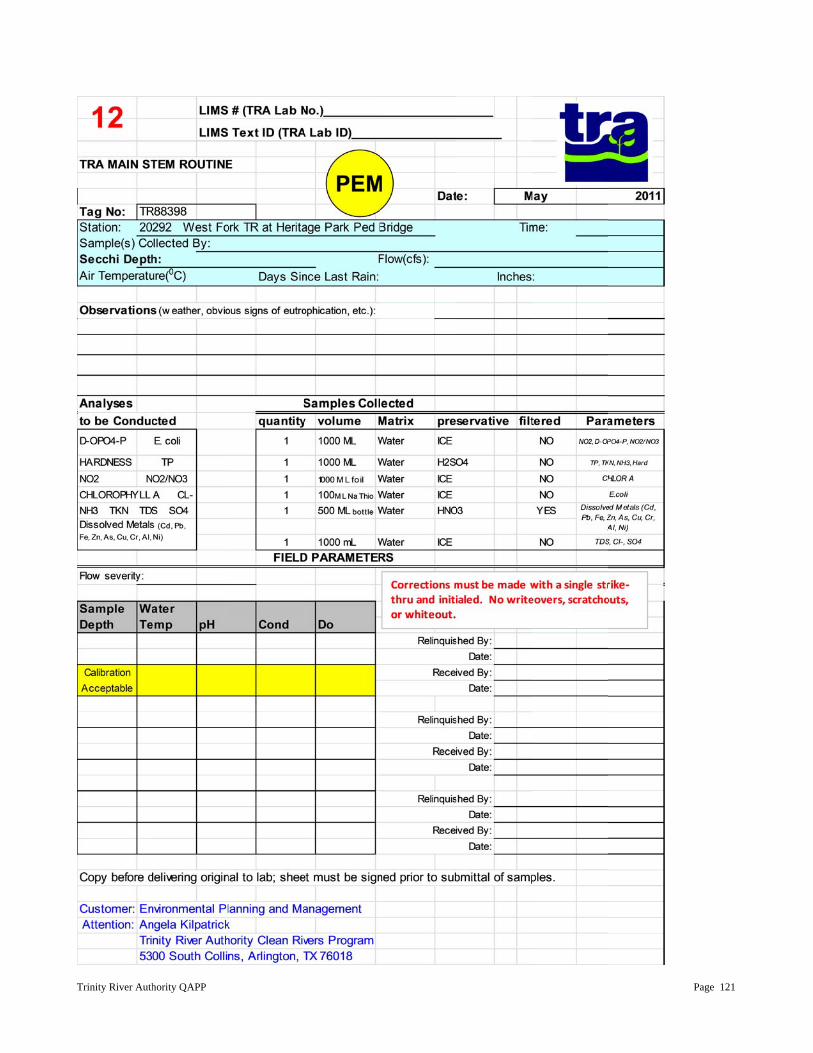
Trinity River Auth
hority QAPP Page 121
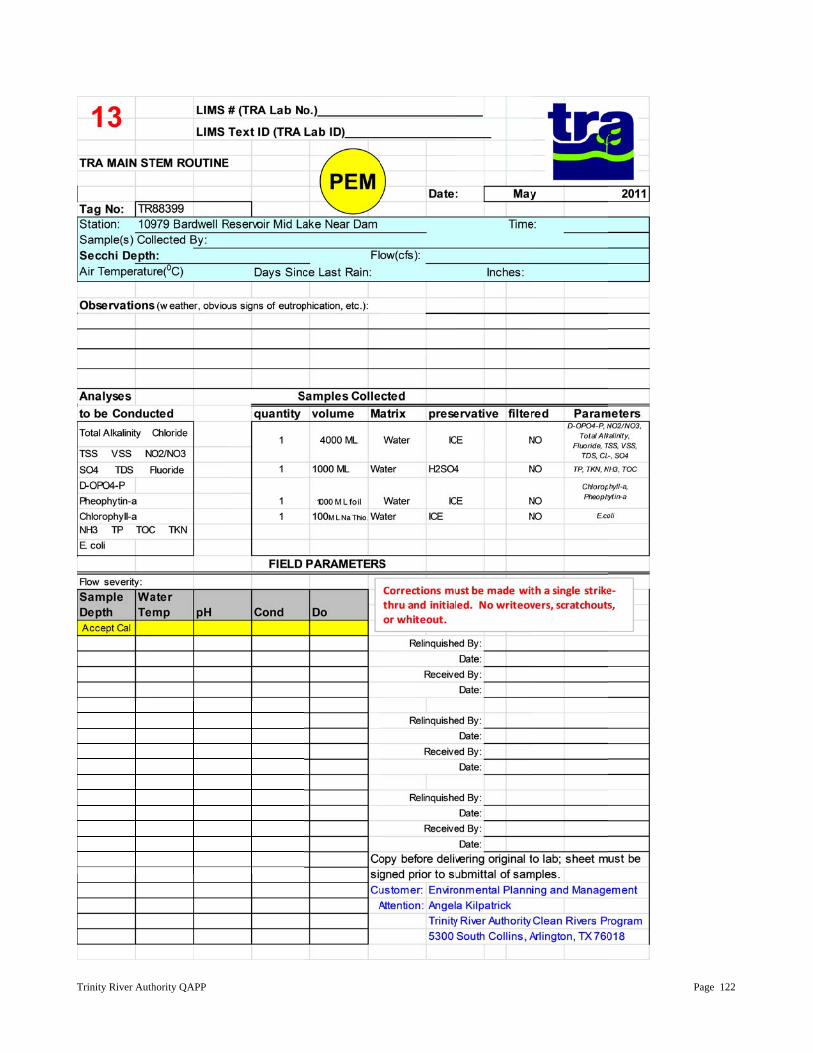
Trinity River Auth
hority QAPP
Page 122

Trinity River Auth
hority QAPP
Page 123
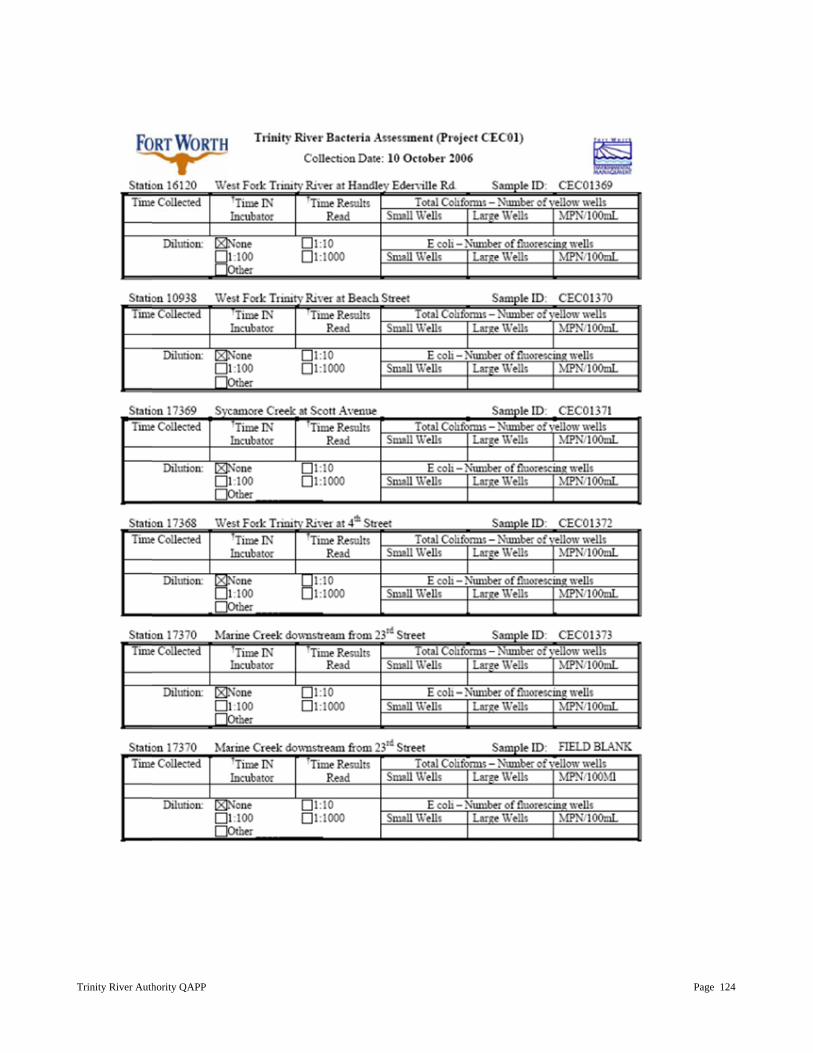
Trinity River Auth
hority QAPP Page 124
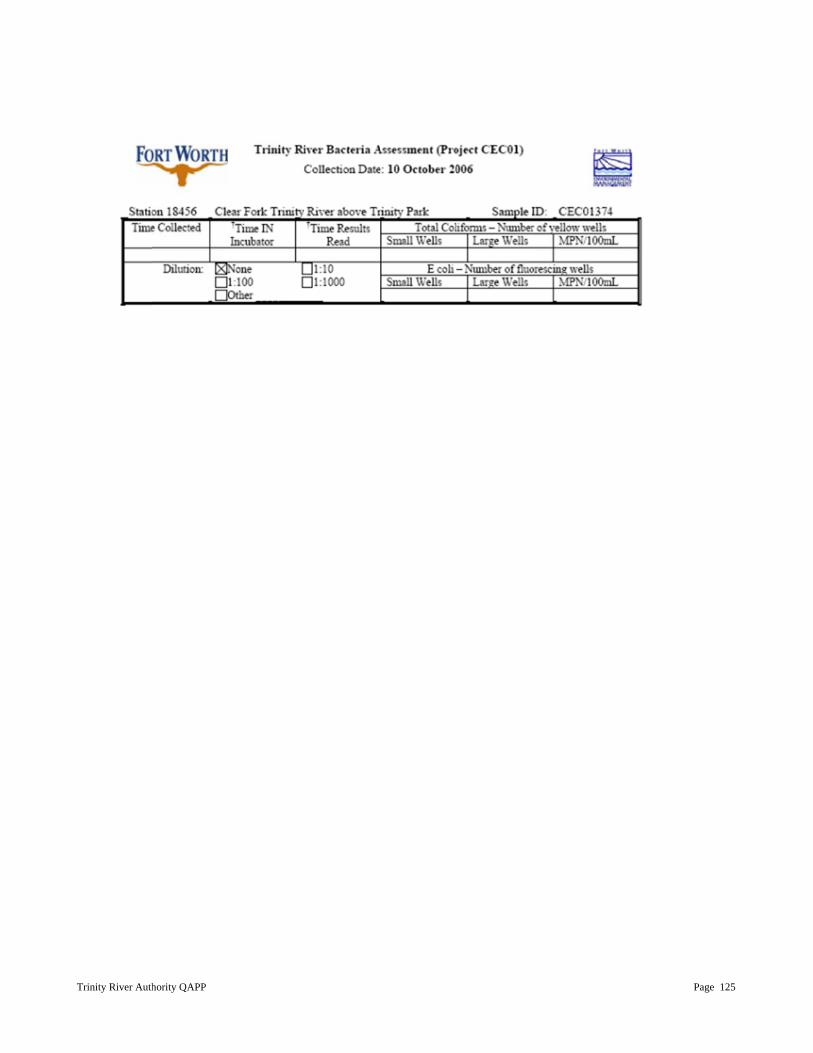
Trinity River Auth
hority QAPP
Page 125
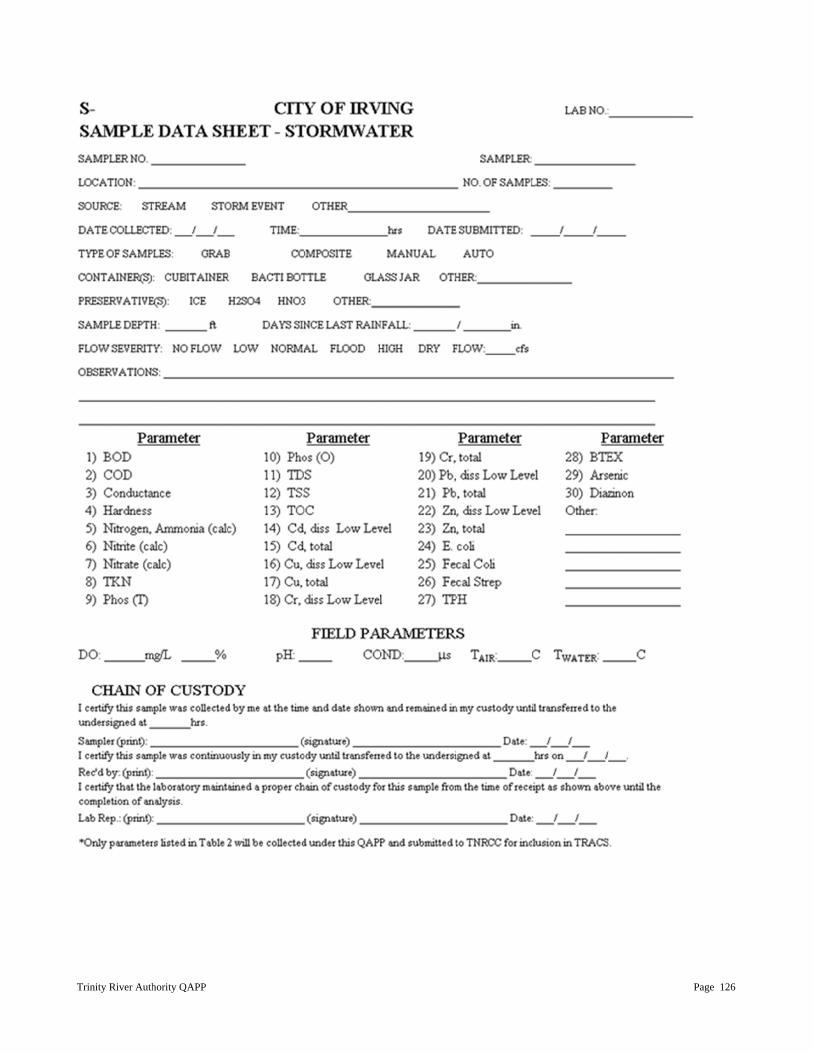
Trinity River Auth
hority QAPP Page 126
Trinity River Authority QAPP Page 127
APPENDIX E: DATA REVIEW CHECKLIST AND SUMMARY
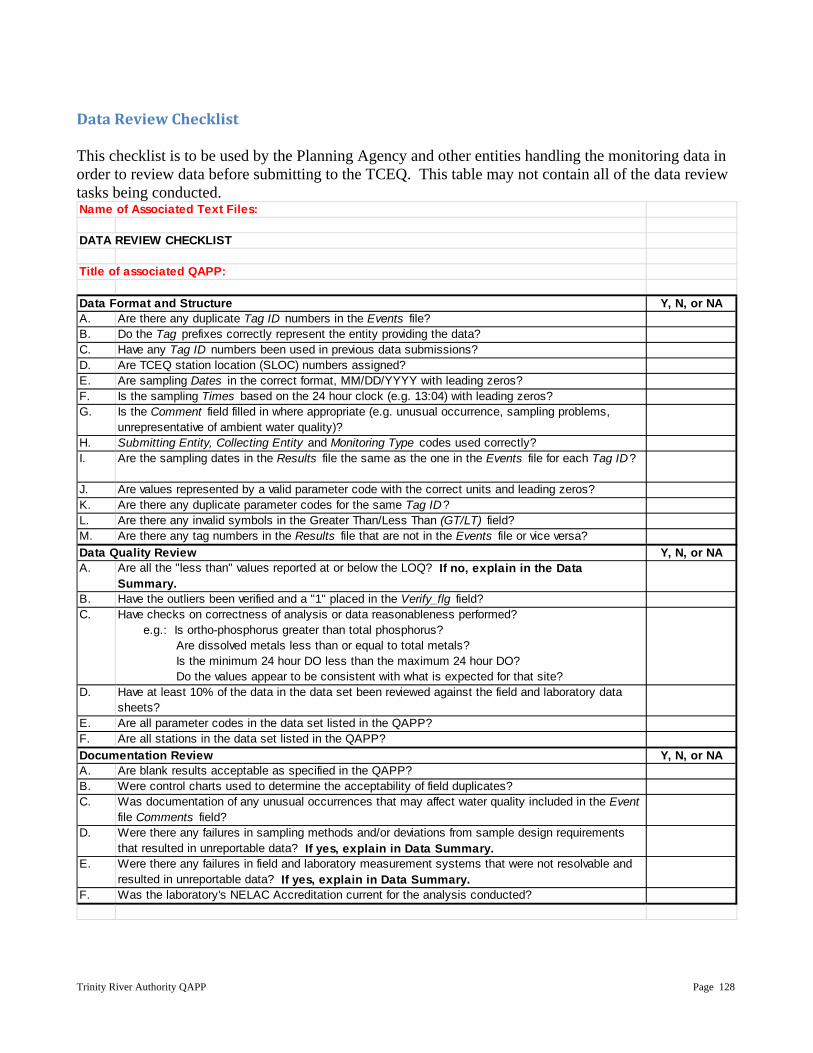
Trinity River Authority QAPP Page 128
DataReviewChecklist This checklist is to be used by the Planning Agency and other entities handling the monitoring data in order to review data before submitting to the TCEQ. This table may not contain all of the data review tasks being conducted.
Y, N, or NAA. Are there any duplicate Tag ID numbers in the Events file?B. Do the Tag prefixes correctly represent the entity providing the data?C. Have any Tag ID numbers been used in previous data submissions?D. Are TCEQ station location (SLOC) numbers assigned?E. Are sampling Dates in the correct format, MM/DD/YYYY with leading zeros?F. Is the sampling Times based on the 24 hour clock (e.g. 13:04) with leading zeros?G. Is the Comment field filled in where appropriate (e.g. unusual occurrence, sampling problems,
unrepresentative of ambient water quality)?H. Submitting Entity, Collecting Entity and Monitoring Type codes used correctly?I. Are the sampling dates in the Results file the same as the one in the Events file for each Tag ID?
J. Are values represented by a valid parameter code with the correct units and leading zeros?K. Are there any duplicate parameter codes for the same Tag ID?L. Are there any invalid symbols in the Greater Than/Less Than (GT/LT) field?M. Are there any tag numbers in the Results file that are not in the Events file or vice versa?
Y, N, or NAA. Are all the "less than" values reported at or below the LOQ? If no, explain in the Data
Summary.B. Have the outliers been verified and a "1" placed in the Verify_flg field?C. Have checks on correctness of analysis or data reasonableness performed?
e.g.: Is ortho-phosphorus greater than total phosphorus? Are dissolved metals less than or equal to total metals? Is the minimum 24 hour DO less than the maximum 24 hour DO? Do the values appear to be consistent with what is expected for that site?
D. Have at least 10% of the data in the data set been reviewed against the field and laboratory data sheets?
E. Are all parameter codes in the data set listed in the QAPP?F. Are all stations in the data set listed in the QAPP?
Y, N, or NAA. Are blank results acceptable as specified in the QAPP?B. Were control charts used to determine the acceptability of field duplicates?C. Was documentation of any unusual occurrences that may affect water quality included in the Event
file Comments field?D. Were there any failures in sampling methods and/or deviations from sample design requirements
that resulted in unreportable data? If yes, explain in Data Summary.E. Were there any failures in field and laboratory measurement systems that were not resolvable and
resulted in unreportable data? If yes, explain in Data Summary.F. Was the laboratory's NELAC Accreditation current for the analysis conducted?
DATA REVIEW CHECKLIST
Name of Associated Text Files:
Data Quality Review
Documentation Review
Data Format and Structure
Title of associated QAPP:
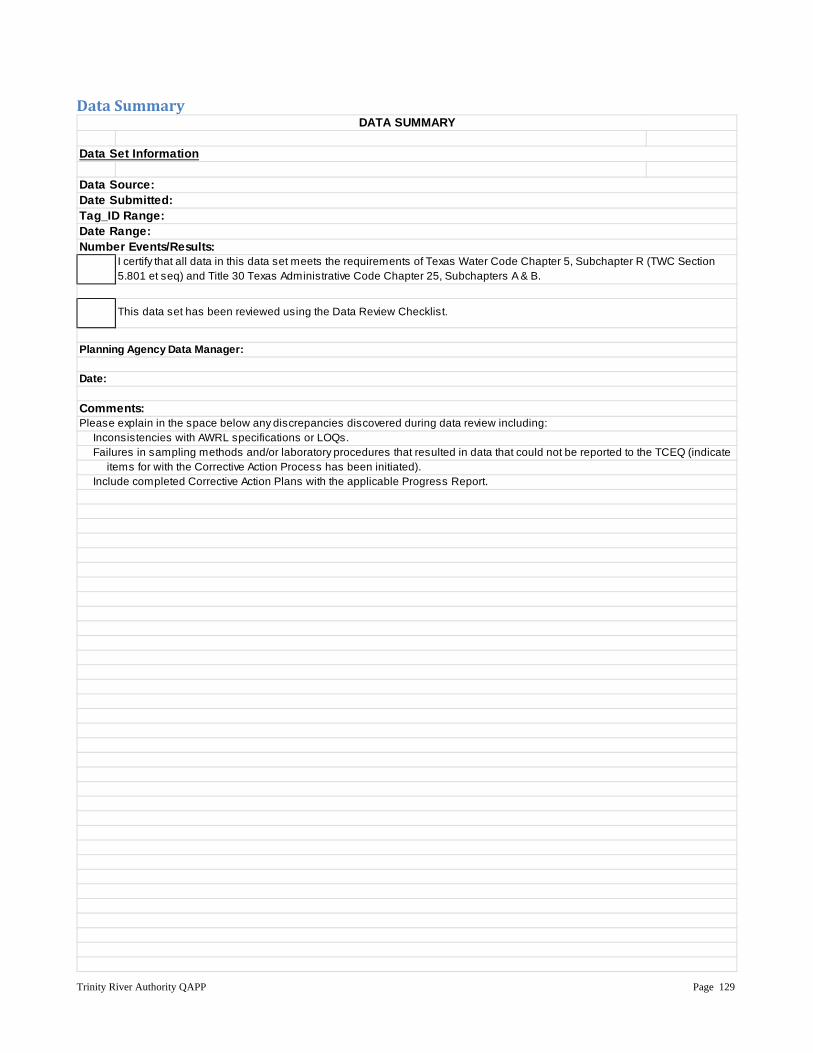
Trinity River Authority QAPP Page 129
DataSummary
Number Events/Results:
Comments:
Planning Agency Data Manager:
Date:
Failures in sampling methods and/or laboratory procedures that resulted in data that could not be reported to the TCEQ (indicate Inconsistencies with AWRL specifications or LOQs.Please explain in the space below any discrepancies discovered during data review including:
items for with the Corrective Action Process has been initiated).
DATA SUMMARY
Data Set Information
Include completed Corrective Action Plans with the applicable Progress Report.
Data Source:
Date Range:Tag_ID Range:Date Submitted:
I certify that all data in this data set meets the requirements of Texas Water Code Chapter 5, Subchapter R (TWC Section 5.801 et seq) and Title 30 Texas Administrative Code Chapter 25, Subchapters A & B.
This data set has been reviewed using the Data Review Checklist.
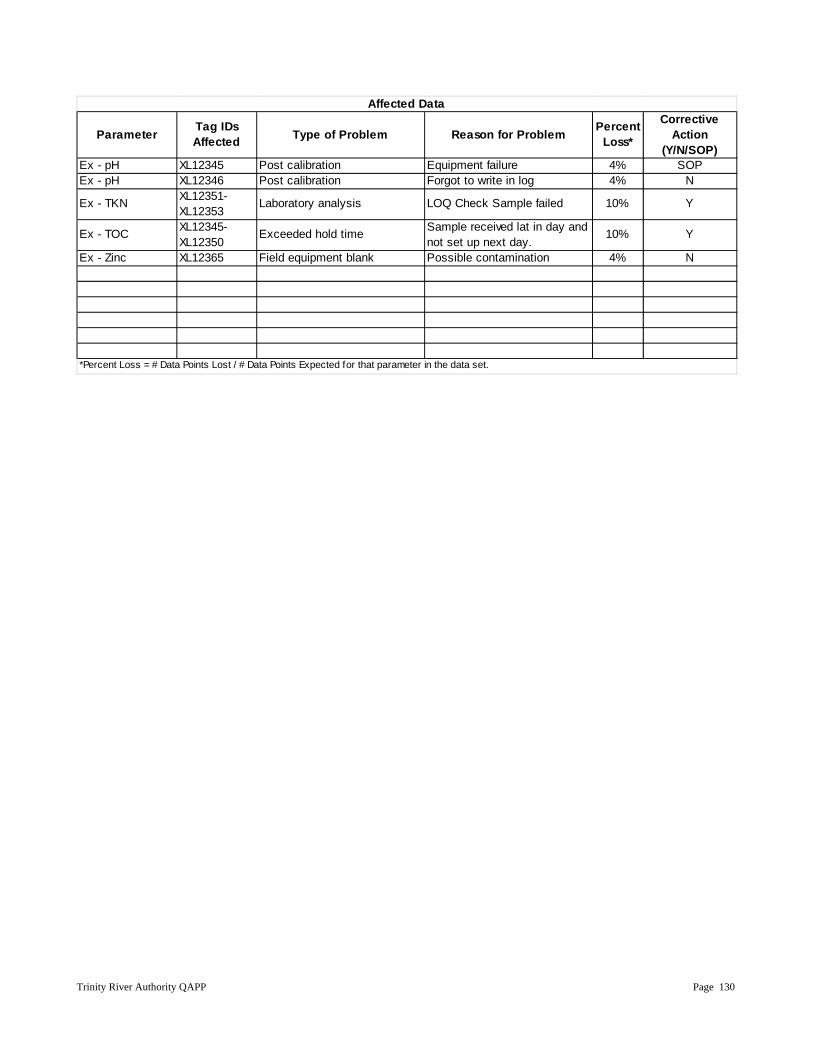
Trinity River Authority QAPP Page 130
Parameter Tag IDs Affected Type of Problem Reason for Problem Percent
Loss*
Corrective Action
(Y/N/SOP)Ex - pH XL12345 Post calibration Equipment failure 4% SOPEx - pH XL12346 Post calibration Forgot to write in log 4% N
Ex - TKN XL12351-XL12353
Laboratory analysis LOQ Check Sample failed 10% Y
Ex - TOC XL12345-XL12350
Exceeded hold time Sample received lat in day and not set up next day.
10% Y
Ex - Zinc XL12365 Field equipment blank Possible contamination 4% N
*Percent Loss = # Data Points Lost / # Data Points Expected for that parameter in the data set.
Affected Data
Trinity River Authority QAPP Page 131
APPENDIX F: TRA CRP DATA MANAGEMENT PLAN
Trinity River Authority QAPP Page 132
DATA MANAGEMENT PLAN
August 2011
The Texas Clean Rivers Program
Trinity River Authority
Trinity River Authority QAPP Page 133
Introduction
TRA was created in 1955 to provide a range of water-related services in the Trinity River basin. Among those duties, the Authority is to maintain a Master Plan for the conservation and use of water resources in the Trinity River basin. In 1991 the Texas Legislature enacted Senate Bill 818, the Clean Rivers Act, which requires each river authority in the state to perform water quality assessments in their respective river basins. The Trinity River Authority administers the Clean Rivers Program in the Trinity basin under contract with the Texas Commission on Environmental Quality. TRA’s objectives are to establish and maintain a comprehensive, quality assured database concerning the quality of waters in the Trinity River basin and to make such data available in a uniform, usable format as to allow highly informed decisions to be made concerning these waters. The data management plan herein detailed describes the mechanisms and procedures to be used in obtaining the above stated objectives. The Trinity River Authority Clean Rivers Program obtains data from three primary sources. These sources are within basin participating agencies (WBPA) (e.g. Tarrant Regional Water District and the City of Dallas), TRA general Office routine sampling, and special studies. Each of the WBPAs maintain their own database(s) which exist in a variety of formats and can be very large. Generally, each entity has designed and implements data collection programs on its own initiative, utilizing funds independent of the CRP. WBPAs submit or will submit data routinely. Subcontractors, in contrast, may be used to conduct special studies, which may be limited in scope and time. Water quality data obtained from the above listed sources will be submitted to the TCEQ only after programs generating data are covered under the TRA QAPP or upon approval of the TCEQ CRP Project Manager. It may at times be desirable to obtain data from sources other than those listed above. These alternate sources may include the Texas Commission on Environmental Quality, U. S. Geological Survey, Texas Parks and Wildlife Department, U. S. Fish and Wildlife Service, and U. S. Army Corps of Engineers. The Clean Rivers Program has identified various additional databases which may be included in this program, especially geographic coverages for sampling sites, wastewater discharges, water rights, underground and above ground storage tanks, oil and gas wells, water supply wells, and landfills. The CRP cycle begins on September 1 of odd years, which is the start of the first fiscal year of the state biennium and is the start of each CRP contract between TCEQ and TRA. The workplan for each biennium is developed beginning the preceding spring. TRA seeks recommendations from and develops basin-wide priorities with the Trinity CRP Steering Committee. TCEQ develops state-wide priorities with the CRP stakeholders group and the Long Term Objectives Committee. Basin-wide and state-wide priorities are combined in a workplan, which is then incorporated as a scope of services in the two-year TCEQ/TRA contract. The TRA cycle is based on its fiscal year beginning December 1. Budget preparation begins early in the year and the budget is made final in October. CRP activity must be included in the budget in categories such as personnel, subcontracts, capital, etc. Many actions involving CRP do not directly affect other authority programs and are planned simply according to CRP requirements. However, some actions involving computers are planned on an authority-wide basis and CRP must adapt to those actions.
Trinity River Authority QAPP Page 134
Data Management Personnel
1. TRA Senior Project Manager a. Responsible for overseeing the implementation of the CRP requirements in
the contract and in this QAPP.
2. TRA Project Manager a. Responsible for implementing CRP requirements in contracts, QAPPs, and
QAPP amendments and appendices. b. Coordinates basin planning activities and work of basin partners. c. Ensures monitoring systems audits are conducted to ensure QAPPs are
followed by planning agency participants and that projects are producing data of known quality.
d. Ensures that subcontractors are qualified to perform contracted work. e. Ensures CRP project managers and/or QA Specialists are notified of
circumstances which may adversely affect quality of data derived from collection and analysis of samples.
f. Responsible for validating that all data collected meet the data quality objectives of the project and are suitable for reporting to the TCEQ.
3. TRA Quality Assurance Officer
a. Responsible for writing and maintaining basin QAPPs, amendments and appendices.
b. Responsible for determining if all data collected meet the data quality objectives of the project and are suitable for reporting to the TCEQ.
c. Assists with conduct of monitoring systems audits for planning agency projects.
4. TRA Data Manager
a. Responsible for ensuring that field data are properly reviewed and verified. b. Responsible for the transfer of basin quality-assured water quality data to the
TCEQ in a compatible format. c. Maintains quality-assured data on planning agency internet site. d. Responsible for the basin Data Management Plan.
5. Within Basin Participating Agencies (WBPAs)
a. WBPAs have their own staff with designated responsibilities. See Section A4 of the FY 2010-2011 TRA CRP QAPP for further explanation.
6. TCEQ
a. TCEQ has their own staff with designated responsibilities. See Section A4 of the FY 2010-2011 TRA CRP QAPP for further explanation.
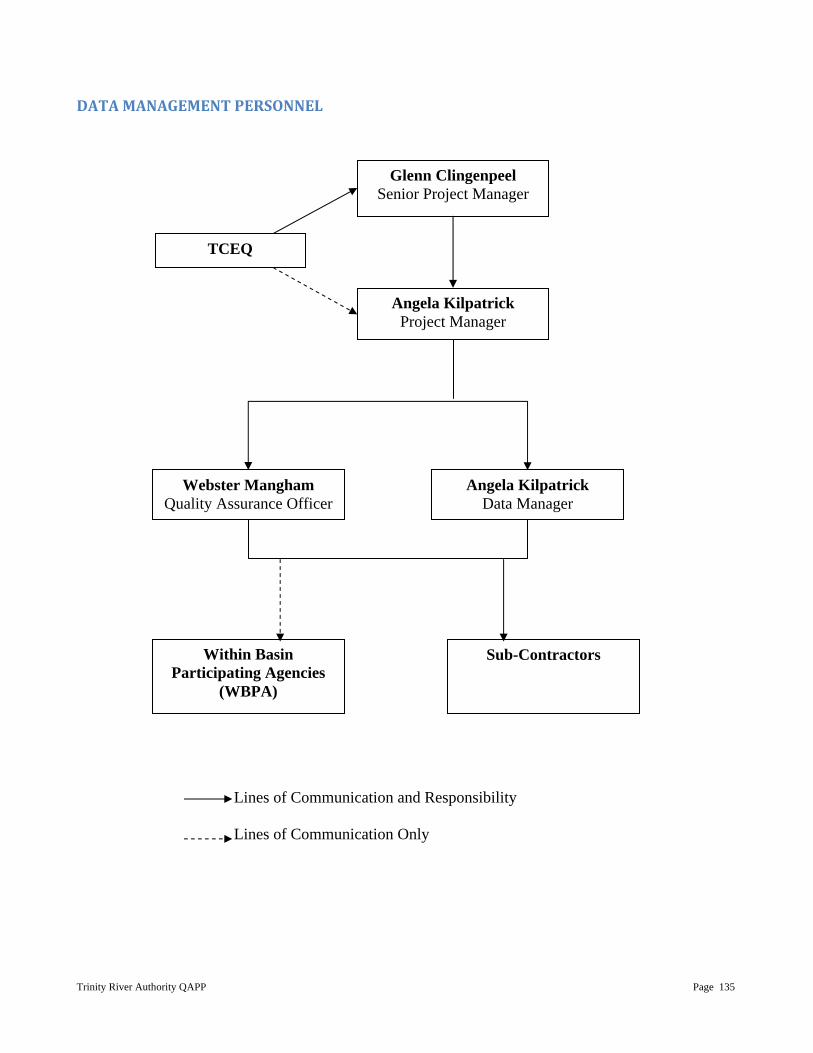
Trinity River Authority QAPP Page 135
DATAMANAGEMENTPERSONNEL
Glenn Clingenpeel
Senior Project Manager
Angela Kilpatrick Data Manager
Webster Mangham Quality Assurance Officer
Sub-Contractors Within Basin Participating Agencies
(WBPA)
Lines of Communication and Responsibility Lines of Communication Only
Angela Kilpatrick Project Manager
TCEQ
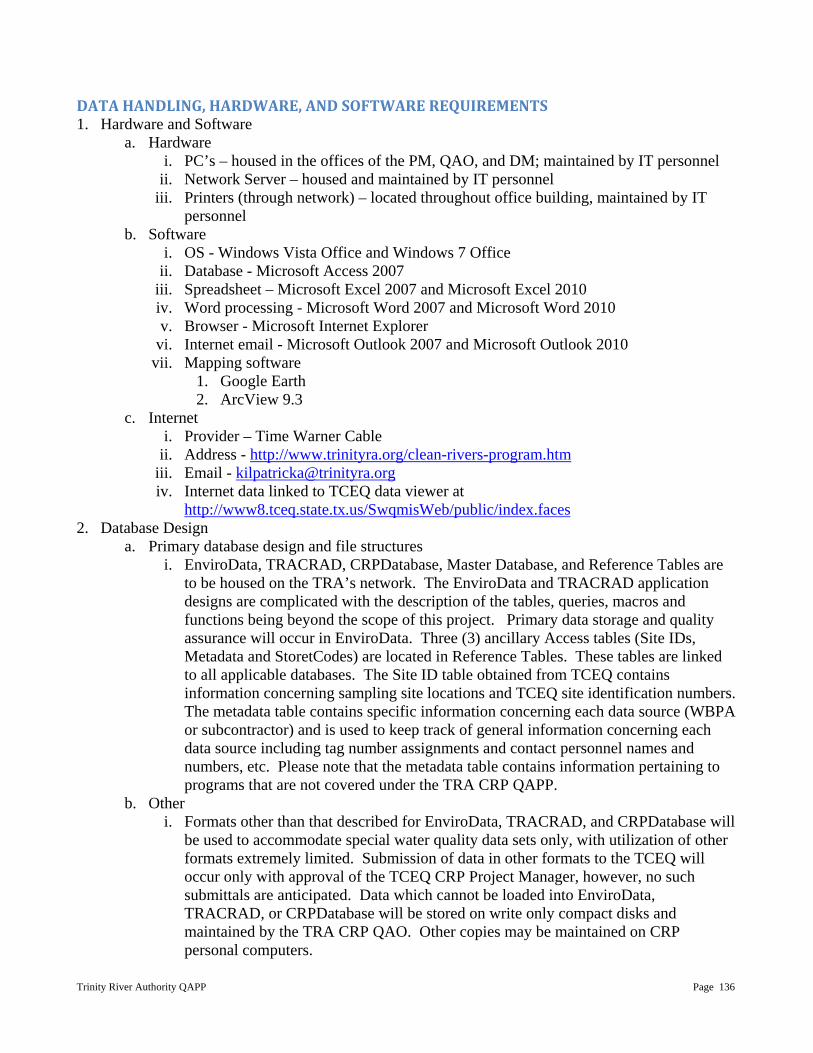
Trinity River Authority QAPP Page 136
DATAHANDLING,HARDWARE,ANDSOFTWAREREQUIREMENTS1. Hardware and Software
a. Hardware i. PC’s – housed in the offices of the PM, QAO, and DM; maintained by IT personnel
ii. Network Server – housed and maintained by IT personnel iii. Printers (through network) – located throughout office building, maintained by IT
personnel b. Software
i. OS - Windows Vista Office and Windows 7 Office ii. Database - Microsoft Access 2007
iii. Spreadsheet – Microsoft Excel 2007 and Microsoft Excel 2010 iv. Word processing - Microsoft Word 2007 and Microsoft Word 2010 v. Browser - Microsoft Internet Explorer
vi. Internet email - Microsoft Outlook 2007 and Microsoft Outlook 2010 vii. Mapping software
1. Google Earth 2. ArcView 9.3
c. Internet i. Provider – Time Warner Cable
ii. Address - http://www.trinityra.org/clean-rivers-program.htm iii. Email - [email protected] iv. Internet data linked to TCEQ data viewer at
http://www8.tceq.state.tx.us/SwqmisWeb/public/index.faces 2. Database Design
a. Primary database design and file structures i. EnviroData, TRACRAD, CRPDatabase, Master Database, and Reference Tables are
to be housed on the TRA’s network. The EnviroData and TRACRAD application designs are complicated with the description of the tables, queries, macros and functions being beyond the scope of this project. Primary data storage and quality assurance will occur in EnviroData. Three (3) ancillary Access tables (Site IDs, Metadata and StoretCodes) are located in Reference Tables. These tables are linked to all applicable databases. The Site ID table obtained from TCEQ contains information concerning sampling site locations and TCEQ site identification numbers. The metadata table contains specific information concerning each data source (WBPA or subcontractor) and is used to keep track of general information concerning each data source including tag number assignments and contact personnel names and numbers, etc. Please note that the metadata table contains information pertaining to programs that are not covered under the TRA CRP QAPP.
b. Other i. Formats other than that described for EnviroData, TRACRAD, and CRPDatabase will
be used to accommodate special water quality data sets only, with utilization of other formats extremely limited. Submission of data in other formats to the TCEQ will occur only with approval of the TCEQ CRP Project Manager, however, no such submittals are anticipated. Data which cannot be loaded into EnviroData, TRACRAD, or CRPDatabase will be stored on write only compact disks and maintained by the TRA CRP QAO. Other copies may be maintained on CRP personal computers.
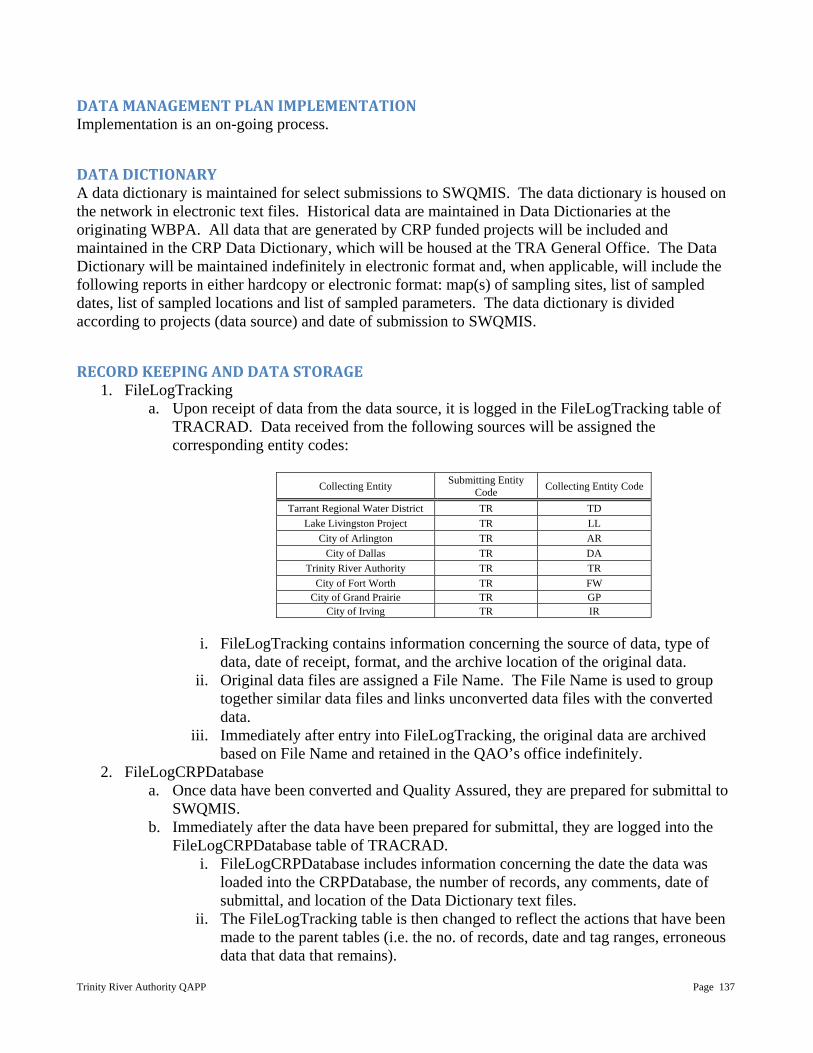
Trinity River Authority QAPP Page 137
DATAMANAGEMENTPLANIMPLEMENTATIONImplementation is an on-going process.
DATADICTIONARYA data dictionary is maintained for select submissions to SWQMIS. The data dictionary is housed on the network in electronic text files. Historical data are maintained in Data Dictionaries at the originating WBPA. All data that are generated by CRP funded projects will be included and maintained in the CRP Data Dictionary, which will be housed at the TRA General Office. The Data Dictionary will be maintained indefinitely in electronic format and, when applicable, will include the following reports in either hardcopy or electronic format: map(s) of sampling sites, list of sampled dates, list of sampled locations and list of sampled parameters. The data dictionary is divided according to projects (data source) and date of submission to SWQMIS.
RECORDKEEPINGANDDATASTORAGE1. FileLogTracking
a. Upon receipt of data from the data source, it is logged in the FileLogTracking table of TRACRAD. Data received from the following sources will be assigned the corresponding entity codes:
Collecting Entity Submitting Entity Code Collecting Entity Code
Tarrant Regional Water District TR TD Lake Livingston Project TR LL
City of Arlington TR AR City of Dallas TR DA
Trinity River Authority TR TR City of Fort Worth TR FW
City of Grand Prairie TR GP City of Irving TR IR
i. FileLogTracking contains information concerning the source of data, type of data, date of receipt, format, and the archive location of the original data.
ii. Original data files are assigned a File Name. The File Name is used to group together similar data files and links unconverted data files with the converted data.
iii. Immediately after entry into FileLogTracking, the original data are archived based on File Name and retained in the QAO’s office indefinitely.
2. FileLogCRPDatabase a. Once data have been converted and Quality Assured, they are prepared for submittal to
SWQMIS. b. Immediately after the data have been prepared for submittal, they are logged into the
FileLogCRPDatabase table of TRACRAD. i. FileLogCRPDatabase includes information concerning the date the data was
loaded into the CRPDatabase, the number of records, any comments, date of submittal, and location of the Data Dictionary text files.
ii. The FileLogTracking table is then changed to reflect the actions that have been made to the parent tables (i.e. the no. of records, date and tag ranges, erroneous data that data that remains).
Trinity River Authority QAPP Page 138
c. After the data are logged into FileLogCRPDatabase, they are archived in text format. d. A copy of the data added to the CRPDatabase is made and placed in the Data
Dictionary.
MIGRATION,TRANSFER,ANDCONVERSION1. Migration and Transfer
a. For migration and transfer purposes FileLogTracking contains information concerning the location of the data file on the hard-drive or network, actions taken on the data file, number of records, date range, and in which database the converted data may be found. FileLogTracking makes it possible to track data from a parent tables to the original data file or vice versa in order to ensure that data have been faithfully transferred throughout the conversion process.
2. Conversion a. The acquisition of data from other parties frequently involves conversion from
spreadsheets, laboratory bench sheets, field notes, hard copies of historical data or other formats.
b. Conversions are performed by TRA staff or subcontractors. c. Data are converted from their original formats into the TCEQ event/result format and
moved into database tables to await quality assurance and quality control.
QUALITYASSURANCE/QUALITYCONTROL(QA/QC),DATAERRORS,ANDLOSS1. It is the policy of most or all WBPAs to check data post entry for inconsistencies by comparing
entered data to original hard copies (lab bench sheets, etc.). 2. In some cases, post entry electronic data conversion to the required format will be
accomplished via the use of subcontractors. In these cases, the responsibility of assuring that all conversions are accomplished faithfully will be with the subcontractor’s project manager. In other cases, data conversion is accomplished by the TRA Data Manager who is then responsible for assuring that the conversions were completed faithfully. This will be accomplished by checking converted data against original data on a 10% basis.
3. Once data have been entered in or converted to required format, they will be transmitted to the TRA Data Manager. This individual will then be responsible for verifying that data are in the appropriate format and, to the extent possible, free of errors. The data will then be copied into the quality assurance application.
4. After data have been entered into the quality assurance application, they are immediately and automatically subjected to a suite of queries which examine records for outliers, incorrect storet codes, missing data in required fields, tag numbers not present in both result and event tables and incorrect site IDs. Only records which do not have any of the above errors are flagged (by the application) as acceptable.
a. Data that have been found to contain errors will be flagged to await correction. 5. Only the TRA Project Manager, Data Manager, and QAO will enter data into EnviroData,
TRACRAD, and CRPDatabase. These individuals will be the only individuals outside of computer services who will have read/write privileges. All other users will have read only access, so as to avoid inadvertent deletions or alterations to data or underlying queries and macros.
6. A Data Review Checklist and Data Summary will be completed for each set of data that has been through QA/QC and prepared for submittal to TCEQ.
Trinity River Authority QAPP Page 139
7. Once the Data Review Checklist and Data Summary have been completed and erroneous data have been flagged, the data that have undergone and passed QA/QC will be flagged as acceptable.
8. Data that have been submitted to SWQMIS are logged into FileLogCRPDatabase and archived. a. Procedures for logging data into FileLogCRPDatabase and archival of final data are as
described previously. 9. Throughout QA/QC steps, the number of records is compared to those initially recorded in
FileLogTracking to confirm that no data has been lost. If data has been lost, it can be recovered from the archived original hardcopy or electronic data files.
10. Pertinent databases used for the conversion, QA/QC, and storage of data will be backed up as needed. In addition, the network drive that contains these databases are backed up on a regular basis by IT personnel.
INFORMATIONDISSEMINATIONPublic availability of data will be limited to completed, quality assured data. TCEQ’s data viewer is linked on the TRA CRP webpage for public access to data. Public data requests are generally fulfilled by spreadsheet and sent to the requesting party via email but format and transmission method will be determined on a case-by-case basis.
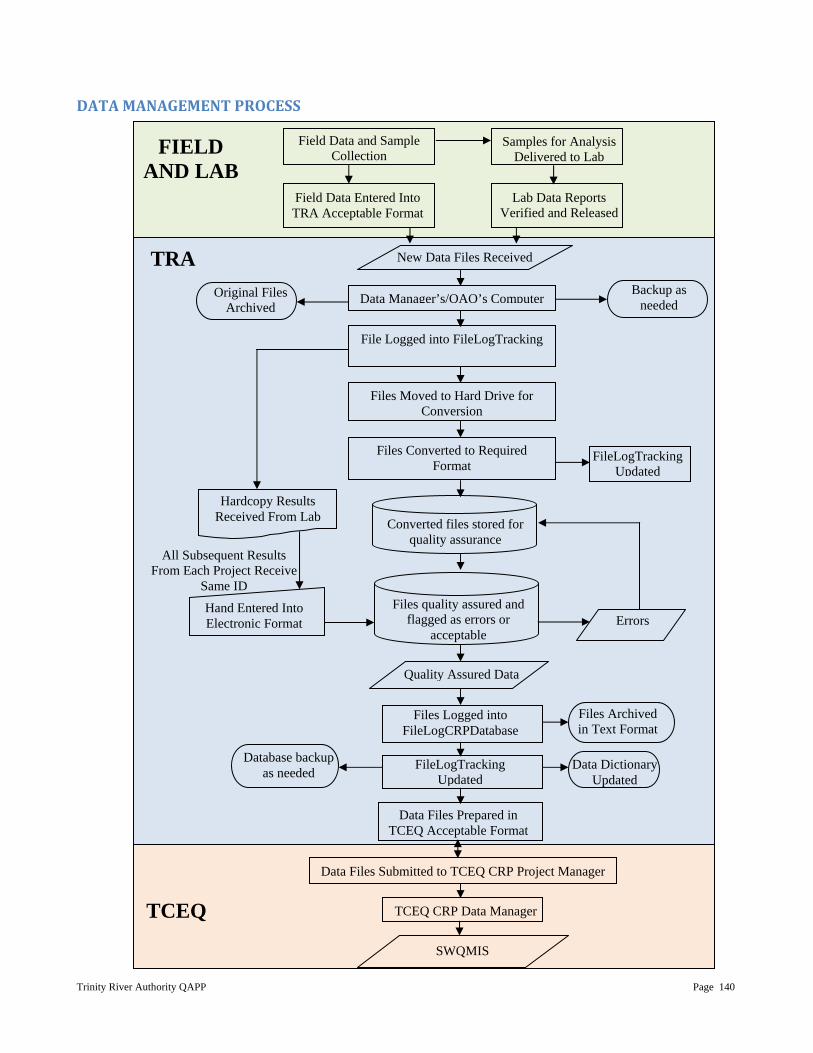
Trinity River Authority QAPP Page 140
DATAMANAGEMENTPROCESS
Converted files stored for quality assurance
Data Manager’s/QAO’s Computer
All Subsequent Results From Each Project Receive
Same ID
File Logged into FileLogTracking
Files Moved to Hard Drive for Conversion
Files Converted to Required Format
FileLogTracking Updated
Files quality assured and flagged as errors or
acceptable Errors
Hardcopy Results Received From Lab
Hand Entered Into Electronic Format
Quality Assured Data
Files Logged into FileLogCRPDatabase
FileLogTracking Updated
Files Archived in Text Format
Data Dictionary Updated
Data Files Prepared in TCEQ Acceptable Format
Database backup as needed
Original Files Archived
Backup as needed
New Data Files Received
Data Files Submitted to TCEQ CRP Project Manager
Field Data and Sample Collection
Samples for Analysis Delivered to Lab
Field Data Entered Into TRA Acceptable Format
Lab Data Reports Verified and Released
FIELD AND LAB
TRA
TCEQ TCEQ CRP Data Manager
SWQMIS