Embed Size (px)
Citation preview
Triode Vacuum Tube Laboratory Development
Noam D. Pikelny, Advisor: Steven ErredeDepartment of Physics, University of Illinois at Urbana-Champaign
1110 West Green Street, Urbana, IL 61801-3080, USA
I present a detailed description of laboratory experiments and apparatus designed to aid studentsin research and understanding of Dual Triode Vacuum Tubes. Students will utilize the newlaboratory setups in a new UIUC Physics Course 398 EMI, The Physics of Electronic MusicalInstruments.
WHY STUDY VACUUM TUBES
In the past, the vacuum tube was a commonhousehold item. Early televisions, radios, and calculatorsutilized vacuum tubes. However, the invention of thetransistor practically eliminated the use of vacuum tubes inalmost all applications. Despite the advantages of solid-statetechnology such as size, reliability and cost, the vacuumtube is still used today in high-end audio applications. Tubeamplifiers produce a wonderfully warm tone that has not yetbeen successfully emulated through digital technology. Thisis one of the several reasons of why it is important to studyvacuum tubes. It is obvious that a better understanding ofvacuum tubes is required to achieve the same sound withdigital signal processing. The accepted standard data andparameters for vacuum tubes were recorded almost a half-century ago, before the invention of a calculator. Therefore,using today’s computers to study the characteristics oftubes will yield a better understanding, and possibly moreaccurate parameters then those that have been widelyaccepted for years. Through this approach students will alsolearn how to use computer software and hardware for dataacquisition. Due to the dominance of transistors over tubesin society, vacuum tube technology is not always includedin today’s physicist/engineer’s curriculum. Studying tubeguitar amplifiers provides a more exciting way for studentsto learn tube theory than the standard textbook approach.
P398EMI: The Physics of Electronic MusicalInstruments
The vacuum tube is not the only interesting aspectof electric musical instruments. Physical phenomenainvolving electric guitar pickups, loudspeakers,transformers, effects boxes, guitar body resonances, andmore are all worthy of academic study. This long list ofinteresting topics to investigate motivated Professor SteveErrede to create a new physics course on the physics ofelectronic musical instruments. The course will be taught forthe first time this Fall 2000 semester at the University ofIllinois at Urbana-Champaign. Due to the fact that this willbe the first offering of the course, and that there are few
courses on Electronic Musical Instruments being taughtworldwide, much work and time is being spent deciding onissues such as the how to structure the course, and howmuch time is devoted to each topic. As a participant in NSFResearch for Undergraduates program I worked onpreparing laboratory experiments and apparatus for thecourse this fall. This included the following:
1. Designing and building hardware2. Configuring standard laboratory equipment3. Writing graphical software for data acquisition and
analysis.4. Writing student lab manuals with background
information, detailed instructions and sample results.
VACUUM TUBE OPERATION
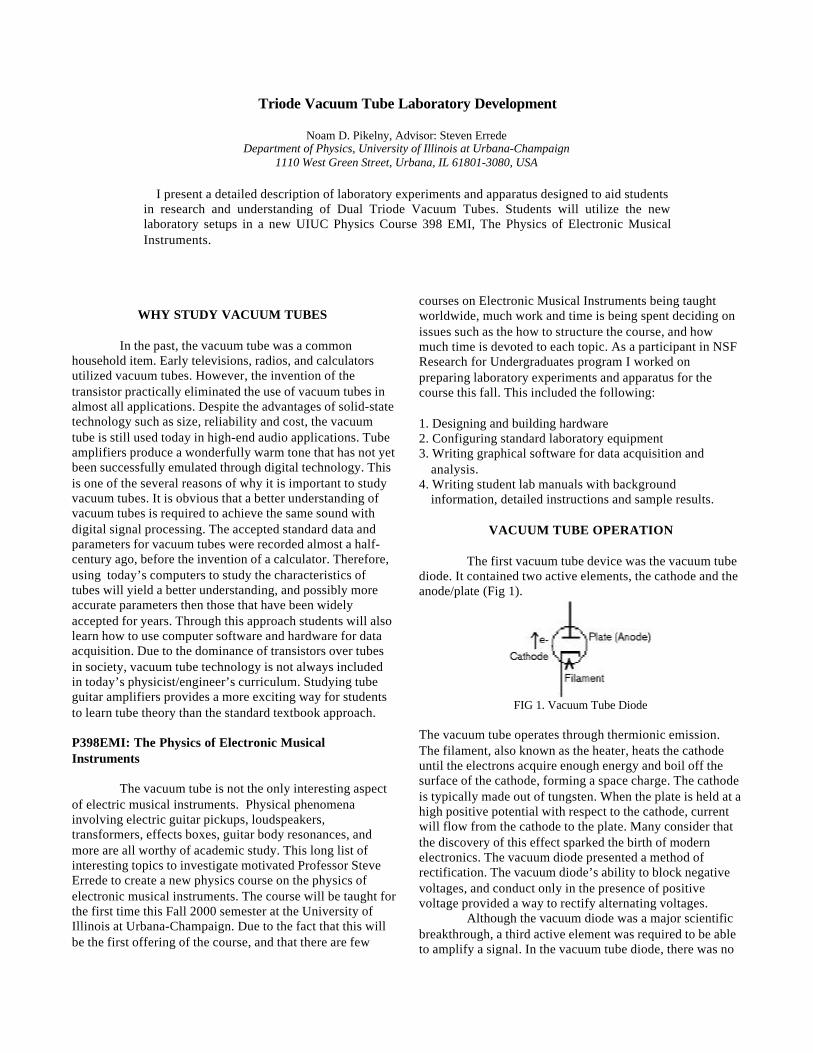
The first vacuum tube device was the vacuum tubediode. It contained two active elements, the cathode and theanode/plate (Fig 1).
FIG 1. Vacuum Tube Diode
The vacuum tube operates through thermionic emission.The filament, also known as the heater, heats the cathodeuntil the electrons acquire enough energy and boil off thesurface of the cathode, forming a space charge. The cathodeis typically made out of tungsten. When the plate is held at ahigh positive potential with respect to the cathode, currentwill flow from the cathode to the plate. Many consider thatthe discovery of this effect sparked the birth of modernelectronics. The vacuum diode presented a method ofrectification. The vacuum diode’s ability to block negativevoltages, and conduct only in the presence of positivevoltage provided a way to rectify alternating voltages.
Although the vacuum diode was a major scientificbreakthrough, a third active element was required to be ableto amplify a signal. In the vacuum tube diode, there was no
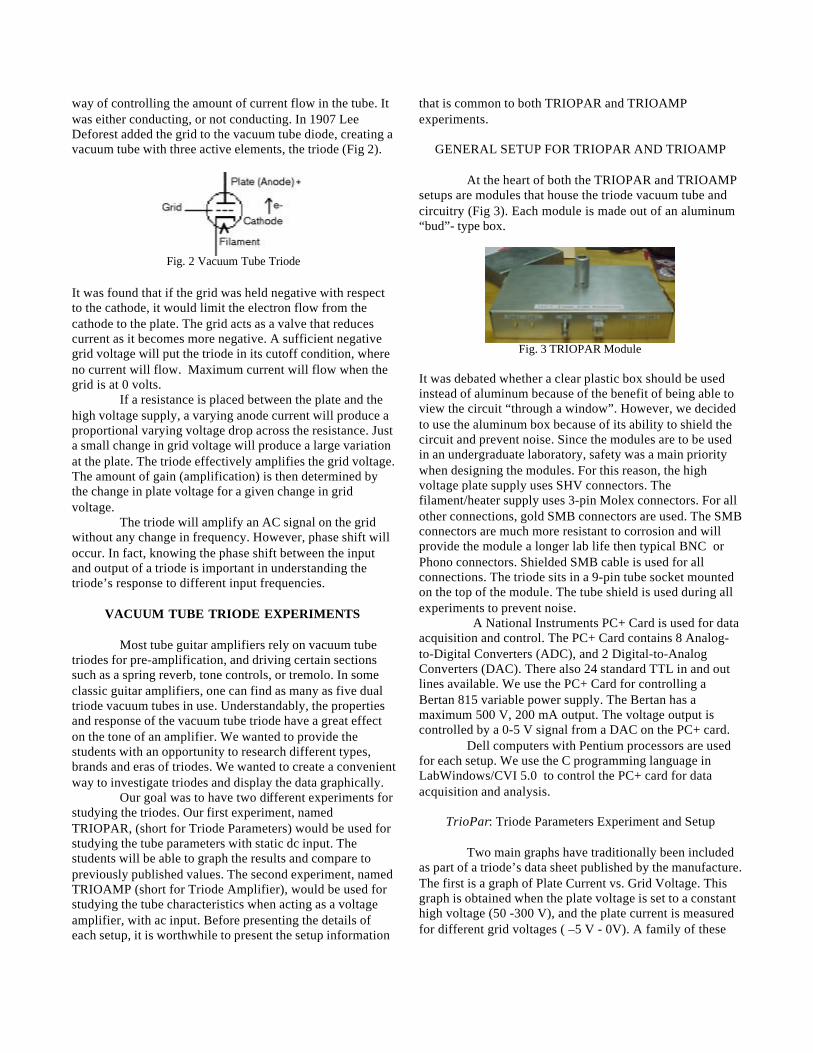
way of controlling the amount of current flow in the tube. Itwas either conducting, or not conducting. In 1907 LeeDeforest added the grid to the vacuum tube diode, creating avacuum tube with three active elements, the triode (Fig 2).
Fig. 2 Vacuum Tube Triode
It was found that if the grid was held negative with respectto the cathode, it would limit the electron flow from thecathode to the plate. The grid acts as a valve that reducescurrent as it becomes more negative. A sufficient negativegrid voltage will put the triode in its cutoff condition, whereno current will flow. Maximum current will flow when thegrid is at 0 volts.
If a resistance is placed between the plate and thehigh voltage supply, a varying anode current will produce aproportional varying voltage drop across the resistance. Justa small change in grid voltage will produce a large variationat the plate. The triode effectively amplifies the grid voltage.The amount of gain (amplification) is then determined bythe change in plate voltage for a given change in gridvoltage.
The triode will amplify an AC signal on the gridwithout any change in frequency. However, phase shift willoccur. In fact, knowing the phase shift between the inputand output of a triode is important in understanding thetriode’s response to different input frequencies.
VACUUM TUBE TRIODE EXPERIMENTS
Most tube guitar amplifiers rely on vacuum tubetriodes for pre-amplification, and driving certain sectionssuch as a spring reverb, tone controls, or tremolo. In someclassic guitar amplifiers, one can find as many as five dualtriode vacuum tubes in use. Understandably, the propertiesand response of the vacuum tube triode have a great effecton the tone of an amplifier. We wanted to provide thestudents with an opportunity to research different types,brands and eras of triodes. We wanted to create a convenientway to investigate triodes and display the data graphically.
Our goal was to have two different experiments forstudying the triodes. Our first experiment, namedTRIOPAR, (short for Triode Parameters) would be used forstudying the tube parameters with static dc input. Thestudents will be able to graph the results and compare topreviously published values. The second experiment, namedTRIOAMP (short for Triode Amplifier), would be used forstudying the tube characteristics when acting as a voltageamplifier, with ac input. Before presenting the details ofeach setup, it is worthwhile to present the setup information
that is common to both TRIOPAR and TRIOAMPexperiments.
GENERAL SETUP FOR TRIOPAR AND TRIOAMP
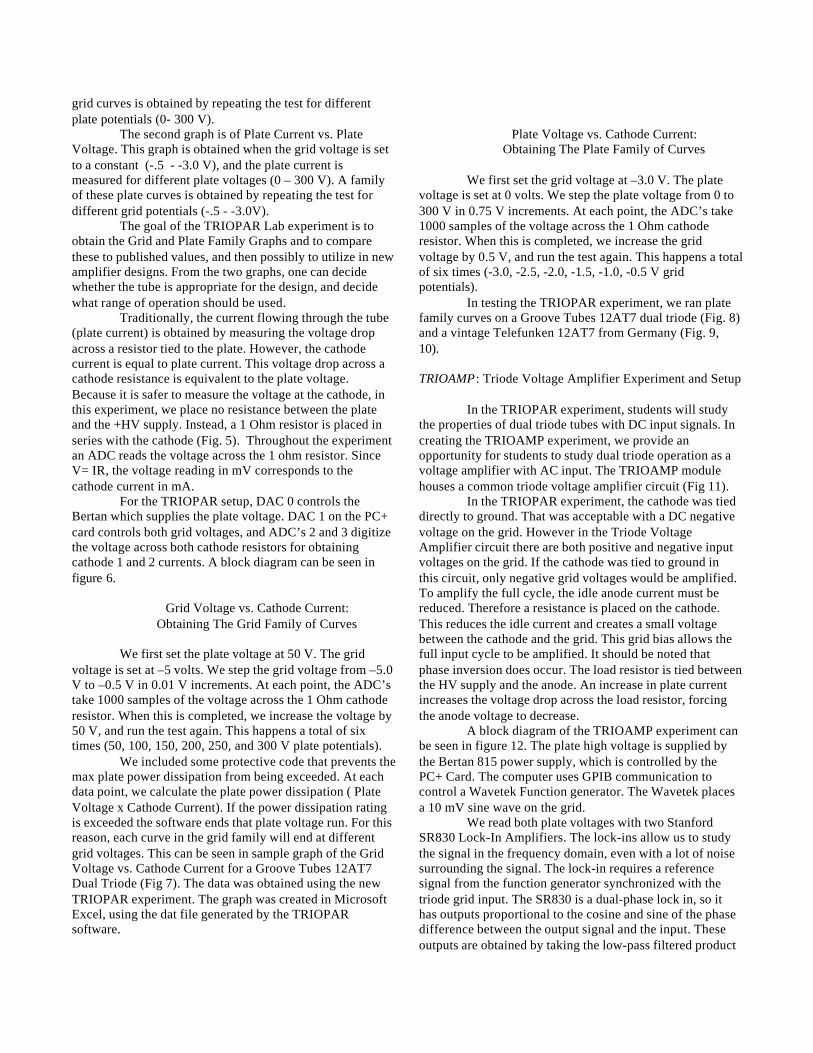
At the heart of both the TRIOPAR and TRIOAMPsetups are modules that house the triode vacuum tube andcircuitry (Fig 3). Each module is made out of an aluminum“bud”- type box.
Fig. 3 TRIOPAR Module
It was debated whether a clear plastic box should be usedinstead of aluminum because of the benefit of being able toview the circuit “through a window”. However, we decidedto use the aluminum box because of its ability to shield thecircuit and prevent noise. Since the modules are to be usedin an undergraduate laboratory, safety was a main prioritywhen designing the modules. For this reason, the highvoltage plate supply uses SHV connectors. Thefilament/heater supply uses 3-pin Molex connectors. For allother connections, gold SMB connectors are used. The SMBconnectors are much more resistant to corrosion and willprovide the module a longer lab life then typical BNC orPhono connectors. Shielded SMB cable is used for allconnections. The triode sits in a 9-pin tube socket mountedon the top of the module. The tube shield is used during allexperiments to prevent noise.
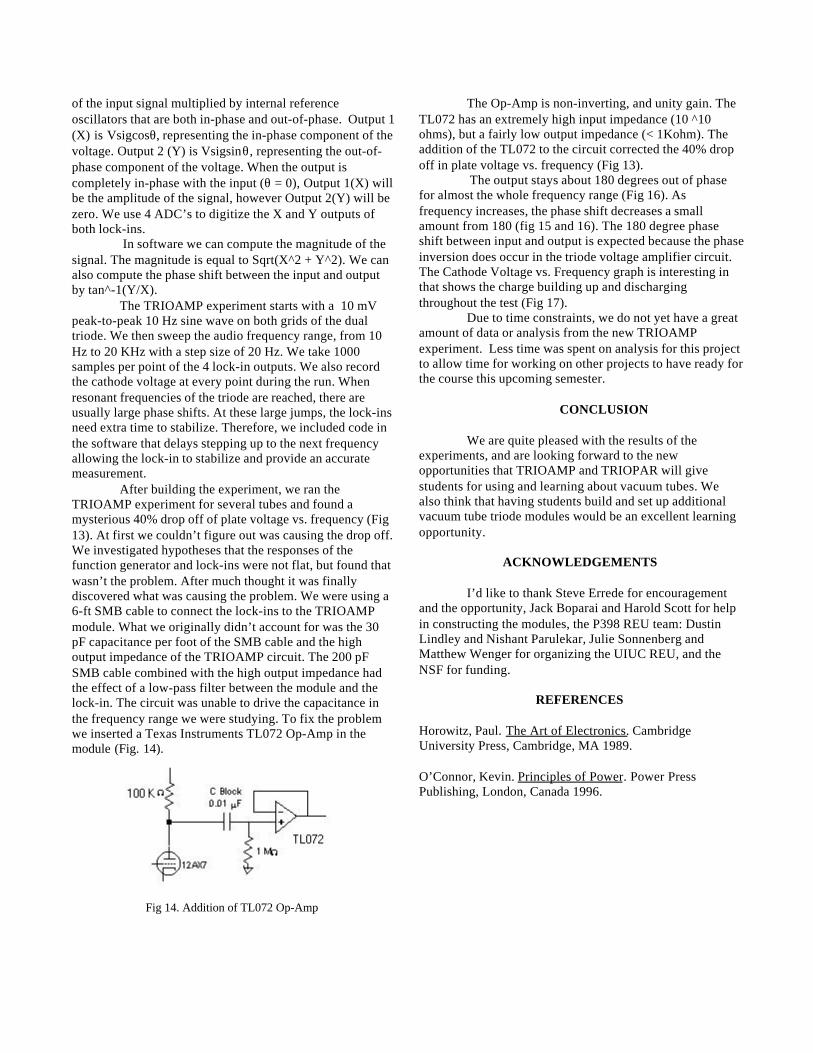
A National Instruments PC+ Card is used for dataacquisition and control. The PC+ Card contains 8 Analog-to-Digital Converters (ADC), and 2 Digital-to-AnalogConverters (DAC). There also 24 standard TTL in and outlines available. We use the PC+ Card for controlling aBertan 815 variable power supply. The Bertan has amaximum 500 V, 200 mA output. The voltage output iscontrolled by a 0-5 V signal from a DAC on the PC+ card.
Dell computers with Pentium processors are usedfor each setup. We use the C programming language inLabWindows/CVI 5.0 to control the PC+ card for dataacquisition and analysis.
TrioPar: Triode Parameters Experiment and Setup
Two main graphs have traditionally been includedas part of a triode’s data sheet published by the manufacture.The first is a graph of Plate Current vs. Grid Voltage. Thisgraph is obtained when the plate voltage is set to a constanthigh voltage (50 -300 V), and the plate current is measuredfor different grid voltages ( –5 V - 0V). A family of these
grid curves is obtained by repeating the test for differentplate potentials (0- 300 V).
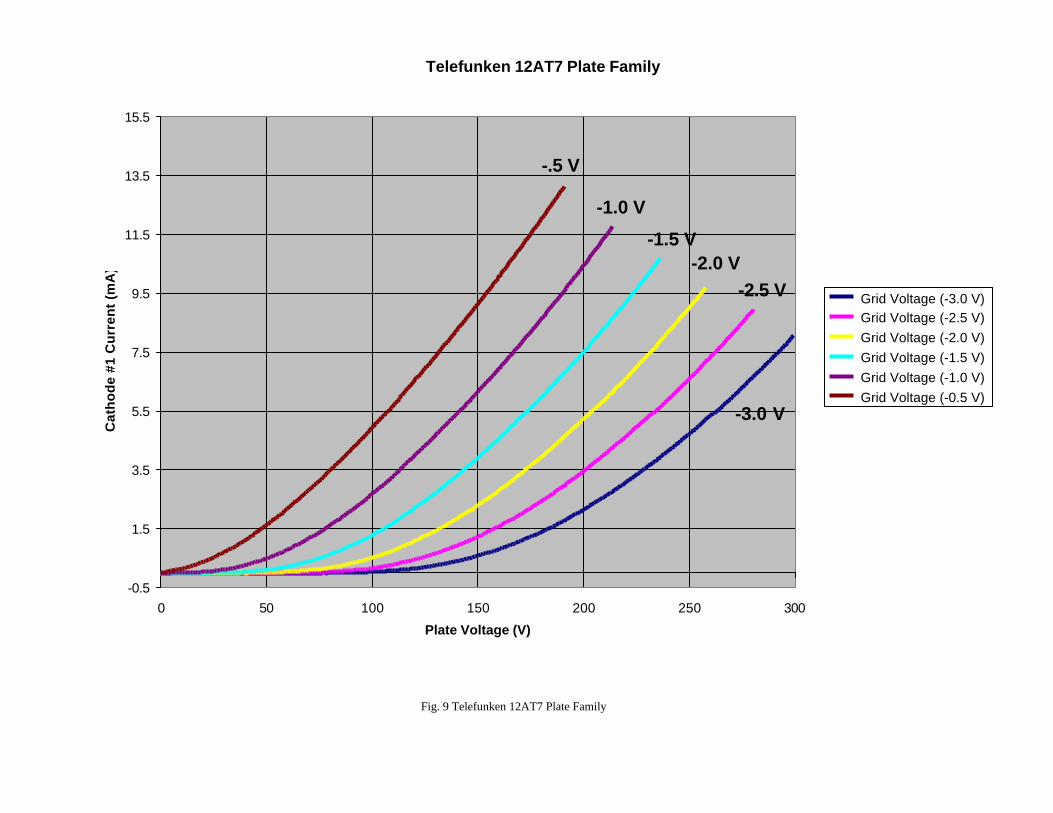
The second graph is of Plate Current vs. PlateVoltage. This graph is obtained when the grid voltage is setto a constant (-.5 - -3.0 V), and the plate current ismeasured for different plate voltages (0 – 300 V). A familyof these plate curves is obtained by repeating the test fordifferent grid potentials (-.5 - -3.0V).
The goal of the TRIOPAR Lab experiment is toobtain the Grid and Plate Family Graphs and to comparethese to published values, and then possibly to utilize in newamplifier designs. From the two graphs, one can decidewhether the tube is appropriate for the design, and decidewhat range of operation should be used.
Traditionally, the current flowing through the tube(plate current) is obtained by measuring the voltage dropacross a resistor tied to the plate. However, the cathodecurrent is equal to plate current. This voltage drop across acathode resistance is equivalent to the plate voltage.Because it is safer to measure the voltage at the cathode, inthis experiment, we place no resistance between the plateand the +HV supply. Instead, a 1 Ohm resistor is placed inseries with the cathode (Fig. 5). Throughout the experimentan ADC reads the voltage across the 1 ohm resistor. SinceV= IR, the voltage reading in mV corresponds to thecathode current in mA.
For the TRIOPAR setup, DAC 0 controls theBertan which supplies the plate voltage. DAC 1 on the PC+card controls both grid voltages, and ADC’s 2 and 3 digitizethe voltage across both cathode resistors for obtainingcathode 1 and 2 currents. A block diagram can be seen infigure 6.
Grid Voltage vs. Cathode Current:Obtaining The Grid Family of Curves
We first set the plate voltage at 50 V. The gridvoltage is set at –5 volts. We step the grid voltage from –5.0V to –0.5 V in 0.01 V increments. At each point, the ADC’stake 1000 samples of the voltage across the 1 Ohm cathoderesistor. When this is completed, we increase the voltage by50 V, and run the test again. This happens a total of sixtimes (50, 100, 150, 200, 250, and 300 V plate potentials).
We included some protective code that prevents themax plate power dissipation from being exceeded. At eachdata point, we calculate the plate power dissipation ( PlateVoltage x Cathode Current). If the power dissipation ratingis exceeded the software ends that plate voltage run. For thisreason, each curve in the grid family will end at differentgrid voltages. This can be seen in sample graph of the GridVoltage vs. Cathode Current for a Groove Tubes 12AT7Dual Triode (Fig 7). The data was obtained using the newTRIOPAR experiment. The graph was created in MicrosoftExcel, using the dat file generated by the TRIOPARsoftware.
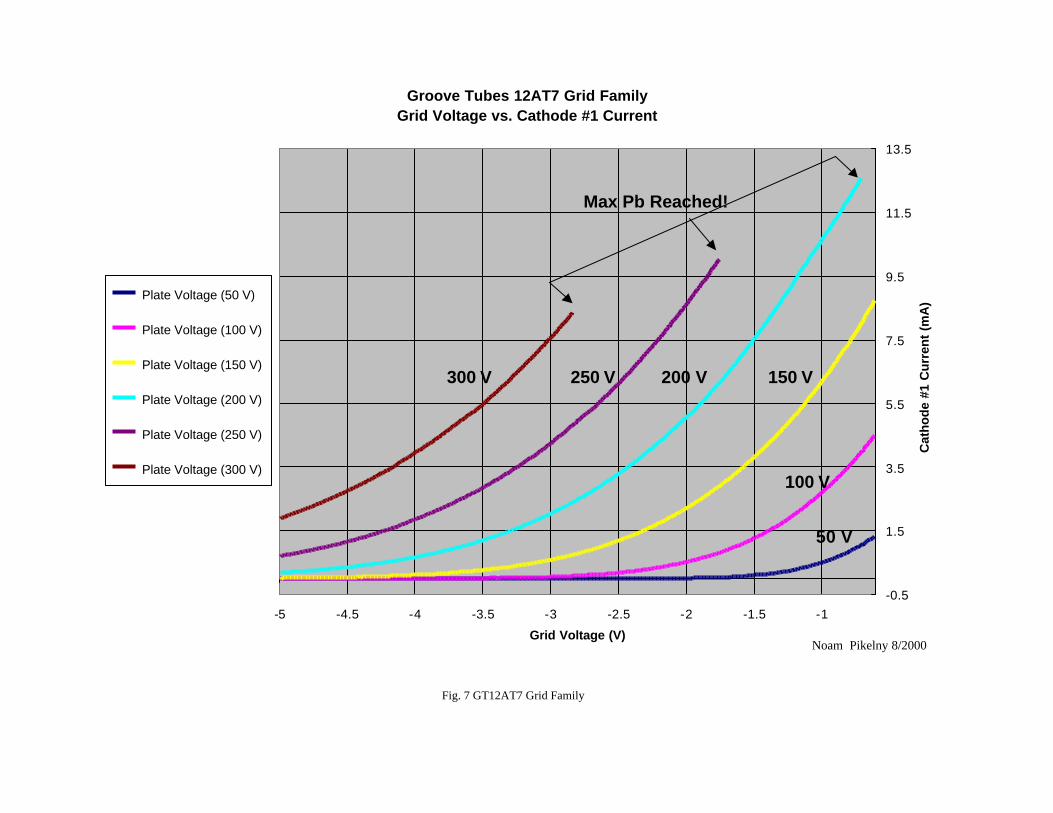
Plate Voltage vs. Cathode Current:Obtaining The Plate Family of Curves
We first set the grid voltage at –3.0 V. The platevoltage is set at 0 volts. We step the plate voltage from 0 to300 V in 0.75 V increments. At each point, the ADC’s take1000 samples of the voltage across the 1 Ohm cathoderesistor. When this is completed, we increase the gridvoltage by 0.5 V, and run the test again. This happens a totalof six times (-3.0, -2.5, -2.0, -1.5, -1.0, -0.5 V gridpotentials).
In testing the TRIOPAR experiment, we ran platefamily curves on a Groove Tubes 12AT7 dual triode (Fig. 8)and a vintage Telefunken 12AT7 from Germany (Fig. 9,10).
TRIOAMP: Triode Voltage Amplifier Experiment and Setup
In the TRIOPAR experiment, students will studythe properties of dual triode tubes with DC input signals. Increating the TRIOAMP experiment, we provide anopportunity for students to study dual triode operation as avoltage amplifier with AC input. The TRIOAMP modulehouses a common triode voltage amplifier circuit (Fig 11).
In the TRIOPAR experiment, the cathode was tieddirectly to ground. That was acceptable with a DC negativevoltage on the grid. However in the Triode VoltageAmplifier circuit there are both positive and negative inputvoltages on the grid. If the cathode was tied to ground inthis circuit, only negative grid voltages would be amplified.To amplify the full cycle, the idle anode current must bereduced. Therefore a resistance is placed on the cathode.This reduces the idle current and creates a small voltagebetween the cathode and the grid. This grid bias allows thefull input cycle to be amplified. It should be noted thatphase inversion does occur. The load resistor is tied betweenthe HV supply and the anode. An increase in plate currentincreases the voltage drop across the load resistor, forcingthe anode voltage to decrease.
A block diagram of the TRIOAMP experiment canbe seen in figure 12. The plate high voltage is supplied bythe Bertan 815 power supply, which is controlled by thePC+ Card. The computer uses GPIB communication tocontrol a Wavetek Function generator. The Wavetek placesa 10 mV sine wave on the grid.
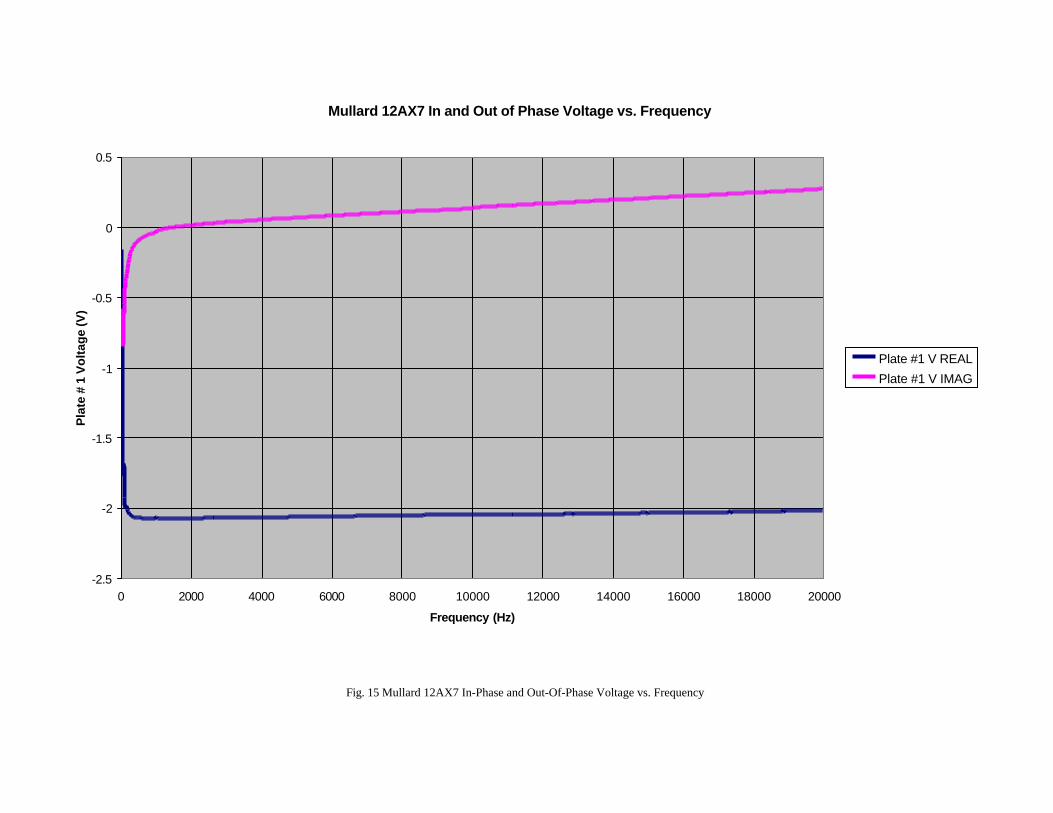
We read both plate voltages with two StanfordSR830 Lock-In Amplifiers. The lock-ins allow us to studythe signal in the frequency domain, even with a lot of noisesurrounding the signal. The lock-in requires a referencesignal from the function generator synchronized with thetriode grid input. The SR830 is a dual-phase lock in, so ithas outputs proportional to the cosine and sine of the phasedifference between the output signal and the input. Theseoutputs are obtained by taking the low-pass filtered product
of the input signal multiplied by internal referenceoscillators that are both in-phase and out-of-phase. Output 1(X) is Vsigcosθ, representing the in-phase component of thevoltage. Output 2 (Y) is Vsigsinθ, representing the out-of-phase component of the voltage. When the output iscompletely in-phase with the input (θ = 0), Output 1(X) willbe the amplitude of the signal, however Output 2(Y) will bezero. We use 4 ADC’s to digitize the X and Y outputs ofboth lock-ins.
In software we can compute the magnitude of thesignal. The magnitude is equal to Sqrt(X^2 + Y^2). We canalso compute the phase shift between the input and outputby tan^-1(Y/X).
The TRIOAMP experiment starts with a 10 mVpeak-to-peak 10 Hz sine wave on both grids of the dualtriode. We then sweep the audio frequency range, from 10Hz to 20 KHz with a step size of 20 Hz. We take 1000samples per point of the 4 lock-in outputs. We also recordthe cathode voltage at every point during the run. Whenresonant frequencies of the triode are reached, there areusually large phase shifts. At these large jumps, the lock-insneed extra time to stabilize. Therefore, we included code inthe software that delays stepping up to the next frequencyallowing the lock-in to stabilize and provide an accuratemeasurement.
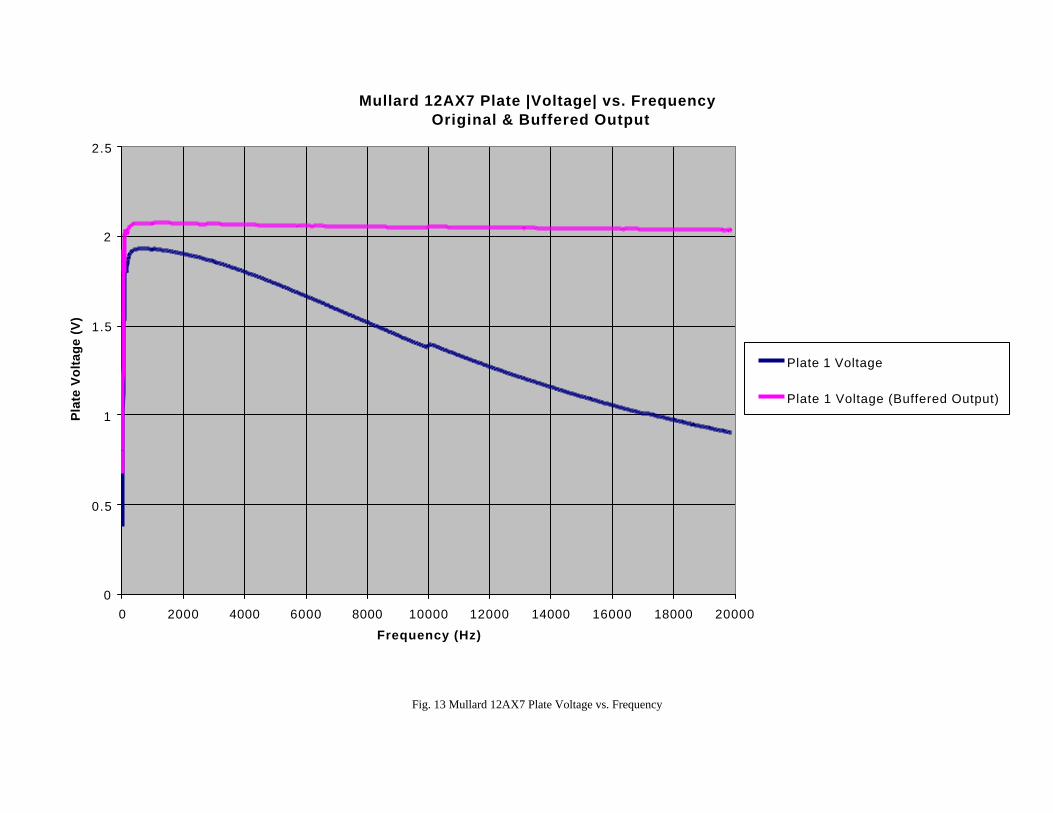
After building the experiment, we ran theTRIOAMP experiment for several tubes and found amysterious 40% drop off of plate voltage vs. frequency (Fig13). At first we couldn’t figure out was causing the drop off.We investigated hypotheses that the responses of thefunction generator and lock-ins were not flat, but found thatwasn’t the problem. After much thought it was finallydiscovered what was causing the problem. We were using a6-ft SMB cable to connect the lock-ins to the TRIOAMPmodule. What we originally didn’t account for was the 30pF capacitance per foot of the SMB cable and the highoutput impedance of the TRIOAMP circuit. The 200 pFSMB cable combined with the high output impedance hadthe effect of a low-pass filter between the module and thelock-in. The circuit was unable to drive the capacitance inthe frequency range we were studying. To fix the problemwe inserted a Texas Instruments TL072 Op-Amp in themodule (Fig. 14).
Fig 14. Addition of TL072 Op-Amp
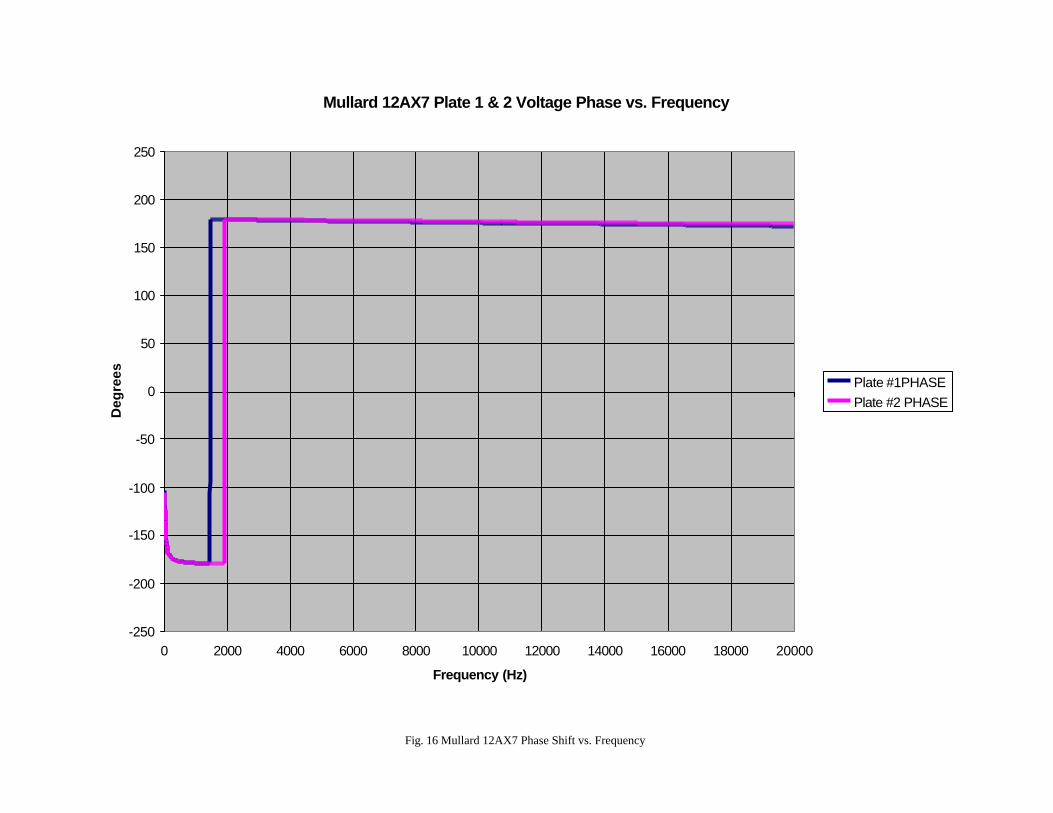
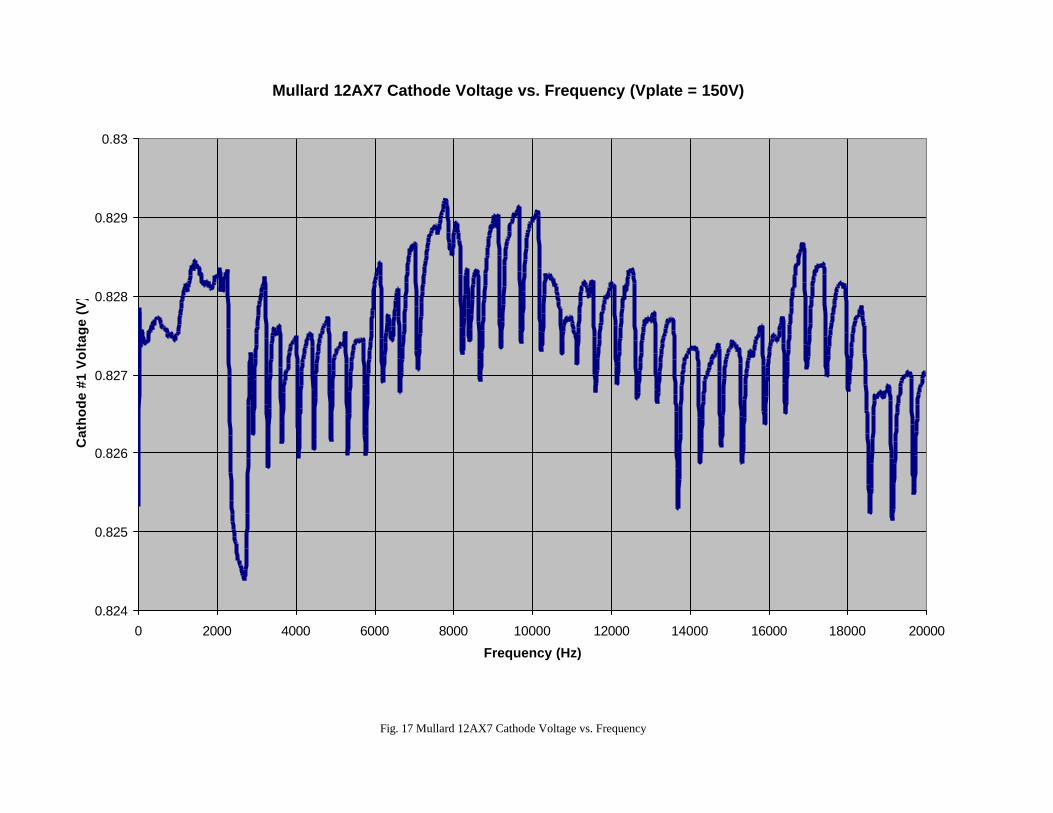
The Op-Amp is non-inverting, and unity gain. TheTL072 has an extremely high input impedance (10 ^10ohms), but a fairly low output impedance (< 1Kohm). Theaddition of the TL072 to the circuit corrected the 40% dropoff in plate voltage vs. frequency (Fig 13). The output stays about 180 degrees out of phasefor almost the whole frequency range (Fig 16). Asfrequency increases, the phase shift decreases a smallamount from 180 (fig 15 and 16). The 180 degree phaseshift between input and output is expected because the phaseinversion does occur in the triode voltage amplifier circuit.The Cathode Voltage vs. Frequency graph is interesting inthat shows the charge building up and dischargingthroughout the test (Fig 17).
Due to time constraints, we do not yet have a greatamount of data or analysis from the new TRIOAMPexperiment. Less time was spent on analysis for this projectto allow time for working on other projects to have ready forthe course this upcoming semester.
CONCLUSION
We are quite pleased with the results of theexperiments, and are looking forward to the newopportunities that TRIOAMP and TRIOPAR will givestudents for using and learning about vacuum tubes. Wealso think that having students build and set up additionalvacuum tube triode modules would be an excellent learningopportunity.
ACKNOWLEDGEMENTS
I’d like to thank Steve Errede for encouragementand the opportunity, Jack Boparai and Harold Scott for helpin constructing the modules, the P398 REU team: DustinLindley and Nishant Parulekar, Julie Sonnenberg andMatthew Wenger for organizing the UIUC REU, and theNSF for funding.
REFERENCES
Horowitz, Paul. The Art of Electronics. CambridgeUniversity Press, Cambridge, MA 1989.
O’Connor, Kevin. Principles of Power. Power PressPublishing, London, Canada 1996.
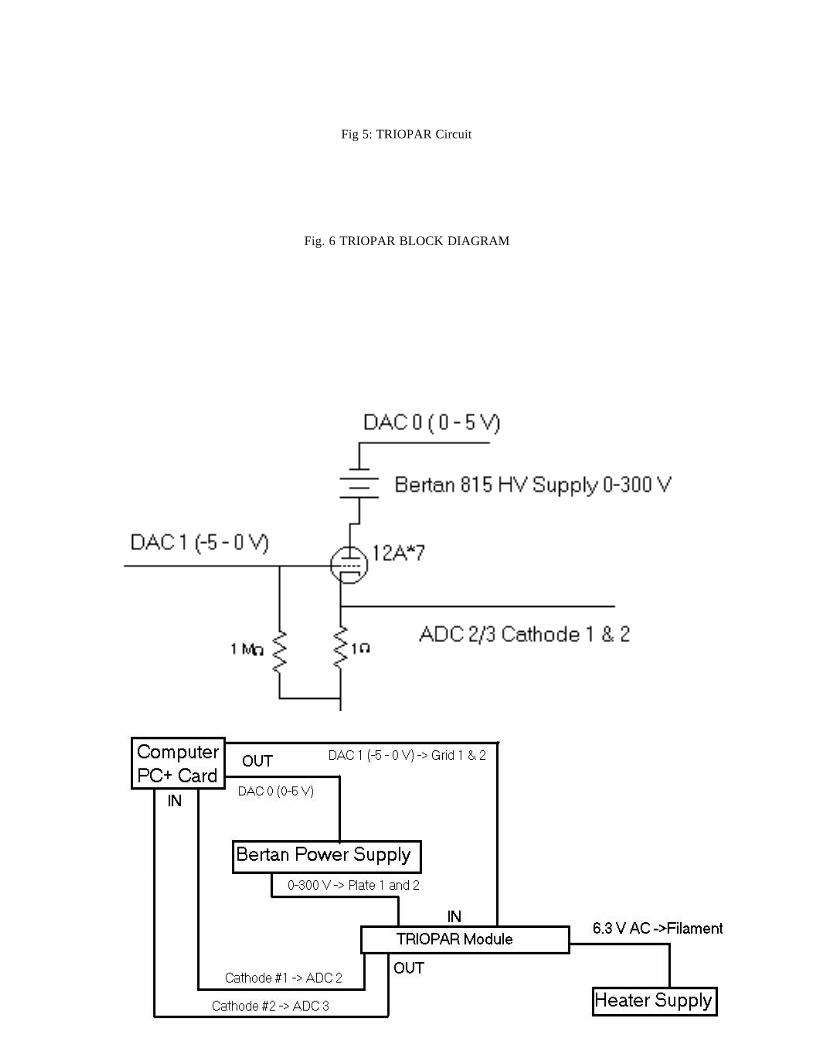
Fig 5: TRIOPAR Circuit
Fig. 6 TRIOPAR BLOCK DIAGRAM
Groove Tubes 12AT7 Grid Family Grid Voltage vs. Cathode #1 Current
-0.5
1.5
3.5
5.5
7.5
9.5
11.5
13.5
-5 -4.5 -4 -3.5 -3 -2.5 -2 -1.5 -1
Grid Voltage (V)
Cat
ho
de
#1 C
urr
ent
(mA
) Plate Voltage (50 V)
Plate Voltage (100 V)
Plate Voltage (150 V)
Plate Voltage (200 V)
Plate Voltage (250 V)
Plate Voltage (300 V)
150 V250 V300 V
100 V
200 V
50 V
Max Pb Reached!
Noam Pikelny 8/2000
Fig. 7 GT12AT7 Grid Family
Groove Tubes 12AT7 Plate FamilyPlate Voltage vs. Cathode #1 Current
-0.5
1.5
3.5
5.5
7.5
9.5
11.5
13.5
0 50 100 150 200 250 300
Plate Voltage (V)
Cat
ho
de
#1 C
urr
ent
(mA
)
Grid Voltage (-3.0 V) Grid Voltage (-2.5 V) Grid Voltage (-2.0 V) Grid Voltage (-1.5 V) Grid Voltage (-1.0 V) Grid Voltage (-0.5 V)
-.5 V-1.0 V
-3.0 V
-2.5 V
-2.0 V
-1.5 V
Fig. 8 GT12AT7 Plate Family
Telefunken 12AT7 Plate Family
-0.5
1.5
3.5
5.5
7.5
9.5
11.5
13.5
15.5
0 50 100 150 200 250 300
Plate Voltage (V)
Cat
ho
de
#1 C
urr
ent
(mA
)
Grid Voltage (-3.0 V) Grid Voltage (-2.5 V) Grid Voltage (-2.0 V) Grid Voltage (-1.5 V) Grid Voltage (-1.0 V) Grid Voltage (-0.5 V)
-.5 V
-2.5 V
-1.5 V
-1.0 V
-2.0 V
-3.0 V
Fig. 9 Telefunken 12AT7 Plate Family
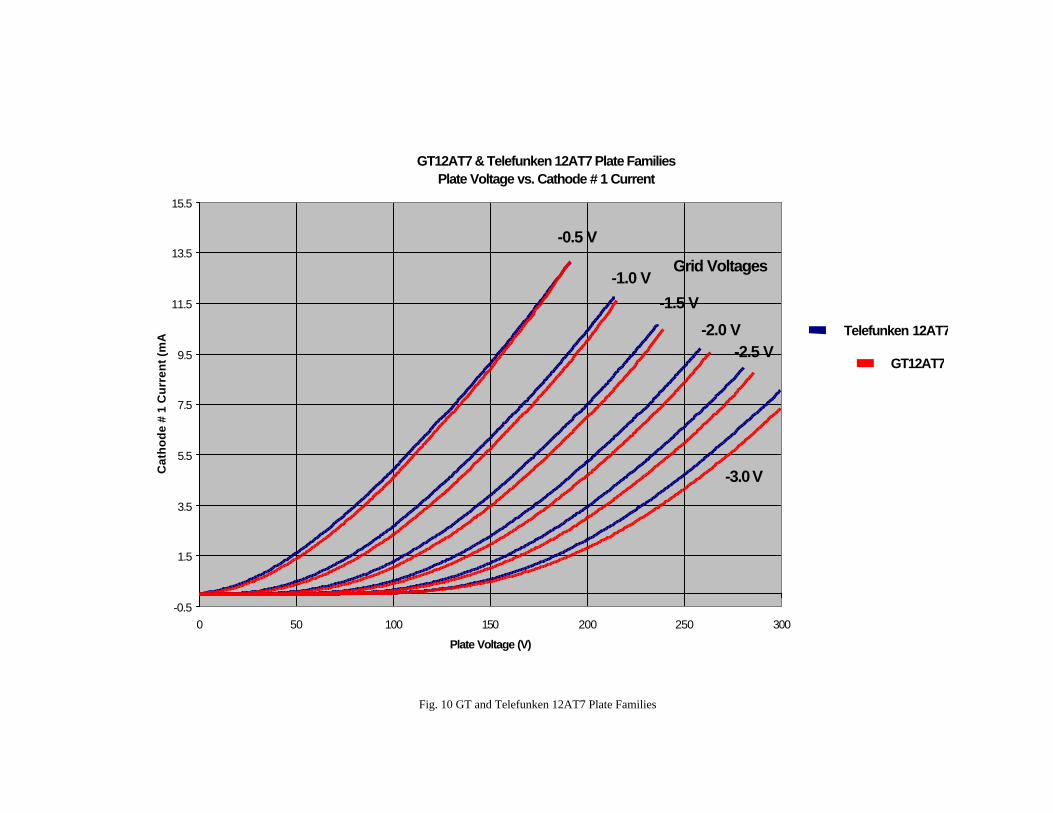
Fig. 10 GT and Telefunken 12AT7 Plate Families
GT12AT7 & Telefunken 12AT7 Plate FamiliesPlate Voltage vs. Cathode # 1 Current
-0.5
1.5
3.5
5.5
7.5
9.5
11.5
13.5
15.5
0 50 100 150 200 250 300
Plate Voltage (V)
Cat
ho
de
# 1
Cu
rren
t (m
A) Telefunken 12AT7
GT12AT7-2.5 V
-2.0 V
-1.5 V
-1.0 V
-0.5 V
-3.0 V
Grid Voltages
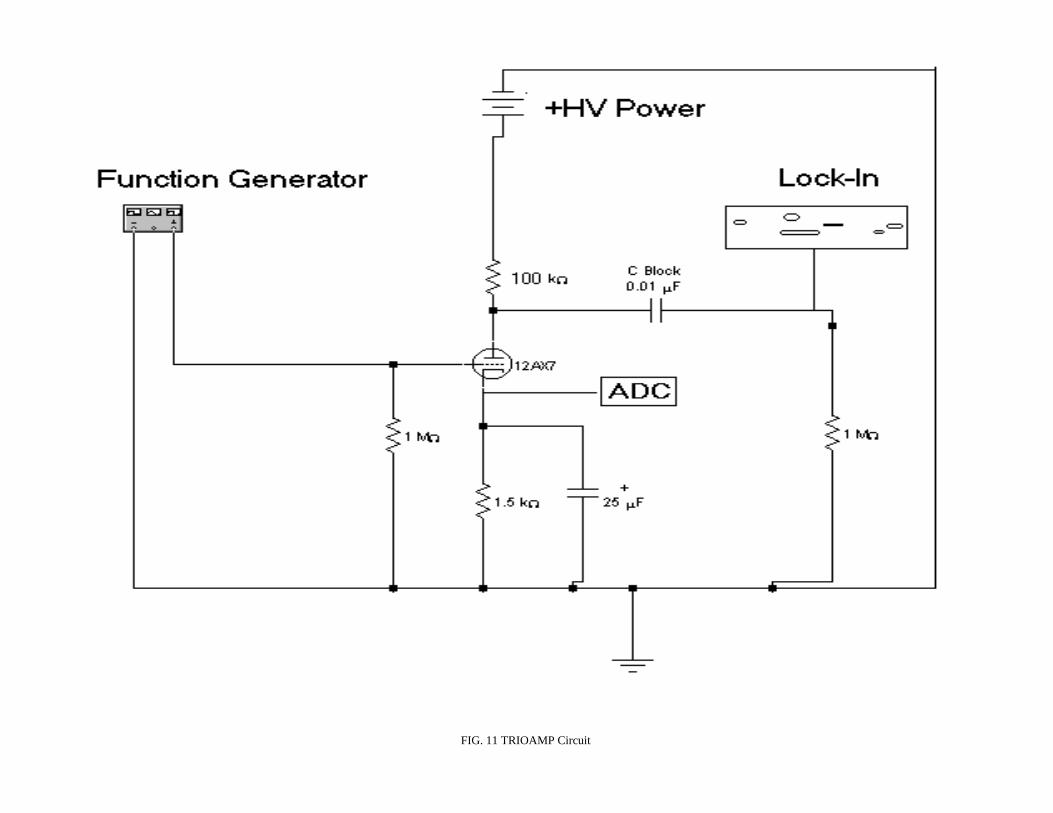
FIG. 11 TRIOAMP Circuit
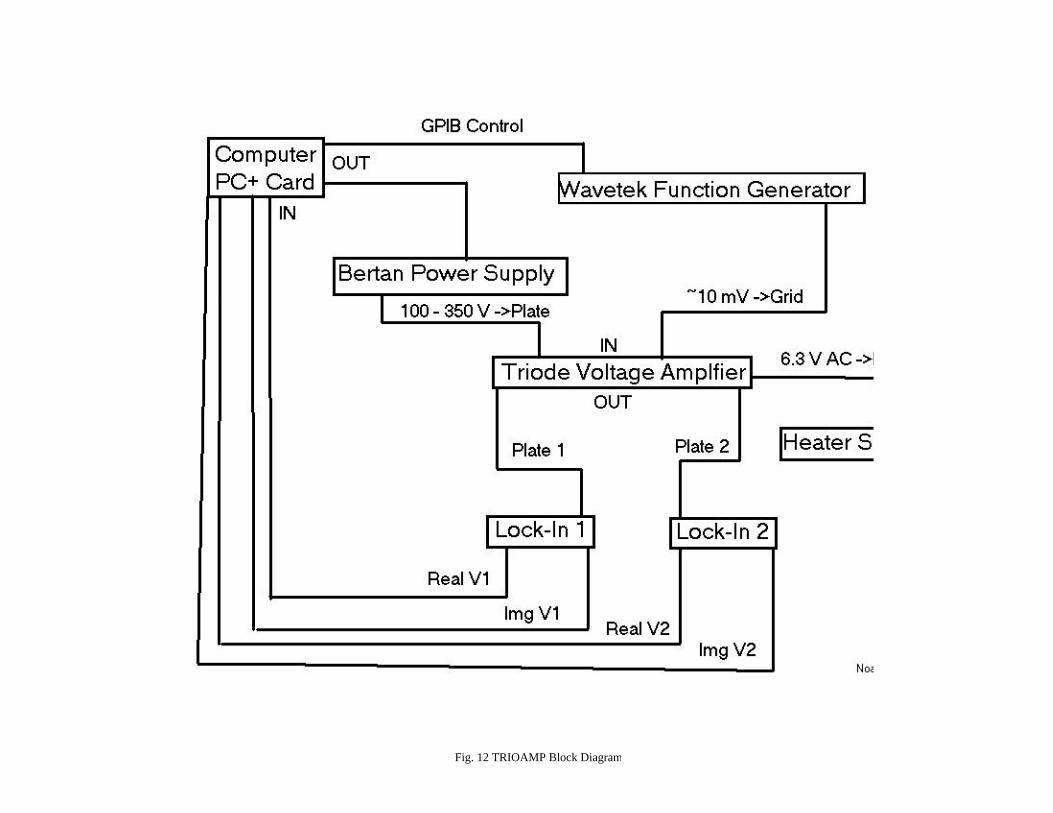
Fig. 12 TRIOAMP Block Diagram
Mullard 12AX7 Plate |Voltage| vs. Frequency Original & Buffered Output
0
0.5
1
1.5
2
2.5
0 2000 4000 6000 8000 10000 12000 14000 16000 18000 20000
Frequency (Hz)
Pla
te V
olt
age
(V)
Plate 1 Voltage
Plate 1 Voltage (Buffered Output)
Fig. 13 Mullard 12AX7 Plate Voltage vs. Frequency
Mullard 12AX7 In and Out of Phase Voltage vs. Frequency
-2.5
-2
-1.5
-1
-0.5
0
0.5
0 2000 4000 6000 8000 10000 12000 14000 16000 18000 20000
Frequency (Hz)
Pla
te #
1 V
olt
age
(V)
Plate #1 V REAL
Plate #1 V IMAG
Fig. 15 Mullard 12AX7 In-Phase and Out-Of-Phase Voltage vs. Frequency
Mullard 12AX7 Plate 1 & 2 Voltage Phase vs. Frequency
-250
-200
-150
-100
-50
0
50
100
150
200
250
0 2000 4000 6000 8000 10000 12000 14000 16000 18000 20000
Frequency (Hz)
Deg
rees
Plate #1PHASEPlate #2 PHASE
Fig. 16 Mullard 12AX7 Phase Shift vs. Frequency
Mullard 12AX7 Cathode Voltage vs. Frequency (Vplate = 150V)
0.824
0.825
0.826
0.827
0.828
0.829
0.83
0 2000 4000 6000 8000 10000 12000 14000 16000 18000 20000
Frequency (Hz)
Cat
ho
de
#1 V
olt
age
(V)
Fig. 17 Mullard 12AX7 Cathode Voltage vs. Frequency