Embed Size (px)
Citation preview
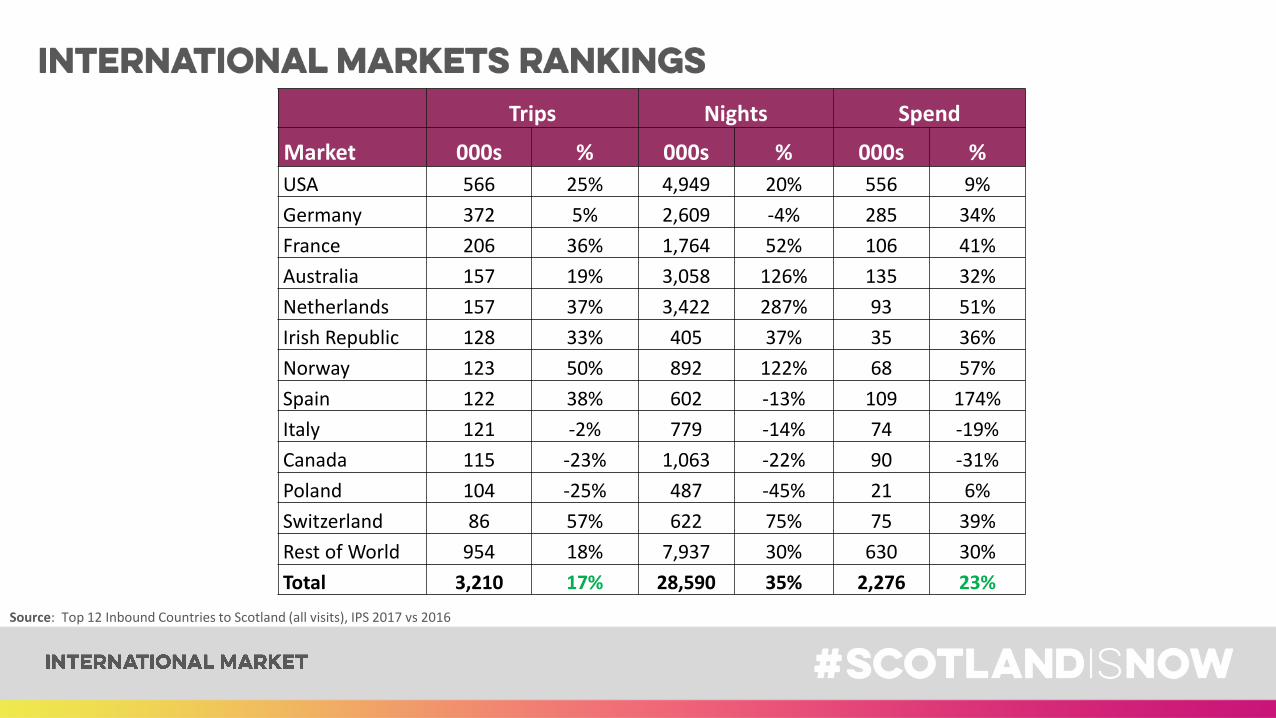
Trips Nights Spend
Market 000s % 000s % 000s %
USA 566 25% 4,949 20% 556 9%
Germany 372 5% 2,609 -4% 285 34%
France 206 36% 1,764 52% 106 41%
Australia 157 19% 3,058 126% 135 32%
Netherlands 157 37% 3,422 287% 93 51%
Irish Republic 128 33% 405 37% 35 36%
Norway 123 50% 892 122% 68 57%
Spain 122 38% 602 -13% 109 174%
Italy 121 -2% 779 -14% 74 -19%
Canada 115 -23% 1,063 -22% 90 -31%
Poland 104 -25% 487 -45% 21 6%
Switzerland 86 57% 622 75% 75 39%
Rest of World 954 18% 7,937 30% 630 30%
Total 3,210 17% 28,590 35% 2,276 23%
Source: Top 12 Inbound Countries to Scotland (all visits), IPS 2017 vs 2016
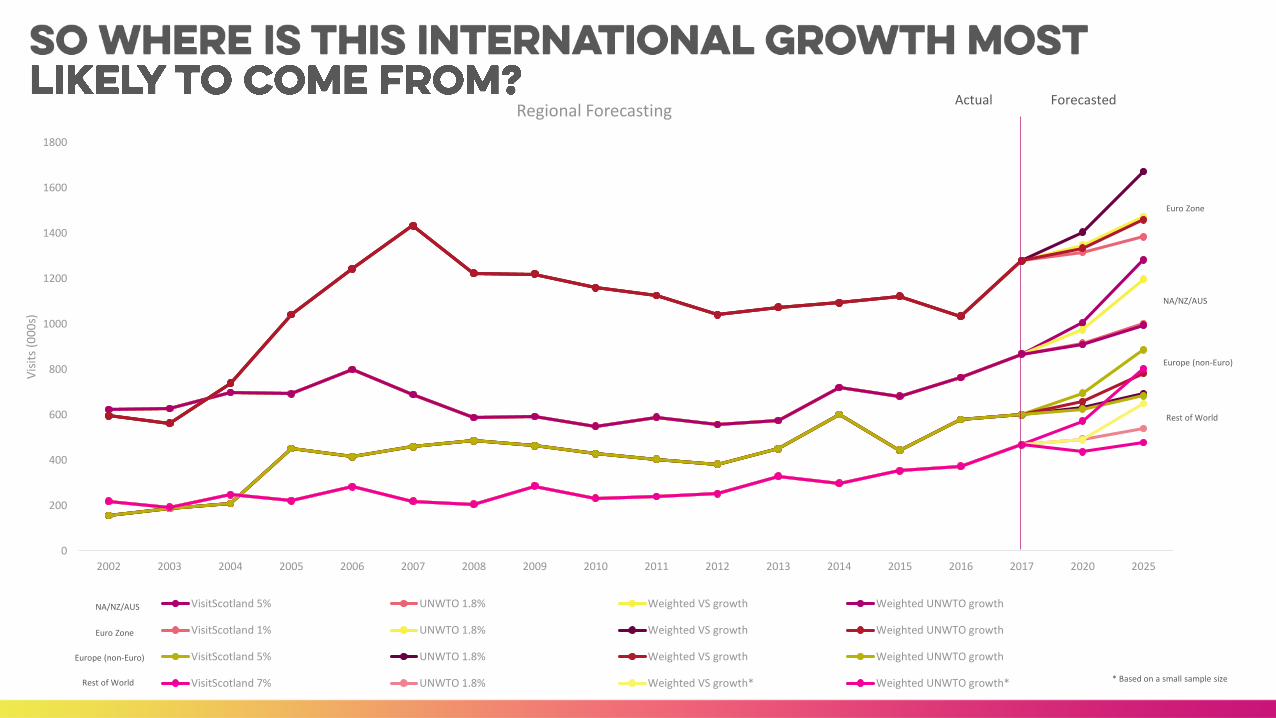
0
200
400
600
800
1000
1200
1400
1600
1800
2002 2003 2004 2005 2006 2007 2008 2009 2010 2011 2012 2013 2014 2015 2016 2017 2020 2025
Vis
its
(00
0s)
Regional Forecasting
VisitScotland 5% UNWTO 1.8% Weighted VS growth Weighted UNWTO growth
VisitScotland 1% UNWTO 1.8% Weighted VS growth Weighted UNWTO growth
VisitScotland 5% UNWTO 1.8% Weighted VS growth Weighted UNWTO growth
VisitScotland 7% UNWTO 1.8% Weighted VS growth* Weighted UNWTO growth*
NA/NZ/AUS
Euro Zone
Europe (non-Euro)
Rest of World
NA/NZ/AUS
Euro Zone
Europe (non-Euro)
Rest of World
* Based on a small sample size
Actual Forecasted
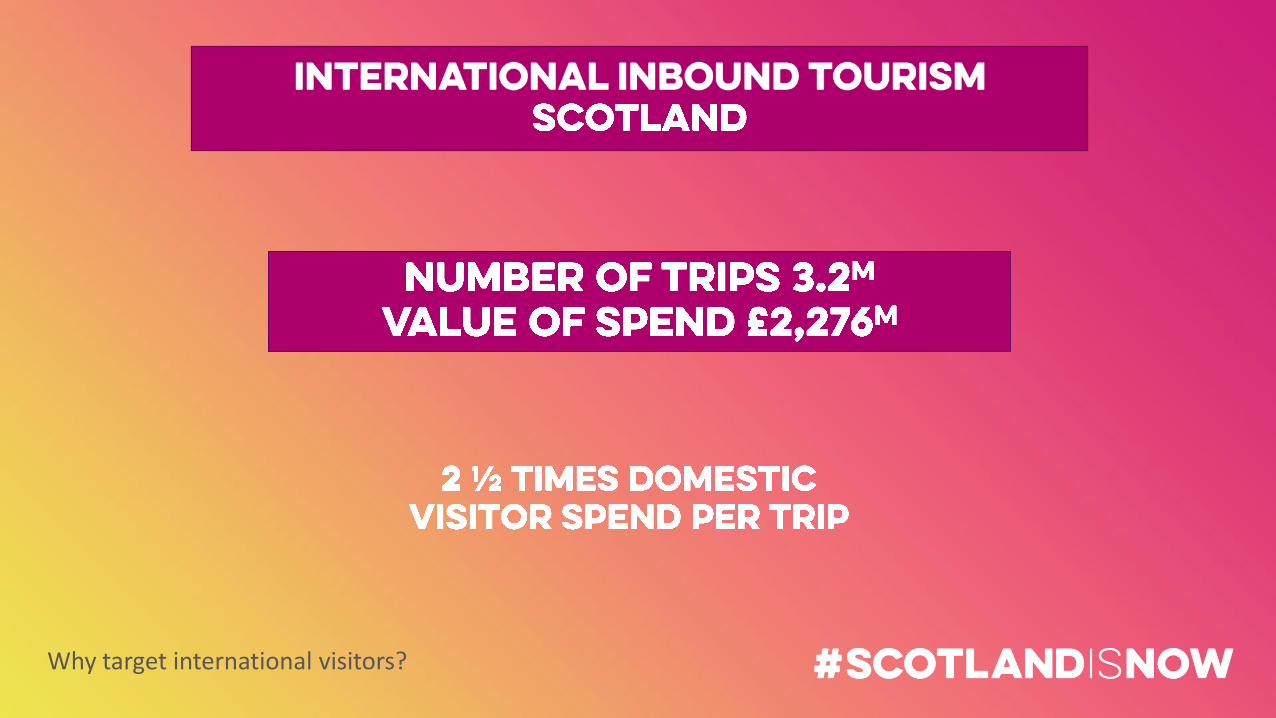
Why target international visitors?
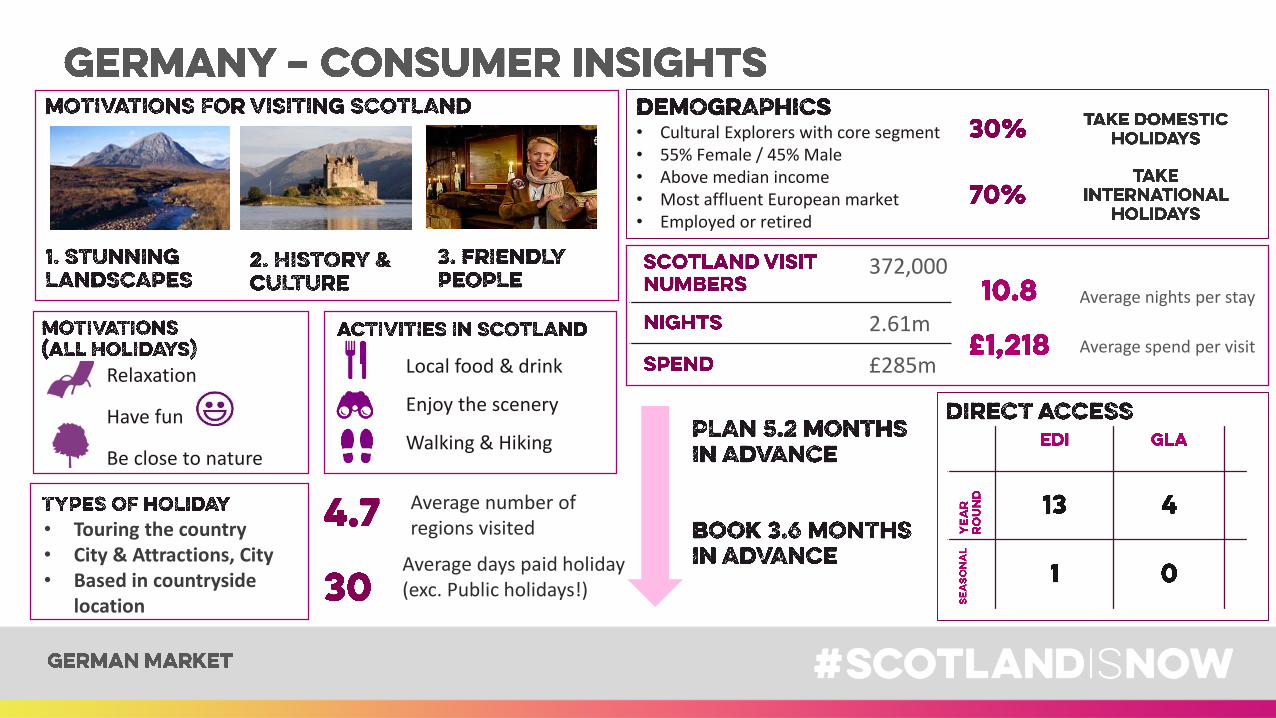
Average number of regions visited• Touring the country
• City & Attractions, City • Based in countryside
location
Average days paid holiday (exc. Public holidays!)
Relaxation
Have fun
Be close to nature
Local food & drink
Enjoy the scenery
Walking & Hiking
372,000
2.61m
£285m
Average nights per stay
Average spend per visit
• Cultural Explorers with core segment 35+• 55% Female / 45% Male• Above median income• Most affluent European market• Employed or retired
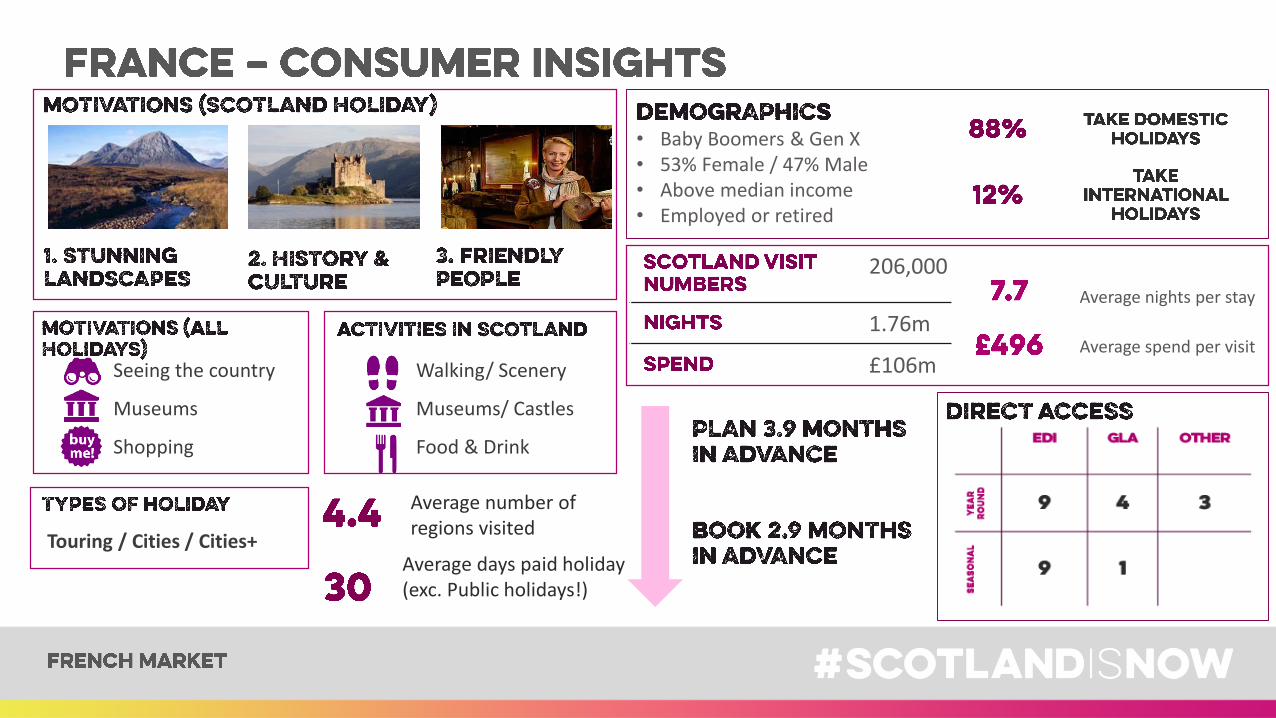
Seeing the country
Museums
Shopping
Average number of regions visited
Walking/ Scenery
Museums/ Castles
Food & Drink
Touring / Cities / Cities+Average days paid holiday (exc. Public holidays!)
• Baby Boomers & Gen X• 53% Female / 47% Male• Above median income• Employed or retired
206,000
1.76m
£106m
Average nights per stay
Average spend per visit
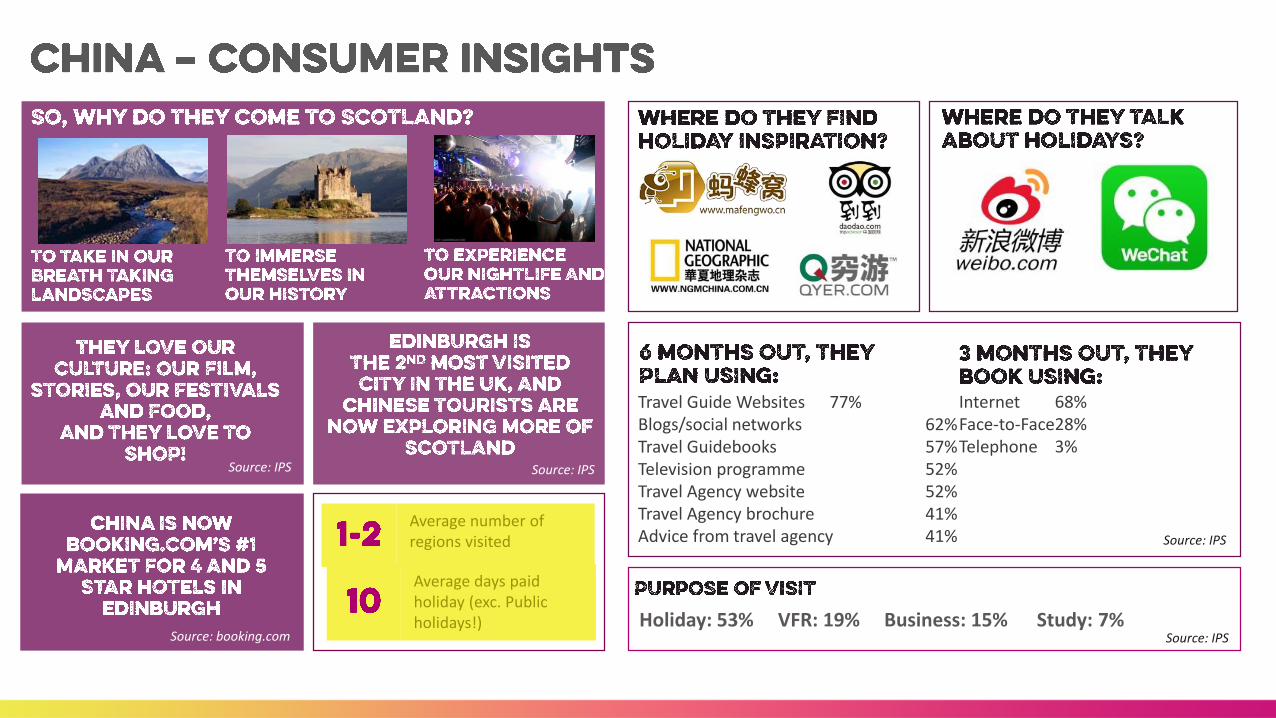
Travel Guide Websites 77%Blogs/social networks 62%Travel Guidebooks 57%Television programme 52%Travel Agency website 52%Travel Agency brochure 41%Advice from travel agency 41%
Internet 68%Face-to-Face28%Telephone 3%
Source: IPS
Source: IPS
Source: booking.com
Source: IPS
Holiday: 53% VFR: 19% Business: 15% Study: 7% Source: IPS Source: IPS
Average number of regions visited
Average days paid holiday (exc. Public holidays!)
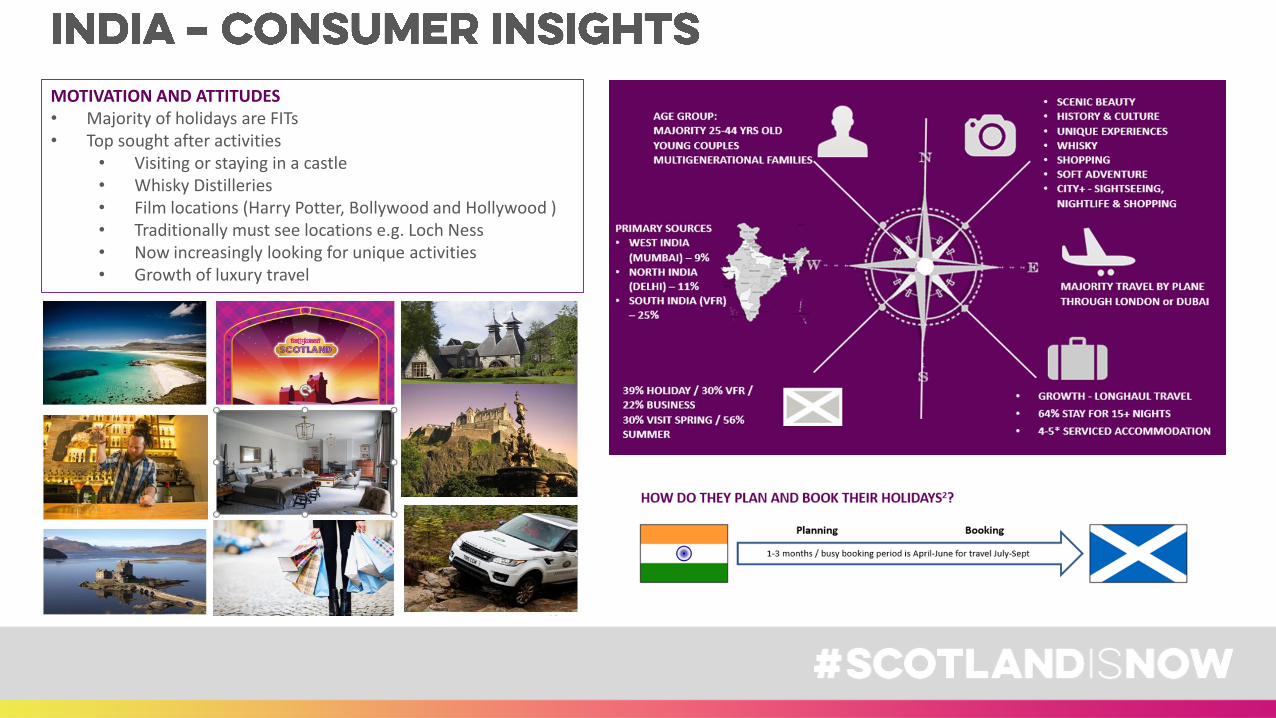
MOTIVATION AND ATTITUDES• Majority of holidays are FITs• Top sought after activities
• Visiting or staying in a castle• Whisky Distilleries • Film locations (Harry Potter, Bollywood and Hollywood )• Traditionally must see locations e.g. Loch Ness• Now increasingly looking for unique activities • Growth of luxury travel
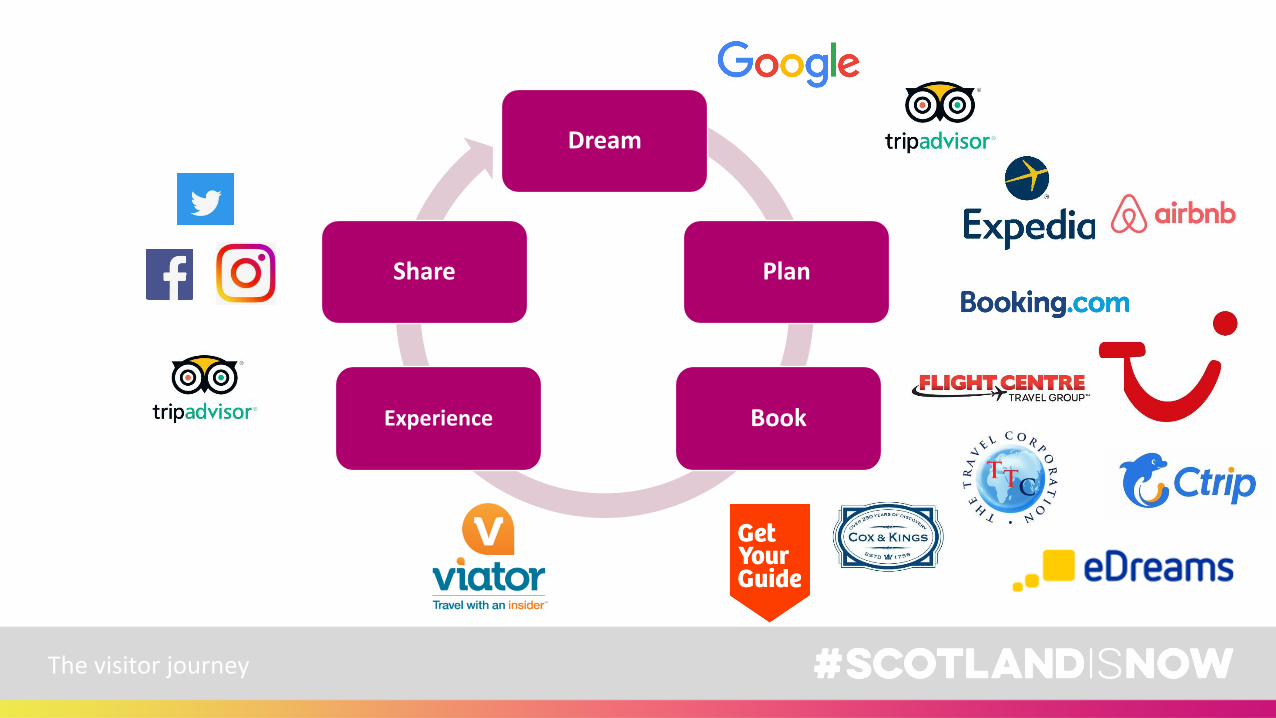
The visitor journey
Dream
Plan
BookExperience
Share
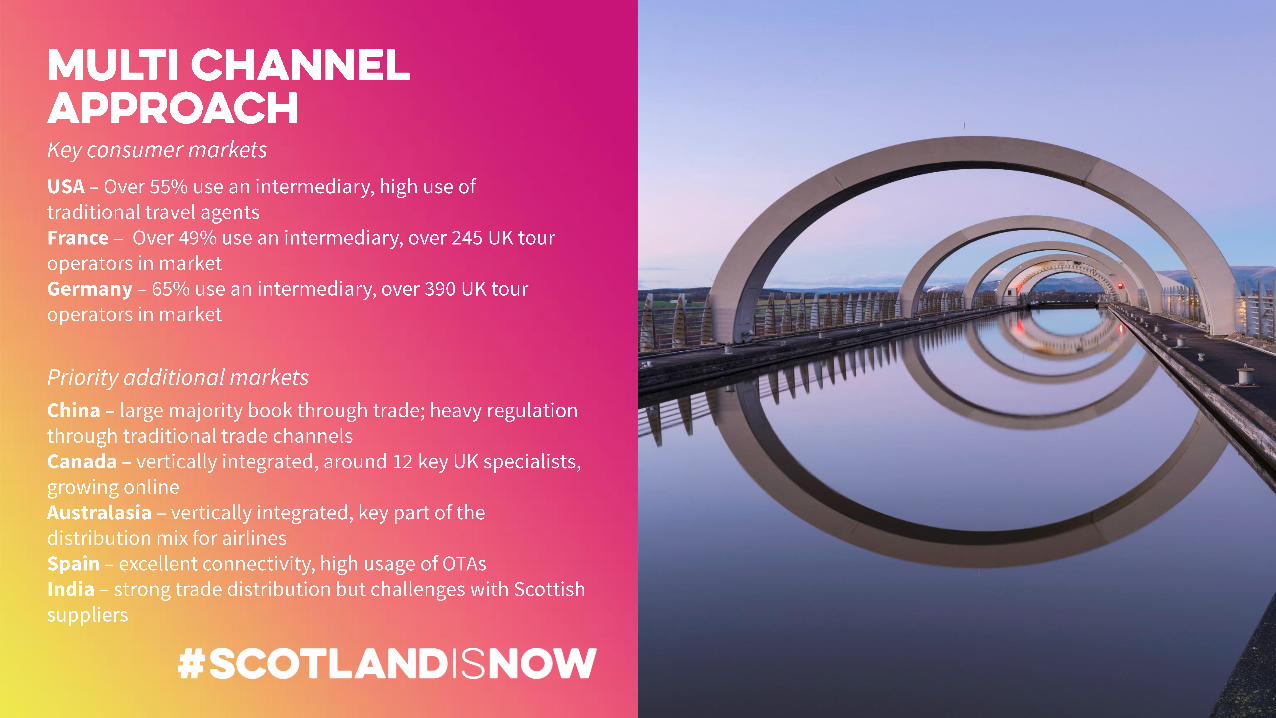
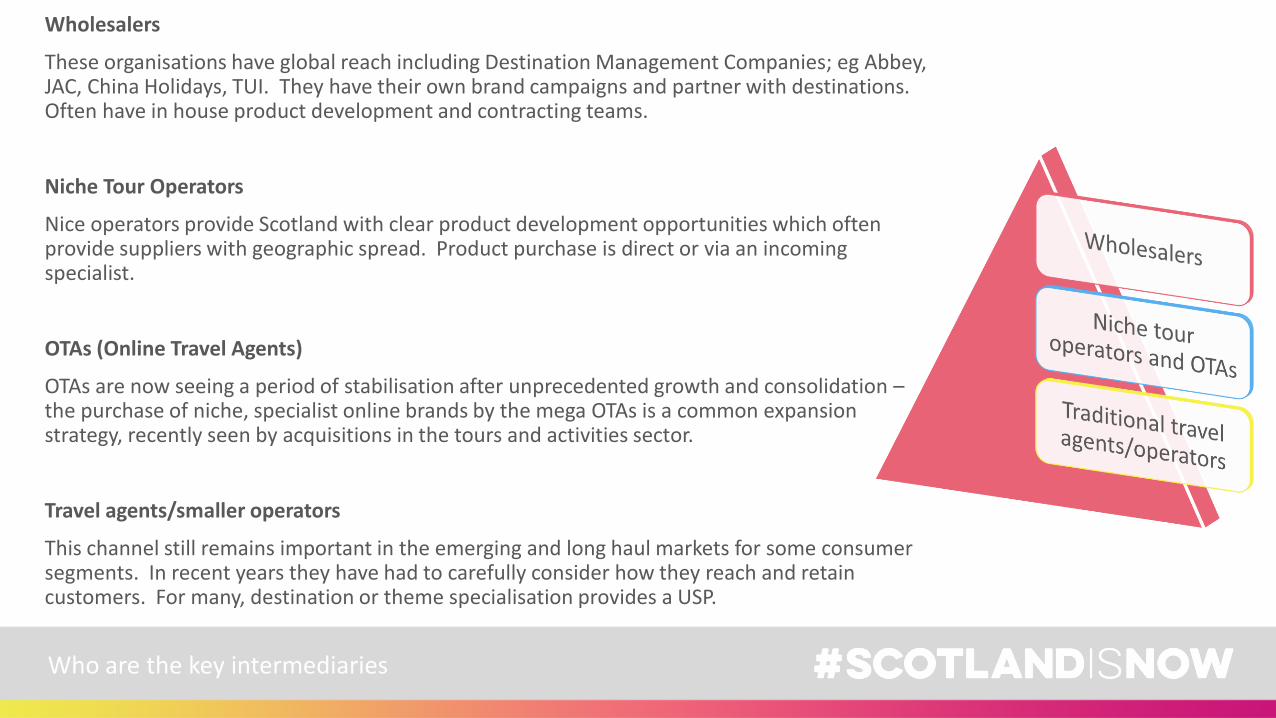
Wholesalers
These organisations have global reach including Destination Management Companies; eg Abbey, JAC, China Holidays, TUI. They have their own brand campaigns and partner with destinations. Often have in house product development and contracting teams.
Niche Tour Operators
Nice operators provide Scotland with clear product development opportunities which often provide suppliers with geographic spread. Product purchase is direct or via an incoming specialist.
OTAs (Online Travel Agents)
OTAs are now seeing a period of stabilisation after unprecedented growth and consolidation –the purchase of niche, specialist online brands by the mega OTAs is a common expansion strategy, recently seen by acquisitions in the tours and activities sector.
Travel agents/smaller operators
This channel still remains important in the emerging and long haul markets for some consumer segments. In recent years they have had to carefully consider how they reach and retain customers. For many, destination or theme specialisation provides a USP.
Who are the key intermediaries
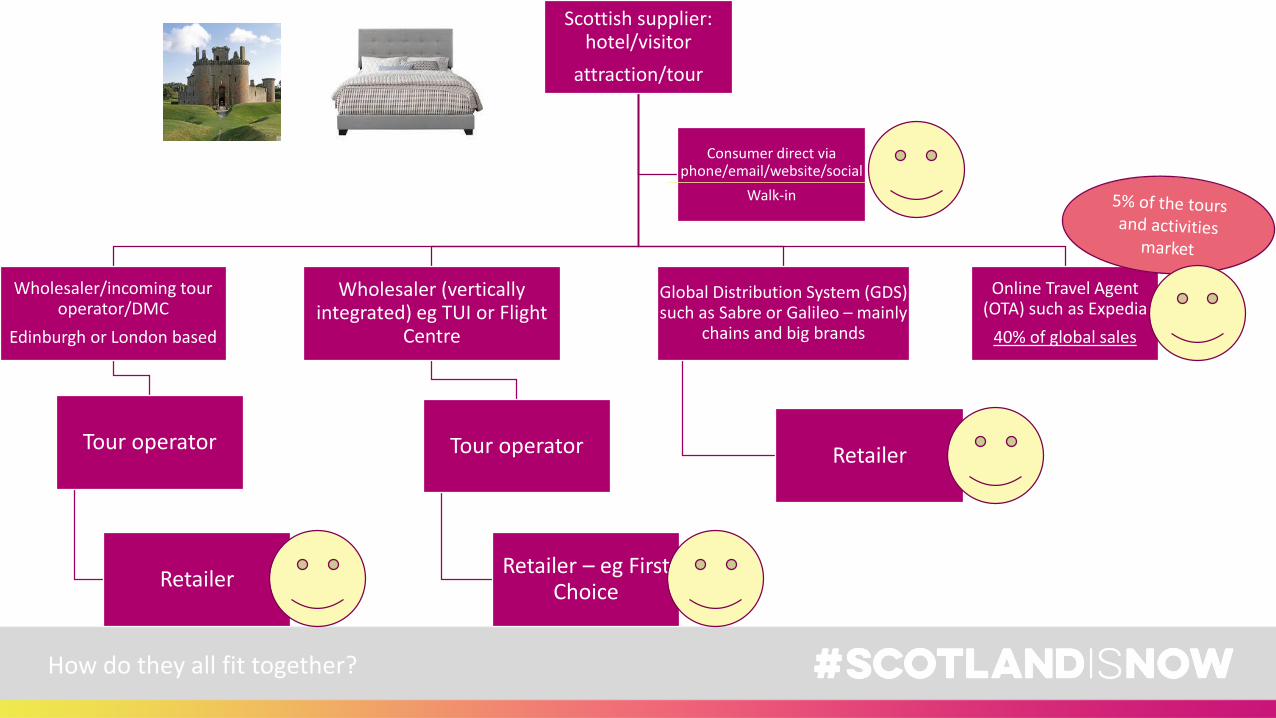
How do they all fit together?
Scottish supplier: hotel/visitor
attraction/tour
Wholesaler/incoming tour operator/DMC
Edinburgh or London based
Tour operator
Retailer
Wholesaler (vertically integrated) eg TUI or Flight
Centre
Tour operator
Retailer – eg First Choice
Global Distribution System (GDS) such as Sabre or Galileo – mainly
chains and big brands
Retailer
Online Travel Agent (OTA) such as Expedia
40% of global sales
Consumer direct via phone/email/website/social
Walk-in
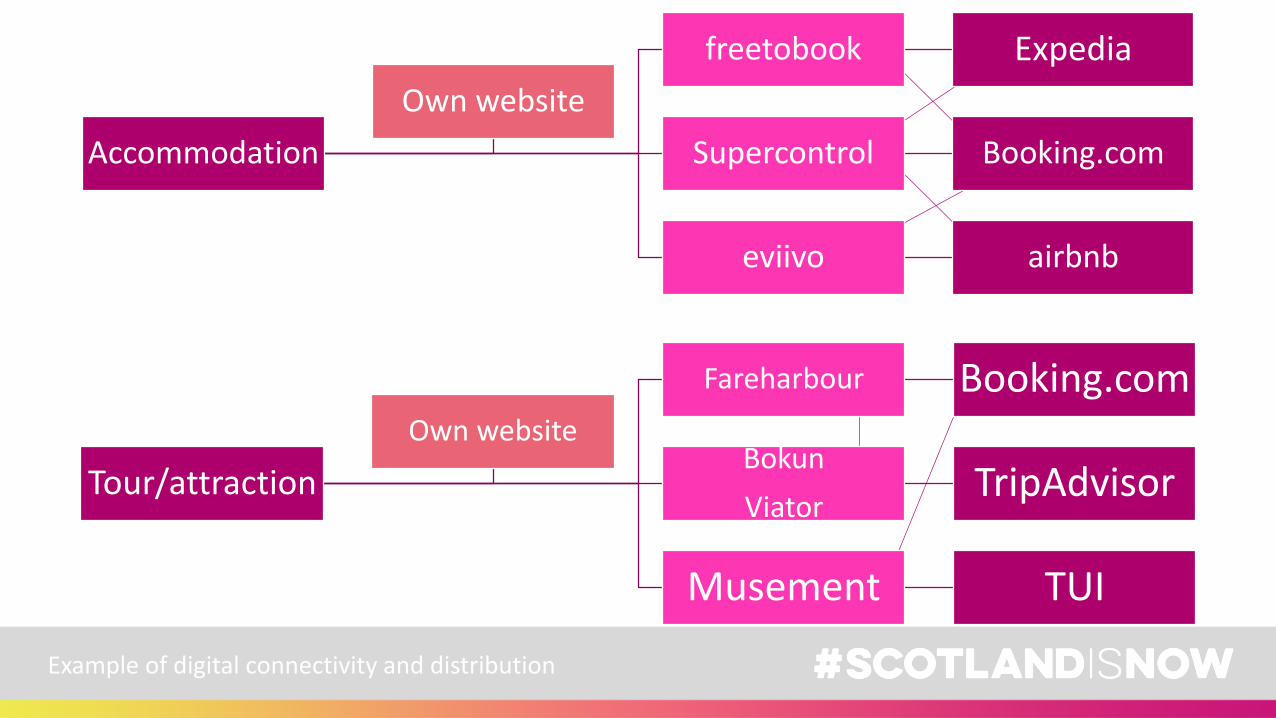
Example of digital connectivity and distribution
Accommodation
freetobook Expedia
Supercontrol Booking.com
eviivo airbnb
Own website
Tour/attraction
Fareharbour Booking.com
Bokun
ViatorTripAdvisor
Musement TUI
Own website
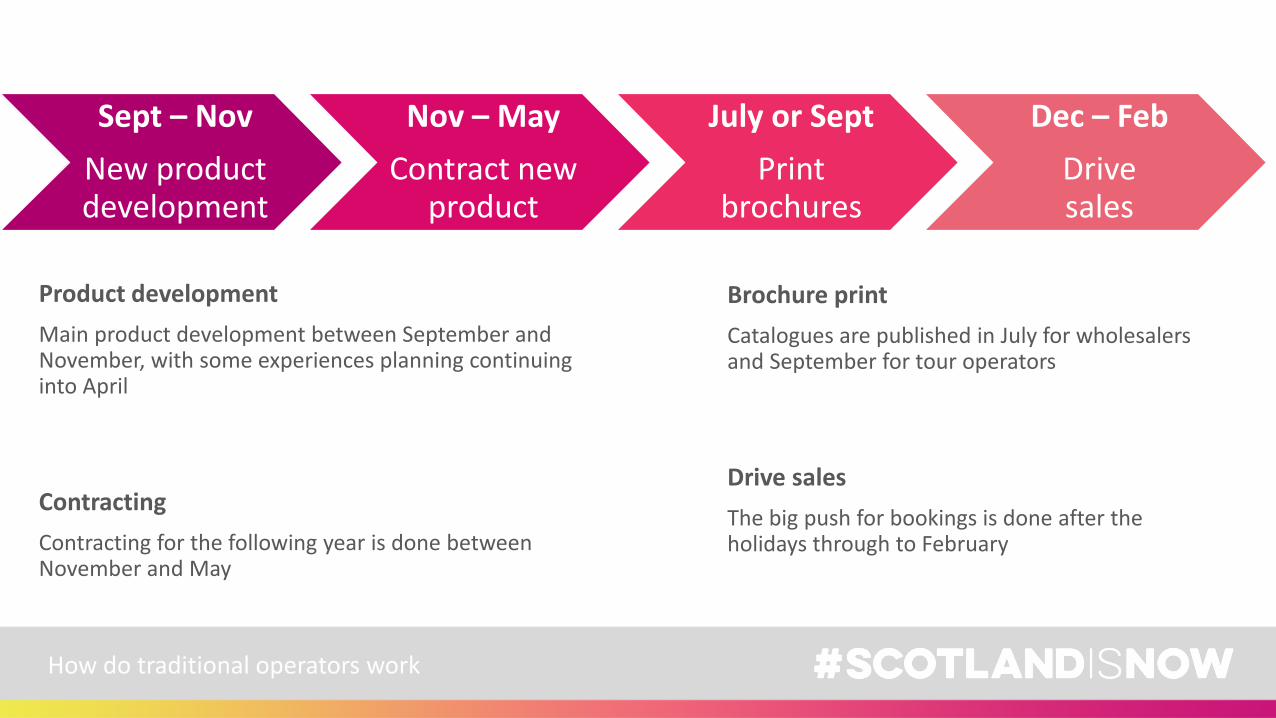
How do traditional operators work
Sept – Nov
New product development
Nov – May
Contract new product
July or Sept
Print brochures
Dec – Feb
Drive sales
Product development
Main product development between September and November, with some experiences planning continuing into April
Contracting
Contracting for the following year is done between November and May
Brochure print
Catalogues are published in July for wholesalers and September for tour operators
Drive sales
The big push for bookings is done after the holidays through to February
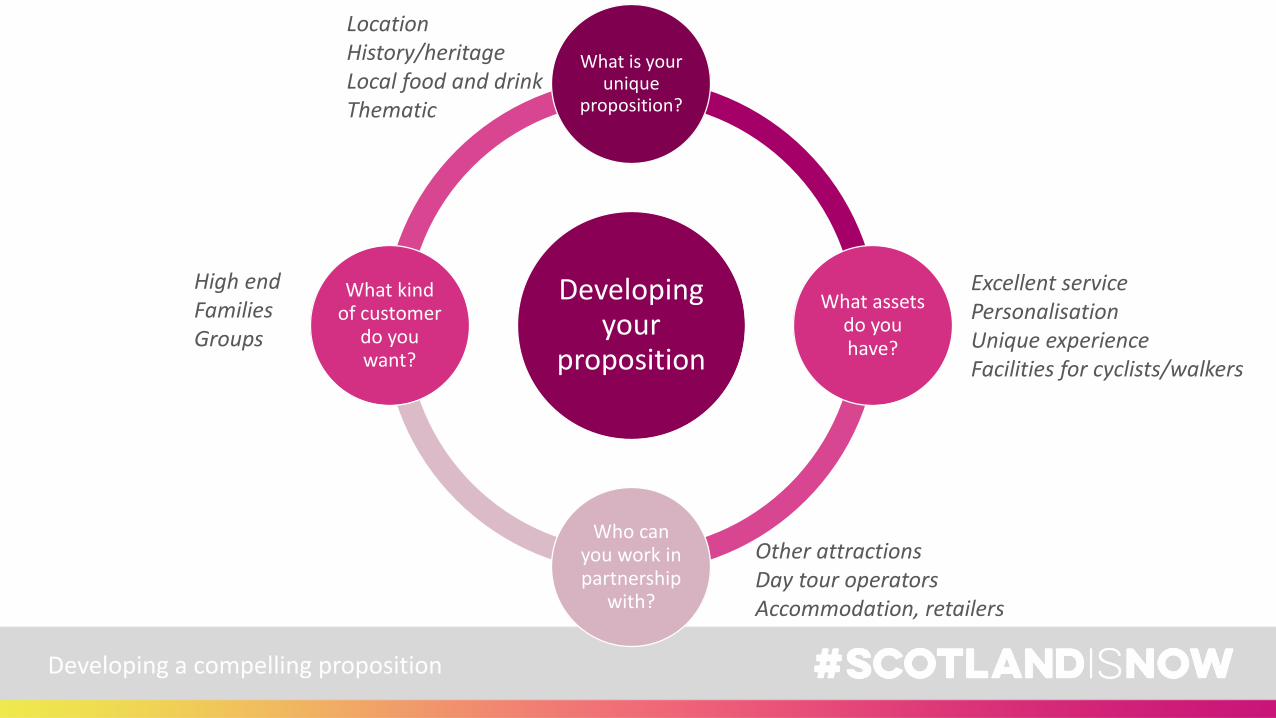
Developing a compelling proposition
Developing your
proposition
What is your unique
proposition?
What assets do you have?
Who can you work in partnership
with?
What kind of customer
do you want?
High endFamiliesGroups
Other attractionsDay tour operatorsAccommodation, retailers
Excellent servicePersonalisationUnique experienceFacilities for cyclists/walkers
LocationHistory/heritageLocal food and drinkThematic
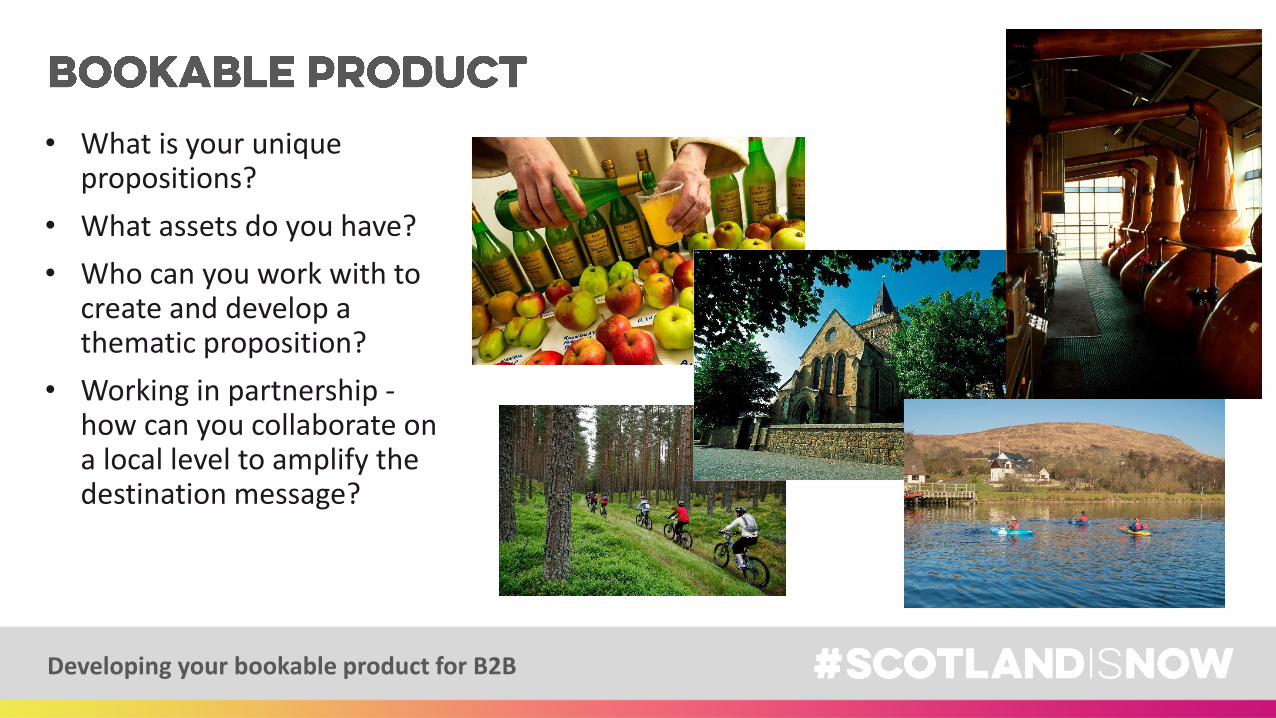
• What is your unique propositions?
• What assets do you have?
• Who can you work with to create and develop a thematic proposition?
• Working in partnership -how can you collaborate on a local level to amplify the destination message?
Developing your bookable product for B2B
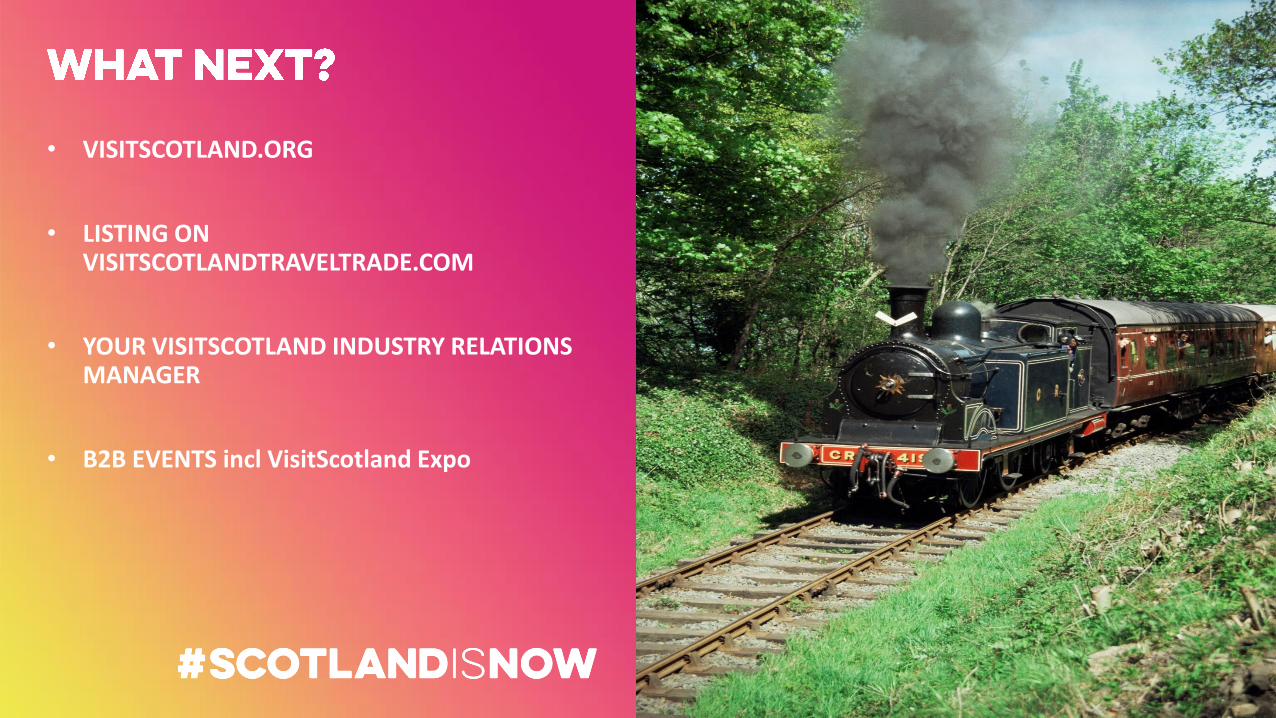
• VISITSCOTLAND.ORG
• LISTING ON VISITSCOTLANDTRAVELTRADE.COM
• YOUR VISITSCOTLAND INDUSTRY RELATIONS MANAGER
• B2B EVENTS incl VisitScotland Expo