Embed Size (px)
Citation preview
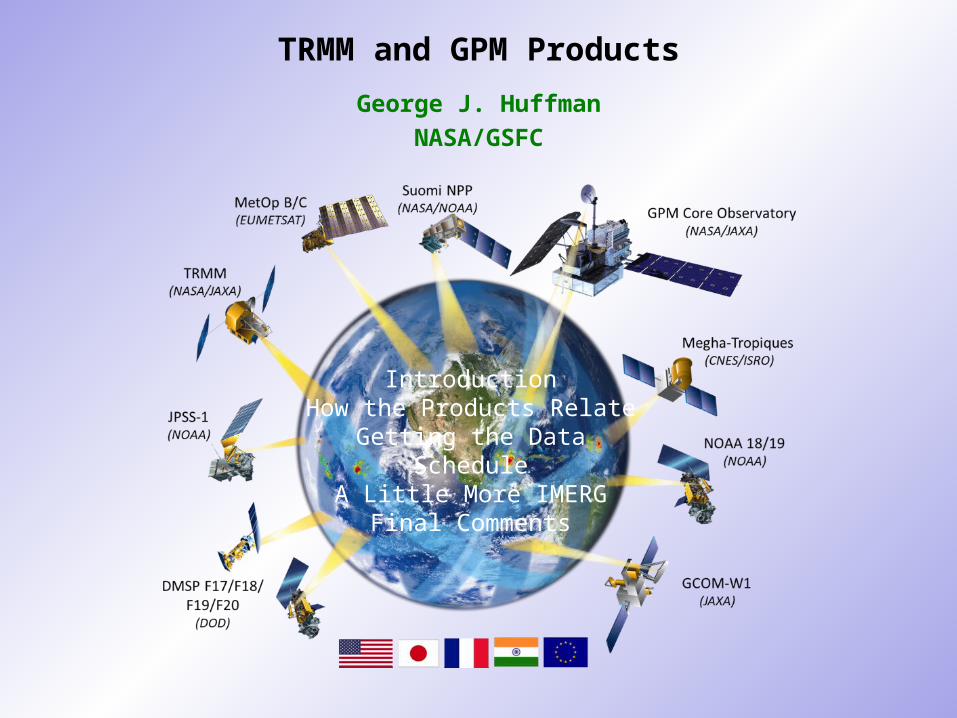
TRMM and GPM Products
George J. Huffman
NASA/GSFC
IntroductionHow the Products Relate
Getting the DataSchedule
A Little More IMERGFinal Comments
1. INTRODUCTION
TRMM started with a goal of 5°x5° monthly data for the tropics
• the mission expanded to a much more applications-oriented focus
• user-oriented services developed
GPM built on TRMM’s success
• better sensors
• constellation as an integral part of the project
• improved algorithms
But, GPM is not just TRMM-plus
• zero-base review
• next-generation algorithms
• requires significant time to tune up the system
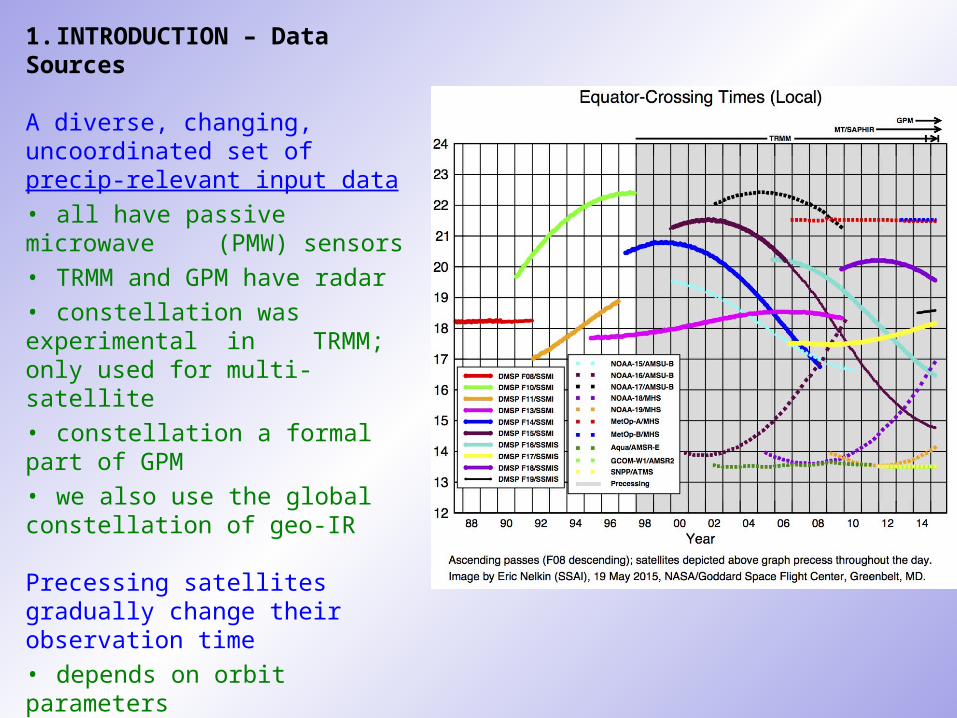
1. INTRODUCTION – Data Sources
A diverse, changing, uncoordinated set of precip-relevant input data
• all have passive microwave (PMW) sensors
• TRMM and GPM have radar
• constellation was experimental in TRMM; only used for multi-
satellite
• constellation a formal part of GPM
• we also use the global constellation of geo-IR
Precessing satellites gradually change their observation time
• depends on orbit parameters
• TRMM – 46 days
• GPM – 83 days
• Megha-Tropiques – 51 days
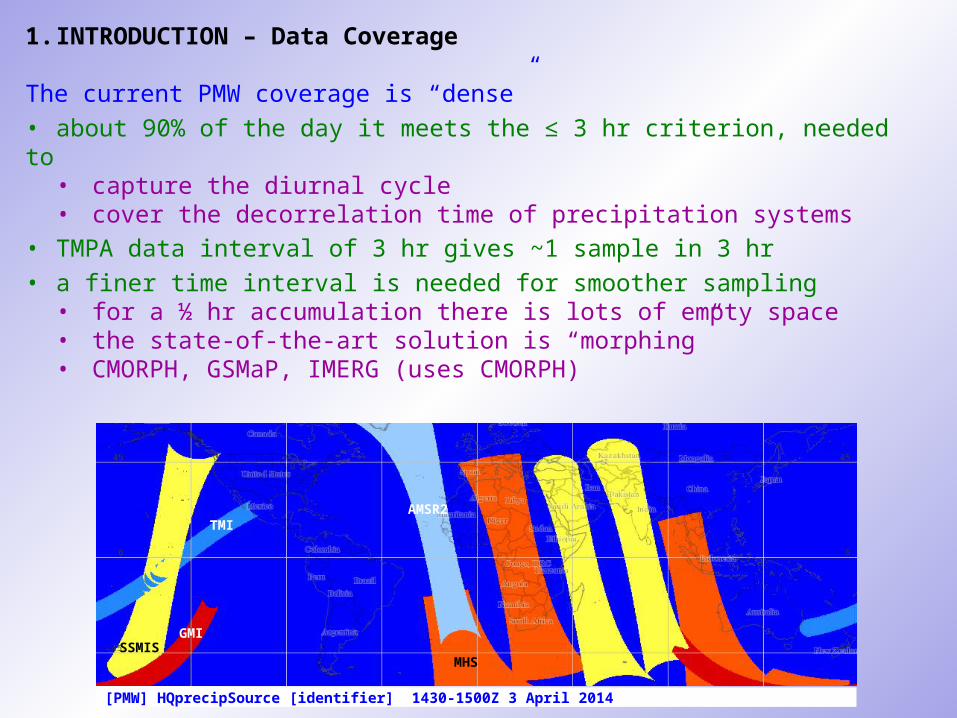
1. INTRODUCTION – Data Coverage
The current PMW coverage is “dense”
• about 90% of the day it meets the ≤ 3 hr criterion, needed to • capture the diurnal cycle
• cover the decorrelation time of precipitation systems
• TMPA data interval of 3 hr gives ~1 sample in 3 hr
• a finer time interval is needed for smoother sampling • for a ½ hr accumulation there is lots of empty space
• the state-of-the-art solution is “morphing” • CMORPH, GSMaP, IMERG (uses CMORPH)
[PMW] HQprecipSource [identifier] 1430-1500Z 3 April 2014
GMI
TMIAMSR2
MHSSSMIS
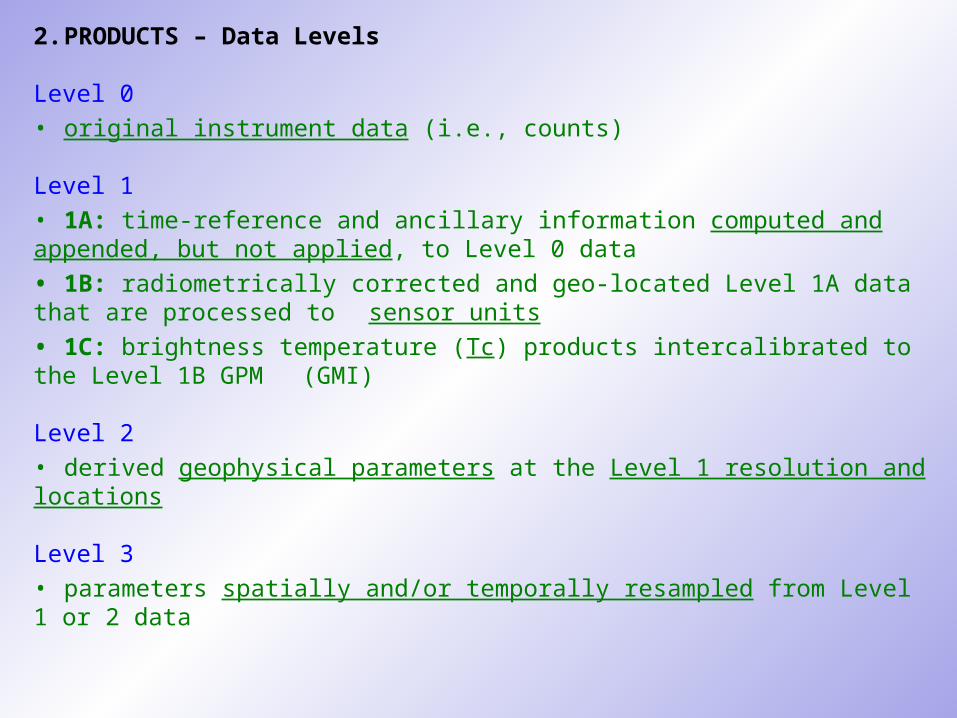
2. PRODUCTS – Data Levels
Level 0
• original instrument data (i.e., counts)
Level 1
• 1A: time-reference and ancillary information computed and appended, but not applied, to Level 0 data
• 1B: radiometrically corrected and geo-located Level 1A data that are processed to sensor units
• 1C: brightness temperature (Tc) products intercalibrated to the Level 1B GPM (GMI)
Level 2
• derived geophysical parameters at the Level 1 resolution and locations
Level 3
• parameters spatially and/or temporally resampled from Level 1 or 2 data
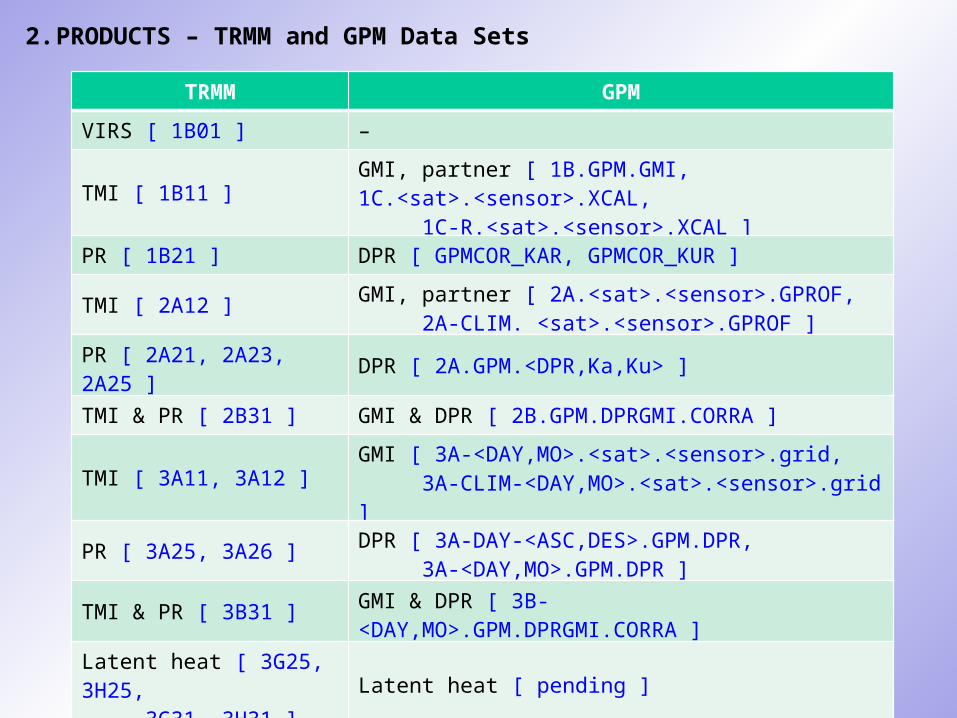
2. PRODUCTS – TRMM and GPM Data Sets
Note – see packet for more details on GPM data sets
TRMM GPM
VIRS [ 1B01 ] –
TMI [ 1B11 ] GMI, partner [ 1B.GPM.GMI, 1C.<sat>.<sensor>.XCAL, 1C-R.<sat>.<sensor>.XCAL ]
PR [ 1B21 ] DPR [ GPMCOR_KAR, GPMCOR_KUR ]
TMI [ 2A12 ] GMI, partner [ 2A.<sat>.<sensor>.GPROF, 2A-CLIM. <sat>.<sensor>.GPROF ]
PR [ 2A21, 2A23, 2A25 ] DPR [ 2A.GPM.<DPR,Ka,Ku> ]
TMI & PR [ 2B31 ] GMI & DPR [ 2B.GPM.DPRGMI.CORRA ]
TMI [ 3A11, 3A12 ] GMI [ 3A-<DAY,MO>.<sat>.<sensor>.grid, 3A-CLIM-<DAY,MO>.<sat>.<sensor>.grid ]
PR [ 3A25, 3A26 ] DPR [ 3A-DAY-<ASC,DES>.GPM.DPR, 3A-<DAY,MO>.GPM.DPR ]
TMI & PR [ 3B31 ] GMI & DPR [ 3B-<DAY,MO>.GPM.DPRGMI.CORRA ]
Latent heat [ 3G25, 3H25, 3G31, 3H31 ] Latent heat [ pending ]
Multi-sat. [ 3B42, 3B43 ] Multi-sat. [ 3B-HHR<none,-E,-L>.MS.MRG.3IMERG, 3B-MO.MS.MRG.3IMERG ], [ GSMAP at JAXA ]
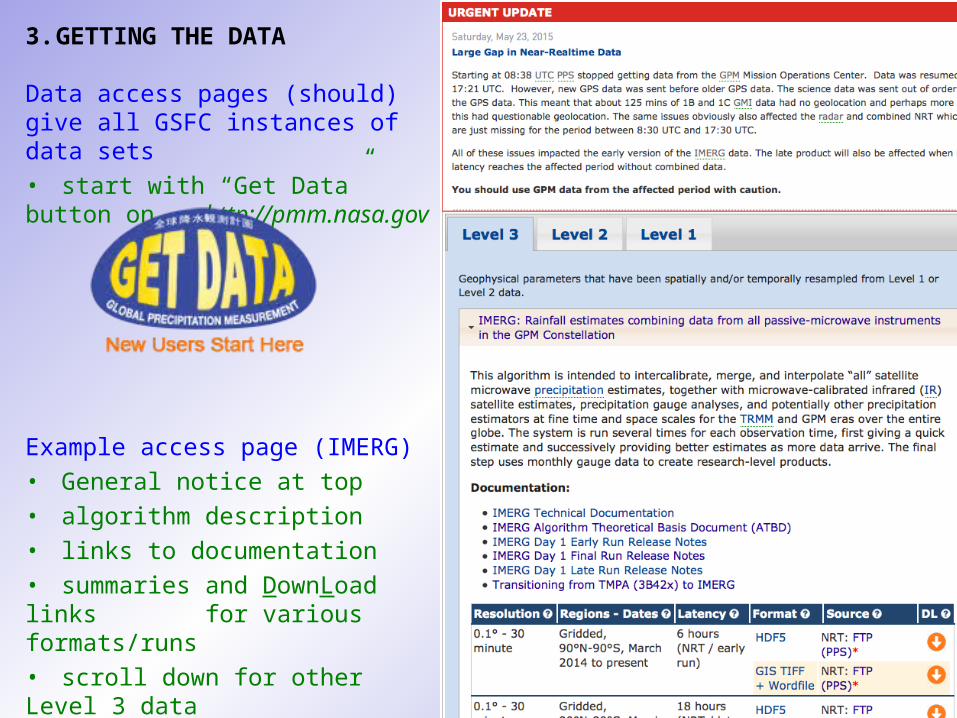
3. GETTING THE DATA
Data access pages (should) give all GSFC instances of data sets
• start with “Get Data” button on http://pmm.nasa.gov
Example access page (IMERG)
• General notice at top
• algorithm description
• links to documentation
• summaries and DownLoad links for various formats/runs
• scroll down for other Level 3 data
• click other Level tabs for 1 and 2
3. GETTING THE DATA – A Few More Details
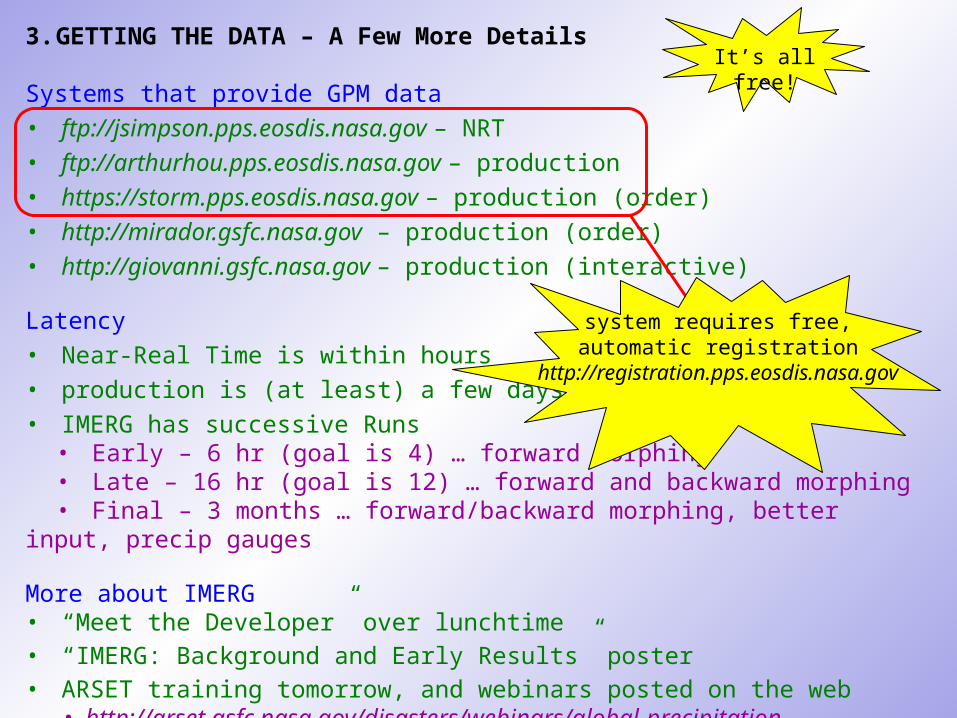
Systems that provide GPM data
• ftp://jsimpson.pps.eosdis.nasa.gov – NRT
• ftp://arthurhou.pps.eosdis.nasa.gov – production
• https://storm.pps.eosdis.nasa.gov – production (order)
• http://mirador.gsfc.nasa.gov – production (order)
• http://giovanni.gsfc.nasa.gov – production (interactive)
Latency
• Near-Real Time is within hours
• production is (at least) a few days
• IMERG has successive Runs• Early – 6 hr (goal is 4) … forward morphing• Late – 16 hr (goal is 12) … forward and backward morphing• Final – 3 months … forward/backward morphing, better input, precip gauges
More about IMERG• “Meet the Developer” over lunchtime
• “IMERG: Background and Early Results” poster
• ARSET training tomorrow, and webinars posted on the web• http://arset.gsfc.nasa.gov/disasters/webinars/global-precipitation
It’s all free!
system requires free,automatic registration
http://registration.pps.eosdis.nasa.gov
3. GETTING THE DATA – Shapefile Averaging
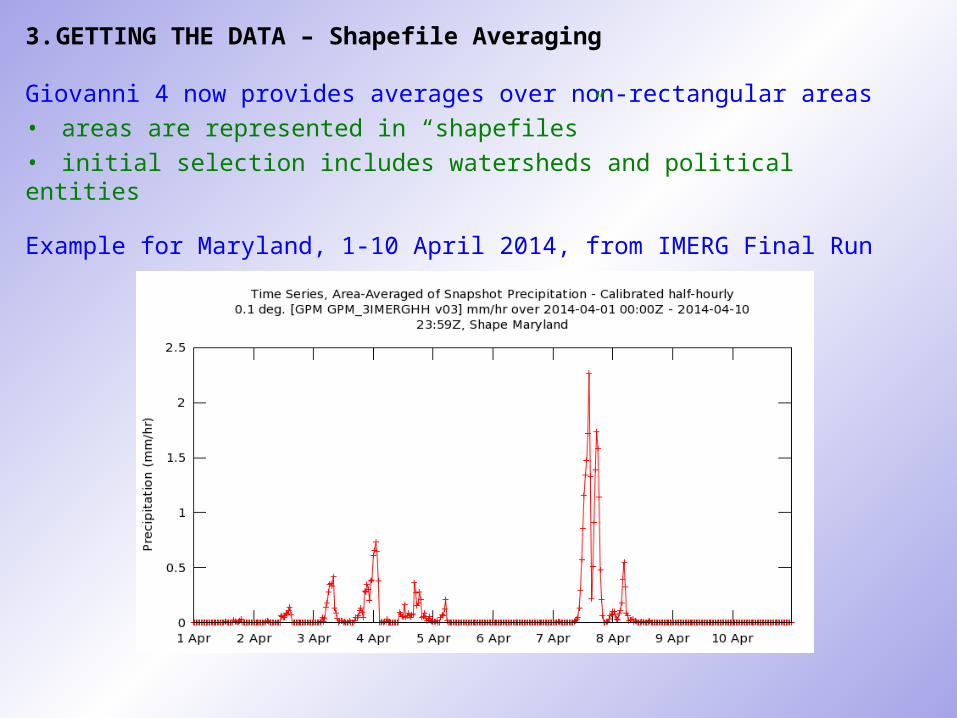
Giovanni 4 now provides averages over non-rectangular areas
• areas are represented in “shapefiles”
• initial selection includes watersheds and political entities
Example for Maryland, 1-10 April 2014, from IMERG Final Run
4. SCHEDULE – TRMM
The TRMM satellite is done
• fuel was depleted in July 2014
• PR products stopped 8 October 2014
• TMI was shut down 8 April 2015
• re-entry is “soon”
• TMPA-RT uses climatological calibration, so continues to run “as is”
• production TMPA partly depends on PR for calibration• production switches to climatological calibration with October 2014• performance is being scrutinized• gauge calibration over land continues to yield consistent results• climatological calibration over ocean causes a discontinuity
• loss of legacy sounder estimates or computer hardware could raise issues for continuing TMPA

4. SCHEDULE – GPM
GPM Day-1 products were brought up during 2014
• launch on 27 February 2014
• early release of Level 1 GMI in June 2014 to support tropical cyclone forecasts
• Level 2 data sets released in September 2014
• IMERG• Final Run released in December 2014 (back to 12 March 2014)• Late Run starts 7 March 2015• Early Run starts 1 April 2015
First reprocessing
• Cross-Calibration Team has finalized radiometric calibration for PMW
• Version 2 Level 1 and 2 data sets to be released for GPM era in September 2015
• Version 2 IMERG to be released for GPM era in early 2016
Second reprocessing
• Cross-Calibration Team to finalize radiometric calibration for TMI in Spring 2016
• Version 3 Level 1 and 2 data sets to be released for TRMM/GPM era in Fall 2016
• Version 3 IMERG to be released for TRMM/GPM era in Winter 2017
• TMPA and TMPA shut down in late Spring 2017

5. IMERG – Release Notes
“Day 1 IMERG Final Run Release Notes”
• an introduction and first cut at comparisons
• a living document
• http://pmm.nasa.gov/sites/default/files/document_files/IMERG_FinalRun_Day1_release_notes.pdf
• this and all documents hot-linked on the IMERG data access page, accessible on the Level 3 tab on http://pmm.nasa.gov/data-access/downloads/gpm
• specific features, problems, behaviors
• effects due to IMERG’s structure
• cautions due to the input data
• biggest overall issue is that none of the inputs or IMERG are fully GPM-based
5. IMERG – Final Run vs. 3B43 for June 2014
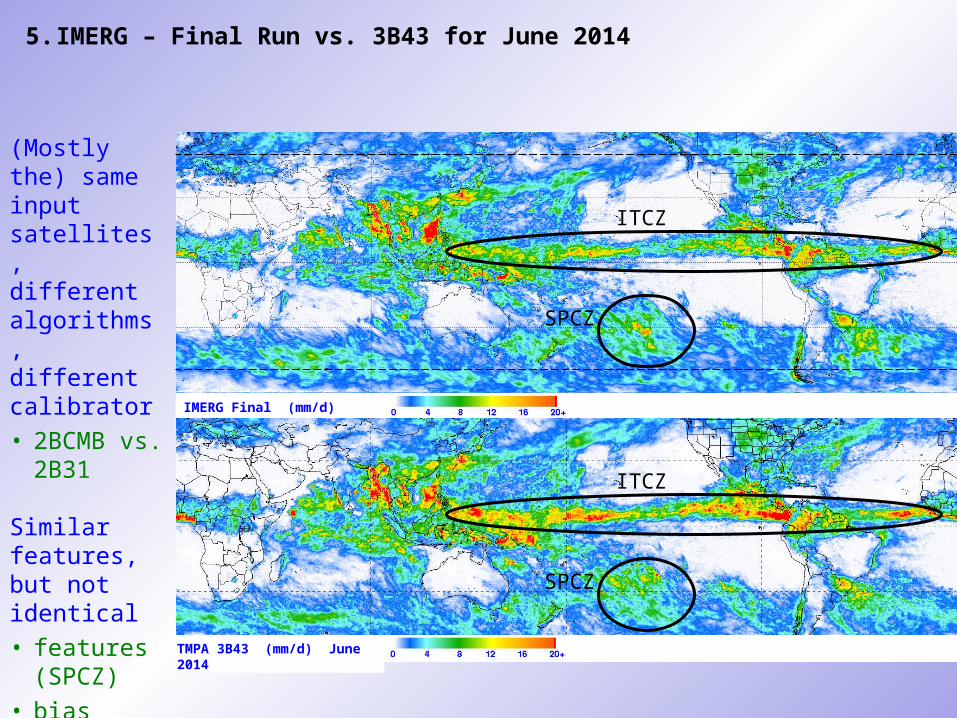
(Mostly the) same input satellites, different algorithms, different calibrator
• 2BCMB vs. 2B31
Similar features, but not identical
• features (SPCZ)
• bias (ITCZ)
IMERG Final (mm/d) June 2014
TMPA 3B43 (mm/d) June 2014
ITCZ
ITCZ
SPCZ
SPCZ
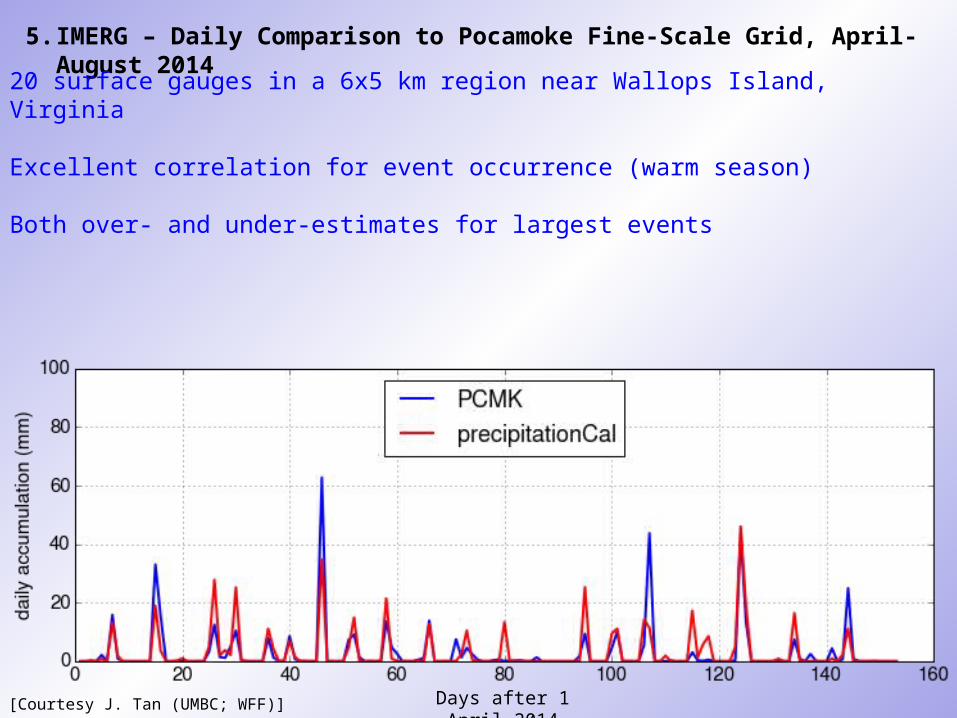
5. IMERG – Daily Comparison to Pocamoke Fine-Scale Grid, April-August 2014
20 surface gauges in a 6x5 km region near Wallops Island, Virginia
Excellent correlation for event occurrence (warm season)
Both over- and under-estimates for largest events
[Courtesy J. Tan (UMBC; WFF)] Days after 1 April 2014
6. FINAL COMMENTS
GPM algorithms and processing differ significantly from TRMM counterparts
Guidance on access to TRMM and GPM data and documentation has been upgraded and consolidated in one set of pages
The transition from TRMM to GPM datasets is well underway
• Fully GPM-based retrievals will be available for Levels 1 and 2 in September 2015
• GPM-era IMERG should be reprocessed in early 2016
• TRMM/GPM-era products will be processed about a year later
• TMPA and TMPA-RT to be run until Spring 2017
http://pmm.nasa.gov

Reserve Slides
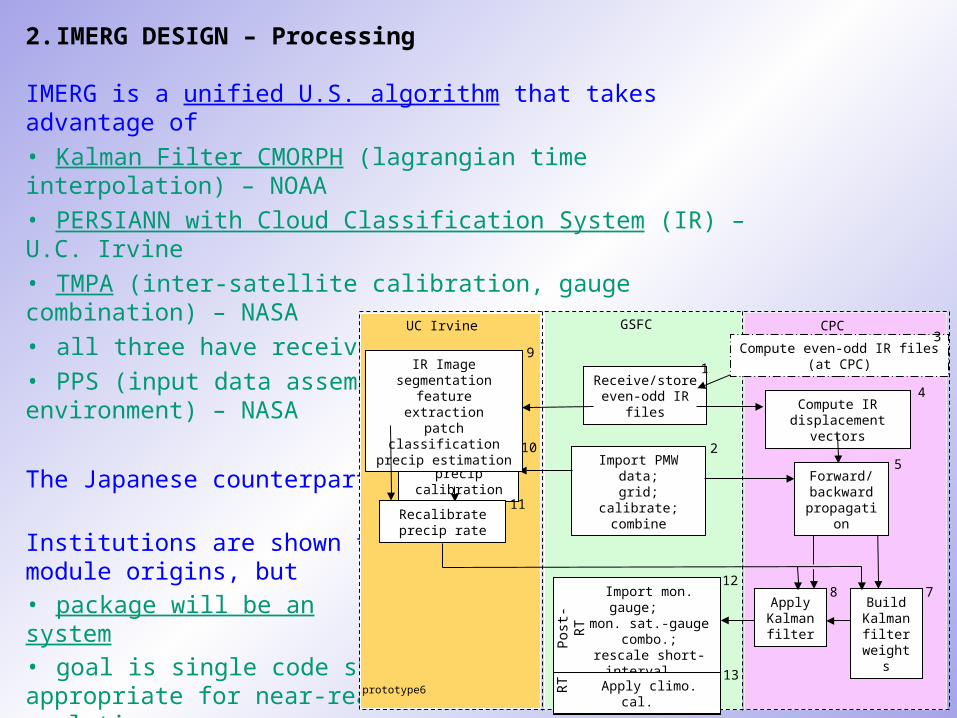
2. IMERG DESIGN – Processing
IMERG is a unified U.S. algorithm that takes advantage of
• Kalman Filter CMORPH (lagrangian time interpolation) – NOAA
• PERSIANN with Cloud Classification System (IR) – U.C. Irvine
• TMPA (inter-satellite calibration, gauge combination) – NASA
• all three have received PMM support
• PPS (input data assembly, processing environment) – NASA
The Japanese counterpart is GSMaP
Institutions are shown for module origins, but
• package will be an integrated system
• goal is single code systemappropriate for near-real and post-real time
• “the devil is in the details”
GSFC CPCUC Irvine
prototype6
Receive/storeeven-odd IR
files
1
Import PMW data;grid; calibrate;
combine
2
Compute even-odd IR files(at CPC)
3
Compute IRdisplacement vectors
4
Build IR-PMW precip calibration
10
IR Image segmentationfeature extraction
patch classificationprecip estimation
9
Apply Kalman
filter
8Build
Kalmanfilter
weights
7
Forward/backward
propagation
5
Import mon. gauge; mon. sat.-gauge
combo.; rescale short-interval datasets to monthly
Apply climo. cal.RT
Pos
t-R
T
13
12
11Recalibrateprecip rate
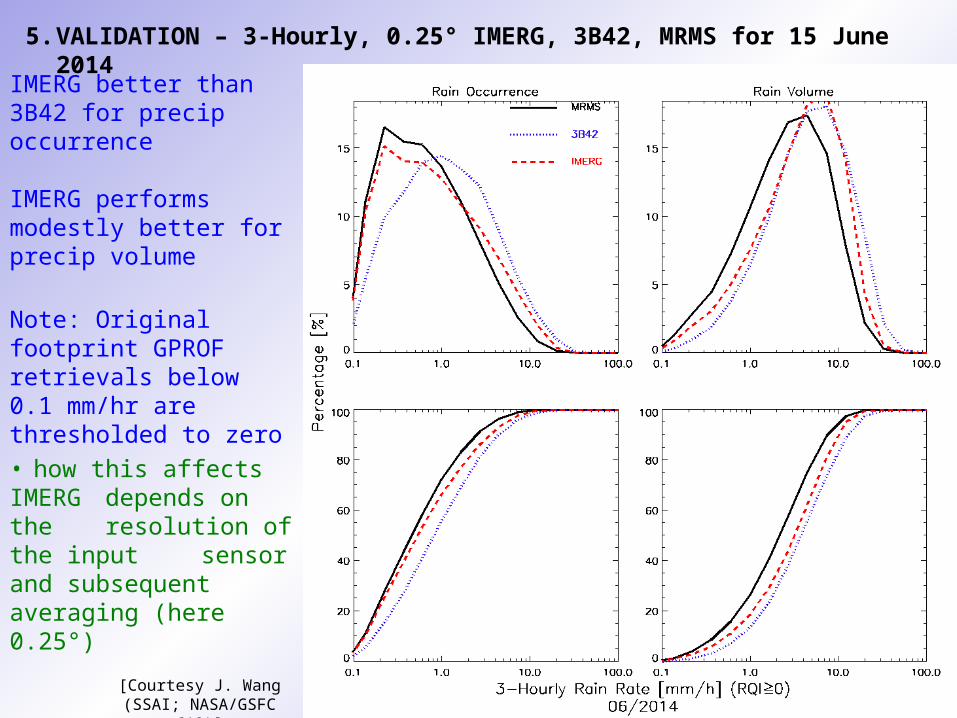
5. VALIDATION – 3-Hourly, 0.25° IMERG, 3B42, MRMS for 15 June 2014
IMERG better than 3B42 for precip occurrence
IMERG performs modestly better for precip volume
Note: Original footprint GPROF retrievals below 0.1 mm/hr are thresholded to zero
• how this affects IMERG depends on the resolution of the input sensor and subsequent averaging (here 0.25°)
[Courtesy J. Wang(SSAI; NASA/GSFC 612)]
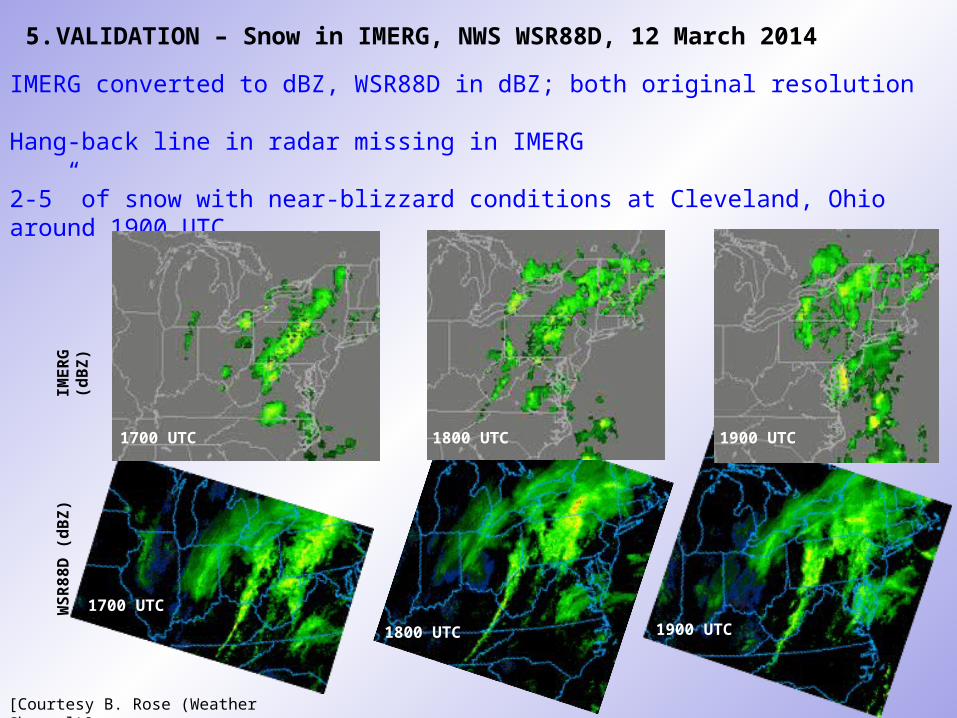
5. VALIDATION – Snow in IMERG, NWS WSR88D, 12 March 2014
IMERG converted to dBZ, WSR88D in dBZ; both original resolution
Hang-back line in radar missing in IMERG
2-5” of snow with near-blizzard conditions at Cleveland, Ohio around 1900 UTC
IME
RG
(d
BZ
)
[Courtesy B. Rose (Weather Channel)]
1700 UTC
WS
R8
8D
(d
BZ
)
1800 UTC 1900 UTC
1700 UTC
1800 UTC 1900 UTC
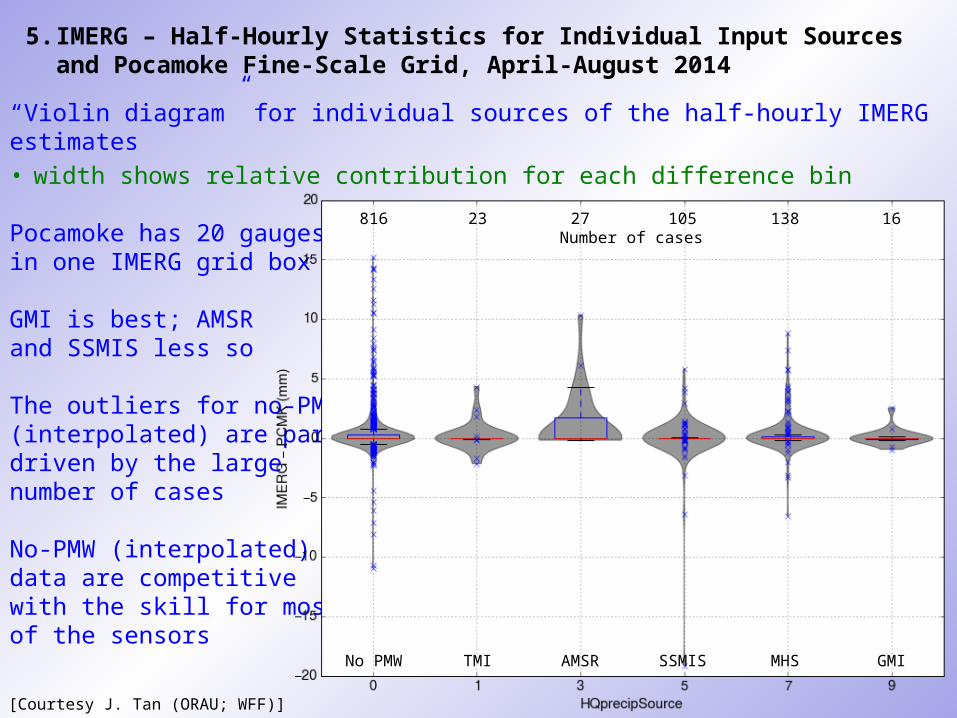
5. IMERG – Half-Hourly Statistics for Individual Input Sources and Pocamoke Fine-Scale Grid, April-August 2014
“Violin diagram” for individual sources of the half-hourly IMERG estimates
• width shows relative contribution for each difference bin
Pocamoke has 20 gaugesin one IMERG grid box
GMI is best; AMSR and SSMIS less so
The outliers for no-PMW (interpolated) are partly driven by the large number of cases
No-PMW (interpolated)data are competitive with the skill for most of the sensors
[Courtesy J. Tan (ORAU; WFF)]
No PMW TMI AMSR SSMIS MHS GMI
Number of cases816 23 27 105 138 16