Embed Size (px)
Citation preview

Trojan Investment FundsAnnual Report and Financial Statements31 January 2016
Trojan FundTrojan Ethical Income FundTrojan Global Equity Fund (formerly Trojan Capital Fund)Trojan Income FundCrystal FundSpectrum FundSpectrum Income Fund

Trojan Investment Funds 1
CONTENTS
ACD’s Report ................................................................................................................................................ 8
Authorised Status................................................................................................................................ 8
Important Information ....................................................................................................................... 8
Cross Holdings ..................................................................................................................................... 9
Director’s Statement ................................................................................................................................ 10
Statement of ACD’s Responsibilities in Relation to the Financial Statements ............................. 10
Statement of Depositary’s Responsibilities ......................................................................................... 11
Report of the Depositary ......................................................................................................................... 11
Independent Auditor’s Report to the Members of Trojan Investment Funds ................................ 12
Financial Statements ................................................................................................................................ 14
Accounting Policies ........................................................................................................................... 14
TROJAN FUND
ACD’s Report .............................................................................................................................................. 17
Important Information ..................................................................................................................... 17
Investment Objective and Policy ................................................................................................... 17
Investment Manager’s Report ........................................................................................................ 18
Fund Information .............................................................................................................................. 22
Portfolio Statement .......................................................................................................................... 32
Summary of Material Portfolio Changes ...................................................................................... 34
Financial Statements ................................................................................................................................ 35
Statement of Total Return ............................................................................................................... 35
Statement of Change in Net Assets Attributable to Shareholders ......................................... 35
Balance Sheet ..................................................................................................................................... 36
Notes to the Financial Statements ................................................................................................ 37
Distribution Table .............................................................................................................................. 50
AUTHORISED CORPORATE DIRECTOR (‘ACD’)Capita Financial Managers LimitedHead Offi ce:40 Dukes PlaceLondon EC3A 7NHTelephone: 0870 607 2555 Fax: 0870 607 2550Email: enquiries@capitafi nancial.com(Authorised and regulated by the Financial Conduct Authority)
DIRECTORS OF THE ACDC. AddenbrookeN. BoylingB. HammondP. Hugh-SmithK.J. Midl
INVESTMENT MANAGERTroy Asset Management Limited33 Davies StreetLondon W1K 4BP(Authorised and regulated by the Financial Conduct Authority)
DEPOSITARYBNY Mellon Trust & Depositary (UK) LimitedThe Bank of New York Mellon Centre160 Queen Victoria StreetLondon EC4V 4LA(Authorised and regulated by the Financial Conduct Authority)
REGISTRARSCapita Financial Administrators LimitedCustomer Service Centre:2 The BoulevardCity West One Offi ce ParkGelderd RoadLeeds LS12 6NTTelephone: 0345 922 0044 Fax: 0113 224 6001(Authorised and regulated by the Financial Conduct Authority)
INDEPENDENT AUDITORErnst & Young LLP25 Churchill PlaceCanary WharfLondon E14 5EY

2 Trojan Investment Funds Trojan Investment Funds 3
Contents (continued)
TROJAN ETHICAL INCOME FUND
ACD’s Report .............................................................................................................................................. 53
Important Information ..................................................................................................................... 53
Investment Objective and Policy ................................................................................................... 53
Investment Manager’s Report ........................................................................................................ 54
Fund Information .............................................................................................................................. 57
Portfolio Statement .......................................................................................................................... 64
Summary of Material Portfolio Changes ...................................................................................... 68
Financial Statements ................................................................................................................................ 69
Statement of Total Return ............................................................................................................... 69
Statement of Change in Net Assets Attributable to Shareholders ......................................... 69
Balance Sheet ..................................................................................................................................... 70
Notes to the Financial Statements ................................................................................................ 71
Distribution Table .............................................................................................................................. 79
TROJAN GLOBAL EQUITY FUND
ACD’s Report .............................................................................................................................................. 81
Important Information ..................................................................................................................... 81
Investment Objective and Policy ................................................................................................... 81
Investment Manager’s Report ........................................................................................................ 82
Fund Information .............................................................................................................................. 85
Portfolio Statement .......................................................................................................................... 93
Summary of Material Portfolio Changes ...................................................................................... 95
Financial Statements ................................................................................................................................ 96
Statement of Total Return ............................................................................................................... 96
Statement of Change in Net Assets Attributable to Shareholders ......................................... 96
Balance Sheet ..................................................................................................................................... 97
Notes to the Financial Statements ................................................................................................ 98
Distribution Table ........................................................................................................................... 107

4 Trojan Investment Funds Trojan Investment Funds 5
Contents (continued)
TROJAN INCOME FUND
ACD’s Report ........................................................................................................................................... 110
Important Information .................................................................................................................. 110
Investment Objective and Policy ................................................................................................ 110
Investment Manager’s Report ..................................................................................................... 111
Fund Information ........................................................................................................................... 115
Portfolio Statement ....................................................................................................................... 125
Summary of Material Portfolio Changes ................................................................................... 130
Financial Statements ............................................................................................................................. 131
Statement of Total Return ............................................................................................................ 131
Statement of Change in Net Assets Attributable to Shareholders ...................................... 131
Balance Sheet .................................................................................................................................. 132
Notes to the Financial Statements ............................................................................................. 133
Distribution Table ........................................................................................................................... 143
CRYSTAL FUND
ACD’s Report ........................................................................................................................................... 146
Important Information .................................................................................................................. 146
Investment Objective and Policy ................................................................................................ 146
Investment Manager’s Report ..................................................................................................... 147
Fund Information ........................................................................................................................... 151
Portfolio Statement ....................................................................................................................... 154
Summary of Material Portfolio Changes ................................................................................... 156
Financial Statements ............................................................................................................................. 157
Statement of Total Return ............................................................................................................ 157
Statement of Change in Net Assets Attributable to Shareholders ...................................... 157
Balance Sheet .................................................................................................................................. 158
Notes to the Financial Statements ............................................................................................. 159
Distribution Table ........................................................................................................................... 170

6 Trojan Investment Funds Trojan Investment Funds 7
Contents (continued)
SPECTRUM FUND
ACD’s Report ........................................................................................................................................... 171
Important Information .................................................................................................................. 171
Investment Objective and Policy ................................................................................................ 171
Investment Manager’s Report ..................................................................................................... 172
Fund Information ........................................................................................................................... 176
Portfolio Statement ....................................................................................................................... 182
Summary of Material Portfolio Changes ................................................................................... 185
Financial Statements ............................................................................................................................. 186
Statement of Total Return ............................................................................................................ 186
Statement of Change in Net Assets Attributable to Shareholders ...................................... 186
Balance Sheet .................................................................................................................................. 187
Notes to the Financial Statements ............................................................................................. 188
Distribution Table ........................................................................................................................... 200
SPECTRUM INCOME FUND
ACD’s Report ........................................................................................................................................... 201
Important Information .................................................................................................................. 201
Investment Objective and Policy ................................................................................................ 201
Investment Manager’s Report ..................................................................................................... 202
Fund Information ........................................................................................................................... 205
Portfolio Statement ....................................................................................................................... 208
Summary of Material Portfolio Changes ................................................................................... 209
Financial Statements ............................................................................................................................. 210
Statement of Total Return ............................................................................................................ 210
Statement of Change in Net Assets Attributable to Shareholders ...................................... 210
Balance Sheet .................................................................................................................................. 211
Notes to the Financial Statements ............................................................................................. 212
Distribution Table ........................................................................................................................... 221
General Information .............................................................................................................................. 222

8 Trojan Investment Funds Trojan Investment Funds 9
ACD’S REPORTFOR THE YEAR ENDED 31 JANUARY 2016
AUTHORISED STATUSTrojan Investment Funds (‘the Company’) is an investment company with variable capital incorporated in England and Wales under registered number IC000280 and authorised by the Financial Conduct Authority with effect from 14 November 2003. The Company has an unlimited duration.
Shareholders are not liable for the debts of the Company. Shareholders are not liable to make any further payment to the Company after they have paid the price on purchase of the shares.
The Company is a UCITS scheme and the base currency of the Company and each sub-fund is Pounds Sterling.
IMPORTANT INFORMATIONWith effect from 1 February 2015 the periodic fee paid to the Depositary of the Company was decreased to 0.03% for the fi rst £100 million of the value of the scheme property of each sub-fund, 0.0175% for the next £50 million and 0.01% for the balance thereafter, subject to a minimum of £5,000 per annum plus VAT.
With effect from 16 March 2015 the name of the Trojan Capital Fund changed to Trojan Global Equity Fund.
From 1 April 2015 the prices of all shares are now published on the Capita Asset Services website www.capitafi nancial.com. The prices of shares may also be obtained by calling 0345 608 0950 during the ACD’s normal business hours.
On 27 April 2015 a new sub-fund, the Spectrum Income Fund, was launched. Further details on this sub-fund are available in the latest scheme Prospectus.
With effect from 5 May 2015 the manner in which the registration fee has been charged has been amended from a per shareholder basis to a charge equal to 0.03% of the net asset value of each sub-fund of the Company. The revised charge is subject to a minimum of £1,500 per annum and a maximum of £100,000 per annum.
With effect from 11 May 2015 a discretionary dilution levy of up to 0.5% may be charged on the purchase and redemption of shares for the Trojan Fund, the Trojan Global Equity Fund, the Trojan Income Fund, the Spectrum Fund and the Spectrum Income Fund.
From 3 August 2015 the Investment Manager has agreed, on a discretionary basis, to waive an appropriate portion of their fee in respect of Class ‘O’ shares issued by Spectrum Fund and Spectrum Income Fund, and the ‘I’ shares issued by Spectrum Fund with a view that the future Ongoing Charges Figures of 1.5% and 2% respectively are not exceeded.
On 6 January 2016 a new sub-fund, the Trojan Ethical Income Fund, was launched. Further details on this sub-fund are available in the latest scheme Prospectus.
With effect from 25 April 2016, shares of the sub-funds of the Company are permitted to be distributed in Switzerland.
Note that the customer services and dealing line has now changed from 0845 608 0950 to 0345 608 0950.
CROSS HOLDINGSNo sub-funds had holdings in any other sub-fund of the Company at the end of the year.
CAPITA FINANCIAL MANAGERS LIMITEDACD of Trojan Investment Funds3 May 2016

10 Trojan Investment Funds Trojan Investment Funds 11
DIRECTOR’S STATEMENT
This report has been prepared in accordance with the requirements of the Collective Investment Schemes Sourcebook as issued and amended by the Financial Conduct Authority.
P. HUGH-SMITH
CAPITA FINANCIAL MANAGERS LIMITEDACD of Trojan Investment Funds3 May 2016
STATEMENT OF ACD’S RESPONSIBILITIES IN RELATIONTO THE FINANCIAL STATEMENTS
The ACD is responsible for preparing the fi nancial statements in accordance with applicable law and United Kingdom Generally Accepted Accounting Practice, including FRS 102 The Financial Reporting Standard applicable in the UK and Republic of Ireland with early application of Amendments to FRS 102 – Fair value hierarchy disclosures, issued in March 2016.
The Financial Conduct Authority’s Collective Investment Schemes Sourcebook (the ‘COLL Sourcebook’) requires the ACD to prepare fi nancial statements for each fi nancial year which give a true and fair view of the state of affairs of the Company and of the net revenue/expense and of the net capital gains/losses on the scheme property of the Company for that year. In preparing those fi nancial statements, the ACD is required to:
• select suitable accounting policies and then apply them consistently;
• make judgements and estimates that are reasonable and prudent;
• state whether applicable United Kingdom accounting standards have been followed, subject to any material departures disclosed and explained in the fi nancial statements;
• prepare the fi nancial statements in accordance with the requirements of the IA SORP; and
• prepare the fi nancial statements on the going concern basis unless it is inappropriate to presume that the Company will continue in business.
The ACD is responsible for keeping proper accounting records which disclose with reasonable accuracy at any time the fi nancial position of the Company and to enable it to ensure that the fi nancial statements comply with the COLL Sourcebook. The ACD is also responsible for safeguarding the assets of the Company and hence for taking reasonable steps for the prevention and detection of fraud and other irregularities.
In so far as the ACD is aware:
• there is no relevant audit information of which the Company’s Auditor is unaware; and
• the ACD has taken all steps that it ought to have taken to make itself aware of any relevant audit information and to establish that the Auditor is aware of that information.
STATEMENT OF DEPOSITARY’S RESPONSIBILITIES
The Depositary is responsible for the safekeeping of all of the property of the Company (other than tangible moveable property) which is entrusted to it and for the collection of revenue that arises from that property.
It is the duty of the Depositary to take reasonable care to ensure that the Company is managed in accordance with the Financial Conduct Authority’s Collective Investment Schemes Sourcebook (COLL), as amended, the Open-Ended Investment Companies Regulations 2001 (SI 2001/1228), as amended (the ‘OEIC Regulations’), the Company’s Instrument of Incorporation and Prospectus, in relation to the pricing of, and dealings in, shares in the Company; the application of revenue of the Company; and the investment and borrowing powers applicable to the Company.
REPORT OF THE DEPOSITARYFOR THE YEAR ENDED 31 JANUARY 2016
Having carried out such procedures as we considered necessary to discharge our responsibilities as Depositary of the Company, it is our opinion, based on the information available to us and the explanations provided, that in all material respects the Company, acting through the Authorised Corporate Director:
(i) has carried out the issue, sale, redemption and cancellation, and calculation of the price of the Company’s shares and the application of the Company’s revenue in accordance with COLL and, where applicable, the OEIC Regulations, the Instrument of Incorporation and the Prospectus of the Company; and
(ii) has observed the investment and borrowing powers and restrictions applicable to the Company.
BNY MELLON TRUST & DEPOSITARY (UK) LIMITEDDepositary of Trojan Investment Funds3 May 2016

12 Trojan Investment Funds Trojan Investment Funds 13
INDEPENDENT AUDITOR’S REPORT TO THE MEMBERS OF TROJAN INVESTMENT FUNDS
We have audited the fi nancial statements of Trojan Investment Funds (‘the Company’) for the year ended 31 January 2016 which comprise the accounting policies of the Company, Statement of Total Return, Statement of Change in Net Assets Attributable to Shareholders, the Balance Sheet, the related notes and the Distribution Tables for each of the Company’s sub-funds. The fi nancial reporting framework that has been applied in their preparation is applicable law and United Kingdom Accounting Standards (United Kingdom Generally Accepted Accounting Practice) including FRS 102 ‘The Financial Reporting Standard applicable in the UK and Republic of Ireland’.
This report is made solely to the Company’s members, as a body, pursuant to Paragraph 4.5.12 of the rules of the Collective Investment Schemes Sourcebook of the Financial Conduct Authority. Our audit work has been undertaken so that we might state to the Company’s members those matters we are required to state to them in an auditor’s report and for no other purpose. To the fullest extent permitted by law, we do not accept or assume responsibility to anyone other than the Company and the Company’s members as a body, for our audit work, for this report, or for the opinions we have formed.
RESPECTIVE RESPONSIBILITIES OF THE AUTHORISED CORPORATE DIRECTOR (ACD) AND AUDITORAs explained more fully in the ACD’s responsibilities statement set out on page 10, the ACD is responsible for the preparation of the fi nancial statements and for being satisfi ed that they give a true and fair view.
Our responsibility is to audit and express an opinion on the fi nancial statements in accordance with applicable law and International Standards on Auditing (UK and Ireland). Those standards require us to comply with the Auditing Practices Board’s Ethical Standards for Auditors.
SCOPE OF THE AUDIT OF THE FINANCIAL STATEMENTSAn audit involves obtaining evidence about the amounts and disclosures in the fi nancial statements suffi cient to give reasonable assurance that the fi nancial statements are free from material misstatement, whether caused by fraud or error. This includes an assessment of:
• whether the accounting policies are appropriate to the Company’s circumstances and have been consistently applied and adequately disclosed;
• the reasonableness of signifi cant accounting estimates made by the ACD; and
• the overall presentation of the fi nancial statements.
In addition, we read all the fi nancial and non-fi nancial information in the Annual Report to identify material inconsistencies with the audited fi nancial statements and to identify any information that is apparently materially incorrect based on, or materially inconsistent with, the knowledge acquired by us in the course of performing the audit. If we become aware of any apparent material misstatements or inconsistencies we consider the implications for our report.
OPINION ON FINANCIAL STATEMENTSIn our opinion the fi nancial statements:
• give a true and fair view of the fi nancial position of the Company comprising each of its sub-funds as at 31 January 2016 and of the net revenue and the net capital gains and losses on the scheme property of the Company comprising each of its sub-funds for the year then ended; and
• have been properly prepared in accordance with United Kingdom Generally Accepted Accounting Practice.
OPINION ON OTHER MATTERS PRESCRIBED BY THE RULES OF THE COLLECTIVE INVESTMENT SCHEMES SOURCEBOOK OF THE FINANCIAL CONDUCT AUTHORITYIn our opinion:
• the fi nancial statements have been properly prepared in accordance with the Statement of Recommended Practice relating to Authorised Funds, the rules of the Collective Investment Schemes Sourcebook of the Financial Conduct Authority and the Instrument of Incorporation;
• the information given in the ACD’s report for the fi nancial year for which the fi nancial statements are prepared is consistent with the fi nancial statements;
• there is nothing to indicate that proper accounting records have not been kept or that the fi nancial statements are not in agreement with those records; and
• we have received all the information and explanations which, to the best of our knowledge and belief, are necessary for the purposes of our audit.
ERNST & YOUNG LLPStatutory AuditorLondon3 May 2016

14 Trojan Investment Funds Trojan Investment Funds 15
FINANCIAL STATEMENTSACCOUNTING POLICIESAS AT 31 JANUARY 2016
The principal accounting policies, which have been applied to the fi nancial statements of the sub-funds in both the current and prior year, are set out below. These have been applied consistently across all sub-funds unless otherwise stated in the Notes to the Financial Statements of each sub-fund.
(a) Basis of accountingThe fi nancial statements of each sub-fund have been prepared under the historical cost basis, as modifi ed by the revaluation of investments and in accordance with FRS 102 The Financial Reporting Standard applicable in the UK and Republic of Ireland including early application of Amendments to FRS 102 – Fair value hierarchy disclosures, issued in March 2016. The fi nancial statements have been prepared in accordance with the Statement of Recommended Practice (‘SORP’) for Financial Statements of Authorised Funds issued by the Investment Association (‘IA’) in May 2014. Previously, the requirements of the SORP issued by the IA in October 2010 were applied; there are no changes to the fi nancial statements of the sub-funds on adoption of the new SORP, other than minor presentational amendments and additional disclosures in notes 11 to 14.
(b) Recognition of revenueDividends on quoted equities and preference shares are recognised when the securities are quoted ex-dividend.
Distributions from collective investment schemes are recognised when the schemes are quoted ex-distribution. Equalisation returned with the distribution is deducted from the cost of the investment in the scheme and does not form part of the distributable revenue.
Reportable income from funds with ‘Reporting Fund’ status for UK tax purposes is recognised when the information is made available by the Reporting Fund.
Revenue on debt securities is accounted for on an effective yield basis.
Premiums recieved in respect of written call options, where the express purpose is to generate extra revenue, are recognised as revenue on receipt.
Rebates of annual management charges (AMC rebates) from underlying investments are accounted for on an accruals basis and are recognised as revenue, or capital in line with the allocation of the annual management charge between capital and revenue of the underlying investments.
Interest on bank and other cash deposits is recognised on an accruals basis.
(c) Treatment of stock and special dividendsThe ordinary element of stock received in lieu of cash dividends is credited to capital in the fi rst instance followed by a transfer to revenue of the cash equivalent being offered and this forms part of the distributable revenue of the Fund.
Special dividends are reviewed on a case by case basis in determining whether the dividend is to be treated as revenue or capital. Amounts recognised as revenue will form part of the distributable revenue. Amounts recognised as capital are deducted from the cost of the investment. The tax accounting treatment follows the treatment of the principal amount.
(d) Treatment of expensesAll expenses, except for those relating to the purchase and sale of investments and stamp duty reserve tax, are charged initially against revenue.
(d) Treatment of expenses (continued)Expenses incurred by tax transparent funds are recognised when the information is made available by the Reporting Fund.
(e) Allocation of revenue and expenses to multiple share classes and sub-fundsAny revenue or expense not directly attributable to a particular share class or sub-fund will normally be allocated pro-rata to the net assets of the relevant share classes and sub-funds, unless a different allocation method is more appropriate.
All share classes are ranked pari passu and have no particular rights or terms attached, including rights on winding up.
(f) TaxationCorporation tax is provided at 20% on taxable revenue, after deduction of allowable expenses.
Offshore income gains, from funds without reporting status, are liable to corporation tax at 20% and any resulting charge is deducted from capital.
Where overseas tax has been deducted from overseas revenue that tax can, in some instances, be set off against the corporation tax payable by way of double tax relief and where this is the case the offset is refl ected in the tax charge.
Deferred tax is provided using the liability method on all timing differences arising on the treatment of certain items for taxation and accounting purposes, calculated at the rate at which it is anticipated the timing differences will reverse. Deferred tax assets are recognised only when, on the basis of available evidence, it is more likely than not that there will be taxable profi ts in the future against which the deferred tax asset can be offset.
(g) Distribution policySurplus revenue after taxation, as disclosed in the fi nancial statements, after adjustment for items of a capital nature, is distributable to shareholders. Any defi cit of revenue is deducted from capital.
Interim distributions may be made at the ACD’s discretion. Final distributions are made in accordance with the COLL Sourcebook.
Distributions which have remained unclaimed by shareholders for more than six years are credited to the capital property of the sub-fund.
(h) Basis of valuation of investmentsAll investments are valued at their fair value as at 12.00 noon on 29 January 2016, being the last business day of the fi nancial year.
Quoted investments are valued at fair value which generally is the bid price, excluding any accrued interest in the case of debt securities. Accrued interest on debt securities is included in revenue.
Collective investment schemes are valued at quoted bid prices for dual priced funds and at quoted prices for single priced funds.
Open forward currency contracts are valued based on the difference between the contract value and the market value adjusted by the prevailing spot rate and swap curve.

16 Trojan Investment Funds Trojan Investment Funds 17
Financial Statements (continued) Accounting Policies (continued)As at 31 January 2016
(i) Exchange ratesThe base and functional currency of the sub-funds is Pounds Sterling. Transactions in foreign currencies are recorded in sterling at the rate ruling at the date of the transactions. Assets and liabilities expressed in foreign currencies at the end of the accounting period are translated into sterling at the exchange rate prevailing at 12.00 noon on the last business day of the fi nancial year.
(j) Dilution levyThe ACD may require a dilution levy on the purchase and redemption of shares if, in its opinion, the existing shareholders (for purchases) or remaining shareholders (for redemptions) might otherwise be adversely affected. For example, the dilution levy may be charged in the following circumstances: where the scheme property of a sub-fund is in continual decline; where a sub-fund is experiencing large levels of net purchases relative to its size; on ‘large deals’ (typically being a purchase or redemption of shares to a size exceeding 5% of the Net Asset Value of the relevant sub-fund); in any case where the ACD is of the opinion that the interests of existing or remaining shareholders require the imposition of a dilution levy.
(k) Portfolio transaction costsDirect transaction costs may consist of fees and commissions paid to agents, advisers, brokers and dealers, levies by regulatory agencies and securities exchanges, and transfer taxes and duties. Debt security investments have no separately identifi able transaction costs as they form part of the dealing spread. Indirect transaction costs may be incurred on transactions in underlying schemes but these do not form part of the direct transaction costs’ disclosures. Direct transaction costs do not include any difference between the quoted bid and offer prices or internal administrative or holding costs. The average portfolio dealing spread disclosed is the difference between the bid and offer prices of investments at the balance sheet date, including the effect of foreign exchange, expressed as a percentage of the value determined by reference to the offer price.
TROJAN FUNDACD’S REPORTFOR THE YEAR ENDED 31 JANUARY 2016
IMPORTANT INFORMATIONRefer to the ‘Important Information’ section of the Company on page 8.
INVESTMENT OBJECTIVE AND POLICYThe investment objective of the Trojan Fund (‘the Fund’) is to achieve growth in capital and income in real terms over the longer term. The Fund’s policy is to invest substantially in UK and overseas equities and fi xed interest securities, but may also invest in collective investment schemes and money market instruments.
CAPITA FINANCIAL MANAGERS LIMITEDACD of Trojan Fund3 May 2016

18 Trojan Investment Funds Trojan Investment Funds 19
TROJAN FUNDACD’s Report (continued)For the year ended 31 January 2016
INVESTMENT MANAGER’S REPORT
INVESTMENT REVIEWFor the year to 31 January 2016, the Fund produced a total return of +1.7% compared to a return of +0.4%* in the LIBID Index (total return) and -4.6%* in the FTSE All-Share Index (total return).
ASSET ALLOCATION AS AT 31 JANUARY 2016
MARKET REVIEWIn December, after another year of apparent indecisiveness, the Federal Reserve (‘the Fed’) decided to raise US interest rates for the fi rst time since 2006. Given deteriorating global economic fundamentals, it seems a strange time to be tightening monetary policy and, with hindsight, the Fed’s decision may prove too little too late. There is little prospect of interest rate rises elsewhere in the world and we would not be surprised to see the Fed’s decision reversed in 2016. Negative nominal interest rates and a fourth round of quantitative easing may be on the menu before the year ends – a policy reversal which would lead to a weaker US dollar and the potential loss of credibility for central banks.
The past two years have been boring at the headline market level, but 2016 has been anything but dull. Stock markets have had the worst start to the year for decades. Much of this shift has been blamed on the weakening Chinese economy and currency and the (not unrelated) fall in the oil price. But there is more to it than that. The fall in oil has led to tighter monetary conditions for many, pushing the US dollar higher. For years a weak dollar has provided a tide of liquidity that has buoyed asset prices and economic activity. Now that tide of liquidity is reversing and has become a tide of tightening for those that have dollar debt obligations. World trade has collapsed to near 2008 levels and corporate profi tability has fallen, which is evident from the pressures on cash fl ows. Corporate bond yields have been rising, especially in High Yield Bonds, as fi nancial conditions deteriorate. Market action underlines the point that normalising interest rates looks an unachievable target for the Fed.
* Source: Lipper as at 31 January 2016, bid to bid basis, net income reinvested at ex-dividend date, sterling terms. The indices used by the Investment Manager are for comparison purposes. No benchmark is required to be disclosed per the Prospectus.
UK Equities 12%
Net other assets (inc. UK T-Bills) 25%
Gold 10%
US Index-linked Bonds 9%
UK Index-linked Bonds 15%
Overseas Equities 29%
Headline market moves also disguise the bifurcation of the market. The decade-long overinvestment in natural resources has proven, with hindsight, to have been a bubble that has now spectacularly burst. Companies involved in extracting natural resources have been subject to a vicious bear market. In contrast to this, companies selling staples to western consumers have enjoyed an equally notable bull run. We have largely avoided the carnage of the energy and metals crash and have benefi tted from the relentless rerating upwards of consumer staple stocks. Both these trends cannot and will not go on forever. We will have to endure both absolute and relative pain when these remarkable trends reverse.
PORTFOLIOWe look for investments that we see as having not too much risk, but the scope for plenty of reward. Today, the two most important asset classes – bonds and equities – possess the opposite qualities, a great deal of potential risk for little deserved reward. When both bonds and equities are expensive, the very long duration of stocks makes them particularly vulnerable to pernicious drawdowns. The portfolio is unsurprisingly defensively positioned with a greater emphasis on return of capital than return on capital. In a world of scarce earnings growth, the market has become impatient. Investors have rushed to pay huge premiums for revenue growth and earnings dependability. Our stance has instead been one of purposeful inactivity. We are waiting for the companies we like to trade at valuations we like. As a reminder, we have a bias towards businesses that enjoy strong and predictable cash generation; demonstrate sustainably high returns on capital; and possess easy-to-understand growth opportunities. The few portfolio changes that were made were more tactical than strategic in nature.
Growing fears that the last decade of impressive emerging market economic growth is over, combined with blossoming hope that a fall in gas prices will support US disposable incomes have powerfully combined to boost the stock prices of US consumer staple companies that predominantly serve the domestic market. We therefore elected to reduce the Fund’s holdings of Altria Group, Dr Pepper Snapple Group and Reynolds American on record price-to-earnings multiples. The share price strength of the domestic US tobacco companies has been in stark contrast to the two international behemoths, Philip Morris International (‘PMI’) and British American Tobacco (‘BAT’). These businesses have wonderful emerging market franchises and so their resilient operating power is being somewhat obfuscated by overseas currency weakness. The long-term growth profi le of PMI and BAT looks better than that of either Altria Group or Reynolds American, yet the valuations of the former are more modest. We therefore increased the Fund’s holdings of both PMI and BAT. BAT also owns 42% of Reynolds American so this holding effectively gives us a discounted way of owning Reynolds American.
Persistent stock price weakness in American Express Company also allowed us to add to our one fi nancial holding. American Express Company is fi nding corporate life tougher as competitor credit card issuers, fi nally restored to health, compete more vigorously for affl uent Americans’ share of wallet. We believe the ‘American Express’ brand is strong enough to ensure the company’s growth will remain attractive and the Fund’s economic interest in this unique fi nancial franchise will grow thanks to the Board’s commitment to large and sensibly priced share repurchases. In contrast, the decision by the board of Becton, Dickinson and Company to sanction an expensive acquisition at the expense of a buyback programme and a pristine balance sheet encouraged us to take profi ts from this longstanding holding.
We also further reduced the Fund’s interest in Microsoft Corporation on valuation concerns. Microsoft’s earnings per share have been stagnant for a number of years, but its share price has raced ahead meaning there is little margin for future disappointment. Coincidentally, we also
20 Trojan Investment Funds Trojan Investment Funds 21
TROJAN FUNDACD’s Report (continued)Investment Manager’s Report (continued)For the year ended 31 January 2016
PORTFOLIO (continued)reduced the holding of the Fund’s other technology investment, Sage Group. For years Sage Group has been perceived to be a low growth, lumbering technological relic, but a remarkable turnaround in investor perceptions has seen it become one of the FTSE’s most richly valued constituents.
We disposed of the holding of Newcrest Mining in its entirety. Subsequent to our initial investment, Newcrest’s management decided to launch a hostile bid for Lihir Mining. Hindsight has proved that they overpaid for the business and Newcrest is unlikely to make a cumulative positive return on this ill-gotten venture. The resulting balance sheet is over-indebted and more capital needs to be sunk into Lihir and other mines to replace extracted ounces of gold. We prefer to hold companies that pay us to own them and we could have been waiting years before a dividend cheque lands on the doormat. We also reduced the holdings in Better Capital 2012. This has been a disappointing investment as the manager has proven to be overconfi dent and too stretched. We take some solace in the knowledge that the holdings were only ever an immaterial percentage of net asset value.
Finally, during the summer sell off we acquired a new holding in Procter & Gamble Company (‘P&G’), which was trading on a dividend yield of 3.8%, the highest since the late 1980s. P&G has underperformed its peers in recent years but is undergoing a major reorganisation, divesting non-core brands and cutting excess costs. P&G owns an enviable portfolio of household brands including Pampers, Pantene, Gillette and Fairy. Its 59 years of consecutive dividend growth and $10 billion of reliable free cash fl ow fi ts our more discerning investment criteria.
OUTLOOKZero interest rates intendedly pull and unintendedly push. They are designed to pull forward in time the consumption of goods and accelerate asset price returns. Central banks have certainly had unquestionable success with the latter and only qualifi ed success with the former. However, the unintended consequences of zero interest rates are beginning to reveal themselves. Zero interest rates have unintentionally pushed infl ation backward in time. Low interest rates force many savers to actually defer consumption as they have to save even more to maintain prevailing interest income. Low interest rates also allow the marginal and ineffi cient incumbent producers to struggle on, whilst emboldening new entrants and disrupters to enter the competitive fi eld. Zero interest rates reduce the rate of return hurdle for corporations. Industry disruptors like Amazon.com, Uber and Airbnb are able to invest aggressively as fi nancial markets are willing to accept very low short-term rates of return. The combined result is insuffi cient demand facing excess supply. The drip of zero interest rates has been a placebo for demand; saline for the over-borrowed and ecstasy for the ambitious. The loose monetary policy forced upon the world by central bankers to fi ght defl ation has, in fact contributed to it.
If zero interest rates stretch the imagination then negative interest rates blow the mind. But interest rates in many parts of the world have breached the zero bound. Logically, interest rates should always be positive. People should prefer a euro or a dollar today to something less than a euro or a dollar in the future. Negative interest rates are a tax on cash and savers can literally avoid negative interest rates by sticking their savings under the mattress… or better still swapping it for gold. We are worried that central bankers rather than accepting that their past prescriptions have been the wrong response will instead reach out for even more unorthodox ‘solutions’. Respected commentators are increasingly calling on central banks to fund fi scal splurges. The strategist, James Montier of GMO, says “this sounds a little like Rumpelstiltskin spinning straw into gold” and it is.
In an environment of near universally overvalued asset markets it is likely to be easier to navigate the post-market falls then to avoid the falls themselves. This is because with both equities and bonds looking vulnerable, traditional asset diversifi cation may not protect to the same extent that it has in the past.
2016 will hopefully present the long-awaited opportunity to exploit equity market declines. Yet for the time being we remain circumspect. There are indications that corporate profi tability has peaked for this cycle, along with ultra-low corporate fi nancing costs which have supported dividends and share buybacks. There remains a chasm between the prices of individual stocks that we would wish to own and our own appraisal of their fair values. Thankfully that chasm has begun to close and we look forward to making the step towards being more fully invested in equities.
TROY ASSET MANAGEMENT LIMITEDInvestment Manager22 February 2016

22 Trojan Investment Funds Trojan Investment Funds 23
TROJAN FUND ACD’s Report (continued)FUND INFORMATION
SYNTHETIC RISK AND REWARD INDICATOR
Typically lower rewards Typically higher rewards
Lower risk Higher risk
1 2 3 4 5 6 7
This indicator shows how much a fund has risen and fallen in the past, and therefore how much a fund’s returns have varied. It is a measure of a fund’s volatility. The higher a fund’s past volatility the higher the number on the scale and the greater the risk that investors in that fund may have made losses as well as gains. The lowest number on the scale does not mean that a fund is risk free.
The Fund has been classed as 4 because its volatility has been measured as average.
This indicator is based on historical data and may not be a reliable indication of the future risk profi le of this Fund.
The risk and reward profi le shown is not guaranteed to remain the same and may shift over time.
RISK WARNINGAn investment in an open-ended investment company should be regarded as a medium to long term investment. Investors should be aware that the price of shares and the income from them can fall as well as rise and investors may not receive back the full amount invested. Past performance is not a guide to future performance. Investments denominated in currencies other than the base currency are subject to fl uctuation in exchange rates, which can be favourable or unfavourable.
COMPARATIVE TABLESWhere the Fund has signifi cant investment in collective investment schemes, the operating charges take account of the ongoing charges incurred in the underlying schemes, calculated as the expense value of such holdings at the period end weighted against the net asset value of the share class at that date.
31.01.16 31.01.15 31.01.14 (p/share) (p/share) (p/share)
‘O’ Income shares
Change in net assets per share
Opening net asset value per share 215.81 192.91 206.84
Return before operating charges* 5.73 26.25 (10.43)
Operating charges (2.25) (2.17) (2.17)
Return after operating charges 3.48 24.08 (12.60)
Distributions on income shares (0.96) (1.18) (1.33)
Closing net asset value per share 218.33 215.81 192.91
* after direct transaction costs 0.03 0.03 0.06
Performance
Return after charges 1.61% 12.48% (6.09)%
Other Information
Closing net asset value (£’000) 993,387 931,135 815,816
Closing number of shares 454,988,441 431,459,461 422,901,754
Operating charges 1.05% 1.06% 1.07%
Direct transaction costs 0.01% 0.01% 0.03%
Prices
Highest share price 218.90 219.54 214.17
Lowest share price 204.75 192.36 193.57

24 Trojan Investment Funds Trojan Investment Funds 25
TROJAN FUND ACD’s Report (continued)Fund Information (continued)
COMPARATIVE TABLES (continued) 31.01.16 31.01.15 31.01.14 (p/share) (p/share) (p/share)
‘O’ Accumulation shares
Change in net assets per share
Opening net asset value per share 259.30 230.45 245.45
Return before operating charges* 6.94 31.44 (12.42)
Operating charges (2.71) (2.59) (2.58)
Return after operating charges 4.23 28.85 (15.00)
Closing net asset value per share 263.53 259.30 230.45
Retained distributions on accumulation shares 1.16 1.41 1.58
* after direct transaction costs 0.03 0.03 0.08
Performance
Return after charges 1.63% 12.52% (6.11)%
Other Information
Closing net asset value (£’000) 913,015 819,541 672,465
Closing number of shares 346,456,587 316,053,423 291,799,000
Operating charges 1.05% 1.06% 1.07%
Direct transaction costs 0.01% 0.01% 0.03%
Prices
Highest share price 263.86 263.47 254.16
Lowest share price 246.81 229.84 230.72
31.01.16 31.01.15 31.01.14 (p/share) (p/share) (p/share)
‘I’ Income shares
Change in net assets per share
Opening net asset value per share 215.18 192.61 206.56
Return before operating charges* 5.70 26.17 (10.37)
Operating charges (3.30) (3.18) (3.20)
Return after operating charges 2.40 22.99 (13.57)
Distributions on income shares (0.15) (0.42) (0.38)
Closing net asset value per share 217.43 215.18 192.61
* after direct transaction costs 0.03 0.03 0.06
Performance
Return after charges 1.12% 11.94% (6.57)%
Other Information
Closing net asset value (£’000) 44,110 52,393 64,375
Closing number of shares 20,286,562 24,348,146 33,423,370
Operating charges 1.55% 1.56% 1.57%
Direct transaction costs 0.01% 0.01% 0.03%
Prices
Highest share price 217.71 218.67 213.70
Lowest share price 204.08 192.08 192.83

26 Trojan Investment Funds Trojan Investment Funds 27
TROJAN FUND ACD’s Report (continued)Fund Information (continued)
COMPARATIVE TABLES (continued) 31.01.16 31.01.15 31.01.14 (p/share) (p/share) (p/share)
‘I’ Accumulation shares
Change in net assets per share
Opening net asset value per share 250.64 223.87 239.64
Return before operating charges* 6.62 30.47 (12.08)
Operating charges (3.85) (3.70) (3.69)
Return after operating charges 2.77 26.77 (15.77)
Closing net asset value per share 253.41 250.64 223.87
Retained distributions on accumulation shares 0.17 0.49 0.44
* after direct transaction costs 0.03 0.03 0.07
Performance
Return after charges 1.11% 11.96% (6.58)%
Other Information
Closing net asset value (£’000) 171,951 260,781 359,773
Closing number of shares 67,855,755 104,045,339 160,704,220
Operating charges 1.55% 1.56% 1.57%
Direct transaction costs 0.01% 0.01% 0.03%
Prices
Highest share price 253.73 254.70 247.93
Lowest share price 237.85 223.27 224.13
31.01.16 31.01.15 31.01.14 (p/share) (p/share) (p/share)
‘S’ Income shares (Registered charities only)
Change in net assets per share
Opening net asset value per share 215.97 193.04 206.99
Return before operating charges* 5.75 26.28 (10.44)
Operating charges (1.72) (1.66) (1.67)
Return after operating charges 4.03 24.62 (12.11)
Distributions on income shares (1.50) (1.69) (1.84)
Closing net asset value per share 218.50 215.97 193.04
* after direct transaction costs 0.03 0.03 0.06
Performance
Return after charges 1.87% 12.75% (5.85)%
Other Information
Closing net asset value (£’000) 275,078 270,954 248,096
Closing number of shares 125,896,087 125,460,276 128,520,585
Operating charges 0.80% 0.81% 0.82%
Direct transaction costs 0.01% 0.01% 0.03%
Prices
Highest share price 219.33 219.96 214.42
Lowest share price 204.94 192.49 193.95

28 Trojan Investment Funds Trojan Investment Funds 29
TROJAN FUND ACD’s Report (continued)Fund Information (continued)
COMPARATIVE TABLES (continued) 31.01.16 31.01.15 31.01.14 (p/share) (p/share) (p/share)
‘S’ Accumulation shares (Registered charities only)
Change in net assets per share
Opening net asset value per share 264.52 234.50 249.14
Return before operating charges* 7.08 32.05 (12.63)
Operating charges (2.11) (2.03) (2.01)
Return after operating charges 4.97 30.02 (14.64)
Closing net asset value per share 269.49 264.52 234.50
Retained distributions on accumulation shares 1.84 2.06 2.22
* after direct transaction costs 0.03 0.03 0.08
Performance
Return after charges 1.88% 12.80% (5.88)%
Other Information
Closing net asset value (£’000) 53,872 72,267 59,102
Closing number of shares 19,990,263 27,320,197 25,203,456
Operating charges 0.80% 0.81% 0.82%
Direct transaction costs 0.01% 0.01% 0.03%
Prices
Highest share price 269.82 268.76 258.08
Lowest share price 252.13 233.88 234.77
31.01.16 31.01.151
(p/share) (p/share)
‘Z’ Income shares (this class is only available for investment
by the Trojan Feeder Fund (Ireland))
Change in net assets per share
Opening net asset value per share 105.99 100.00
Return before operating charges* 2.84 6.72
Operating charges (0.06) (0.03)
Return after operating charges 2.78 6.69
Distributions on income shares (1.53) (0.70)
Closing net asset value per share 107.24 105.99
* after direct transaction costs 0.01 0.01
Performance
Return after charges 2.62% 6.69%
Other Information
Closing net asset value (£’000) 131,943 124,689
Closing number of shares 123,038,218 117,642,277
Operating charges 0.05% 0.06%2
Direct transaction costs 0.01% 0.01%2
Prices
Highest share price 108.04 108.30
Lowest share price 100.63 98.43
1 From 23 June 2014. 2 Annualised fi gure due to share class launched less than 1 year.

30 Trojan Investment Funds Trojan Investment Funds 31
TROJAN FUND ACD’s Report (continued)Fund Information (continued)
COMPARATIVE TABLES (continued) 31.01.16 31.01.151
(p/share) (p/share)
‘Z’ Accumulation shares (this class is only available for investment
by the Trojan Feeder Fund (Ireland))
Change in net assets per share
Opening net asset value per share 106.68 100.00
Return before operating charges* 2.96 6.72
Operating charges (0.06) (0.04)
Return after operating charges 2.90 6.68
Closing net asset value per share 109.58 106.68
Retained distributions on accumulation shares 1.65 0.69
* after direct transaction costs 0.01 0.01
Performance
Return after charges 2.72% 6.68%
Other Information
Closing net asset value (£’000) – –
Closing number of shares 250 250
Operating charges 0.05% 0.06%2
Direct transaction costs 0.01% 0.01%2
Prices
Highest share price 109.60 108.36
Lowest share price 102.12 98.50
1 From 23 June 2014. 2 Annualised fi gure due to share class launched less than 1 year.
FUND PERFORMANCE TO 31 JANUARY 2016 (%)
1 year 3 years 5 years
Trojan Fund 1.68 7.03 25.74
The performance of the Fund is based on the published price per ‘O’ income share with income reinvested.
The performance of the Fund disclosed in the above table may differ from the ‘Return after charges’ disclosed in the Comparative Table due to above performance being calculated on the latest published price prior to the year end, rather than the year end return after operating charges.
Details of the distributions per share for the year are shown in the Distribution Table on pages 50 to 52.

32 Trojan Investment Funds Trojan Investment Funds 33
TROJAN FUNDACD’s Report (continued)PORTFOLIO STATEMENTAS AT 31 JANUARY 2016
Holding Portfolio of Investments Value 31.01.16 £’000 %
DEBT SECURITIES – 42.55% (31.01.15 – 39.23%) £89,000,000 Treasury 0% 22.02.16 88,975 3.44 £125,000,000 Treasury 0% 29.02.16 124,812 4.83 £130,000,000 Treasury 0% 25.04.16 129,727 5.02 £130,000,000 Treasury 0% 25.07.16 129,648 5.02 £106,498,500 Treasury 0.125% index-linked 2024 123,505 4.78 £90,447,000 Treasury 1.875% index-linked 2022 137,464 5.32 £33,604,000 Treasury 2.5% index-linked 2020 120,776 4.68 US$235,616,000 US Treasury 0.125% Infl ation Protected Securities 2022 170,652 6.61 US$97,562,000 US Treasury 0.625% Infl ation Protected Securities 2021 73,608 2.85
TOTAL DEBT SECURITIES 1,099,167 42.55
EQUITIES – 41.53% (31.01.15 – 41.41%) UNITED KINGDOM – 12.33% (31.01.15 – 12.52%) 9,354,011 Better Capital 2009 7,109 0.27 16,825,000 Better Capital 2012 6,646 0.26 3,124,977 British American Tobacco 120,327 4.66 1,653,368 Diageo 30,943 1.20 2,591,613 GlaxoSmithKline 36,892 1.43 1,784,852 Mithras Investment Trust 2,517 0.10 12,119,734 Sage Group (The) 74,052 2.86 1,321,000 Unilever 39,993 1.55
TOTAL UNITED KINGDOM 318,479 12.33
CONTINENTAL EUROPE – 1.54% (31.01.15 – 1.57%) 780,600 Nestlé 39,890 1.54
AUSTRALIA – 0.00% (31.01.15 – 0.81%) – –
NORTH AMERICA – 27.66% (31.01.15 – 26.51%) 1,031,300 Agnico-Eagle Mines 20,828 0.81 1,773,764 Altria Group 73,927 2.86 800,000 American Express Company 29,562 1.14 500,000 Becton, Dickinson and Company 49,703 1.92 340 Berkshire Hathaway 45,100 1.75
Holding Portfolio of Investments Value 31.01.16 £’000 %
NORTH AMERICA – 27.66% (31.01.15 – 26.51%) (continued) 2,384,500 Coca-Cola Company (The) 70,944 2.75 907,000 Colgate-Palmolive Company 41,219 1.60 880,000 Dr Pepper Snapple Group 56,627 2.19 2,907,808 Imperial Oil 61,959 2.40 2,400,000 Microsoft Corporation 87,326 3.38 1,500,000 Philip Morris International 93,387 3.61 530,000 Procter & Gamble Company (The) 29,573 1.14 1,604,456 Reynolds American 54,421 2.11
TOTAL NORTH AMERICA 714,576 27.66
TOTAL EQUITIES 1,072,945 41.53
COMMODITIES – 10.24% (31.01.15 – 11.31%) 129,531 BlackRock Gold and General* 729 0.03 814,850 ETFS Physical Swiss Gold* 61,828 2.39 2,726,600 Gold Bullion Securities* 201,966 7.82
TOTAL COMMODITIES 264,523 10.24
FORWARD CURRENCY CONTRACTS – (0.99)% (31.01.15 – (0.71)%) US$(874,265,000) Vs £585,470,143 (expiry 21.03.16) (25,640) (0.99)
Portfolio of investments# 2,410,995 93.33 Net other assets 172,361 6.67 Net assets 2,583,356 100.00
The investments have been valued in accordance with note (h) of the Accounting Policies and are ordinary shares listed on a regulated market unless stated otherwise.
* Collective investment scheme. # Includes investment liabilities.

34 Trojan Investment Funds Trojan Investment Funds 35
TROJAN FUND ACD’s Report (continued)SUMMARY OF MATERIAL PORTFOLIO CHANGESFOR THE YEAR ENDED 31 JANUARY 2016
Total purchases for the year £’000 (note 13) 246,680
Purchases Cost £’000
Treasury 2% 22.01.16 175,177 Philip Morris International 29,101 Procter & Gamble Company (The) 23,706 American Express Company 15,088 British American Tobacco 3,608 In addition to above, purchases of £1,496,626 thousand were made in short term investments during the year.
Total sales for the year £’000 (note 13) 300,828
Sales Proceeds £’000
Treasury 2% 22.01.16 174,000 Dr Pepper Snapple Group 31,941 Reynolds American 27,458 Microsoft Corporation 22,088 Newcrest Mining 20,692 Becton, Dickinson and Company 8,637 Sage Group (The) 7,466 Altria Group 5,012 Better Capital 2012 2,949 Mithras Investment Trust 585
In addition to above, sales of £1,387,533 thousand were made in short term investments during the year.
The summary of material portfolio changes represents all of the purchases and sales during the year.
FINANCIAL STATEMENTSSTATEMENT OF TOTAL RETURNFOR THE YEAR ENDED 31 JANUARY 2016
31.01.16 31.01.15 Notes £’000 £’000 £’000 £’000
Income: Net capital gains 2 28,558 261,659
Revenue 3 39,648 39,528
Expenses 4 (24,889) (24,186)
Net revenue before taxation 14,759 15,342
Taxation 5 (2,401) (2,385)
Net revenue after taxation 12,358 12,957
Total return before distributions 40,916 274,616
Distributions 6 (12,645) (13,418)
Change in net assets attributable to shareholders from investment activities 28,271 261,198
STATEMENT OF CHANGE IN NET ASSETS ATTRIBUTABLE TO SHAREHOLDERSFOR THE YEAR ENDED 31 JANUARY 2016 31.01.16 31.01.15 £’000 £’000 £’000 £’000
Opening net assets attributable to shareholders 2,531,761 2,219,627
Amounts receivable on issue of shares 220,814 272,742
Amounts payable on cancellation of shares (202,129) (227,298)
18,685 45,444
Stamp duty reserve tax, net of refund – 79
Change in net assets attributable to shareholders from investment activities 28,271 261,198
Retained distributions on Accumulation shares 4,639 5,413
Closing net assets attributable to shareholders 2,583,356 2,531,761

36 Trojan Investment Funds Trojan Investment Funds 37
TROJAN FUNDFinancial Statements (continued)BALANCE SHEETAS AT 31 JANUARY 2016
Notes 31.01.16 31.01.15 £’000 £’000
ASSETS
Fixed assets Investments 2,436,635 2,327,876
Current assets Debtors 7 13,783 11,067Cash and bank balances 168,754 249,724
Total assets 2,619,172 2,588,667
LIABILITIES
Investment liabilities (25,640) (17,966)
Creditors Bank overdrafts – (1,481)Distribution payable (2,850) (2,506)Other creditors 8 (7,326) (34,953)
Total liabilities (35,816) (56,906)
Net assets attributable to shareholders 2,583,356 2,531,761
NOTES TO THE FINANCIAL STATEMENTSAS AT 31 JANUARY 2016
1. ACCOUNTING POLICIES
The accounting policies described on pages 14 to 16 have been applied to the fi nancial statements of the Fund in the current and prior year.
31.01.16 31.01.15 £’000 £’000
2. NET CAPITAL GAINS
The net capital gains during the year comprise: Non-derivative securities 52,844 297,100Forward currency contracts (16,343) (35,946)Transaction charges (1) –AMC rebates from underlying investments 205 69Currency (losses)/gains (8,147) 436 Net capital gains 28,558 261,659
3. REVENUE
Non-taxable dividends 29,771 28,490Unfranked interest 9,640 10,828Bank interest 237 210 Total revenue 39,648 39,528
4. EXPENSES
Payable to the ACD, associates of the ACD and agents of either of them: Annual Management Charge 24,346 23,647Legal and professional fees 18 20Printing costs 8 9Registration fees 85 61
24,457 23,737Payable to the Depositary, associates of the Depositary and agents of either of them: Depositary’s fees 332 318Safe custody and other bank charges 78 100
410 418

38 Trojan Investment Funds Trojan Investment Funds 39
TROJAN FUND Financial Statements (continued) Notes to the Financial Statements (continued)As at 31 January 2016
31.01.16 31.01.15 £’000 £’000
4. EXPENSES (continued)
Other expenses: Fees paid to auditor – audit 9 9
– tax services 3 3Publication costs 8 8Legal and professional fees – 3Postage and distribution costs 2 8
22 31 Total expenses 24,889 24,186
The Investment Management fees and expenses (plus VAT thereon) for providing investment management services are paid by the ACD out of its remuneration.
31.01.16 31.01.15 £’000 £’000
5. TAXATION
a) Analysis of charge for the year Corporation tax at 20% – –Overseas tax 2,401 2,385 Current tax charge 2,401 2,385 Deferred tax – origination and reversal of timing differences (note 5c) – – Total taxation (note 5b) 2,401 2,385 b) Factors affecting the tax charge for the yearThe tax assessed for the year differs from the standard rate of corporation tax in the UK for an authorised fund (20%) (31.01.15 : 20%). The difference is explained below.
31.01.16 31.01.15 £’000 £’000
Net revenue before taxation 14,759 15,342
Corporation tax at 20% 2,952 3,068
31.01.16 31.01.15 £’000 £’000
5. TAXATION (continued)
Effects of: Non-taxable dividends (5,954) (5,698)RPI movement on UK index-linked gilts (1,035) (782)AMC rebates taken to capital 41 14Unutilised excess management expenses 3,996 3,398
Corporation tax charge – – Overseas tax 2,401 2,385 Total tax charge (note 5a) 2,401 2,385
c) Deferred taxAt the year end there is a potential deferred tax asset of £16,753 thousand (31.01.15 : £12,757 thousand) in relation to surplus management expenses. It is unlikely that the Fund will generate suffi cient taxable profi ts in the future to utilise this amount and, therefore, no deferred tax asset has been recognised in the current or prior year.
6. FINANCE COSTS
DistributionsThe distributions take account of revenue received on the issue of shares and revenue deducted on cancellations of shares, and comprise:
31.01.16 31.01.15 £’000 £’000
Interim 8,536 9,758Final 4,198 3,670
12,734 13,428 Add: Revenue deducted on cancellation of shares 423 460Deduct: Revenue received on issue of shares (512) (470) Net distributions for the year 12,645 13,418 Details of the distributions per share are set out in the table on pages 50 to 52.

40 Trojan Investment Funds Trojan Investment Funds 41
TROJAN FUND Financial Statements (continued) Notes to the Financial Statements (continued)As at 31 January 2016
31.01.16 31.01.15 £’000 £’000
6. FINANCE COSTS (continued)
Distributions represented by: Net revenue after taxation 12,358 12,957Allocations to capital: Revenue defi cit – ‘I’ Income shares 51 64
– ‘I’ Accumulation shares 199 321
250 385
Equalisation on conversions* 38 76Balance brought forward – –Balance carried forward (1) – Net distributions for the year 12,645 13,418
* Where an investor converts to a class with a higher income yield, the investor will receive an equalisation as if they had held the new class throughout the period from the last distribution to the conversion date. The yield differential at the point of conversion is an equalisation which will be offset by capital erosion for the converted investor.
31.01.16 31.01.15 £’000 £’000
7. DEBTORS
Amounts receivable for issue of shares 5,416 8,870 Sales awaiting settlement 5,661 – Accrued revenue: Non-taxable dividends 551 257 Unfranked interest 1,279 1,268 AMC rebates from underlying investments 15 17 Bank interest 22 28
1,867 1,570 Prepaid expenses 5 6 Taxation recoverable: Overseas withholding tax 727 514 Stamp duty reserve tax refund 107 107
834 621 Total debtors 13,783 11,067
31.01.16 31.01.15 £’000 £’000
8. CREDITORS
Amounts payable for cancellation of shares 5,190 2,826 Purchases awaiting settlement – 29,976 Accrued expenses: Amounts payable to the ACD, associates of the ACD and agents of either of them: Annual Management Charge 2,075 2,083 Legal and professional fees 2 2 Printing costs 4 5 Registration fees 8 3
2,089 2,093Amounts payable to the Depositary, associates of the Depositary and agents of either of them: Depositary’s fees 28 29 Safe custody and other bank charges 6 15
34 44 Other expenses 13 14 Total creditors 7,326 34,953
9. RELATED PARTY TRANSACTIONS
Annual Management Charge and legal and professional fees payable to Capita Financial Managers Limited (‘the ACD’), registration fees payable to Capita Financial Administrators Limited and printing costs payable to Capita Sinclair Henderson Limited (both companies are associates of the ACD) are disclosed in note 4 and amounts due at the year end are disclosed in note 8.
The aggregate monies received by the ACD through the issue and cancellation of shares are disclosed in the Statement of Change in Net Assets Attributable to Shareholders on page 35 and amounts due at the year end are disclosed in notes 7 and 8.
Capita Financial Managers Limited and its associates (including other authorised investment funds managed by Capita Financial Managers Limited) held 8,958,384 (31.01.15 : 6,783,769) of the Fund’s shares at the balance sheet date.

42 Trojan Investment Funds Trojan Investment Funds 43
TROJAN FUND Financial Statements (continued) Notes to the Financial Statements (continued)As at 31 January 2016
10. CONTINGENT LIABILITIES AND COMMITMENTS
There are no contingent liabilities or unrecorded outstanding commitments (31.01.15 : none).
11. SHAREHOLDERS’ FUNDS
‘O’ ‘O’ ‘I’ Income Accumulation Income
Annual Management Charge 1.00% 1.00% 1.50%
Opening shares in issue 431,459,461 316,053,423 24,348,146Issues 36,996,519 25,128,781 912,138Cancellations (15,189,536) (17,616,070) (2,260,608)Conversions 1,721,997 22,890,453 (2,713,114) Closing shares in issue 454,988,441 346,456,587 20,286,562
‘I’ ‘S’ ‘S’ Accumulation Income Accumulation
Annual Management Charge 1.50% 0.75% 0.75%
Opening shares in issue 104,045,339 125,460,276 27,320,197 Issues 688,278 12,075,133 2,519,971 Cancellations (12,941,154) (11,990,334) (10,593,232)Conversions (23,936,708) 351,012 743,327 Closing shares in issue 67,855,755 125,896,087 19,990,263
‘Z’ ‘Z’ Income Accumulation
Annual Management Charge 0.00% 0.00%
Opening shares in issue 117,642,277 250 Issues 39,243,065 – Cancellations (33,847,124) – Conversions – – Closing shares in issue 123,038,218 250
12. RISK MANAGEMENT POLICIES
In pursuing the investment objective a number of fi nancial instruments are held which may comprise securities and other investments, cash balances and debtors and creditors that arise directly from operations. Derivatives, such as futures or forward currency contracts, may be utilised for hedging purposes.
12. RISK MANAGEMENT POLICIES (continued)
The main risks from the Fund’s holding of fi nancial instruments, together with the ACD’s policy for managing these risks, are set out below:
The ACD has in place a Risk Management Policy and Procedures Document (‘RMPPD’) that sets out the risks that may impact a fund and how the ACD seeks, where appropriate, to manage, monitor and mitigate those risks, and in particular those risks associated with the use of derivatives. The RMPPD sets out both the framework and the risk mitigations operated by the ACD in managing the identifi ed risks of the fund. The ACD requires that the appointed Investment Manager to the fund has in place its own governance structure, policies and procedures that are commensurate with its regulatory obligations and the risks posed by the fund managed.
i. Credit riskCredit risk is the risk that a counterparty may be unable or unwilling to make a payment or fulfi l contractual obligations. This may be in terms of an actual default or by deterioration in a counterparty’s credit quality.
Certain transactions in securities that the Fund enters into expose it to the risk that the counterparty will not deliver the investment for a purchase, or cash for a sale after the Fund has fulfi lled its obligations. As part of its due diligence process, the ACD undertakes a review of the controls operated over counterparties by the Investment Manager, including initial and ongoing due diligence and business volumes placed with each counterparty. In cases which are dependent on the counterparty settling at the transaction’s maturity date, the ACD has policies in place which set out the minimum credit quality expected of a market counterparty or deposit taker at the outset of the transaction.
The bond investments held are exposed to credit risk which refl ects the ability of the issuer to meet its obligations. The ACD monitors the credit rating of bond holdings.
Credit Quality 31.01.16 31.01.15 % %
Investment grade debt securities 24.24 32.89 Non-rated debt securities* 18.31 6.34 Other investments 50.78 52.01 Net other assets 6.67 8.76 100.00 100.00 * UK treasury bills
ii. Interest rate riskInterest rate risk is the risk that the value of the Fund’s investments will fl uctuate as a result of interest rate changes. The value of fi xed interest securities may be affected by changes in interest rates, either globally or locally. Changes in the rate of return in one asset class may infl uence the valuation basis of other classes. The amount of revenue receivable from fl oating rate investments and bank balances or payable on bank overdrafts will be affected by fl uctuations in interest rates.

44 Trojan Investment Funds Trojan Investment Funds 45
TROJAN FUND Financial Statements (continued) Notes to the Financial Statements (continued)As at 31 January 2016
12. RISK MANAGEMENT POLICIES (continued)
ii. Interest rate risk (continued) Investment in collective investment schemes exposes the Fund to indirect interest rate risk to the extent that they invest in interest bearing securities, the returns from which will be affected by fl uctuations in interest rates.
The table below shows the direct interest rate risk profi le:
31.01.16 31.01.15 £’000 £’000
Floating rate assets: US dollars 310,501 235,635 Pounds sterling 484,258 637,829
794,759 873,464Floating rate liabilities: Pounds sterling – (1,481)
Fixed rate assets: Singapore dollars – 104,956 Pounds sterling 473,162 264,669
473,162 369,625Assets on which interest is not paid: Australian dollars – 20,483 Canadian dollars 82,787 92,275 Swiss francs 39,891 40,271 US dollars 896,944 864,461 Pounds sterling 917,099 740,201
1,936,721 1,757,691Liabilities on which interest is not paid: US dollars (611,110) (430,079) Pounds sterling (10,176) (37,459)
(621,286) (467,538) Net assets 2,583,356 2,531,761
The fl oating rate fi nancial assets and liabilities comprise bank balances and bank overdraft positions which earn or pay interest at rates linked to the Bank of England base rate or its international equivalents and index-linked securites that earn interest at rates adjusted by changes in the UK Retail Prices Index (RPI) or its international equivalent.
Fixed rate fi nancial assets held in the current year is 0% UK government bond and prior year are 0% UK and Singapore government bonds held for short term investment purposes.
12. RISK MANAGEMENT POLICIES (continued)
iii. Foreign currency riskForeign currency risk is the risk that the sterling value of investments will fl uctuate as a result of exchange rate movements. Assets denominated in currencies other than sterling will provide direct exposure to currency risk as a consequence of the movement in foreign exchange rates when calculating the sterling equivalent value. Forward currency contracts are employed by the Investment Manager, where deemed appropriate, to mitigate the foreign exchange risk. Investment in collective investment schemes may provide indirect exposure to currency risk as a consequence of the movement in foreign exchange rates.
The table below shows the direct foreign currency risk profi le:
31.01.16 31.01.16 31.01.16 Gross £’000 Hedged £’000 Net £’000
Currency: Canadian dollars 82,787 – 82,787 Swiss francs 39,891 – 39,891 US dollars 1,207,445 (611,110) 596,335 1,330,123 (611,110) 719,013
Pounds sterling 1,278,873 585,470 1,864,343 Net assets 2,608,996 (25,640) 2,583,356
31.01.15 31.01.15 31.01.15 Gross £’000 Hedged £’000 Net £’000
Currency: Australian dollars 20,483 – 20,483 Canadian dollars 92,275 – 92,275 Singapore dollars 104,956 – 104,956 Swiss francs 40,271 – 40,271 US dollars 1,100,096 (430,078) 670,018 1,358,081 (430,078) 928,003
Pounds sterling 1,191,646 412,112 1,603,758 Net assets 2,549,727 (17,966) 2,531,761
iv. Liquidity riskThe main liability of the Fund is the cancellation of any shares that investors want to sell. Investments may have to be sold to fund such cancellations should insuffi cient cash be held at the bank to meet this obligation.
To reduce liquidity risk the Investment Manager will ensure that a substantial portion of the Fund’s assets consist of cash and readily realisable investments.
All fi nancial liabilities are payable in one year or less, or on demand.

46 Trojan Investment Funds Trojan Investment Funds 47
TROJAN FUND Financial Statements (continued) Notes to the Financial Statements (continued)As at 31 January 2016
12. RISK MANAGEMENT POLICIES (continued)
v. Market price riskMarket price risk is the risk that the value of the Fund’s fi nancial instruments will fl uctuate as a result of changes in market prices caused by factors other than interest rate or foreign currency movement. Market price risk arises primarily from uncertainty about the future prices of fi nancial instruments that the Fund holds.
Market price risk represents the potential loss the Fund may suffer through holding market positions in the face of price movements. The Fund’s investment portfolio is exposed to price fl uctuations, which are monitored by the ACD in pursuance of the investment objective and policy. The risk is generally regarded as consisting of two elements – stock specifi c risk and market risk. Adhering to investment guidelines and avoiding excessive exposure to one particular issuer can limit stock specifi c risk. Subject to compliance with the investment objective, spreading exposure across a broad range of global stocks can mitigate market risk.
vi. Fair value of fi nancial assets and fi nancial liabilitiesThere is no material difference between the value of the fi nancial assets and liabilities, as shown in the balance sheet, and their fair value.
vii. DerivativesThe Investment Manager has the power to manage exposure to currency movements by using forward currency contracts. Details of the holdings of such instruments, the net exposure to foreign currencies as at the balance sheet date, and details of the total losses on forward currency contracts during the year are set out in the Portfolio Statement, note 12ii and note 2, respectively.
The intention in using forward currency contracts is, where deemed appropriate, to reduce the risk profi le of the Fund by managing the exposure of the Fund to currency exchange risk and leave the Fund primarily exposed to the underlying market risk of overseas investments. Therefore, where the value of overseas investments falls due to currency movements, the forward currency contract generates a gain and vice versa. The Investment Manager will only engage in currency hedging when they consider such hedging to be in the interests of Effi cient Portfolio Management.
13. PORTFOLIO TRANSACTION COSTS
Purchases /sales before Gross purchases transaction costs Commissions Taxes /net sales £’000 £’000 £’000 £’00031.01.16 Ordinary shares 71,387 98 18 71,503 Debt securities 175,177 – – 175,177 Purchases total 246,564 98 18 246,680 Transaction cost % of purchases total 0.04% 0.01% Transaction cost %
of average NAV – – Ordinary shares 127,010 (180) (2) 126,828 Debt securities 174,000 – – 174,000 Sales total 301,010 (180) (2) 300,828 Transaction cost %
of sales total 0.06% – Transaction cost %
of average NAV 0.01% – Average portfolio dealing spread at 31.01.16 is 0.26% (31.01.15 : 0.17%).

48 Trojan Investment Funds Trojan Investment Funds 49
TROJAN FUND Financial Statements (continued) Notes to the Financial Statements (continued)As at 31 January 2016
13. PORTFOLIO TRANSACTION COSTS (continued)
Purchases /sales before Gross purchases transaction costs Commissions Taxes /net sales £’000 £’000 £’000 £’00031.01.15 Ordinary shares 26,621 29 92 26,742 Purchases total 26,621 29 92 26,742 Transaction cost % of purchases total 0.11% 0.35% Transaction cost %
of average NAV – – Ordinary shares 207,237 (199) (4) 207,034 Sales total 207,237 (199) (4) 207,034 Transaction cost %
of sales total 0.10% – Transaction cost %
of average NAV 0.01% –
14. FAIR VALUE HIERARCHY
Investments are categorised into the following levels based on their fair value measurement:
Level 1: The unadjusted quoted price in an active market for identical assets that the Fund can access at the year end date.
Level 2: Inputs other than quoted prices included within Level 1 that are observable (i.e. developed using market data) for the asset or liability, either directly or indirectly.
Level 3: Inputs are unobservable (i.e. for which market data is unavailable) for the asset.
31.01.16 31.01.15Valuation technique Assets Liabilities Assets Liabilities £’000 £’000 £’000 £’000 Level 1 2,155,841 – 1,908,360 – Level 2 280,794 (25,640) 419,516 (17,966)Level 3 – – – – 2,436,635 (25,640) 2,327,876 (17,966) Total portfolio of investments 2,410,995 2,309,910
Level 1 includes £1,099,167 thousand of assets which are debt securities (31.01.15 : £888,409 thousand).

50 Trojan Investment Funds Trojan Investment Funds 51
TROJAN FUNDFinancial Statements (continued)DISTRIBUTION TABLEFOR THE YEAR ENDED 31 JANUARY 2016 – IN PENCE PER SHARE
EQUALISATIONEqualisation applies only to shares purchased during the distribution period (Group 2 shares –the applicable distribution periods for each distribution are shown below). It represents the accrued revenue included in the purchase price of the shares. After averaging it is returned with the distribution as a capital repayment. It is not liable to Income Tax but must be deducted from the cost of the shares for Capital Gains Tax purposes.
Group 2 Interim Final
FromTo
01.02.1531.07.15
01.08.1531.01.16
‘O’ Income shares
Interim NetRevenue
Equalisation Paid30.09.15
Paid30.09.14
Group 1Group 2
0.6731 0.2470
– 0.4261
0.6731 0.6731
0.9181 0.9181
Final NetRevenue
Equalisation Payable31.03.16
Paid31.03.15
Group 1Group 2
0.2902 0.0589
– 0.2313
0.2902 0.2902
0.2608 0.2608
‘O’ Accumulation shares
Interim NetRevenue
Equalisation Allocated30.09.15
Allocated30.09.14
Group 1Group 2
0.8102 0.2635
– 0.5467
0.8102 0.8102
1.0959 1.0959
Final NetRevenue
Equalisation Allocation31.03.16
Allocated31.03.15
Group 1Group 2
0.3495 0.0837
– 0.2658
0.3495 0.3495
0.3129 0.3129
‘I’ Income shares
Interim NetRevenue
Equalisation Paid30.09.15
Paid30.09.14
Group 1Group 2
0.1503 –
– 0.1503
0.1503 0.1503
0.4227 0.4227
Final NetRevenue
Equalisation Payable31.03.16
Paid31.03.15
Group 1Group 2
– –
– –
– –
– –
‘I’ Accumulation shares
Interim NetRevenue
Equalisation Allocated30.09.15
Allocated30.09.14
Group 1Group 2
0.1666 –
– 0.1666
0.1666 0.1666
0.4894 0.4894
Final NetRevenue
Equalisation Allocation31.03.16
Allocated31.03.15
Group 1Group 2
– –
– –
– –
– –
‘S’ Income shares (Registered charities only)
Interim NetRevenue
Equalisation Paid30.09.15
Paid30.09.14
Group 1Group 2
0.9406 0.2605
– 0.6801
0.9406 0.9406
1.1688 1.1688
Final NetRevenue
Equalisation Payable31.03.16
Paid31.03.15
Group 1Group 2
0.5589 0.2441
– 0.3148
0.5589 0.5589
0.5237 0.5237

52 Trojan Investment Funds Trojan Investment Funds 53
TROJAN FUNDFinancial Statements (continued)Distribution Table (continued)
‘S’ Accumulation shares (Registered charities only)
Interim NetRevenue
Equalisation Allocated30.09.15
Allocated30.09.14
Group 1Group 2
1.1529 0.2104
– 0.9425
1.1529 1.1529
1.4193 1.4193
Final NetRevenue
Equalisation Allocation31.03.16
Allocated31.03.15
Group 1Group 2
0.6857 0.6857
– 0.0000
0.6857 0.6857
0.6406 0.6406
‘Z’ Income shares (this class is only available for investment by the
Trojan Feeder Fund (Ireland)
Interim NetRevenue
Equalisation Paid30.09.15
Paid30.09.14
Group 1Group 2
0.8547 0.3074
– 0.5473
0.8547 0.8547
0.0875 0.0875
Final NetRevenue
Equalisation Payable31.03.16
Paid31.03.15
Group 1Group 2
0.6713 0.3423
– 0.3290
0.6713 0.6713
0.6152 0.6152
‘Z’ Accumulation shares (this class is only available for investment by the
Trojan Feeder Fund (Ireland))
Interim NetRevenue
Equalisation Allocated30.09.15
Allocated30.09.14
Group 1Group 2
0.8640 0.8640
– 0.0000
0.8640 0.8640
0.1560 0.1560
Final NetRevenue
Equalisation Allocation31.03.16
Allocated31.03.15
Group 1Group 2
0.7880 0.7880
– 0.0000
0.7880 0.7880
0.5320 0.5320
TROJAN ETHICAL INCOME FUNDACD’S REPORTFOR THE PERIOD FROM 6 JANUARY 2016 TO 31 JANUARY 2016
IMPORTANT INFORMATIONRefer to the ‘Important Information’ section of the Company on page 8.
INVESTMENT OBJECTIVE AND POLICYThe investment objective of the Trojan Ethical Income Fund (‘the Fund’) is to seek to provide income with the potential for capital growth in the medium term. The Fund’s policy is to invest substantially in UK and overseas equities. It may also invest in fi xed interest securities, indices, deposits, collective investment schemes and money market instruments.
The Fund will invest in accordance with the parameters of the Fund’s ethical investment criteria, which consider ethical issues in relation to: fossil fuels, pornography, tobacco and certain types of armaments. A document setting out the Fund’s ethical investment criteria is available on the ACD’s website.
The Investment Manager may employ derivatives for the purposes of Effi cient Portfolio Management.
The Investment Manager operates screening whereby potential investments are screened against the Fund’s ethical investment criteria, the details of which are included in the document on the ACD’s website setting out the Fund’s ethical investment criteria.
Where an investment is identifi ed as not meeting the Fund’s ethical investment criteria, the Investment Manager will seek to sell the investment within the following 90 days. The prices at which such an investment can be sold in these circumstances may be lower than the prices that might otherwise have been realised for the investment if such a sale was not required.
CAPITA FINANCIAL MANAGERS LIMITEDACD of Trojan Ethical Income Fund3 May 2016

54 Trojan Investment Funds Trojan Investment Funds 55
TROJAN ETHICAL INCOME FUNDACD’s Report (continued)For the period from 6 January 2016 to 31 January 2016
INVESTMENT MANAGER’S REPORT
INVESTMENT REVIEWThe Fund was launched on 6 January 2016, with the fi rst valuation on 7 January 2016, and as such was only in existence for the fi nal 17 business days of the reporting period.
For the period 7 January 2016 to 31 January 2016 the Fund’s ‘O’ Income shares produced a total return of -1.1%. Over the same period the FTSE All-Share Index produced a total return of -0.5%*, while the total return on cash (LIBID Index) amounted to +0.0%*. At 31 January 2016 the Fund size was £25 million. A distribution of 0.0705p will be paid to holders of ‘O’ Income shares on 31 March which represents the total accrued income over the 17 days since the Fund’s launch. This dividend is not indicative of the income generating potential of the Fund and should not be used to make assumptions about any future pay-outs.
MARKET REVIEWIn early December, the President of the European Central Bank unveiled a new package of measures to tackle anaemic eurozone infl ation that included a cut in the fl oor for interest rates and an expansion of the Quantitative Easing programme. Markets were left disappointed, with many expecting more radical measures to address Mr. Draghi’s bleak assessment of euro area prospects: “The economic recovery in the euro area continues to be dampened by subdued growth prospects in emerging markets and moderate global trade.”
In a seemingly contradictory move, made only a few days later, the US Federal Reserve (‘the Fed’) voted to raise interest rates for the fi rst time in nearly a decade. The initial market reaction was muted and continued uncertainty about the confused global growth picture ensured a volatile end to 2015 for global stocks.
China continued to attract column inches as markets remained fi xated on lower growth expectations. The 2015 forecast growth rate of 6.8% (which many market commentators believe to be overstated) compares unfavorably with the average c.10% level seen over the prior 10 years. This lower expected growth rate, coupled with China’s attempts to become less dependent on investment and more reliant on consumption has sent ripples through commodity markets and the oil price has seen lows of around $26 per barrel.
Such economic uncertainty made for a very volatile start to the year and a challenging environment in which to launch a new fund.
PORTFOLIOThe current positioning of the Fund refl ects this turbulent environment with a focus on sustainable, cash generative companies with strong balance sheets and persistently high returns on equity. It is these companies that are best positioned to deliver a growing stream of equity income over the coming years.
Just shy of a quarter of the portfolio’s assets are invested in high quality consumer goods franchises which have historically proven to be resilient in times of market weakness. A similar percentage is invested in a wide range of well diversifi ed fi nancial stocks including
* Source: Bloomberg as at 31 January 2016. The indices are used by the Investment Manager for comparison purposes. No benchmark is required to be disclosed per the Prospectus.
property and non-life insurance companies. The utility holdings within the portfolio include two infrastructure investment vehicles as well as listed UK utilities. This sector represents the Fund’s largest exposure to UK revenues in what is otherwise a portfolio of largely global revenues.
12% of the Fund’s assets are invested in US listed stocks and 8.7% in Swiss companies. The Fund is able to invest up to 30% of assets in overseas equities. This allocation to overseas equities is not a call on the relative merits of other markets in relation to the UK, but a bottom up refl ection of where high quality companies and attractive valuations can be found. 9.2% of assets are currently held as cash (versus a maximum possible cash holding of 20%) in order to provide insulation against the worst of the current market volatility and to allow additional investments to be made when valuations reach appropriate levels. As at 31 January 2016 there were 40 equity holdings in the portfolio. The sector weightings as at the end of January 2016 are shown below.
SECTOR ALLOCATION AS AT 31 JANUARY 2016
This portfolio currently has a trailing yield of 3.4%, well in excess of the Fund’s minimum yield of 3%.
OUTLOOK2016 has started ominously. The S&P 500 recorded its worst start to a year on record, falling 6% in the fi rst week of 2016. In China, the Shanghai Composite has shed -21.0% in January. Closer to home, the FTSE 100 kicked off 2016 with its worst fi rst week since 2000. The weakness in each of these markets is a refl ection of both domestic and global uncertainties combined with challenging valuations.
Central bankers continue to rail against the spectre of defl ation. Sweden, Switzerland, Denmark, the eurozone and most recently Japan have all introduced some form of negative interest rate policy and as of February 2016, over $6 trillion of bonds within the JPM Global Government Bond Index traded with negative yields. The impact of negative interest rate policies reach beyond the real economy to signifi cantly impact investor behavior and entice investors towards higher yielding equities. It seems that in such an environment investor sentiment will continue to be heavily intertwined with the actions and language of central bankers, most notably the Fed. Following the Chairwoman’s admission that “Financial conditions in the US have recently become less supportive of growth”, the direction of US interest rate policy remains notably uncertain.
Consumer Goods 23%
Consumer Services 8%
Financials 24% Net other assets 9%
Health Care 11%
Industrials 7%
Technology 3%
Telecommunications 7%
Utilities 8%

56 Trojan Investment Funds Trojan Investment Funds 57
FUND INFORMATION
TROJAN ETHICAL INCOME FUNDACD’s Report (continued)Investment Manager’s Report (continued)For the period from 6 January 2016 to 31 January 2016
OUTLOOK (continued)The spate of dividend cuts witnessed in 2015 is an important reminder that with equity yield comes equity risk. After several years of robust growth, thirteen FTSE 100 companies have announced dividend cuts in the last 12 months and we would be surprised if there were not further high profi le announcements to come. Capita’s Q1 2016 UK Dividend Monitor Report forecasts 2016 will see the fi rst decline in underlying UK dividends since 2010 with major dividend cuts and company takeovers set to impact the 2016 payout by at least £4.7 billion. The Fund’s ethical investment criteria and Troy’s focus on cash fl ow and strong balance sheets should insulate the Fund from what may well continue to be a challenging dividend environment for investors.
Finally, 2016 will also see British voters head to the polls on 23 June to vote on whether to remain part of a reformed EU or leave altogether. We are not in a position to speculate as to the outcome of any referendum but given 44% of UK exports go to the EU and the EU is the source of 46% of the stock of inward foreign direct investment in the UK, both UK equities and sterling can be expected to be the subject of heightened volatility in the months ahead.
When faced with such a great dispersion of possible outcomes we feel even less inclined to try and make forecasts than usual. Instead, we continue to focus our attention, time and efforts on constructing a portfolio of low volatility, high quality equities that can deliver high through-the-cycle returns on invested capital and deliver a growing stream of dividend income.
TROY ASSET MANAGEMENT LIMITEDInvestment Manager23 February 2016
SYNTHETIC RISK AND REWARD INDICATOR
Typically lower rewards Typically higher rewards
Lower risk Higher risk
1 2 3 4 5 6 7
This indicator shows how much a fund has risen and fallen in the past, and therefore how much a fund’s returns have varied. It is a measure of a fund’s volatility. The higher a fund’s past volatility the higher the number on the scale and the greater the risk that investors in that fund may have made losses as well as gains. The lowest number on the scale does not mean that a fund is risk free.
The Fund has been classed as 5 because its volatility has been measured as above average.
As the Fund has less than 5 years’ price history, this calculation incorporates the volatility of an appropriate benchmark index.
The risk and reward profi le shown is not guaranteed to remain the same and may shift over time.
RISK WARNINGAn investment in an open-ended investment company should be regarded as a medium to long term investment. Investors should be aware that the price of shares and the income from them can fall as well as rise and investors may not receive back the full amount invested. Past performance is not a guide to future performance. Investments denominated in currencies other than the base currency are subject to fl uctuation in exchange rates, which can be favourable or unfavourable.

58 Trojan Investment Funds Trojan Investment Funds 59
TROJAN ETHICAL INCOME FUND ACD’s Report (continued)Fund Information (continued)
COMPARATIVE TABLES 31.01.161
(p/share)
‘O’ Accumulation shares
Change in net assets per share
Opening net asset value per share 100.00
Return before operating charges* (1.01)
Operating charges (0.16)
Return after operating charges (1.17)
Closing net asset value per share 98.83
Retained distributions on accumulation shares 0.11
* after direct transaction costs 0.03
Performance
Return after charges (1.17)%
Other Information
Closing net asset value (£’000) –
Closing number of shares 250
Operating charges 1.23%2
Direct transaction costs 0.51%2
Prices
Highest share price 100.00
Lowest share price 96.22
1 From 6 January 2016. 2 Annualised fi gure due to share class launched less than 1 year.
31.01.161
(p/share)
‘O’ Income shares
Change in net assets per share
Opening net asset value per share 100.00
Return before operating charges* (0.98)
Operating charges (0.14)
Return after operating charges (1.12)
Distributions on income shares (0.07)
Closing net asset value per share 98.81
* after direct transaction costs 0.03
Performance
Return after charges (1.12)%
Other Information
Closing net asset value (£’000) 25,271
Closing number of shares 25,574,324
Operating charges 1.23%2
Direct transaction costs 0.51%2
Prices
Highest share price 100.00
Lowest share price 96.25
1 From 6 January 2016. 2 Annualised fi gure due to share class launched less than 1 year.

60 Trojan Investment Funds Trojan Investment Funds 61
TROJAN ETHICAL INCOME FUND ACD’s Report (continued)Fund Information (continued)
COMPARATIVE TABLES (continued) 31.01.161
(p/share)
‘I’ Accumulation shares
Change in net assets per share
Opening net asset value per share 100.00
Return before operating charges* (0.93)
Operating charges (0.16)
Return after operating charges (1.09)
Closing net asset value per share 98.91
Retained distributions on accumulation shares 0.08
* after direct transaction costs 0.03
Performance
Return after charges (1.09)%
Other Information
Closing net asset value (£’000) –
Closing number of shares 250
Operating charges 1.73%2
Direct transaction costs 0.51%2
Prices
Highest share price 100.00
Lowest share price 96.28
1 From 6 January 2016. 2 Annualised fi gure due to share class launched less than 1 year.
31.01.161
(p/share)
‘I’ Income shares
Change in net assets per share
Opening net asset value per share 100.00
Return before operating charges* (1.01)
Operating charges (0.16)
Return after operating charges (1.17)
Distributions on income shares (0.07)
Closing net asset value per share 98.76
* after direct transaction costs 0.03
Performance
Return after charges (1.17)%
Other Information
Closing net asset value (£’000) –
Closing number of shares 250
Operating charges 1.73%2
Direct transaction costs 0.51%2
Prices
Highest share price 100.00
Lowest share price 96.22
1 From 6 January 2016. 2 Annualised fi gure due to share class launched less than 1 year.

62 Trojan Investment Funds Trojan Investment Funds 63
TROJAN ETHICAL INCOME FUND ACD’s Report (continued)Fund Information (continued)
COMPARATIVE TABLES (continued) 31.01.161
(p/share)
‘S’ Accumulation shares (Registered charities only)
Change in net assets per share
Opening net asset value per share 100.00
Return before operating charges* (1.01)
Operating charges (0.16)
Return after operating charges (1.17)
Closing net asset value per share 98.83
Retained distributions on accumulation shares 0.03
* after direct transaction costs 0.03
Performance
Return after charges (1.17)%
Other Information
Closing net asset value (£’000) –
Closing number of shares 250
Operating charges 0.98%2
Direct transaction costs 0.51%2
Prices
Highest share price 100.00
Lowest share price 96.23
1 From 6 January 2016. 2 Annualised fi gure due to share class launched less than 1 year.
31.01.161
(p/share)
‘S’ Income shares (Registered charities only)
Change in net assets per share
Opening net asset value per share 100.00
Return before operating charges* (1.01)
Operating charges (0.16)
Return after operating charges (1.17)
Distributions on income shares (0.03)
Closing net asset value per share 98.80
* after direct transaction costs 0.03
Performance
Return after charges (1.17)%
Other Information
Closing net asset value (£’000) –
Closing number of shares 250
Operating charges 0.98%2
Direct transaction costs 0.51%2
Prices
Highest share price 100.00
Lowest share price 96.23
1 From 6 January 2016. 2 Annualised fi gure due to share class launched less than 1 year.
FUND PERFORMANCEAs the Fund has less than one year’s performance, there is insuffi cient data to provide a useful indication of past performance.
Details of the distributions per share for the year are shown in the Distribution Table on pages 79 and 80.

64 Trojan Investment Funds Trojan Investment Funds 65
TROJAN ETHICAL INCOME FUNDACD’s Report (continued)PORTFOLIO STATEMENTAS AT 31 JANUARY 2016
Holding Portfolio of Investments Value 31.01.16 £’000 %
UNITED KINGDOM – 68.73% INDUSTRIALS – 6.51% INDUSTRIAL TRANSPORTATION – 3.86% 215,000 Royal Mail Group 976 3.86
SUPPORT SERVICES – 2.65% 57,000 Experian 669 2.65
TOTAL INDUSTRIALS 1,645 6.51
CONSUMER GOODS – 13.01% FOOD PRODUCERS – 9.57% 67,261 A.G BARR 356 1.41 60,000 Dairy Crest Group 382 1.51 27,500 Diageo 515 2.04 38,500 Unilever 1,165 4.61 2,418 9.57
HOUSEHOLD GOODS & HOME CONSTRUCTION – 3.44% 131,575 PZ Cussons 343 1.36 8,500 Reckitt Benckiser Group 526 2.08 869 3.44
TOTAL CONSUMER GOODS 3,287 13.01
HEALTH CARE – 6.14% PHARMACEUTICALS & BIOTECHNOLOGY – 6.14% 20,275 AstraZeneca 898 3.55 46,000 GlaxoSmithKline 655 2.59
TOTAL HEALTH CARE 1,553 6.14
CONSUMER SERVICES – 8.23% GENERAL RETAILERS – 2.15% 30,000 WH Smith 544 2.15
Holding Portfolio of Investments Value 31.01.16 £’000 %
TRAVEL & LEISURE – 2.85% 60,250 Compass Group 719 2.85
MEDIA – 3.23% 77,000 Sky 816 3.23
TOTAL CONSUMER SERVICES 2,079 8.23
TELECOMMUNICATIONS – 4.42% MOBILE TELECOMMUNICATIONS – 4.42% 35,000 Inmarsat 372 1.47 340,000 Vodafone Group 745 2.95
TOTAL TELECOMMUNICATIONS 1,117 4.42
UTILITIES – 7.78% GAS, WATER & MULTIUTILITIES – 7.78% 95,000 National Grid 922 3.65 60,000 Pennon Group 528 2.09 23,750 Severn Trent 515 2.04
TOTAL UTILITIES 1,965 7.78
FINANCIALS – 19.99% BANKS – 5.44% 100,000 HSBC Holdings 484 1.92 1,380,000 Lloyds Banking Group 890 3.52 1,374 5.44
NON-LIFE INSURANCE – 5.72% 37,500 Hiscox 368 1.45 70,000 Jardine Lloyd Thompson Group 578 2.29 80,000 Lancashire Holdings 500 1.98 1,446 5.72

66 Trojan Investment Funds Trojan Investment Funds 67
TROJAN ETHICAL INCOME FUND ACD’s Report (continued)Portfolio Statement (continued)As at 31 January 2016
Holding Portfolio of Investments Value 31.01.16 £’000 %
REAL ESTATE INVESTMENT TRUSTS – 6.24% 450,000 Assura 243 0.96 66,500 Land Securities Group 722 2.86 315,000 LondonMetric Property 506 2.00 98,269 Primary Health Properties 105 0.42 1,576 6.24
FINANCIAL SERVICES – 1.59% 564 Rathbone Brothers 13 0.05 14,500 Schroders 388 1.54 401 1.59
EQUITY INVESTMENT INSTRUMENTS – 1.00% 150,000 3i Infrastructure 255 1.00
TOTAL FINANCIALS 5,052 19.99
TECHNOLOGY – 2.65% SOFTWARE & COMPUTER SERVICES – 2.65% 110,000 Sage Group (The) 672 2.65
TOTAL UNITED KINGDOM 17,370 68.73
CONTINENTAL EUROPE – 10.14% 270,000 International Public Partnerships 377 1.49 16,750 Nestlé 856 3.39 17,750 Novartis 951 3.76 2,100 Roche Holding 378 1.50
TOTAL CONTINENTAL EUROPE 2,562 10.14
NORTH AMERICA – 11.90% 17,500 American Express Company 647 2.56 22,000 Coca-Cola Company (The) 655 2.60 15,000 Colgate-Palmolive Company 682 2.70 7,250 Procter & Gamble Company (The) 405 1.60 18,000 Verizon Communications 617 2.44
TOTAL NORTH AMERICA 3,006 11.90
Value 31.01.16 £’000 %
Portfolio of investments 22,938 90.77 Net other assets 2,333 9.23 Net assets 25,271 100.00
The investments have been valued in accordance with note (h) of the Accounting Policies and are ordinary shares listed on a regulated market.

68 Trojan Investment Funds Trojan Investment Funds 69
TROJAN ETHICAL INCOME FUND ACD’s Report (continued)SUMMARY OF MATERIAL PORTFOLIO CHANGESFOR THE PERIOD FROM 6 JANUARY 2016 TO 31 JANUARY 2016
Total purchases for the period £’000 (note 13) 23,001
Major purchases Cost £’000
Unilever 1,081Novartis 1,017Lloyds Banking Group 973Royal Mail Group 954National Grid 905AstraZeneca 895Sky 848Nestlé 819American Express Company 767Vodafone Group 764Land Securities Group 759Compass Group 687Jardine Lloyd Thompson Group 649Colgate-Palmolive Company 649Sage Group (The) 642Experian 641GlaxoSmithKline 632Coca-Cola Company (The) 630Verizon Communications 561WH Smith 520
The summary of material portfolio changes represents the 20 largest purchases during the period.
There were no sales during the period.
FINANCIAL STATEMENTSSTATEMENT OF TOTAL RETURNFOR THE PERIOD FROM 6 JANUARY 2016 TO 31 JANUARY 2016
31.01.161
Notes £’000 £’000
Income: Net capital losses 2 (87)
Revenue 3 35
Expenses 4 (30)
Net revenue before taxation 5
Taxation 5 (1)
Net revenue after taxation 4
Total return before distributions (83)
Distributions 6 (18)
Change in net assets attributable to shareholders from investment activities (101)
STATEMENT OF CHANGE IN NET ASSETS ATTRIBUTABLE TO SHAREHOLDERSFOR THE PERIOD FROM 6 JANUARY 2016 TO 31 JANUARY 2016 31.01.161
£’000
Opening net assets attributableto shareholders –
Amounts receivable on issue of shares 25,372
Change in net assets attributable to shareholders from investment activities (101)
Closing net assets attributable to shareholders 25,271
1 No comparative fi gures are presented for the Statement of Total Return, Statement of Change in Net Assets Attributable to Shareholders and the related notes as this is the Fund’s fi rst reporting period; the Fund launched on 6 January 2016.

70 Trojan Investment Funds Trojan Investment Funds 71
TROJAN ETHICAL INCOME FUNDFinancial Statements (continued)BALANCE SHEETAS AT 31 JANUARY 2016
Notes 31.01.161
£’000
ASSETS
Fixed assets Investments 22,938
Current assets Debtors 7 34Cash and bank balances 2,349
Total assets 25,321
LIABILITIES
Creditors Distribution payable 6 (18)Other creditors 8 (32)
Total liabilities (50)
Net assets attributable to shareholders 25,271
1 No comparative fi gures are presented for the Balance Sheet and the related notes as this is the Fund’s fi rst reporting period; the Fund launched on 6 January 2016.
NOTES TO THE FINANCIAL STATEMENTSAS AT 31 JANUARY 2016
1. ACCOUNTING POLICIES
The accounting policies described on pages 14 to 16 have been applied to the fi nancial statements of the Fund in the current and prior year. The additional accounting policy described below has also been applied to this Fund.
(a) Distribution policyThe Annual Management Charge is transferred to capital for distribution purposes in line with the Fund’s investment objective. This will increase the amount of revenue available for distribution; however, will erode capital and may constrain capital growth.
For the period from 06.01.16 to 31.01.16 £’000
2. NET CAPITAL LOSSES
The net capital losses during the period comprise:
Non-derivative securities (62)Transaction charges (2)Currency losses (23) Net capital losses (87)
3. REVENUE
Non-taxable dividends 35
4. EXPENSES
Payable to the ACD, associates of the ACD and agents of either of them: Annual Management Charge 14Legal and professional fees 1Printing costs 4Registration fees 1
20Payable to the Depositary, associates of the Depositary and agents of either of them: Depositary’s fees 1

72 Trojan Investment Funds Trojan Investment Funds 73
TROJAN ETHICAL INCOME FUND Financial Statements (continued) Notes to the Financial Statements (continued)As at 31 January 2016
For the period from 06.01.16 to 31.01.16 £’000
4. EXPENSES (continued)
Other expenses:
Fees paid to auditor – audit 6– tax services 3
9 Total expenses 30
The Investment Management fees and expenses (plus VAT thereon) for providing investment management services are paid by the ACD out of its remuneration.
For the period from 06.01.16 to 31.01.16 £’000
5. TAXATION
a) Analysis of charge for the periodCorporation tax at 20% –Overseas tax 1 Current tax charge 1 Deferred tax –origination and reversal of timing differences (note 5c) – Total taxation (note 5b) 1 b) Factors affecting the tax charge for the periodThe tax assessed for the period differs from the standard rate of corporation tax in the UK for an authorised fund (20%). The difference is explained below.
For the period from 06.01.16 to 31.01.16 £’000
Net revenue before taxation 5
Corporation tax at 20% 1
For the period from 06.01.16 to 31.01.16 £’000
5. TAXATION (continued)
Effects of: Non-taxable dividends (7)Unutilised excess management expenses 6 Corporation tax charge –
Overseas tax 1 Total tax charge (note 5a) 1
c) Deferred tax At the period end there is a potential deferred tax asset of £6 thousand in relation to surplus management expenses. It is unlikely that the Fund will generate suffi cient taxable profi ts in the future to utilise this amount and, therefore, no deferred tax asset has been recognised in the current period.
For the period from 06.01.16 to 31.01.16 £’000
6. FINANCE COSTS
DistributionsThe distributions comprise:
Final 18 Net distributions for the period 18
Total fi nance costs 18
Details of the distributions per share are set out in the table on pages 79 and 80.

74 Trojan Investment Funds Trojan Investment Funds 75
TROJAN ETHICAL INCOME FUND Financial Statements (continued) Notes to the Financial Statements (continued)As at 31 January 2016
For the period from 06.01.16 to 31.01.16 £’000
6. FINANCE COSTS (continued)
Distributions represented by: Net revenue after taxation 4Allocations to capital: Annual Management Charge 14 Net distributions for the period 18
31.01.16 £’000
7. DEBTORS
Accrued revenue: Non-taxable dividends 34
8. CREDITORS
Accrued expenses: Amounts payable to the ACD, associates of the ACD and agents of either of them: Annual Management Charge 14 Legal and professional fees 1 Printing costs 4
19Amounts payable to the Depositary, associates of the Depositary and agents of either of them: Depositary’s fees 1 Transaction charges 2
3 Other expenses 10 Total creditors 32
9. RELATED PARTY TRANSACTIONS
Annual Management Charge and legal and professional fees payable to Capita Financial Managers Limited (‘the ACD’), registration fees payable to Capita Financial Administrators Limited and printing costs payable to Capita Sinclair Henderson Limited (both companies are associates of the ACD) are disclosed in note 4 and amounts due at the year end are disclosed in note 8.
9. RELATED PARTY TRANSACTIONS (continued)
The aggregate monies received by the ACD through the issue of shares are disclosed in the Statement of Change in Net Assets Attributable to Shareholders on page 69.
A shareholder may be able to exercise signifi cant infl uence over the fi nancial and operating policies of the Fund and as such is deemed to be a related party. At the balance sheet date one shareholder held 100% of the shares in issue of the Fund.
10. CONTINGENT LIABILITIES AND COMMITMENTS
There are no contingent liabilities or unrecorded outstanding commitments.
11. SHAREHOLDERS’ FUNDS
‘O’ ‘O’ ‘I’ Accumulation Income Accumulation
Annual Management Charge 1.00% 1.00% 1.50%Opening shares in issue – – –Issues 250 25,574,324 250 Cancellations – – –Conversions – – – Closing shares in issue 250 25,574,324 250
‘I’ ‘S’ ‘S’ Income Accumulation Income
Annual Management Charge 1.50% 0.75% 0.75%
Opening shares in issue – – –Issues 250 250 250 Cancellations – – –Conversions – – – Closing shares in issue 250 250 250
12. RISK MANAGEMENT POLICIES
In pursuing the investment objective a number of fi nancial instruments are held which may comprise securities and other investments, cash balances and debtors and creditors that arise directly from operations. Derivatives, such as futures or forward currency contracts, may be utilised for hedging purposes.

76 Trojan Investment Funds Trojan Investment Funds 77
TROJAN ETHICAL INCOME FUND Financial Statements (continued) Notes to the Financial Statements (continued)As at 31 January 2016
12. RISK MANAGEMENT POLICIES (continued)
The main risks from the Fund’s holding of fi nancial instruments, together with the ACD’s policy for managing these risks, are set out below:
The ACD has in place a Risk Management Policy and Procedures Document (‘RMPPD’) that sets out the risks that may impact a fund and how the ACD seeks, where appropriate, to manage, monitor and mitigate those risks, and in particular those risks associated with the use of derivatives. The RMPPD sets out both the framework and the risk mitigations operated by the ACD in managing the identifi ed risks of the fund. The ACD requires that the appointed Investment Manager to the fund has in place its own governance structure, policies and procedures that are commensurate with its regulatory obligations and the risks posed by the fund managed.
i. Credit riskCredit risk is the risk that a counterparty may be unable or unwilling to make a payment or fulfi l contractual obligations. This may be in terms of an actual default or by deterioration in a counterparty’s credit quality.
Certain transactions in securities that the Fund enters into expose it to the risk that the counterparty will not deliver the investment for a purchase, or cash for a sale after the Fund has fulfi lled its obligations. As part of its due diligence process, the ACD undertakes a review of the controls operated over counterparties by the Investment Manager, including initial and ongoing due diligence and business volumes placed with each counterparty. In cases which are dependent on the counterparty settling at the transaction’s maturity date, the ACD has policies in place which set out the minimum credit quality expected of a market counterparty or deposit taker at the outset of the transaction.
ii. Foreign currency riskForeign currency risk is the risk that the sterling value of investments will fl uctuate as a result of exchange rate movements. Assets denominated in currencies other than sterling will provide direct exposure to currency risk as a consequence of the movement in foreign exchange rates when calculating the sterling equivalent value.
Where the Fund invests in non-sterling assets, the Investment Manager allows for the foreign currency risk when considering whether to invest and does not seek to hedge this risk.
The table below shows the direct foreign currency risk profi le:
31.01.16 £’000
Currency: Swiss francs 2,185 US dollars 3,010 5,195
Pounds sterling 20,076 Net assets 25,271
12. RISK MANAGEMENT POLICIES (continued)
iii. Liquidity riskThe main liability of the Fund is the cancellation of any shares that investors want to sell. Investments may have to be sold to fund such cancellations should insuffi cient cash be held at the bank to meet this obligation.
To reduce liquidity risk the Investment Manager will ensure that a substantial portion of the Fund’s assets consist of cash and readily realisable investments.
All fi nancial liabilities are payable in one year or less, or on demand.
iv. Market price riskMarket price risk is the risk that the value of the Fund’s fi nancial instruments will fl uctuate as a result of changes in market prices caused by factors other than interest rate or foreign currency movement. Market price risk arises primarily from uncertainty about the future prices of fi nancial instruments that the Fund holds.
Market price risk represents the potential loss the Fund may suffer through holding market positions in the face of price movements. The Fund’s investment portfolio is exposed to price fl uctuations, which are monitored by the ACD in pursuance of the investment objective and policy. The risk is generally regarded as consisting of two elements – stock specifi c risk and market risk. Adhering to investment guidelines and avoiding excessive exposure to one particular issuer can limit stock specifi c risk. Subject to compliance with the investment objective, spreading exposure across a broad range of global stocks can mitigate market risk.
v. Fair value of fi nancial assets and fi nancial liabilitiesThere is no material difference between the value of the fi nancial assets and liabilities, as shown in the balance sheet, and their fair value.
vi. DerivativesThe Fund held no derivatives during the current period.
13. PORTFOLIO TRANSACTION COSTS
Purchases before Gross transaction costs Commissions Taxes purchases £’000 £’000 £’000 £’00031.01.16 Ordinary shares 22,889 34 78 23,001 Purchases total 22,889 34 78 23,001 Transaction cost %
of purchases total 0.15% 0.34% Transaction cost %
of average NAV 0.13% 0.31% There were no sales in the period.
Average portfolio dealing spread at 31.01.16 is 0.12%.

78 Trojan Investment Funds Trojan Investment Funds 79
TROJAN ETHICAL INCOME FUND Financial Statements (continued) Notes to the Financial Statements (continued)As at 31 January 2016
14. FAIR VALUE HIERARCHY
Investments are categorised into the following levels based on their fair value measurement:
Level 1: The unadjusted quoted price in an active market for identical assets that the Fund can access at the year end date.
Level 2: Inputs other than quoted prices included within Level 1 that are observable (i.e. developed using market data) for the asset, either directly or indirectly.
Level 3: Inputs are unobservable (i.e. for which market data is unavailable) for the asset.
31.01.16Valuation technique Assets £’000 Level 1 22,938Level 2 –Level 3 – Total portfolio of investments 22,938
DISTRIBUTION TABLEFOR THE PERIOD FROM 6 JANUARY 2016 TO 31 JANUARY 2016 – IN PENCE PER SHARE
EQUALISATIONEqualisation applies only to shares purchased during the distribution period (Group 2 shares –the applicable distribution periods for each distribution are shown below). It represents the accrued revenue included in the purchase price of the shares. After averaging it is returned with the distribution as a capital repayment. It is not liable to Income Tax but must be deducted from the cost of the shares for Capital Gains Tax purposes.
Group 2 Final
FromTo
07.01.1631.01.16
‘O’ Accumulation shares
Final NetRevenue
Equalisation Allocation31.03.16
Group 1Group 2
0.1080 0.1080
– 0.0000
0.1080 0.1080
‘O’ Income shares
Final NetRevenue
Equalisation Payable31.03.16
Group 1Group 2
0.0705 0.0705
– 0.0000
0.0705 0.0705
‘I’ Accumulation shares
Final NetRevenue
Equalisation Allocation31.03.16
Group 1Group 2
0.0800 0.0800
– 0.0000
0.0800 0.0800
‘I’ Income shares
Final NetRevenue
Equalisation Payable31.03.16
Group 1Group 2
0.0720 0.0720
– 0.0000
0.0720 0.0720

80 Trojan Investment Funds Trojan Investment Funds 81
TROJAN ETHICAL INCOME FUNDFinancial Statements (continued)Distribution Table (continued)
‘S’ Accumulation shares (Registered charities only)
Final NetRevenue
Equalisation Allocation31.03.16
Group 1Group 2
0.0280 0.0280
– 0.0000
0.0280 0.0280
‘S’ Income shares (Registered charities only)
Final NetRevenue
Equalisation Payable31.03.16
Group 1Group 2
0.0280 0.0280
– 0.0000
0.0280 0.0280
TROJAN GLOBAL EQUITY FUNDACD’S REPORTFOR THE YEAR ENDED 31 JANUARY 2016
IMPORTANT INFORMATIONRefer to the ‘Important Information’ section of the Company on page 8.
INVESTMENT OBJECTIVE AND POLICYThe investment objective of the Trojan Global Equity Fund (‘the Fund’) is to provide capital growth over the longer term. The Fund’s policy is to invest substantially in UK and overseas equities but may also invest in collective investment schemes and money market instruments.
CAPITA FINANCIAL MANAGERS LIMITEDACD of Trojan Global Equity Fund3 May 2016

82 Trojan Investment Funds Trojan Investment Funds 83
TROJAN GLOBAL EQUITY FUNDACD’s Report (continued)For the year ended 31 January 2016
INVESTMENT MANAGER’S REPORT
For the year to 31 January 2016 the Fund produced a total return of +6.5% compared to a total return of +0.4%1 for the LIBID Index and +0.5%1 for the MSCI World Index.
The year proved to be uninspiring for global equity markets with the best return of +4% achieved by MSCI Japan followed closely by the US with +4% in sterling terms. The MSCI Emerging Markets Index lost -16%, Pacifi c ex Japan -12%, the MSCI UK Index -7% and Europe ex UK ended the period -2.5%.2 Currencies were a powerful feature as the US dollar appreciated 7% against sterling, 4% against the euro and signifi cantly more against most emerging markets currencies (just over 50% against the Brazilian real, for example).3
The tone of equity markets changed over the past twelve months as the outlook for global growth deteriorated, the oil price declined just under 40%, the yield on low-rated corporate debt expanded to 2008 highs and there was considerable volatility across Emerging Markets. A move by the Federal Reserve to increase interest rates by just a quarter of one percent in December was followed by a sharp sell-off in equity markets in January and reminded the world that the monetary authorities’ magic wand is running out of fairy dust.3
Meanwhile, the level of global M&A activity in 2015 exceeded the highs of 2007 and a number of our companies were involved in deal activity over the year. Corporate debt levels have increased globally. The balance sheet of corporate America has deteriorated as record high levels of cash are matched with increasing debt issuance as companies seek to avoid the tax implications of repatriation of overseas earnings. Corporate earnings performance has been very mixed. Any companies involved in the oil and gas industry or the commodity-related sectors are experiencing very diffi cult times. The fi nancial sector is struggling with the consequences of extremely low interest rates, pressures on net interest margins, rising provisions in response to the energy crisis and the ongoing burden of regulation.
Elsewhere, the impact of digitalisation, e-commerce and the changing technology landscape is impacting the profi tability and business practices of many industries, particularly those that have to compete with the platform giants like Amazon.
At the end of January 2016 the Fund owns investments in 32 companies and the top 10 positions represented 42.4% of the capital of the Fund. Half of the Fund is invested in the United States, 23% in the UK, 12% in Switzerland, 2% in Holland, 3.4% in Japan and 2.5% in Hong Kong.
1 Source: Lipper, net income reinvested at ex-dividend date, quoted in sterling terms. The indices used by the Investment Manager are for comparison purposes. No benchmark is required to be disclosed per the Prospectus.
2 MSCI, net income reinvested net of withholding tax, quoted in sterling terms.3 Source: Bloomberg as at 31 January 2016.
ASSET ALLOCATION AS AT 31 JANUARY 2016
PORTFOLIO REVIEWReturns over the year were broad-based across the portfolio with particular highlights including Microsoft Corporation, Japan Tobacco, Altria Group, Sage Group and Fiserv, all of which returned more than +20% over the year. Regionally, stock selection in the US was strong and returns were helped by the relative strength of the US dollar. Although the UK equity market was lacklustre, performance was helped by stock selection with particular highlights including Sage Group, Sky, British American Tobacco, Reckitt Benckiser Group and Unilever. Performance in Europe was more mixed with Heineken Holding, Nestlé and Roche Holding delivering positive returns but Novartis was disappointing weighed down by problems in their eye care business Alcon. In Asia Japan Tobacco was a standout performer but Jardine Matheson Holdings had a disappointing year as the weaker Asian macroeconomic backdrop weighed on their subsidiaries Astra and Dairy Farm in particular. Jardines has over 180 years’ experience navigating the ups and downs of operating in Asia and, with the shares trading on 13.5x 2016 earnings, the valuation is not demanding.²
On an industry basis, our investments in technology and consumer staples were strong contributors to returns. The Fund’s health care investments had another solid year with Becton, Dickinson and Company, Medtronic and Johnson and Johnson all performing well. The most disappointing stock was American Express where the loss of a number of co-branding contracts, the most signifi cant of which a longstanding relationship with Costco and evidence of a more competitive landscape weighed on the performance of the shares. We are believers in the long-term sustainability of the American Express franchise and see the shares as undervalued at just over 10x 2016 earnings.²
There were few changes to the Fund over the year. The holding in Société BIC was sold after the shares had performed very well and the valuation was the most expensive in ten years. The small holding in Indivior that was received following the spin from Reckitt Benckiser Group was sold. Elsewhere, holdings were increased in American Express Company, Jardine Matheson Holdings, Coca-Cola Company and AG BARR. A small investment in the consumer products giant Procter & Gamble Company (‘P&G’) was made in August, following the equity market sell-off, when the shares were trading on a dividend yield of 3.8%, the highest since the late 1980’s. P&G has
Net other assets 7%
UK 23%
Europe 18%
North America 46%
Asia inc. Japan 6%

84 Trojan Investment Funds Trojan Investment Funds 85
FUND INFORMATION
TROJAN GLOBAL EQUITY FUNDACD’s Report (continued)Investment Manager’s Report (continued)For the year ended 31 January 2016
PORTFOLIO REVIEW (continued)underperformed peers and the market for more than seven years and a lot of work is needed to get the company back on track. But with over $10 billion in annual operating cash fl ow and a portfolio of iconic brands the incoming chief executive David Taylor has a number of levers at his disposal.
OUTLOOKAs we enter 2016 fi nancial markets are in nervous mood. At the time of writing global equity markets have sold off -3%, the oil price has collapsed below $30, high yield bond spreads have expanded to their highest levels in four years and numerous economic indicators are pointing towards a global economic slowdown. The Chinese economy appears to be slowing down at a precipitous rate, giving rise to material defl ationary forces for the rest of the world. The potential for some serious dislocation in fi nancial markets or a ‘credit event’ in 2016 has increased materially. Meanwhile, digitalisation is dramatically changing the economics and rules of engagement in numerous industries thereby creating substantial opportunities and a great number of disruptions and threats. We do not pretend to know how this will all unfold and instead focus our efforts on understanding the companies we prefer. In such an uncertain economic world the Fund is prepared for renewed adversity in the short term whilst maintaining its objective of providing long-term capital growth. It does this through the ownership of a collection of special companies which, by virtue of their cash generative business models, strong balance sheets and able management teams, have demonstrated over many decades their capacity to survive through the bad times and thrive when they are good.
TROY ASSET MANAGEMENT LIMITEDInvestment Manager25 February 2016
SYNTHETIC RISK AND REWARD INDICATOR
Typically lower rewards Typically higher rewards
Lower risk Higher risk
1 2 3 4 5 6 7
This indicator shows how much a fund has risen and fallen in the past, and therefore how much a fund’s returns have varied. It is a measure of a fund’s volatility. The higher a fund’s past volatility the higher the number on the scale and the greater the risk that investors in that fund may have made losses as well as gains. The lowest number on the scale does not mean that a fund is risk free.
The Fund has been classed as 4 because its volatility has been measured as average.
This indicator is based on historical data and may not be a reliable indication of the future risk profi le of this Fund.
The risk and reward profi le shown is not guaranteed to remain the same and may shift over time.
RISK WARNINGAn investment in an open-ended investment company should be regarded as a medium to long term investment. Investors should be aware that the price of shares and the income from them can fall as well as rise and investors may not receive back the full amount invested. Past performance is not a guide to future performance. Investments denominated in currencies other than the base currency are subject to fl uctuation in exchange rates, which can be favourable or unfavourable.

86 Trojan Investment Funds Trojan Investment Funds 87
TROJAN GLOBAL EQUITY FUND ACD’s Report (continued)Fund Information (continued)
COMPARATIVE TABLES 31.01.16 31.01.15 31.01.14 (p/share) (p/share) (p/share)
‘O’ Income shares
Change in net assets per share
Opening net asset value per share 177.21 146.69 142.62
Return before operating charges* 14.36 33.94 7.84
Operating charges (2.06) (1.79) (1.69)
Return after operating charges 12.30 32.15 6.15
Distributions on income shares (1.76) (1.63) (2.08)
Closing net asset value per share 187.75 177.21 146.69
* after direct transaction costs 0.02 0.07 0.12
Performance
Return after charges 6.94% 21.92% 4.31%
Other Information
Closing net asset value (£’000) 40,314 39,110 29,395
Closing number of shares 21,472,107 22,070,556 20,038,443
Operating charges 1.13% 1.11% 1.12%
Direct transaction costs 0.01% 0.04% 0.08%
Prices
Highest share price 193.26 181.30 159.47
Lowest share price 169.99 145.53 142.53
31.01.16 31.01.15 31.01.14 (p/share) (p/share) (p/share)
‘O’ Accumulation shares
Change in net assets per share
Opening net asset value per share 206.57 169.26 162.32
Return before operating charges* 16.81 39.38 8.86
Operating charges (2.41) (2.07) (1.92)
Return after operating charges 14.40 37.31 6.94
Closing net asset value per share 220.97 206.57 169.26
Retained distributions on accumulation shares 2.07 1.89 2.38
* after direct transaction costs 0.03 0.08 0.14
Performance
Return after charges 6.97% 22.04% 4.28%
Other Information
Closing net asset value (£’000) 51,745 45,713 38,780
Closing number of shares 23,417,895 22,129,209 22,911,586
Operating charges 1.13% 1.11% 1.12%
Direct transaction costs 0.01% 0.04% 0.08%
Prices
Highest share price 226.88 210.91 181.50
Lowest share price 199.57 167.91 163.07

88 Trojan Investment Funds Trojan Investment Funds 89
TROJAN GLOBAL EQUITY FUND ACD’s Report (continued)Fund Information (continued)
COMPARATIVE TABLES (continued) 31.01.16 31.01.15 31.01.14 (p/share) (p/share) (p/share)
‘I’ Income shares
Change in net assets per share
Opening net asset value per share 178.70 147.99 143.89
Return before operating charges* 14.46 34.19 7.90
Operating charges (2.97) (2.58) (2.43)
Return after operating charges 11.49 31.61 5.47
Distributions on income shares (0.88) (0.90) (1.37)
Closing net asset value per share 189.31 178.70 147.99
* after direct transaction costs 0.02 0.07 0.12
Performance
Return after charges 6.43% 21.36% 3.80%
Other Information
Closing net asset value (£’000) 826 863 1,052
Closing number of shares 436,338 482,675 710,930
Operating charges 1.62% 1.60% 1.61%
Direct transaction costs 0.01% 0.04% 0.08%
Prices
Highest share price 194.48 182.47 160.66
Lowest share price 171.36 146.80 143.66
31.01.16 31.01.15 31.01.14 (p/share) (p/share) (p/share)
‘I’ Accumulation shares
Change in net assets per share
Opening net asset value per share 194.89 160.48 154.65
Return before operating charges* 15.81 37.21 8.46
Operating charges (3.25) (2.80) (2.63)
Return after operating charges 12.56 34.41 5.83
Closing net asset value per share 207.45 194.89 160.48
Retained distributions on accumulation shares 0.96 0.97 1.46
* after direct transaction costs 0.02 0.07 0.13
Performance
Return after charges 6.44% 21.44% 3.77%
Other Information
Closing net asset value (£’000) 6,294 7,676 10,546
Closing number of shares 3,033,980 3,938,370 6,571,464
Operating charges 1.62% 1.60% 1.61%
Direct transaction costs 0.01% 0.04% 0.08%
Prices
Highest share price 213.09 199.01 172.67
Lowest share price 187.76 159.19 155.37

90 Trojan Investment Funds Trojan Investment Funds 91
TROJAN GLOBAL EQUITY FUND ACD’s Report (continued)Fund Information (continued)
COMPARATIVE TABLES (continued) 31.01.16 31.01.15 31.01.14 (p/share) (p/share) (p/share)
‘S’ Income shares (Registered charities only)
Change in net assets per share
Opening net asset value per share 177.28 146.74 142.67
Return before operating charges* 14.39 33.97 7.84
Operating charges (1.59) (1.37) (1.29)
Return after operating charges 12.80 32.60 6.55
Distributions on income shares (2.24) (2.06) (2.48)
Closing net asset value per share 187.84 177.28 146.74
* after direct transaction costs 0.02 0.07 0.12
Performance
Return after charges 7.22% 22.22% 4.59%
Other Information
Closing net asset value (£’000) 5,802 5,473 4,501
Closing number of shares 3,088,772 3,087,472 3,067,046
Operating charges 0.87% 0.85% 0.86%
Direct transaction costs 0.01% 0.04% 0.08%
Prices
Highest share price 193.55 174.72 181.59
Lowest share price 170.10 145.58 142.66
31.01.16 31.01.15 31.01.14 (p/share) (p/share) (p/share)
‘S’ Accumulation shares (Registered charities only)
Change in net assets per share
Opening net asset value per share 207.15 169.30 161.93
Return before operating charges* 16.87 39.41 8.85
Operating charges (1.86) (1.56) (1.48)
Return after operating charges 15.01 37.85 7.37
Closing net asset value per share 222.16 207.15 169.30
Retained distributions on accumulation shares 2.62 2.37 2.82
* after direct transaction costs 0.03 0.08 0.14
Performance
Return after charges 7.25% 22.36% 4.55%
Other Information
Closing net asset value (£’000) 88 82 184
Closing number of shares 39,418 39,418 108,498
Operating charges 0.87% 0.85% 0.86%
Direct transaction costs 0.01% 0.04% 0.08%
Prices
Highest share price 228.05 211.49 181.21
Lowest share price 200.42 167.96 162.68

92 Trojan Investment Funds Trojan Investment Funds 93
PORTFOLIO STATEMENTAS AT 31 JANUARY 2016
TROJAN GLOBAL EQUITY FUND ACD’s Report (continued)Fund Information (continued)
FUND PERFORMANCE TO 31 JANUARY 2016 (%)
1 year 3 years 5 years
Trojan Global Equity Fund 6.47 33.60 60.57
The performance of the Fund is based on the published price per ‘I’ Accumulation share which includes reinvested income.
The performance of the Fund disclosed in the above table may differ from the ‘Return after charges’ disclosed in the Comparative Table due to above performance being calculated on the latest published price prior to the year end, rather than the year end return after operating charges.
Details of the distributions per share for the year are shown in the Distribution Table on pages 107 to 109.
Holding Portfolio of Investments Value 31.01.16 £’000 %
UNITED KINGDOM – 22.76% (31.01.15 – 23.10%) 163,180 A.G BARR 863 0.82 62,500 AVEVA Group 834 0.79 93,000 British American Tobacco 3,581 3.41 111,000 Diageo 2,077 1.98 162,500 Experian 1,908 1.82 88,000 Rathbone Brothers 2,021 1.92 34,500 Reckitt Benckiser Group 2,136 2.03 761,444 Sage Group (The) 4,652 4.43 268,000 Sky 2,844 2.71 99,000 Unilever 2,997 2.85
TOTAL UNITED KINGDOM 23,913 22.76
CONTINENTAL EUROPE – 17.96% (31.01.15 – 21.45%) 40,200 Heineken Holding 2,133 2.03 82,000 Medtronic 4,236 4.03 74,000 Nestlé 3,782 3.60 78,800 Novartis 4,221 4.02 25,000 Roche Holding 4,495 4.28
TOTAL CONTINENTAL EUROPE 18,867 17.96
NORTH AMERICA – 46.55% (31.01.15 – 43.41%) 3,000 Alphabet 1,569 1.49 126,000 Altria Group 5,251 5.00 95,800 American Express Company 3,540 3.37 51,500 Becton, Dickinson and Company 5,119 4.87 117,000 Coca-Cola Company (The) 3,481 3.31 70,400 Colgate-Palmolive Company 3,199 3.04 131,700 eBay 2,129 2.03 55,000 Fiserv 3,500 3.33 25,200 Intuit 1,621 1.54 37,000 Johnson & Johnson 2,645 2.52 157,000 Microsoft Corporation 5,713 5.44 131,700 PayPal Holdings 3,151 3.00 52,000 Philip Morris International 3,238 3.08 21,000 Procter & Gamble Company (The) 1,172 1.11 105,000 Wells Fargo & Company 3,589 3.42
TOTAL NORTH AMERICA 48,917 46.55

94 Trojan Investment Funds Trojan Investment Funds 95
SUMMARY OF MATERIAL PORTFOLIO CHANGESFOR THE YEAR ENDED 31 JANUARY 2016
TROJAN GLOBAL EQUITY FUND ACD’s Report (continued)Portfolio Statement (continued)As at 31 January 2016
Holding Portfolio of Investments Value 31.01.16 £’000 %
ASIA – 5.95% (31.01.15 – 4.59%) 132,700 Japan Tobacco 3,574 3.40 73,000 Jardine Matheson Holdings 2,676 2.55
TOTAL ASIA 6,250 5.95
FORWARD CURRENCY CONTRACTS – 0.00% (31.01.15 – (0.06)%) – –
Portfolio of investments 97,947 93.22 Net other assets 7,122 6.78 Net assets 105,069 100.00
The investments have been valued in accordance with note (h) of the Accounting Policies and are ordinary shares listed on a regulated market.
Total purchases for the year £’000 (note 13) 3,566
Purchases Cost £’000
Jardine Matheson Holdings 982Procter & Gamble Company (The) 954Coca-Cola Company (The) 846American Express Company 425A. G. BARR 359
Total sales for the year £’000 (note 13) 2,862
Sales Proceeds £’000
Société BIC 1,545 Rathbone Brothers 711 Novartis 528 Indivior 78
The summary of material portfolio changes represents all of the purchases and sales during the year.

96 Trojan Investment Funds Trojan Investment Funds 97
TROJAN GLOBAL EQUITY FUNDFINANCIAL STATEMENTSSTATEMENT OF TOTAL RETURNFOR THE YEAR ENDED 31 JANUARY 2016
31.01.16 31.01.15 Notes £’000 £’000 £’000 £’000
Income: Net capital gains 2 5,772 17,176
Revenue 3 2,296 2,130
Expenses 4 (1,156) (1,040)
Net revenue before taxation 1,140 1,090
Taxation 5 (185) (192)
Net revenue after taxation 955 898
Total return before distributions 6,727 18,074
Distributions 6 (956) (901)
Change in net assets attributable to shareholders from investment activities 5,771 17,173
STATEMENT OF CHANGE IN NET ASSETS ATTRIBUTABLE TO SHAREHOLDERSFOR THE YEAR ENDED 31 JANUARY 2016 31.01.16 31.01.15 £’000 £’000 £’000 £’000
Opening net assets attributable to shareholders 98,917 84,457
Amounts receivable on issue of shares 7,857 7,577
Amounts payable on cancellation of shares (8,008) (10,880)
(151) (3,303)
Dilution levy charged 31 122
Stamp duty reserve tax, net of refund – (2)
Change in net assets attributable to shareholders from investment activities 5,771 17,173
Retained distributions on Accumulation shares 501 470
Closing net assets attributable to shareholders 105,069 98,917
BALANCE SHEETAS AT 31 JANUARY 2016
Notes 31.01.16 31.01.15 £’000 £’000
ASSETS
Fixed assets Investments 97,947 91,543
Current assets Debtors 7 346 243Cash and bank balances 7,032 7,791
Total assets 105,325 99,577
LIABILITIES
Investment liabilities – (58)
Creditors Distribution payable (123) (99)Other creditors 8 (133) (503)
Total liabilities (256) (660)
Net assets attributable to shareholders 105,069 98,917

98 Trojan Investment Funds Trojan Investment Funds 99
TROJAN GLOBAL EQUITY FUNDFinancial Statements (continued)NOTES TO THE FINANCIAL STATEMENTSAS AT 31 JANUARY 2016
1. ACCOUNTING POLICIES
The accounting policies described on pages 14 to 16 have been applied to the fi nancial statements of the Fund in the current and prior year.
31.01.16 31.01.15 £’000 £’000
2. NET CAPITAL GAINS
The net capital gains during the year comprise: Non-derivative securities 5,699 17,219Forward currency contracts 66 (58)Currency gains 7 15 Net capital gains 5,772 17,176
3. REVENUE
Non-taxable dividends 2,285 2,121Bank interest 9 9Interest on receipt of withholding tax reclaims 2 – Total revenue 2,296 2,130
4. EXPENSES
Payable to the ACD, associates of the ACD and agents of either of them: Annual Management Charge 1,027 940Legal and professional fees 14 14Printing costs 6 5Registration fees 24 6Tax related services 7 –
1,078 965Payable to the Depositary, associates of the Depositary and agents of either of them: Depositary’s fees 36 41Safe custody and other bank charges 10 14
46 55
31.01.16 31.01.15 £’000 £’000
4. EXPENSES (continued)
Other expenses:
Fees paid to auditor – audit 8 8– tax services 3 3– other tax related services 12 –
Publication costs 8 8Legal and professional fees 1 –Postage and distribution costs – 1
32 20 Total expenses 1,156 1,040
The Investment Management fees and expenses (plus VAT thereon) for providing investment management services are paid by the ACD out of its remuneration.
31.01.16 31.01.15 £’000 £’000
5. TAXATION
a) Analysis of charge for the yearCorporation tax at 20% – –Overseas tax 205 192Adjustments in respect of withholding tax reclaims (20) – Current tax charge 185 192 Deferred tax – origination and reversal of timing differences (note 5c) – – Total taxation (note 5b) 185 192
b) Factors affecting the tax charge for the yearThe tax assessed for the year differs from the standard rate of corporation tax in the UK for an authorised fund (20%) (31.01.15 : 20%). The difference is explained below.
31.01.16 31.01.15 £’000 £’000
Net revenue before taxation 1,140 1,090
Corporation tax at 20% 228 218

100 Trojan Investment Funds Trojan Investment Funds 101
TROJAN GLOBAL EQUITY FUND Financial Statements (continued) Notes to the Financial Statements (continued)As at 31 January 2016
31.01.16 31.01.15 £’000 £’000
5. TAXATION (continued)
Effects of: Non-taxable dividends (457) (424)Unutilised excess management expenses 229 206 Corporation tax charge – – Overseas tax 205 192Adjustments in respect of withholding tax reclaims (20) – Total tax charge (note 5a) 185 192
c) Deferred tax At the year end there is a potential deferred tax asset of £1,053 thousand (31.01.15 : £824 thousand) in relation to surplus management expenses. It is unlikely that the Fund will generate suffi cient taxable profi ts in the future to utilise this amount and, therefore, no deferred tax asset has been recognised in the current or prior year.
6. FINANCE COSTS
DistributionsThe distributions take account of revenue received on the issue of shares and revenue deducted on cancellations of shares, and comprise:
31.01.16 31.01.15 £’000 £’000
Interim 692 706Final 253 194 945 900 Add: Revenue deducted on cancellation of shares 36 41Deduct: Revenue received on issue of shares (25) (40) Net distributions for the year 956 901 Total fi nance costs 956 901
Details of the distributions per share are set out in the table on pages 107 to 109.
31.01.16 31.01.15 £’000 £’000
6. FINANCE COSTS (continued)
Distributions represented by: Net revenue after taxation 955 898Allocations to capital: Revenue defi cit – ‘I’ Accumulation shares – 2 Equalisation on conversions* 1 1 Net distributions for the year 956 901
* Where an investor converts to a class with a higher income yield, the investor will receive an equalisation as if they had held the new class throughout the period from the last distribution to the conversion date. The yield differential at the point of conversion is an equalisation which will be offset by capital erosion for the converted investor.
31.01.16 31.01.15 £’000 £’000
7. DEBTORS
Amounts receivable for issue of shares 76 4 Accrued revenue: Non-taxable dividends 85 62 Bank interest 1 1
86 63 Dilution levy – 2 Prepaid expenses 5 6 Taxation recoverable: Overseas withholding tax 179 168 Total debtors 346 243

102 Trojan Investment Funds Trojan Investment Funds 103
TROJAN GLOBAL EQUITY FUND Financial Statements (continued) Notes to the Financial Statements (continued)As at 31 January 2016
31.01.16 31.01.15 £’000 £’000
8. CREDITORS
Amounts payable for cancellation of shares 18 394 Accrued expenses: Amounts payable to the ACD, associates of the ACD and agents of either of them: Annual Management Charge 90 86 Legal and professional fees 1 1 Printing costs 3 3 Registration fees 3 1
97 91Amounts payable to the Depositary, associates of the Depositary and agents of either of them: Depositary’s fees 3 4 Safe custody and other bank charges 1 2
4 6 Other expenses 14 12 Total creditors 133 503
9. RELATED PARTY TRANSACTIONS
Annual Management Charge and legal and professional fees payable to Capita Financial Managers Limited (‘the ACD’), registration and tax related services fees payable to Capita Financial Administrators Limited and printing costs payable to Capita Sinclair Henderson Limited (both companies are associates of the ACD) are disclosed in note 4 and amounts due at the year end are disclosed in note 8.
The aggregate monies received by the ACD through the issue of shares and paid on cancellation of shares are disclosed in the Statement of Change in Net Assets Attributable to Shareholders on page 96 and amounts due at the year end are disclosed in notes 7 and 8.
Capita Financial Managers Limited and its associates (including other authorised investment funds managed by Capita Financial Managers Limited) held 459,097 (31.01.15 : 482,556) of the Fund’s shares at the balance sheet date.
A shareholder may be able to exercise signifi cant infl uence over the fi nancial and operating policies of the Fund and as such is deemed to be a related party. At the balance sheet date the following shareholder held in excess of 20% of the shares in issue of the Fund:
Pershing Nominees Limited 48.00% (31.01.15 : 0.00%)
10. CONTINGENT LIABILITIES AND COMMITMENTS
There are no contingent liabilities or unrecorded outstanding commitments (31.01.15 : none).
11. SHAREHOLDERS’ FUNDS
‘O’ ‘O’ ‘I’ Income Accumulation Income
Annual Management Charge 1.00% 1.00% 1.50%
Opening shares in issue 22,070,556 22,129,209 482,675 Issues 936,611 2,551,937 62,069 Cancellations (1,931,177) (1,301,249) (26,858)Conversions 396,117 37,998 (81,548) Closing shares in issue 21,472,107 23,417,895 436,338
‘I’ ‘S’ S’ Accumulation ‘Income Accumulation
Annual Management Charge 1.50% 0.75% 0.75%
Opening shares in issue 3,938,370 3,087,472 39,418 Issues 281,675 36,400 – Cancellations (861,910) (35,100) – Conversions (324,155) – – Closing shares in issue 3,033,980 3,088,772 39,418
12. RISK MANAGEMENT POLICIES
In pursuing the investment objective a number of fi nancial instruments are held which may comprise securities and other investments, cash balances and debtors and creditors that arise directly from operations. Derivatives, such as futures or forward currency contracts, may be utilised for hedging purposes.
The main risks from the Fund’s holding of fi nancial instruments, together with the ACD’s policy for managing these risks, are set out below:
The ACD has in place a Risk Management Policy and Procedures Document (‘RMPPD’) that sets out the risks that may impact a fund and how the ACD seeks, where appropriate, to manage, monitor and mitigate those risks, and in particular those risks associated with the use of derivatives. The RMPPD sets out both the framework and the risk mitigations operated by the ACD in managing the identifi ed risks of the fund. The ACD requires that the appointed Investment Manager to the fund has in place its own governance structure, policies and procedures that are commensurate with its regulatory obligations and the risks posed by the fund managed.

104 Trojan Investment Funds Trojan Investment Funds 105
TROJAN GLOBAL EQUITY FUND Financial Statements (continued) Notes to the Financial Statements (continued)As at 31 January 2016
12. RISK MANAGEMENT POLICIES (continued)
i. Credit riskCredit risk is the risk that a counterparty may be unable or unwilling to make a payment or fulfi l contractual obligations. This may be in terms of an actual default or by deterioration in a counterparty’s credit quality.
Certain transactions in securities that the Fund enters into expose it to the risk that the counterparty will not deliver the investment for a purchase, or cash for a sale after the Fund has fulfi lled its obligations. As part of its due diligence process, the ACD undertakes a review of the controls operated over counterparties by the Investment Manager, including initial and ongoing due diligence and business volumes placed with each counterparty. In cases which are dependent on the counterparty settling at the transaction’s maturity date, the ACD has policies in place which set out the minimum credit quality expected of a market counterparty or deposit taker at the outset of the transaction.
ii. Foreign currency riskForeign currency risk is the risk that the sterling value of investments will fl uctuate as a result of exchange rate movements. Assets denominated in currencies other than sterling will provide direct exposure to currency risk as a consequence of the movement in foreign exchange rates when calculating the sterling equivalent value.
Where the Fund invests in non-sterling assets, the Investment Manager allows for the foreign currency risk when considering whether to invest and does not seek to hedge this risk.
The table below shows the direct foreign currency risk profi le:
31.01.16 31.01.15 £’000 £’000
Currency: Euros 2,161 3,312 Japanese yen 3,618 135 Swiss francs 12,656 14,103 US dollars 55,886 49,067 74,321 66,617
Pounds sterling 30,748 32,300 Net assets 105,069 98,917
iii. Liquidity riskThe main liability of the Fund is the cancellation of any shares that investors want to sell. Investments may have to be sold to fund such cancellations should insuffi cient cash be held at the bank to meet this obligation.
To reduce liquidity risk the Investment Manager will ensure that a substantial portion of the Fund’s assets consist of cash and readily realisable investments.
All fi nancial liabilities are payable in one year or less, or on demand.
12. RISK MANAGEMENT POLICIES (continued)
iv. Market price riskMarket price risk is the risk that the value of the Fund’s fi nancial instruments will fl uctuate as a result of changes in market prices caused by factors other than interest rate or foreign currency movement. Market price risk arises primarily from uncertainty about the future prices of fi nancial instruments that the Fund holds.
Market price risk represents the potential loss the Fund may suffer through holding market positions in the face of price movements. The Fund’s investment portfolio is exposed to price fl uctuations, which are monitored by the ACD in pursuance of the investment objective and policy. The risk is generally regarded as consisting of two elements – stock specifi c risk and market risk. Adhering to investment guidelines and avoiding excessive exposure to one particular issuer can limit stock specifi c risk. Subject to compliance with the investment objective, spreading exposure across a broad range of global stocks can mitigate market risk.
vi. Fair value of fi nancial assets and fi nancial liabilitiesThere is no material difference between the value of the fi nancial assets and liabilities, as shown in the balance sheet, and their fair value.
13. PORTFOLIO TRANSACTION COSTS
Purchases /sales before Gross purchases transaction costs Commissions Taxes /net sales £’000 £’000 £’000 £’00031.01.16 Ordinary shares 3,558 6 2 3,566 Purchases total 3,558 6 2 3,566 Transaction cost % of purchases total 0.17% 0.06% Transaction cost %
of average NAV 0.01% – Ordinary shares 2,867 (5) – 2,862 Sales total 2,867 (5) – 2,862 Transaction cost %
of sales total 0.17% – Transaction cost %
of average NAV – – Average portfolio dealing spread at 31.01.16 is 0.11% (31.01.15 : 0.06%).

106 Trojan Investment Funds Trojan Investment Funds 107
TROJAN GLOBAL EQUITY FUND Financial Statements (continued) Notes to the Financial Statements (continued)As at 31 January 2016
13. PORTFOLIO TRANSACTION COSTS (continued)
Purchases /sales before Gross purchases transaction costs Commissions Taxes /net sales £’000 £’000 £’000 £’00031.01.15 Ordinary shares 11,377 16 7 11,400 Purchases total 11,377 16 7 11,400 Transaction cost %
of purchases total 0.14% 0.06% Transaction cost %
of average NAV 0.02% 0.01% Ordinary shares 14,600 (15) – 14,585 Sales total 14,600 (15) – 14,585 Transaction cost %
of sales total 0.10% – Transaction cost %
of average NAV 0.02% –
14. FAIR VALUE HIERARCHY
Investments are categorised into the following levels based on their fair value measurement:
Level 1: The unadjusted quoted price in an active market for identical assets that the Fund can access at the year end date.
Level 2: Inputs other than quoted prices included within Level 1 that are observable (i.e. developed using market data) for the asset or liability, either directly or indirectly.
Level 3: Inputs are unobservable (i.e. for which market data is unavailable) for the asset.
31.01.16 31.01.15 31.01.15Valuation technique Assets Assets Liabilities £’000 £’000 £’000 Level 1 97,947 91,543 –Level 2 – – (58)Level 3 – – – 97,947 91,543 (58) Total portfolio of investments 97,947 91,485
DISTRIBUTION TABLEFOR THE YEAR ENDED 31 JANUARY 2016 – IN PENCE PER SHARE
EQUALISATIONEqualisation applies only to shares purchased during the distribution period (Group 2 shares –the applicable distribution periods for each distribution are shown below). It represents the accrued revenue included in the purchase price of the shares. After averaging it is returned with the distribution as a capital repayment. It is not liable to Income Tax but must be deducted from the cost of the shares for Capital Gains Tax purposes.
Group 2 Interim Final
FromTo
01.02.1531.07.15
01.08.1531.01.16
‘O’ Income shares
Interim NetRevenue
Equalisation Paid30.09.15
Paid30.09.14
Group 1Group 2
1.2944 0.6635
– 0.6309
1.2944 1.2944
1.2672 1.2672
Final NetRevenue
Equalisation Payable31.03.16
Paid31.03.15
Group 1Group 2
0.4698 0.1071
– 0.3627
0.4698 0.4698
0.3674 0.3674
‘O’ Accumulation shares
Interim NetRevenue
Equalisation Allocated30.09.15
Allocated30.09.14
Group 1Group 2
1.5112 0.3176
– 1.1936
1.5112 1.5112
1.4632 1.4632
Final NetRevenue
Equalisation Allocation31.03.16
Allocated31.03.15
Group 1Group 2
0.5540 0.1822
– 0.3718
0.5540 0.5540
0.4288 0.4288

108 Trojan Investment Funds Trojan Investment Funds 109
TROJAN GLOBAL EQUITY FUNDFinancial Statements (continued)Distribution Table (continued)
‘I’ Income shares
Interim NetRevenue
Equalisation Paid30.09.15
Paid30.09.14
Group 1Group 2
0.8599 0.3735
– 0.4864
0.8599 0.8599
0.8981 0.8981
Final NetRevenue
Equalisation Payable31.03.16
Paid31.03.15
Group 1Group 2
0.0171 0.0000
– 0.0171
0.0171 0.0171
– –
‘I’ Accumulation shares
Interim NetRevenue
Equalisation Allocated30.09.15
Allocated30.09.14
Group 1Group 2
0.9365 0.1669
– 0.7696
0.9365 0.9365
0.9726 0.9726
Final NetRevenue
Equalisation Allocation31.03.16
Allocated31.03.15
Group 1Group 2
0.0188 0.0000
– 0.0188
0.0188 0.0188
– –
‘S’ Income shares
Interim NetRevenue
Equalisation Paid30.09.15
Paid30.09.14
Group 1Group 2
1.5297 0.5022
– 1.0275
1.5297 1.5297
1.4689 1.4689
Final NetRevenue
Equalisation Payable31.03.16
Paid31.03.15
Group 1Group 2
0.7088 0.2691
– 0.4397
0.7088 0.7088
0.5866 0.5866
‘S’ Accumulation shares
Interim NetRevenue
Equalisation Allocated30.09.15
Allocated30.09.14
Group 1Group 2
1.7884 1.7884
– 0.0000
1.7884 1.7884
1.6951 1.6951
Final NetRevenue
Equalisation Allocation31.03.16
Allocated31.03.15
Group 1Group 2
0.8354 0.8354
– 0.0000
0.8354 0.8354
0.6742 0.6742
110 Trojan Investment Funds Trojan Investment Funds 111
TROJAN INCOME FUNDACD’S REPORTFOR THE YEAR ENDED 31 JANUARY 2016
IMPORTANT INFORMATIONRefer to the ‘Important Information’ section of the Company on page 8.
INVESTMENT OBJECTIVE AND POLICYThe investment objective of the Trojan Income Fund (‘the Fund’) is to provide an above average income with the potential for capital growth in the medium term. The Fund’s policy is to invest substantially in UK and overseas equities and fi xed interest securities but may also invest in collective investment schemes and money market instruments.
CAPITA FINANCIAL MANAGERS LIMITEDACD of Trojan Income Fund3 May 2016
INVESTMENT MANAGER’S REPORT
INVESTMENT REVIEWOver the twelve months under review the Fund produced a total return of +4.8%. Over the same period the FTSE All-Share Index produced a total return of -4.6%*, while the total return on cash (LIBID Index) amounted to +0.4%*. At 31 January 2016 the Fund size was £2,444 million.
A distribution of 3.9465p will be paid to holders of ‘O’ Income shares on 31 March which, combined with the interim dividend of 2.7300p paid on 30 September, makes a total distribution of 6.6765p. This represents an increase of 2.5% over the previous year and continues the Fund’s track record of unbroken dividend growth since its launch in 2004.
2015 proved to be the most unpredictable and volatile year of trading across global markets since 2008. Investors started the year sporting their fi nest pair of rose-tinted glasses as the European Central Bank launched its long-awaited Quantitative Easing programme and expectations for a US and UK rate hike were kicked into the long grass. Concerns over Greece’s ability to come to an agreement with its international creditors to unlock fi nancing and avert a default were put on the back-burner as markets rallied; the FTSE 100 broke above its December 1999 peak to close at 7,104 in April 2015 whilst the S&P 500 marched on to reach its all-time high and the NASDAQ Composite completed its long journey back from the bursting of the internet bubble. A decisive outcome at the polls at the UK general election in May helped markets remain tranquil. However, with a €1.6 billion debt repayment and the expiry of its bailout package looming large, Greece returned to the negotiating table with creditors in June in an attempt to thrash out a deal. In an escalation of the Greek debt crisis, the talks broke down, Greek banks were closed and capital controls were imposed. With Grexit looking inevitable, only a last-ditch intervention from Donald Tusk, President of the European Council, ensured the EU overcame its sternest test yet.
If the Greek drama failed to truly rattle markets, then the persistent crude oversupply that resulted in a 20% drop in oil prices in the month of July certainly did. By August, it was China’s turn to send ripples through markets – a shock yuan devaluation triggered a drop in the Chinese stock market that reached its crescendo on 26 August by which point the Shanghai Composite had shed 25%. By December, Bloomberg’s closely watched Commodity Index was hovering around lows not seen since 1999 as ongoing overcapacity and concerns over a slowdown in China came to the fore; the bloodbath in resources stocks became acute and rights issue and dividend cut announcements increased in frequency. Dividend cuts continue to attract column inches and the high yield on resources stocks refl ects scepticism among investors over whether the current level of payouts is sustainable. Dividend cuts, however, have not been confi ned to the resources sector; in the banking sector Standard Chartered scrapped its dividend whilst the supermarket price war took its toll on Tesco which cancelled its payout in January 2015. Both Sainsbury and WM Morrison sharply cut their own payouts during the year. To round off a topsy-turvy 2015, December saw the Federal Reserve raise interest rates for the fi rst time in nearly a decade, ushering in an era of monetary policy divergence. Share prices on both sides of the Atlantic ended a volatile year roughly where they started.
* Source: Bloomberg. The indices used by the Investment Manager are for comparison purposes. No benchmark is required to be disclosed per the Prospectus.

112 Trojan Investment Funds Trojan Investment Funds 113
TROJAN INCOME FUNDACD’s Report (continued)Investment Manager’s Report (continued)For the year ended 31 January 2016
PORTFOLIOAs at 31 January 2016 there were 45 equity holdings in the portfolio. 4.6% of assets were held as cash. The asset and sector allocations as at the end of January 2016 are shown below.
SECTOR ALLOCATION AS AT 31 JANUARY 2016
In an environment of zero interest rates, investors starved of yield remain attracted to stocks with good dividend track records, low leverage, strong pricing power, healthy free cash fl ow and high returns on invested capital. Market valuations therefore remain elevated and pockets of value have proved hard to come by.
We added to the Fund’s holding of Centrica following the announcement of the dividend cut in February 2015. From the perspective of a long-term investor we believe that the stock looks cheap despite the ongoing lack of short-term clarity. We reduced our exposure to Severn Trent and Pennon Group on the basis of valuation concerns and reinvested the proceeds from the reduction of these two holdings into Lloyds Banking Group, Royal Mail Group and AstraZeneca over the course of the year. We made a new investment in Assura, a UK health care REIT and a developer and owner-manager of primary care property for the NHS. Assura’s business model is similar to that of Primary Health Properties, an existing holding in the Fund. In November 2015, the Fund participated in International Public Partnerships’ capital raising following a meeting with management. This holding, which is not dissimilar to our existing holding in 3i Infrastructure, offers exposure to public infrastructure assets at the lower end of the risk spectrum e.g. PPP projects.
Three of the Fund’s investments were the objects of corporate activity during the year. Germany’s Müller Group fi nally completed the acquisition of Dairy Crest Group’s milk operations. The disposal of this low margin, commoditised business will allow Dairy Crest, a long – standing holding in the Fund, to develop its small ingredients business into products aimed primarily at the global infant formula market, in addition to focusing on a strong branded cheese and spreads division. In September 2015, Amlin, the Lloyd’s market non-life underwriter, attracted an all-cash bid from Tokyo-based Mitsui Sumitomo pitched at a 36% premium to the undisturbed share price. Part of the Amlin holding has since been reinvested in Hiscox, one of the few remaining quoted Lloyd’s companies and another that has demonstrated fi ne underwriting
Oil & Gas 7%
Industrials 6%
Consumer Goods 22%
Health Care 7%
Consumer Services 9%Telecommunications 7%
Util ities 12%
Financials 23%
Technology 2%Net other assets 5%
discipline over the years. 2015 also saw Royal Dutch Shell launch a £47 billion bid to acquire BG Group, attracted by its deepwater assets in Brazil and its LNG portfolio. At the time of writing, Shell has completed its acquisition of BG Group.
Finally, in September 2015, the Fund took advantage of market volatility to write put options, on Diageo shares, at a price level at which we would be comfortable owning the stock. The option premium received enhances the income account and represents an attractive return on cash that would ordinarily have returned 0%.
OUTLOOK2016 has started ominously. China’s tolerance of a weaker yuan, a slowing Chinese economy, a relentless fall in commodity prices and erratic monetary policy have conspired to bring about a turbulent start to the year for global stock markets. Markets remain jittery and volatility remains elevated.
Perhaps the most uncertain variable in the current environment remains the consequences of central bankers’ unorthodox monetary policy. At a simplistic level, falling oil and grocery prices lower the cost of living as nominal wages are rigid downwards (and we have been seeing real wage growth). This in turn should create a demand stimulus as consumers spend the saving on other products and services. Central Bankers, however, are keen to dispel the spectre of defl ation and Sweden, Switzerland, Denmark, the eurozone and most recently Japan (together almost a quarter of the global economy) have all introduced some form of negative interest rate policy. As of 11 February 2016, $6.1 trillion of bonds within the JPM Global Government Bond Index traded with negative yields. Central Bankers are betting that negative interest policy will help fi ght defl ationary forces, weaken their currencies and stimulate growth in the real economy whilst an aversion to negative yields in the fi nancial economy will drive investors to change their asset allocation towards riskier asset classes e.g. equities. One could be forgiven for perceiving the Central Bank’s mandate to be one that erodes the purchasing power of its citizens and stokes asset bubbles.
At the time of writing the FTSE 100 Share Index has recovered to sit at 6,000 following a 22% drop from its all-time high reached in April 2015. It is important to remember that the UK stock market has a heavy weighting in oil and commodity stocks, with a quarter of UK dividends coming from resources stocks. Whilst underlying dividends (which exclude special payments) rose 7% in 2015 to £85 billion, this masks the fact that the growth rate slowed over the course of the year. The cratering of commodity prices has left miners slashing payouts and oil majors under pressure to follow suit in 2016. Although the expectation of lower payouts has already been refl ected in share prices across the commodities sector, backward looking dividend growth measures will only refl ect the effects in 2016; indeed, Capita’s Q1 2016 UK Dividend Monitor Report forecasts 2016 will see the fi rst decline in underlying UK dividends since 2010 with major dividend cuts and company takeovers set to impact 2016 payout by at least £4.7 billion. 2016 will also see British voters head to the polls to vote on whether to remain part of a reformed EU or leave altogether. Given 44% of UK exports go to the EU and the EU is the source of 46% of the stock of inward foreign direct investment in the UK, both UK equities and sterling can be expected to be the subject of heightened volatility in the months ahead. A benign infl ationary environment coupled with continued uncertainty as to when the Bank of England will eventually lift interest rates (the benchmark rate has been kept on hold for 83 consecutive months) will do little to calm market observers.

114 Trojan Investment Funds Trojan Investment Funds 115
FUND INFORMATION
TROJAN INCOME FUNDACD’s Report (continued)Investment Manager’s Report (continued)For the year ended 31 January 2016
OUTLOOK (continued)The investment outlook looks ever-more uncertain and increasingly volatile. In such an environment, it is futile to predict where markets, infl ation expectations and interest rates are headed and instead, we continue to focus our attention on low volatility, high quality equities that can deliver high through-the-cycle returns on invested capital and shy away from capital intensive businesses that are cyclically exposed.
TROY ASSET MANAGEMENT LIMITEDInvestment Manager23 February 2016
SYNTHETIC RISK AND REWARD INDICATOR
Typically lower rewards Typically higher rewards
Lower risk Higher risk
1 2 3 4 5 6 7
This indicator shows how much a fund has risen and fallen in the past, and therefore how much a fund’s returns have varied. It is a measure of a fund’s volatility. The higher a fund’s past volatility the higher the number on the scale and the greater the risk that investors in that fund may have made losses as well as gains. The lowest number on the scale does not mean that a fund is risk free.
During the year the indicator changed from 5 to 4. The Fund has been classed as 4 because its volatility has been measured as average.
This indicator is based on historical data and may not be a reliable indication of the future risk profi le of this Fund.
The risk and reward profi le shown is not guaranteed to remain the same and may shift over time.
RISK WARNINGAn investment in an open-ended investment company should be regarded as a medium to long term investment. Investors should be aware that the price of shares and the income from them can fall as well as rise and investors may not receive back the full amount invested. Past performance is not a guide to future performance. Investments denominated in currencies other than the base currency are subject to fl uctuation in exchange rates, which can be favourable or unfavourable.

116 Trojan Investment Funds Trojan Investment Funds 117
TROJAN INCOME FUND ACD’s Report (continued)Fund Information (continued)
COMPARATIVE TABLES 31.01.16 31.01.15 31.01.14 (p/share) (p/share) (p/share)
‘O’ Income shares
Change in net assets per share
Opening net asset value per share 170.16 149.87 140.85
Return before operating charges* 9.90 28.45 16.81
Operating charges (1.77) (1.65) (1.56)
Return after operating charges 8.13 26.80 15.25
Distributions on income shares (6.68) (6.51) (6.23)
Closing net asset value per share 171.61 170.16 149.87
* after direct transaction costs 0.18 0.19 0.32
Performance
Return after charges 4.78% 17.88% 10.83%
Other Information
Closing net asset value (£’000) 1,352,549 1,144,657 741,033
Closing number of shares 788,152,225 672,675,819 494,466,061
Operating charges 1.02% 1.02% 1.03%
Direct transaction costs 0.11% 0.12% 0.21%
Prices
Highest share price 180.94 174.31 159.23
Lowest share price 161.89 149.08 141.32
31.01.16 31.01.15 31.01.14 (p/share) (p/share) (p/share)
‘O’ Accumulation shares
Change in net assets per share
Opening net asset value per share 264.44 223.94 202.06
Return before operating charges* 15.48 42.99 24.13
Operating charges (2.77) (2.49) (2.25)
Return after operating charges 12.71 40.50 21.88
Closing net asset value per share 277.15 264.44 223.94
Retained distributions on accumulation shares 10.45 9.80 8.99
* after direct transaction costs 0.29 0.28 0.46
Performance
Return after charges 4.81% 18.09% 10.83%
Other Information
Closing net asset value (£’000) 526,241 397,776 202,378
Closing number of shares 189,876,411 150,423,856 90,372,793
Operating charges 1.02% 1.02% 1.03%
Direct transaction costs 0.11% 0.12% 0.21%
Prices
Highest share price 283.21 264.86 232.23
Lowest share price 255.58 222.75 202.74

118 Trojan Investment Funds Trojan Investment Funds 119
TROJAN INCOME FUND ACD’s Report (continued)Fund Information (continued)
COMPARATIVE TABLES (continued) 31.01.16 31.01.15 31.01.14 (p/share) (p/share) (p/share)
‘I’ Income shares
Change in net assets per share
Opening net asset value per share 162.73 144.06 136.08
Return before operating charges* 9.44 27.27 16.21
Operating charges (2.51) (2.35) (2.23)
Return after operating charges 6.93 24.92 13.98
Distributions on income shares (6.37) (6.25) (6.00)
Closing net asset value per share 163.29 162.73 144.06
* after direct transaction costs 0.18 0.18 0.31
Performance
Return after charges 4.26% 17.30% 10.27%
Other Information
Closing net asset value (£’000) 49,809 73,216 94,786
Closing number of shares 30,503,447 44,991,509 65,795,511
Operating charges 1.52% 1.52% 1.53%
Direct transaction costs 0.11% 0.12% 0.21%
Prices
Highest share price 172.75 166.60 152.99
Lowest share price 154.26 143.30 136.54
31.01.16 31.01.15 31.01.14 (p/share) (p/share) (p/share)
‘I’ Accumulation shares
Change in net assets per share
Opening net asset value per share 258.27 219.81 199.33
Return before operating charges* 15.07 42.08 23.77
Operating charges (4.01) (3.62) (3.29)
Return after operating charges 11.06 38.46 20.48
Closing net asset value per share 269.33 258.27 219.81
Retained distributions on accumulation shares 10.19 9.60 8.86
* after direct transaction costs 0.28 0.28 0.45
Performance
Return after charges 4.28% 17.50% 10.27%
Other Information
Closing net asset value (£’000) 115,181 144,709 147,905
Closing number of shares 42,765,868 56,030,686 67,286,319
Operating charges 1.52% 1.52% 1.53%
Direct transaction costs 0.11% 0.12% 0.21%
Prices
Highest share price 275.44 258.69 227.98
Lowest share price 248.90 218.63 200.00

120 Trojan Investment Funds Trojan Investment Funds 121
TROJAN INCOME FUND ACD’s Report (continued)Fund Information (continued)
COMPARATIVE TABLES (continued) 31.01.16 31.01.15 31.01.14 (p/share) (p/share) (p/share)
‘S’ Income shares (Registered charities only)
Change in net assets per share
Opening net asset value per share 174.61 153.39 143.79
Return before operating charges* 10.16 29.18 17.17
Operating charges (1.37) (1.28) (1.20)
Return after operating charges 8.79 27.90 15.97
Distributions on income shares (6.86) (6.68) (6.37)
Closing net asset value per share 176.54 174.61 153.39
* after direct transaction costs 0.19 0.19 0.33
Performance
Return after charges 5.03% 18.19% 11.11%
Other Information
Closing net asset value (£’000) 271,116 266,936 188,496
Closing number of shares 153,573,526 152,875,095 122,889,689
Operating charges 0.77% 0.77% 0.78%
Direct transaction costs 0.11% 0.12% 0.21%
Prices
Highest share price 185.81 178.92 163.01
Lowest share price 166.43 152.59 144.28
31.01.16 31.01.15 31.01.14 (p/share) (p/share) (p/share)
‘S’ Accumulation shares (Registered charities only)
Change in net assets per share
Opening net asset value per share 265.77 224.54 202.09
Return before operating charges* 15.57 43.11 24.15
Operating charges (2.10) (1.88) (1.70)
Return after operating charges 13.47 41.23 22.45
Closing net asset value per share 279.24 265.77 224.54
Retained distributions on accumulation shares 10.52 9.84 9.01
* after direct transaction costs 0.29 0.28 0.46
Performance
Return after charges 5.07% 18.36% 11.11%
Other Information
Closing net asset value (£’000) 13,415 10,134 9,185
Closing number of shares 4,804,412 3,813,222 4,090,738
Operating charges 0.77% 0.77% 0.78%
Direct transaction costs 0.11% 0.12% 0.21%
Prices
Highest share price 285.23 266.20 232.84
Lowest share price 257.23 223.35 202.77

122 Trojan Investment Funds Trojan Investment Funds 123
TROJAN INCOME FUND ACD’s Report (continued)Fund Information (continued)
COMPARATIVE TABLES (continued) 31.01.16 31.01.15 31.01.141
(p/share) (p/share) (p/share)
‘Z’ Income shares (this class is only available for investment
by the Trojan Income Feeder Fund (Ireland))
Change in net assets per share
Opening net asset value per share 117.82 102.73 100.00
Return before operating charges* 6.88 19.61 6.12
Operating charges (0.03) (0.03) (0.02)
Return after operating charges 6.85 19.58 6.10
Distributions on income shares (4.64) (4.49) (3.37)
Closing net asset value per share 120.03 117.82 102.73
* after direct transaction costs 0.13 0.13 0.22
Performance
Return after charges 5.82% 19.06% 6.10%
Other Information
Closing net asset value (£’000) 116,063 78,567 42,365
Closing number of shares 96,694,430 66,684,948 41,239,972
Operating charges 0.02% 0.02% 0.03%2
Direct transaction costs 0.11% 0.12% 0.21%2
Prices
Highest share price 125.68 120.67 108.41
Lowest share price 112.73 102.20 97.92
1 From 15 April 2013. 2 Annualised fi gure due to share class launched less than 1 year.
31.01.16 31.01.15 31.01.141
(p/share) (p/share) (p/share)
‘Z’ Accumulation shares (this class is only available for investment
by the Trojan Income Feeder Fund (Ireland))
Change in net assets per share
Opening net asset value per share 126.42 105.96 100.00
Return before operating charges* 7.39 20.49 5.98
Operating charges (0.03) (0.03) (0.02)
Return after operating charges 7.36 20.46 5.96
Closing net asset value per share 133.78 126.42 105.96
Retained distributions on accumulation shares 5.02 4.66 3.40
* after direct transaction costs 0.14 0.13 0.22
Performance
Return after charges 5.82% 19.31% 5.96%
Other Information
Closing net asset value (£’000) – – –
Closing number of shares 250 250 250
Operating charges 0.02% 0.02% 0.03%2
Direct transaction costs 0.11% 0.12% 0.21%2
Prices
Highest share price 136.48 126.62 109.85
Lowest share price 122.83 105.40 97.85
1 From 15 April 2013. 2 Annualised fi gure due to share class launched less than 1 year.

124 Trojan Investment Funds Trojan Investment Funds 125
PORTFOLIO STATEMENTAS AT 31 JANUARY 2016
TROJAN INCOME FUND ACD’s Report (continued)Fund Information (continued)
FUND PERFORMANCE TO 31 JANUARY 2016 (%)
1 year 3 years 5 years
Trojan Income Fund 4.83 37.03 72.74
The performance of the Fund is based on the published price per ‘O’ Accumulation share which includes reinvested income.
The performance of the Fund disclosed in the above table may differ from the ‘Return after charges’ disclosed in the Comparative Table due to above performance being calculated on the latest published price prior to the year end, rather than the year end return after operating charges.
Details of the distributions per share for the year are shown in the Distribution Table on pages 143 to 145.
Holding Portfolio of Investments Value 31.01.16 £’000 %
UNITED KINGDOM – 84.52% (31.01.15 – 83.21%) OIL & GAS – 6.95% (31.01.15 – 8.13%) OIL & GAS PRODUCERS – 6.95% (31.01.15 – 8.13%) 3,900,000 BG Group 40,677 1.66 18,000,000 BP 66,663 2.73 4,200,000 Royal Dutch Shell ‘B’ 62,622 2.56
TOTAL OIL & GAS 169,962 6.95
INDUSTRIALS – 6.31% (31.01.15 – 4.74%) INDUSTRIAL TRANSPORTATION – 3.62% (31.01.15 – 2.43%) 19,500,000 Royal Mail Group 88,530 3.62
SUPPORT SERVICES – 2.69% (31.01.15 – 2.31%) 5,600,000 Experian 65,744 2.69
TOTAL INDUSTRIALS 154,274 6.31
CONSUMER GOODS – 13.63% (31.01.15 – 13.07%) FOOD PRODUCERS – 6.10% (31.01.15 – 5.21%) 5,000,000 Dairy Crest Group 31,850 1.30 3,875,000 Unilever 117,316 4.80 149,166 6.10
HOUSEHOLD GOODS & HOME CONSTRUCTION – 1.27% (31.01.15 – 1.76%) 500,000 Reckitt Benckiser Group 30,960 1.27
TOBACCO – 6.26% (31.01.15 – 6.10%) 1,400,000 British American Tobacco 53,907 2.20 2,650,000 Imperial Tobacco Group 99,243 4.06 153,150 6.26
TOTAL CONSUMER GOODS 333,276 13.63

126 Trojan Investment Funds Trojan Investment Funds 127
TROJAN INCOME FUND ACD’s Report (continued)Portfolio Statement (continued)As at 31 January 2016
Holding Portfolio of Investments Value 31.01.16 £’000 %
HEALTH CARE – 6.60% (31.01.15 – 6.24%) PHARMACEUTICALS & BIOTECHNOLOGY – 6.60% (31.01.15 – 6.24%) 1,525,000 AstraZeneca 67,588 2.77 6,500,000 GlaxoSmithKline 92,527 3.79 650,000 Indivior 1,004 0.04
TOTAL HEALTH CARE 161,119 6.60
CONSUMER SERVICES – 9.20% (31.01.15 – 8.06%) GENERAL RETAILERS – 2.86% (31.01.15 – 2.47%) 3,870,148 WH Smith 70,127 2.86
TRAVEL & LEISURE – 3.43% (31.01.15 – 2.71%) 7,020,000 Compass Group 83,749 3.43
MEDIA – 2.91% (31.01.15 – 2.88%) 6,700,000 Sky 71,087 2.91
TOTAL CONSUMER SERVICES 224,963 9.20
TELECOMMUNICATIONS – 4.50% (31.01.15 – 3.90%) MOBILE TELECOMMUNICATIONS – 4.50% (31.01.15 – 3.90%) 2,500,000 Inmarsat 26,600 1.09 38,100,000 Vodafone Group 83,439 3.41
TOTAL TELECOMMUNICATIONS 110,039 4.50
UTILITIES – 11.60% (31.01.15 – 13.44%) ELECTRICITY – 2.27% (31.01.15 – 2.43%) 3,875,000 SSE 55,490 2.27
Holding Portfolio of Investments Value 31.01.16 £’000 %
GAS, WATER & MULTIUTILITIES – 9.33% (31.01.15 – 11.01%) 34,000,000 Centrica 68,918 2.82 8,000,000 National Grid 77,648 3.18 5,300,000 Pennon Group 46,667 1.91 1,600,000 Severn Trent 34,720 1.42 227,953 9.33
TOTAL UTILITIES 283,443 11.60
FINANCIALS – 23.35% (31.01.15 – 23.24%) BANKS – 4.53% (31.01.15 – 5.30%) 11,400,000 HSBC Holdings 55,187 2.26 86,000,000 Lloyds Banking Group 55,461 2.27 110,648 4.53
NON-LIFE INSURANCE – 2.91% (31.01.15 – 4.40%) 2,425,000 Hiscox 23,777 0.97 3,061,521 Jardine Lloyd Thompson Group 25,273 1.03 3,534,821 Lancashire Holdings 22,093 0.91 71,143 2.91
REAL ESTATE INVESTMENT TRUSTS – 6.89% (31.01.15 – 4.02%) 51,676,160 Assura 27,931 1.14 5,700,000 Land Securities Group 61,902 2.53 24,000,000 LondonMetric Property 38,520 1.58 7,018,000 Newriver Retail and Material^ 23,580 0.96 15,524,000 Primary Health Properties 16,611 0.68 168,544 6.89
FINANCIAL SERVICES – 7.19% (31.01.15 – 8.28%) 9,300,001 ICAP 44,575 1.82 1,900,000 Provident Financial 54,720 2.24 1,348,000 Rathbone Brothers 30,950 1.27 1,700,000 Schroders 45,492 1.86 175,737 7.19

128 Trojan Investment Funds Trojan Investment Funds 129
TROJAN INCOME FUND ACD’s Report (continued)Portfolio Statement (continued)As at 31 January 2016
Holding Portfolio of Investments Value 31.01.16 £’000 %
EQUITY INVESTMENT INSTRUMENTS – 1.83% (31.01.15 – 1.24%) 15,300,000 3i Infrastructure 26,056 1.07 13,400,000 International Public Partnerships 18,706 0.76 44,762 1.83
TOTAL FINANCIALS 570,834 23.35
TECHNOLOGY – 2.38% (31.01.15 – 2.39%) SOFTWARE & COMPUTER SERVICES – 2.38% (31.01.15 – 2.39%) 9,500,000 Sage Group (The) 58,045 2.38
TOTAL UNITED KINGDOM 2,065,955 84.52
CONTINENTAL EUROPE – 1.74% (31.01.15 – 2.00%) 830,000 Nestlé 42,415 1.74
NORTH AMERICA – 9.17% (31.01.15 – 7.01%) 1,300,000 Altria Group 54,181 2.22 1,250,000 Coca-Cola Company (The) 37,190 1.52 2,250,000 Reynolds American 76,316 3.12 1,650,000 Verizon Communications 56,479 2.31
TOTAL NORTH AMERICA 224,166 9.17
OPTIONS – (0.03)% (31.01.15 – 0.00%) (739) Burberry Group P1,000 18.03.16 (77) (0.01) (5,820) Centrica P190 18.03.16 (262) (0.01) (18,550) Lloyds Bank P60 18.03.16 (325) (0.01)
TOTAL OPTIONS (664) (0.03)
Value 31.01.16 £’000 %
Portfolio of investments# 2,331,872 95.40 Net other assets 112,502 4.60 Net assets 2,444,374 100.00
The investments have been valued in accordance with note (h) of the Accounting Policies and are ordinary shares listed on a regulated market unless stated otherwise.
# Includes investment liabilities. ^ Quoted on the Alternative Investment Market (AIM).

130 Trojan Investment Funds Trojan Investment Funds 131
TROJAN INCOME FUND ACD’s Report (continued)SUMMARY OF MATERIAL PORTFOLIO CHANGESFOR THE YEAR ENDED 31 JANUARY 2016
Total purchases for the year £’000 (note 13) 481,092
Major purchases Cost £’000
Royal Mail Group 37,449Vodafone Group 31,643Land Securities Group 29,506Centrica 29,415Verizon Communications 28,851Assura 25,979Unilever 24,662Newriver Retail and Material 23,118Hiscox 22,887Compass Group 22,652Lloyds Banking Group 22,000GlaxoSmithKline 21,412Royal Dutch Shell ‘B’ 19,345International Public Partnerships 17,588Experian 17,457National Grid 14,487Sky 14,107AstraZeneca 14,047LondonMetric Property 11,882SSE 9,925
Total sales for the year £’000 (note 13) 139,505
Sales Proceeds £’000
Amlin 59,081 Severn Trent 15,139 Sky 12,305 Provident Financial 10,366 Reckitt Benckiser Group 9,421 Pennon Group 7,334 British American Tobacco 5,753 Sage Group (The) 5,420 National Grid 5,127 Inmarsat 4,887 Reynolds American 4,672
The summary of material portfolio changes represents the 20 largest purchases and all of the sales during the year.
FINANCIAL STATEMENTSSTATEMENT OF TOTAL RETURNFOR THE YEAR ENDED 31 JANUARY 2016
31.01.16 31.01.15 Notes £’000 £’000 £’000 £’000
Income: Net capital gains 2 42,309 244,235
Revenue 3 89,921 70,878
Expenses 4 (22,581) (17,740)
Net revenue before taxation 67,340 53,138
Taxation 5 (1,173) (941)
Net revenue after taxation 66,167 52,197
Total return before distributions 108,476 296,432
Distributions 6 (87,793) (69,342)
Change in net assets attributable to shareholders from investment activities 20,683 227,090
STATEMENT OF CHANGE IN NET ASSETS ATTRIBUTABLE TO SHAREHOLDERSFOR THE YEAR ENDED 31 JANUARY 2016 31.01.16 31.01.15 £’000 £’000 £’000 £’000
Opening net assets attributable to shareholders 2,115,995 1,426,150
Amounts receivable on issue of shares 414,812 512,404
Amounts payable on cancellation of shares (131,411) (68,384)
283,401 444,020
Stamp duty reserve tax – (263)
Change in net assets attributable to shareholders from investment activities 20,683 227,090
Retained distributions on Accumulation shares 24,295 18,998
Closing net assets attributable to shareholders 2,444,374 2,115,995

132 Trojan Investment Funds Trojan Investment Funds 133
TROJAN INCOME FUNDFinancial Statements (continued)BALANCE SHEETAS AT 31 JANUARY 2016
Notes 31.01.16 31.01.15 £’000 £’000
ASSETS
Fixed assets Investments 2,332,536 1,951,433
Current assets Debtors 7 19,887 14,270Cash and bank balances 136,101 192,974
Total assets 2,488,524 2,158,677
LIABILITIES
Investment liabilities (664) –
Creditors Distribution payable (41,212) (35,537)Other creditors 8 (2,274) (7,145)
Total liabilities (44,150) (42,682)
Net assets attributable to shareholders 2,444,374 2,115,995
NOTES TO THE FINANCIAL STATEMENTSAS AT 31 JANUARY 2016
1. ACCOUNTING POLICIES
The accounting policies described on pages 14 to 16 have been applied to the fi nancial statements of the Fund in the current and prior year. The additional accounting policy described below has also been applied to this Fund.
(a) Distribution policyThe Annual Management Charge is transferred to capital for distribution purposes in line with the Fund’s investment objective. This will increase the amount of revenue available for distribution; however, will erode capital and may constrain capital growth.
31.01.16 31.01.15 £’000 £’000
2. NET CAPITAL GAINS
The net capital gains during the year comprise: Non-derivative securities 42,481 244,246Derivative contracts (69) –Transaction charges (1) (2)Currency losses (102) (9) Net capital gains 42,309 244,235
3. REVENUE
Non-taxable dividends 87,122 69,494UK property income distributions 1,932 1,180Underwriting commision 6 –Bank interest 287 204Option premium 574 – Total revenue 89,921 70,878
4. EXPENSES
Payable to the ACD, associates of the ACD and agents of either of them: Annual Management Charge 22,079 17,331Legal and professional fees 18 19Printing costs 8 8Registration fees 82 41
22,187 17,399Payable to the Depositary, associates of the Depositary and agents of either of them: Depositary’s fees 302 246Safe custody and other bank charges 71 71
373 317

134 Trojan Investment Funds Trojan Investment Funds 135
TROJAN INCOME FUND Financial Statements (continued) Notes to the Financial Statements (continued)As at 31 January 2016
31.01.16 31.01.15 £’000 £’000
4. EXPENSES (continued)
Other expenses: FCA fee – 1Fees paid to auditor – audit 9 8
– tax services 3 3Publication costs 8 8Postage and distribution costs 1 4
21 24 Total expenses 22,581 17,740
The Investment Management fees and expenses (plus VAT thereon) for providing investment management services are paid by the ACD out of its remuneration.
31.01.16 31.01.15 £’000 £’000
5. TAXATION
a) Analysis of charge for the year Corporation tax at 20% – –Overseas tax 1,173 941 Current tax charge 1,173 941 Deferred tax – origination and reversal of timing differences (note 5c) – – Total taxation (note 5b) 1,173 941 b) Factors affecting the tax charge for the year The tax assessed for the year differs from the standard rate of corporation tax in the UK for an authorised fund (20%) (31.01.15 : 20%). The difference is explained below.
31.01.16 31.01.15 £’000 £’000
Net revenue before taxation 67,340 53,138
Corporation tax at 20% 13,468 10,628
31.01.16 31.01.15 £’000 £’000
5. TAXATION (continued)
Effects of: Non-taxable dividends (17,424) (13,899)Unutilised excess management expenses 3,956 3,271 Corporation tax charge – – Overseas tax 1,173 941 Total tax charge (note 5a) 1,173 941
c) Deferred taxAt the year end there is a potential deferred tax asset of £12,333 thousand (31.01.15 : £8,377 thousand) in relation to surplus management expenses. It is unlikely that the Fund will generate suffi cient taxable profi ts in the future to utilise this amount and, therefore, no deferred tax asset has been recognised in the current or prior year.
6. FINANCE COSTS
DistributionsThe distributions take account of revenue received on the issue of shares and revenue deducted on cancellations of shares, and comprise:
31.01.16 31.01.15 £’000 £’000
Interim 35,992 27,846Final 55,806 47,669 91,798 75,515 Add: Revenue deducted on cancellation of shares 1,443 900Deduct: Revenue received on issue of shares (5,448) (7,073) Net distributions for the year 87,793 69,342
Total fi nance costs 87,793 69,342
Details of the distributions per share are set out in the table on pages 143 to 145.

136 Trojan Investment Funds Trojan Investment Funds 137
TROJAN INCOME FUND Financial Statements (continued) Notes to the Financial Statements (continued)As at 31 January 2016
31.01.16 31.01.15 £’000 £’000
6. FINANCE COSTS (continued)
Distributions represented by:Net revenue after taxation 66,167 52,197Allocations to capital: Annual Management Charge, net of tax relief 21,619 17,136
Equalisation on conversions* 7 9Balance brought forward 1 1Balance carried forward (1) (1) Net distributions for the year 87,793 69,342
* Where an investor converts to a class with a higher income yield, the investor will receive an equalisation as if they had held the new class throughout the period from the last distribution to the conversion date. The yield differential at the point of conversion is an equalisation which will be offset by capital erosion for the converted investor.
31.01.16 31.01.15 £’000 £’000
7. DEBTORS
Amounts receivable for issue of shares 9,271 7,504 Accrued revenue: Non-taxable dividends 6,798 6,232 Bank interest 19 24
6,817 6,256 Prepaid expenses 5 5
Amounts due from brokers 3,099 – Taxation recoverable: Income tax 6 59 Overseas withholding tax 689 446
695 505 Total debtors 19,887 14,270
8. CREDITORS
Amounts payable for cancellation of shares 238 1,895 Purchases awaiting settlement – 3,465
31.01.16 31.01.15 £’000 £’000
8. CREDITORS (continued)
Accrued expenses: Amounts payable to the ACD, associates of the ACD and agents of either of them: Annual Management Charge 1,975 1,726 Legal and professional fees 2 2 Printing costs 4 4 Registration fees 9 2
1,990 1,734Amounts payable to the Depositary, associates of the Depositary and agents of either of them: Depositary’s fees 26 24 Safe custody and other bank charges 6 12
32 36 Other expenses 12 13 Taxation payable: Stamp duty reserve tax 2 2 Total creditors 2,274 7,145
9. RELATED PARTY TRANSACTIONS
Annual Management Charge and legal and professional fees payable to Capita Financial Managers Limited (‘the ACD’), registration fees payable to Capita Financial Adminstrators Limited and printing costs payable to Capita Sinclair Henderson Limited (both companies are associates of the ACD) are disclosed in note 4 and amounts due at the year end are disclosed in note 8.
The aggregate monies received and paid by the ACD through the issue of shares and paid on cancellation of shares are disclosed in the Statement of Change in Net Assets Attributable to Shareholders on page 131 and amounts due at the year end are disclosed in notes 7 and 8.
Capita Financial Managers Limited and its associates (including other authorised investment funds managed by Capita Financial Managers Limited) held 9,232,874 (31.01.15 : 10,087,277) of the Fund’s shares at the balance sheet date.
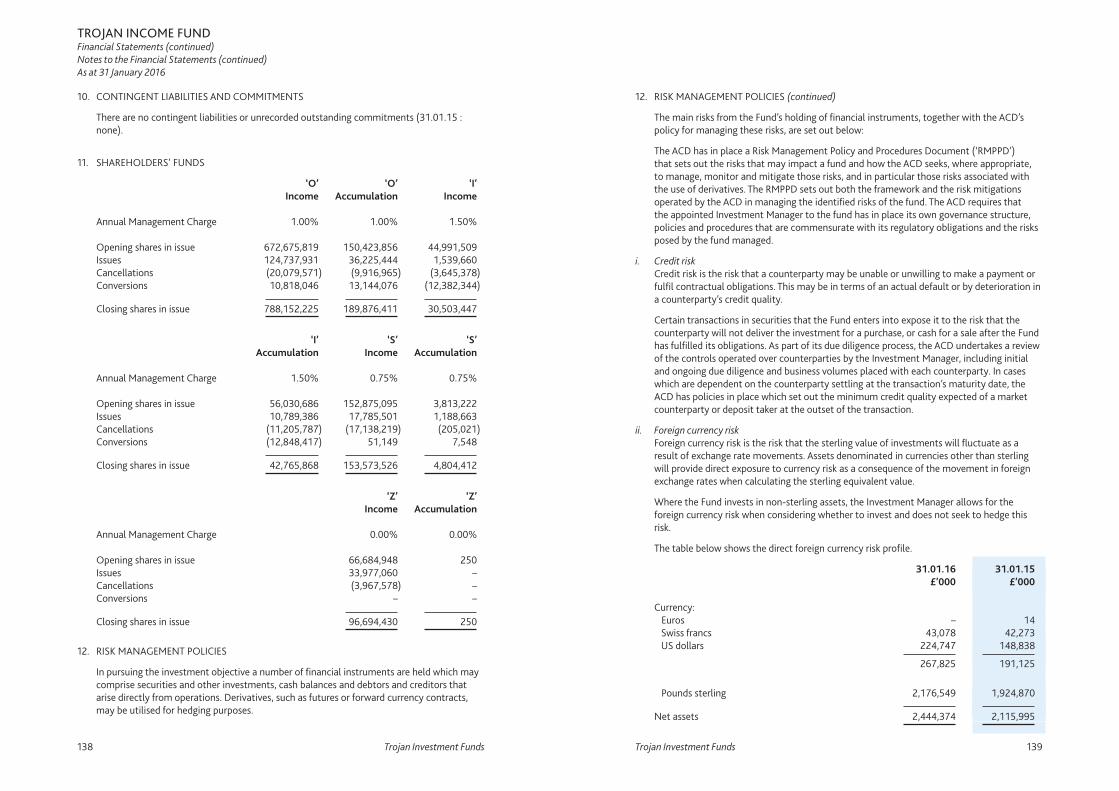
138 Trojan Investment Funds Trojan Investment Funds 139
TROJAN INCOME FUND Financial Statements (continued) Notes to the Financial Statements (continued)As at 31 January 2016
10. CONTINGENT LIABILITIES AND COMMITMENTS
There are no contingent liabilities or unrecorded outstanding commitments (31.01.15 : none).
11. SHAREHOLDERS’ FUNDS
‘O’ ‘O’ ‘I’ Income Accumulation Income
Annual Management Charge 1.00% 1.00% 1.50%
Opening shares in issue 672,675,819 150,423,856 44,991,509 Issues 124,737,931 36,225,444 1,539,660 Cancellations (20,079,571) (9,916,965) (3,645,378)Conversions 10,818,046 13,144,076 (12,382,344) Closing shares in issue 788,152,225 189,876,411 30,503,447
‘I’ ‘S’ ‘S’ Accumulation Income Accumulation
Annual Management Charge 1.50% 0.75% 0.75%
Opening shares in issue 56,030,686 152,875,095 3,813,222 Issues 10,789,386 17,785,501 1,188,663 Cancellations (11,205,787) (17,138,219) (205,021)Conversions (12,848,417) 51,149 7,548 Closing shares in issue 42,765,868 153,573,526 4,804,412
‘Z’ ‘Z’ Income Accumulation
Annual Management Charge 0.00% 0.00%
Opening shares in issue 66,684,948 250 Issues 33,977,060 – Cancellations (3,967,578) – Conversions – – Closing shares in issue 96,694,430 250
12. RISK MANAGEMENT POLICIES
In pursuing the investment objective a number of fi nancial instruments are held which may comprise securities and other investments, cash balances and debtors and creditors that arise directly from operations. Derivatives, such as futures or forward currency contracts, may be utilised for hedging purposes.
12. RISK MANAGEMENT POLICIES (continued)
The main risks from the Fund’s holding of fi nancial instruments, together with the ACD’s policy for managing these risks, are set out below:
The ACD has in place a Risk Management Policy and Procedures Document (‘RMPPD’) that sets out the risks that may impact a fund and how the ACD seeks, where appropriate, to manage, monitor and mitigate those risks, and in particular those risks associated with the use of derivatives. The RMPPD sets out both the framework and the risk mitigations operated by the ACD in managing the identifi ed risks of the fund. The ACD requires that the appointed Investment Manager to the fund has in place its own governance structure, policies and procedures that are commensurate with its regulatory obligations and the risks posed by the fund managed.
i. Credit riskCredit risk is the risk that a counterparty may be unable or unwilling to make a payment or fulfi l contractual obligations. This may be in terms of an actual default or by deterioration in a counterparty’s credit quality.
Certain transactions in securities that the Fund enters into expose it to the risk that the counterparty will not deliver the investment for a purchase, or cash for a sale after the Fund has fulfi lled its obligations. As part of its due diligence process, the ACD undertakes a review of the controls operated over counterparties by the Investment Manager, including initial and ongoing due diligence and business volumes placed with each counterparty. In cases which are dependent on the counterparty settling at the transaction’s maturity date, the ACD has policies in place which set out the minimum credit quality expected of a market counterparty or deposit taker at the outset of the transaction.
ii. Foreign currency riskForeign currency risk is the risk that the sterling value of investments will fl uctuate as a result of exchange rate movements. Assets denominated in currencies other than sterling will provide direct exposure to currency risk as a consequence of the movement in foreign exchange rates when calculating the sterling equivalent value.
Where the Fund invests in non-sterling assets, the Investment Manager allows for the foreign currency risk when considering whether to invest and does not seek to hedge this risk.
The table below shows the direct foreign currency risk profi le.
31.01.16 31.01.15 £’000 £’000
Currency: Euros – 14 Swiss francs 43,078 42,273 US dollars 224,747 148,838 267,825 191,125
Pounds sterling 2,176,549 1,924,870 Net assets 2,444,374 2,115,995

140 Trojan Investment Funds Trojan Investment Funds 141
TROJAN INCOME FUND Financial Statements (continued) Notes to the Financial Statements (continued)As at 31 January 2016
12. RISK MANAGEMENT POLICIES (continued)
iii. Liquidity riskThe main liability of the Fund is the cancellation of any shares that investors want to sell. Investments may have to be sold to fund such cancellations should insuffi cient cash be held at the bank to meet this obligation.
To reduce liquidity risk the Investment Manager will ensure that a substantial portion of the Fund’s assets consist of cash and readily realisable investments.
All fi nancial liabilities are payable in one year or less, or on demand.
iv. Market price riskMarket price risk is the risk that the value of the Fund’s fi nancial instruments will fl uctuate as a result of changes in market prices caused by factors other than interest rate or foreign currency movement. Market price risk arises primarily from uncertainty about the future prices of fi nancial instruments that the Fund holds.
Market price risk represents the potential loss the Fund may suffer through holding market positions in the face of price movements. The Fund’s investment portfolio is exposed to price fl uctuations, which are monitored by the ACD in pursuance of the investment objective and policy. The risk is generally regarded as consisting of two elements – stock specifi c risk and market risk. Adhering to investment guidelines and avoiding excessive exposure to one particular issuer can limit stock specifi c risk. Subject to compliance with the investment objective, spreading exposure across a broad range of global stocks can mitigate market risk.
v. Fair value of fi nancial assets and fi nancial liabilitiesThere is no material difference between the value of the fi nancial assets and liabilities, as shown in the balance sheet, and their fair value.
vi. DerivativesThe Fund held no derivatives of a material nature during the current and prior year.
13. PORTFOLIO TRANSACTION COSTS
Purchases /sales before Gross purchases transaction costs Commissions Taxes /net sales £’000 £’000 £’000 £’00031.01.16 Ordinary shares 478,853 576 1,663 481,092 Purchases total 478,853 576 1,663 481,092 Transaction cost % of purchases total 0.12% 0.35% Transaction cost %
of average NAV 0.03% 0.07% Ordinary shares 139,698 (193) – 139,505 Sales total 139,698 (193) – 139,505 Transaction cost %
of sales total 0.14% – Transaction cost %
of average NAV 0.01% – Average portfolio dealing spread at 31.01.16 is 0.14% (31.01.15 : 0.09%).

142 Trojan Investment Funds Trojan Investment Funds 143
TROJAN INCOME FUND Financial Statements (continued) Notes to the Financial Statements (continued)As at 31 January 2016
13. PORTFOLIO TRANSACTION COSTS (continued)
Purchases /sales before Gross purchases transaction costs Commissions Taxes /net sales £’000 £’000 £’000 £’00031.01.15 Ordinary shares 366,786 386 1,620 368,792 Purchases total 366,786 386 1,620 368,792 Transaction cost % of purchases total 0.11% 0.44% Transaction cost %
of average NAV 0.02% 0.09% Ordinary shares 22,301 (11) – 22,290 Sales total 22,301 (11) – 22,290 Transaction cost %
of sales total 0.05% – Transaction cost %
of average NAV – –
14. FAIR VALUE HIERARCHY
Investments are categorised into the following levels based on their fair value measurement:
Level 1: The unadjusted quoted price in an active market for identical assets or liabilities that the Fund can access at the year end date.
Level 2: Inputs other than quoted prices included within Level 1 that are observable (i.e. developed using market data) for the asset, either directly or indirectly.
Level 3: Inputs are unobservable (i.e. for which market data is unavailable) for the asset.
31.01.16 31.01.16 31.01.15Valuation technique Assets Liabilities Assets £’000 £’000 £’000 Level 1 2,290,747 (664) 1,878,823Level 2 41,789 – 72,610Level 3 – – – 2,332,536 (664) 1,951,433 Total portfolio of investments 2,331,872 1,951,433
DISTRIBUTION TABLEFOR THE YEAR ENDED 31 JANUARY 2016 – IN PENCE PER SHARE
EQUALISATIONEqualisation applies only to shares purchased during the distribution period (Group 2 shares –the applicable distribution periods for each distribution are shown below). It represents the accrued revenue included in the purchase price of the shares. After averaging it is returned with the distribution as a capital repayment. It is not liable to Income Tax but must be deducted from the cost of the shares for Capital Gains Tax purposes.
Group 2 Interim Final
FromTo
01.02.1531.07.15
01.08.1531.01.16
‘O’ Income shares
Interim NetRevenue
Equalisation Paid30.09.15
Paid30.09.14
Group 1Group 2
2.7300 0.8890
– 1.8410
2.7300 2.7300
2.6500 2.6500
Final NetRevenue
Equalisation Payable31.03.16
Paid31.03.15
Group 1Group 2
3.9465 1.4151
– 2.5314
3.9465 3.9465
3.8636 3.8636
‘O’ Accumulation shares
Interim NetRevenue
Equalisation Allocated30.09.15
Allocated30.09.14
Group 1Group 2
4.2428 1.3976
– 2.8452
4.2428 4.2428
3.9586 3.9586
Final NetRevenue
Equalisation Allocation31.03.16
Allocated31.03.15
Group 1Group 2
6.2068 2.2213
– 3.9855
6.2068 6.2068
5.8433 5.8433

144 Trojan Investment Funds Trojan Investment Funds 145
TROJAN INCOME FUNDFinancial Statements (continued)Distribution Table (continued)
‘I’ Income shares
Interim NetRevenue
Equalisation Paid30.09.15
Paid30.09.14
Group 1Group 2
2.7300 0.9202
– 1.8098
2.7300 2.7300
2.6500 2.6500
Final NetRevenue
Equalisation Payable31.03.16
Paid31.03.15
Group 1Group 2
3.6387 1.3099
– 2.3288
3.6387 3.6387
3.5956 3.5956
‘I’ Accumulation shares
Interim NetRevenue
Equalisation Allocated30.09.15
Allocated30.09.14
Group 1Group 2
4.3342 1.4608
– 2.8734
4.3342 4.3342
4.0424 4.0424
Final NetRevenue
Equalisation Allocation31.03.16
Allocated31.03.15
Group 1Group 2
5.8510 2.3879
– 3.4631
5.8510 5.8510
5.5596 5.5596
‘S’ Income shares (Registered charities only)
Interim NetRevenue
Equalisation Paid30.09.15
Paid30.09.14
Group 1Group 2
2.7300 0.5474
– 2.1826
2.7300 2.7300
2.6500 2.6500
Final NetRevenue
Equalisation Payable31.03.16
Paid31.03.15
Group 1Group 2
4.1312 1.6682
– 2.4630
4.1312 4.1312
4.0262 4.0262
‘S’ Accumulation shares (Registered charities only)
Interim NetRevenue
Equalisation Allocated30.09.15
Allocated30.09.14
Group 1Group 2
4.1556 3.2942
– 0.8614
4.1556 4.1556
3.8786 3.8786
Final NetRevenue
Equalisation Allocation31.03.16
Allocated31.03.15
Group 1Group 2
6.3605 2.6519
– 3.7086
6.3605 6.3605
5.9631 5.9631
‘Z’ Income shares (this class is only available for investment by the
Trojan Income Feeder Fund (Ireland))
Interim NetRevenue
Equalisation Paid30.09.15
Paid30.09.14
Group 1Group 2
1.9000 0.3058
– 1.5942
1.9000 1.9000
1.8250 1.8250
Final NetRevenue
Equalisation Payable31.03.16
Paid31.03.15
Group 1Group 2
2.7444 0.8761
– 1.8683
2.7444 2.7444
2.6609 2.6609
‘Z’ Accumulation shares (this class is only available for investment by the
Trojan Income Feeder Fund (Ireland))
Interim NetRevenue
Equalisation Allocated30.09.15
Allocated30.09.14
Group 1Group 2
2.0511 2.0511
– 0.0000
2.0511 2.0511
1.8858 1.8858
Final NetRevenue
Equalisation Allocation31.03.16
Allocated31.03.15
Group 1Group 2
2.9680 2.9680
– 0.0000
2.9680 2.9680
2.7760 2.7760

146 Trojan Investment Funds Trojan Investment Funds 147
CRYSTAL FUNDACD’S REPORTFOR THE YEAR ENDED 31 JANUARY 2016
IMPORTANT INFORMATIONRefer to the ‘Important Information’ section of the Company on page 8.
INVESTMENT OBJECTIVE AND POLICYThe investment objective of the Crystal Fund (‘the Fund’) is to achieve growth in capital over the longer term with a particular emphasis on preservation. The Fund’s policy is to invest substantially in UK and overseas equities and fi xed interest securities, but may also invest in collective investment schemes and money market instruments.
CAPITA FINANCIAL MANAGERS LIMITEDACD of Crystal Fund3 May 2016
INVESTMENT MANAGER’S REPORT
For the year to 31 January 2016, the Fund produced a total return of +1.6% compared to a return +0.4%* in the LIBID Index (total return) and -4.6%* in the FTSE All-Share Index (total return).
ASSET ALLOCATION AS AT 31 JANUARY 2016
MARKET REVIEWIn December, after another year of apparent indecisiveness, the Federal Reserve (‘the Fed’) decided to raise US interest rates for the fi rst time since 2006. Given deteriorating global economic fundamentals, it seems a strange time to be tightening monetary policy and, with hindsight, the Fed’s decision may prove too little too late. There is little prospect of interest rate rises elsewhere in the world and we would not be surprised to see the Fed’s decision reversed in 2016. Negative nominal interest rates and a fourth round of Quantitative Easing may be on the menu before the year ends – a policy reversal which would lead to a weaker US dollar and the potential loss of credibility for central banks.
The past two years have been boring at the headline market level, but 2016 has been anything but dull. Stock markets have had the worst start to the year for decades. Much of this shift has been blamed on the weakening Chinese economy and currency and the (not unrelated) fall in the oil price. But there is more to it than that. The fall in oil has led to tighter monetary conditions for many, pushing the US dollar higher. For years a weak dollar has provided a tide of liquidity that has buoyed asset prices and economic activity. Now that tide of liquidity is reversing and has become a tide of tightening for those that have dollar debt obligations. World trade has collapsed to near 2008 levels and corporate profi tability has fallen, which is evident from the pressures on cash fl ows. Corporate bond yields have been rising, especially in High Yield Bonds, as fi nancial conditions deteriorate. Market action underlines the point that normalising interest rates looks an unachievable target for the Fed.
* Source: Bloomberg, bid to bid basis, net income reinvested at ex-dividend date, sterling terms. The indices used by the Investment Manager are for comparison purposes. No benchmark is required to be disclosed per the Prospectus.
UK Equities 15%
Overseas Equities 36%
US Index-Linked 8%
UK Index-Linked 13%
Gold Shares 1%
Gold 9%
Net other assets (Inc. UK T-Bills) 18%

148 Trojan Investment Funds Trojan Investment Funds 149
CRYSTAL FUNDACD’s Report (continued)Investment Manager’s Report (continued)For the year ended 31 January 2016
MARKET REVIEW (continued)Headline market moves also disguise the bifurcation of the market. The decade-long over-investment in natural resources has proven, with hindsight, to have been a bubble that has now spectacularly burst. Companies involved in extracting natural resources have been subject to a vicious bear market. In contrast to this, companies selling staples to western consumers have enjoyed an equally notable bull run. We have largely avoided the carnage of the energy and metals crash and have benefi tted from the relentless rerating upwards of consumer staple stocks. Both these trends cannot and will not go on forever. We will have to endure both absolute and relative pain when these remarkable trends reverse.
PORTFOLIOWe look for investments that we see as having not too much risk, but the scope for plenty of reward. Today, the two most important asset classes-bonds and equities- possess the opposite qualities, a great deal of potential risk for little deserved reward. When both bonds and equities are expensive, the very long duration of stocks makes them particularly vulnerable to pernicious drawdowns. The portfolio is unsurprisingly defensively positioned with a greater emphasis on return of capital than return on capital. In a world of scarce earnings growth, the market has become impatient. Investors have rushed to pay huge premiums for revenue growth and earnings dependability. Our stance instead has instead been one of purposeful inactivity. We are waiting for the companies we like to trade at valuations we like. As a reminder we have a bias towards businesses that enjoy strong and predictable cash generation; demonstrate sustainably high returns on capital; and possess easy-to-understand growth opportunities. The few portfolio changes that were made were more tactical than strategic in nature.
Growing fears that the last decade of impressive emerging market economic growth is over, combined with blossoming hope that a fall in gas prices will support US disposable incomes have powerfully combined to boost the stock prices of US consumer staple companies that predominantly serve the domestic market. We therefore elected to reduce the Fund’s holdings of Altria Group, Dr Pepper Snapple Group and Reynolds American on record price-to-earnings multiples. The share price strength of the domestic US tobacco companies has been in stark contrast to international peers. British American Tobacco (‘BAT’) has wonderful emerging market franchises and so it’s resilient operating power is being somewhat obfuscated by overseas currency weakness. The long-term growth profi le of BAT looks better than that of either Altria or Reynolds, yet the valuations of the former is more modest. We therefore increased the Fund’s holdings of BAT. BAT also owns 42% of Reynolds American so this holding effectively gives us a discounted way of owning Reynolds American.
Persistent stock price weakness in American Express Company also allowed us to add to our one fi nancial holding. American Express Company is fi nding corporate life tougher as competitor credit card issuers, fi nally restored to health, compete more vigorously for affl uent Americans’ share of wallet. We believe the ‘American Express’ brand is strong enough to ensure the company’s growth will remain attractive and the Fund’s economic interest in this unique fi nancial franchise will grow thanks to the Board’s commitment to large and sensibly priced share repurchases. In contrast, the decision by the board of Becton, Dickinson and Company to sanction an expensive acquisition at the expense of a buyback programme and a pristine balance sheet encouraged us to take profi ts from this longstanding holding.
We also further reduced the Fund’s interest in Microsoft Corporation on valuation concerns. Microsoft’s earnings per share have been stagnant for a number of years, but its share price has raced ahead meaning there is little margin for future disappointment. Coincidentally, we also
reduced the holding of the Fund’s other technology investment, Sage Group. For years Sage has been perceived to be a low growth, lumbering technological relic, but a remarkable turnaround in investor perceptions has seen it become one of the FTSE’s most richly valued constituents.
We disposed of the holding of Newcrest Mining in its entirety. Subsequent to our initial investment, Newcrest’s management decided to launch a hostile bid for Lihir Mining. Hindsight has proved that they overpaid for the business and Newcrest is unlikely to make a cumulative positive return on this ill-gotten venture. The resulting balance sheet is over-indebted and more capital needs to be sunk into Lihir and other mines to replace extracted ounces of gold. We prefer to hold companies that pay us to own them and we could have been waiting years before a dividend cheque lands on the doormat. We also reduced the holdings in Better Capital 2012. This has been a disappointing investment as the manager has proven to be overconfi dent and too stretched. We take some solace in the knowledge that the holdings were only ever an immaterial percentage of net asset value.
Finally we bought three new equity stakes in A.G. BARR, Procter & Gamble Company and PZ Cussons. All three companies sell goods that are found in the kitchens and bathrooms up and down the country and have done so for generations. However, all three have suffered from recent tough trading and have experienced share price falls. We therefore took advantage of a decline in their respective valuations to initiate these holdings. If sentiment continues to change for the worse we would enthusiastically increase Crystal’s economic exposure to these unique time-tested value-creating franchises.
OUTLOOKZero interest rates intendedly pull and unintendedly push. They are designed to pull forward in time the consumption of goods and accelerate asset price returns. Central banks have certainly had unquestionable success with the latter and only qualifi ed success with the former. However, the unintended consequences of zero interest rates are beginning to reveal themselves. Zero interest rates have unintentionally pushed infl ation backward in time. Low interest rates force many savers to actually defer consumption as they have to save even more to maintain prevailing interest income. Low interest rates also allow the marginal and ineffi cient incumbent producers to struggle on, whilst emboldening new entrants and disrupters to enter the competitive fi eld. Zero interest rates reduce the rate of return hurdle for corporations. Industry disruptors like Amazon, Uber and Airbnb are able to invest aggressively as fi nancial markets are willing to accept very low short-term rates of return. The combined result is insuffi cient demand facing excess supply. The drip of zero interest rates has been a placebo for demand; saline for the over-borrowed and ecstasy for the ambitious. The loose monetary policy forced upon the world by central bankers to fi ght defl ation has, in fact contributed to it.
If zero interest rates stretch the imagination then negative interest rates blow the mind. But interest rates in many parts of the world have breached the zero bound. Logically, interest rates should always be positive. People should prefer a euro or a dollar today to something less than a euro or a dollar in the future. Negative interest rates are a tax on cash and savers can literally avoid negative interest rates by sticking their savings under the mattress… or better still swapping it for gold. We are worried that central bankers rather than accepting that their past prescriptions have been the wrong response will instead reach out for even more unorthodox ‘solutions’. Respected commentators are increasingly calling on central banks to fund fi scal splurges. The strategist, James Montier of GMO, says “this sounds a little like Rumpelstiltskin spinning straw into gold” and it is.

150 Trojan Investment Funds Trojan Investment Funds 151
FUND INFORMATION
CRYSTAL FUNDACD’s Report (continued)Investment Manager’s Report (continued)For the year ended 31 January 2016
OUTLOOK (continued)In an environment of near universally overvalued asset markets it is likely to be easier to navigate the post-market falls then to avoid the falls themselves. This is because with both equities and bonds looking vulnerable, traditional asset diversifi cation may not protect to the same extent that it has in the past.
2016 will hopefully present the long-awaited opportunity to exploit equity market declines. Yet for the time being we remain circumspect. There are indications that corporate profi tability has peaked for this cycle, along with ultra-low corporate fi nancing costs which have supported dividends and share buybacks. There remains a chasm between the prices of individual stocks that we would wish to own and our own appraisal of their fair values. Thankfully, that chasm has begun to close and we look forward to making the step towards being more fully invested in equities.
TROY ASSET MANAGEMENT LIMITEDInvestment Manager23 February 2016
SYNTHETIC RISK AND REWARD INDICATOR
Typically lower rewards Typically higher rewards
Lower risk Higher risk
1 2 3 4 5 6 7
This indicator shows how much a fund has risen and fallen in the past, and therefore how much a fund’s returns have varied. It is a measure of a fund’s volatility. The higher a fund’s past volatility the higher the number on the scale and the greater the risk that investors in that fund may have made losses as well as gains. The lowest number on the scale does not mean that a fund is risk free.
The Fund has been classed as 4 because its volatility has been measured as average.
This indicator is based on historical data and may not be a reliable indication of the future risk profi le of this Fund.
The risk and reward profi le shown is not guaranteed to remain the same and may shift over time.
RISK WARNINGAn investment in an open-ended investment company should be regarded as a medium to long term investment. Investors should be aware that the price of shares and the income from them can fall as well as rise and investors may not receive back the full amount invested. Past performance is not a guide to future performance. Investments denominated in currencies other than the base currency are subject to fl uctuation in exchange rates, which can be favourable or unfavourable.

152 Trojan Investment Funds Trojan Investment Funds 153
CRYSTAL FUND ACD’s Report (continued)Fund Information (continued)
COMPARATIVE TABLEWhere the Fund has signifi cant investment in collective investment schemes, the operating charges take account of the ongoing charges incurred in the underlying schemes, calculated as the expense value of such holdings at the period end weighted against the net asset value of the share class at that date.
31.01.16 31.01.15 31.01.14 (p/share) (p/share) (p/share)
Income shares
Change in net assets per share
Opening net asset value per share 209.98 188.92 197.99
Return before operating charges* 5.54 24.64 (5.03)
Operating charges (2.38) (2.30) (2.30)
Return after operating charges 3.16 22.34 (7.33)
Distributions on income shares (1.12) (1.28) (1.74)
Closing net asset value per share 212.02 209.98 188.92
* after direct transaction costs 0.05 0.02 0.05
Performance
Return after charges 1.50% 11.83% (3.70)%
Other Information
Closing net asset value (£’000) 46,312 46,231 42,305
Closing number of shares 21,843,393 22,016,527 22,392,587
Operating charges 1.15% 1.15% 1.16%
Direct transaction costs 0.02% 0.01% 0.02%
Prices
Highest share price 212.64 211.31 206.93
Lowest share price 199.20 188.34 189.51
FUND PERFORMANCE TO 31 JANUARY 2016 (%)
1 year 3 years 5 years
Crystal Fund 1.58 8.96 31.34
The performance of the Fund is based on the published price per share with income reinvested.
The performance of the Fund disclosed in the above table may differ from the ‘Return after charges’ disclosed in the Comparative Table due to above performance being calculated on the latest published price prior to the year end, rather than the year end return after operating charges.
Details of the distributions per share for the year are shown in the Distribution Table on page 170.

154 Trojan Investment Funds Trojan Investment Funds 155
CRYSTAL FUNDACD’s Report (continued)PORTFOLIO STATEMENTAS AT 31 JANUARY 2016
Holding Portfolio of Investments Value 31.01.16 £’000 %
DEBT SECURITIES – 30.93% (31.01.15 – 33.70%) £2,500,000 Treasury 0% 25.04.2016 2,495 5.39 £2,500,000 Treasury 0% 25.07.2016 2,493 5.38 £3,046,300 Treasury 0.125% index-linked 2024 3,533 7.63 £1,518,000 Treasury 1.875% index-linked 2022 2,307 4.98 US$3,166,000 US Treasury 0.125% Infl ation Protected Securities 2022 2,293 4.95 US$1,500,000 US Treasury 1.375% Infl ation Protected Securities 2020 1,205 2.60
TOTAL DEBT SECURITIES 14,326 30.93 EQUITIES – 51.38% (31.01.15 – 48.52%) UNITED KINGDOM – 14.91% (31.01.15 – 12.79%) 117,200 A.G. BARR 620 1.34 304,000 Better Capital 2009 231 0.50 212,000 Better Capital 2012 84 0.18 45,742 British American Tobacco 1,761 3.80 31,356 Diageo 587 1.27 47,000 GlaxoSmithKline 669 1.44 124,555 PZ Cussons 325 0.70 219,827 Sage Group (The) 1,343 2.90 42,500 Unilever 1,287 2.78
TOTAL UNITED KINGDOM 6,907 14.91 CONTINENTAL EUROPE – 3.57% (31.01.15 – 3.57%) 32,400 Nestlé 1,656 3.57 AUSTRALIA – 0.00% (31.01.15 – 0.53%) – – NORTH AMERICA – 32.90% (31.01.15 – 31.63%) 15,500 Agnico-Eagle Mines 313 0.68 31,634 Altria Group 1,318 2.85 15,000 American Express Company 554 1.20 9,000 Becton, Dickinson and Company 895 1.93 6 Berkshire Hathaway 796 1.72 35,000 Coach 876 1.89 55,600 Coca-Cola Company (The) 1,654 3.57
Holding Portfolio of Investments Value 31.01.16 £’000 %
NORTH AMERICA – 32.90% (31.01.15 – 31.63%) (continued) 16,000 Colgate-Palmolive Company 727 1.57 16,000 Dr Pepper Snapple Group 1,030 2.22 50,604 Imperial Oil 1,078 2.33 14,636 Johnson & Johnson 1,046 2.26 44,000 Microsoft Corporation 1,601 3.46 24,958 Philip Morris International 1,554 3.35 9,500 Procter & Gamble Company (The) 530 1.14 37,241 Reynolds American 1,263 2.73
TOTAL NORTH AMERICA 15,235 32.90
TOTAL EQUITIES 23,798 51.38 COMMODITIES – 10.21% (31.01.15 – 11.37%) 111,363 BlackRock Gold and General* 627 1.35 24,746 ETFS Physical Swiss Gold* 1,878 4.06 30,000 Gold Bullion Securities* 2,222 4.80
TOTAL COMMODITIES 4,727 10.21 FORWARD CURRENCY CONTRACTS – (1.12)% (31.01.15 – (0.84)%) US$(17,780,000) Vs £11,906,755 (expiry 21.03.16) (521) (1.12) Portfolio of investments# 42,330 91.40 Net other assets 3,982 8.60 Net assets 46,312 100.00 The investments have been valued in accordance with note (h) of the
Accounting Policies and are ordinary shares listed on a regulated market unless stated otherwise.
* Collective investment scheme. # Includes investment liabilities.

156 Trojan Investment Funds Trojan Investment Funds 157
CRYSTAL FUND ACD’s Report (continued)SUMMARY OF MATERIAL PORTFOLIO CHANGESFOR THE YEAR ENDED 31 JANUARY 2016
Total purchases for the year £’000 (note 13) 7,736 Purchases Cost £’000 Treasury 2% 2016 6,044 A.G. BARR 628 Procter & Gamble Company (The) 425 PZ Cussons 354 American Express Company 225 British American Tobacco 60 In addition to above, purchases of £18,384 thousand were made in short term investments during the year. Total sales for the year £’000 (note 13) 7,889 Sales Proceeds £’000 Treasury 2% 2016 6,000 Microsoft Corporation 497 Reynolds American 371 Newcrest Mining 247 Dr Pepper Snapple Group 240 Becton, Dickinson and Company 186 Sage Group (The) 177 Altria Group 134 Better Capital 2012 37 In addition to above, sales of £19,579 thousand were made in short term investments during the year. The summary of material portfolio changes represents all of the purchases and sales during the year.
FINANCIAL STATEMENTSSTATEMENT OF TOTAL RETURNFOR THE YEAR ENDED 31 JANUARY 2016
31.01.16 31.01.15 Notes £’000 £’000 £’000 £’000
Income: Net capital gains 2 439 4,669
Revenue 3 813 827
Expenses 4 (501) (486)
Net revenue before taxation 312 341
Taxation 5 (66) (55)
Net revenue after taxation 246 286
Total return before distributions 685 4,955
Distributions 6 (246) (286)
Change in net assets attributable to shareholders from investment activities 439 4,669
STATEMENT OF CHANGE IN NET ASSETS ATTRIBUTABLE TO SHAREHOLDERSFOR THE YEAR ENDED 31 JANUARY 2016 31.01.16 31.01.15 £’000 £’000
Opening net assets attributable to shareholders 46,231 42,305
Amounts payable on cancellation of shares (358) (743)
Change in net assets attributable to shareholders from investment activities 439 4,669
Closing net assets attributable to shareholders 46,312 46,231

158 Trojan Investment Funds Trojan Investment Funds 159
CRYSTAL FUNDFinancial Statements (continued)BALANCE SHEETAS AT 31 JANUARY 2016
Notes 31.01.16 31.01.15 £’000 £’000
ASSETS
Fixed assets Investments 42,851 43,270
Current assets Debtors 7 261 36Cash and bank balances 3,846 3,468
Total assets 46,958 46,774
LIABILITIES
Investment liabilities (521) (391)
Creditors Bank overdrafts – (33)Distribution payable 6 (70) (64)Other creditors 8 (55) (55)
Total liabilities (646) (543)
Net assets attributableto shareholders 46,312 46,231
NOTES TO THE FINANCIAL STATEMENTSAS AT 31 JANUARY 2016
1. ACCOUNTING POLICIES
The accounting policies described on pages 14 to 16 have been applied to the fi nancial statements of the Fund in the current and prior year.
31.01.16 31.01.15 £’000 £’000
2. NET CAPITAL GAINS
The net capital gains during the year comprise: Non-derivative securities 936 5,421Forward currency contracts (310) (756)AMC rebates from underlying investments 3 1Currency (losses)/gains (190) 3 Net capital gains 439 4,669
3. REVENUE
Non-taxable dividends 646 635Unfranked interest 163 188Bank interest 4 4 Total revenue 813 827
4. EXPENSES
Payable to the ACD, associates of the ACD and agents of either of them: Annual Management Charge 453 442Legal and professional fees 3 3Printing costs 4 3Registration fees 11 2
471 450Payable to the Depositary, associates of the Depositary and agents of either of them: Depositary’s fees 16 21Safe custody and other bank charges 3 3
19 24

160 Trojan Investment Funds Trojan Investment Funds 161
CRYSTAL FUND Financial Statements (continued) Notes to the Financial Statements (continued)As at 31 January 2016
31.01.16 31.01.15 £’000 £’000
4. EXPENSES (continued)
Other expenses:
Fees paid to auditor – audit 8 9– tax services 3 3
11 12 Total expenses 501 486
The Investment Management fees and expenses (plus VAT thereon) for providing investment management services are paid by the ACD out of its remuneration.
31.01.16 31.01.15 £’000 £’000
5. TAXATION
a) Analysis of charge for the year Corporation tax at 20% – –Overseas tax 66 55 Current tax charge 66 55 Deferred tax – origination and reversal of timing differences (note 5c) – – Total taxation (note 5b) 66 55
b) Factors affecting the tax charge for the yearThe tax assessed for the year differs from the standard rate of corporation tax in the UK for an authorised fund (20%) (31.01.15 : 20%). The difference is explained below.
31.01.16 31.01.15 £’000 £’000
Net revenue before taxation 312 341
Corporation tax at 20% 62 68
Effects of: Non-taxable dividends (129) (127)RPI movement on UK index-linked gilts (16) (12)AMC rebates taken to capital 1 –Unutilised excess management expenses 82 71 Corporation tax charge – –
31.01.16 31.01.15 £’000 £’000
5. TAXATION (continued)
Overseas tax 66 55 Total tax charge (note 5a) 66 55
c) Deferred taxAt the year end there is a potential deferred tax asset of £449 thousand (31.01.15 : £367 thousand) in relation to surplus management expenses. It is unlikely that the Fund will generate suffi cient taxable profi ts in the future to utilise this amount and, therefore, no deferred tax asset has been recognised in the current or prior year.
6. FINANCE COSTS
DistributionsThe distributions take account of revenue deducted on cancellations of shares, and comprise:
31.01.16 31.01.15 £’000 £’000
Interim 175 220Final 70 64 245 284 Add: Revenue deducted on cancellation of shares 1 2 Net distributions for the year 246 286 Total fi nance costs 246 286
Details of the distributions per share are set out in the table on page 170.
31.01.16 31.01.15 £’000 £’000
7. DEBTORS
Sales awaiting settlement 221 – Accrued revenue: Non-taxable dividends 10 5 Unfranked interest 10 9 Bank interest – 1
20 15

162 Trojan Investment Funds Trojan Investment Funds 163
CRYSTAL FUND Financial Statements (continued) Notes to the Financial Statements (continued)As at 31 January 2016
31.01.16 31.01.15 £’000 £’000
7. DEBTORS (continued)
Taxation recoverable: Overseas withholding tax 20 21 Total debtors 261 36
8. CREDITORS
Accrued expenses: Amounts payable to the ACD, associates of the ACD and agents of either of them: Annual Management Charge 39 39 Printing costs 2 2 Registration fees 1 –
42 41Amounts payable to the Depositary, associates of the Depositary and agents of either of them: Depositary’s fees 2 2 Other expenses 11 12 Total creditors 55 55
9. RELATED PARTY TRANSACTIONS
Annual Management Charge and legal and professional fees payable to Capita Financial Managers Limited (‘the ACD’), registration fees payable to Capita Financial Administrators Limited and printing costs payable to Capita Business Services Limited (both companies are associates of the ACD) are disclosed in note 4 and amounts due at the year end are disclosed in note 8.
The aggregate monies received by the ACD through the issue and cancellation of shares are disclosed in the Statement of Change in Net Assets Attributable to Shareholders on page 157 and amounts due at the year end are disclosed in notes 7 and 8.
A shareholder may be able to exercise signifi cant infl uence over the fi nancial and operating policies of a Fund and as such is deemed to be a related party. At the balance sheet date two shareholders held 64.61% and 35.09% of the shares in issue of the Fund (31.01.15 : 64.89% and 35.11% respectively).
10. CONTINGENT LIABILITIES AND COMMITMENTS
There are no contingent liabilities or unrecorded outstanding commitments (31.01.15 : none).
11. SHAREHOLDERS’ FUNDS
Income
Annual Management Charge 1.00%
Opening shares in issue 22,016,527 Issues – Cancellations (173,134) Closing shares in issue 21,843,393
12. RISK MANAGEMENT POLICIES
In pursuing the investment objective a number of fi nancial instruments are held which may comprise securities and other investments, cash balances and debtors and creditors that arise directly from operations. Derivatives, such as futures or forward currency contracts, may be utilised for hedging purposes.
The main risks from the Fund’s holding of fi nancial instruments, together with the ACD’s policy for managing these risks, are set out below:
The ACD has in place a Risk Management Policy and Procedures Document (‘RMPPD’) that sets out the risks that may impact a fund and how the ACD seeks, where appropriate, to manage, monitor and mitigate those risks, and in particular those risks associated with the use of derivatives. The RMPPD sets out both the framework and the risk mitigations operated by the ACD in managing the identifi ed risks of the fund. The ACD requires that the appointed Investment Manager to the fund has in place its own governance structure, policies and procedures that are commensurate with its regulatory obligations and the risks posed by the fund managed.
i. Credit riskCredit risk is the risk that a counterparty may be unable or unwilling to make a payment or fulfi l contractual obligations. This may be in terms of an actual default or by deterioration in a counterparty’s credit quality.
Certain transactions in securities that the Fund enters into expose it to the risk that the counterparty will not deliver the investment for a purchase, or cash for a sale after the Fund has fulfi lled its obligations. As part of its due diligence process, the ACD undertakes a review of the controls operated over counterparties by the Investment Manager, including initial and ongoing due diligence and business volumes placed with each counterparty. In cases which are dependent on the counterparty settling at the transaction’s maturity date, the ACD has policies in place which set out the minimum credit quality expected of a market counterparty or deposit taker at the outset of the transaction.

164 Trojan Investment Funds Trojan Investment Funds 165
CRYSTAL FUND Financial Statements (continued) Notes to the Financial Statements (continued)As at 31 January 2016
12. RISK MANAGEMENT POLICIES (continued)
i. Credit risk (continued) The bond investments held are exposed to credit risk which refl ects the ability of the issuer to meet its obligations. The ACD monitors the credit rating of bond holdings.
Credit Quality 31.01.16 31.01.15 % %
Investment grade debt securities 20.16 20.13 Non-rated debt securities* 10.77 13.57 Other investments 60.47 59.05 Net other assets 8.60 7.25 100.00 100.00 * UK treasury bills
ii. Interest rate riskInterest rate risk is the risk that the value of the Fund’s investments will fl uctuate as a result of interest rate changes. The value of fi xed interest securities may be affected by changes in interest rates, either globally or locally. Changes in the rate of return in one asset class may infl uence the valuation basis of other classes. The amount of revenue receivable from fl oating rate investments and bank balances or payable on bank overdrafts will be affected by fl uctuations in interest rates. Investment in collective investment schemes exposes the Fund to indirect interest rate risk to the extent that they invest in interest bearing securities, the returns from which will be affected by fl uctuations in interest rates.
The Fund will at times have signifi cant exposure to interest rate risk. This risk is actively managed at all times taking into account the correlations with other risks in the portfolio.
The table below shows the direct interest rate risk profi le:
31.01.16 31.01.15 £’000 £’000
Floating rate assets: US dollars 4,488 3,533 Pounds sterling 8,696 9,242
13,184 12,775Floating rate liabilities: Pounds sterling – (33) Fixed rate assets: Singapore dollars – 1,274 Pounds sterling 4,988 4,996
4,988 6,270
31.01.16 31.01.15 £’000 £’000
12. RISK MANAGEMENT POLICIES (continued)
ii. Interest rate risk (continued)Assets on which interest is not paid: Australian dollars – 245 Canadian dollars 1,391 1,553 Swiss francs 1,676 1,672 US dollars 18,063 17,512 Pounds sterling 19,563 15,707
40,693 36,689Liabilities on which interest is not paid: US dollars (12,428) (9,351) Pounds sterling (125) (119)
(12,553) (9,470) Net assets 46,312 46,231
The fl oating rate fi nancial assets and liabilities comprise bank balances and bank overdraft positions which earn or pay interest at rates linked to the Bank of England base rate or its international equivalents and index-linked securites that earn interest at rates adjusted to changes in the UK Retail Prices Index (RPI) or its international equivalent.
Fixed rate fi nancial assets held in the current year is 0% UK government bond and prior year are 0% UK and Singapore government bonds held for short term investment purposes.
iii. Foreign currency riskForeign currency risk is the risk that the sterling value of investments will fl uctuate as a result of exchange rate movements. Assets denominated in currencies other than sterling will provide direct exposure to currency risk as a consequence of the movement in foreign exchange rates when calculating the sterling equivalent value. Forward currency contracts are employed by the Investment Manager, where deemed appropriate, to mitigate the foreign exchange risk. Investment in collective investment schemes may provide indirect exposure to currency risk as a consequence of the movement in foreign exchange rates.
The table below shows the direct foreign currency risk profi le:
31.01.16 31.01.16 31.01.16 Gross £’000 Hedged £’000 Net £’000
Currency: Canadian dollars 1,391 – 1,391 Swiss francs 1,676 – 1,676 US dollars 22,551 (12,428) 10,123 25,618 (12,428) 13,190
Pounds sterling 21,215 11,907 33,122 Net assets 46,833 (521) 46,312

166 Trojan Investment Funds Trojan Investment Funds 167
CRYSTAL FUND Financial Statements (continued) Notes to the Financial Statements (continued)As at 31 January 2016
12. RISK MANAGEMENT POLICIES (continued)
31.01.15 31.01.15 31.01.15 Gross £’000 Hedged £’000 Net £’000
iii. Foreign currency risk (continued)Currency: Australian dollars 245 – 245 Canadian dollars 1,553 – 1,553 Singapore dollars 1,274 – 1,274 Swiss francs 1,672 – 1,672 US dollars 21,045 (9,351) 11,694 25,789 (9,351) 16,438
Pounds sterling 20,833 8,960 29,793 Net assets 46,622 (391) 46,231
iv. Liquidity riskThe main liability of the Fund is the cancellation of any shares that investors want to sell. Investments may have to be sold to fund such cancellations should insuffi cient cash be held at the bank to meet this obligation.
To reduce liquidity risk the Investment Manager will ensure that a substantial portion of the Fund’s assets consist of cash and readily realisable investments.
All fi nancial liabilities are payable in one year or less, or on demand.
v. Market price riskMarket price risk is the risk that the value of the Fund’s fi nancial instruments will fl uctuate as a result of changes in market prices caused by factors other than interest rate or foreign currency movement. Market price risk arises primarily from uncertainty about the future prices of fi nancial instruments that the Fund holds.
Market price risk represents the potential loss the Fund may suffer through holding market positions in the face of price movements. The Fund’s investment portfolio is exposed to price fl uctuations, which are monitored by the ACD in pursuance of the investment objective and policy. The risk is generally regarded as consisting of two elements – stock specifi c risk and market risk. Adhering to investment guidelines and avoiding excessive exposure to one particular issuer can limit stock specifi c risk. Subject to compliance with the investment objective, spreading exposure across abroad range of global stocks can mitigate market risk.
vi. Fair value of fi nancial assets and fi nancial liabilitiesThere is no material difference between the value of the fi nancial assets and liabilities, as shown in the balance sheet, and their fair value.
12. RISK MANAGEMENT POLICIES (continued)
vii. DerivativesThe Investment Manager has the power to manage exposure to currency movements by using forward currency contracts. Details of the holdings of such instruments, the net exposure to foreign currencies as at the balance sheet date, and details of the total gains/(losses) on forward currency contracts during the year are set out in the Portfolio Statement, note 12ii and note 2, respectively.
The intention in using the forward currency contracts is, where deemed appropriate, to reduce the risk profi le of the Fund by managing the exposure of the Fund to currency exchange risk and leave the Fund primarily exposed to the underlying market risk of overseas investments. Therefore, where the value of overseas investments falls due to currency movements, the forward currency contract generates a gain and vice versa. The Investment Manager will only engage in currency hedging when they consider such hedging to be in the interests of effi cient portfolio management.
13. PORTFOLIO TRANSACTION COSTS
Purchases /sales before Gross purchases transaction costs Commissions Taxes /net sales £’000 £’000 £’000 £’00031.01.16 Ordinary shares 1,685 2 5 1,692 Debt securities 6,044 – – 6,044 Purchases total 7,729 2 5 7,736 Transaction cost % of purchases total 0.03% 0.06% Transaction cost %
of average NAV – 0.01% Ordinary shares 1,892 (3) – 1,889 Debt securities 6,000 – – 6,000 Sales total 7,892 (3) – 7,889 Transaction cost %
of sales total 0.04% – Transaction cost %
of average NAV 0.01% – Average portfolio dealing spread at 31.01.16 is 0.30% (31.01.15 : 0.16%).

168 Trojan Investment Funds Trojan Investment Funds 169
CRYSTAL FUND Financial Statements (continued) Notes to the Financial Statements (continued)As at 31 January 2016
13. PORTFOLIO TRANSACTION COSTS (continued)
Purchases /sales before Gross purchases transaction costs Commissions Taxes /net sales £’000 £’000 £’000 £’00031.01.15 Ordinary shares 278 – 1 279 Purchases total 278 – 1 279 Transaction cost % of purchases total – 0.36% Transaction cost %
of average NAV – – Ordinary shares 3,262 (3) – 3,259 Sales total 3,262 (3) – 3,259 Transaction cost %
of sales total 0.09% – Transaction cost %
of average NAV 0.01% –
14. FAIR VALUE HIERARCHY
Investments are categorised into the following levels based on their fair value measurement:
Level 1: The unadjusted quoted price in an active market for identical assets or liabilities that the Fund can access at the year end date.
Level 2: Inputs other than quoted prices included within Level 1 that are observable (i.e. developed using market data) for the asset or liability, either directly or indirectly.
Level 3: Inputs are unobservable (i.e. for which market data is unavailable) for the asset or liability.
31.01.16 31.01.15Valuation technique Assets Liabilities Assets Liabilities £’000 £’000 £’000 £’000 Level 1 40,031 – 40,687 – Level 2 2,820 (521) 2,583 (391)Level 3 – – – – 42,851 (521) 43,270 (391) Total portfolio of investments 42,330 42,879
Level 1 include £14,236 thousand of assets which are debt securities (31.01.15 : £14,304 thousand).

170 Trojan Investment Funds Trojan Investment Funds 171
CRYSTAL FUNDFinancial Statements (continued)DISTRIBUTION TABLEFOR THE YEAR ENDED 31 JANUARY 2016 – IN PENCE PER SHARE
EQUALISATIONEqualisation applies only to shares purchased during the distribution period (Group 2 shares –the applicable distribution periods for each distribution are shown below). It represents the accrued revenue included in the purchase price of the shares. After averaging it is returned with the distribution as a capital repayment. It is not liable to Income Tax but must be deducted from the cost of the shares for Capital Gains Tax purposes.
Group 2 Interim Final
FromTo
01.02.1531.07.15
01.08.1531.01.16
Income shares
Interim NetRevenue
Equalisation Paid30.09.15
Paid30.09.14
Group 1Group 2
0.8023 0.8023
– 0.0000
0.8023 0.8023
0.9890 0.9890
Final NetRevenue
Equalisation Payable31.03.16
Paid31.03.15
Group 1Group 2
0.3192 0.3192
– 0.0000
0.3192 0.3192
0.2915 0.2915
SPECTRUM FUNDACD’S REPORTFOR THE YEAR ENDED 31 JANUARY 2016
IMPORTANT INFORMATIONRefer to the ‘Important Information’ section of the Company on page 8.
INVESTMENT OBJECTIVE AND POLICYThe investment objective of the Spectrum Fund (‘the Fund’) is to produce long term capital growth. The Fund’s policy is diversifi ed investment predominantly in collective investment schemes, though the Fund may be invested in bonds, equities, cash and other eligible instruments from time to time. The Fund may invest up to 100% of its assets in collective investment schemes.
CAPITA FINANCIAL MANAGERS LIMITEDACD of Spectrum Fund3 May 2016

172 Trojan Investment Funds Trojan Investment Funds 173
SPECTRUM FUNDACD’s Report (continued)For the year ended 31 January 2016
INVESTMENT MANAGER’S REPORT
INVESTMENT REVIEWFor the year to 31 January 2016 the Fund produced a total return of -1.2% compared to a rise of +0.4%* in the LIBID Index (total return) and a rise of +0.5%* in the MSCI World (£) Index (net return). The FTSE All-Share Index (total return) produced a return of -4.6%*.
MARKET REVIEWIn general, the year under review was a poor one for equity markets with investors becoming increasingly concerned about slowing global economic growth. These concerns were evident in the performance of developed market equities. European and Japanese equities started the year in ebullient fashion, bolstered by further monetary stimulus, but faltered as the year progressed. Whilst Quantitative Easing (‘QE’) has played a part in infl ating asset prices over the last few years, there is a growing realisation that it has done little to rejuvenate the global economy. By suppressing the cost of capital, QE has also arguably encouraged a misallocation of capital, leading to excess supply in certain industries. This was most noticeable in the energy sector during 2015, where strong supply and a weak oil price combined to place considerable pressure on the earnings of energy companies.
Having benefi ted from easy access to cheap capital over the last few years, US corporates now face a more challenging environment. Whilst the US Federal Reserve only fi nally began to raise interest rates in December 2015, the credit cycle is at a far more mature stage. Credit spreads widened during the year, tightening fi nancial conditions for US corporates at a time when many faced headwinds from a stronger US dollar. Along with rising labour costs, these factors could start to pressure corporate profi t margins, which remain at record levels. Despite the hike in interest rates, government bond yields remained low, suggesting that investors are sceptical that the US economy can stand alone in the face of slowing global economic growth.
A bifurcation in the performance of US equities was further evidence of increasingly fragile markets. During the year, volatility increased and positive performance came from a narrower base of companies such as Amazon.com and Facebook. Investors were prepared to pay high multiples for companies that continued to deliver growth in a low growth world but were far more circumspect about the prospects of those facing short-term issues.
Emerging Market (‘EM’) equities had a torrid time during the year, beset by a confl uence of factors. The headwinds of a strong US dollar, slowing economic growth and weak commodity prices undermined EM currencies. The Brazilian real, for example, fell from approximately 2.72 to the US dollar at the beginning of the year to around 3.99 at the end. Whilst such currency weakness encouraged further outfl ows of foreign capital, it also placed a huge amount of strain on EM companies with US dollar denominated debt. China’s decision to devalue its currency heightened concerns that its economy is slowing more rapidly and uncontrollably than many assumed. An implicit faith in China’s ability to successfully engineer a transition from an export and investment-led economy to a consumption-driven one was replaced by fears that a weakening yuan would export defl ation to the rest of the world.
* Source: Bloomberg. The indices used by the Investment Manager are for comparison purposes. No benchmark is required to be disclosed per the Prospectus.
PORTFOLIOThe main contributors to the Fund’s performance during the twelve months to 31 January 2016 were HAL Trust, Lindsell Train Japanese Equity and Lindsell Train Global Equity.
Following a strong year in 2014, HAL Trust continued to perform well during the year under review. Much of the positive performance was driven by HAL’s decision to sell 20% of its stake in GrandVision (an optical retailer), via an initial public offering (‘IPO’) in February 2015. The IPO raised approximately €1 billion, valuing HAL’s remaining holding of GrandVision at a substantial premium to that ascribed in HAL’s previous full year report and accounts. HAL is yet to reinvest the proceeds but has a history of deploying capital effectively when opportunities arise. We remain confi dent that HAL will continue to create signifi cant shareholder value over time through its disciplined, patient and long-term approach. The strong returns posted by the two Lindsell Train funds were largely the result of good stock selection. As an example, the strong performance of Nintendo and OBIC Business Consultants were signifi cant contributors to the Japanese fund. They also benefi ted from a lack of exposure to the hard hit energy and materials sectors.
The biggest detractors from the Fund’s performance were BlackRock Gold and General and Findlay Park Latin American. A strong US dollar helped to depress the price of gold in 2015, making it a very diffi cult environment for gold miners. Whilst it is impossible to predict the short-term price move of any commodity, we believe that gold can be an important diversifi er to a portfolio in times of stress. It should also play a part in protecting capital if we see a breakdown in the faith vested in Central Bankers to revive the global economy. Although the share price performance of gold mining companies has been extremely disappointing, we are encouraged that costs continue to be cut and management teams are focusing on improving shareholder returns. We believe this more disciplined approach should result in gold miners having greater sensitivity to any upside in the gold price. The Findlay Park Latin American fund faced severe currency headwinds. It also suffered from signifi cant drawdowns in a number of its holdings. The most notable losses were in the fund’s private education holdings, including Kroton Educacional and Estacio Participacoes, which were hurt by the Brazilian government’s decision to remove an education subsidy. The fund’s performance has undoubtedly been poor over the last couple of years. However, we continue to have confi dence in Findlay Park Latin American’s long-term prospects. Rupert Brandt, the fund manager, invests in good quality, cash generative companies that are growing despite the diffi cult economic conditions. The short-term pain may well get worse but we believe such companies now offer signifi cant value.
We added two new funds to the Fund during the year; E I Sturdza Strategic Europe Value and Aurora Investment Trust. The Strategic Europe Value fund is managed by Willem Vinke, who has an excellent performance track record. The fund is concentrated, with 25-35 holdings, and predominantly invests in companies listed in Europe (including the UK). Phoenix, established in 1998 by Gary Channon, has a strong track record of investing in UK-listed companies. They follow a value-based approach; focusing on good quality companies that have been beset by issues Phoenix believe will be short-term in nature. They are long-term investors, expressing courage in their convictions through a concentrated portfolio of 10-15 holdings. Accepting the greater volatility of such a focused approach, Phoenix seeks to reduce risk by undertaking forensic due diligence at the outset and then closely monitoring the operational performance of the companies in which they invest. They also only ever invest at valuations they feel provide a signifi cant margin of safety.

174 Trojan Investment Funds Trojan Investment Funds 175
SPECTRUM FUNDACD’s Report (continued)Investment Manager’s Report (continued)For the year ended 31 January 2016
PORTFOLIO (continued)Other changes to the Fund included trimming the holdings of Lindsell Train Global Equity, Lindsell Train Japanese Equity and Findlay Park American. All three remain core holdings but were reduced following strong performance and rising underlying valuations. We also made additional investments into Halley Asian Prosperity and Findlay Park Latin American, whose constituents we judge to be attractively valued at current levels.
Top 10 Holdings January 2015 % FundFindlay Park American 7.6Morant Wright Sakura Hedged 7.5Heptagon Yacktman US Equity 6.7Lindsell Train Global Equity 6.6Egerton Capital Equity 6.2Evenlode Income 5.9Odey Allegra Developed Markets 5.5CG Portfolio Real Return 5.4First State Asia Pacifi c Leaders 5.3Polar Capital Global Insurance 4.3 Total Top 10 61.0Plus 11 other holdings 31.8Cash & equivalent 7.2 Total 100.0
Top 10 Holdings January 2016 % FundMorant Wright Sakura Hedged 7.5Heptagon Yacktman US Equity 6.7Egerton Capital Equity 6.4Evenlode Income 5.8CG Portfolio Real Return 5.5Odey Allegra Developed Markets 5.3Findlay Park American 5.2First State Asia Pacifi c Leaders 4.9Polar Capital Global Insurance 4.8E.I. Sturdza Strategic Europe Value 4.6 Total Top 10 56.7Plus 13 other holdings 36.5Cash & equivalent 6.8 Total 100.0
ASSET ALLOCATION AS AT 31 JANUARY 2016
OUTLOOKDeveloped market equity valuations have risen signifi cantly over the last few years, driven higher by ebullient markets buoyed by extraordinary monetary stimulus. Quantitative Easing indiscriminately lifted the price of most stocks, regardless of each company’s underlying value or quality. Zero interest rates encouraged corporates to issue debt to buy back stock, infl ating current earnings per share measures but postponing the investment required to underpin future growth. Against such a backdrop, it is unsurprising that the attractions of cheap ‘passive’ investments have been accentuated.
However, the investment landscape is changing and we believe it’s becoming increasingly important to invest alongside active and discerning fund managers. Equity markets have grown more volatile and we have started to see a greater dispersion in returns. Investors are beginning to demand greater support from underlying fundamentals.
Few active managers will consistently outperform each and every year, especially when equity markets are rising indiscriminately. However, we do believe that the best ones can add signifi cant value over the course of a full market cycle by making rational and informed investment decisions. They can add value through both what they choose to own but also what they seek to avoid. In an environment where prospective returns are likely to be harder won and more closely based on underlying fundamentals, we feel comfortable investing alongside a collection of outstanding fund managers.
TROY ASSET MANAGEMENT LIMITEDInvestment Manager22 February 2016
USA Equities 12%Net other assets (inc. UK T-Bills) 7%
Financials 5%
Absolute Returns & Alternatives 2%
Gold & Gold Funds 7%
Euro Equities 7%
Japanese Equities 12%
Global Equities 19%
Global Index-linked 9%
Emerging Equities 4%
SE Asia Equities 9%
UK Equities 7%

176 Trojan Investment Funds Trojan Investment Funds 177
SPECTRUM FUND ACD’s Report (continued)FUND INFORMATION
SYNTHETIC RISK AND REWARD INDICATOR
Typically lower rewards Typically higher rewards
Lower risk Higher risk
1 2 3 4 5 6 7
This indicator shows how much a fund has risen and fallen in the past, and therefore how much a fund’s returns have varied. It is a measure of a fund’s volatility. The higher a fund’s past volatility the higher the number on the scale and the greater the risk that investors in that fund may have made losses as well as gains. The lowest number on the scale does not mean that a fund is risk free.
The Fund has been classed as 4 because its volatility has been measured as average.
This indicator is based on historical data and may not be a reliable indication of the future risk profi le of this Fund.
The risk and reward profi le shown is not guaranteed to remain the same and may shift over time.
RISK WARNINGAn investment in an open-ended investment company should be regarded as a medium to long term investment. Investors should be aware that the price of shares and the income from them can fall as well as rise and investors may not receive back the full amount invested. Past performance is not a guide to future performance. Investments denominated in currencies other than the base currency are subject to fl uctuation in exchange rates, which can be favourable or unfavourable.
COMPARATIVE TABLESWhere the Fund has signifi cant investment in collective investment schemes, the operating charges take account of the ongoing charges incurred in the underlying schemes, calculated as the expense value of such holdings at the period end weighted against the net asset value of the share class at that date.
31.01.16 31.01.15 31.01.14 (p/share) (p/share) (p/share)
‘O’ Income shares
Change in net assets per share
Opening net asset value per share 155.99 139.46 142.31
Return before operating charges* 0.64 19.43 0.05
Operating charges (2.46) (2.54) (2.19)
Return after operating charges (1.82) 16.89 (2.14)
Distributions on income shares (0.60) (0.36) (0.71)
Closing net asset value per share 153.57 155.99 139.46
* after direct transaction costs 0.01 0.03 0.09
Performance
Return after charges (1.17)% 12.11% (1.50)%
Other Information
Closing net asset value (£’000) 64,513 66,659 60,506
Closing number of shares 42,008,114 42,732,341 43,384,899
Operating charges 1.58%1 1.68% 1.54%
Direct transaction costs 0.01% 0.02% 0.06%
Prices
Highest share price 165.90 157.61 149.88
Lowest share price 148.04 137.32 137.49
1 From 3 August 2015 the Investment Manager has agreed, on a discretionary basis, to waive a
portion of its fee in relation to the ‘O’ Income share class, in order to seek to achieve an Ongoing Charges Figure of 1.50%. Therefore, the estimated Ongoing Charges Figure at 31 January 2016 is 1.50%.

178 Trojan Investment Funds Trojan Investment Funds 179
SPECTRUM FUND ACD’s Report (continued)Fund Information (continued)
COMPARATIVE TABLES (continued) 31.01.16 31.01.15 31.01.14 (p/share) (p/share) (p/share)
‘O’ Accumulation shares
Change in net assets per share
Opening net asset value per share 159.91 142.66 144.85
Return before operating charges* 0.65 19.85 0.04
Operating charges (2.53) (2.60) (2.23)
Return after operating charges (1.88) 17.25 (2.19)
Closing net asset value per share 158.03 159.91 142.66
Retained distributions on accumulation shares 0.62 0.36 0.73
* after direct transaction costs 0.01 0.03 0.09
Performance
Return after charges (1.18)% 12.09% (1.51)%
Other Information
Closing net asset value (£’000) 20,861 20,868 20,010
Closing number of shares 13,200,429 13,049,746 14,026,855
Operating charges 1.58%1 1.68% 1.54%
Direct transaction costs 0.01% 0.02% 0.06%
Prices
Highest share price 170.06 161.26 152.56
Lowest share price 151.88 140.46 139.94
1 From 3 August 2015 the Investment Manager has agreed, on a discretionary basis, to waive a
portion of its fee in relation to the ‘O’ Accumulation share class, in order to seek to achieve an Ongoing Charges Figure of 1.50%. Therefore, the estimated Ongoing Charges Figure at 31 January 2016 is 1.50%.
31.01.16 31.01.15 31.01.14 (p/share) (p/share) (p/share)
‘I’ Income shares
Change in net assets per share
Opening net asset value per share 154.50 138.49 141.42
Return before operating charges* 0.64 19.23 0.06
Operating charges (3.21) (3.22) (2.87)
Return after operating charges (2.57) 16.01 (2.81)
Distributions on income shares – – (0.12)
Closing net asset value per share 151.93 154.50 138.49
* after direct transaction costs 0.01 0.03 0.09
Performance
Return after charges (1.66)% 11.56% (1.99)%
Other Information
Closing net asset value (£’000) 50 92 125
Closing number of shares 32,949 59,300 89,898
Operating charges 2.08%1 2.17% 2.04%
Direct transaction costs 0.01% 0.02% 0.06%
Prices
Highest share price 164.14 155.81 148.87
Lowest share price 146.33 136.35 136.37
1 From 3 August 2015 the Investment Manager has agreed, on a discretionary basis, to waive a
portion of its fee in relation to the ‘I’ Income share class, in order to seek to achieve an Ongoing Charges Figure of 2.00%. Therefore, the estimated Ongoing Charges Figure at 31 January 2016 is 2.00%.
.

180 Trojan Investment Funds Trojan Investment Funds 181
SPECTRUM FUND ACD’s Report (continued)Fund Information (continued)
COMPARATIVE TABLES (continued) 31.01.16 31.01.15 31.01.14 (p/share) (p/share) (p/share)
‘I’ Accumulation shares
Change in net assets per share
Opening net asset value per share 157.28 140.99 143.85
Return before operating charges* 0.67 19.57 0.06
Operating charges (3.28) (3.28) (2.92)
Return after operating charges (2.61) 16.29 (2.86)
Closing net asset value per share 154.67 157.28 140.99
Retained distributions on accumulation shares – – 0.05
* after direct transaction costs 0.01 0.03 0.09
Performance
Return after charges (1.66)% 11.55% (1.99)%
Other Information
Closing net asset value (£’000) 437 683 1,052
Closing number of shares 282,834 434,265 746,076
Operating charges 2.09%1 2.17% 2.04%
Direct transaction costs 0.01% 0.02% 0.06%
Prices
Highest share price 167.10 158.62 151.42
Lowest share price 148.97 138.81 138.71
1 From 3 August 2015 the Investment Manager has agreed, on a discretionary basis, to waive a portion of its fee in relation to the ‘I’ Accumulation share class, in order to seek to achieve an Ongoing Charges Figure of 1.50%. Therefore, the estimated Ongoing Charges Figure at 31 January 2016 is 2.00%.
FUND PERFORMANCE TO 31 JANUARY 2016 (%)
1 year 3 years 5 years
Spectrum Fund (1.16) 8.69 19.69
The performance of the Fund is based on the published price per ‘O’ Accumulation share which includes reinvested income.
The performance of the Fund disclosed in the above table may differ from the ‘Return after charges’ disclosed in the Comparative Table due to above performance being calculated on the latest published price prior to the year end, rather than the year end return after operating charges.
Details of the distributions per share for the year are shown in the Distribution Table on page 200.

182 Trojan Investment Funds Trojan Investment Funds 183
SPECTRUM FUNDACD’s Report (continued)PORTFOLIO STATEMENTAS AT 31 JANUARY 2016
Holding Portfolio of Investments Value 31.01.16 £’000 %
DEBT SECURITIES – 1.98% (31.01.15 – 2.13%) £1,700,000 Treasury Bill 0% 18.04.16 1,697 1.98 INDEX-LINKED BONDS – 8.79% (31.01.15 – 8.51%) 20,770 CG Portfolio Dollar 2,826 3.30 27,129 CG Portfolio Real Return 4,718 5.49
TOTAL INDEX-LINKED BONDS 7,544 8.79 UNITED KINGDOM EQUITIES – 6.61% (31.01.15 – 5.91%) 425,000 Aurora Investment Trust* 650 0.76 3,075,409 Evenlode Income 5,028 5.85
TOTAL UNITED KINGDOM EQUITIES 5,678 6.61 EUROPEAN EQUITIES – 7.58% (31.01.15 – 2.86%) 30,715 EI Sturdza Strategic Europe Value 3,951 4.60 20,893 HAL Trust* 2,560 2.98
TOTAL EUROPEAN EQUITIES 6,511 7.58 UNITED STATES EQUITIES – 11.84% (31.01.15 – 14.21%) 84,724 Findlay Park American 4,446 5.18 58,059 Heptagon Yacktman US Equity 5,719 6.66
TOTAL UNITED STATES EQUITIES 10,165 11.84 EMERGING MARKETS EQUITIES – 4.48% (31.01.15 – 5.31%) 275,909 Findlay Park Latin American 1,906 2.22 121,440 First State Global Emerging Markets 1,056 1.23 874,661 PFS Somerset Emerging Markets Dividend Growth 887 1.03
TOTAL EMERGING MARKETS EQUITIES 3,849 4.48
Holding Portfolio of Investments Value 31.01.16 £’000 %
JAPANESE EQUITIES – 11.61% (31.01.15 – 11.42%) 4,570,771 Lindsell Train Japanese Equity 3,491 4.07 504,164 Morant Wright Sakura 6,480 7.54
TOTAL JAPANESE EQUITIES 9,971 11.61 ASIAN EQUITIES – 9.31% (31.01.15 – 8.71%) 859,273 First State Asia Pacifi c Leaders 4,230 4.92 18,018 Halley Asian Prosperity 3,767 4.39
TOTAL ASIAN EQUITIES 7,997 9.31 GLOBAL EQUITIES – 19.30% (31.01.15 – 21.25%) 35,438 Egerton Capital Equity 5,529 6.44 2,037,629 Lindsell Train Global Equity 3,789 4.42 68,332 McInroy & Wood Balanced 2,664 3.10 36,914 Odey Allegra Developed Markets 4,587 5.34
TOTAL GLOBAL EQUITIES 16,569 19.30 ABSOLUTE RETURNS & ALTERNATIVES – 1.85% (31.01.15 – 2.12%) 2,088,709 Better Capital 2009* 1,587 1.85 FINANCIALS – 4.79% (31.01.15 – 4.29%) 995,978 Polar Capital Global Insurance 4,108 4.79 COMMODITIES – 7.08% (31.01.15 – 8.16%) 476,005 BlackRock Gold and General 2,679 3.12 45,950 Gold Bullion Securities 3,404 3.96
TOTAL COMMODITIES 6,083 7.08 FORWARD CURRENCY CONTRACTS – 0.23% (31.01.15 – 0.01%) ¥(608,460,000) Vs £3,716,286 (expiry 22.04.16) 193 0.23

184 Trojan Investment Funds Trojan Investment Funds 185
SUMMARY OF MATERIAL PORTFOLIO CHANGESFOR THE YEAR ENDED 31 JANUARY 2016
SPECTRUM FUND ACD’s Report (continued)Portfolio Statement (continued)As at 31 January 2016
Value 31.01.16 £’000 %
Portfolio of investments 81,952 95.45 Net other assets 3,909 4.55 Net assets 85,861 100.00 The investments have been valued in accordance with note (h) of the
Accounting Policies and are collective investment schemes unless stated otherwise.
* Ordinary shares.
Total purchases for the year £’000 (note 13) 5,985 Purchases Cost £’000
EI Sturdza Strategic Europe Value 4,000Halley Asian Prosperity 900Aurora Investment Trust 655Findlay Park Latin American 430 In addition to above, purchases totalling £7,113 thousand were made in short term investments during the year. Total sales for the year £’000 (note 13) 6,538 Sales Proceeds £’000
Lindsell Train Global Equity 2,613Findlay Park American 2,534HAL Trust 473Lindsell Train Japanese Equity 470Morant Wright Sakura 448 In addition to above, sales totalling £7,233 thousand were made in short term investments during the year. The summary of material portfolio changes represents all of the purchases and sales during the year.

186 Trojan Investment Funds Trojan Investment Funds 187
SPECTRUM FUNDFINANCIAL STATEMENTSSTATEMENT OF TOTAL RETURNFOR THE YEAR ENDED 31 JANUARY 2016
31.01.16 31.01.15 Notes £’000 £’000 £’000 £’000
Income: Net capital (losses)/gains 2 (1,315) 9,313
Revenue 3 924 825
Expenses 4 (594) (627)
Net revenue before taxation 330 198
Taxation 5 – –
Net revenue after taxation 330 198
Total return before distributions (985) 9,511
Distributions 6 (331) (200)
Change in net assets attributable to shareholders from investment activities (1,316) 9,311
STATEMENT OF CHANGE IN NET ASSETS ATTRIBUTABLE TO SHAREHOLDERSFOR THE YEAR ENDED 31 JANUARY 2016 31.01.16 31.01.15 £’000 £’000 £’000 £’000
Opening net assets attributable to shareholders 88,302 81,692
Amounts receivable on issue of shares 2,070 3,527
Amounts payable on cancellation of shares (3,290) (6,329)
(1,220) (2,802)
Dilution levy charged 15 54
Stamp duty reserve tax – (1)
Change in net assets attributable to shareholders from investment activities (1,316) 9,311
Retained distributions on Accumulation shares 80 48
Closing net assets attributable to shareholders 85,861 88,302
BALANCE SHEETAS AT 31 JANUARY 2016
Notes 31.01.16 31.01.15 £’000 £’000
ASSETS
Fixed assets Investments 81,952 83,793
Current assets Debtors 7 195 45Cash and bank balances 3,981 4,755
Total assets 86,128 88,593
LIABILITIES
Creditors Distribution payable (196) (128)Other creditors 8 (71) (163)
Total liabilities (267) (291)
Net assets attributable to shareholders 85,861 88,302

188 Trojan Investment Funds Trojan Investment Funds 189
SPECTRUM FUNDFinancial Statements (continued)NOTES TO THE FINANCIAL STATEMENTSAS AT 31 JANUARY 2016
1. ACCOUNTING POLICIES
The accounting policies described on pages 14 to 16 have been applied to the fi nancial statements of the Fund in the current and prior year.
31.01.16 31.01.15 £’000 £’000
2. NET CAPITAL (LOSSES)/GAINS
The net capital (losses)/gains during the year comprise: Non-derivative securities (1,234) 9,120Forward currency contracts 8 312Transaction charges – (1)AMC rebates from underlying investments 3 –Currency losses (92) (118) Net capital (losses)/gains (1,315) 9,313
3. REVENUE
Non-taxable dividends 684 511Taxable dividends 90 148Unfranked interest 137 159AMC rebates from underlying investments 7 1Bank interest 6 6 Total revenue 924 825
4. EXPENSES
Payable to the ACD, associates of the ACD and agents of either of them: Annual Management Charge 576 545Rebate of Investment Management fees (74) – Legal and professional fees 10 10Printing costs 5 5Registration fees 20 2
537 562Payable to the Depositary, associates of the Depositary and agents of either of them: Depositary’s fees 32 38Safe custody and other bank charges 6 7
38 45
31.01.16 31.01.15 £’000 £’000
4. EXPENSES (continued)
Other expenses:
Fees paid to auditor – audit 8 8– tax services 3 3
Publication costs 8 8Postage and distribution costs – 1
19 20 Total expenses 594 627
The Investment Management fees and expenses (plus VAT thereon) for providing investment management services are paid by the ACD out of its remuneration. From 3 August 2015 the Investment Manager has agreed, on a discretionary basis, to waive a portion of its fee, in order to seek to achieve an Ongoing Charges Figure of 1.50%, for the ‘O’ Income and Accumulation share classes, and 2.00%, for the ‘I’ Income and Accumulation share classes.
31.01.16 31.01.15 £’000 £’000
5. TAXATION
a) Analysis of charge for the year Corporation tax at 20% – – Current tax charge – – Deferred tax – origination and reversal of timing differences (note 5c) – – Total taxation (note 5b) – –
b) Factors affecting the tax charge for the yearThe tax assessed for the year differs from the standard rate of corporation tax in the UK for an authorised fund (20%) (31.01.15 : 20%). The difference is explained below.
31.01.16 31.01.15 £’000 £’000
Net revenue before taxation 330 198
Corporation tax at 20% 66 39

190 Trojan Investment Funds Trojan Investment Funds 191
SPECTRUM FUND Financial Statements (continued) Notes to the Financial Statements (continued)As at 31 January 2016
31.01.16 31.01.15 £’000 £’000
5. TAXATION (continued)
Effects of: Non-taxable dividends (137) (102)AMC rebates taken to capital 1 –Unutilised excess management expenses 70 63 Corporation tax charge – – Total tax charge (note 5a) – –
c) Deferred taxAt the year end there is a potential deferred tax asset of £361 thousand (31.01.15 : £291 thousand) in relation to surplus management expenses. It is unlikely that the Fund will generate suffi cient taxable profi ts in the future to utilise this amount and, therefore, no deferred tax asset has been recognised in the current or prior year.
6. FINANCE COSTS
DistributionsThe distributions take account of revenue received on the issue of shares and revenue deducted on cancellations of shares, and comprise:
31.01.16 31.01.15 £’000 £’000
Interim 74 32Final 259 169 333 201 Add: Revenue deducted on cancellation of shares 1 2Deduct: Revenue received on issue of shares (3) (3) Net distributions for the year 331 200 Total fi nance costs 331 200
Details of the distributions per share are set out in the table on page 200.
31.01.16 31.01.15 £’000 £’000
6. FINANCE COSTS (continued)
Distributions represented by: Net revenue after taxation 330 198Allocations to capital: Revenue defi cit – ‘I’ Accumulation shares 1 2 Net distributions for the year 331 200
7. DEBTORS
Amounts receivable for issue of shares 82 9 Accrued revenue: Non-taxable dividends 31 28 AMC rebates from underlying investments 2 1 Bank interest – 1
107 30Amounts due from the Investment Manager Rebate of Investment Management fees 74 – Prepaid expenses 6 6 Total debtors 195 45
8. CREDITORS
Amounts payable for cancellation of shares 2 93 Accrued expenses: Amounts payable to the ACD, associates of the ACD and agents of either of them: Annual Management Charge 48 48 Legal and professional fees 1 1 Printing costs 3 3 Registration fees 2 –
54 52Amounts payable to the Depositary, associates of the Depositary and agents of either of them: Depositary’s fees 3 4 Safe custody and other bank charges – 1
3 5

192 Trojan Investment Funds Trojan Investment Funds 193
SPECTRUM FUND Financial Statements (continued) Notes to the Financial Statements (continued)As at 31 January 2016
31.01.16 31.01.15 £’000 £’000
8. CREDITORS (continued)
Other expenses 11 12 Taxation payable: Stamp duty reserve tax 1 1 Total creditors 71 163
9. RELATED PARTY TRANSACTIONS
Annual Management Charge and legal and professional fees payable to Capita Financial Managers Limited (‘the ACD’), registration fees payable to Capita Financial Administrators Limited and printing costs payable to Capita Business Services Limited (both companies are associates of the ACD) are disclosed in note 4 and amounts due at the year end are disclosed in note 8.
The aggregate monies received by the ACD through the issue of shares and paid on cancellation of shares are disclosed in the Statement of Change in Net Assets Attributable to Shareholders on page 186 and amounts due at the year end are disclosed in notes 7 and 8.
Capita Financial Managers Limited and its associates (including other authorised investment funds managed by Capita Financial Managers Limited) held 100,921 (31.01.15 : 135,537) of the Fund’s shares at the balance sheet date.
10. CONTINGENT LIABILITIES AND COMMITMENTS
There are no contingent liabilities or unrecorded outstanding commitments (31.01.15 : none).
11. SHAREHOLDERS’ FUNDS
‘O’ ‘O’ Income Accumulation
Annual Management Charge 0.65% 0.65%
Opening shares in issue 42,732,341 13,049,746 Issues 302,052 977,663 Cancellations (1,048,922) (878,063)Conversions 22,643 51,083 Closing shares in issue 42,008,114 13,200,429
11. SHAREHOLDERS’ FUNDS (continued)
‘I’ Income ‘I’ Accumulation
Annual Management Charge 1.15% 1.15%
Opening shares in issue 59,300 434,265Issues 3,622 10,357Cancellations (7,106) (109,778)Conversions (22,867) (52,010) Closing shares in issue 32,949 282,834
12. RISK MANAGEMENT POLICIES
In pursuing the investment objective a number of fi nancial instruments are held which may comprise securities and other investments, cash balances and debtors and creditors that arise directly from operations. Derivatives, such as futures or forward currency contracts, may be utilised for hedging purposes.
The main risks from the Fund’s holding of fi nancial instruments, together with the ACD’s policy for managing these risks, are set out below:
The ACD has in place a Risk Management Policy and Procedures Document (‘RMPPD’) that sets out the risks that may impact a fund and how the ACD seeks, where appropriate, to manage, monitor and mitigate those risks, and in particular those risks associated with the use of derivatives. The RMPPD sets out both the framework and the risk mitigations operated by the ACD in managing the identifi ed risks of the fund. The ACD requires that the appointed Investment Manager to the fund has in place its own governance structure, policies and procedures that are commensurate with its regulatory obligations and the risks posed by the fund managed.
i. Credit riskCredit risk is the risk that a counterparty may be unable or unwilling to make a payment or fulfi l contractual obligations. This may be in terms of an actual default or by deterioration in a counterparty’s credit quality.
Certain transactions in securities that the Fund enters into expose it to the risk that the counterparty will not deliver the investment for a purchase, or cash for a sale after the Fund has fulfi lled its obligations. As part of its due diligence process, the ACD undertakes a review of the controls operated over counterparties by the Investment Manager, including initial and ongoing due diligence and business volumes placed with each counterparty. In cases which are dependent on the counterparty settling at the transaction’s maturity date, the ACD has policies in place which set out the minimum credit quality expected of a market counterparty or deposit taker at the outset of the transaction.
The bond investments held are exposed to credit risk which refl ects the ability of the issuer to meet its obligations. The ACD monitors the credit rating of bond holdings. The bond in which the Fund invests is a government security which is lower risk.

194 Trojan Investment Funds Trojan Investment Funds 195
SPECTRUM FUND Financial Statements (continued) Notes to the Financial Statements (continued)As at 31 January 2016
12. RISK MANAGEMENT POLICIES (continued)
ii. Interest rate riskInterest rate risk is the risk that the value of the Fund’s investments will fl uctuate as a result of interest rate changes. The value of fi xed interest securities may be affected by changes in interest rates, either globally or locally. Changes in the rate of return in one asset class may infl uence the valuation basis of other classes. The amount of revenue receivable from fl oating rate investments and bank balances or payable on bank overdrafts will be affected by fl uctuations in interest rates. Investment in collective investment schemes exposes the Fund to indirect interest rate risk to the extent that they invest in interest bearing securities, the returns from which will be affected by fl uctuations in interest rates.
The Fund will at times have signifi cant exposure to interest rate risk. This risk is actively managed at all times taking into account the correlations with other risks in the portfolio.
The table below shows the direct interest rate risk profi le:
31.01.16 31.01.15 £’000 £’000
Floating rate assets: Pounds sterling 11,525 12,271 Fixed rate assets: Singapore dollars – 1,884 Pounds sterling 1,697 –
1,697 1,884Assets on which interest is not paid: Euros 2,560 2,523 Japanese yen 3,491 3,465 US dollars 15,505 18,649 Pounds sterling 54,873 53,131
76,429 77,768Liabilities on which interest is not paid: Japanese yen (3,523) (3,330) Pounds sterling (267) (291)
(3,790) (3,621) Net assets 85,861 88,302
The fl oating rate fi nancial assets comprise bank balances which earn interest at rates linked to the Bank of England base rate or its international equivalents and collective investment schemes that pay UK interest distributions.
12. RISK MANAGEMENT POLICIES (continued)
iii. Foreign currency riskForeign currency risk is the risk that the sterling value of investments will fl uctuate as a result of exchange rate movements. Assets denominated in currencies other than sterling will provide direct exposure to currency risk as a consequence of the movement in foreign exchange rates when calculating the sterling equivalent value. Forward currency contracts are employed by the Investment Manager, where deemed appropriate, to mitigate the foreign exchange risk. Investment in collective investment schemes may provide indirect exposure to currency risk as a consequence of the movement in foreign exchange rates.
The table below shows the direct foreign currency risk profi le:
31.01.16 31.01.16 31.01.16 Gross £’000 Hedged £’000 Net £’000
Currency: Euros 2,560 – 2,560 Japanese yen 3,491 (3,523) (32) US dollars 15,505 – 15,505 21,556 (3,523) 18,033
Pounds sterling 64,112 3,716 67,828 Net assets 85,668 193 85,861
31.01.15 31.01.15 31.01.15 Gross £’000 Hedged £’000 Net £’000
Currency: Euros 2,523 – 2,523 Japanese yen 3,465 (3,330) 135 Singapore dollars 1,884 – 1,884 US dollars 18,649 – 18,649 26,521 (3,330) 23,191
Pounds sterling 61,774 3,337 65,111 Net assets 88,295 7 88,302
iv. Liquidity riskThe main liability of the Fund is the cancellation of any shares that investors want to sell. Investments may have to be sold to fund such cancellations should insuffi cient cash be held at the bank to meet this obligation.
To reduce liquidity risk the Investment Manager will ensure that a substantial portion of the Fund’s assets consist of cash and readily realisable investments.
All fi nancial liabilities are payable in one year or less, or on demand.

196 Trojan Investment Funds Trojan Investment Funds 197
SPECTRUM FUND Financial Statements (continued) Notes to the Financial Statements (continued)As at 31 January 2016
12. RISK MANAGEMENT POLICIES (continued)
v. Market price riskMarket price risk is the risk that the value of the Fund’s fi nancial instruments will fl uctuate as a result of changes in market prices caused by factors other than interest rate or foreign currency movement. Market price risk arises primarily from uncertainty about the future prices of fi nancial instruments that the Fund holds.
Market price risk represents the potential loss the Fund may suffer through holding market positions in the face of price movements. The Fund’s investment portfolio is exposed to price fl uctuations, which are monitored by the ACD in pursuance of the investment objective and policy. The risk is generally regarded as consisting of two elements – stock specifi c risk and market risk. Adhering to investment guidelines and avoiding excessive exposure to one particular issuer can limit stock specifi c risk. Subject to compliance with the investment objective, spreading exposure across abroad range of global stocks can mitigate market risk.
vi. Fair value of fi nancial assets and fi nancial liabilitiesThere is no material difference between the value of the fi nancial assets and liabilities, as shown in the balance sheet, and their fair value.
vii. DerivativesDuring the year the Investment Manager has used forward currency contracts.
The intention in using forward currency contracts is, where deemed appropriate, to reduce the risk profi le of the Fund by managing the exposure of the Fund to currency exchange risk and leave the Fund primarily exposed to the underlying market risk of overseas investments. Therefore, where the value of overseas investments falls due to currency movements, the forward currency contract generates a gain and vice versa. The Investment Manager will only engage in currency hedging when they consider such hedging to be in the interests of effi cient portfolio management.
Refer to note 2 for the impact of forward currency contracts in the year and to the Portfolio Statement for the impact of forward currency contracts held at the year end.
13. PORTFOLIO TRANSACTION COSTS
Purchases /sales before Gross purchases transaction costs Commissions Taxes /net sales £’000 £’000 £’000 £’00031.01.16 Ordinary shares 651 1 3 655 Collective investment schemes 5,328 – 2 5,330 Purchases total 5,979 1 5 5,985 Transaction cost %
of purchases total 0.02% 0.08% Transaction cost %
of average NAV – 0.01% Ordinary shares 474 (1) – 473 Collective investment schemes 6,065 – – 6,065 Sales total 6,539 (1) – 6,538 Transaction cost %
of sales total 0.02% – Transaction cost %
of average NAV – – Average portfolio dealing spread at 31.01.16 is 0.10% (31.01.15 : 0.08%).
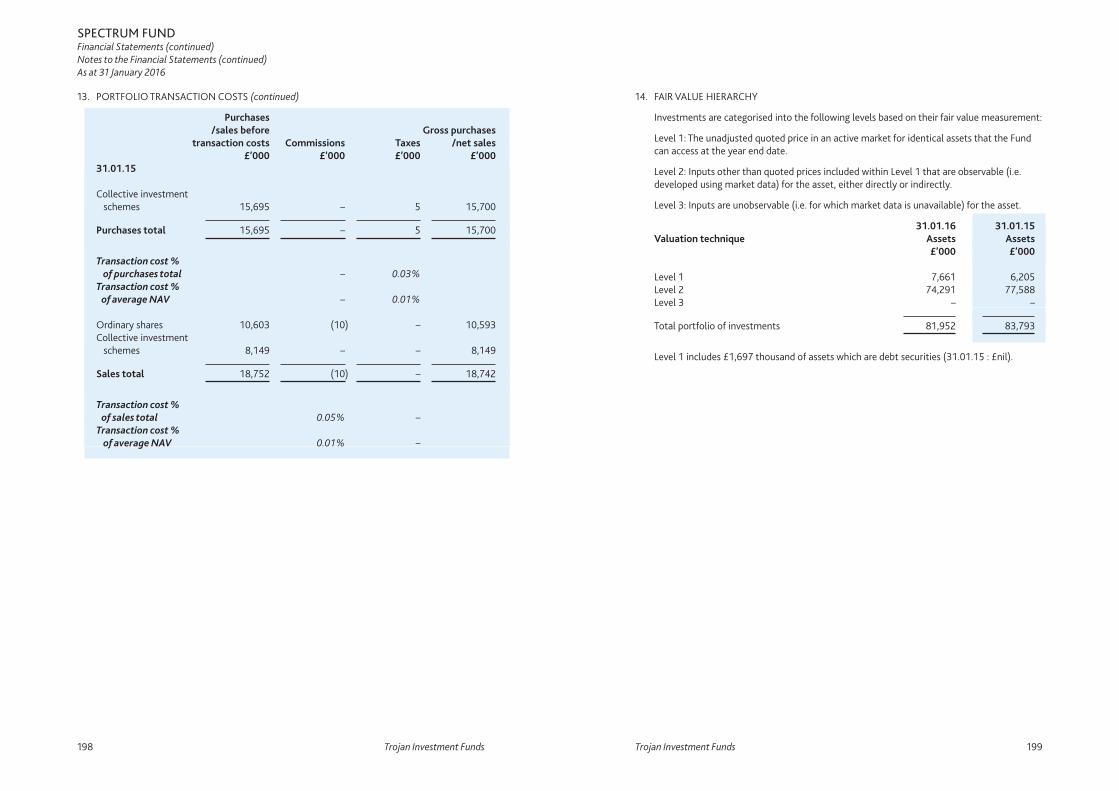
198 Trojan Investment Funds Trojan Investment Funds 199
SPECTRUM FUND Financial Statements (continued) Notes to the Financial Statements (continued)As at 31 January 2016
13. PORTFOLIO TRANSACTION COSTS (continued)
Purchases /sales before Gross purchases transaction costs Commissions Taxes /net sales £’000 £’000 £’000 £’00031.01.15 Collective investment schemes 15,695 – 5 15,700 Purchases total 15,695 – 5 15,700 Transaction cost %
of purchases total – 0.03% Transaction cost %
of average NAV – 0.01% Ordinary shares 10,603 (10) – 10,593 Collective investment schemes 8,149 – – 8,149 Sales total 18,752 (10) – 18,742 Transaction cost %
of sales total 0.05% – Transaction cost %
of average NAV 0.01% –
14. FAIR VALUE HIERARCHY
Investments are categorised into the following levels based on their fair value measurement:
Level 1: The unadjusted quoted price in an active market for identical assets that the Fund can access at the year end date.
Level 2: Inputs other than quoted prices included within Level 1 that are observable (i.e. developed using market data) for the asset, either directly or indirectly.
Level 3: Inputs are unobservable (i.e. for which market data is unavailable) for the asset.
31.01.16 31.01.15Valuation technique Assets Assets
£’000 £’000 Level 1 7,661 6,205Level 2 74,291 77,588Level 3 – – Total portfolio of investments 81,952 83,793
Level 1 includes £1,697 thousand of assets which are debt securities (31.01.15 : £nil).

200 Trojan Investment Funds Trojan Investment Funds 201
SPECTRUM FUNDFinancial Statements (continued)DISTRIBUTION TABLEFOR THE YEAR ENDED 31 JANUARY 2016 – IN PENCE PER SHARE
EQUALISATIONEqualisation applies only to shares purchased during the distribution period (Group 2 shares –the applicable distribution periods for each distribution are shown below). It represents the accrued revenue included in the purchase price of the shares. After averaging it is returned with the distribution as a capital repayment. It is not liable to Income Tax but must be deducted from the cost of the shares for Capital Gains Tax purposes.
Group 2 Interim Final
FromTo
01.02.1531.07.15
01.08.1531.01.16
‘O’ Income shares
Interim NetRevenue
Equalisation Paid30.09.15
Paid30.09.14
Group 1Group 2
0.1337 0.0961
– 0.0376
0.1337 0.1337
0.0572 0.0572
Final NetRevenue
Equalisation Payable31.03.16
Paid31.03.15
Group 1Group 2
0.4665 0.0448
– 0.4217
0.4665 0.4665
0.3005 0.3005
‘O’ Accumulation shares
Interim NetRevenue
Equalisation Allocated30.09.15
Allocated30.09.14
Group 1Group 2
0.1369 0.0525
– 0.0844
0.1369 0.1369
0.0572 0.0572
Final NetRevenue
Equalisation Allocation31.03.16
Allocated31.03.15
Group 1Group 2
0.4782 0.1045
– 0.3737
0.4782 0.4782
0.3075 0.3075
There were no distributions for ‘I’ Income or ‘I’ Accumulation shares in the current or prior year.
SPECTRUM INCOME FUNDACD’S REPORTFOR THE PERIOD FROM 27 APRIL 2015 TO 31 JANUARY 2016
IMPORTANT INFORMATIONRefer to the ‘Important Information’ section of the Company on page 8.
INVESTMENT OBJECTIVE AND POLICYThe investment objective of the Spectrum Income Fund (‘the Fund’) is to seek to provide income with the potential for capital growth over the longer term.
The Fund may invest up to 100% of its assets in collective investment schemes.
The Fund’s investment policy is to invest predominantly in collective investment schemes which invest in equities, fi xed interest securities, other transferable securities, indices, money market instruments and deposits.
The Fund may also invest directly in bonds, equities, cash, near cash (including money market instruments), other transferable securities, indices, deposits and other collective investment schemes.
The Investment Manager may employ derivatives for the purposes of Effi cient Portfolio Management in accordance with the ACD’s Risk Management Policy, a copy of which is available on request from the ACD.
CAPITA FINANCIAL MANAGERS LIMITEDACD of Spectrum Income Fund3 May 2016

202 Trojan Investment Funds Trojan Investment Funds 203
SPECTRUM INCOME FUNDACD’s Report (continued)For the period from 27 April 2015 to 31 January 2016
INVESTMENT MANAGER’S REPORT
INVESTMENT REVIEWThe Fund launched 27 April 2015, with its fi rst valuation on 1 May 2015. For the period 1 May 2015 to 31 January 2016 the Fund produced a total return of -4.3%* compared to +0.3%* in the LIBID Index (total return) and -5.3%* in the MSCI World (£) Index (net return). The FTSE All-Share Index (total return) produced a return of -9.5%*.
MARKET REVIEWIn general, the period under review was a poor one for equity markets with investors becoming increasingly concerned about slowing global economic growth. These concerns were evident in the performance of developed market equities. European and Japanese equities started the year in ebullient fashion, bolstered by further monetary stimulus, but faltered as the year progressed. Whilst Quantitative Easing (‘QE’) has played a part in infl ating asset prices over the last few years, there is a growing realisation that it has done little to rejuvenate the global economy. By suppressing the cost of capital, QE has also arguably encouraged a misallocation of capital, leading to excess supply in certain industries. This was most noticeable in the energy sector during 2015, where strong supply and a weak oil price combined to place considerable pressure on the earnings of energy companies.
Having benefi ted from easy access to cheap capital over the last few years, US corporates now face a more challenging environment. Whilst the US Federal Reserve only fi nally began to raise interest rates in December 2015, the credit cycle is at a far more mature stage. Credit spreads widened during the year, tightening fi nancial conditions for US corporates at a time when many faced headwinds from a stronger US dollar. Along with rising labour costs, these factors could start to pressure corporate profi t margins, which remain at record levels. Despite the hike in interest rates, government bond yields remained low, suggesting that investors are sceptical that the US economy can stand alone in the face of slowing global economic growth.
A bifurcation in the performance of US equities was further evidence of increasingly fragile markets. During the period, volatility increased and positive performance came from a narrower base of companies such as Amazon and Facebook. Investors were prepared to pay high multiples for companies that continued to deliver growth in a low growth world but were far more circumspect about the prospects of those facing short-term issues.
Emerging market equities had a torrid time during the year, beset by a confl uence of factors. The headwinds of a strong US dollar, slowing economic growth and weak commodity prices undermined emerging market currencies. The Brazilian real, for example, fell from approximately 2.72 to the US dollar at the beginning of the period to around 3.99 at the end (source: Bloomberg). Whilst such currency weakness encouraged further outfl ows of foreign capital, it also placed a huge amount of strain on emerging market companies with US dollar denominated debt. China’s decision to devalue its currency heightened concerns that its economy is slowing more rapidly and uncontrollably than many assumed. An implicit faith in China’s ability to successfully engineer a transition from an export and investment-led economy to a consumption-driven one was replaced by fears that a weakening yuan would export defl ation to the rest of the world.
PORTFOLIOThe Fund was launched at the beginning of May 2015 and during the period invested in Artemis Global Income, RWC Enhanced Income, Evenlode Income, Veritas Global Equity Income, PFS Somerset Emerging Market Dividend Growth, CC Japan Income & Growth, CG Portfolio Dollar, PFS TwentyFour Dynamic Bond and Sequoia Economic Infrastructure Income.
Whilst there were no major changes to the portfolio during the period, we did take advantage of equity market volatility to add to the Fund’s holdings. With a relatively high cash weighting, Spectrum Income has further dry powder to invest as new opportunities arise.
Holdings January 2016 % FundRWC Enhanced Income 14.3Evenlode Income 13.5CG Portfolio Dollar 10.8Sequoia Economic Infrastructure Debt 10.0Artemis Global Income 9.9Veritas Global Equity Income 9.6PFS Twentyfour Dynamic Bond 8.0CC Japan Income & Growth 7.6PFS Somerset Emerging Markets Dividend Growth 6.4 Total Top 10 90.1Cash & equivalent 9.9 Total 100.0 ASSET ALLOCATION AS AT 31 JANUARY 2016
Japanese Equities 8%
Global Equities 19%
Emerging Equities 6%
UK Equities 28%
Infrastructure Debt 10%
US Index-Linked 11%
UK T-Bills 8%Net other assets 2%
Global Fixed Income 8%

204 Trojan Investment Funds Trojan Investment Funds 205
FUND INFORMATION
SPECTRUM INCOME FUNDACD’s Report (continued)Investment Manager’s Report (continued)For the period from 27 April 2015 to 31 January 2016
OUTLOOKDeveloped market equity valuations have risen signifi cantly over the last few years, driven higher by ebullient markets buoyed by extraordinary monetary stimulus. QE indiscriminately lifted the price of most stocks, regardless of each company’s underlying value or quality. Zero interest rates encouraged corporates to issue debt to buy back stock, infl ating current earnings per share measures but postponing the investment required to underpin future growth. Against such a backdrop, it is unsurprising that the attractions of cheap ‘passive’ investments have been accentuated.
However, the investment landscape is changing and we believe it’s becoming increasingly important to invest alongside active and discerning fund managers. Equity markets have grown more volatile and we have started to see a greater dispersion in returns. Investors are beginning to demand greater support from underlying fundamentals.
Few active managers will consistently outperform each and every year, especially when equity markets are rising indiscriminately. However, we do believe that the best ones can add signifi cant value over the course of a full market cycle by making rational and informed investment decisions. They can add value through both what they choose to own but also what they seek to avoid. In an environment where prospective returns are likely to be harder won and more closely based on underlying fundamentals, we feel comfortable investing alongside a collection of outstanding fund managers.
* Source: Lipper & Bloomberg, net income reinvested at ex-dividend date, sterling terms. The indices used by the Investment Manager are for comparison purposes. No benchmark is required to be disclosed per the Prospectus.
TROY ASSET MANAGEMENT LIMITEDInvestment Manager24 February 2016
SYNTHETIC RISK AND REWARD INDICATOR
Typically lower rewards Typically higher rewards
Lower risk Higher risk
1 2 3 4 5 6 7
This indicator shows how much a fund has risen and fallen in the past, and therefore how much a fund’s returns have varied. It is a measure of a fund’s volatility. The higher a fund’s past volatility the higher the number on the scale and the greater the risk that investors in that fund may have made losses as well as gains. The lowest number on the scale does not mean that a fund is risk free.
During the period the indicator changed from 5 to 4. The Fund has been classed as 4 because its volatility has been measured as average.
As the Fund has less than 5 years’ price history, this calculation incorporates the volatility of an appropriate benchmark index.
The risk and reward profi le shown is not guaranteed to remain the same and may shift over time.
RISK WARNINGAn investment in an open-ended investment company should be regarded as a medium to long term investment. Investors should be aware that the price of shares and the income from them can fall as well as rise and investors may not receive back the full amount invested. Past performance is not a guide to future performance. Investments denominated in currencies other than the base currency are subject to fl uctuation in exchange rates, which can be favourable or unfavourable.

206 Trojan Investment Funds Trojan Investment Funds 207
SPECTRUM INCOME FUND ACD’s Report (continued)Fund Information (continued)
COMPARATIVE TABLESWhere the Fund has signifi cant investment in collective investment schemes, the operating charges take account of the ongoing charges incurred in the underlying schemes, calculated as the expense value of such holdings at the period end weighted against the net asset value of the share class at that date.
31.01.161
(p/share)
‘O’ Income shares
Change in net assets per share
Opening net asset value per share 100.00
Return before operating charges* (3.83)
Operating charges (0.52)
Return after operating charges (4.35)
Distributions on income shares (2.04)
Closing net asset value per share 93.61
* after direct transaction costs 0.05
Performance
Return after charges (4.35)%
Other Information
Closing net asset value (£’000) 10,328
Closing number of shares 11,033,658
Operating charges2 1.61%
Direct transaction costs 0.05%
Prices
Highest share price 101.06
Lowest share price 93.57
1 From 27 April 2015. 2 Annualised fi gure due to share class launched less than 1 year. From 3 August 2015 the Investment
Manager has agreed, on a discretionary basis, to waive a portion of its fee in relation to the ‘O’ Income share class, in order to seek to achieve an Ongoing Charges Figure of 1.50%. Therefore, the estimated Ongoing Charges Figure at 31 January 2016 is 1.50%.
31.01.161
(p/share)
‘O’ Accumulation shares
Change in net assets per share
Opening net asset value per share 100.00
Return before operating charges* (3.83)
Operating charges (0.53)
Return after operating charges (4.36)
Closing net asset value per share 95.64
Retained distributions on accumulation shares 2.07
* after direct transaction costs 0.05
Performance
Return after charges (4.36)%
Other Information
Closing net asset value (£’000) 24
Closing number of shares 25,250
Operating charges2 1.61%
Direct transaction costs 0.05%
Prices
Highest share price 101.06
Lowest share price 93.57
1 From 27 April 2015. 2 Annualised fi gure due to share class launched less than 1 year. From 3 August 2015 the Investment
Manager has agreed, on a discretionary basis, to waive a portion of its fee in relation to the ‘O’ Accumulation share class, in order to seek to achieve an Ongoing Charges Figure of 1.50%. Therefore, the estimated Ongoing Charges Figure at 31 January 2016 is 1.50%.
FUND PERFORMANCEAs the Fund has less than one year’s performance, there is insuffi cient data to provide a useful indication of past performance.
Details of the distributions per share for the year are shown in the Distribution Table on page 221.

208 Trojan Investment Funds Trojan Investment Funds 209
SPECTRUM INCOME FUND
SUMMARY OF MATERIAL PORTFOLIO CHANGESFOR THE PERIOD FROM 27 APRIL 2015 TO 31 JANUARY 2016
ACD’s Report (continued)PORTFOLIO STATEMENTAS AT 31 JANUARY 2016
Holding Portfolio of Investments Value 31.01.16 £’000 %
DEBT SECURITIES – 7.71% £800,000 Treasury 0% 2016 798 7.71 BOND FUNDS – 18.89% 8,218 CG Portfolio Dollar 1,118 10.80 7,872 PFS TwentyFour Dynamic Bond 837 8.09
TOTAL BOND FUNDS 1,955 18.89 UNITED KINGDOM – 37.73% 852,393 Evenlode Income 1,394 13.47 17,515 RWC Enhanced Income 1,477 14.27 640,000 Sequoia Economic Infrastructure Income* 635 6.14 400,000 Sequoia Economic Infrastructure Income ‘C’* 399 3.85
TOTAL UNITED KINGDOM 3,905 37.73 EMERGING MARKETS EQUITIES – 6.36% 649,511 PFS Somerset Emerging Markets Dividend Growth 659 6.36 JAPANESE EQUITIES – 7.64% 57,099 CC Japan Income and Growth 791 7.64 GLOBAL EQUITIES – 19.53% 1,351,391 Artemis Global Income 1,026 9.91 7,295 Veritas Global Equity Income 996 9.62
TOTAL GLOBAL EQUITIES 2,022 19.53 Portfolio of investments 10,130 97.86 Net other assets 222 2.14 Net assets 10,352 100.00 The investments have been valued in accordance with note (h) of the Accounting
Policies and are collective investment schemes unless stated otherwise.
* Ordinary shares.
Total purchases for the period £’000 (note 13) 10,221 Purchases Cost £’000
RWC Enhanced Income 1,575 Evenlode Income 1,470 Artemis Global Income 1,158 Veritas Global Equity Income 1,155 CG Portfolio Dollar 1,050 Sequoia Economic Infrastructure Income 894 PFS TwentyFour Dynamic Bond 890 CC Japan Income and Growth 840 PFS Somerset Emerging Markets Dividend Growth 788 Sequoia Economic Infrastructure Income ‘C’ 401 In addition to the above, purchases totalling £2,397 thousand were made in short term investments during the period.
Total sales for the period £’000 (note 13) 205 Sales Proceeds £’000
Sequoia Economic Infrastructure Income 205 In addition to above, sales totalling £1,600 thousand were made in short term investments during the period. The summary of material portfolio changes represents all of the purchases and sales during the period.

210 Trojan Investment Funds Trojan Investment Funds 211
SPECTRUM INCOME FUNDFINANCIAL STATEMENTSSTATEMENT OF TOTAL RETURNFOR THE PERIOD FROM 27 APRIL 2015 TO 31 JANUARY 2016
31.01.16* Notes £’000 £’000
Income: Net capital losses 2 (661)
Revenue 3 248
Expenses 4 (69)
Net revenue before taxation 179
Taxation 5 –
Net revenue after taxation 179
Total return before distributions (482)
Distributions 6 (226)
Change in net assets attributable to shareholders from investment activities (708)
STATEMENT OF CHANGE IN NET ASSETS ATTRIBUTABLE TO SHAREHOLDERSFOR THE PERIOD FROM 27 APRIL 2015 TO 31 JANUARY 2016 31.01.16* £’000 £’000
Opening net assets attributable to shareholders –
Amounts receivable on issue of shares 11,075
Amounts payable on cancellation of shares (15)
11,060
Change in net assets attributable to shareholders from investment activities (708)
Closing net assets attributable to shareholders 10,352
* No comparative fi gures are presented for the Statement of Total Return and Statement of Change in Net Assets Attributable to Shareholders as this is the Fund’s fi rst reporting period; the Fund launched on 27 April 2015.
BALANCE SHEETAS AT 31 JANUARY 2016
Notes 31.01.16* £’000
ASSETS
Fixed assets Investments 10,130
Current assets Debtors 7 82Cash and bank balances 338
Total assets 10,550
LIABILITIES
Creditors Distribution payable (176)Other creditors 8 (22)
Total liabilities (198)
Net assets attributable to shareholders 10,352
* No comparative fi gures are presented for the Balance Sheet as this is the Fund’s fi rst reporting period; the Fund launched on 27 April 2015.

212 Trojan Investment Funds Trojan Investment Funds 213
SPECTRUM INCOME FUNDFinancial Statements (continued)NOTES TO THE FINANCIAL STATEMENTSAS AT 31 JANUARY 2016
1. ACCOUNTING POLICIES
The accounting policies described on pages 14 to 16 have been applied to the fi nancial statements of the Fund in the current year. The additional accounting policies described below have also been applied to this Fund.
(a) Distribution policyThe Annual Management Charge is transferred to capital for distribution purposes in line with the Fund’s Investment Objective. This will increase the amount of revenue available for distribution; however, will erode capital and may constrain capital growth.
For the period from 27.04.15 to 31.01.16 £’000
2. NET CAPITAL LOSSES
The net capital losses during the period comprise:Non-derivative securities (661) Net capital losses (661)
3. REVENUE
Non-taxable dividends 201Unfranked interest 47 Total revenue 248
4. EXPENSES
Payable to the ACD, associates of the ACD and agents of either of them: Annual Management Charge 52Rebate of Investment Management fees (14)Legal and professional fees 4Printing costs 5Registration fees 2
49Payable to the Depositary, associates of the Depositary and agents of either of them: Depositary’s fees 4Safe custody and other bank charges 1
5
For the period from 27.04.15 to 31.01.16 £’000
4. EXPENSES (continued)
Other expenses:
Fees paid to auditor – audit 8– tax services 3
Publication costs 4
15 Total expenses 69
The Investment Management fees and expenses (plus VAT thereon) for providing investment management services are paid by the ACD out of its remuneration. From 3 August 2015 the Investment Manager has agreed, on a discretionary basis, to waive a portion of its fee, in order to seek to achieve an Ongoing Charges Figure of 1.50%.
For the period from 27.04.15 to 31.01.16 £’000
5. TAXATION
a) Analysis of charge for the period Corporation tax at 20% – Current tax charge – Deferred tax – origination and reversal of timing differences (note 5c) – Total taxation (note 5b) – b) Factors affecting the tax charge for the periodThe tax assessed for the period differs from the standard rate of corporation tax in the UK for an authorised fund (20%). The difference is explained below.
For the period from 27.04.15 to 31.01.16 £’000
Net revenue before taxation 179
Corporation tax at 20% 36

214 Trojan Investment Funds Trojan Investment Funds 215
SPECTRUM INCOME FUND Financial Statements (continued) Notes to the Financial Statements (continued)As at 31 January 2016
For the period from 27.04.15 to 31.01.16 £’000
5. TAXATION (continued)
Effects of: Non-taxable dividends (40)Unutilised excess management expenses 4 Corporation tax charge – Total tax charge (note 5a) –
c) Deferred taxAt the period end there is a potential deferred tax asset of £4 thousand in relation to surplus management expenses. It is unlikely that the Fund will generate suffi cient taxable profi ts in the future to utilise this amount and, therefore, no deferred tax asset has been recognised in the current period.
For the period from 27.04.15 to 31.01.16 £’000
6. FINANCE COSTS
DistributionsThe distributions comprise:
Interim 49Final 177 Net distributions for the period 226 Total fi nance costs 226
Details of the distributions per share are set out in the table on page 221.
For the period from 27.04.15 to 31.01.16 £’000
6. FINANCE COSTS (continued)
Distributions represented by: Net revenue after taxation 179Allocations to capital: Annual Management Charge, net of tax relief 47 Net distributions for the period 226
31.01.16 £’000
7. DEBTORS
Accrued revenue: Non-taxable dividends 49 Unfranked interest 9
58
Prepaid expenses 5 Amounts due from the Investment Manager: Rebate of Investment Management fees 14 Taxation recoverable: Income tax 5 Total debtors 82
8. CREDITORS
Accrued expenses: Amounts payable to the ACD, associates of the ACD and agents of either of them: Annual Management Charge 6 Printing costs 3
9Amounts payable to the Depositary, associates of the Depositary and agents of either of them: Depositary’s fees 1 Other expenses 12 Total creditors 22

216 Trojan Investment Funds Trojan Investment Funds 217
SPECTRUM INCOME FUND Financial Statements (continued) Notes to the Financial Statements (continued)As at 31 January 2016
9. RELATED PARTY TRANSACTIONS
Annual Management Charge and legal and professional fees payable to Capita Financial Managers Limited (‘the ACD’), registration fees payable to Capita Financial Administrators Limited and printing costs payable to Capita Sinclair Henderson Limited (both companies are associates of the ACD) are disclosed in note 4 and amounts due at the period end are disclosed in note 8.
The aggregate monies received by the ACD through the issue of shares and paid on cancellation of shares are disclosed in the Statement of Change in Net Assets Attributable to Shareholders on page 210.
A shareholder may be able to exercise signifi cant infl uence over the fi nancial and operating policies of the Fund and as such is deemed to be a related party. At the balance sheet date the following shareholder held in excess of 20% of the shares in issue of the Fund:
Pershing Nominees Limited 79.56%
10. CONTINGENT LIABILITIES AND COMMITMENTS
There are no contingent liabilities or unrecorded outstanding commitments.
11. SHAREHOLDERS’ FUNDS
‘O’ ‘O’ Income Accumulation
Annual Management Charge 0.65% 0.65%
Opening shares in issue – – Issues 11,033,658 41,139 Cancellations – (15,889) Conversions – – Closing shares in issue 11,033,658 25,250
12. RISK MANAGEMENT POLICIES
In pursuing the investment objective a number of fi nancial instruments are held which may comprise securities and other investments, cash balances and debtors and creditors that arise directly from operations. Derivatives, such as futures or forward currency contracts, may be utilised for hedging purposes.
12. RISK MANAGEMENT POLICIES (continued)
The main risks from the Fund’s holding of fi nancial instruments, together with the ACD’s policy for managing these risks, are set out below:
The ACD has in place a Risk Management Policy and Procedures Document (‘RMPPD’) that sets out the risks that may impact a fund and how the ACD seeks, where appropriate, to manage, monitor and mitigate those risks, and in particular those risks associated with the use of derivatives. The RMPPD sets out both the framework and the risk mitigations operated by the ACD in managing the identifi ed risks of the fund. The ACD requires that the appointed Investment Manager to the fund has in place its own governance structure, policies and procedures that are commensurate with its regulatory obligations and the risks posed by the fund managed.
i. Credit riskCredit risk is the risk that a counterparty may be unable or unwilling to make a payment or fulfi l contractual obligations. This may be in terms of an actual default or by deterioration in a counterparty’s credit quality.
Certain transactions in securities that the Fund enters into expose it to the risk that the counterparty will not deliver the investment for a purchase, or cash for a sale after the Fund has fulfi lled its obligations. As part of its due diligence process, the ACD undertakes a review of the controls operated over counterparties by the Investment Manager, including initial and ongoing due diligence and business volumes placed with each counterparty. In cases which are dependent on the counterparty settling at the transaction’s maturity date, the ACD has policies in place which set out the minimum credit quality expected of a market counterparty or deposit taker at the outset of the transaction.
The bond investments held are exposed to credit risk which refl ects the ability of the issuer to meet its obligations. The ACD monitors the credit rating of bond holdings. The bond in which the Fund invests is a government security which is lower risk.
ii. Interest rate riskInterest rate risk is the risk that the value of the Fund’s investments will fl uctuate as a result of interest rate changes. The value of fi xed interest securities may be affected by changes in interest rates, either globally or locally. Changes in the rate of return in one asset class may infl uence the valuation basis of other classes. The amount of revenue receivable from fl oating rate investments and bank balances or payable on bank overdrafts will be affected by fl uctuations in interest rates. Investment in collective investment schemes exposes the Fund to indirect interest rate risk to the extent that they invest in interest bearing securities, the returns from which will be affected by fl uctuations in interest rates.
The Fund will at times have signifi cant exposure to interest rate risk. This risk is actively managed at all times taking into account the correlations with other risks in the portfolio.

218 Trojan Investment Funds Trojan Investment Funds 219
SPECTRUM INCOME FUND Financial Statements (continued) Notes to the Financial Statements (continued)As at 31 January 2016
12. RISK MANAGEMENT POLICIES (continued)
ii. Interest rate risk (continued) The table below shows the direct interest rate risk profi le:
31.01.16 £’000
Floating rate assets: Pounds sterling 2,293 Fixed rate assets: Pounds sterling 798
Assets on which interest is not paid: Pounds sterling 7,459 Liabilities on which interest is not paid: Pounds sterling (198) Net assets 10,352
The fl oating rate fi nancial assets comprise bank balances which earn interest at rates linked to the Bank of England base rate or its international equivalents and collective investment schemes that pay UK interest distribution.
Fixed rate fi nancial assets held in the current period is a 0% UK government bond held for short term investment purposes.
iii. Foreign currency riskWhere the Fund invests in non-sterling assets, the Investment Manager allows for the foreign currency risk when considering whether to invest and does not seek to hedge this risk.
iv. Liquidity riskThe main liability of the Fund is the cancellation of any shares that investors want to sell. Investments may have to be sold to fund such cancellations should insuffi cient cash be held at the bank to meet this obligation.
To reduce liquidity risk the Investment Manager will ensure that a substantial portion of the Fund’s assets consist of cash and readily realisable investments.
All fi nancial liabilities are payable in one year or less, or on demand.
v. Market price riskMarket price risk is the risk that the value of the Fund’s fi nancial instruments will fl uctuate as a result of changes in market prices caused by factors other than interest rate or foreign currency movement. Market price risk arises primarily from uncertainty about the future prices of fi nancial instruments that the Fund holds.
12. RISK MANAGEMENT POLICIES (continued)
v. Market price risk (continued)Market price risk represents the potential loss the Fund may suffer through holding market positions in the face of price movements. The Fund’s investment portfolio is exposed to price fl uctuations, which are monitored by the ACD in pursuance of the investment objective and policy. The risk is generally regarded as consisting of two elements – stock specifi c risk and market risk. Adhering to investment guidelines and avoiding excessive exposure to one particular issuer can limit stock specifi c risk. Subject to compliance with the investment objective, spreading exposure across a broad range of global stocks can mitigate market risk.
vi. Fair value of fi nancial assets and fi nancial liabilitiesThere is no material difference between the value of the fi nancial assets and liabilities, as shown in the balance sheet, and their fair value.
13. PORTFOLIO TRANSACTION COSTS
Purchases /sales before Gross purchases transaction costs Commissions Taxes /net sales £’000 £’000 £’000 £’00031.01.16 Ordinary shares¹ 1,294 1 – 1,295 Collective investment schemes 8,922 – 4 8,926 Purchases total 10,216 1 4 10,221 Transaction cost % of purchases total 0.01% 0.04% Transaction cost %
of average NAV 0.01% 0.04% Ordinary shares 205 – – 205 Sales total 205 – – 205 Average portfolio dealing spread at 31.01.16 is 0.23%.
¹ Includes corporate actions of £200 thousand on which no direct transaction costs were incurred.

220 Trojan Investment Funds Trojan Investment Funds 221
SPECTRUM INCOME FUND Financial Statements (continued) Notes to the Financial Statements (continued)As at 31 January 2016
14. FAIR VALUE HIERARCHY
Investments are categorised into the following levels based on their fair value measurement:
Level 1: The unadjusted quoted price in an active market for identical assets that the Fund can access at the year end date.
Level 2: Inputs other than quoted prices included within Level 1 that are observable (i.e. developed using market data) for the asset, either directly or indirectly.
Level 3: Inputs are unobservable (i.e. for which market data is unavailable) for the asset.
31.01.16Valuation technique Assets £’000 Level 1 1,197 Level 2 8,933Level 3 – Total portfolio of investments 10,130
Level 1 includes £798 thousand of assets which are debt securities.
DISTRIBUTION TABLEFOR THE PERIOD FROM 27 APRIL 2015 TO 31 JANUARY 2016 – IN PENCE PER SHARE
EQUALISATIONEqualisation applies only to shares purchased during the distribution period (Group 2 shares –the applicable distribution periods for each distribution are shown below). It represents the accrued revenue included in the purchase price of the shares. After averaging it is returned with the distribution as a capital repayment. It is not liable to Income Tax but must be deducted from the cost of the shares for Capital Gains Tax purposes.
Group 2 Interim Final
FromTo
01.05.1531.07.15
01.08.1531.01.16
‘O’ Income shares
Interim NetRevenue
Equalisation Paid30.09.15
Group 1Group 2
0.4380 0.4380
– 0.0000
0.4380 0.4380
Final NetRevenue
Equalisation Payable31.03.16
Group 1Group 2
1.5985 0.6776
– 0.9209
1.5985 1.5985
‘O’ Accumulation shares
Interim NetRevenue
Equalisation Allocated30.09.15
Group 1Group 2
0.4674 –
– 0.4674
0.4674 0.4674
Final NetRevenue
Equalisation Allocation31.03.16
Group 1Group 2
1.5994 1.5994
– 0.0000
1.5994 1.5994

222 Trojan Investment Funds Trojan Investment Funds 223
GENERAL INFORMATION
STRUCTURE OF THE COMPANYThe Company is structured as an umbrella company, in that different sub-funds may be established from time to time by the ACD with the approval of the Financial Conduct Authority. On the introduction of any new sub-fund or class, a revised Prospectus will be prepared setting out the relevant details of each sub-fund or class.
The assets of each sub-fund will be treated as separate from those of every other sub-fund and will be invested in accordance with the investment objective and investment policy applicable to that sub-fund. The sub-funds which are currently available are:
Trojan FundTrojan Ethical Income FundTrojan Global Equity FundTrojan Income FundCrystal FundSpectrum FundSpectrum Income Fund
In the future there may be other sub-funds of the Company.
CLASSES OF SHARESThe Company can issue different classes of shares in respect of any sub-fund.
Holders of Income shares are entitled to be paid the income attributable to such shares, in respect of each annual or interim accounting period.
Holders of Accumulation shares are not entitled to be paid the income attributable to such shares, but that income is retained and accumulated for the benefi t of shareholders and is refl ected in the price of shares.
VALUATION POINTThe valuation point of the Trojan Fund, the Trojan Ethical Income Fund, the Trojan Global Equity Fund, the Trojan Income Fund, the Spectrum Fund and the Spectrum Income Fund is 12.00 noon London time on each business day. The valuation point of the Crystal Fund is 12.00 noon London time on each Thursday which is a business day and the last business day of each month. Valuations may be made at other times under the terms contained within the Prospectus.
BUYING AND SELLING SHARESThe ACD will accept orders to deal in the shares on normal business days between 8.30am and 5.30pm (London time) and transactions will be effected at prices determined by the following valuation. Instructions to buy or sell shares may be either in writing to: 2 The Boulevard, City West One Offi ce Park, Gelderd Road, Leeds LS12 6NT or by telephone on 0345 608 0950.
PRICESThe prices of Class ‘O’ shares in the Trojan Fund, Trojan Ethical Income Fund, Trojan Income Fund, Trojan Global Equity Fund, Spectrum Fund and Spectrum Income Fund are published in the Financial Times. The prices of shares in the Crystal Fund are not currently published in the Financial Times. The prices of all shares are available on the website: www.capitafi nancial.com. Prices of all shares may also be obtained by calling 0345 608 0950 during the ACD’s normal business hours.
OTHER INFORMATION The Instrument of Incorporation, Prospectus, Key Investor Information Document and the most recent interim and annual reports may be inspected at the offi ce of the ACD which is also the Head Offi ce. Copies of these may be obtained upon application and, excepting the Instrument of Incorporation, can be found on the ACD’s website, www.capitafi nancial.co.uk, by following the link ‘Fund Information’.
Shareholders who have any complaints about the operation of the Company should contact the ACD or the Depositary in the fi rst instance. In the event that a shareholder fi nds the response unsatisfactory they may make their complaint direct to the Financial Ombudsman Service at South Quay Plaza, 183 Marsh Wall, London E14 9SR.
DATA PROTECTION ACTShareholders’ names will be added to a mailing list which may be used by the ACD, its associates or third parties to inform investors of other products by sending details of such products. Shareholders who do not want to receive such details should write to the ACD requesting their removal from any such mailing list.
RISK WARNINGAn investment in an open-ended investment company should be regarded as a medium to long term investment. Investors should be aware that the price of shares and the income from them can fall as well as rise and investors may not receive back the full amount invested. Past performance is not a guide to future performance. Investments denominated in currencies other than the base currency are subject to fl uctuation in exchange rates, which can be favourable or unfavourable.


40 Dukes Place, London EC3A 7NHT 0870 607 2555 F 0870 607 2550 www.capitafi nancial.co.uk