Embed Size (px)
Citation preview
Original research
13www.ceceditore.com
Ab
str
Ac
t
Nutrafoods (2017) 16:13-17DOI 10.17470/NF-017-1030-1
Received: September 21, 2016Accepted: November 4, 2016
This article presents the results of a study on the effectiveness of oral administration of the probiotic
Enterococcus faecium L3 on the trophological status of infants and their quality of life. Over 10 weeks
during autumn and winter, we observed 26 children aged 2–12 months in a specialized (psychoneu-
rological) children’s orphanage. Children were randomly divided into a main group (n=15) and a
comparison group (n=11). The groups were similar regarding sex (p=0.62) and trophological status
(body weight, Chulitskaya index and body mass index). The average ages of the children in the main
and comparison groups were 4.3±0.4 and 6.4±0.18 months, respectively (p=0.02). In addition to their
regular food, children in the main group received 5 ml of a liquid probiotic form of E. faecium L3 108
CFU/ml twice a day. Indicators of trophological status were assessed every 2 weeks, change in quality
of life according to the QUALIN questionnaire at baseline and at study completion, incidence of acute
respiratory infections, and completion of planned vaccinations. Children in the main group showed
increased growth rates during the first 4 weeks of the study and also an improved Chulitskaya index
during the first 8 weeks of the study. Children in the main group had fewer acute respiratory infections,
improved quality of life and more planned vaccinations.
1North-Western State Medical University named after I.I.
Mechnikov, Saint Petersburg, Russia
2Scientific Research Institute of Children’s Infections,
Saint Petersburg, Russia
3Specialized Orphanage No. 16 (Psychoneurological),
Saint Petersburg, Russia
4Institute of Experimental Medicine of the North-West
Department of RAMS, Saint Petersburg, Russia
5The First Saint Petersburg State Medical University named after
Acad. I.P. Pavlov, Saint Petersburg, Russia
6Saint Petersburg State University, Saint Petersburg, Russia
Correspondence to: Natalia V Gonchar - [email protected]
Trophological status and quality of life in infants administered probiotic enterococci
Natalia V Gonchar1,2*, Vyacheslav P Maryshev3, Tamara V Churkova3, Galina G Alehina4, Vitaliy A Dobrenko5, Alexandr N Suvorov4,6
Introduction
The trophological status of a person describes their state of
health and physical development in relation to the optimal
assimilation of nutrients. In the trophological approach, nu-
tritional values are assessed as the consumption of a particu-
lar set of essential nutrients together with the complex inter-
action of nutrients with the digestive system and the body
as a whole, including metabolic parameters and adaptation
reserves. Disturbance of the internal environment of human
systems can have negative consequences with a decline in
nutrient absorption and an increase in the production of
toxic biologically active substances [1].
As children’s pathological conditions are often associated
with malnutrition, it is very important that malnutrition is
diagnosed and treated at an early age [2]. Timely diagnosis,
treatment strategy and prognosis are based on the results of
dynamic assessment of trophological status [3]. Correction
of malnutrition, depending on aetiology, can be achieved
by various approaches. Where breastfeeding is not possible,
infant formula and food for artificial feeding provide the
growing body with essential nutrients [4]. Inclusion of pro-
biotic strains into the infant formula or supplementation of
their diets with probiotic bacteria optimizes metabolism and
increases resistance to infection due to the actions of probi-
otics as biocatalysts of many vital processes in the body [5].
Differences in the effectiveness of probiotic agents used to
prevent or treat infectious and somatic diseases are deter-
mined by the characteristics of the probiotic strains [6, 7].
Numerous investigations have demonstrated the therapeutic
Keywords:
Infants
Trophological status
Quality of life
Probiotic strain
of Enterococcus
Incidence
Acute respiratory infection
Planned vaccination
14 www.ceceditore.com
Nutrafoods (2017) 16:1-17 Original research
10 weeks): body weight, body length, arm circumference,
chest circumference, hip circumference, lower leg circum-
ference, BMI, Chulitskaya index and Erismann index; (2)
QUALIN [11], a quality of life questionnaire for paediatri-
cians (assessed at baseline and at study completion); (3) the
number of cases of acute respiratory infections (ARIs) during
the study (the absolute number and percentage of children
affected in each group); and (4) the absolute number and
percentage of vaccinated children in each group.
The trophological status of the children was based on as-
sessment of the Chulitskaya index, Erismann index and
BMI. The Chulitskaya index is traditionally used by pae-
diatricians to evaluate the nutritional status of children
in the first year of life. Normal values are in the range
20–25 with a decrease in the index indicating malnutri-
tion [2]. The Chulitskaya index was calculated using the
formula: Chulitskaya index=3×arm circumference+thigh
circumference+tibia circumference–body length (cm). The
Erismann index was calculated using the formula: Eris-
mann index=chest circumference–(0.5×length) (cm). BMI
was determined using the formula: BMI=weight (kg)/length
(m)2 [12].
The QUALIN questionnaire for evaluating the quality of the
first year of life in children consisted of 33 questions on:
(1) behaviour and communication (13 questions); (2) abil-
ity to stay alone (5 questions); (3) family surroundings (4
questions); and (4) neuropsychological development and
physical health (11 questions). Each question included six
possible answers: ‘Definitely not’ (1 point), ‘Rather no than
yes’ (2 points), ‘Yes and no’ (3 points), ‘More likely than not’
(4 points), ‘Definitely yes’ (5 points) and ‘I do not know’ (0
points). The average of each of these four indicators of QoL
and the average value of the sum of all 33 questions (aver-
age value) were calculated. We counted the total number of
points for each child and the average number of points in
both groups. QUALIN also provides an ‘overall assessment’
of the child’s QoL by assigning numbers in the range from 1
(‘very bad’) to 10 (‘excellent’). The results of the estimations
were converted to a 0–5 scale where 1 and 2 corresponded
to 1 point, 3 and 4 to 2 points, 5 and 6 to 3 points, 7 and 8 to
4 points, and 9 and 10 to 5 points. The result was called the
‘approximate overall assessment’ and the average value was
determined in both groups of children. We analysed seven
QoL indicators in total.
The results were subjected to statistical analysis using Stu-
dent’s t-test and Pearson’s χ2 test. Differences between the
results obtained in the groups under study were considered
significant at p<0.05.
and prophylactic effectiveness of probiotic strain Enterococ-
cus faecium L3 in paediatrics [8, 9]. The aim of this study
was to investigate the effect of a liquid form of the probi-
otic E. faecium L3 on trophological status and quality of life
(QoL) in infants.
Materials and methods
A total of 26 children in the first year of life were observed
in St. Petersburg specialized orphanage No. 16 for 10 weeks
from November 2014 to February 2015. This orphanage
cares for the children of socially disadvantaged parents. Dur-
ing pregnancy, most of the mothers consumed inappropri-
ate drugs, alcohol and nicotine, and had various illnesses
including sexually transmitted diseases (including HIV,
hepatitis C and syphilis) and in some cases tuberculosis.
The physical development indicators of the children at birth
were characterized by low values due to the high incidence
of prematurity, drug withdrawal syndrome at birth and in-
trauterine growth retardation. In the first months of life,
these children received antibiotic treatment (prophylactic
treatment for syphilis), antiretroviral prophylaxis (Viramune,
Epivir, Retrovir) and pneumocystis pneumonia prophylaxis
(Biseptol). During the first year of life, the physical develop-
ment of children with intoxication at birth is delayed and
they are underweight and stunted [10].
The criteria for enrolment of children in the study were age
2–12 months and absence of chronic diseases, serious con-
genital malformations and functional insufficiency of organs
or systems. The children were randomly divided into two
groups. The main group (n=15) included eight boys and sev-
en girls, while the control group (n=11) consisted of seven
boys and four girls. The groups did not differ significantly by
sex (p=0.62), initial average body weight (p=0.07), Chulit-
skaya index (used to determine the trophological status of
infants) (p=0.98) or body mass index (BMI) (p=0.66) (Table
1). The mean age (±SD) of children in the main group was
4.3±0.4 months, and 6.4±0.18 months (p=0.02) in the com-
parison group.
Twice a day, children in the main group received 5 ml
of a liquid form of the probiotic E. faecium L3 (No. RU.
77.99.26.009.E.002272.02.11) with a titre of bacteria of not
less than 108 CFU/ml. The probiotic E. faecium L3 was add-
ed to the infant formula. Children in the comparison group
received the normal diet for their age.
The effectiveness of the addition of E. faecium L3 was com-
pared in the two groups of children by assessing: (1) tropho-
logical status (evaluated at baseline and every 2 weeks for
www.ceceditore.com
Original research Nutrafoods (2017) 16:1-17
15
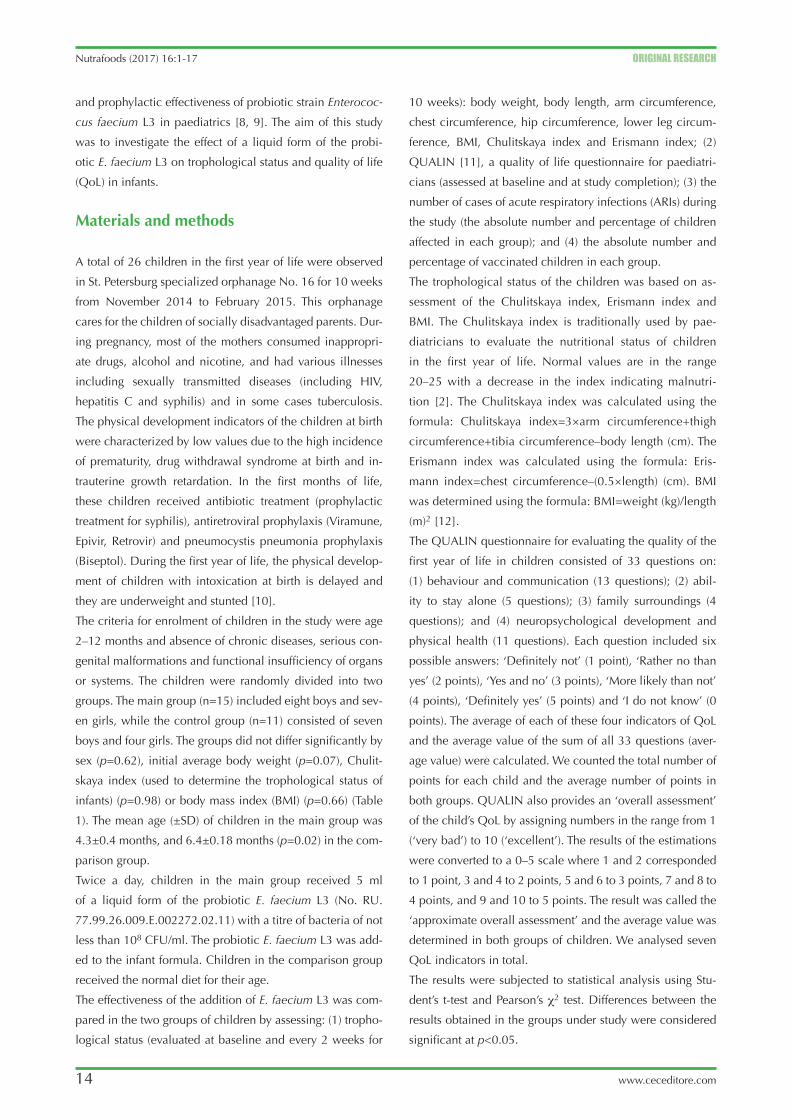
Erismann index values were significantly higher in chil-
dren in the main group at baseline, 2 weeks and 8 weeks
(Table 1). There were no significant differences in BMI or
the Chulitskaya index between the groups during the study.
Chulitskaya index values were below normal throughout the
study, reflecting the difficulties treating malnutrition in these
patients.
Average growth values were compared throughout the
study. There was a reduction in BMI gain in the main group
compared to the comparison group. This difference was sig-
nificant at 2 weeks (–0.15±0.51 kg/m2; 0.25±0.38 kg/m2;
t=2.13; p=0.04) but not significant at 4 weeks (–0.19±0.59
kg/m2; 0.13±0.48 kg/m2;
t=1.48; p=0.15), reflecting an
overall increase in body length
in the main group. Changes
in the average increase in the
Erismann index in children in
the main group compared to
the comparison group were
characterized by their low val-
ues at 4 weeks (–0.33±1.09
cm; 0.46±0.69 cm; t=–2.11;
p=0.05) and high values at
8 weeks (0.23±0.46 cm;
–0.18±0.40; t=2.40; p=0.03).
This indicated greater improve-
ment in the nutritional status
of children in the main group
than in the comparison group.
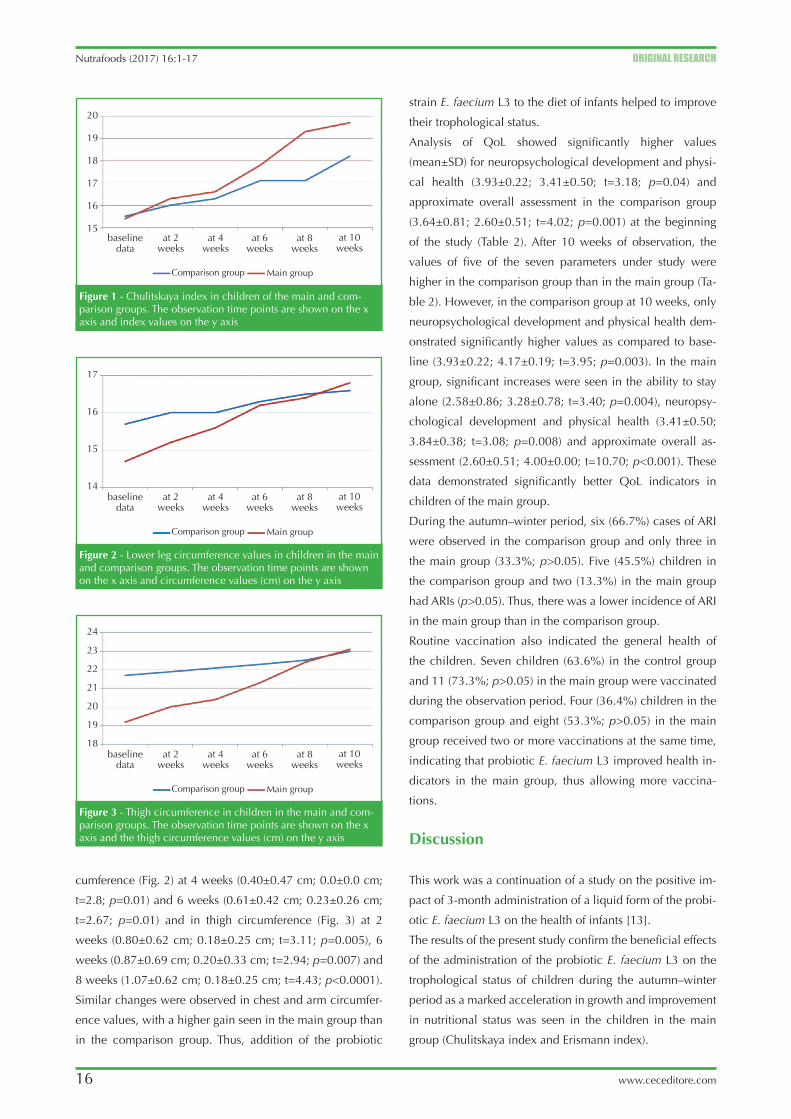
Changes in the Chulitskaya
index indicated accelerated
elimination of malnutrition in
children in the main group as
values from 2 to 8 weeks were
higher in the main group than in
the comparison group (Fig. 1).
The average Chulitskaya index
values in the main group signif-
icantly increased between the
6th and 8th weeks (1.53±1.77
cm) compared to no increase
in the comparison group in the
same age group (0.00±1.00
cm; t=2.58; p=0.02). The fast-
er increase in the main group
was the result of significantly
higher increases in tibia cir-
Results
Comparison of the main indicators of trophological status
(weight and body length) revealed a marked increase in the
weight of children throughout the study and the absence
of significant differences between the groups (Table 1). The
body length of the children also increased. The baseline body
length in the comparison group was higher than in the main
group, but this difference later disappeared, indicating accel-
erated growth in children in the main group. The increase in
the average body length of the comparison group early in the
study was slower than in the main group of children (Table 1).
Table 1 - Average trophological status data (mean±SD) in two groups of children in the first year of life
Trophological status criteria Comparison group (n=11) Main group (n=15) Student’s t p Value
Baseline data
Body mass (g) 6340±1402 5386±1168 1.89 0.07
Length (cm) 62.2±4.7 56.8±5.1 2.78 0.01
Body mass index (kg/m2) 16.2±1.9 16.5±1.6 -0.44 0.66
Chulickaya index (cm) 15.5±5.6 15.4±4.2 0.03 0.98
Erismann index (cm) 10.2±1.5 12.2±2.1 -2.66 0.02
At 2 weeks
Body mass (g) 6563±1387 5635±1170 1.85 0.08
Length (cm) 62.9±4.5 58.4±4.9 2.38 0.03
Body mass index (kg/m2) 16.4±1.9 16.3±1.6 0.13 0.89
Chulickaya index (cm) 16.0±5.7 16.3± 4.6 -0.15 0.88
Erismann index (cm) 10.2±1.5 12.0±1.7 -2.82 0.01
At 4 weeks
Body mass (g) 6717±1321 5874±1188 1.71 0.10
Length (cm) 63.4±4.4 60.0±4.8 1.85 0.08
Body mass index (kg/m2) 16.6±1.8 16.2±1.6 0.64 0.53
Chulickaya index (cm) 16.3±5.9 16.6±4.4 -0.16 0.87
Erismann index (cm) 10.6±1.5 11.7±1.6 -1.64 0.11
At 6 weeks
Body mass (g) 6871±1264 6094±1021 1.73 0.10
Length (cm) 64.2±4.4 61.2±3.8 1.83 0.08
Body mass index (kg/m2) 16.6±1.6 16.1±1.4 0.75 0.46
Chulickaya index (cm) 17.1±6.4 17.8±3.9 -0.35 0.73
Erismann index (cm) 10.8±1.7 11.8±1.3 -1.67 0.11
At 8 weeks
Body mass (g) 7072±1192 6349±1026 1.66 0.11
Length (cm) 65.0±4.0 62.2±3.8 1.79 0.09
Body mass index (kg/m2) 16.6±1.4 16.3±1.4 0.59 0.56
Chulickaya index (cm) 17.1±6.1 19.3±3.3 -1.21 0.24
Erismann index (cm) 10.6±1.6 12.0±1.5 -2.26 0.03
At 10 weeks
Body mass (g) 7246±1223 6485±1055 1.70 0.10
Length (cm) 66.0±4.0 63.3±4.0 1.75 0.09
Body mass index (kg/m2) 16.5±1.5 16.1±1.2 0.77 0.45
Chulickaya index (cm) 18.2±6.5 19.7±3.1 -0.80 0.43
Erismann index (cm) 11.0±1.5 11.9±1.7 -1.41 0.17
Significant p values are shown in bold
16 www.ceceditore.com
Nutrafoods (2017) 16:1-17 Original research
strain E. faecium L3 to the diet of infants helped to improve
their trophological status.
Analysis of QoL showed significantly higher values
(mean±SD) for neuropsychological development and physi-
cal health (3.93±0.22; 3.41±0.50; t=3.18; p=0.04) and
approximate overall assessment in the comparison group
(3.64±0.81; 2.60±0.51; t=4.02; p=0.001) at the beginning
of the study (Table 2). After 10 weeks of observation, the
values of five of the seven parameters under study were
higher in the comparison group than in the main group (Ta-
ble 2). However, in the comparison group at 10 weeks, only
neuropsychological development and physical health dem-
onstrated significantly higher values as compared to base-
line (3.93±0.22; 4.17±0.19; t=3.95; p=0.003). In the main
group, significant increases were seen in the ability to stay
alone (2.58±0.86; 3.28±0.78; t=3.40; p=0.004), neuropsy-
chological development and physical health (3.41±0.50;
3.84±0.38; t=3.08; p=0.008) and approximate overall as-
sessment (2.60±0.51; 4.00±0.00; t=10.70; p<0.001). These
data demonstrated significantly better QoL indicators in
children of the main group.
During the autumn–winter period, six (66.7%) cases of ARI
were observed in the comparison group and only three in
the main group (33.3%; p>0.05). Five (45.5%) children in
the comparison group and two (13.3%) in the main group
had ARIs (p>0.05). Thus, there was a lower incidence of ARI
in the main group than in the comparison group.
Routine vaccination also indicated the general health of
the children. Seven children (63.6%) in the control group
and 11 (73.3%; p>0.05) in the main group were vaccinated
during the observation period. Four (36.4%) children in the
comparison group and eight (53.3%; p>0.05) in the main
group received two or more vaccinations at the same time,
indicating that probiotic E. faecium L3 improved health in-
dicators in the main group, thus allowing more vaccina-
tions.
Discussion
This work was a continuation of a study on the positive im-
pact of 3-month administration of a liquid form of the probi-
otic E. faecium L3 on the health of infants [13].
The results of the present study confirm the beneficial effects
of the administration of the probiotic E. faecium L3 on the
trophological status of children during the autumn–winter
period as a marked acceleration in growth and improvement
in nutritional status was seen in the children in the main
group (Chulitskaya index and Erismann index).
cumference (Fig. 2) at 4 weeks (0.40±0.47 cm; 0.0±0.0 cm;
t=2.8; p=0.01) and 6 weeks (0.61±0.42 cm; 0.23±0.26 cm;
t=2.67; p=0.01) and in thigh circumference (Fig. 3) at 2
weeks (0.80±0.62 cm; 0.18±0.25 cm; t=3.11; p=0.005), 6
weeks (0.87±0.69 cm; 0.20±0.33 cm; t=2.94; p=0.007) and
8 weeks (1.07±0.62 cm; 0.18±0.25 cm; t=4.43; p<0.0001).
Similar changes were observed in chest and arm circumfer-
ence values, with a higher gain seen in the main group than
in the comparison group. Thus, addition of the probiotic
Figure 1 - Chulitskaya index in children of the main and com-parison groups. The observation time points are shown on the x axis and index values on the y axis
Figure 2 - Lower leg circumference values in children in the main and comparison groups. The observation time points are shown on the x axis and circumference values (cm) on the y axis
Figure 3 - Thigh circumference in children in the main and com-parison groups. The observation time points are shown on the x axis and the thigh circumference values (cm) on the y axis
20
19
18
17
16
15
17
16
15
14
24
23
22
21
20
19
18
baseline data
baseline data
baseline data
Comparison group
Comparison group
Comparison group
Main group
Main group
Main group
at 2weeks
at 2weeks
at 2weeks
at 4weeks
at 4weeks
at 4weeks
at 6weeks
at 6weeks
at 6weeks
at 8weeks
at 8weeks
at 8weeks
at 10weeks
at 10weeks
at 10weeks
www.ceceditore.com
Original research Nutrafoods (2017) 16:1-17
17
(eds) Intestinal dysbiosis. Guidelines for the diagnosis and treat-
ment, 2nd ed. InformMed, St. Petersburg, pp 175–223
5. Makarova SG, Namazova-Baranova LS (2015) Intestinal microbiota
and probiotics in pediatric practice. What’s new? Pediatr Pharmacol
12:38–45
6. Tilg H, Moschen AR (2014) Microbiota and diabetes: an evolving
relationship. Gut 63:1513–1521
7. Ermolenko E, Gromova L, Borschev Y et al. (2013) Influence of dif-
ferent probiotic lactic acid bacteria on microbiota and metabolism
of rats with dysbiosis. Biosci Microbiota Food Health 32(2):1–9
8. Zakharchenko SM (2011) Enterococcal probiotics in the repre-
sentation of contemporary physician. Gastroenterol St. Petersburg
4:13–16
9. Sokolova MI, Akimov AA, Shishkina YA, Novozhilova MV, Ale-
khina GG (2013) Clinical features and rehabilitation of children
with malnutrition from socially disadvantaged families. Pediatrics
4(2):70–74
10. Maryshev VP (2012) Influence of alcohol consumption and tobacco
use by pregnant women in the pre- and postnatal development of
the child. Children’s Medicine North-West 3:22–25
11. Chernikov VV (2009) Development of the Russian version of the
questionnaire QUALIN for quality of life of young children. Ques-
tions Contemp Pediatr 8:14–18
12. Gritsinskaya VL (2010) Evaluation index of body mass index in chil-
dren first year of life. Hyg Sanit 2:63–65
13. Gonchar NV, Suvorov AN, Maryshev VP et al. (2015) Probiotics, nu-
tritional status and resistance to respiratory infections in infants. Exp
Clin Gastroenterol 113:48–54
14. Shulpekova JO (2014) Intestinal microbiota as a special body [in
Russian]. Russ J Gastroenterol Hepatol Coloproctol 24:82–88
The intestinal microbiota responds dynamically to changes
in the external environment, including food and weather
conditions. Probiotic bacteria can produce hormones,
growth factor analogues and neurotransmitters that affect
metabolism [14]. The data obtained suggest that the quali-
tative and quantitative composition of the intestinal micro-
biota was improved in children of the main group receiving
the probiotic. Although the initially higher QoL indicators in
the comparison group were possibly explained by the dif-
ference in the age of the children in the two groups, during
10 weeks of observation only one of the seven QoL param-
eters studied in the comparison group improved compared
to three of the seven parameters in the main group. Thus, the
improved trophological status of the children in the first year
of life in the main group indicates the prophylactic value of
probiotic of E. faecium L3. We also noted a lower incidence
of ARIs, increased routine immunization and a marked in-
crease in QoL.
ReFeReNCeS
1. Luft VM, Luft VV (2013) Trophological status: evaluation criteria and
diagnostic trophic failure. In: Luft VM, Bagnenko SF (eds) Manual of
clinical nutrition, 2nd ed. Art-Express, St. Petersburg, pp 57–84
2. Jur’ev VV, Khomich MM (eds) (2012) Propaedeutics – childhood dis-
eases. GEOTAR-Media, Moscow, 720 pp
3. Ladodo KS (ed) (2015) Clinical nutrition childhood: a guide for phy-
sicians, 2nd ed. Medical News Agency, Moscow, 720 pp
4. Bulatova EM, Bogdanova IM (2009) Formation and the role of mi-
crobiota in children. Current approaches to diagnosis and treatment
of intestinal dysbiosis in pediatric. In: Tkachenko EI, Suvorov AN
Table 2 - Quality of life (mean±SD) parameters assessed using the Qualin questionnaire in children in their first year of life
Quality of life parameters Compared parametersComparison group
(n=11)Main group (n=15) Student’s t p Value
Behaviour and communication Baseline 3.99±0.51 3.78±0.74 0.82 0.42
At 10 weeks 4.29±0.21 3.85±0.57 2.40 0.02
Ability to stay aloneBaseline 3.60±0.59 3.21±0.70 1.49 0.15
At 10 weeks 3.62±0.57 3.04±0.70 2.25 0.03
Family surroundingsBaseline 3.20±0.74 2.58±0.86 1.93 0.07
At 10 weeks 3.55±0.51 3.28±0.78 0.97 0.34
Neuropsychological deve-lopment and physical health
Baseline 3.93±0.22 3.41±0.50 3.18 0.004
At 10 weeks 4.17±0.19 3.84±0.38 2.64 0.01
Approximate overall assessmentBaseline 3.64±0.81 2.60±0.51 4.02 0.001
At 10 weeks 4.00±0.00 4.00±0.00 0.0 1.0
Number of pointsBaseline 125.9±9.2 113.1±19.3 2.04 0.053
At 10 weeks 133.9±7.9 120.7±15.4 2.60 0.02
Average value Baseline 3.82±0.28 3.43±0.59 2.04 0.053
At 10 weeks 4.06±0.24 3.66±0.47 2.61 0.02
Significant p values are shown in bold


![[hal-00779493, v2] Image Classification with the Fisher Vector ...rogerioferis.com/VisualRecognitionAndSearch2014/material/...INRIA/RR--8209--FR+ENG RESEARCH REPORT N 8209 May 2013](https://img.pdfslide.net/doc/110x75/5f4eebac71e25a792a76dad0/hal-00779493-v2-image-classification-with-the-fisher-vector-inriarr-8209-freng.jpg)