Embed Size (px)
Citation preview
1
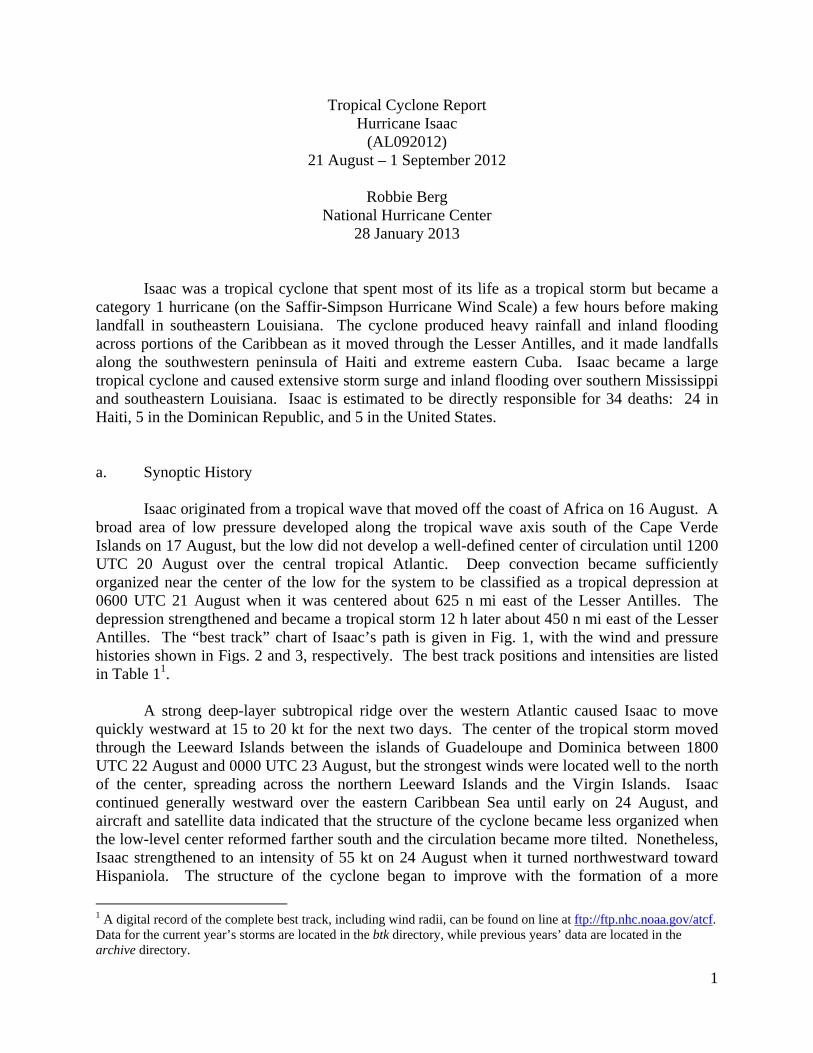
Tropical Cyclone Report Hurricane Isaac
(AL092012) 21 August – 1 September 2012
Robbie Berg
National Hurricane Center 28 January 2013
Isaac was a tropical cyclone that spent most of its life as a tropical storm but became a category 1 hurricane (on the Saffir-Simpson Hurricane Wind Scale) a few hours before making landfall in southeastern Louisiana. The cyclone produced heavy rainfall and inland flooding across portions of the Caribbean as it moved through the Lesser Antilles, and it made landfalls along the southwestern peninsula of Haiti and extreme eastern Cuba. Isaac became a large tropical cyclone and caused extensive storm surge and inland flooding over southern Mississippi and southeastern Louisiana. Isaac is estimated to be directly responsible for 34 deaths: 24 in Haiti, 5 in the Dominican Republic, and 5 in the United States. a. Synoptic History
Isaac originated from a tropical wave that moved off the coast of Africa on 16 August. A broad area of low pressure developed along the tropical wave axis south of the Cape Verde Islands on 17 August, but the low did not develop a well-defined center of circulation until 1200 UTC 20 August over the central tropical Atlantic. Deep convection became sufficiently organized near the center of the low for the system to be classified as a tropical depression at 0600 UTC 21 August when it was centered about 625 n mi east of the Lesser Antilles. The depression strengthened and became a tropical storm 12 h later about 450 n mi east of the Lesser Antilles. The “best track” chart of Isaac’s path is given in Fig. 1, with the wind and pressure histories shown in Figs. 2 and 3, respectively. The best track positions and intensities are listed in Table 11.
A strong deep-layer subtropical ridge over the western Atlantic caused Isaac to move
quickly westward at 15 to 20 kt for the next two days. The center of the tropical storm moved through the Leeward Islands between the islands of Guadeloupe and Dominica between 1800 UTC 22 August and 0000 UTC 23 August, but the strongest winds were located well to the north of the center, spreading across the northern Leeward Islands and the Virgin Islands. Isaac continued generally westward over the eastern Caribbean Sea until early on 24 August, and aircraft and satellite data indicated that the structure of the cyclone became less organized when the low-level center reformed farther south and the circulation became more tilted. Nonetheless, Isaac strengthened to an intensity of 55 kt on 24 August when it turned northwestward toward Hispaniola. The structure of the cyclone began to improve with the formation of a more
1 A digital record of the complete best track, including wind radii, can be found on line at ftp://ftp.nhc.noaa.gov/atcf. Data for the current year’s storms are located in the btk directory, while previous years’ data are located in the archive directory.
2
developed inner core and the first hints of an eye just before Isaac made landfall on the southern coast of Haiti near the city of Jacmel around 0600 UTC 25 August.
The center of Isaac quickly traversed the narrow southwestern peninsula of Haiti, and the
cyclone weakened slightly when the circulation interacted with the mountainous terrain of Hispaniola. Isaac continued northwestward over the Gulf of Gonâve during the early morning hours of 25 August and moved just south of the Windward Passage, making landfall along the southeastern coast of Cuba near Cajobabo, Guantánamo, around 1500 UTC with maximum winds of 50 kt. The center emerged from the northern coast of Cuba into the Atlantic near Rafael Freyre, Holguín, around 2015 UTC. Isaac grew in size during its passage across Haiti and Cuba, with tropical-storm-force winds extending up to 180 n mi to the north of the center across the Turks and Caicos Islands and most of the Bahamas.
After emerging over the Atlantic, Isaac turned west-northwestward and moved faster on
26 August between a large deep-layer low over the northwestern Caribbean Sea and a mid-tropospheric ridge over the western Atlantic. Isaac had maximum sustained winds of 50 kt while the center moved parallel to the northern coast of Cuba toward the Straits of Florida, passing south of the Florida Keys later in the day. Tropical-storm-force winds, especially in gusts, affected the Florida Keys and South Florida in rain bands that moved across the area for much of the day.
Isaac entered the southeastern Gulf of Mexico early on 27 August, moving more slowly
toward the west-northwest and northwest as it reached the southwestern periphery of the subtropical ridge. The wind field remained large, and microwave data indicated that deep convection became more organized in a ring around the center of circulation. Isaac gradually strengthened while moving across the Gulf of Mexico and became a hurricane around 1200 UTC 28 August while centered about 75 n mi southeast of the mouth of the Mississippi River. A mid-level blocking ridge to the northwest of the hurricane caused Isaac to slow down considerably while it approached the coast of Louisiana (Fig. 4), which prolonged the strong winds, dangerous storm surge, and heavy rains along the northern Gulf coast. Isaac made its first landfall along the coast of Louisiana at Southwest Pass on the mouth of the Mississippi River around 0000 UTC 29 August with maximum sustained winds of 70 kt. The center then wobbled westward back over water (Fig. 5) and made a second landfall just west of Port Fourchon, Louisiana, around 0800 UTC 29 August.
Isaac gradually weakened once it moved inland over southeastern Louisiana, and it
became a tropical storm at 1800 UTC 29 August when the center was located about 35 n mi west-southwest of New Orleans. A mid-level anticyclone over the southeastern United States steered Isaac northwestward across Louisiana on 30 August, and the cyclone weakened to a tropical depression around 0000 UTC 31 August just after crossing into southern Arkansas. The depression turned northward and moved into extreme southwestern Missouri later on 31 August. The center of circulation then lost its definition over western Missouri early on 1 September, and Isaac dissipated just after 0600 UTC about 55 n mi west-southwest of Jefferson City, Missouri. The remnants of Isaac moved northeastward and eastward across Missouri and Illinois, producing several tornadoes across the Mississippi River Valley later on 1 September.
3
b. Meteorological Statistics Observations in Isaac (Figs. 2 and 3) include subjective satellite-based Dvorak technique intensity estimates from the Tropical Analysis and Forecast Branch (TAFB) and the Satellite Analysis Branch (SAB), and objective Dvorak estimates from the Cooperative Institute for Meteorological Satellite Studies/University of Wisconsin-Madison (UW-CIMSS). Data and imagery from NOAA polar-orbiting satellites including the Advanced Microwave Sounding Unit (AMSU), the NASA Tropical Rainfall Measuring Mission (TRMM) and Aqua, the European Space Agency’s Advanced Scatterometer (ASCAT), the Naval Research Laboratory WindSat, and Defense Meteorological Satellite Program (DMSP) satellites, among others, were also useful in constructing the best track of Isaac.
Aircraft observations include flight-level, stepped frequency microwave radiometer (SFMR), and dropwindsonde observations from 18 flights (including 73 center fixes) of the 53rd Weather Reconnaissance Squadron of the U. S. Air Force Reserve Command and 9 flights (including 25 center fixes) of the NOAA Aircraft Operations Center (AOC) WP-3D aircraft. In addition, the 53rd Weather Reconnaissance Squadron and the NOAA AOC G-IV aircraft flew 1 and 6 synoptic surveillance flights, respectively, around Isaac.
National Weather Service WSR-88D Doppler radar data from San Juan, Puerto Rico;
Miami, Florida; Key West, Florida; and Slidell, Louisiana, were used to make center fixes and obtain velocity data while Isaac was near the U. S. coast. Météo-France radar data from Guadeloupe and Martinique as well as radar data from the Institute of Meteorology of Cuba also helped track the center of Isaac.
Ship reports of winds of tropical storm force associated with Isaac are given in Table 2, and selected surface observations from land stations and data buoys are given in Table 3. Winds and Pressure Isaac’s analyzed strengthening to a tropical storm is based on a measured 1500-ft flight-level wind of 44 kt at 1843 UTC 21 August, which suggests maximum surface winds of about 35 kt, and on bias-adjusted SFMR estimates of about 35 kt between 1800 and 2000 UTC 21 August.
The intensity of Isaac on 22 and 23 August is somewhat unclear. An Air Force flight early on 22 August measured bias-adjusted SFMR winds of 50-55 kt east of the Leeward Islands around 0600 UTC, but the peak 850-mb flight-level wind a few hours after that time was 49 kt, which would suggest an intensity of only 40 kt. Subsequent Air Force Reserve and NOAA flights over the eastern Caribbean Sea on 22 August yielded lower flight-level and surface winds. Early on 23 August, Air Force Reserve and NOAA planes flying simultaneous missions continued to measure relatively low flight-level winds, but they also measured bias-adjusted SFMR winds of 58 kt and 60 kt around 0930 UTC. Given the discrepancy between the flight-level and surface estimates, and the potential that the adjustment of the SFMR estimates did not fully account for the peak in rain rates, the maximum sustained winds on 22 and 23 August when Isaac moved across the Leeward Islands are estimated to be about 45 kt. The highest wind
4
reported at a land station in the Leeward Islands was at Grande-Anse on the French island of La Désirade, where a maximum sustained 1-min wind of 41 kt was reported at 0700 UTC 23 August with a gust to 48 kt. A sustained wind of 34 kt and a gust to 45 kt were measured by a United States National Ocean Service (NOS) site on the island of Barbuda at 1212 UTC 23 August. Surface observations of sustained tropical-storm-force winds or greater for the Caribbean Sea are shown in Fig. 6a, while surface observations of tropical-storm-force or greater wind gusts are shown in Fig. 6b. Isaac strengthened over the central Caribbean Sea before making landfall along the southern peninsula of Haiti, and the landfall intensity estimate of 55 kt is based on an 850-mb flight-level wind of 70 kt measured at 1821 UTC 24 August and a 700-mb flight-level wind of 62 kt measured at 1005 UTC 25 August, both of which suggest peak surface winds of about 56 kt. The highest bias-adjusted SFMR estimate around that time was 55 kt at 0526 UTC 25 August. Isaac weakened slightly after moving across Haiti and made landfall along the coast of southeastern Cuba later that day with maximum sustained winds of 50 kt. Aircraft observations were not available at that time, but the subsequent Hurricane Hunter flight measured a maximum wind of 56 kt at the 850-mb flight level at 2012 UTC 25 August, suggesting peak surface winds of 45 kt. Isaac re-strengthened after moving off the northern coast of Cuba and temporarily had maximum winds of 55 kt. This estimate is based on an 850-mb flight-level wind of 69 kt and a bias-adjusted SFMR estimate of 53 kt, both occurring around 0707 UTC 26 August. However, the subsequent Hurricane Hunter flight in the afternoon failed to find winds that high while Isaac was moving through the Straits of Florida toward the Lower Florida Keys. The maximum 850-mb flight-level wind reported by the afternoon flight was 56 kt at 1743 UTC 26 August, accompanied by a bias-adjusted SFMR estimate of 51 kt at 1509 UTC. These data are the basis for Isaac’s estimated 50-kt intensity when it passed by the Florida Keys. When Isaac moved across the eastern Gulf of Mexico, dropsonde data indicated that the minimum central pressure steadily decreased, but aircraft observations showed that maximum surface winds were not increasing, likely because the wind field was expanding at the same time. For example, the minimum central pressure first dropped to 987 mb, the nominal minimum pressure for a typical category 1 hurricane2, around 1200 UTC 27 August. However, the reconnaissance flight at the time only measured a maximum 850-mb flight-level wind of 56 kt, and the highest bias-adjusted SFMR wind was 51 kt. The first observations supporting hurricane-force winds at the surface began late on 27 August and early on 28 August when flight-level winds and dropsonde data suggested maximum surface winds of 60-65 kt. However, SFMR measurements did not support hurricane-force winds for about another 12 h, when a bias-adjusted estimate of 64 kt occurred at 1551 UTC 28 August. Based on these data, it is estimated that Isaac reached hurricane strength around 1200 UTC 28 August. By this time, the minimum central pressure was 976 mb.
Flight-level winds continued to increase up until landfall along the Louisiana coast, with the highest measured 850-mb wind of 96 kt occurring at 2249 UTC 28 August. This observation 2 Dvorak, V. F., 1984: Tropical cyclone intensity analysis using satellite data. NOAA Tech. Rep. 11, 45 pp.
5
would typically suggest an intensity of about 77 kt, however SFMR winds did not increase further, and several surface measurements made around the time of the highest flight-level wind continued to support an intensity of 60-65 kt. At 2333 UTC, a Texas Tech University Hurricane Research Team (TTUHRT) sensor in Buras, Louisiana, measured a peak 1-minute sustained wind of 65 kt and a gust to 75 kt at an elevation of 2.25 m (7.4 ft). The sensor was located on top of a levee and was likely affected by wind speed-up effects. Accounting for the possible speed-up effects and sensor elevation, the TTUHRT estimates that the peak 1-minute sustained wind at 10 m for that location was 66-67 kt. Isaac’s estimated peak intensity of 70 kt, occurring between 1800 UTC 28 August and 0600 UTC 29 August, is a blend of the aircraft and surface data. The highest gust recorded on land was 84 kt by a WeatherBug station in Poydras in St. Bernard Parish, Louisiana, at 0639 UTC 29 August.
The minimum central pressure of 965 mb around 0300 UTC 29 August is based on a
dropsonde report from the NOAA P-3 of a surface pressure of 966 mb with 12 kt of wind at 0238 UTC. Official stations at Pilot’s Station East at Southwest Pass and Grand Isle reported minimum pressures of 969.8 mb and 970.0 mb, respectively. Minimum pressures of 967.4 mb and 967.6 mb were reported by unofficial stations at Montegut and Chauvin, Louisiana, respectively.
Surface observations of sustained tropical-storm-force winds or greater for the Gulf of Mexico and surrounding coastal areas are shown in Fig. 7a, while surface observations of tropical-storm-force or greater wind gusts are shown in Fig. 7b. Storm Surge3
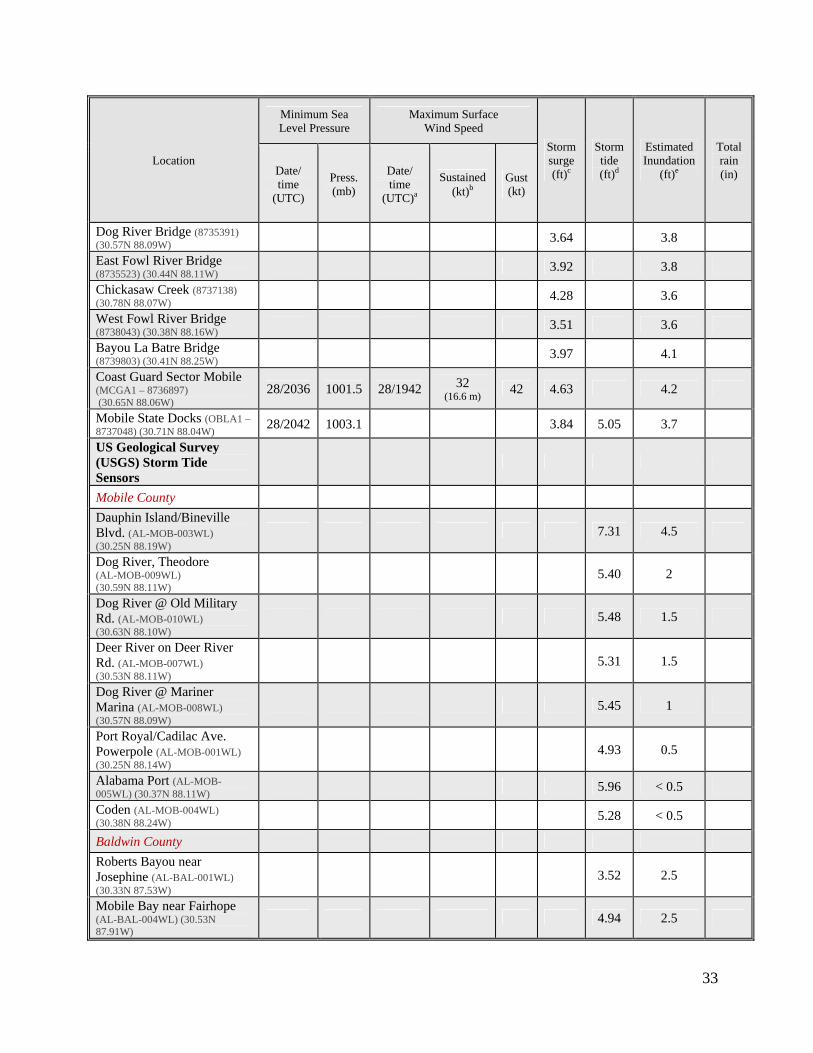
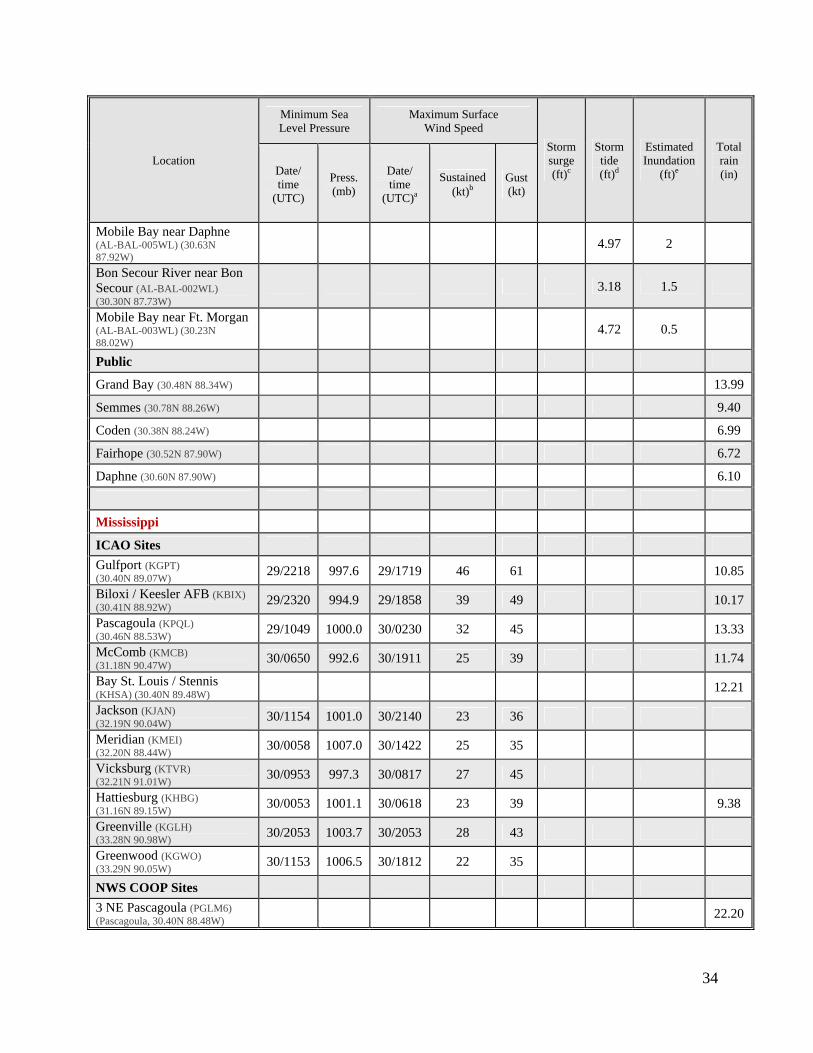
Isaac’s large wind field led to extensive storm surge flooding along the northern Gulf of Mexico coastline, especially in southeastern Louisiana, Mississippi, and Alabama. The highest storm surge measured by a NOS tide gauge was 11.03 ft above normal tide levels at Shell Beach, Louisiana, on the southern end of Lake Borgne (Fig. 8). A storm surge of 6.69 ft was measured at Pilottown, Louisiana, near the mouth of the Mississippi River, and a surge of 6.35 ft was observed in New Orleans at New Canal Station on the southern shore of Lake Pontchartrain. In Mississippi, a storm surge of 8.00 ft was measured by the NOS gauge at the Bay Waveland Yacht Club. Farther east, a storm surge of 4.63 ft was measured in Mobile Bay, Alabama, at the Coast Guard Sector Mobile facility.
In Louisiana, the following inundation levels, expressed above ground level, were prevalent near the immediate coast, lakeshore, or levee systems due to the storm tide:
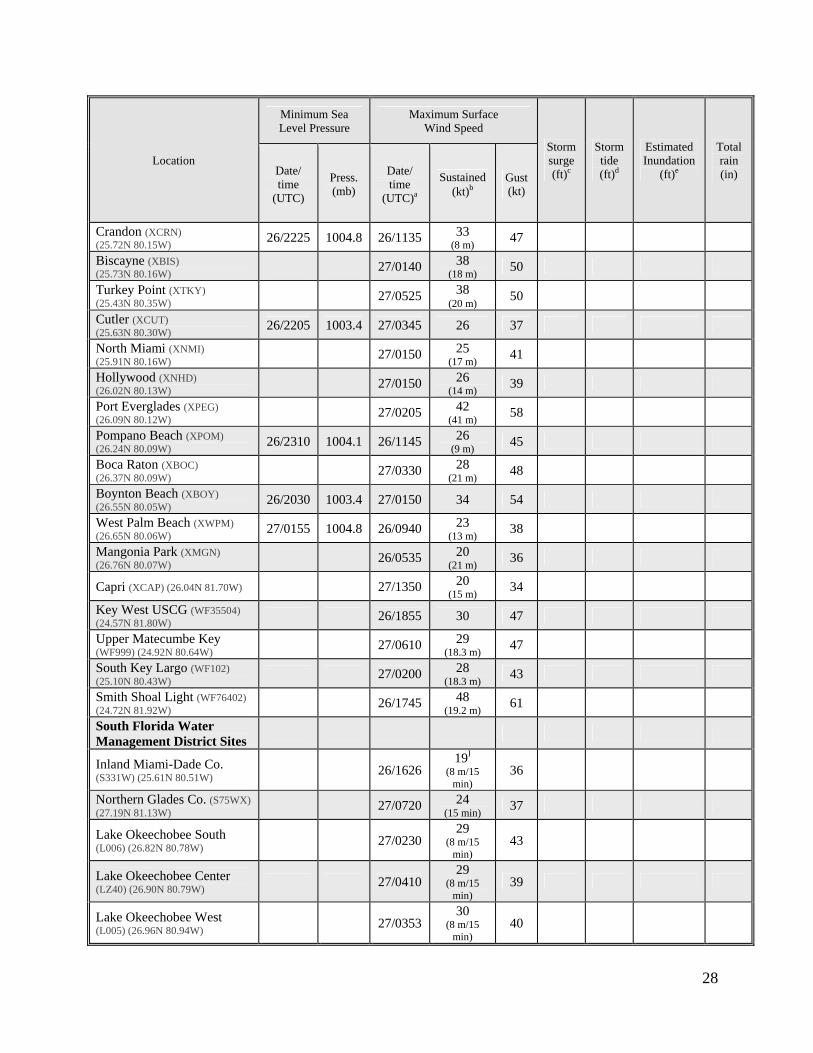
3 Several terms are used to describe water levels due to a storm. Storm surge is defined as the abnormal rise of water generated by a storm, over and above the predicted astronomical tide, and is expressed in terms of height above normal tide levels. Because storm surge represents the deviation from normal water levels, it is not referenced to a vertical datum. Storm tide is defined as the water level due to the combination of storm surge and the astronomical tide, and is expressed in terms of height above a vertical datum, i.e. the North American Vertical Datum of 1988 (NAVD88) or Mean Lower Low Water (MLLW). Inundation is the total water level that occurs on normally dry ground as a result of the storm tide, and is expressed in terms of height above ground level. At the coast, normally dry land is roughly defined as areas higher than the normal high tide line, or Mean Higher High Water (MHHW).
6
Plaquemines Parish 10 – 17 ft St. Bernard Parish 8 – 12 ft Orleans and St. Tammany Parishes 4 – 8 ft Jefferson and Tangipahoa Parishes 3 – 6 ft St. John the Baptist and St. Charles Parishes 1 – 3 ft Storm tide is estimated to have inundated parts of Plaquemines Parish with as much as 10
to 17 ft of water above ground level, based on data from United States Geological Survey (USGS) pressure sensors and surveyed high-water marks (Fig. 9a). Isaac piled water up from Breton Sound against a non-federal back levee that was meant to protect the east bank of Plaquemines Parish, and several USGS pressure sensors indicated that water depths just outside the levee in northern Plaquemines Parish reached 9 to 14 ft above ground level. The non-federal levee heights vary from 8.5 to 12 ft, and as a result, water overtopped the levee and began spilling into the area between it and the Mississippi River levee, extending from Braithwaite southward to Bel Air. The deepest water likely occurred in uninhabited areas within the levee system, which tend to be at lower elevations than major roads and nearby residential and commercial areas. A USGS pressure sensor secured to the base of a tree in an uninhabited area near Scarsdale measured a storm tide of 14.0 ft above NAVD88. Since the sensor was surveyed at an elevation of 2.8 ft below NAVD88, the inundation at that location was almost 17 ft above ground level. Lower but still significant inundation occurred in more inhabited areas. Data from a storm tide sensor near the Braithwaite Golf Course indicated that the water was as much as 13 to 14 ft deep there. The highest high-water mark surveyed by the USGS was 14.25 ft above NAVD88 in a residence in Bertrandville, suggesting an inundation of 6 to 7 ft above ground level. Farther south in Plaquemines Parish, water depths were 10 to 12 ft above ground level outside the federal levee system on the east bank and as deep as 5 to 7 ft on the west bank. Major flooding also occurred in unprotected areas of St. Bernard, Orleans, and St. Tammany Parishes. In St. Bernard Parish, water depths outside the federal levee system were as much as 8 to 12 ft based on measurements from several USGS storm tide sensors in Wood Lake, Delacroix, and Alluvial City. Eastern portions of Orleans Parish near the Rigolets and Lake St. Catherine had water heights of 4 to 8 ft above ground level based on storm tide sensor data and several high-water marks. In St. Tammany Parish, on the northeastern shore of Lake Pontchartrain, maximum water depths were on the order of 4 to 7 ft, and the surge from the lake penetrated far enough inland to inundate parts of Slidell, Lacombe, Mandeville, and Madisonville. Widespread storm surge flooding on the western side of Lake Pontchartrain occurred in St. John the Baptist Parish. USGS high-water marks in the city of Laplace indicate that maximum water depths were 1 to 3 ft. The USGS reported that strong winds and storm surge from Isaac forced the Mississippi River to flow backwards for almost 24 h. At Belle Chasse, Louisiana, a USGS streamgauge showed that the river rose 10 ft and flowed upstream at 182,000 cubic ft per second. The normal flow for the river at that location is downstream at about 125,000 cubic ft per second. The storm surge traveled more than 300 miles upriver, as far as Red River Landing in northern Pointe Coupee Parish, and it caused the river to rise 8 ft in Baton Rouge.
7
Elsewhere, the following inundation levels, expressed above ground level, were prevalent along the coast due to the storm tide: Mississippi 5 – 9 ft Alabama 3 – 5 ft Florida (west and southeast coasts) 1 – 2 ft Puerto Rico and US Virgin Islands 1 ft
Significant storm surge flooding occurred along the coasts of Mississippi and Alabama (Fig. 9b). The highest water levels occurred in Hancock and Harrison Counties, Mississippi, where several USGS storm tide pressure sensors suggested inundation depths of 5 to 9 ft above ground level, and high-water marks indicated that the storm surge penetrated inland north of Interstate 10. Measured water depths were as much as 6 ft farther east in Jackson County. In Alabama, the maximum inundation occurred on Dauphin Island, where a USGS sensor measured a water level of 4.5 ft above ground level. Data from other sensors suggested that water depths were 1 to 3 ft along the shore of Mobile Bay. In Florida, the highest storm surges recorded by NOS tide gauges were along the Florida Panhandle and Apalachee Bay, with 3.47 ft above normal tide levels at Pensacola and 3.44 ft at Apalachicola, resulting in inundation estimates of about 3 ft above ground level. Storm surge measured by gauges along the west coast of Florida, the Florida Keys, and southeastern Florida was generally 1 to 3 ft above normal tide levels, resulting in maximum inundation of 1 to 2 ft above ground level.
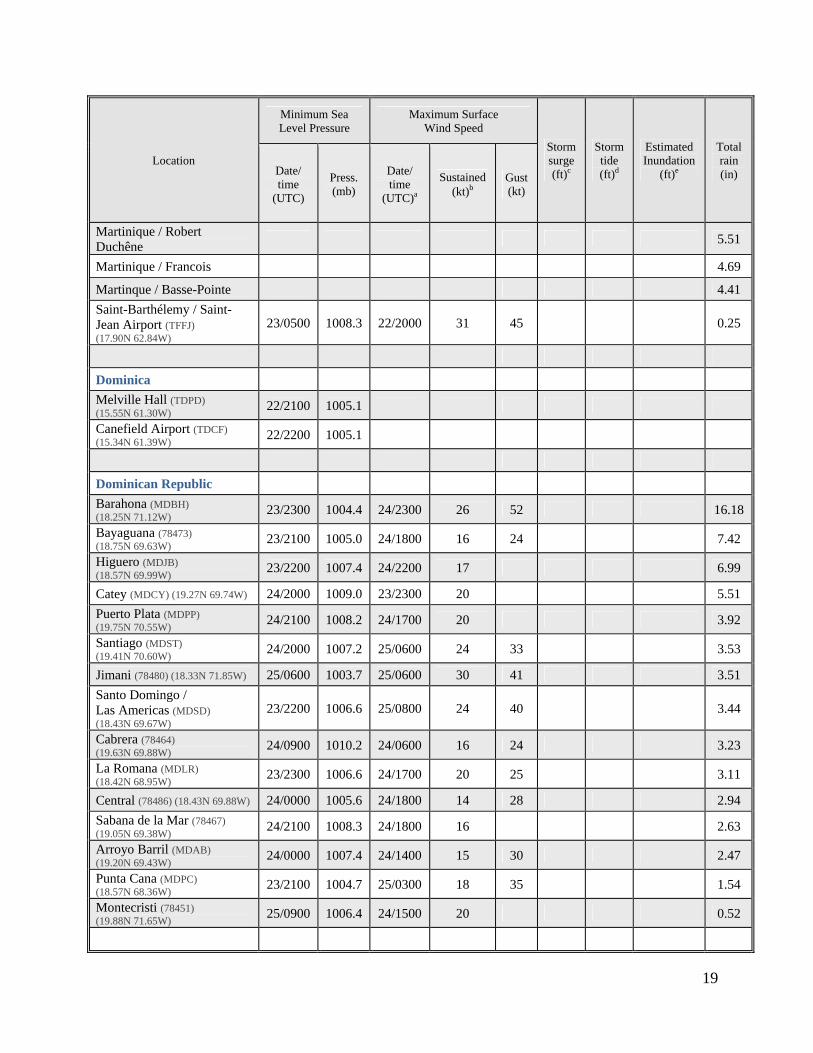
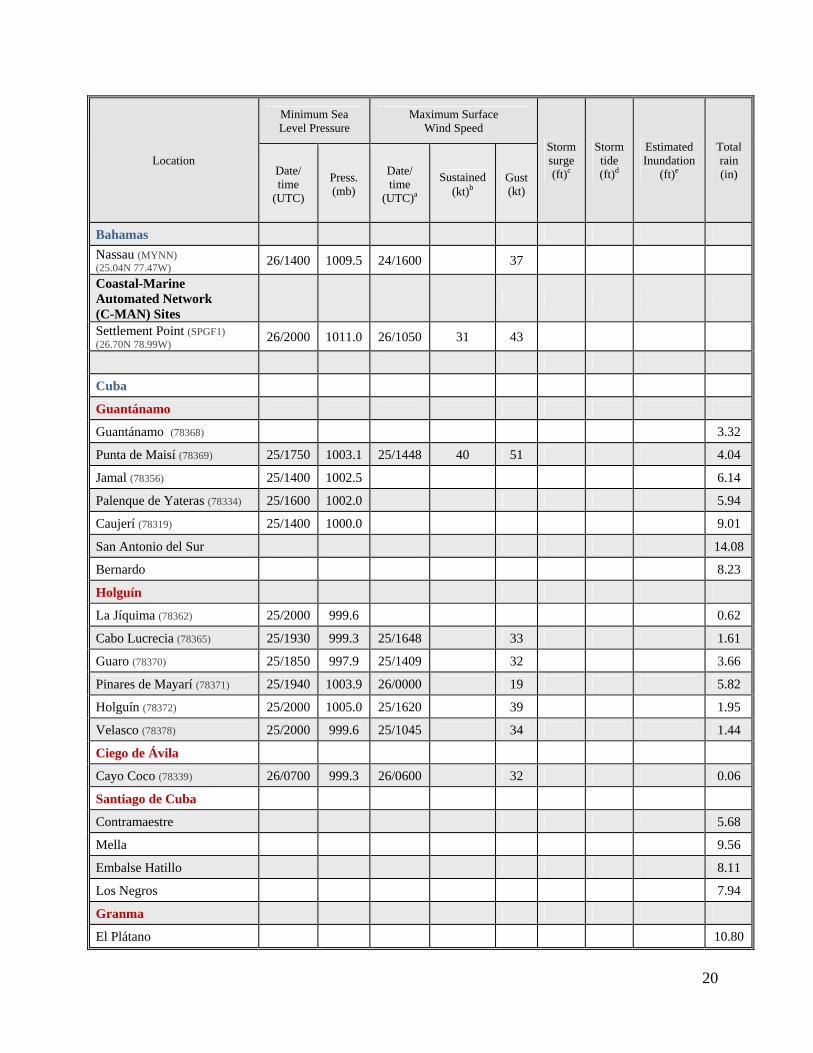
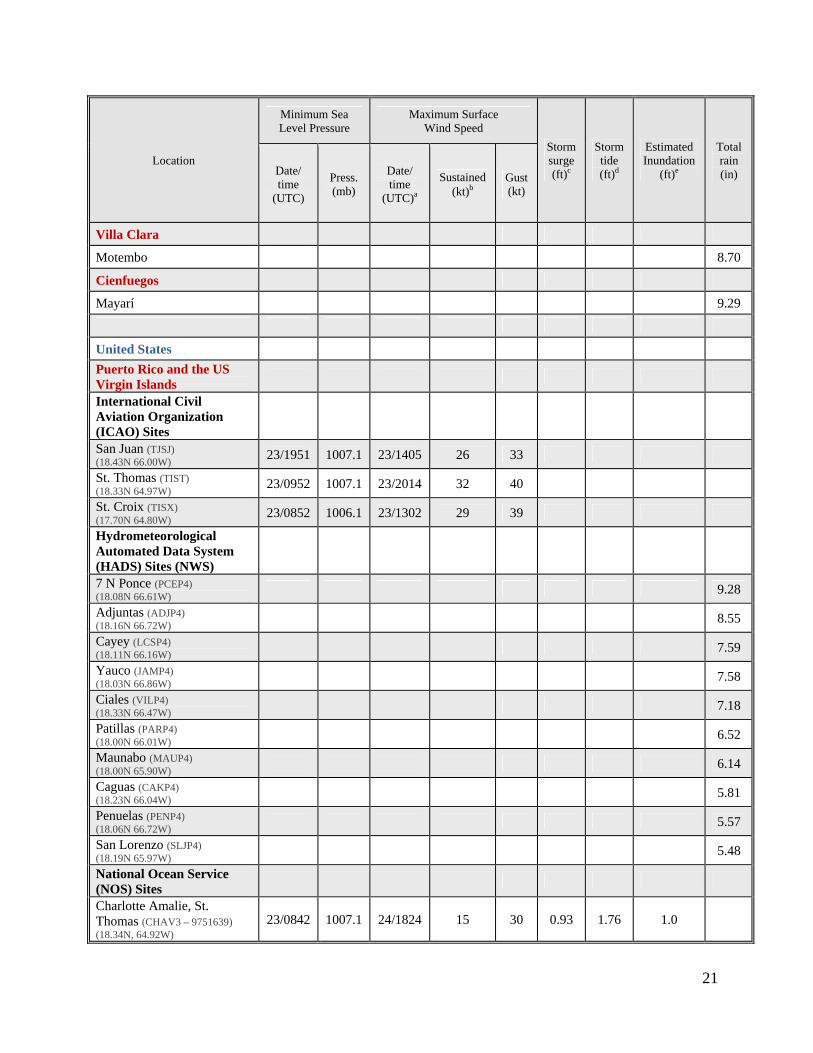
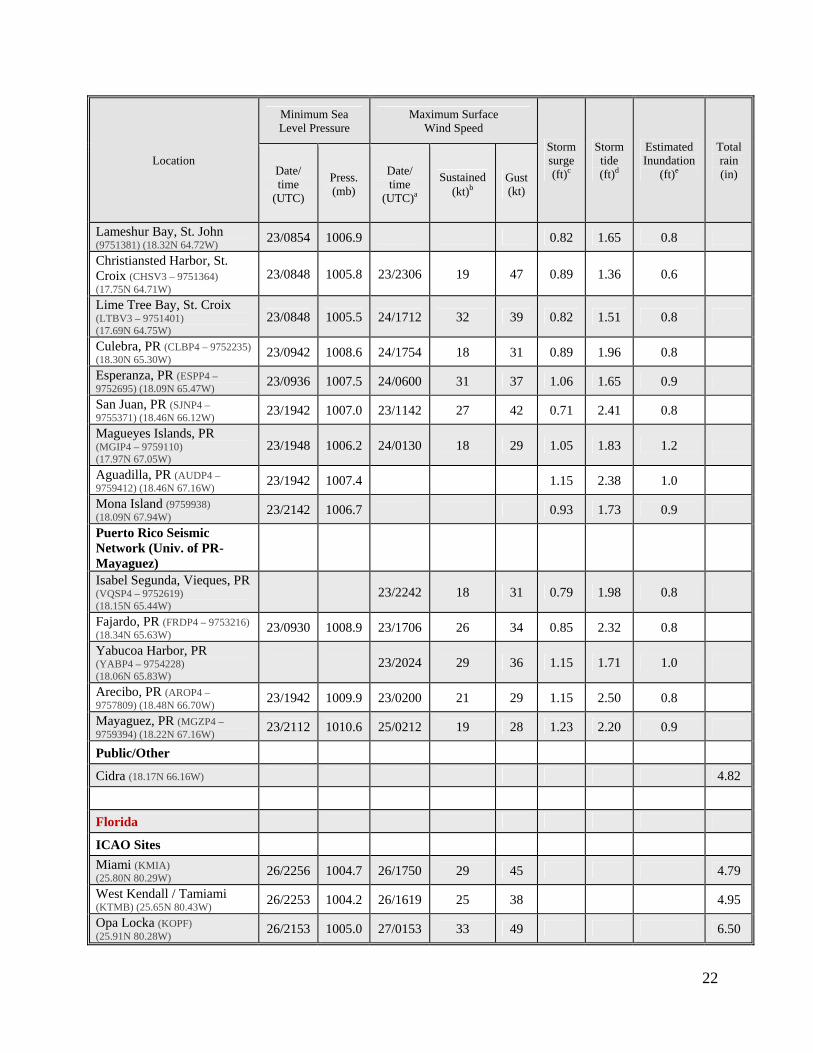
Water levels rose no more than 1 to 1.5 ft above normal tide levels in Puerto Rico, the U.S. Virgin Islands, and parts of the northern Leeward Islands, yielding maximum inundation depths of about 1 ft above ground level near the immediate coast. The highest recorded storm surge in these areas was 1.23 ft by a Puerto Rico Seismic Network sensor in Mayagüez. Rainfall and Flooding Isaac produced heavy rainfall across Puerto Rico and Hispaniola, causing flooded rivers and mud slides. Much of the rain occurred after the center of Isaac passed the islands, as deep tropical moisture from the south was forced up the south-facing slopes of the higher terrain. The maximum measured rainfall total in Puerto Rico was 9.28 inches several miles north of Ponce on the southern side of the island. The highest rainfall reported in the Dominican Republic was 16.18 inches in Barahona, on the southwestern coast of that country. No rainfall amounts are available from Haiti. Heavy rain also occurred in eastern Cuba, with maximum amounts of 14.08 inches reported in San Antonio del Sur, Guantánamo, and 10.80 inches reported in El Plátano, Granma. Severe flooding occurred over parts of South Florida and East-Central Florida due to heavy rains affecting the same areas for a prolonged period. The worst flooding occurred over Palm Beach County to the west of Florida’s Turnpike in the communities of Wellington, Royal Palm Beach, Loxahatchee, and the Acreage, where entire neighborhoods were isolated by several
8
feet of water due to heavy rain and over-topped canals. The highest measured totals were 15.86 inches at the Lion Country Safari in Loxahatchee, 13.74 inches in Boynton Beach, 13.10 inches in Greenacres, and 13.02 inches in Port St. Lucie. Radar estimates suggested rainfall totals in some areas could have been 18 to 20 in. A map of rainfall totals is shown in Fig. 10. The Army Corps of Engineers indicated that the water level in Lake Okeechobee rose by about 2 ft due to heavy rains over the lake and freshwater flowing into the lake in the subsequent days. Most of extreme southwestern Alabama, southern Mississippi and southeastern Louisiana received greater than 10 inches of rain, which produced both flash flooding and river flooding. The highest totals measured in each state were 13.99 inches in Grand Bay, Alabama, 22.20 inches in Pascagoula, Mississippi, and 20.66 inches in New Orleans, Louisiana. The heavy rains caused moderate to record flooding on several rivers in southern Mississippi and southeastern Louisiana. In particular, record flooding occurred on the Wolf River in southern Mississippi, where a river crest of 8.5 ft above flood stage was recorded near Gulfport and a crest of 4.4 ft above flood stage was recorded near Landon. A record crest of about 6.5 ft above flood stage was also recorded on the East Hobolochitto Creek near Caesar, Louisiana. While not records, major flooding occurred on the Tangipahoa River near Robert, Louisiana, at 9.0 ft above flood stage and on the Bogue Chitto River near Tylertown, Mississippi, at 14.8 ft above flood stage. Tornadoes Isaac is estimated to have produced 17 tornadoes in the United States while it was a tropical cyclone. Most of the tornadoes were rated as EF-0 or EF-1 on the Enhanced Fujita (EF) Scale while one was rated as an EF-2. Five tornadoes occurred in Florida, all of which were rated EF-0. Four tornadoes occurred in Alabama, the strongest of which touched down as an EF-1 near the city of Samson. Mississippi had 6 tornadoes, with an EF-2 downing large trees and tearing nearly the entire roof off of a large house in Pascagoula. Three people were injured by an EF-1 that hit near Crandall, Mississippi. Two tornadoes also occurred in Illinois, injuring one person near the town of Franklin. At least nine additional tornadoes occurred in Illinois, Missouri, and Arkansas on 1 September due to the remnants of Isaac. The strongest was an EF-2 that touched down in Corning, Arkansas, causing extensive damage to two hangars and several aircraft at the Corning Airport. c. Casualty and Damage Statistics Isaac is estimated to be directly responsible for 34 deaths in Haiti, the Dominican Republic, and the United States.4 It is difficult to differentiate most of the deaths in Haiti as
4 Deaths occurring as a direct result of the forces of the tropical cyclone are referred to as “direct” deaths. These would include those persons who drowned in storm surge, rough seas, rip currents, and freshwater floods. Direct deaths also include casualties resulting from lightning and wind-related events (e.g., collapsing structures). Deaths occurring from such factors as heart attacks, house fires, electrocutions from downed power lines, vehicle accidents on wet roads, etc., are considered “indirect” deaths.
9
direct or indirect since post-storm reports from several agencies listed various causes for the 24 deaths (such as mud slides and electrocution from downed power lines) without direct attribution. Haiti’s Civil Protection Office cited a few specific cases, including a 51-year-old woman who died in the southern coastal town of Marigot after a tree fell on her home and a 10-year-old girl in the village of Thomazeau who died when a wall collapsed on her. Five direct deaths were reported in the Dominican Republic, two of which occurred when men were swept away by flooded rivers in separate incidents.
Five direct deaths were reported in the United States. A 62-year-old woman in Lexington, Mississippi, and a 52-year-old man in Picayune, Mississippi, died when strong winds blew trees onto their cars. A 75-year-old man died in Slidell, Louisiana, when he drove his car off an Interstate 10 on-ramp and drowned in 9 ft of water in a roadside ditch. In addition, a couple in their mid-40s was found drowned in their house from storm surge that overtopped a levee in Braithwaite, Louisiana. The Property Claim Services of the Insurance Services Office estimates that the insured damage in the United States from Isaac is about $970 million. In addition, the National Flood Insurance Program has paid out about $407 million for losses due to storm surge and inland flooding. Adjusting for non-insured losses, the total U.S. damage estimate is about $2.35 billion.
Damage in the eastern Caribbean was minimal and largely related to flooding from heavy rains. A slow-moving band of showers and thunderstorms extending to the south of Isaac produced significant flooding and landslides in Trinidad and Tobago, damaging homes in several cities. Some flooding was reported in the eastern and southern regions of Puerto Rico, where about 4,000 people lost electricity and 3,000 were without water. Mud slides closed several roads, and a bridge was washed out in the southern part of the island. The United Nations Office for the Coordination of Humanitarian Affairs (OCHA) released a report on 4 September stating that in addition to the 24 deaths, 42 people were injured during the storm and 3 people were missing in Haiti. The Ouest and Sud-Est departments were most severely affected by the storm, with storm surge, freshwater flooding, and landslides affecting areas from Port-au-Prince to Jacmel and westward across the southwestern peninsula. The Haitian people were particularly vulnerable to the hazards associated with Isaac since many were still living in camps that were set up after the devastating January 2010 earthquake. The OCHA report stated that nearly 15,000 families were evacuated and 218 camps were affected by the storm. About 6,000 people in the camps lost shelters, and an additional 1,000 houses were reported destroyed. Concerns over the spread of cholera and food security due to the damage to crops increased after Isaac affected the country. The Haitian newspaper Le Nouvelliste reported that Isaac caused an estimated loss of 336 million Haitian gourdes (about 8 million USD) to the electricity network in the country. Damage in Cuba was less severe. The Miami Herald reported that almost 50,000 people evacuated to higher ground during the storm. The storm destroyed 4 and damaged 19 homes in Baracoa, and 72 homes were flooded by the Sagua de Tánamo River in Holguín province. Isaac also knocked down power lines and damaged about 1,100 acres of plantain, cocoa, and coconut plants in the region. In the Dominican Republic, almost 13,000 people evacuated their homes,
10
and an estimated 864 houses were damaged. River flooding and storm surge cut off 90 towns, including Pedernales in the southwestern part of the country. About 5 to 10 percent of the banana and coconut plantations was damaged, and agricultural losses are estimated to be about $30 million USD. Wind damage in southern Florida and the Florida Keys was minor and mostly limited to downed trees and power lines. Approximately 113,000 customers lost power in Miami-Dade, Broward, and Palm Beach Counties. Flood damage was moderate to severe in parts of Palm Beach and Broward Counties. The worst flooding of homes and roads occurred in Wellington and The Acreage, which was exacerbated by a breach in the M Canal. Elsewhere in Florida, the Republican National Convention in Tampa was postponed by a day due to the uncertainties of Isaac’s effects in the Tampa Bay region. Extensive storm surge damage occurred in southeastern Louisiana, mainly in areas that are located outside of the federal protection levees. In fact, the Hurricane and Storm Damage Risk Reduction System (HSDRRS), funded after the devastation caused by Hurricanes Katrina and Rita in 2005 and built by the U. S. Army Corps of Engineers during the past six years, was tested for the first time by a significant storm, and it successfully protected much of the Greater New Orleans area from storm surge. However, significant storm surge damage occurred in areas not protected by the federal levee system. The State of Louisiana estimates that 59,000 homes were damaged by Isaac. Most of the damaged homes were located in Jefferson Parish, but the most severe damage occurred in St. John the Baptist and Plaquemines Parishes. In Plaquemines Parish, a non-federal parish levee on the east bank was overtopped by storm surge coming from the southeast, and the seawater filled an 18-mile stretch within the levee system from Braithwaite southward to White Ditch. In Braithwaite, the force of the water picked up homes, cars, and other debris, which were reportedly deposited across Highway 93 onto the Mississippi River levee. Over 100 people were rescued from flooded homes and rooftops in the town. Officials later intentionally breached the non-federal levee to allow the water to drain out of the area. In St. John the Baptist Parish, water from Lake Pontchartrain flowed into the city of Laplace, where almost 4,000 people were rescued and Interstate 10 was closed due to high water covering the road. Another 1,000 people were rescued in Lafourche Parish when storm surge overtopped the Bayou Boeuf levee. The Louisiana Public Service Commission estimated that 901,000 homes and business lost power in the state, about 47% of all state customers. Isaac caused significant damage to crops in southern Louisiana, especially citrus groves and sugarcane fields. About 380,000 acres of sugarcane were damaged, or approximately 90% of the total crop that was planted. An estimated 400 head of cattle drowned in the storm surge in Plaquemines Parish alone. The state’s Coastal Protection and Restoration Authority estimated that 565,000 lbs of oiled material from the Deepwater Horizon disaster were brought to the water surface and deposited on the coast. Heavy rainfall in the area led to concerns of a potential dam failure in Percy Quin State Park near McComb, Mississippi, and consequently about 60,000 people were ordered to evacuate low-lying areas along the Tangipahoa River farther south in Tangipahoa Parish, Louisiana.
11
Damage in Mississippi and Alabama was less severe than in Louisiana. In Mississippi, the governor estimated that at least 6,000 homes were damaged in southern Mississippi from storm surge and freshwater flooding. Flooding also closed 70 roads in the area. Emergency management officials in Hancock County, Mississippi, estimate that at least 15,000 nutria from the marshes of southeastern Louisiana were killed by storm surge and washed up on Mississippi beaches. In Alabama, storm surge deposited as much as 4 ft of sand on parts of western Dauphin Island, and the barrier island was breached on both sides of the rock wall that was constructed in 2010 to close a cut produced by Hurricane Katrina. Otherwise, relatively minor wind and flooding damage was reported in southern Alabama. d. Forecast and Warning Critique
The genesis of Isaac was extremely well forecast. The tropical wave from which Isaac formed was first included in the Tropical Weather Outlook (TWO) and given a low (less than 30%) chance of genesis over the next 48 h at 0600 UTC 17 August, which was 4 days before the system became a tropical depression. The formation potential was raised to a medium (30 to 50%) chance at 0600 UTC 18 August, or 3 days before genesis. A high (greater than 50%) chance of formation was noted 54 h (2.25 days) before genesis on the 0000 UTC 19 August TWO.
A verification of NHC official track forecasts for Isaac is given in Table 4a. Isaac’s track
was well forecast, and official forecast track errors were lower than the mean official errors for the previous five-year period from 24 to 96 h. The Climatology and Persistence (CLIPER, or OCD5) model errors were also lower than the mean CLIPER errors for the previous five-year period at all forecast times. However, the official track forecasts were, on average, between 30% and 70% more skillful than CLIPER at all forecast periods. A homogeneous comparison of the official track errors with selected guidance models is given in Table 4b. Compared to the individual track models, the official NHC forecasts had lower errors than all the guidance at 36 and 48 h, but they had higher errors than the European Centre for Medium-Range Weather Forecasts (EMXI) at 12, 24, and 120 h and the Global Forecast System (GFSI) at 12, 72, and 96 h. The variable track consensus for the Atlantic (TVCA) and the Florida State Superensemble (FSSE) were the only guidance to have lower errors than the official track forecasts at all forecast lead times. In fact, the FSSE eclipsed all other guidance and the official forecasts at 120 h, having an average error about 22% lower than the next best model, EMXI. For comparison, Fig. 11 shows track forecasts from the GFSI, EMXI, TVCA, and FSSE. The NHC track forecasts and most of the track guidance forecasts from 72 to 120 h had an eastward bias for the portion of the forecast over the Gulf of Mexico. The 3- to 5-day NHC forecasts suggested that landfall would occur farther east along the Florida Panhandle or the coast of Alabama, and they homed in on a landfall in southeastern Louisiana about 2 days before Isaac’s center reached the coast.
A verification of NHC official intensity forecasts for Isaac is given in Table 5a. Isaac’s
intensity was generally well forecast. Official forecast intensity errors were lower than the mean official errors for the previous five-year period at all forecast times. However, the NHC intensity forecasts were less accurate than the Climatology and Persistence Decay-SHIFOR (OCD5)
12
model at 36, 48, and 120 h. A homogeneous comparison of the official intensity errors with selected guidance models is given in Table 5b. The 12- and 24-h official intensity forecasts were extremely good, beating all available intensity guidance at those times. At longer lead times, the intensity consensus model ICON had lower errors than the official forecasts at all times between 36 and 120 h, and the Geophysical Fluid Dynamics Laboratory hurricane model (GHMI) had lower errors between 36 and 96 h. The NHC intensity forecasts had a noticeable high bias, consistently showing Isaac being a hurricane over the Caribbean Sea, the Straits of Florida, and the eastern Gulf of Mexico (Fig. 12).
Watches and warnings associated with Isaac are given in Table 6. A tropical storm watch was issued for Puerto Rico and the United States Virgin Islands at 0900 UTC 21 August and was upgraded to a tropical storm warning and a hurricane watch at 0300 UTC 22 August. Since Isaac’s center reformed farther south while over the eastern Caribbean Sea, the tropical-storm-force wind field remained to the south of the those islands with no land stations reporting sustained tropical-storm-force winds. A tropical storm watch was issued for much of southern Florida and the Florida Keys during the afternoon of 24 August, which was about 36 h before tropical-storm-force winds are estimated to have first arrived along the southeast Florida coast. The watch was upgraded to a tropical storm warning at 0300 UTC 25 August, about 30 h before the arrival of tropical-storm-force winds. Thus, the lead times for the tropical storm watches and warnings in southern Florida and the Florida Keys were about 6 to 12 h shorter than the lead times prescribed in the watch/warning definitions. A hurricane watch and hurricane warning were issued at 0300 UTC and 0900 UTC, respectively, on 25 August for a portion of southern Florida and the Florida Keys, but the warning did not verify since Isaac did not attain hurricane strength while moving through the Straits of Florida.
A hurricane watch was issued for the northern Gulf of Mexico coast from the Mouth of the Mississippi River, Louisiana, to Indian Pass, Florida, during the early morning hours of 26 August. The watch was then extended westward to Morgan City, Louisiana, including metropolitan New Orleans and Lake Pontchartrain, later that morning. Tropical-storm-force winds are estimated to have reached the coast within the watch area between 0300 UTC and 0900 UTC 28 August, meaning that the hurricane watch had a near-perfect lead time of 48 h. A hurricane warning was issued from Morgan City, Louisiana, to Destin, Florida, including New Orleans, Lake Pontchartrain, and Lake Maurepas, about 36 h prior to the arrival of tropical-storm-force winds. Hurricane-force winds associated with Isaac moved inland along the coast of southeastern Louisiana within the hurricane warning area.
The initial NHC storm surge forecast for the northern Gulf Coast issued at 2100 UTC 26 August indicated that as much as 6 to 12 ft of water above ground level was possible along the coasts of southeastern Louisiana, Mississippi, and Alabama. In general, the forecast verified exceptionally well for Mississippi, where maximum inundation heights were about 9 ft, and for southeastern Louisiana outside of the levee system, where maximum inundation heights were about 12 ft. Due to overtopping of a non-federal levee, some isolated unpopulated areas within the levee system in northern Plaquemines Parish had inundation heights of 12 to 17 ft. Since the occurrence of inundation within the levee system is dependent on non-meteorological factors
13
such as breaching and overtopping of levees and other barriers, and the amount of time that water pours into the “protected” areas if overtopping occurs, storm surge forecasts for those areas are incredibly difficult, and in some cases nearly impossible. Elsewhere, the initial storm surge forecast was too high for the coast of Alabama, where the maximum inundation was 4 to 5 ft, since track forecasts were initially too far to the east. However, the storm surge forecasts were gradually lowered to 6 to 9 ft at 2100 UTC 27 August and then 4 to 8 ft at 2100 UTC 28 August when it became more apparent that Alabama would be less affected than areas farther west. Acknowledgments National Weather Service Forecast Offices (WFOs) in San Juan, PR; Miami, FL; Key West, FL; Melbourne, FL; Tampa Bay, FL; Tallahassee, FL; Mobile, AL; Jackson, MS, New Orleans/Slidell, LA; Lake Charles, LA; and Little Rock, AR, as well as the National Data Buoy Center and the National Ocean Service Center for Operational Oceanographic Products and Services provided extensive post-storm reports that were included as observations in Table 3. Storm tide and high-water mark observations were obtained from the United States Geological Survey. Météo-France, ONAMET, and the Cuban Institute of Meteorology provided observations from the French Antilles, the Dominican Republic, and Cuba, respectively. David Roth at the Hydrometeorological Prediction Center provided the rainfall graphic in Figure 10. The Hurricane Specialist Unit and the Storm Surge Unit at the National Hurricane Center provided extensive insight and guidance in the writing of this report.
14
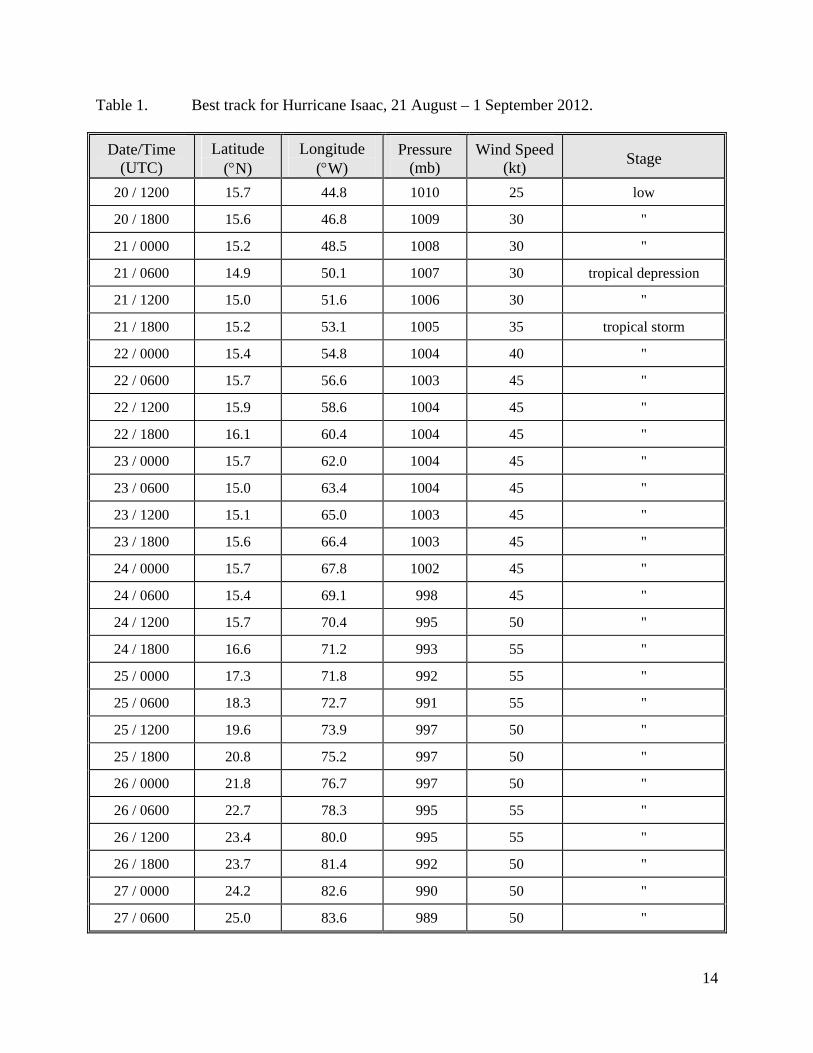
Table 1. Best track for Hurricane Isaac, 21 August – 1 September 2012.
Date/Time (UTC)
Latitude (N)
Longitude (W)
Pressure (mb)
Wind Speed (kt)
Stage
20 / 1200 15.7 44.8 1010 25 low
20 / 1800 15.6 46.8 1009 30 "
21 / 0000 15.2 48.5 1008 30 "
21 / 0600 14.9 50.1 1007 30 tropical depression
21 / 1200 15.0 51.6 1006 30 "
21 / 1800 15.2 53.1 1005 35 tropical storm
22 / 0000 15.4 54.8 1004 40 "
22 / 0600 15.7 56.6 1003 45 "
22 / 1200 15.9 58.6 1004 45 "
22 / 1800 16.1 60.4 1004 45 "
23 / 0000 15.7 62.0 1004 45 "
23 / 0600 15.0 63.4 1004 45 "
23 / 1200 15.1 65.0 1003 45 "
23 / 1800 15.6 66.4 1003 45 "
24 / 0000 15.7 67.8 1002 45 "
24 / 0600 15.4 69.1 998 45 "
24 / 1200 15.7 70.4 995 50 "
24 / 1800 16.6 71.2 993 55 "
25 / 0000 17.3 71.8 992 55 "
25 / 0600 18.3 72.7 991 55 "
25 / 1200 19.6 73.9 997 50 "
25 / 1800 20.8 75.2 997 50 "
26 / 0000 21.8 76.7 997 50 "
26 / 0600 22.7 78.3 995 55 "
26 / 1200 23.4 80.0 995 55 "
26 / 1800 23.7 81.4 992 50 "
27 / 0000 24.2 82.6 990 50 "
27 / 0600 25.0 83.6 989 50 "
15
Date/Time (UTC)
Latitude (N)
Longitude (W)
Pressure (mb)
Wind Speed (kt)
Stage
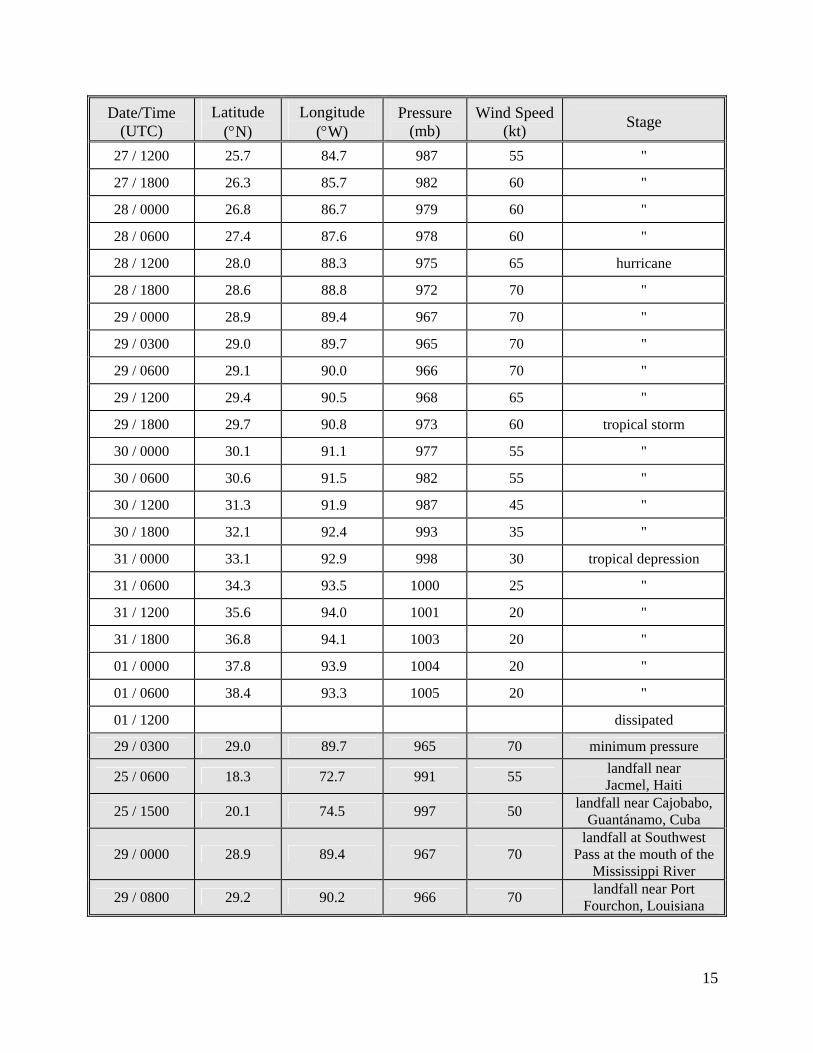
27 / 1200 25.7 84.7 987 55 "
27 / 1800 26.3 85.7 982 60 "
28 / 0000 26.8 86.7 979 60 "
28 / 0600 27.4 87.6 978 60 "
28 / 1200 28.0 88.3 975 65 hurricane
28 / 1800 28.6 88.8 972 70 "
29 / 0000 28.9 89.4 967 70 "
29 / 0300 29.0 89.7 965 70 "
29 / 0600 29.1 90.0 966 70 "
29 / 1200 29.4 90.5 968 65 "
29 / 1800 29.7 90.8 973 60 tropical storm
30 / 0000 30.1 91.1 977 55 "
30 / 0600 30.6 91.5 982 55 "
30 / 1200 31.3 91.9 987 45 "
30 / 1800 32.1 92.4 993 35 "
31 / 0000 33.1 92.9 998 30 tropical depression
31 / 0600 34.3 93.5 1000 25 "
31 / 1200 35.6 94.0 1001 20 "
31 / 1800 36.8 94.1 1003 20 "
01 / 0000 37.8 93.9 1004 20 "
01 / 0600 38.4 93.3 1005 20 "
01 / 1200 dissipated
29 / 0300 29.0 89.7 965 70 minimum pressure
25 / 0600 18.3 72.7 991 55 landfall near Jacmel, Haiti
25 / 1500 20.1 74.5 997 50 landfall near Cajobabo,
Guantánamo, Cuba
29 / 0000 28.9 89.4 967 70 landfall at Southwest
Pass at the mouth of the Mississippi River
29 / 0800 29.2 90.2 966 70 landfall near Port
Fourchon, Louisiana
16
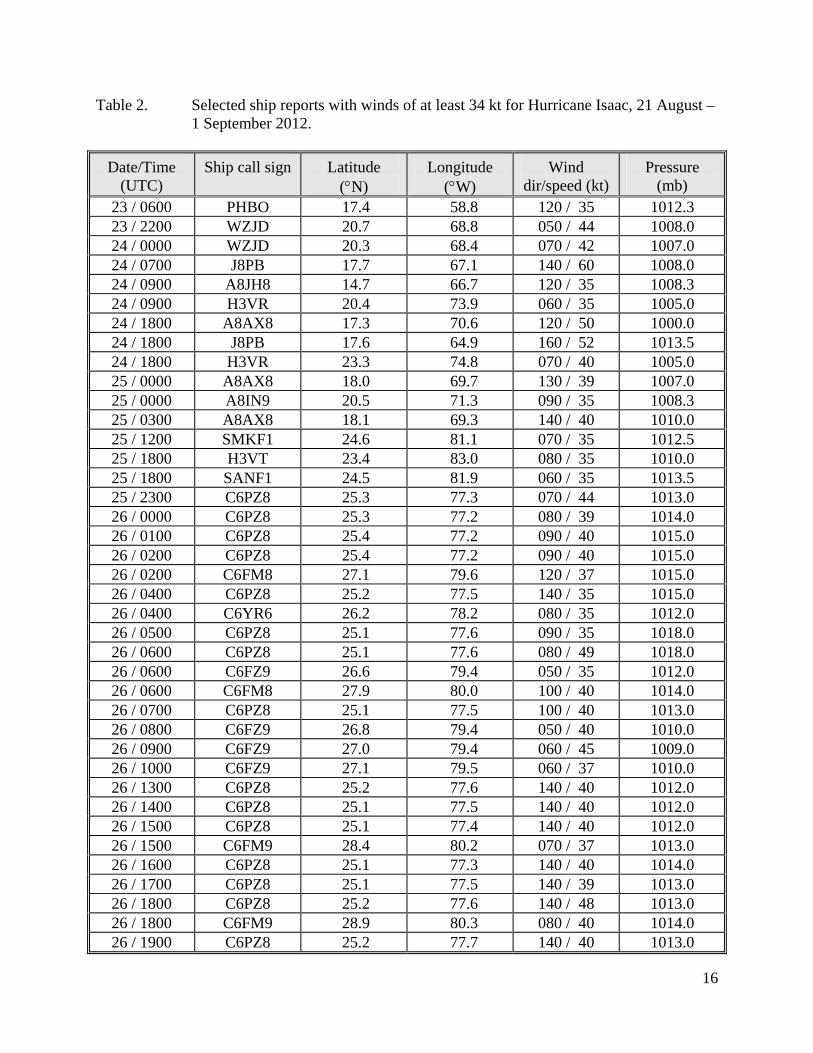
Table 2. Selected ship reports with winds of at least 34 kt for Hurricane Isaac, 21 August – 1 September 2012.
Date/Time (UTC)
Ship call sign
Latitude (N)
Longitude (W)
Wind dir/speed (kt)
Pressure (mb)
23 / 0600 PHBO 17.4 58.8 120 / 35 1012.3 23 / 2200 WZJD 20.7 68.8 050 / 44 1008.0 24 / 0000 WZJD 20.3 68.4 070 / 42 1007.0 24 / 0700 J8PB 17.7 67.1 140 / 60 1008.0 24 / 0900 A8JH8 14.7 66.7 120 / 35 1008.3 24 / 0900 H3VR 20.4 73.9 060 / 35 1005.0 24 / 1800 A8AX8 17.3 70.6 120 / 50 1000.0 24 / 1800 J8PB 17.6 64.9 160 / 52 1013.5 24 / 1800 H3VR 23.3 74.8 070 / 40 1005.0 25 / 0000 A8AX8 18.0 69.7 130 / 39 1007.0 25 / 0000 A8IN9 20.5 71.3 090 / 35 1008.3 25 / 0300 A8AX8 18.1 69.3 140 / 40 1010.0 25 / 1200 SMKF1 24.6 81.1 070 / 35 1012.5 25 / 1800 H3VT 23.4 83.0 080 / 35 1010.0 25 / 1800 SANF1 24.5 81.9 060 / 35 1013.5 25 / 2300 C6PZ8 25.3 77.3 070 / 44 1013.0 26 / 0000 C6PZ8 25.3 77.2 080 / 39 1014.0 26 / 0100 C6PZ8 25.4 77.2 090 / 40 1015.0 26 / 0200 C6PZ8 25.4 77.2 090 / 40 1015.0 26 / 0200 C6FM8 27.1 79.6 120 / 37 1015.0 26 / 0400 C6PZ8 25.2 77.5 140 / 35 1015.0 26 / 0400 C6YR6 26.2 78.2 080 / 35 1012.0 26 / 0500 C6PZ8 25.1 77.6 090 / 35 1018.0 26 / 0600 C6PZ8 25.1 77.6 080 / 49 1018.0 26 / 0600 C6FZ9 26.6 79.4 050 / 35 1012.0 26 / 0600 C6FM8 27.9 80.0 100 / 40 1014.0 26 / 0700 C6PZ8 25.1 77.5 100 / 40 1013.0 26 / 0800 C6FZ9 26.8 79.4 050 / 40 1010.0 26 / 0900 C6FZ9 27.0 79.4 060 / 45 1009.0 26 / 1000 C6FZ9 27.1 79.5 060 / 37 1010.0 26 / 1300 C6PZ8 25.2 77.6 140 / 40 1012.0 26 / 1400 C6PZ8 25.1 77.5 140 / 40 1012.0 26 / 1500 C6PZ8 25.1 77.4 140 / 40 1012.0 26 / 1500 C6FM9 28.4 80.2 070 / 37 1013.0 26 / 1600 C6PZ8 25.1 77.3 140 / 40 1014.0 26 / 1700 C6PZ8 25.1 77.5 140 / 39 1013.0 26 / 1800 C6PZ8 25.2 77.6 140 / 48 1013.0 26 / 1800 C6FM9 28.9 80.3 080 / 40 1014.0 26 / 1900 C6PZ8 25.2 77.7 140 / 40 1013.0
17
Date/Time (UTC)
Ship call sign
Latitude (N)
Longitude (W)
Wind dir/speed (kt)
Pressure (mb)
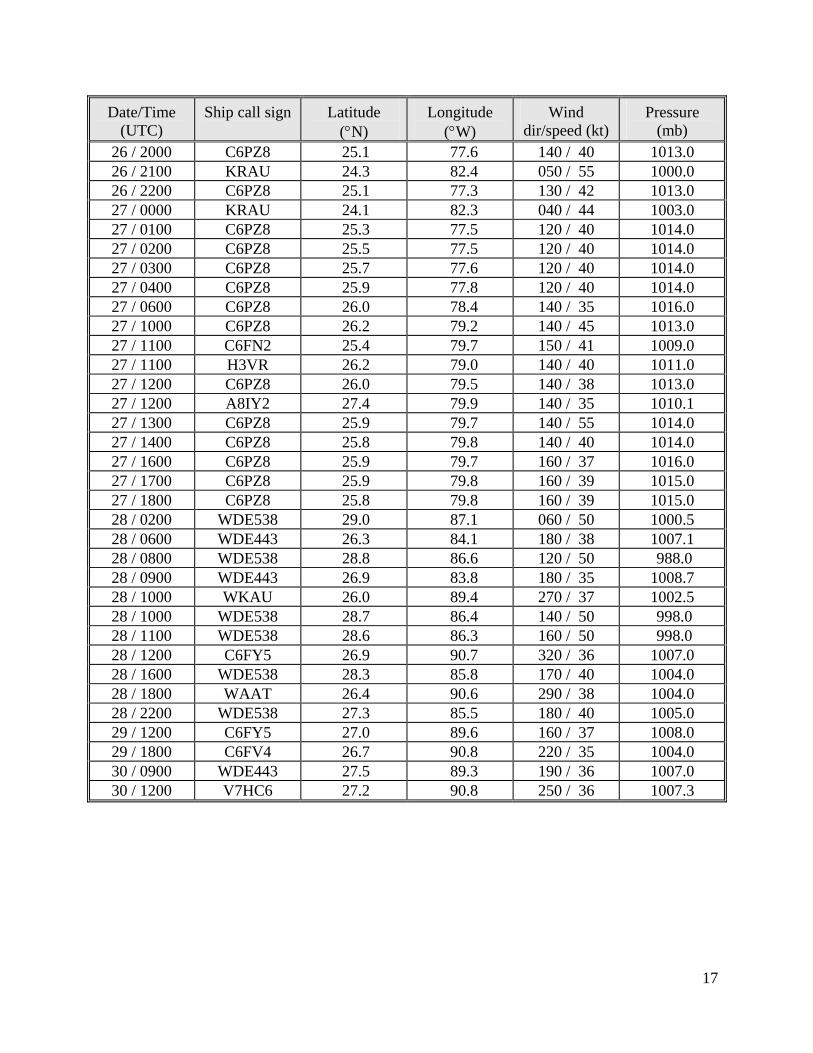
26 / 2000 C6PZ8 25.1 77.6 140 / 40 1013.0 26 / 2100 KRAU 24.3 82.4 050 / 55 1000.0 26 / 2200 C6PZ8 25.1 77.3 130 / 42 1013.0 27 / 0000 KRAU 24.1 82.3 040 / 44 1003.0 27 / 0100 C6PZ8 25.3 77.5 120 / 40 1014.0 27 / 0200 C6PZ8 25.5 77.5 120 / 40 1014.0 27 / 0300 C6PZ8 25.7 77.6 120 / 40 1014.0 27 / 0400 C6PZ8 25.9 77.8 120 / 40 1014.0 27 / 0600 C6PZ8 26.0 78.4 140 / 35 1016.0 27 / 1000 C6PZ8 26.2 79.2 140 / 45 1013.0 27 / 1100 C6FN2 25.4 79.7 150 / 41 1009.0 27 / 1100 H3VR 26.2 79.0 140 / 40 1011.0 27 / 1200 C6PZ8 26.0 79.5 140 / 38 1013.0 27 / 1200 A8IY2 27.4 79.9 140 / 35 1010.1 27 / 1300 C6PZ8 25.9 79.7 140 / 55 1014.0 27 / 1400 C6PZ8 25.8 79.8 140 / 40 1014.0 27 / 1600 C6PZ8 25.9 79.7 160 / 37 1016.0 27 / 1700 C6PZ8 25.9 79.8 160 / 39 1015.0 27 / 1800 C6PZ8 25.8 79.8 160 / 39 1015.0 28 / 0200 WDE538 29.0 87.1 060 / 50 1000.5 28 / 0600 WDE443 26.3 84.1 180 / 38 1007.1 28 / 0800 WDE538 28.8 86.6 120 / 50 988.0 28 / 0900 WDE443 26.9 83.8 180 / 35 1008.7 28 / 1000 WKAU 26.0 89.4 270 / 37 1002.5 28 / 1000 WDE538 28.7 86.4 140 / 50 998.0 28 / 1100 WDE538 28.6 86.3 160 / 50 998.0 28 / 1200 C6FY5 26.9 90.7 320 / 36 1007.0 28 / 1600 WDE538 28.3 85.8 170 / 40 1004.0 28 / 1800 WAAT 26.4 90.6 290 / 38 1004.0 28 / 2200 WDE538 27.3 85.5 180 / 40 1005.0 29 / 1200 C6FY5 27.0 89.6 160 / 37 1008.0 29 / 1800 C6FV4 26.7 90.8 220 / 35 1004.0 30 / 0900 WDE443 27.5 89.3 190 / 36 1007.0 30 / 1200 V7HC6 27.2 90.8 250 / 36 1007.3

18
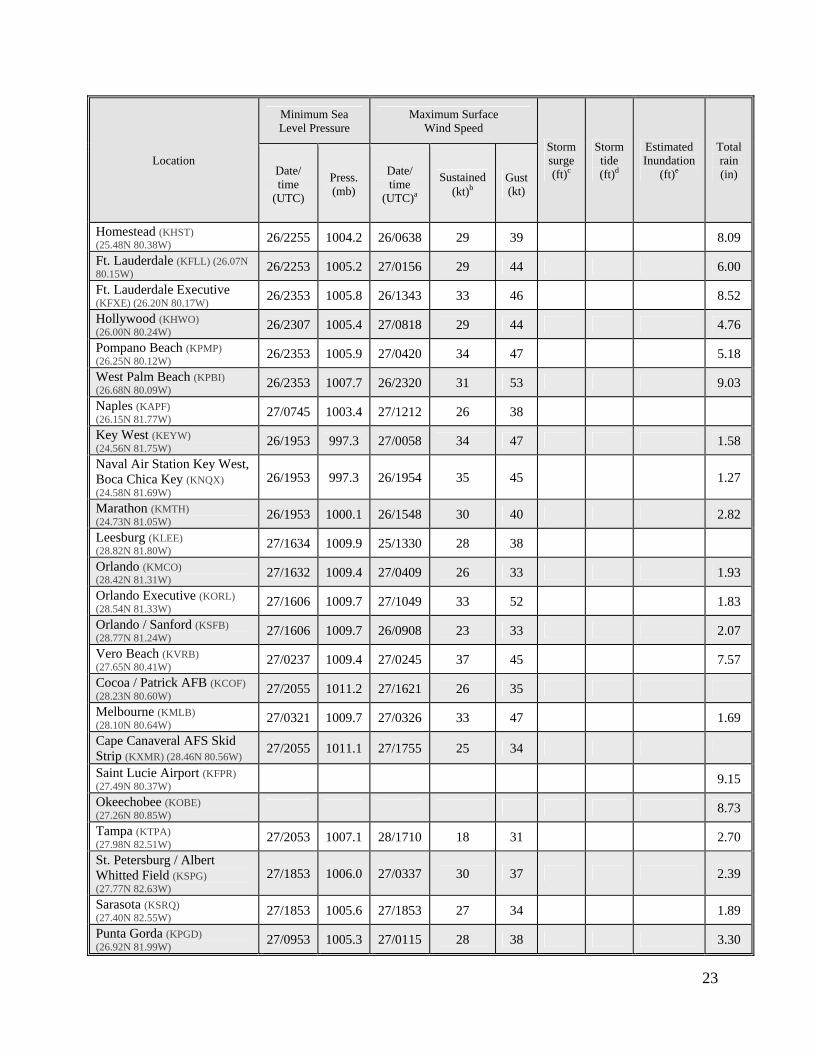
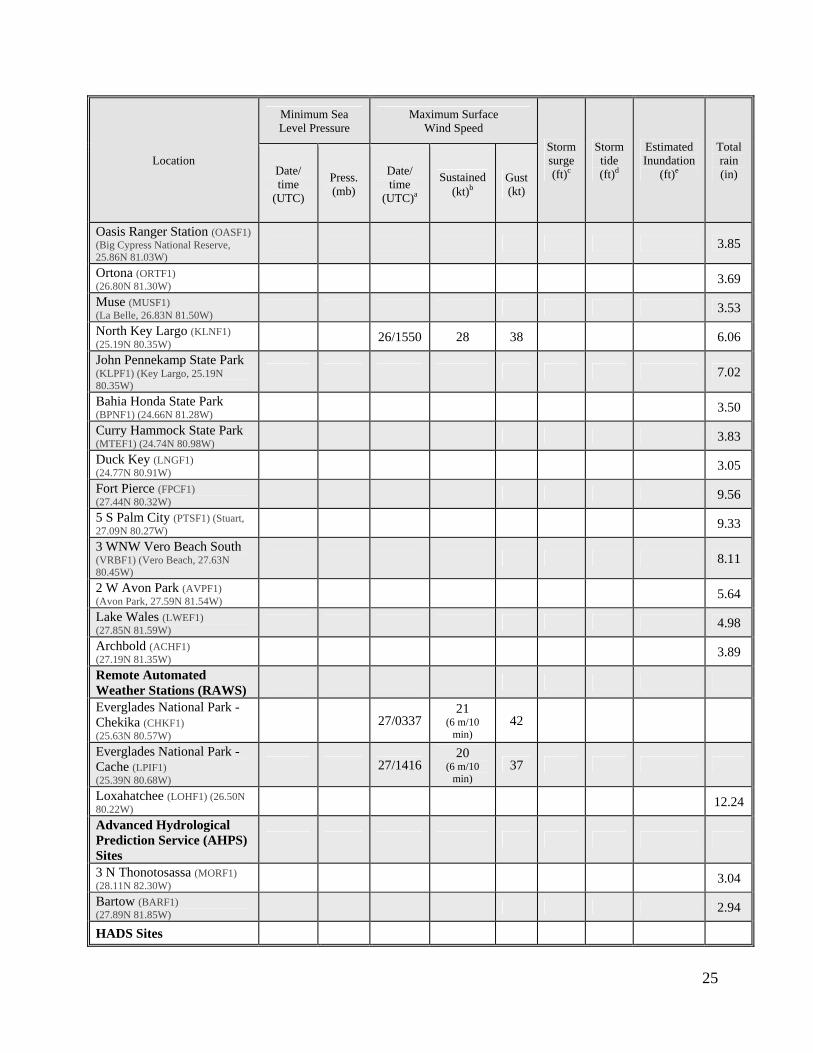
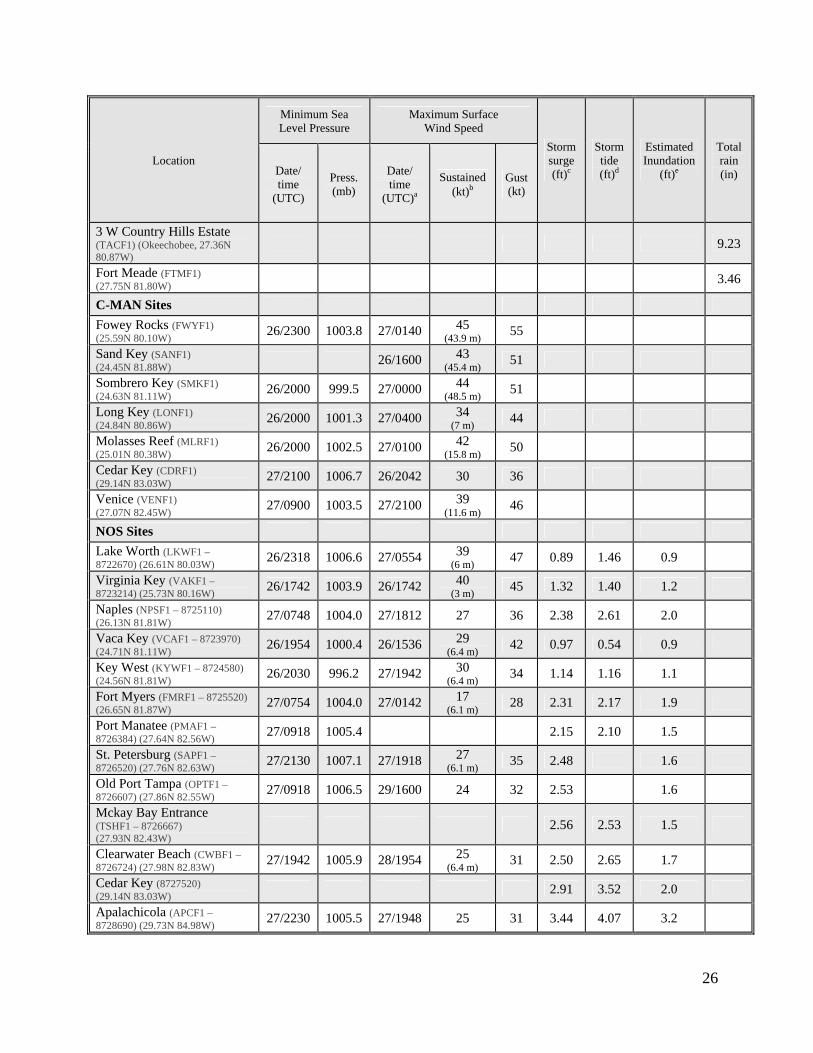
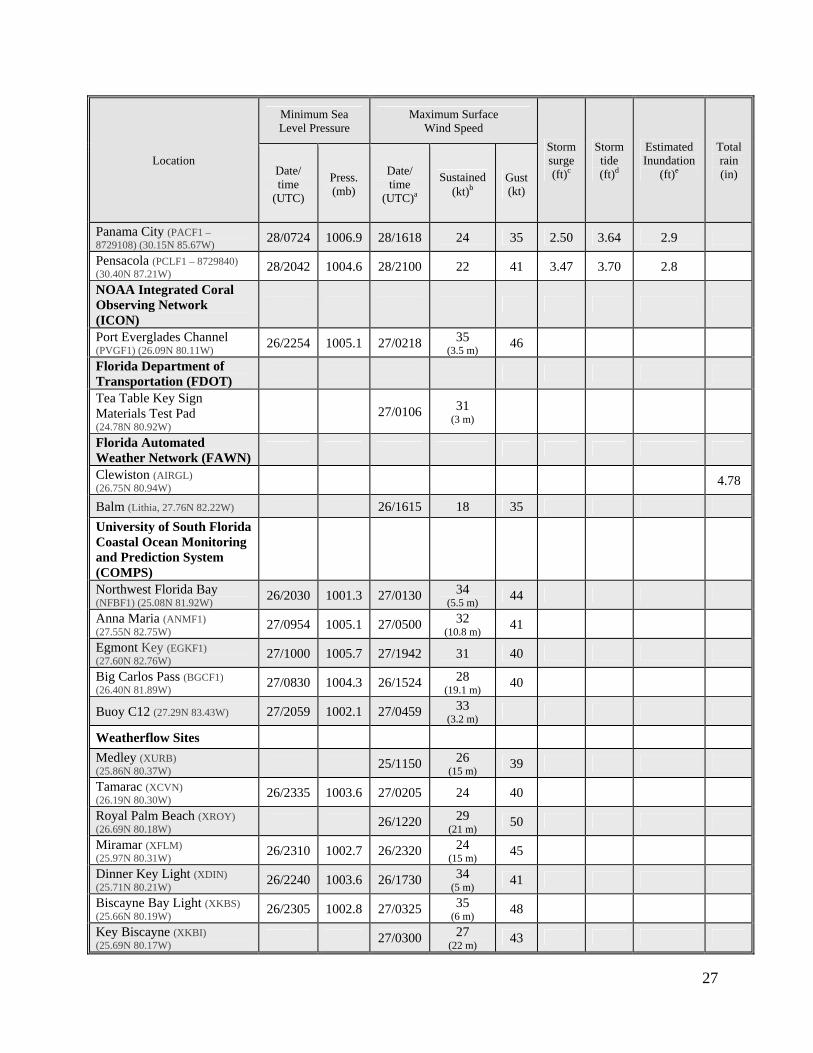
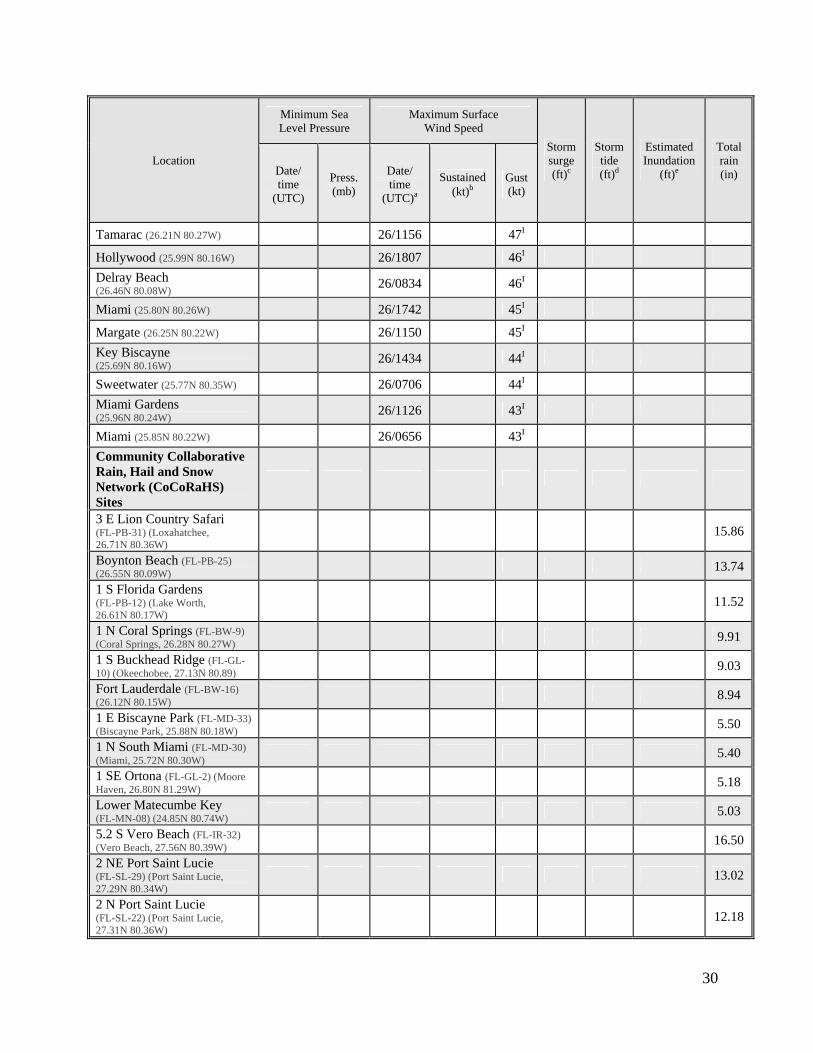
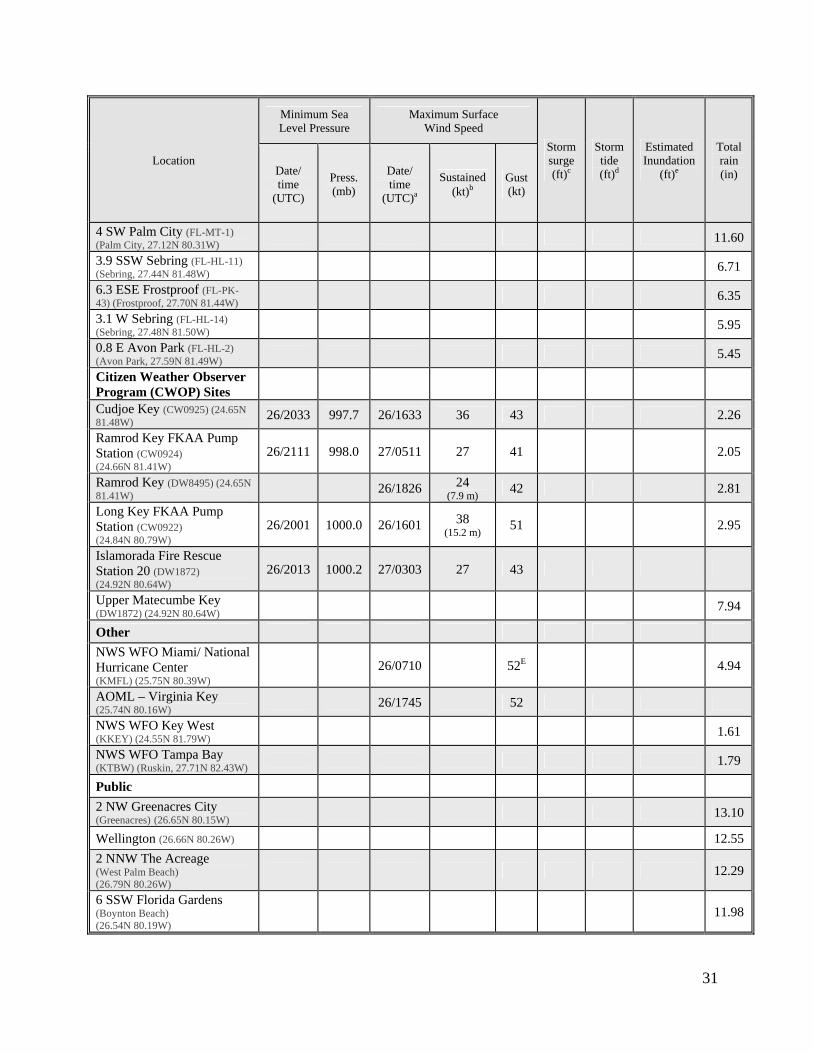
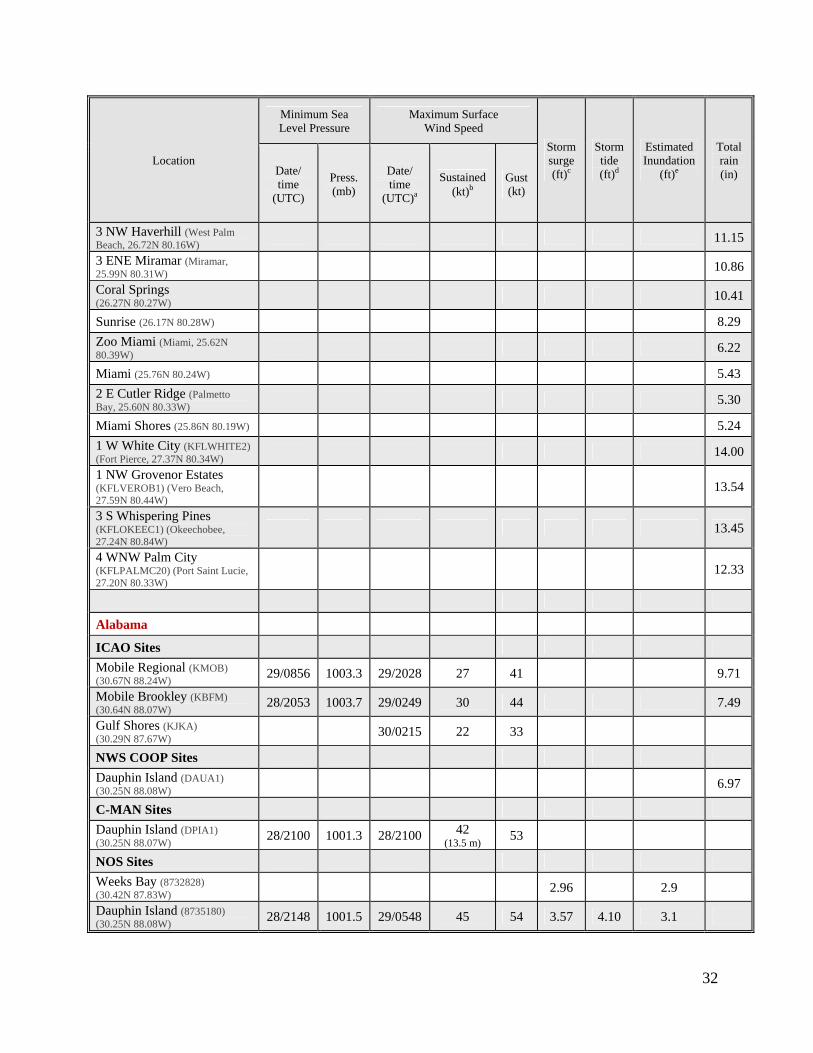
Table 3. Selected surface observations for Hurricane Isaac, 21 August – 1 September 2012.
Location
Minimum Sea Level Pressure
Maximum Surface Wind Speed
Storm surge (ft)c
Storm tide (ft)d
Estimated Inundation
(ft)e
Total rain (in) Date/
time (UTC)
Press. (mb)
Date/ time
(UTC)a
Sustained (kt)b
Gust (kt)
Antigua and Barbuda
Antigua / V.C. Bird (TAPA) (17.14N 61.79W)
22/2000 1007.1
U.S. National Ocean Service (NOS) Sites
Barbuda (9761115) (17.59N 61.82W)
22/2342 1007.7 23/1212 34 45 1.18 1.73 1.0
Dutch Caribbean Islands
Sint Eustatius (TNCE) (17.50N 62.98W)
22/2100 1008.1 23/2000 34
Sint Maarten (TNCM) (18.04N 63.11W)
23/0600 1007.1 22/2200 36
St. Kitts and Nevis
St. Kitts / Golden Rock (TKPK) (17.31N 62.72W)
23/0000 1007.1
Nevis / Charlestown (TKPN) (17.21N 62.59W)
22/2000 1008.1
British Caribbean Islands
Anguilla / Wall Blake (TQPF) (18.20N 63.06W)
22/2100 1009.1 23/1200 36
British Virgin Islands / Beef Island (TUPJ) (18.44N 64.54W)
23/1115 1009.1 23/2000 35
Turks and Caicos Islands / Providenciales (MBPV) (21.77N 72.27W)
25/1000 1008.1 24/2227 35
French Caribbean Islands
Guadeloupe / Le Raizet (TFFR) (16.27N 61.53W)
22/1800 1005.2 22/1900 24 35 1.24
Guadeloupe / Grand-Bourg Les Basses
22/1800 1004.9 23/0800 27 35 1.39
Guadeloupe / La Désirade Grande-Anse
22/1600 1004.1 23/0700 41 48 1.24
Martinique / Le Lamentin (TFFF) (14.59N 61.00W)
22/2200 1006.6 22/1604 28 33 3.10
Martinique / Trinité 22/0349 34 35 2.88
Martinique / Vauclin 22/0352 28 35
19
Location
Minimum Sea Level Pressure
Maximum Surface Wind Speed
Storm surge (ft)c
Storm tide (ft)d
Estimated Inundation
(ft)e
Total rain (in) Date/
time (UTC)
Press. (mb)
Date/ time
(UTC)a
Sustained (kt)b
Gust (kt)
Martinique / Robert Duchêne
5.51
Martinique / Francois 4.69
Martinque / Basse-Pointe 4.41
Saint-Barthélemy / Saint-Jean Airport (TFFJ) (17.90N 62.84W)
23/0500 1008.3 22/2000 31 45 0.25
Dominica
Melville Hall (TDPD) (15.55N 61.30W)
22/2100 1005.1
Canefield Airport (TDCF) (15.34N 61.39W)
22/2200 1005.1
Dominican Republic
Barahona (MDBH) (18.25N 71.12W)
23/2300 1004.4 24/2300 26 52 16.18
Bayaguana (78473) (18.75N 69.63W)
23/2100 1005.0 24/1800 16 24 7.42
Higuero (MDJB) (18.57N 69.99W)
23/2200 1007.4 24/2200 17 6.99
Catey (MDCY) (19.27N 69.74W) 24/2000 1009.0 23/2300 20 5.51
Puerto Plata (MDPP) (19.75N 70.55W)
24/2100 1008.2 24/1700 20 3.92
Santiago (MDST) (19.41N 70.60W)
24/2000 1007.2 25/0600 24 33 3.53
Jimani (78480) (18.33N 71.85W) 25/0600 1003.7 25/0600 30 41 3.51
Santo Domingo / Las Americas (MDSD) (18.43N 69.67W)
23/2200 1006.6 25/0800 24 40 3.44
Cabrera (78464) (19.63N 69.88W)
24/0900 1010.2 24/0600 16 24 3.23
La Romana (MDLR) (18.42N 68.95W)
23/2300 1006.6 24/1700 20 25 3.11
Central (78486) (18.43N 69.88W) 24/0000 1005.6 24/1800 14 28 2.94
Sabana de la Mar (78467) (19.05N 69.38W)
24/2100 1008.3 24/1800 16 2.63
Arroyo Barril (MDAB) (19.20N 69.43W)
24/0000 1007.4 24/1400 15 30 2.47
Punta Cana (MDPC) (18.57N 68.36W)
23/2100 1004.7 25/0300 18 35 1.54
Montecristi (78451) (19.88N 71.65W)
25/0900 1006.4 24/1500 20 0.52
20
Location
Minimum Sea Level Pressure
Maximum Surface Wind Speed
Storm surge (ft)c
Storm tide (ft)d
Estimated Inundation
(ft)e
Total rain (in) Date/
time (UTC)
Press. (mb)
Date/ time
(UTC)a
Sustained (kt)b
Gust (kt)
Bahamas
Nassau (MYNN) (25.04N 77.47W)
26/1400 1009.5 24/1600 37
Coastal-Marine Automated Network (C-MAN) Sites
Settlement Point (SPGF1) (26.70N 78.99W)
26/2000 1011.0 26/1050 31 43
Cuba
Guantánamo
Guantánamo (78368) 3.32
Punta de Maisí (78369) 25/1750 1003.1 25/1448 40 51 4.04
Jamal (78356) 25/1400 1002.5 6.14
Palenque de Yateras (78334) 25/1600 1002.0 5.94
Caujerí (78319) 25/1400 1000.0 9.01
San Antonio del Sur 14.08
Bernardo 8.23
Holguín
La Jíquima (78362) 25/2000 999.6 0.62
Cabo Lucrecia (78365) 25/1930 999.3 25/1648 33 1.61
Guaro (78370) 25/1850 997.9 25/1409 32 3.66
Pinares de Mayarí (78371) 25/1940 1003.9 26/0000 19 5.82
Holguín (78372) 25/2000 1005.0 25/1620 39 1.95
Velasco (78378) 25/2000 999.6 25/1045 34 1.44
Ciego de Ávila
Cayo Coco (78339) 26/0700 999.3 26/0600 32 0.06
Santiago de Cuba
Contramaestre 5.68
Mella 9.56
Embalse Hatillo 8.11
Los Negros 7.94
Granma
El Plátano 10.80
21
Location
Minimum Sea Level Pressure
Maximum Surface Wind Speed
Storm surge (ft)c
Storm tide (ft)d
Estimated Inundation
(ft)e
Total rain (in) Date/
time (UTC)
Press. (mb)
Date/ time
(UTC)a
Sustained (kt)b
Gust (kt)
Villa Clara
Motembo 8.70
Cienfuegos
Mayarí 9.29
United States
Puerto Rico and the US Virgin Islands
International Civil Aviation Organization (ICAO) Sites
San Juan (TJSJ) (18.43N 66.00W)
23/1951 1007.1 23/1405 26 33
St. Thomas (TIST) (18.33N 64.97W)
23/0952 1007.1 23/2014 32 40
St. Croix (TISX) (17.70N 64.80W)
23/0852 1006.1 23/1302 29 39
Hydrometeorological Automated Data System (HADS) Sites (NWS)
7 N Ponce (PCEP4) (18.08N 66.61W)
9.28
Adjuntas (ADJP4) (18.16N 66.72W)
8.55
Cayey (LCSP4) (18.11N 66.16W)
7.59
Yauco (JAMP4) (18.03N 66.86W)
7.58
Ciales (VILP4) (18.33N 66.47W)
7.18
Patillas (PARP4) (18.00N 66.01W)
6.52
Maunabo (MAUP4) (18.00N 65.90W)
6.14
Caguas (CAKP4) (18.23N 66.04W)
5.81
Penuelas (PENP4) (18.06N 66.72W)
5.57
San Lorenzo (SLJP4) (18.19N 65.97W)
5.48
National Ocean Service (NOS) Sites
Charlotte Amalie, St. Thomas (CHAV3 – 9751639) (18.34N, 64.92W)
23/0842 1007.1 24/1824 15 30 0.93 1.76 1.0
22
Location
Minimum Sea Level Pressure
Maximum Surface Wind Speed
Storm surge (ft)c
Storm tide (ft)d
Estimated Inundation
(ft)e
Total rain (in) Date/
time (UTC)
Press. (mb)
Date/ time
(UTC)a
Sustained (kt)b
Gust (kt)
Lameshur Bay, St. John (9751381) (18.32N 64.72W)
23/0854 1006.9 0.82 1.65 0.8
Christiansted Harbor, St. Croix (CHSV3 – 9751364) (17.75N 64.71W)
23/0848 1005.8 23/2306 19 47 0.89 1.36 0.6
Lime Tree Bay, St. Croix (LTBV3 – 9751401) (17.69N 64.75W)
23/0848 1005.5 24/1712 32 39 0.82 1.51 0.8
Culebra, PR (CLBP4 – 9752235) (18.30N 65.30W)
23/0942 1008.6 24/1754 18 31 0.89 1.96 0.8
Esperanza, PR (ESPP4 – 9752695) (18.09N 65.47W)
23/0936 1007.5 24/0600 31 37 1.06 1.65 0.9
San Juan, PR (SJNP4 – 9755371) (18.46N 66.12W)
23/1942 1007.0 23/1142 27 42 0.71 2.41 0.8
Magueyes Islands, PR (MGIP4 – 9759110) (17.97N 67.05W)
23/1948 1006.2 24/0130 18 29 1.05 1.83 1.2
Aguadilla, PR (AUDP4 – 9759412) (18.46N 67.16W)
23/1942 1007.4 1.15 2.38 1.0
Mona Island (9759938) (18.09N 67.94W)
23/2142 1006.7 0.93 1.73 0.9
Puerto Rico Seismic Network (Univ. of PR-Mayaguez)
Isabel Segunda, Vieques, PR (VQSP4 – 9752619) (18.15N 65.44W)
23/2242 18 31 0.79 1.98 0.8
Fajardo, PR (FRDP4 – 9753216) (18.34N 65.63W)
23/0930 1008.9 23/1706 26 34 0.85 2.32 0.8
Yabucoa Harbor, PR (YABP4 – 9754228) (18.06N 65.83W)
23/2024 29 36 1.15 1.71 1.0
Arecibo, PR (AROP4 – 9757809) (18.48N 66.70W)
23/1942 1009.9 23/0200 21 29 1.15 2.50 0.8
Mayaguez, PR (MGZP4 – 9759394) (18.22N 67.16W)
23/2112 1010.6 25/0212 19 28 1.23 2.20 0.9
Public/Other
Cidra (18.17N 66.16W) 4.82
Florida
ICAO Sites
Miami (KMIA) (25.80N 80.29W)
26/2256 1004.7 26/1750 29 45 4.79
West Kendall / Tamiami (KTMB) (25.65N 80.43W)
26/2253 1004.2 26/1619 25 38 4.95
Opa Locka (KOPF) (25.91N 80.28W)
26/2153 1005.0 27/0153 33 49 6.50
23
Location
Minimum Sea Level Pressure
Maximum Surface Wind Speed
Storm surge (ft)c
Storm tide (ft)d
Estimated Inundation
(ft)e
Total rain (in) Date/
time (UTC)
Press. (mb)
Date/ time
(UTC)a
Sustained (kt)b
Gust (kt)
Homestead (KHST) (25.48N 80.38W)
26/2255 1004.2 26/0638 29 39 8.09
Ft. Lauderdale (KFLL) (26.07N 80.15W)
26/2253 1005.2 27/0156 29 44 6.00
Ft. Lauderdale Executive (KFXE) (26.20N 80.17W)
26/2353 1005.8 26/1343 33 46 8.52
Hollywood (KHWO) (26.00N 80.24W)
26/2307 1005.4 27/0818 29 44 4.76
Pompano Beach (KPMP) (26.25N 80.12W)
26/2353 1005.9 27/0420 34 47 5.18
West Palm Beach (KPBI) (26.68N 80.09W)
26/2353 1007.7 26/2320 31 53 9.03
Naples (KAPF) (26.15N 81.77W)
27/0745 1003.4 27/1212 26 38
Key West (KEYW) (24.56N 81.75W)
26/1953 997.3 27/0058 34 47 1.58
Naval Air Station Key West, Boca Chica Key (KNQX) (24.58N 81.69W)
26/1953 997.3 26/1954 35 45 1.27
Marathon (KMTH) (24.73N 81.05W)
26/1953 1000.1 26/1548 30 40 2.82
Leesburg (KLEE) (28.82N 81.80W)
27/1634 1009.9 25/1330 28 38
Orlando (KMCO) (28.42N 81.31W)
27/1632 1009.4 27/0409 26 33 1.93
Orlando Executive (KORL) (28.54N 81.33W)
27/1606 1009.7 27/1049 33 52 1.83
Orlando / Sanford (KSFB) (28.77N 81.24W)
27/1606 1009.7 26/0908 23 33 2.07
Vero Beach (KVRB) (27.65N 80.41W)
27/0237 1009.4 27/0245 37 45 7.57
Cocoa / Patrick AFB (KCOF) (28.23N 80.60W)
27/2055 1011.2 27/1621 26 35
Melbourne (KMLB) (28.10N 80.64W)
27/0321 1009.7 27/0326 33 47 1.69
Cape Canaveral AFS Skid Strip (KXMR) (28.46N 80.56W)
27/2055 1011.1 27/1755 25 34
Saint Lucie Airport (KFPR) (27.49N 80.37W)
9.15
Okeechobee (KOBE) (27.26N 80.85W)
8.73
Tampa (KTPA) (27.98N 82.51W)
27/2053 1007.1 28/1710 18 31 2.70
St. Petersburg / Albert Whitted Field (KSPG) (27.77N 82.63W)
27/1853 1006.0 27/0337 30 37 2.39
Sarasota (KSRQ) (27.40N 82.55W)
27/1853 1005.6 27/1853 27 34 1.89
Punta Gorda (KPGD) (26.92N 81.99W)
27/0953 1005.3 27/0115 28 38 3.30

24
Location
Minimum Sea Level Pressure
Maximum Surface Wind Speed
Storm surge (ft)c
Storm tide (ft)d
Estimated Inundation
(ft)e
Total rain (in) Date/
time (UTC)
Press. (mb)
Date/ time
(UTC)a
Sustained (kt)b
Gust (kt)
Fort Myers Page Field (KFMY) (26.58N 81.97W)
27/0753 1004.1 27/1828 21 33 2.79
Fort Myers Regional Southwest (KRSW) (26.54N 81.76W)
27/0753 1004.0 27/1553 24 34 2.62
Winter Haven (KGIF) (28.05N 81.75W)
27/0853 1009.1 27/0653 22 31 4.42
Panama City / Tyndall AFB (KPAM) (30.07N 85.59W)
28/0857 1007.3 28/1855 24 34
Pensacola (KPNS) (30.47N 87.20W)
28/2053 1004.9 28/2153 28 41 2.36
Milton / Whiting Field NAS (KNSE) (30.70N 87.02W)
28/2156 1005.1 28/1856 23 38
Valparaiso / Eglin AFB (KVPS) (30.48N 86.53W)
28/1637 1006.8 30/1857 23 39 3.53
Destin (KDTS) (30.40N 86.47W)
29/2053 1008.7 30/1953 12 35 4.58
National Weather Service (NWS) HANDAR Sites
Key Biscayne (KVIK) (25.73N 80.16W)
27/0647 47I (15 m)
59
Flamingo (KFLM) (25.15N 80.91W)
27/0931 33I 42
Big Pine Key (BPIF1) (24.72N 81.39W)
26/1650 29 40 3.09
NWS Cooperative Observer Program (COOP) Sites
Palm Beach Gardens (PBGF1) (26.83N 80.10W)
10.65
Brighton Seminole Reservation (BRRF1) (27.08N 81.06W)
7.40
Fort Lauderdale Beach (FLBF1) (26.13N 80.11W)
6.71
Juno Beach (JUBF1) (26.85N 80.05W)
5.85
North Miami Beach (NMBF1) (25.93N 80.16W)
5.74
Hialeah (HIAF1) (25.82N 80.28W)
5.33
South Bay (SBYF1) (26.66N 80.72W)
5.26
Moore Haven (MHVF1) (26.83N 81.10W)
4.53
La Belle (LABF1) (26.75N 81.40W)
4.29
Big Cypress Reservation (BCIF1) (26.30N 80.97W)
4.20
25
Location
Minimum Sea Level Pressure
Maximum Surface Wind Speed
Storm surge (ft)c
Storm tide (ft)d
Estimated Inundation
(ft)e
Total rain (in) Date/
time (UTC)
Press. (mb)
Date/ time
(UTC)a
Sustained (kt)b
Gust (kt)
Oasis Ranger Station (OASF1) (Big Cypress National Reserve, 25.86N 81.03W)
3.85
Ortona (ORTF1) (26.80N 81.30W)
3.69
Muse (MUSF1) (La Belle, 26.83N 81.50W)
3.53
North Key Largo (KLNF1) (25.19N 80.35W)
26/1550 28 38 6.06
John Pennekamp State Park (KLPF1) (Key Largo, 25.19N 80.35W)
7.02
Bahia Honda State Park (BPNF1) (24.66N 81.28W)
3.50
Curry Hammock State Park (MTEF1) (24.74N 80.98W)
3.83
Duck Key (LNGF1) (24.77N 80.91W)
3.05
Fort Pierce (FPCF1) (27.44N 80.32W)
9.56
5 S Palm City (PTSF1) (Stuart, 27.09N 80.27W)
9.33
3 WNW Vero Beach South (VRBF1) (Vero Beach, 27.63N 80.45W)
8.11
2 W Avon Park (AVPF1) (Avon Park, 27.59N 81.54W)
5.64
Lake Wales (LWEF1) (27.85N 81.59W)
4.98
Archbold (ACHF1) (27.19N 81.35W)
3.89
Remote Automated Weather Stations (RAWS)
Everglades National Park - Chekika (CHKF1) (25.63N 80.57W)
27/0337 21
(6 m/10 min)
42
Everglades National Park - Cache (LPIF1) (25.39N 80.68W)
27/1416 20
(6 m/10 min)
37
Loxahatchee (LOHF1) (26.50N 80.22W)
12.24
Advanced Hydrological Prediction Service (AHPS) Sites
3 N Thonotosassa (MORF1) (28.11N 82.30W)
3.04
Bartow (BARF1) (27.89N 81.85W)
2.94
HADS Sites
26
Location
Minimum Sea Level Pressure
Maximum Surface Wind Speed
Storm surge (ft)c
Storm tide (ft)d
Estimated Inundation
(ft)e
Total rain (in) Date/
time (UTC)
Press. (mb)
Date/ time
(UTC)a
Sustained (kt)b
Gust (kt)
3 W Country Hills Estate (TACF1) (Okeechobee, 27.36N 80.87W)
9.23
Fort Meade (FTMF1) (27.75N 81.80W)
3.46
C-MAN Sites
Fowey Rocks (FWYF1) (25.59N 80.10W)
26/2300 1003.8 27/0140 45 (43.9 m)
55
Sand Key (SANF1) (24.45N 81.88W)
26/1600 43 (45.4 m)
51
Sombrero Key (SMKF1) (24.63N 81.11W)
26/2000 999.5 27/0000 44 (48.5 m)
51
Long Key (LONF1) (24.84N 80.86W)
26/2000 1001.3 27/0400 34 (7 m)
44
Molasses Reef (MLRF1) (25.01N 80.38W)
26/2000 1002.5 27/0100 42 (15.8 m)
50
Cedar Key (CDRF1) (29.14N 83.03W)
27/2100 1006.7 26/2042 30 36
Venice (VENF1) (27.07N 82.45W)
27/0900 1003.5 27/2100 39 (11.6 m)
46
NOS Sites
Lake Worth (LKWF1 – 8722670) (26.61N 80.03W)
26/2318 1006.6 27/0554 39 (6 m)
47 0.89 1.46 0.9
Virginia Key (VAKF1 – 8723214) (25.73N 80.16W)
26/1742 1003.9 26/1742 40 (3 m)
45 1.32 1.40 1.2
Naples (NPSF1 – 8725110) (26.13N 81.81W)
27/0748 1004.0 27/1812 27 36 2.38 2.61 2.0
Vaca Key (VCAF1 – 8723970) (24.71N 81.11W)
26/1954 1000.4 26/1536 29 (6.4 m)
42 0.97 0.54 0.9
Key West (KYWF1 – 8724580) (24.56N 81.81W)
26/2030 996.2 27/1942 30 (6.4 m)
34 1.14 1.16 1.1
Fort Myers (FMRF1 – 8725520) (26.65N 81.87W)
27/0754 1004.0 27/0142 17 (6.1 m)
28 2.31 2.17 1.9
Port Manatee (PMAF1 – 8726384) (27.64N 82.56W)
27/0918 1005.4 2.15 2.10 1.5
St. Petersburg (SAPF1 – 8726520) (27.76N 82.63W)
27/2130 1007.1 27/1918 27 (6.1 m)
35 2.48 1.6
Old Port Tampa (OPTF1 – 8726607) (27.86N 82.55W)
27/0918 1006.5 29/1600 24 32 2.53 1.6
Mckay Bay Entrance (TSHF1 – 8726667) (27.93N 82.43W)
2.56 2.53 1.5
Clearwater Beach (CWBF1 – 8726724) (27.98N 82.83W)
27/1942 1005.9 28/1954 25 (6.4 m)
31 2.50 2.65 1.7
Cedar Key (8727520) (29.14N 83.03W)
2.91 3.52 2.0
Apalachicola (APCF1 – 8728690) (29.73N 84.98W)
27/2230 1005.5 27/1948 25 31 3.44 4.07 3.2
27
Location
Minimum Sea Level Pressure
Maximum Surface Wind Speed
Storm surge (ft)c
Storm tide (ft)d
Estimated Inundation
(ft)e
Total rain (in) Date/
time (UTC)
Press. (mb)
Date/ time
(UTC)a
Sustained (kt)b
Gust (kt)
Panama City (PACF1 – 8729108) (30.15N 85.67W)
28/0724 1006.9 28/1618 24 35 2.50 3.64 2.9
Pensacola (PCLF1 – 8729840) (30.40N 87.21W)
28/2042 1004.6 28/2100 22 41 3.47 3.70 2.8
NOAA Integrated Coral Observing Network (ICON)
Port Everglades Channel (PVGF1) (26.09N 80.11W)
26/2254 1005.1 27/0218 35 (3.5 m)
46
Florida Department of Transportation (FDOT)
Tea Table Key Sign Materials Test Pad (24.78N 80.92W)
27/0106 31 (3 m)
Florida Automated Weather Network (FAWN)
Clewiston (AIRGL) (26.75N 80.94W)
4.78
Balm (Lithia, 27.76N 82.22W) 26/1615 18 35
University of South Florida Coastal Ocean Monitoring and Prediction System (COMPS)
Northwest Florida Bay (NFBF1) (25.08N 81.92W)
26/2030 1001.3 27/0130 34 (5.5 m)
44
Anna Maria (ANMF1) (27.55N 82.75W)
27/0954 1005.1 27/0500 32 (10.8 m)
41
Egmont Key (EGKF1) (27.60N 82.76W)
27/1000 1005.7 27/1942 31 40
Big Carlos Pass (BGCF1) (26.40N 81.89W)
27/0830 1004.3 26/1524 28 (19.1 m)
40
Buoy C12 (27.29N 83.43W) 27/2059 1002.1 27/0459 33 (3.2 m)
Weatherflow Sites
Medley (XURB) (25.86N 80.37W)
25/1150 26 (15 m)
39
Tamarac (XCVN) (26.19N 80.30W)
26/2335 1003.6 27/0205 24 40
Royal Palm Beach (XROY) (26.69N 80.18W)
26/1220 29 (21 m)
50
Miramar (XFLM) (25.97N 80.31W)
26/2310 1002.7 26/2320 24 (15 m)
45
Dinner Key Light (XDIN) (25.71N 80.21W)
26/2240 1003.6 26/1730 34 (5 m)
41
Biscayne Bay Light (XKBS) (25.66N 80.19W)
26/2305 1002.8 27/0325 35 (6 m)
48
Key Biscayne (XKBI) (25.69N 80.17W)
27/0300 27 (22 m)
43
28
Location
Minimum Sea Level Pressure
Maximum Surface Wind Speed
Storm surge (ft)c
Storm tide (ft)d
Estimated Inundation
(ft)e
Total rain (in) Date/
time (UTC)
Press. (mb)
Date/ time
(UTC)a
Sustained (kt)b
Gust (kt)
Crandon (XCRN) (25.72N 80.15W)
26/2225 1004.8 26/1135 33 (8 m)
47
Biscayne (XBIS) (25.73N 80.16W)
27/0140 38 (18 m)
50
Turkey Point (XTKY) (25.43N 80.35W)
27/0525 38 (20 m)
50
Cutler (XCUT) (25.63N 80.30W)
26/2205 1003.4 27/0345 26 37
North Miami (XNMI) (25.91N 80.16W)
27/0150 25 (17 m)
41
Hollywood (XNHD) (26.02N 80.13W)
27/0150 26 (14 m)
39
Port Everglades (XPEG) (26.09N 80.12W)
27/0205 42 (41 m)
58
Pompano Beach (XPOM) (26.24N 80.09W)
26/2310 1004.1 26/1145 26 (9 m)
45
Boca Raton (XBOC) (26.37N 80.09W)
27/0330 28 (21 m)
48
Boynton Beach (XBOY) (26.55N 80.05W)
26/2030 1003.4 27/0150 34 54
West Palm Beach (XWPM) (26.65N 80.06W)
27/0155 1004.8 26/0940 23 (13 m)
38
Mangonia Park (XMGN) (26.76N 80.07W)
26/0535 20 (21 m)
36
Capri (XCAP) (26.04N 81.70W) 27/1350 20 (15 m)
34
Key West USCG (WF35504) (24.57N 81.80W)
26/1855 30 47
Upper Matecumbe Key (WF999) (24.92N 80.64W)
27/0610 29 (18.3 m)
47
South Key Largo (WF102) (25.10N 80.43W)
27/0200 28 (18.3 m)
43
Smith Shoal Light (WF76402) (24.72N 81.92W)
26/1745 48 (19.2 m)
61
South Florida Water Management District Sites
Inland Miami-Dade Co. (S331W) (25.61N 80.51W)
26/1626 19I
(8 m/15 min)
36
Northern Glades Co. (S75WX) (27.19N 81.13W)
27/0720 24 (15 min)
37
Lake Okeechobee South (L006) (26.82N 80.78W)
27/0230 29
(8 m/15 min)
43
Lake Okeechobee Center (LZ40) (26.90N 80.79W)
27/0410 29
(8 m/15 min)
39
Lake Okeechobee West (L005) (26.96N 80.94W)
27/0353 30
(8 m/15 min)
40

29
Location
Minimum Sea Level Pressure
Maximum Surface Wind Speed
Storm surge (ft)c
Storm tide (ft)d
Estimated Inundation
(ft)e
Total rain (in) Date/
time (UTC)
Press. (mb)
Date/ time
(UTC)a
Sustained (kt)b
Gust (kt)
Lake Okeechobee North (L001) (27.14N 80.79W)
27/0645 32
(8 m/15 min)
51
12 NNW Intersection I-75 (WCA1ME) (Water Conservation Area 1, 26.15N 80.44W)
11.21
2 NW Tamarac (S38) (Water Conservation Area 2A, 26.23N 80.30W)
9.63
1 WSW Sunrise (S125) (Sunrise, 26.16N 80.30W)
8.46
1 SE Lauderhill (S33) (Lauderhill, 26.14N 80.20W)
8.44
2 ESE Davie (S13) (Fort Lauderdale, 26.07N 80.20W)
8.09
1 WSW Buckhead Ridge (S127) (NW Shore Lake Okeechobee, 27.13N 80.91W)
8.05
1 WNW Princeton (S165) (Princeton, 25.55N 80.41W)
5.34
4 E Harlem (CFSW) (Clewiston, 26.73N 80.89W)
5.24
3 NE Royal Palm Ranger Station (S332) (Everglades NP, 25.39N 80.61W)
5.17
10 N Monroe Station (BCA4) (Big Cypress National Preserve, 26.00N 81.12W)
5.02
3 SE Big Cypress National Preserve Oasis Visitor Center (BCA20) (Big Cypress National Preserve, 25.75N 80.97W)
4.66
6 W Stuart (TPKF1) (Palm City, 27.19N 80.34W)
9.73
1 SSW Port Saint Lucie (PSLF1) (Port Saint Lucie, 27.26N 80.36W)
9.04
11 NW Cornwell (KRLF1) (Lorida, 27.50N 81.20W)
8.51
9 SW Saint Lucie West (OBLF1) (Indiantown, 27.21N 80.48W)
8.28
12 N Indiantown (WLNF1) (Indiantown, 27.19N 80.50W)
8.12
Weatherbug Sites
Pompano Beach (26.28N 80.12W)
26/0830 52I
West Dade (25.73N 80.44W) 26/0713 51I
Miami Beach (25.80N 80.13W)
26/2256 47I
30
Location
Minimum Sea Level Pressure
Maximum Surface Wind Speed
Storm surge (ft)c
Storm tide (ft)d
Estimated Inundation
(ft)e
Total rain (in) Date/
time (UTC)
Press. (mb)
Date/ time
(UTC)a
Sustained (kt)b
Gust (kt)
Tamarac (26.21N 80.27W) 26/1156 47I
Hollywood (25.99N 80.16W) 26/1807 46I
Delray Beach (26.46N 80.08W)
26/0834 46I
Miami (25.80N 80.26W) 26/1742 45I
Margate (26.25N 80.22W) 26/1150 45I
Key Biscayne (25.69N 80.16W)
26/1434 44I
Sweetwater (25.77N 80.35W) 26/0706 44I
Miami Gardens (25.96N 80.24W)
26/1126 43I
Miami (25.85N 80.22W) 26/0656 43I
Community Collaborative Rain, Hail and Snow Network (CoCoRaHS) Sites
3 E Lion Country Safari (FL-PB-31) (Loxahatchee, 26.71N 80.36W)
15.86
Boynton Beach (FL-PB-25) (26.55N 80.09W)
13.74
1 S Florida Gardens (FL-PB-12) (Lake Worth, 26.61N 80.17W)
11.52
1 N Coral Springs (FL-BW-9) (Coral Springs, 26.28N 80.27W)
9.91
1 S Buckhead Ridge (FL-GL-10) (Okeechobee, 27.13N 80.89)
9.03
Fort Lauderdale (FL-BW-16) (26.12N 80.15W)
8.94
1 E Biscayne Park (FL-MD-33) (Biscayne Park, 25.88N 80.18W)
5.50
1 N South Miami (FL-MD-30) (Miami, 25.72N 80.30W)
5.40
1 SE Ortona (FL-GL-2) (Moore Haven, 26.80N 81.29W)
5.18
Lower Matecumbe Key (FL-MN-08) (24.85N 80.74W)
5.03
5.2 S Vero Beach (FL-IR-32) (Vero Beach, 27.56N 80.39W)
16.50
2 NE Port Saint Lucie (FL-SL-29) (Port Saint Lucie, 27.29N 80.34W)
13.02
2 N Port Saint Lucie (FL-SL-22) (Port Saint Lucie, 27.31N 80.36W)
12.18
31
Location
Minimum Sea Level Pressure
Maximum Surface Wind Speed
Storm surge (ft)c
Storm tide (ft)d
Estimated Inundation
(ft)e
Total rain (in) Date/
time (UTC)
Press. (mb)
Date/ time
(UTC)a
Sustained (kt)b
Gust (kt)
4 SW Palm City (FL-MT-1) (Palm City, 27.12N 80.31W)
11.60
3.9 SSW Sebring (FL-HL-11) (Sebring, 27.44N 81.48W)
6.71
6.3 ESE Frostproof (FL-PK-43) (Frostproof, 27.70N 81.44W)
6.35
3.1 W Sebring (FL-HL-14) (Sebring, 27.48N 81.50W)
5.95
0.8 E Avon Park (FL-HL-2) (Avon Park, 27.59N 81.49W)
5.45
Citizen Weather Observer Program (CWOP) Sites
Cudjoe Key (CW0925) (24.65N 81.48W)
26/2033 997.7 26/1633 36 43 2.26
Ramrod Key FKAA Pump Station (CW0924) (24.66N 81.41W)
26/2111 998.0 27/0511 27 41 2.05
Ramrod Key (DW8495) (24.65N 81.41W)
26/1826 24 (7.9 m)
42 2.81
Long Key FKAA Pump Station (CW0922) (24.84N 80.79W)
26/2001 1000.0 26/1601 38 (15.2 m)
51 2.95
Islamorada Fire Rescue Station 20 (DW1872) (24.92N 80.64W)
26/2013 1000.2 27/0303 27 43
Upper Matecumbe Key (DW1872) (24.92N 80.64W)
7.94
Other
NWS WFO Miami/ National Hurricane Center (KMFL) (25.75N 80.39W)
26/0710 52E 4.94
AOML – Virginia Key (25.74N 80.16W)
26/1745 52
NWS WFO Key West (KKEY) (24.55N 81.79W)
1.61
NWS WFO Tampa Bay (KTBW) (Ruskin, 27.71N 82.43W)
1.79
Public
2 NW Greenacres City (Greenacres) (26.65N 80.15W)
13.10
Wellington (26.66N 80.26W) 12.55
2 NNW The Acreage (West Palm Beach) (26.79N 80.26W)
12.29
6 SSW Florida Gardens (Boynton Beach) (26.54N 80.19W)
11.98
32
Location
Minimum Sea Level Pressure
Maximum Surface Wind Speed
Storm surge (ft)c
Storm tide (ft)d
Estimated Inundation
(ft)e
Total rain (in) Date/
time (UTC)
Press. (mb)
Date/ time
(UTC)a
Sustained (kt)b
Gust (kt)
3 NW Haverhill (West Palm Beach, 26.72N 80.16W)
11.15
3 ENE Miramar (Miramar, 25.99N 80.31W)
10.86
Coral Springs (26.27N 80.27W)
10.41
Sunrise (26.17N 80.28W) 8.29
Zoo Miami (Miami, 25.62N 80.39W)
6.22
Miami (25.76N 80.24W) 5.43
2 E Cutler Ridge (Palmetto Bay, 25.60N 80.33W)
5.30
Miami Shores (25.86N 80.19W) 5.24
1 W White City (KFLWHITE2) (Fort Pierce, 27.37N 80.34W)
14.00
1 NW Grovenor Estates (KFLVEROB1) (Vero Beach, 27.59N 80.44W)
13.54
3 S Whispering Pines (KFLOKEEC1) (Okeechobee, 27.24N 80.84W)
13.45
4 WNW Palm City (KFLPALMC20) (Port Saint Lucie, 27.20N 80.33W)
12.33
Alabama
ICAO Sites
Mobile Regional (KMOB) (30.67N 88.24W)
29/0856 1003.3 29/2028 27 41 9.71
Mobile Brookley (KBFM) (30.64N 88.07W)
28/2053 1003.7 29/0249 30 44 7.49
Gulf Shores (KJKA) (30.29N 87.67W)
30/0215 22 33
NWS COOP Sites
Dauphin Island (DAUA1) (30.25N 88.08W)
6.97
C-MAN Sites
Dauphin Island (DPIA1) (30.25N 88.07W)
28/2100 1001.3 28/2100 42 (13.5 m)
53
NOS Sites
Weeks Bay (8732828) (30.42N 87.83W)
2.96 2.9
Dauphin Island (8735180) (30.25N 88.08W)
28/2148 1001.5 29/0548 45 54 3.57 4.10 3.1
33
Location
Minimum Sea Level Pressure
Maximum Surface Wind Speed
Storm surge (ft)c
Storm tide (ft)d
Estimated Inundation
(ft)e
Total rain (in) Date/
time (UTC)
Press. (mb)
Date/ time
(UTC)a
Sustained (kt)b
Gust (kt)
Dog River Bridge (8735391) (30.57N 88.09W)
3.64 3.8
East Fowl River Bridge (8735523) (30.44N 88.11W)
3.92 3.8
Chickasaw Creek (8737138) (30.78N 88.07W)
4.28 3.6
West Fowl River Bridge (8738043) (30.38N 88.16W)
3.51 3.6
Bayou La Batre Bridge (8739803) (30.41N 88.25W)
3.97 4.1
Coast Guard Sector Mobile (MCGA1 – 8736897) (30.65N 88.06W)
28/2036 1001.5 28/1942 32 (16.6 m)
42 4.63 4.2
Mobile State Docks (OBLA1 – 8737048) (30.71N 88.04W)
28/2042 1003.1 3.84 5.05 3.7
US Geological Survey (USGS) Storm Tide Sensors
Mobile County
Dauphin Island/Bineville Blvd. (AL-MOB-003WL) (30.25N 88.19W)
7.31 4.5
Dog River, Theodore (AL-MOB-009WL) (30.59N 88.11W)
5.40 2
Dog River @ Old Military Rd. (AL-MOB-010WL) (30.63N 88.10W)
5.48 1.5
Deer River on Deer River Rd. (AL-MOB-007WL) (30.53N 88.11W)
5.31 1.5
Dog River @ Mariner Marina (AL-MOB-008WL) (30.57N 88.09W)
5.45 1
Port Royal/Cadilac Ave. Powerpole (AL-MOB-001WL) (30.25N 88.14W)
4.93 0.5
Alabama Port (AL-MOB-005WL) (30.37N 88.11W)
5.96 < 0.5
Coden (AL-MOB-004WL) (30.38N 88.24W)
5.28 < 0.5
Baldwin County
Roberts Bayou near Josephine (AL-BAL-001WL) (30.33N 87.53W)
3.52 2.5
Mobile Bay near Fairhope (AL-BAL-004WL) (30.53N 87.91W)
4.94 2.5
34
Location
Minimum Sea Level Pressure
Maximum Surface Wind Speed
Storm surge (ft)c
Storm tide (ft)d
Estimated Inundation
(ft)e
Total rain (in) Date/
time (UTC)
Press. (mb)
Date/ time
(UTC)a
Sustained (kt)b
Gust (kt)
Mobile Bay near Daphne (AL-BAL-005WL) (30.63N 87.92W)
4.97 2
Bon Secour River near Bon Secour (AL-BAL-002WL) (30.30N 87.73W)
3.18 1.5
Mobile Bay near Ft. Morgan (AL-BAL-003WL) (30.23N 88.02W)
4.72 0.5
Public
Grand Bay (30.48N 88.34W) 13.99
Semmes (30.78N 88.26W) 9.40
Coden (30.38N 88.24W) 6.99
Fairhope (30.52N 87.90W) 6.72
Daphne (30.60N 87.90W) 6.10
Mississippi
ICAO Sites
Gulfport (KGPT) (30.40N 89.07W)
29/2218 997.6 29/1719 46 61 10.85
Biloxi / Keesler AFB (KBIX) (30.41N 88.92W)
29/2320 994.9 29/1858 39 49 10.17
Pascagoula (KPQL) (30.46N 88.53W)
29/1049 1000.0 30/0230 32 45 13.33
McComb (KMCB) (31.18N 90.47W)
30/0650 992.6 30/1911 25 39 11.74
Bay St. Louis / Stennis (KHSA) (30.40N 89.48W)
12.21
Jackson (KJAN) (32.19N 90.04W)
30/1154 1001.0 30/2140 23 36
Meridian (KMEI) (32.20N 88.44W)
30/0058 1007.0 30/1422 25 35
Vicksburg (KTVR) (32.21N 91.01W)
30/0953 997.3 30/0817 27 45
Hattiesburg (KHBG) (31.16N 89.15W)
30/0053 1001.1 30/0618 23 39 9.38
Greenville (KGLH) (33.28N 90.98W)
30/2053 1003.7 30/2053 28 43
Greenwood (KGWO) (33.29N 90.05W)
30/1153 1006.5 30/1812 22 35
NWS COOP Sites
3 NE Pascagoula (PGLM6) (Pascagoula, 30.40N 88.48W)
22.20
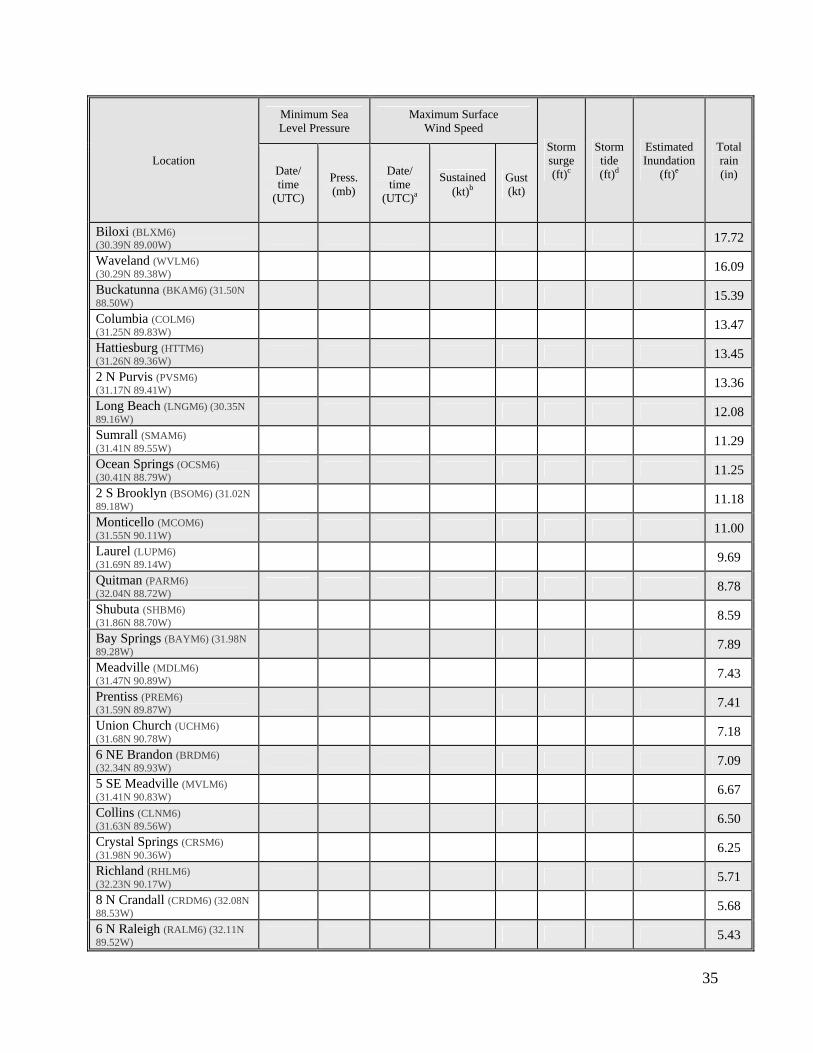
35
Location
Minimum Sea Level Pressure
Maximum Surface Wind Speed
Storm surge (ft)c
Storm tide (ft)d
Estimated Inundation
(ft)e
Total rain (in) Date/
time (UTC)
Press. (mb)
Date/ time
(UTC)a
Sustained (kt)b
Gust (kt)
Biloxi (BLXM6) (30.39N 89.00W)
17.72
Waveland (WVLM6) (30.29N 89.38W)
16.09
Buckatunna (BKAM6) (31.50N 88.50W)
15.39
Columbia (COLM6) (31.25N 89.83W)
13.47
Hattiesburg (HTTM6) (31.26N 89.36W)
13.45
2 N Purvis (PVSM6) (31.17N 89.41W)
13.36
Long Beach (LNGM6) (30.35N 89.16W)
12.08
Sumrall (SMAM6) (31.41N 89.55W)
11.29
Ocean Springs (OCSM6) (30.41N 88.79W)
11.25
2 S Brooklyn (BSOM6) (31.02N 89.18W)
11.18
Monticello (MCOM6) (31.55N 90.11W)
11.00
Laurel (LUPM6) (31.69N 89.14W)
9.69
Quitman (PARM6) (32.04N 88.72W)
8.78
Shubuta (SHBM6) (31.86N 88.70W)
8.59
Bay Springs (BAYM6) (31.98N 89.28W)
7.89
Meadville (MDLM6) (31.47N 90.89W)
7.43
Prentiss (PREM6) (31.59N 89.87W)
7.41
Union Church (UCHM6) (31.68N 90.78W)
7.18
6 NE Brandon (BRDM6) (32.34N 89.93W)
7.09
5 SE Meadville (MVLM6) (31.41N 90.83W)
6.67
Collins (CLNM6) (31.63N 89.56W)
6.50
Crystal Springs (CRSM6) (31.98N 90.36W)
6.25
Richland (RHLM6) (32.23N 90.17W)
5.71
8 N Crandall (CRDM6) (32.08N 88.53W)
5.68
6 N Raleigh (RALM6) (32.11N 89.52W)
5.43
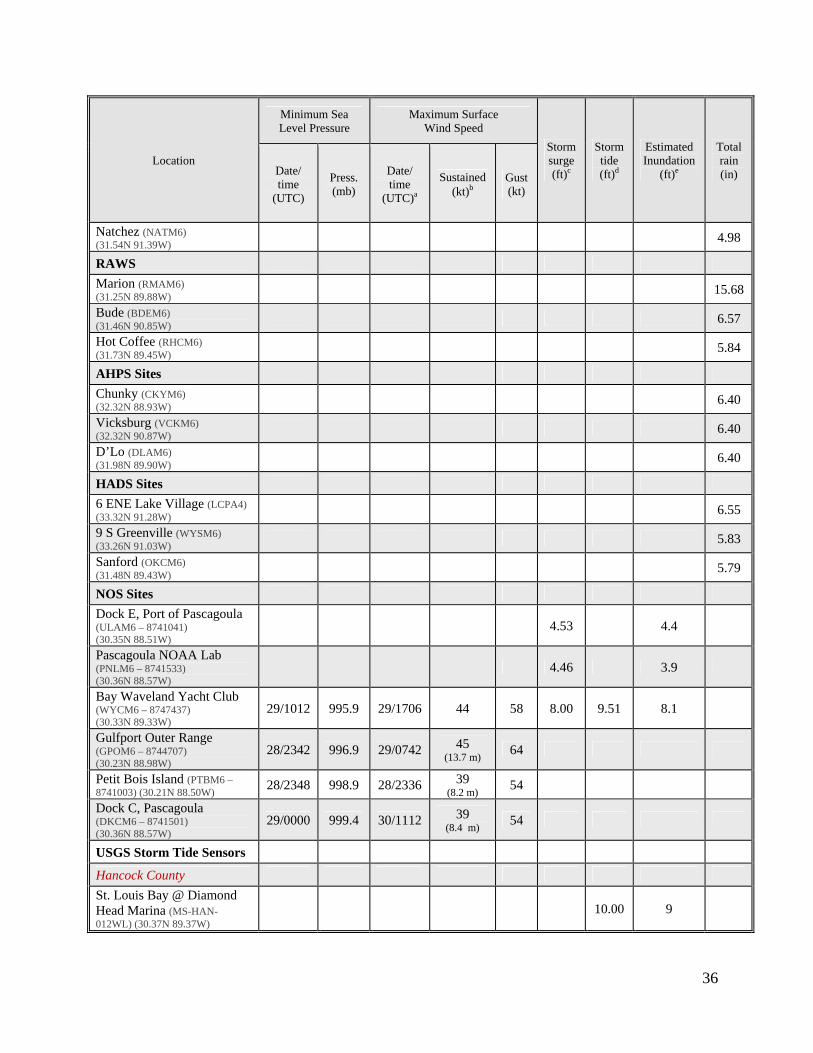
36
Location
Minimum Sea Level Pressure
Maximum Surface Wind Speed
Storm surge (ft)c
Storm tide (ft)d
Estimated Inundation
(ft)e
Total rain (in) Date/
time (UTC)
Press. (mb)
Date/ time
(UTC)a
Sustained (kt)b
Gust (kt)
Natchez (NATM6) (31.54N 91.39W)
4.98
RAWS
Marion (RMAM6) (31.25N 89.88W)
15.68
Bude (BDEM6) (31.46N 90.85W)
6.57
Hot Coffee (RHCM6) (31.73N 89.45W)
5.84
AHPS Sites
Chunky (CKYM6) (32.32N 88.93W)
6.40
Vicksburg (VCKM6) (32.32N 90.87W)
6.40
D’Lo (DLAM6) (31.98N 89.90W)
6.40
HADS Sites
6 ENE Lake Village (LCPA4) (33.32N 91.28W)
6.55
9 S Greenville (WYSM6) (33.26N 91.03W)
5.83
Sanford (OKCM6) (31.48N 89.43W)
5.79
NOS Sites
Dock E, Port of Pascagoula (ULAM6 – 8741041) (30.35N 88.51W)
4.53 4.4
Pascagoula NOAA Lab (PNLM6 – 8741533) (30.36N 88.57W)
4.46 3.9
Bay Waveland Yacht Club (WYCM6 – 8747437) (30.33N 89.33W)
29/1012 995.9 29/1706 44 58 8.00 9.51 8.1
Gulfport Outer Range (GPOM6 – 8744707) (30.23N 88.98W)
28/2342 996.9 29/0742 45 (13.7 m)
64
Petit Bois Island (PTBM6 – 8741003) (30.21N 88.50W)
28/2348 998.9 28/2336 39 (8.2 m)
54
Dock C, Pascagoula (DKCM6 – 8741501) (30.36N 88.57W)
29/0000 999.4 30/1112 39 (8.4 m)
54
USGS Storm Tide Sensors
Hancock County
St. Louis Bay @ Diamond Head Marina (MS-HAN-012WL) (30.37N 89.37W)
10.00 9
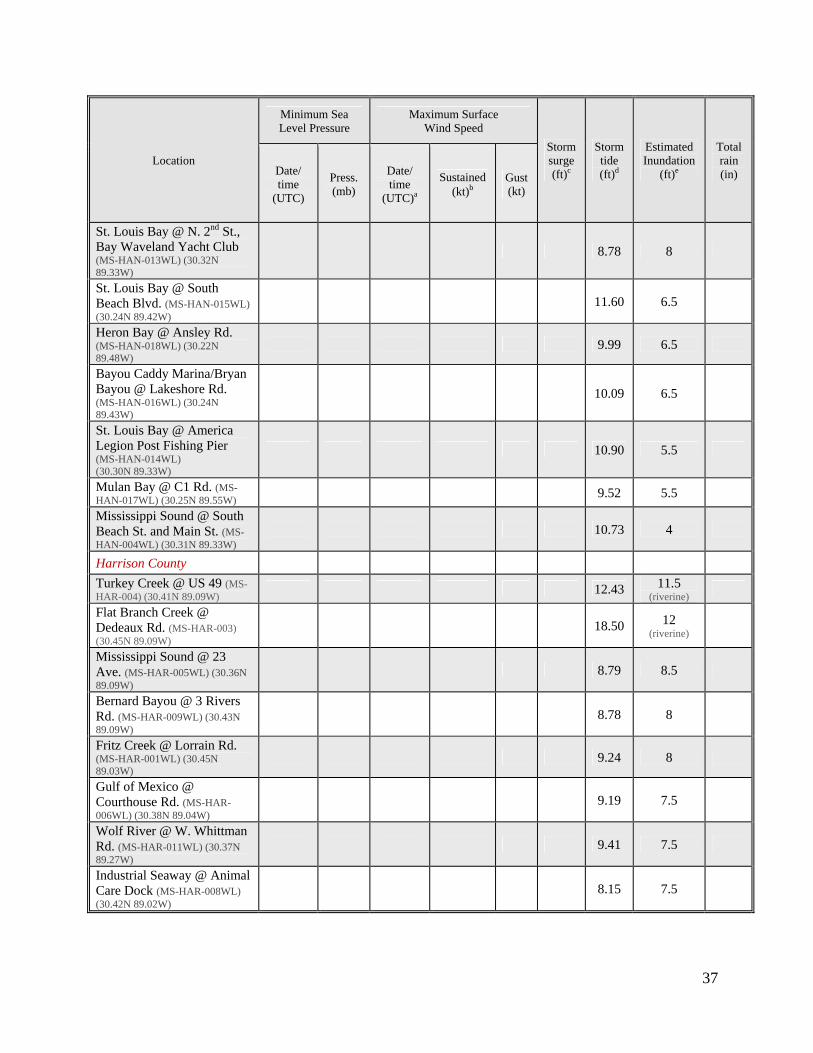
37
Location
Minimum Sea Level Pressure
Maximum Surface Wind Speed
Storm surge (ft)c
Storm tide (ft)d
Estimated Inundation
(ft)e
Total rain (in) Date/
time (UTC)
Press. (mb)
Date/ time
(UTC)a
Sustained (kt)b
Gust (kt)
St. Louis Bay @ N. 2nd St., Bay Waveland Yacht Club (MS-HAN-013WL) (30.32N 89.33W)
8.78 8
St. Louis Bay @ South Beach Blvd. (MS-HAN-015WL) (30.24N 89.42W)
11.60 6.5
Heron Bay @ Ansley Rd. (MS-HAN-018WL) (30.22N 89.48W)
9.99 6.5
Bayou Caddy Marina/Bryan Bayou @ Lakeshore Rd. (MS-HAN-016WL) (30.24N 89.43W)
10.09 6.5
St. Louis Bay @ America Legion Post Fishing Pier (MS-HAN-014WL) (30.30N 89.33W)
10.90 5.5
Mulan Bay @ C1 Rd. (MS-HAN-017WL) (30.25N 89.55W)
9.52 5.5
Mississippi Sound @ South Beach St. and Main St. (MS-HAN-004WL) (30.31N 89.33W)
10.73 4
Harrison County
Turkey Creek @ US 49 (MS-HAR-004) (30.41N 89.09W)
12.43 11.5 (riverine)
Flat Branch Creek @ Dedeaux Rd. (MS-HAR-003) (30.45N 89.09W)
18.50 12 (riverine)
Mississippi Sound @ 23 Ave. (MS-HAR-005WL) (30.36N 89.09W)
8.79 8.5
Bernard Bayou @ 3 Rivers Rd. (MS-HAR-009WL) (30.43N 89.09W)
8.78 8
Fritz Creek @ Lorrain Rd. (MS-HAR-001WL) (30.45N 89.03W)
9.24 8
Gulf of Mexico @ Courthouse Rd. (MS-HAR-006WL) (30.38N 89.04W)
9.19 7.5
Wolf River @ W. Whittman Rd. (MS-HAR-011WL) (30.37N 89.27W)
9.41 7.5
Industrial Seaway @ Animal Care Dock (MS-HAR-008WL) (30.42N 89.02W)
8.15 7.5
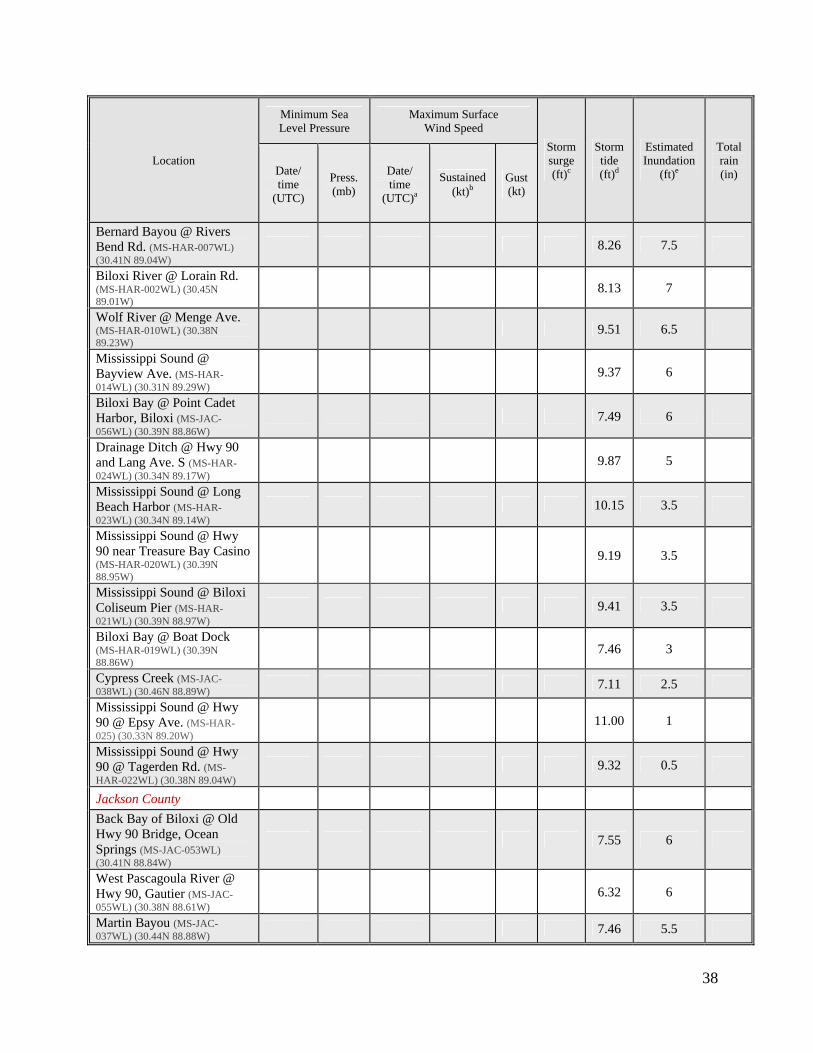
38
Location
Minimum Sea Level Pressure
Maximum Surface Wind Speed
Storm surge (ft)c
Storm tide (ft)d
Estimated Inundation
(ft)e
Total rain (in) Date/
time (UTC)
Press. (mb)
Date/ time
(UTC)a
Sustained (kt)b
Gust (kt)
Bernard Bayou @ Rivers Bend Rd. (MS-HAR-007WL) (30.41N 89.04W)
8.26 7.5
Biloxi River @ Lorain Rd. (MS-HAR-002WL) (30.45N 89.01W)
8.13 7
Wolf River @ Menge Ave. (MS-HAR-010WL) (30.38N 89.23W)
9.51 6.5
Mississippi Sound @ Bayview Ave. (MS-HAR-014WL) (30.31N 89.29W)
9.37 6
Biloxi Bay @ Point Cadet Harbor, Biloxi (MS-JAC-056WL) (30.39N 88.86W)
7.49 6
Drainage Ditch @ Hwy 90 and Lang Ave. S (MS-HAR-024WL) (30.34N 89.17W)
9.87 5
Mississippi Sound @ Long Beach Harbor (MS-HAR-023WL) (30.34N 89.14W)
10.15 3.5
Mississippi Sound @ Hwy 90 near Treasure Bay Casino (MS-HAR-020WL) (30.39N 88.95W)
9.19 3.5
Mississippi Sound @ Biloxi Coliseum Pier (MS-HAR-021WL) (30.39N 88.97W)
9.41 3.5
Biloxi Bay @ Boat Dock (MS-HAR-019WL) (30.39N 88.86W)
7.46 3
Cypress Creek (MS-JAC-038WL) (30.46N 88.89W)
7.11 2.5
Mississippi Sound @ Hwy 90 @ Epsy Ave. (MS-HAR-025) (30.33N 89.20W)
11.00 1
Mississippi Sound @ Hwy 90 @ Tagerden Rd. (MS-HAR-022WL) (30.38N 89.04W)
9.32 0.5
Jackson County
Back Bay of Biloxi @ Old Hwy 90 Bridge, Ocean Springs (MS-JAC-053WL) (30.41N 88.84W)
7.55 6
West Pascagoula River @ Hwy 90, Gautier (MS-JAC-055WL) (30.38N 88.61W)
6.32 6
Martin Bayou (MS-JAC-037WL) (30.44N 88.88W)
7.46 5.5
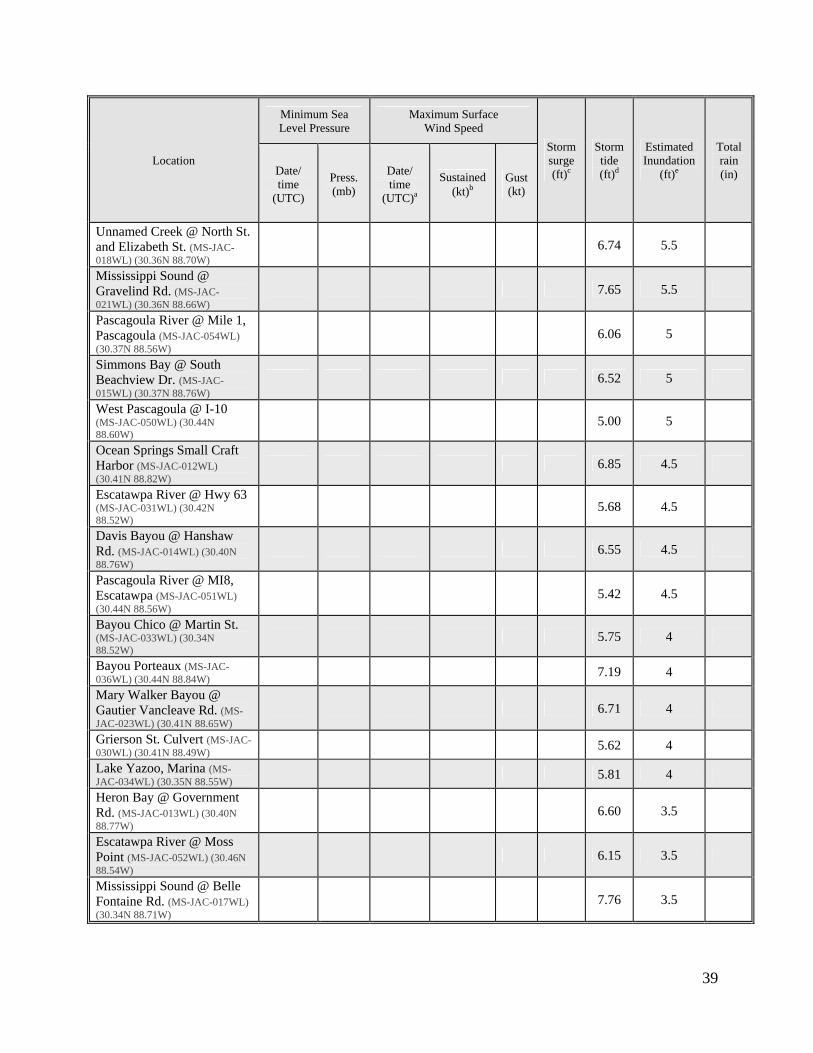
39
Location
Minimum Sea Level Pressure
Maximum Surface Wind Speed
Storm surge (ft)c
Storm tide (ft)d
Estimated Inundation
(ft)e
Total rain (in) Date/
time (UTC)
Press. (mb)
Date/ time
(UTC)a
Sustained (kt)b
Gust (kt)
Unnamed Creek @ North St. and Elizabeth St. (MS-JAC-018WL) (30.36N 88.70W)
6.74 5.5
Mississippi Sound @ Gravelind Rd. (MS-JAC-021WL) (30.36N 88.66W)
7.65 5.5
Pascagoula River @ Mile 1, Pascagoula (MS-JAC-054WL) (30.37N 88.56W)
6.06 5
Simmons Bay @ South Beachview Dr. (MS-JAC-015WL) (30.37N 88.76W)
6.52 5
West Pascagoula @ I-10 (MS-JAC-050WL) (30.44N 88.60W)
5.00 5
Ocean Springs Small Craft Harbor (MS-JAC-012WL) (30.41N 88.82W)
6.85 4.5
Escatawpa River @ Hwy 63 (MS-JAC-031WL) (30.42N 88.52W)
5.68 4.5
Davis Bayou @ Hanshaw Rd. (MS-JAC-014WL) (30.40N 88.76W)
6.55 4.5
Pascagoula River @ MI8, Escatawpa (MS-JAC-051WL) (30.44N 88.56W)
5.42 4.5
Bayou Chico @ Martin St. (MS-JAC-033WL) (30.34N 88.52W)
5.75 4
Bayou Porteaux (MS-JAC-036WL) (30.44N 88.84W)
7.19 4
Mary Walker Bayou @ Gautier Vancleave Rd. (MS-JAC-023WL) (30.41N 88.65W)
6.71 4
Grierson St. Culvert (MS-JAC-030WL) (30.41N 88.49W)
5.62 4
Lake Yazoo, Marina (MS-JAC-034WL) (30.35N 88.55W)
5.81 4
Heron Bay @ Government Rd. (MS-JAC-013WL) (30.40N 88.77W)
6.60 3.5
Escatawpa River @ Moss Point (MS-JAC-052WL) (30.46N 88.54W)
6.15 3.5
Mississippi Sound @ Belle Fontaine Rd. (MS-JAC-017WL) (30.34N 88.71W)
7.76 3.5
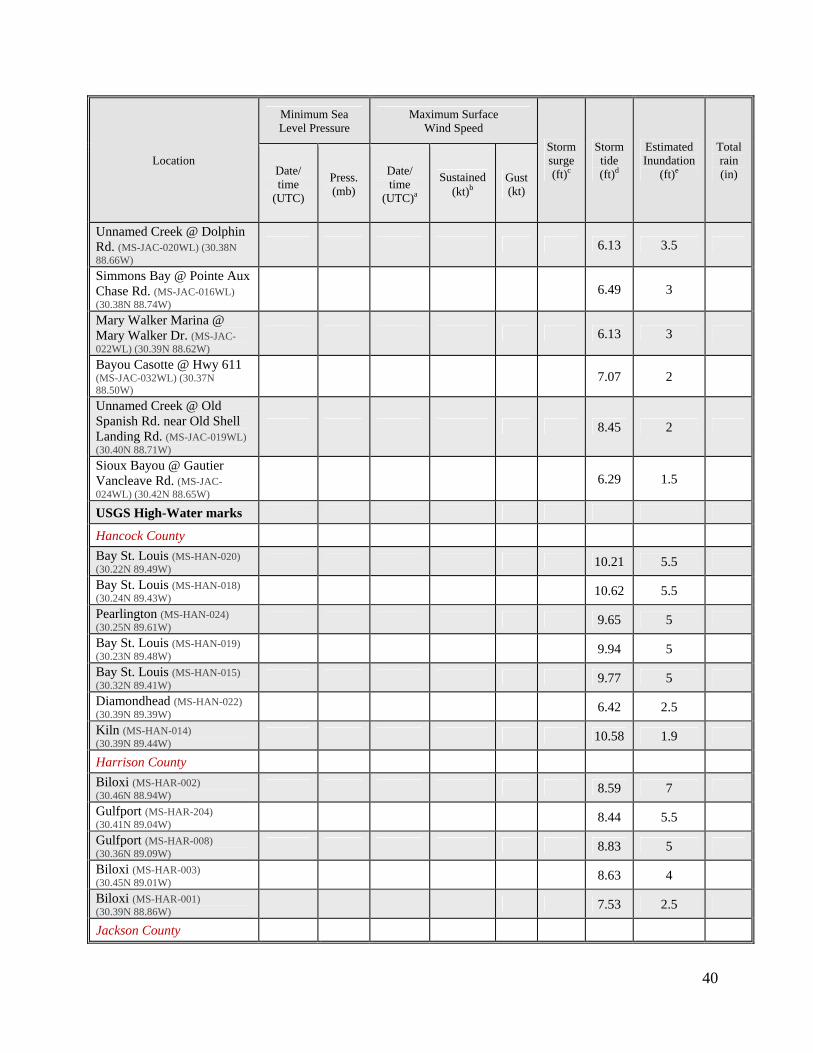
40
Location
Minimum Sea Level Pressure
Maximum Surface Wind Speed
Storm surge (ft)c
Storm tide (ft)d
Estimated Inundation
(ft)e
Total rain (in) Date/
time (UTC)
Press. (mb)
Date/ time
(UTC)a
Sustained (kt)b
Gust (kt)
Unnamed Creek @ Dolphin Rd. (MS-JAC-020WL) (30.38N 88.66W)
6.13 3.5
Simmons Bay @ Pointe Aux Chase Rd. (MS-JAC-016WL) (30.38N 88.74W)
6.49 3
Mary Walker Marina @ Mary Walker Dr. (MS-JAC-022WL) (30.39N 88.62W)
6.13 3
Bayou Casotte @ Hwy 611 (MS-JAC-032WL) (30.37N 88.50W)
7.07 2
Unnamed Creek @ Old Spanish Rd. near Old Shell Landing Rd. (MS-JAC-019WL) (30.40N 88.71W)
8.45 2
Sioux Bayou @ Gautier Vancleave Rd. (MS-JAC-024WL) (30.42N 88.65W)
6.29 1.5
USGS High-Water marks
Hancock County
Bay St. Louis (MS-HAN-020) (30.22N 89.49W)
10.21 5.5
Bay St. Louis (MS-HAN-018) (30.24N 89.43W)
10.62 5.5
Pearlington (MS-HAN-024) (30.25N 89.61W)
9.65 5
Bay St. Louis (MS-HAN-019) (30.23N 89.48W)
9.94 5
Bay St. Louis (MS-HAN-015) (30.32N 89.41W)
9.77 5
Diamondhead (MS-HAN-022) (30.39N 89.39W)
6.42 2.5
Kiln (MS-HAN-014) (30.39N 89.44W)
10.58 1.9
Harrison County
Biloxi (MS-HAR-002) (30.46N 88.94W)
8.59 7
Gulfport (MS-HAR-204) (30.41N 89.04W)
8.44 5.5
Gulfport (MS-HAR-008) (30.36N 89.09W)
8.83 5
Biloxi (MS-HAR-003) (30.45N 89.01W)
8.63 4
Biloxi (MS-HAR-001) (30.39N 88.86W)
7.53 2.5
Jackson County
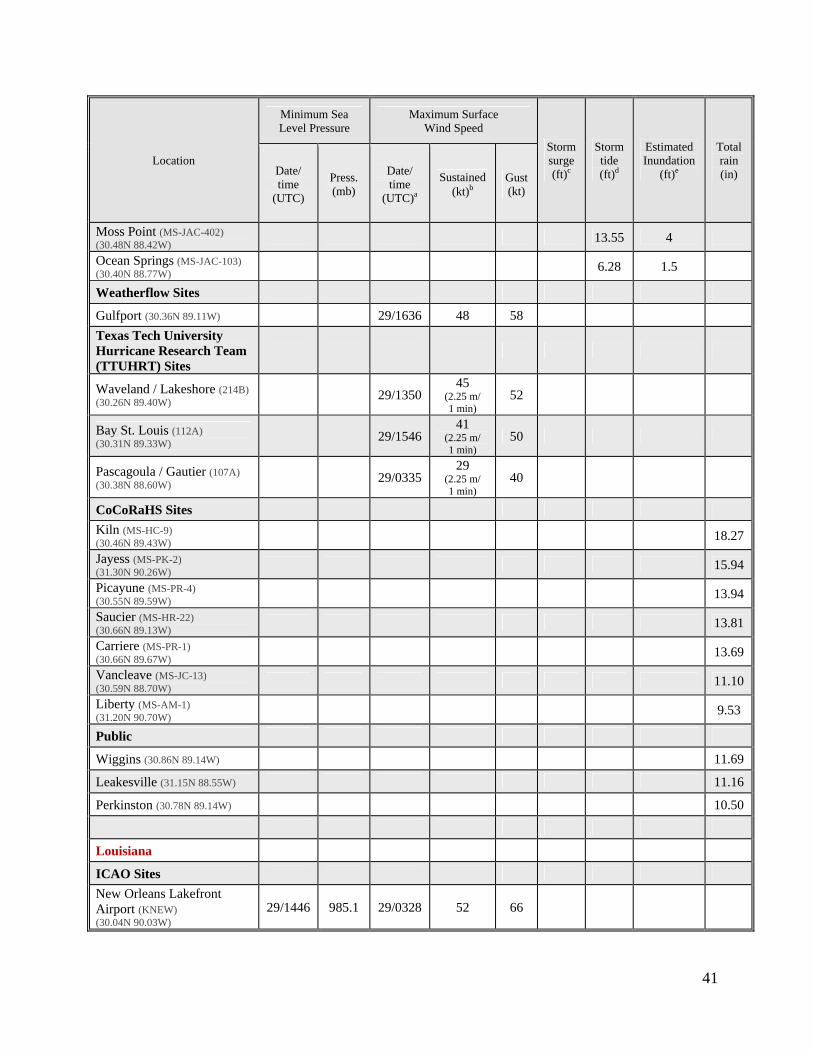
41
Location
Minimum Sea Level Pressure
Maximum Surface Wind Speed
Storm surge (ft)c
Storm tide (ft)d
Estimated Inundation
(ft)e
Total rain (in) Date/
time (UTC)
Press. (mb)
Date/ time
(UTC)a
Sustained (kt)b
Gust (kt)
Moss Point (MS-JAC-402) (30.48N 88.42W)
13.55 4
Ocean Springs (MS-JAC-103) (30.40N 88.77W)
6.28 1.5
Weatherflow Sites
Gulfport (30.36N 89.11W) 29/1636 48 58
Texas Tech University Hurricane Research Team (TTUHRT) Sites
Waveland / Lakeshore (214B) (30.26N 89.40W)
29/1350 45
(2.25 m/ 1 min)
52
Bay St. Louis (112A) (30.31N 89.33W)
29/1546 41
(2.25 m/ 1 min)
50
Pascagoula / Gautier (107A) (30.38N 88.60W)
29/0335 29
(2.25 m/ 1 min)
40
CoCoRaHS Sites
Kiln (MS-HC-9) (30.46N 89.43W)
18.27
Jayess (MS-PK-2) (31.30N 90.26W)
15.94
Picayune (MS-PR-4) (30.55N 89.59W)
13.94
Saucier (MS-HR-22) (30.66N 89.13W)
13.81
Carriere (MS-PR-1) (30.66N 89.67W)
13.69
Vancleave (MS-JC-13) (30.59N 88.70W)
11.10
Liberty (MS-AM-1) (31.20N 90.70W)
9.53
Public
Wiggins (30.86N 89.14W) 11.69
Leakesville (31.15N 88.55W) 11.16
Perkinston (30.78N 89.14W) 10.50
Louisiana
ICAO Sites
New Orleans Lakefront Airport (KNEW) (30.04N 90.03W)
29/1446 985.1 29/0328 52 66
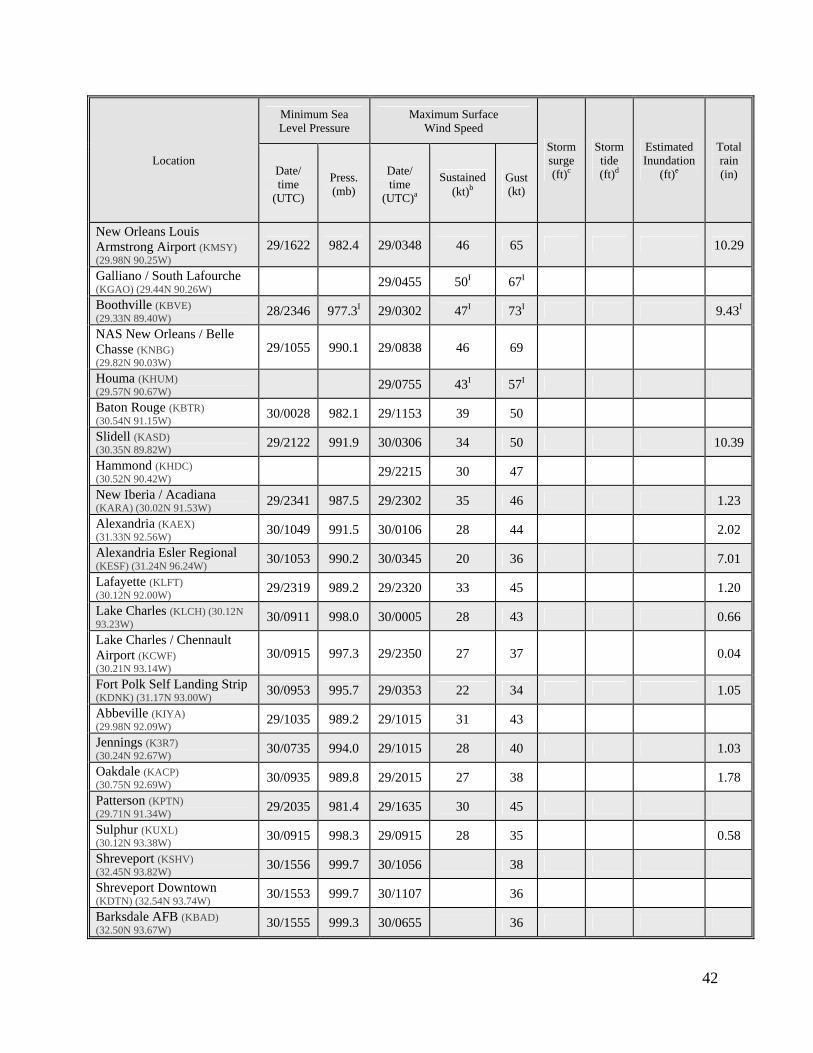
42
Location
Minimum Sea Level Pressure
Maximum Surface Wind Speed
Storm surge (ft)c
Storm tide (ft)d
Estimated Inundation
(ft)e
Total rain (in) Date/
time (UTC)
Press. (mb)
Date/ time
(UTC)a
Sustained (kt)b
Gust (kt)
New Orleans Louis Armstrong Airport (KMSY) (29.98N 90.25W)
29/1622 982.4 29/0348 46 65 10.29
Galliano / South Lafourche (KGAO) (29.44N 90.26W)
29/0455 50I 67I
Boothville (KBVE) (29.33N 89.40W)
28/2346 977.3I 29/0302 47I 73I 9.43I
NAS New Orleans / Belle Chasse (KNBG) (29.82N 90.03W)
29/1055 990.1 29/0838 46 69
Houma (KHUM) (29.57N 90.67W)
29/0755 43I 57I
Baton Rouge (KBTR) (30.54N 91.15W)
30/0028 982.1 29/1153 39 50
Slidell (KASD) (30.35N 89.82W)
29/2122 991.9 30/0306 34 50 10.39
Hammond (KHDC) (30.52N 90.42W)
29/2215 30 47
New Iberia / Acadiana (KARA) (30.02N 91.53W)
29/2341 987.5 29/2302 35 46 1.23
Alexandria (KAEX) (31.33N 92.56W)
30/1049 991.5 30/0106 28 44 2.02
Alexandria Esler Regional (KESF) (31.24N 96.24W)
30/1053 990.2 30/0345 20 36 7.01
Lafayette (KLFT) (30.12N 92.00W)
29/2319 989.2 29/2320 33 45 1.20
Lake Charles (KLCH) (30.12N 93.23W)
30/0911 998.0 30/0005 28 43 0.66
Lake Charles / Chennault Airport (KCWF) (30.21N 93.14W)
30/0915 997.3 29/2350 27 37 0.04
Fort Polk Self Landing Strip (KDNK) (31.17N 93.00W)
30/0953 995.7 29/0353 22 34 1.05
Abbeville (KIYA) (29.98N 92.09W)
29/1035 989.2 29/1015 31 43
Jennings (K3R7) (30.24N 92.67W)
30/0735 994.0 29/1015 28 40 1.03
Oakdale (KACP) (30.75N 92.69W)
30/0935 989.8 29/2015 27 38 1.78
Patterson (KPTN) (29.71N 91.34W)
29/2035 981.4 29/1635 30 45
Sulphur (KUXL) (30.12N 93.38W)
30/0915 998.3 29/0915 28 35 0.58
Shreveport (KSHV) (32.45N 93.82W)
30/1556 999.7 30/1056 38
Shreveport Downtown (KDTN) (32.54N 93.74W)
30/1553 999.7 30/1107 36
Barksdale AFB (KBAD) (32.50N 93.67W)
30/1555 999.3 30/0655 36
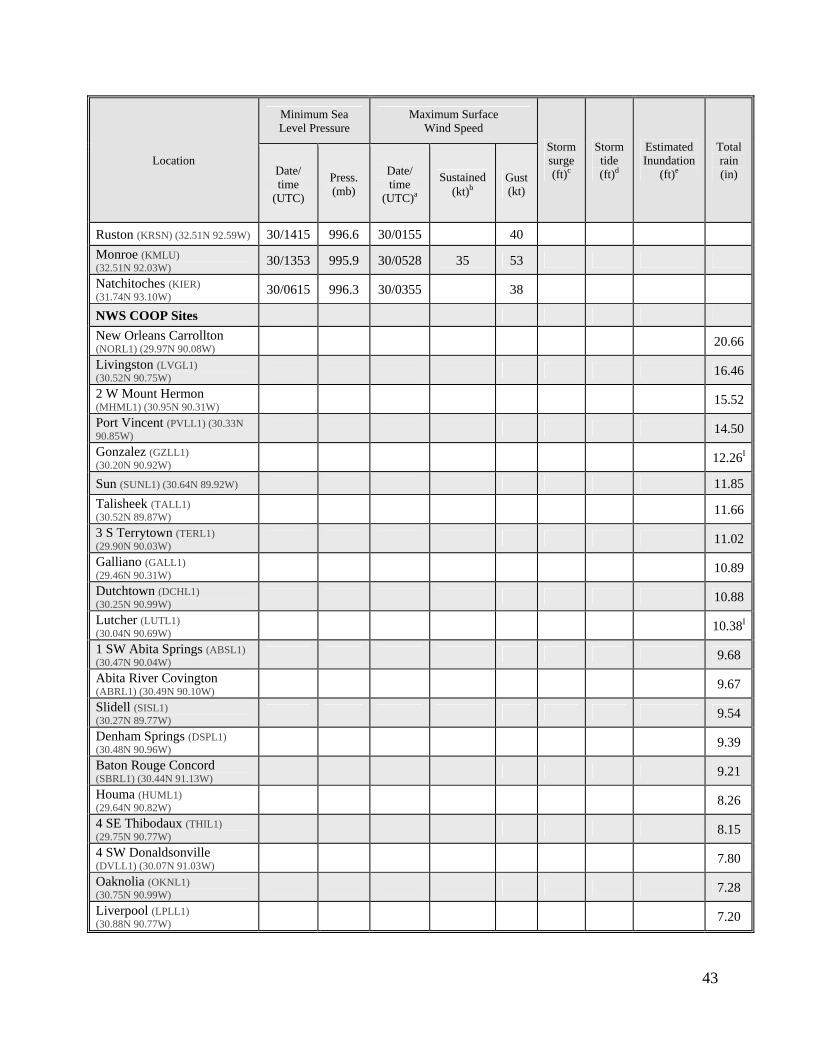
43
Location
Minimum Sea Level Pressure
Maximum Surface Wind Speed
Storm surge (ft)c
Storm tide (ft)d
Estimated Inundation
(ft)e
Total rain (in) Date/
time (UTC)
Press. (mb)
Date/ time
(UTC)a
Sustained (kt)b
Gust (kt)
Ruston (KRSN) (32.51N 92.59W) 30/1415 996.6 30/0155 40
Monroe (KMLU) (32.51N 92.03W)
30/1353 995.9 30/0528 35 53
Natchitoches (KIER) (31.74N 93.10W)
30/0615 996.3 30/0355 38
NWS COOP Sites
New Orleans Carrollton (NORL1) (29.97N 90.08W)
20.66
Livingston (LVGL1) (30.52N 90.75W)
16.46
2 W Mount Hermon (MHML1) (30.95N 90.31W)
15.52
Port Vincent (PVLL1) (30.33N 90.85W)
14.50
Gonzalez (GZLL1) (30.20N 90.92W)
12.26I
Sun (SUNL1) (30.64N 89.92W) 11.85
Talisheek (TALL1) (30.52N 89.87W)
11.66
3 S Terrytown (TERL1) (29.90N 90.03W)
11.02
Galliano (GALL1) (29.46N 90.31W)
10.89
Dutchtown (DCHL1) (30.25N 90.99W)
10.88
Lutcher (LUTL1) (30.04N 90.69W)
10.38I
1 SW Abita Springs (ABSL1) (30.47N 90.04W)
9.68
Abita River Covington (ABRL1) (30.49N 90.10W)
9.67
Slidell (SISL1) (30.27N 89.77W)
9.54
Denham Springs (DSPL1) (30.48N 90.96W)
9.39
Baton Rouge Concord (SBRL1) (30.44N 91.13W)
9.21
Houma (HUML1) (29.64N 90.82W)
8.26
4 SE Thibodaux (THIL1) (29.75N 90.77W)
8.15
4 SW Donaldsonville (DVLL1) (30.07N 91.03W)
7.80
Oaknolia (OKNL1) (30.75N 90.99W)
7.28
Liverpool (LPLL1) (30.88N 90.77W)
7.20
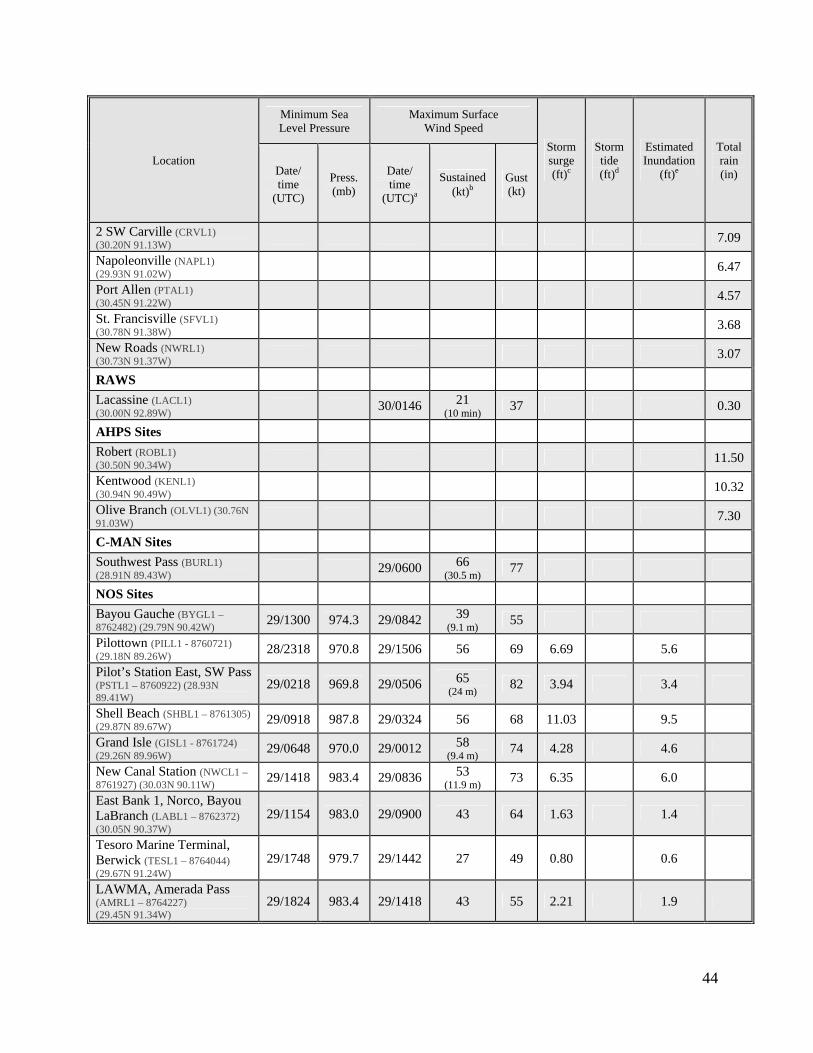
44
Location
Minimum Sea Level Pressure
Maximum Surface Wind Speed
Storm surge (ft)c
Storm tide (ft)d
Estimated Inundation
(ft)e
Total rain (in) Date/
time (UTC)
Press. (mb)
Date/ time
(UTC)a
Sustained (kt)b
Gust (kt)
2 SW Carville (CRVL1) (30.20N 91.13W)
7.09
Napoleonville (NAPL1) (29.93N 91.02W)
6.47
Port Allen (PTAL1) (30.45N 91.22W)
4.57
St. Francisville (SFVL1) (30.78N 91.38W)
3.68
New Roads (NWRL1) (30.73N 91.37W)
3.07
RAWS
Lacassine (LACL1) (30.00N 92.89W)
30/0146 21 (10 min)
37 0.30
AHPS Sites
Robert (ROBL1) (30.50N 90.34W)
11.50
Kentwood (KENL1) (30.94N 90.49W)
10.32
Olive Branch (OLVL1) (30.76N 91.03W)
7.30
C-MAN Sites
Southwest Pass (BURL1) (28.91N 89.43W)
29/0600 66 (30.5 m)
77
NOS Sites
Bayou Gauche (BYGL1 – 8762482) (29.79N 90.42W)
29/1300 974.3 29/0842 39 (9.1 m)
55
Pilottown (PILL1 - 8760721) (29.18N 89.26W)
28/2318 970.8 29/1506 56 69 6.69 5.6
Pilot’s Station East, SW Pass (PSTL1 – 8760922) (28.93N 89.41W)
29/0218 969.8 29/0506 65 (24 m)
82 3.94 3.4
Shell Beach (SHBL1 – 8761305) (29.87N 89.67W)
29/0918 987.8 29/0324 56 68 11.03 9.5
Grand Isle (GISL1 - 8761724) (29.26N 89.96W)
29/0648 970.0 29/0012 58 (9.4 m)
74 4.28 4.6
New Canal Station (NWCL1 – 8761927) (30.03N 90.11W)
29/1418 983.4 29/0836 53 (11.9 m)
73 6.35 6.0
East Bank 1, Norco, Bayou LaBranch (LABL1 – 8762372) (30.05N 90.37W)
29/1154 983.0 29/0900 43 64 1.63 1.4
Tesoro Marine Terminal, Berwick (TESL1 – 8764044) (29.67N 91.24W)
29/1748 979.7 29/1442 27 49 0.80 0.6
LAWMA, Amerada Pass (AMRL1 – 8764227) (29.45N 91.34W)
29/1824 983.4 29/1418 43 55 2.21 1.9
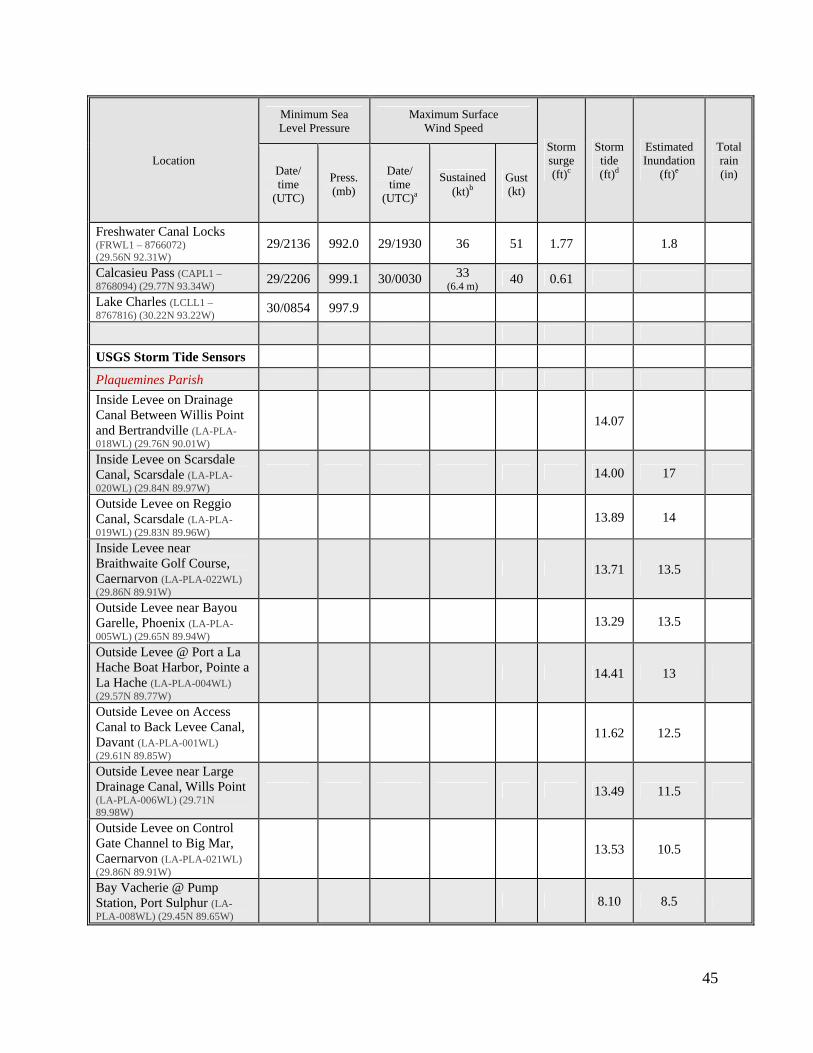
45
Location
Minimum Sea Level Pressure
Maximum Surface Wind Speed
Storm surge (ft)c
Storm tide (ft)d
Estimated Inundation
(ft)e
Total rain (in) Date/
time (UTC)
Press. (mb)
Date/ time
(UTC)a
Sustained (kt)b
Gust (kt)
Freshwater Canal Locks (FRWL1 – 8766072) (29.56N 92.31W)
29/2136 992.0 29/1930 36 51 1.77 1.8
Calcasieu Pass (CAPL1 – 8768094) (29.77N 93.34W)
29/2206 999.1 30/0030 33 (6.4 m)
40 0.61
Lake Charles (LCLL1 – 8767816) (30.22N 93.22W)
30/0854 997.9
USGS Storm Tide Sensors
Plaquemines Parish
Inside Levee on Drainage Canal Between Willis Point and Bertrandville (LA-PLA-018WL) (29.76N 90.01W)
14.07
Inside Levee on Scarsdale Canal, Scarsdale (LA-PLA-020WL) (29.84N 89.97W)
14.00 17
Outside Levee on Reggio Canal, Scarsdale (LA-PLA-019WL) (29.83N 89.96W)
13.89 14
Inside Levee near Braithwaite Golf Course, Caernarvon (LA-PLA-022WL) (29.86N 89.91W)
13.71 13.5
Outside Levee near Bayou Garelle, Phoenix (LA-PLA-005WL) (29.65N 89.94W)
13.29 13.5
Outside Levee @ Port a La Hache Boat Harbor, Pointe a La Hache (LA-PLA-004WL) (29.57N 89.77W)
14.41 13
Outside Levee on Access Canal to Back Levee Canal, Davant (LA-PLA-001WL) (29.61N 89.85W)
11.62 12.5
Outside Levee near Large Drainage Canal, Wills Point (LA-PLA-006WL) (29.71N 89.98W)
13.49 11.5
Outside Levee on Control Gate Channel to Big Mar, Caernarvon (LA-PLA-021WL) (29.86N 89.91W)
13.53 10.5
Bay Vacherie @ Pump Station, Port Sulphur (LA-PLA-008WL) (29.45N 89.65W)
8.10 8.5
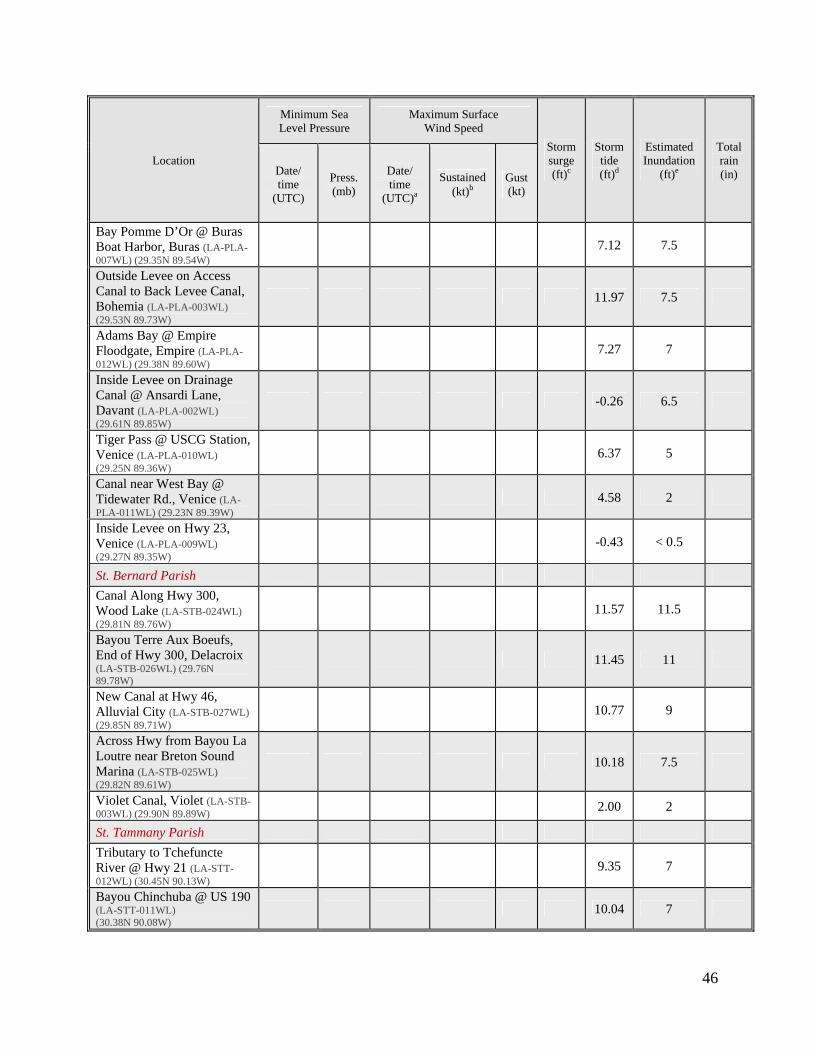
46
Location
Minimum Sea Level Pressure
Maximum Surface Wind Speed
Storm surge (ft)c
Storm tide (ft)d
Estimated Inundation
(ft)e
Total rain (in) Date/
time (UTC)
Press. (mb)
Date/ time
(UTC)a
Sustained (kt)b
Gust (kt)
Bay Pomme D’Or @ Buras Boat Harbor, Buras (LA-PLA-007WL) (29.35N 89.54W)
7.12 7.5
Outside Levee on Access Canal to Back Levee Canal, Bohemia (LA-PLA-003WL) (29.53N 89.73W)
11.97 7.5
Adams Bay @ Empire Floodgate, Empire (LA-PLA-012WL) (29.38N 89.60W)
7.27 7
Inside Levee on Drainage Canal @ Ansardi Lane, Davant (LA-PLA-002WL) (29.61N 89.85W)
-0.26 6.5
Tiger Pass @ USCG Station, Venice (LA-PLA-010WL) (29.25N 89.36W)
6.37 5
Canal near West Bay @ Tidewater Rd., Venice (LA-PLA-011WL) (29.23N 89.39W)
4.58 2
Inside Levee on Hwy 23, Venice (LA-PLA-009WL) (29.27N 89.35W)
-0.43 < 0.5
St. Bernard Parish
Canal Along Hwy 300, Wood Lake (LA-STB-024WL) (29.81N 89.76W)
11.57 11.5
Bayou Terre Aux Boeufs, End of Hwy 300, Delacroix (LA-STB-026WL) (29.76N 89.78W)
11.45 11
New Canal at Hwy 46, Alluvial City (LA-STB-027WL) (29.85N 89.71W)
10.77 9
Across Hwy from Bayou La Loutre near Breton Sound Marina (LA-STB-025WL) (29.82N 89.61W)
10.18 7.5
Violet Canal, Violet (LA-STB-003WL) (29.90N 89.89W)
2.00 2
St. Tammany Parish
Tributary to Tchefuncte River @ Hwy 21 (LA-STT-012WL) (30.45N 90.13W)
9.35 7
Bayou Chinchuba @ US 190 (LA-STT-011WL) (30.38N 90.08W)
10.04 7
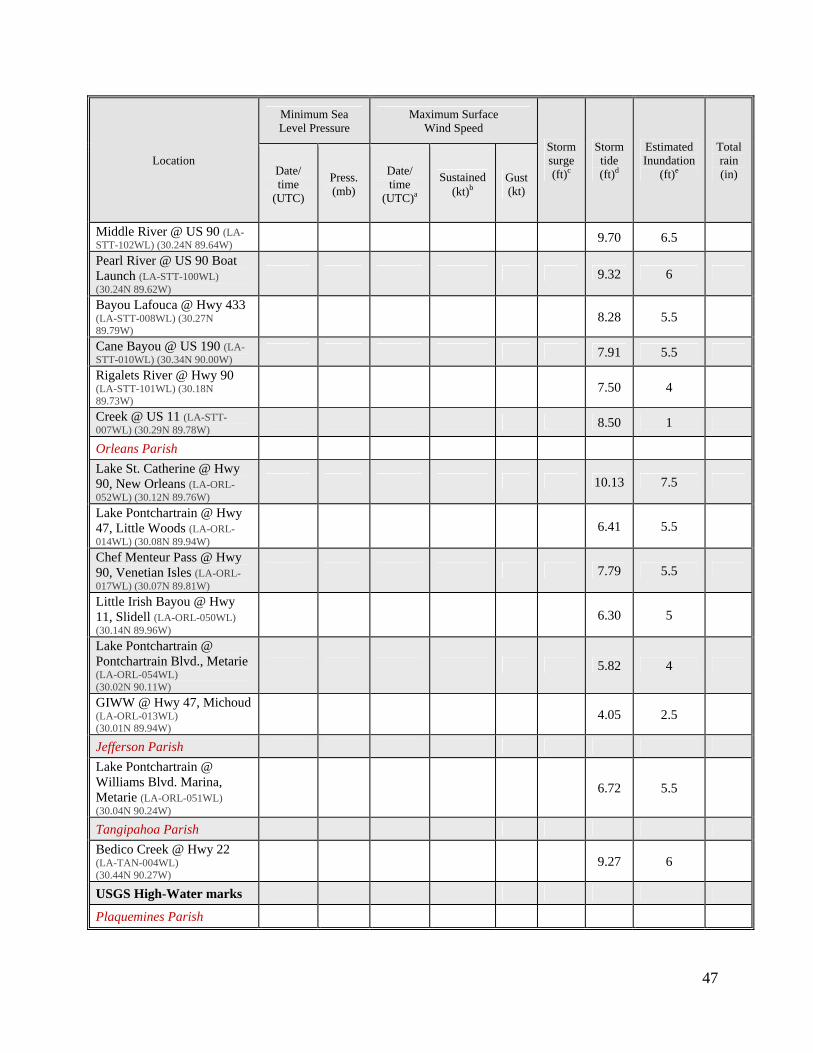
47
Location
Minimum Sea Level Pressure
Maximum Surface Wind Speed
Storm surge (ft)c
Storm tide (ft)d
Estimated Inundation
(ft)e
Total rain (in) Date/
time (UTC)
Press. (mb)
Date/ time
(UTC)a
Sustained (kt)b
Gust (kt)
Middle River @ US 90 (LA-STT-102WL) (30.24N 89.64W)
9.70 6.5
Pearl River @ US 90 Boat Launch (LA-STT-100WL) (30.24N 89.62W)
9.32 6
Bayou Lafouca @ Hwy 433 (LA-STT-008WL) (30.27N 89.79W)
8.28 5.5
Cane Bayou @ US 190 (LA-STT-010WL) (30.34N 90.00W)
7.91 5.5
Rigalets River @ Hwy 90 (LA-STT-101WL) (30.18N 89.73W)
7.50 4
Creek @ US 11 (LA-STT-007WL) (30.29N 89.78W)
8.50 1
Orleans Parish
Lake St. Catherine @ Hwy 90, New Orleans (LA-ORL-052WL) (30.12N 89.76W)
10.13 7.5
Lake Pontchartrain @ Hwy 47, Little Woods (LA-ORL-014WL) (30.08N 89.94W)
6.41 5.5
Chef Menteur Pass @ Hwy 90, Venetian Isles (LA-ORL-017WL) (30.07N 89.81W)
7.79 5.5
Little Irish Bayou @ Hwy 11, Slidell (LA-ORL-050WL) (30.14N 89.96W)
6.30 5
Lake Pontchartrain @ Pontchartrain Blvd., Metarie (LA-ORL-054WL) (30.02N 90.11W)
5.82 4
GIWW @ Hwy 47, Michoud (LA-ORL-013WL) (30.01N 89.94W)
4.05 2.5
Jefferson Parish
Lake Pontchartrain @ Williams Blvd. Marina, Metarie (LA-ORL-051WL) (30.04N 90.24W)
6.72 5.5
Tangipahoa Parish
Bedico Creek @ Hwy 22 (LA-TAN-004WL) (30.44N 90.27W)
9.27 6
USGS High-Water marks
Plaquemines Parish
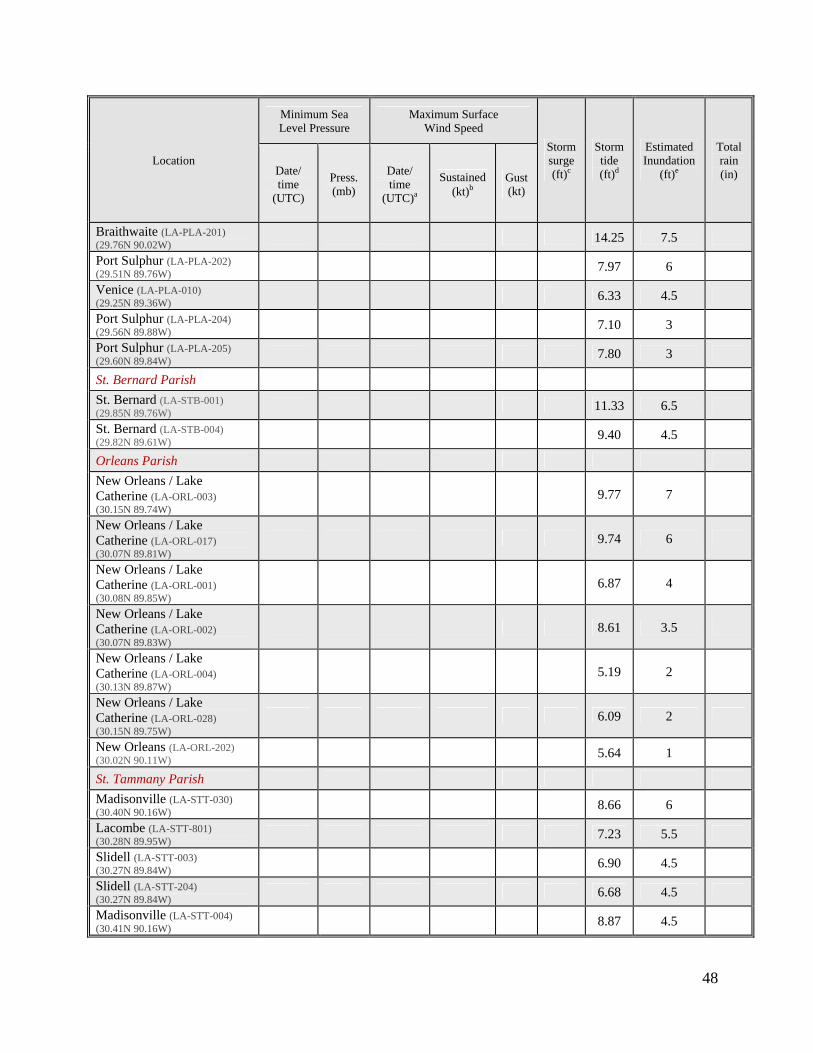
48
Location
Minimum Sea Level Pressure
Maximum Surface Wind Speed
Storm surge (ft)c
Storm tide (ft)d
Estimated Inundation
(ft)e
Total rain (in) Date/
time (UTC)
Press. (mb)
Date/ time
(UTC)a
Sustained (kt)b
Gust (kt)
Braithwaite (LA-PLA-201) (29.76N 90.02W)
14.25 7.5
Port Sulphur (LA-PLA-202) (29.51N 89.76W)
7.97 6
Venice (LA-PLA-010) (29.25N 89.36W)
6.33 4.5
Port Sulphur (LA-PLA-204) (29.56N 89.88W)
7.10 3
Port Sulphur (LA-PLA-205) (29.60N 89.84W)
7.80 3
St. Bernard Parish
St. Bernard (LA-STB-001) (29.85N 89.76W)
11.33 6.5
St. Bernard (LA-STB-004) (29.82N 89.61W)
9.40 4.5
Orleans Parish
New Orleans / Lake Catherine (LA-ORL-003) (30.15N 89.74W)
9.77 7
New Orleans / Lake Catherine (LA-ORL-017) (30.07N 89.81W)
9.74 6
New Orleans / Lake Catherine (LA-ORL-001) (30.08N 89.85W)
6.87 4
New Orleans / Lake Catherine (LA-ORL-002) (30.07N 89.83W)
8.61 3.5
New Orleans / Lake Catherine (LA-ORL-004) (30.13N 89.87W)
5.19 2
New Orleans / Lake Catherine (LA-ORL-028) (30.15N 89.75W)
6.09 2
New Orleans (LA-ORL-202) (30.02N 90.11W)
5.64 1
St. Tammany Parish
Madisonville (LA-STT-030) (30.40N 90.16W)
8.66 6
Lacombe (LA-STT-801) (30.28N 89.95W)
7.23 5.5
Slidell (LA-STT-003) (30.27N 89.84W)
6.90 4.5
Slidell (LA-STT-204) (30.27N 89.84W)
6.68 4.5
Madisonville (LA-STT-004) (30.41N 90.16W)
8.87 4.5
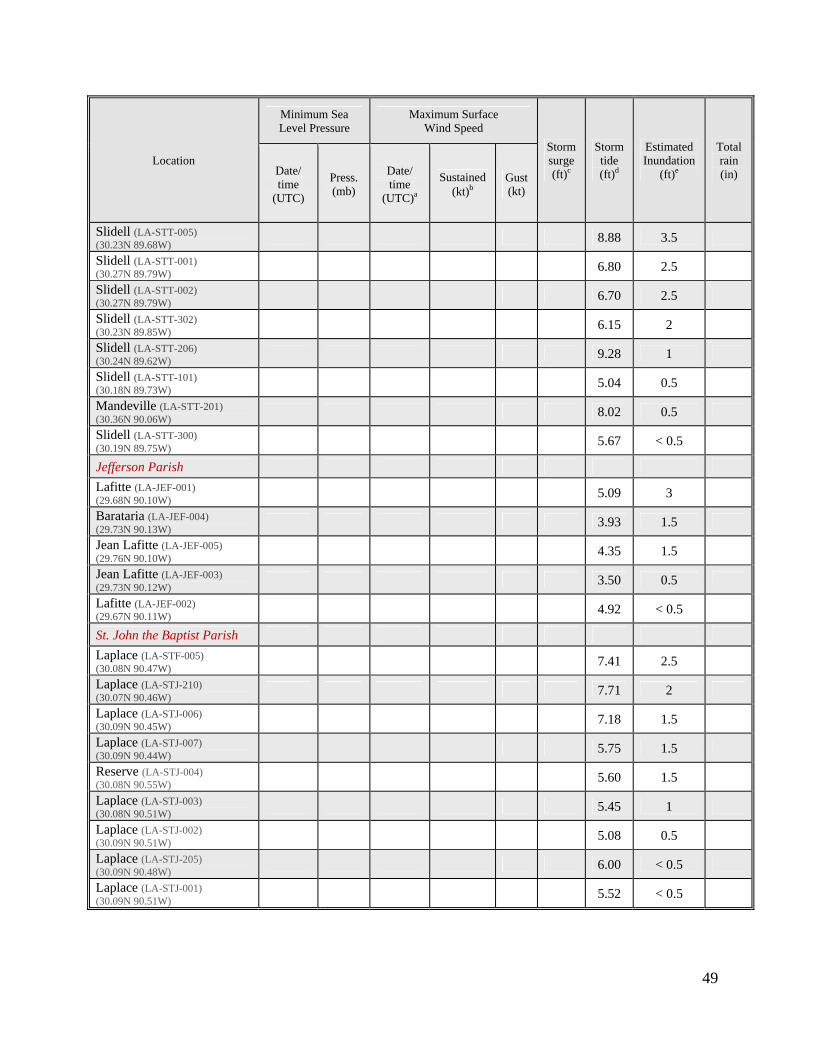
49
Location
Minimum Sea Level Pressure
Maximum Surface Wind Speed
Storm surge (ft)c
Storm tide (ft)d
Estimated Inundation
(ft)e
Total rain (in) Date/
time (UTC)
Press. (mb)
Date/ time
(UTC)a
Sustained (kt)b
Gust (kt)
Slidell (LA-STT-005) (30.23N 89.68W)
8.88 3.5
Slidell (LA-STT-001) (30.27N 89.79W)
6.80 2.5
Slidell (LA-STT-002) (30.27N 89.79W)
6.70 2.5
Slidell (LA-STT-302) (30.23N 89.85W)
6.15 2
Slidell (LA-STT-206) (30.24N 89.62W)
9.28 1
Slidell (LA-STT-101) (30.18N 89.73W)
5.04 0.5
Mandeville (LA-STT-201) (30.36N 90.06W)
8.02 0.5
Slidell (LA-STT-300) (30.19N 89.75W)
5.67 < 0.5
Jefferson Parish
Lafitte (LA-JEF-001) (29.68N 90.10W)
5.09 3
Barataria (LA-JEF-004) (29.73N 90.13W)
3.93 1.5
Jean Lafitte (LA-JEF-005) (29.76N 90.10W)
4.35 1.5
Jean Lafitte (LA-JEF-003) (29.73N 90.12W)
3.50 0.5
Lafitte (LA-JEF-002) (29.67N 90.11W)
4.92 < 0.5
St. John the Baptist Parish
Laplace (LA-STF-005) (30.08N 90.47W)
7.41 2.5
Laplace (LA-STJ-210) (30.07N 90.46W)
7.71 2
Laplace (LA-STJ-006) (30.09N 90.45W)
7.18 1.5
Laplace (LA-STJ-007) (30.09N 90.44W)
5.75 1.5
Reserve (LA-STJ-004) (30.08N 90.55W)
5.60 1.5
Laplace (LA-STJ-003) (30.08N 90.51W)
5.45 1
Laplace (LA-STJ-002) (30.09N 90.51W)
5.08 0.5
Laplace (LA-STJ-205) (30.09N 90.48W)
6.00 < 0.5
Laplace (LA-STJ-001) (30.09N 90.51W)
5.52 < 0.5
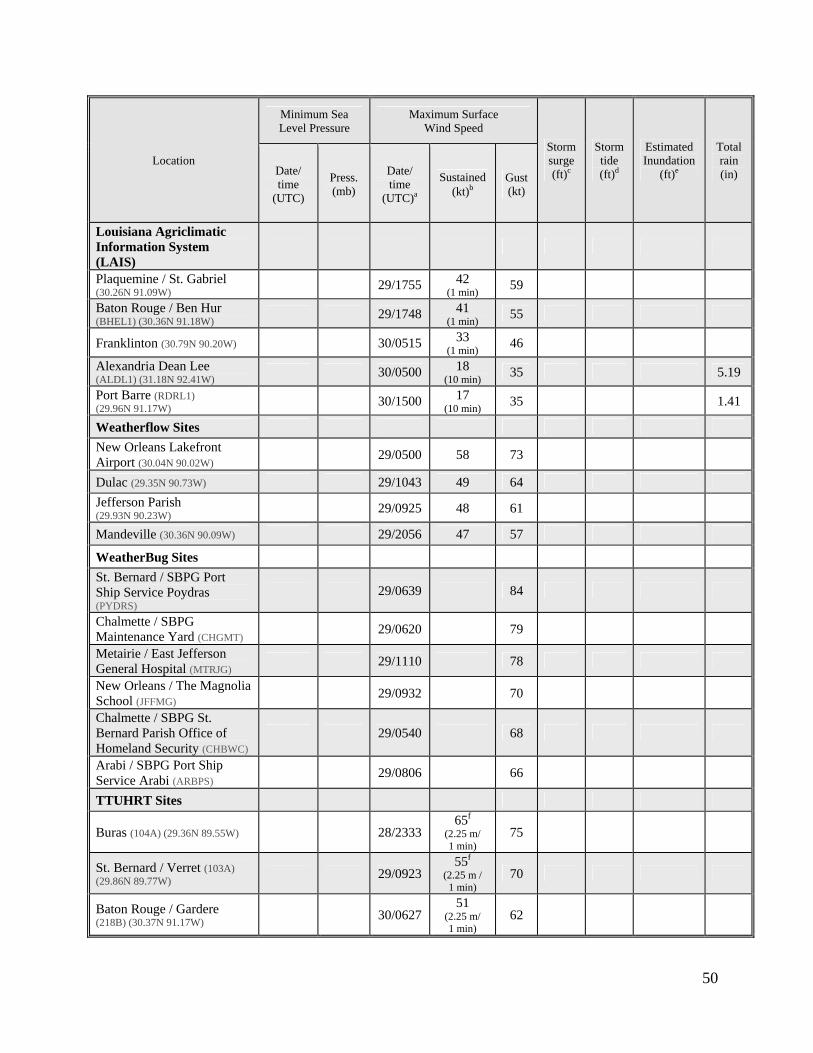
50
Location
Minimum Sea Level Pressure
Maximum Surface Wind Speed
Storm surge (ft)c
Storm tide (ft)d
Estimated Inundation
(ft)e
Total rain (in) Date/
time (UTC)
Press. (mb)
Date/ time
(UTC)a
Sustained (kt)b
Gust (kt)
Louisiana Agriclimatic Information System (LAIS)
Plaquemine / St. Gabriel (30.26N 91.09W)
29/1755 42 (1 min)
59
Baton Rouge / Ben Hur (BHEL1) (30.36N 91.18W)
29/1748 41 (1 min)
55
Franklinton (30.79N 90.20W) 30/0515 33 (1 min)
46
Alexandria Dean Lee (ALDL1) (31.18N 92.41W)
30/0500 18 (10 min)
35 5.19
Port Barre (RDRL1) (29.96N 91.17W)
30/1500 17 (10 min)
35 1.41
Weatherflow Sites
New Orleans Lakefront Airport (30.04N 90.02W)
29/0500 58 73
Dulac (29.35N 90.73W) 29/1043 49 64
Jefferson Parish (29.93N 90.23W)
29/0925 48 61
Mandeville (30.36N 90.09W) 29/2056 47 57
WeatherBug Sites
St. Bernard / SBPG Port Ship Service Poydras (PYDRS)
29/0639 84
Chalmette / SBPG Maintenance Yard (CHGMT)
29/0620 79
Metairie / East Jefferson General Hospital (MTRJG)
29/1110 78
New Orleans / The Magnolia School (JFFMG)
29/0932 70
Chalmette / SBPG St. Bernard Parish Office of Homeland Security (CHBWC)
29/0540 68
Arabi / SBPG Port Ship Service Arabi (ARBPS)
29/0806 66
TTUHRT Sites
Buras (104A) (29.36N 89.55W) 28/2333 65f
(2.25 m/ 1 min)
75
St. Bernard / Verret (103A) (29.86N 89.77W)
29/0923 55f
(2.25 m / 1 min)
70
Baton Rouge / Gardere (218B) (30.37N 91.17W)
30/0627 51
(2.25 m/ 1 min)
62
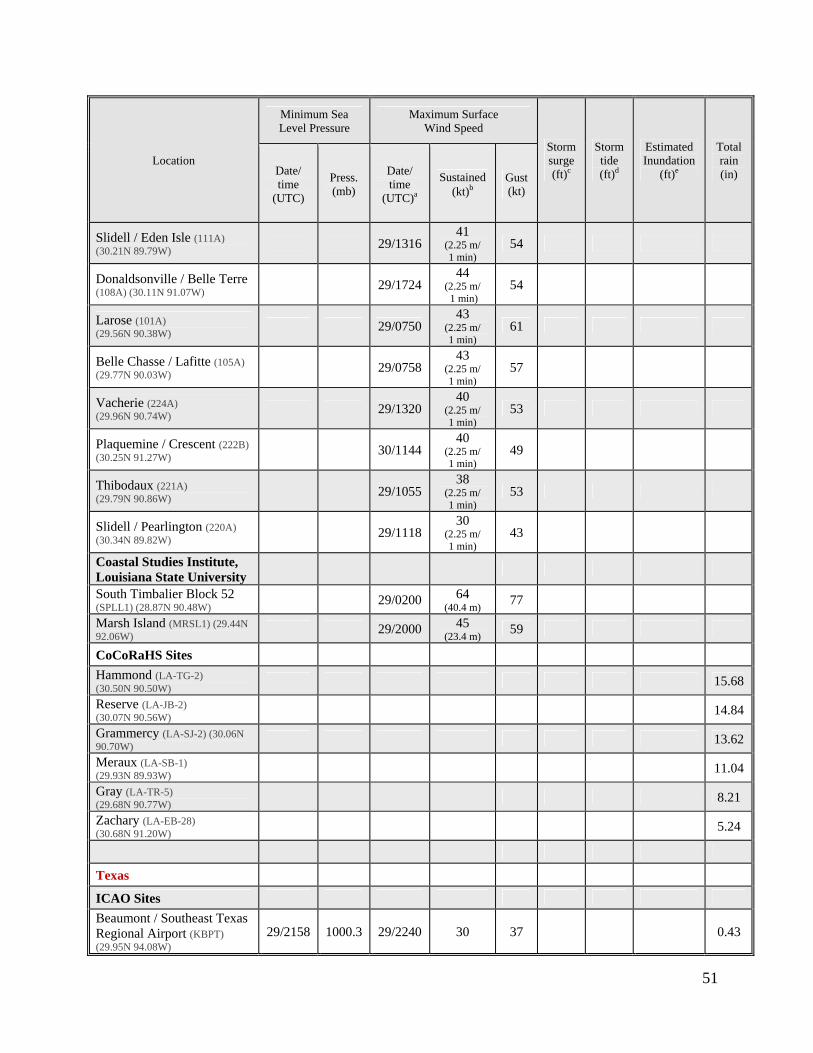
51
Location
Minimum Sea Level Pressure
Maximum Surface Wind Speed
Storm surge (ft)c
Storm tide (ft)d
Estimated Inundation
(ft)e
Total rain (in) Date/
time (UTC)
Press. (mb)
Date/ time
(UTC)a
Sustained (kt)b
Gust (kt)
Slidell / Eden Isle (111A) (30.21N 89.79W)
29/1316 41
(2.25 m/ 1 min)
54
Donaldsonville / Belle Terre (108A) (30.11N 91.07W)
29/1724 44
(2.25 m/ 1 min)
54
Larose (101A) (29.56N 90.38W)
29/0750 43
(2.25 m/ 1 min)
61
Belle Chasse / Lafitte (105A) (29.77N 90.03W)
29/0758 43
(2.25 m/ 1 min)
57
Vacherie (224A) (29.96N 90.74W)
29/1320 40
(2.25 m/ 1 min)
53
Plaquemine / Crescent (222B) (30.25N 91.27W)
30/1144 40
(2.25 m/ 1 min)
49
Thibodaux (221A) (29.79N 90.86W)
29/1055 38
(2.25 m/ 1 min)
53
Slidell / Pearlington (220A) (30.34N 89.82W)
29/1118 30
(2.25 m/ 1 min)
43
Coastal Studies Institute, Louisiana State University
South Timbalier Block 52 (SPLL1) (28.87N 90.48W)
29/0200 64 (40.4 m)
77
Marsh Island (MRSL1) (29.44N 92.06W)
29/2000 45 (23.4 m)
59
CoCoRaHS Sites
Hammond (LA-TG-2) (30.50N 90.50W)
15.68
Reserve (LA-JB-2) (30.07N 90.56W)
14.84
Grammercy (LA-SJ-2) (30.06N 90.70W)
13.62
Meraux (LA-SB-1) (29.93N 89.93W)
11.04
Gray (LA-TR-5) (29.68N 90.77W)
8.21
Zachary (LA-EB-28) (30.68N 91.20W)
5.24
Texas
ICAO Sites
Beaumont / Southeast Texas Regional Airport (KBPT) (29.95N 94.08W)
29/2158 1000.3 29/2240 30 37 0.43
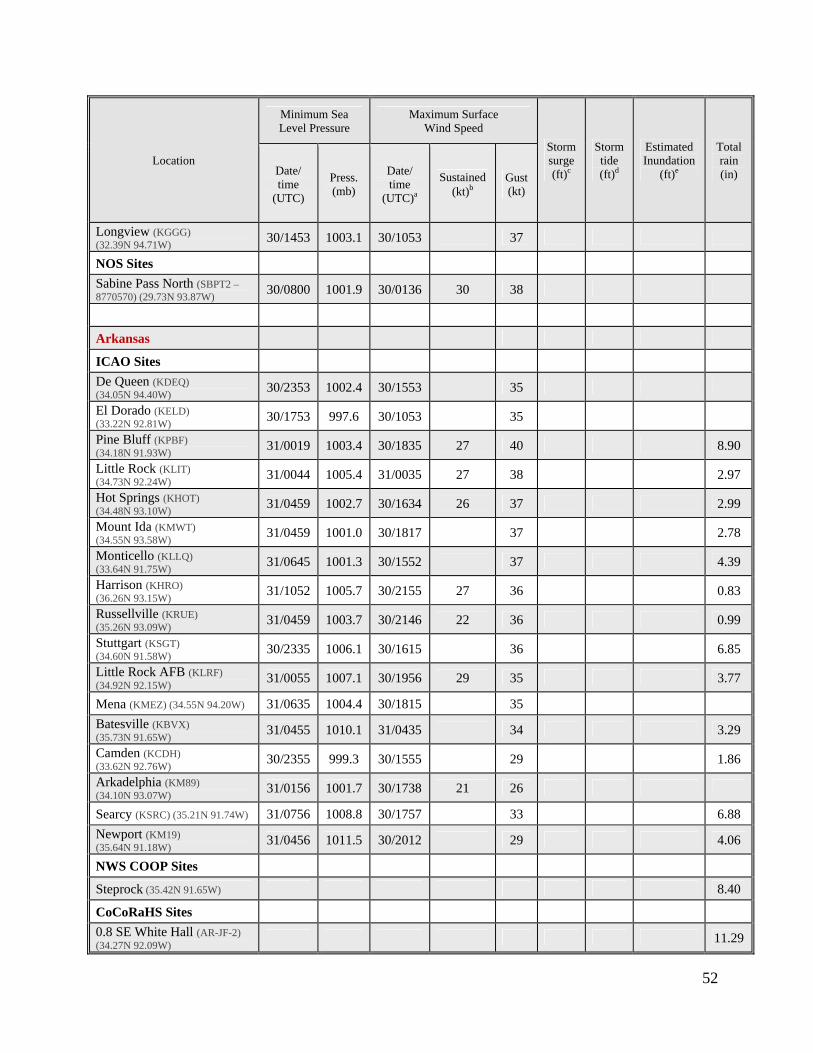
52
Location
Minimum Sea Level Pressure
Maximum Surface Wind Speed
Storm surge (ft)c
Storm tide (ft)d
Estimated Inundation
(ft)e
Total rain (in) Date/
time (UTC)
Press. (mb)
Date/ time
(UTC)a
Sustained (kt)b
Gust (kt)
Longview (KGGG) (32.39N 94.71W)
30/1453 1003.1 30/1053 37
NOS Sites
Sabine Pass North (SBPT2 – 8770570) (29.73N 93.87W)
30/0800 1001.9 30/0136 30 38
Arkansas
ICAO Sites
De Queen (KDEQ) (34.05N 94.40W)
30/2353 1002.4 30/1553 35
El Dorado (KELD) (33.22N 92.81W)
30/1753 997.6 30/1053 35
Pine Bluff (KPBF) (34.18N 91.93W)
31/0019 1003.4 30/1835 27 40 8.90
Little Rock (KLIT) (34.73N 92.24W)
31/0044 1005.4 31/0035 27 38 2.97
Hot Springs (KHOT) (34.48N 93.10W)
31/0459 1002.7 30/1634 26 37 2.99
Mount Ida (KMWT) (34.55N 93.58W)
31/0459 1001.0 30/1817 37 2.78
Monticello (KLLQ) (33.64N 91.75W)
31/0645 1001.3 30/1552 37 4.39
Harrison (KHRO) (36.26N 93.15W)
31/1052 1005.7 30/2155 27 36 0.83
Russellville (KRUE) (35.26N 93.09W)
31/0459 1003.7 30/2146 22 36 0.99
Stuttgart (KSGT) (34.60N 91.58W)
30/2335 1006.1 30/1615 36 6.85
Little Rock AFB (KLRF) (34.92N 92.15W)
31/0055 1007.1 30/1956 29 35 3.77
Mena (KMEZ) (34.55N 94.20W) 31/0635 1004.4 30/1815 35
Batesville (KBVX) (35.73N 91.65W)
31/0455 1010.1 31/0435 34 3.29
Camden (KCDH) (33.62N 92.76W)
30/2355 999.3 30/1555 29 1.86
Arkadelphia (KM89) (34.10N 93.07W)
31/0156 1001.7 30/1738 21 26
Searcy (KSRC) (35.21N 91.74W) 31/0756 1008.8 30/1757 33 6.88
Newport (KM19) (35.64N 91.18W)
31/0456 1011.5 30/2012 29 4.06
NWS COOP Sites
Steprock (35.42N 91.65W) 8.40
CoCoRaHS Sites
0.8 SE White Hall (AR-JF-2) (34.27N 92.09W)
11.29
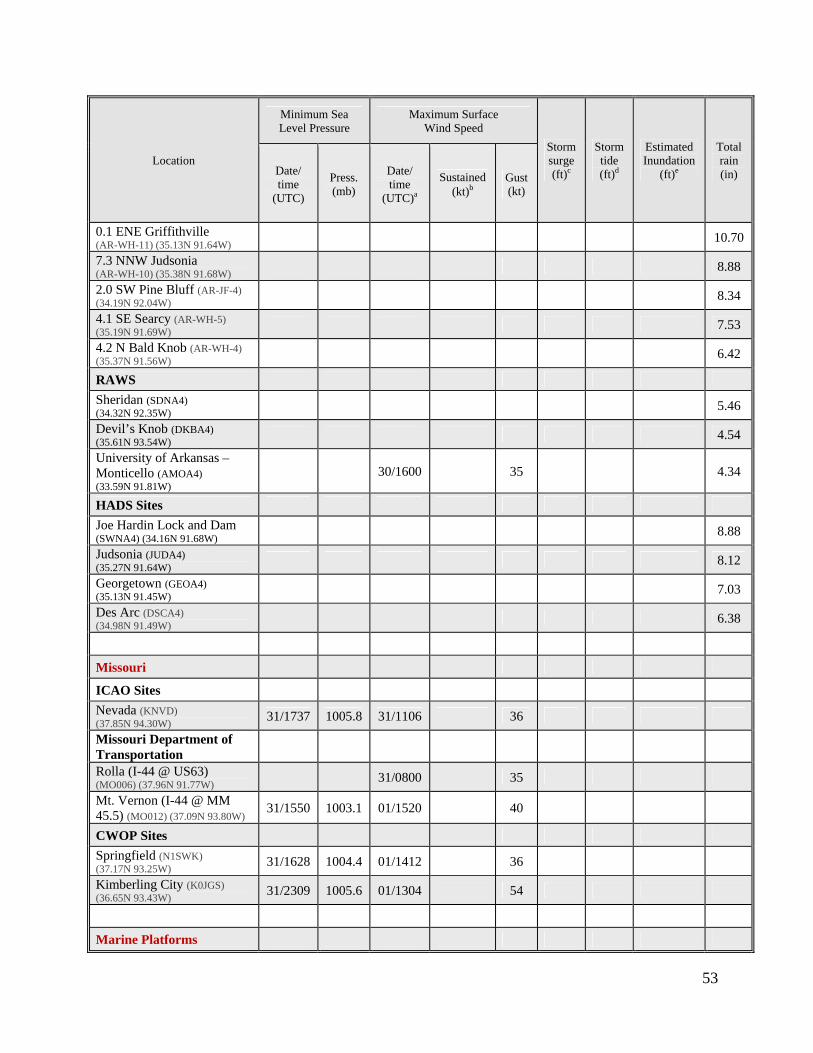
53
Location
Minimum Sea Level Pressure
Maximum Surface Wind Speed
Storm surge (ft)c
Storm tide (ft)d
Estimated Inundation
(ft)e
Total rain (in) Date/
time (UTC)
Press. (mb)
Date/ time
(UTC)a
Sustained (kt)b
Gust (kt)
0.1 ENE Griffithville (AR-WH-11) (35.13N 91.64W)
10.70
7.3 NNW Judsonia (AR-WH-10) (35.38N 91.68W)
8.88
2.0 SW Pine Bluff (AR-JF-4) (34.19N 92.04W)
8.34
4.1 SE Searcy (AR-WH-5) (35.19N 91.69W)
7.53
4.2 N Bald Knob (AR-WH-4) (35.37N 91.56W)
6.42
RAWS
Sheridan (SDNA4) (34.32N 92.35W)
5.46
Devil’s Knob (DKBA4) (35.61N 93.54W)
4.54
University of Arkansas – Monticello (AMOA4) (33.59N 91.81W)
30/1600 35 4.34
HADS Sites
Joe Hardin Lock and Dam (SWNA4) (34.16N 91.68W)
8.88
Judsonia (JUDA4) (35.27N 91.64W)
8.12
Georgetown (GEOA4) (35.13N 91.45W)
7.03
Des Arc (DSCA4) (34.98N 91.49W)
6.38
Missouri
ICAO Sites
Nevada (KNVD) (37.85N 94.30W)
31/1737 1005.8 31/1106 36
Missouri Department of Transportation
Rolla (I-44 @ US63) (MO006) (37.96N 91.77W)
31/0800 35
Mt. Vernon (I-44 @ MM 45.5) (MO012) (37.09N 93.80W)
31/1550 1003.1 01/1520 40
CWOP Sites
Springfield (N1SWK) (37.17N 93.25W)
31/1628 1004.4 01/1412 36
Kimberling City (K0JGS) (36.65N 93.43W)
31/2309 1005.6 01/1304 54
Marine Platforms
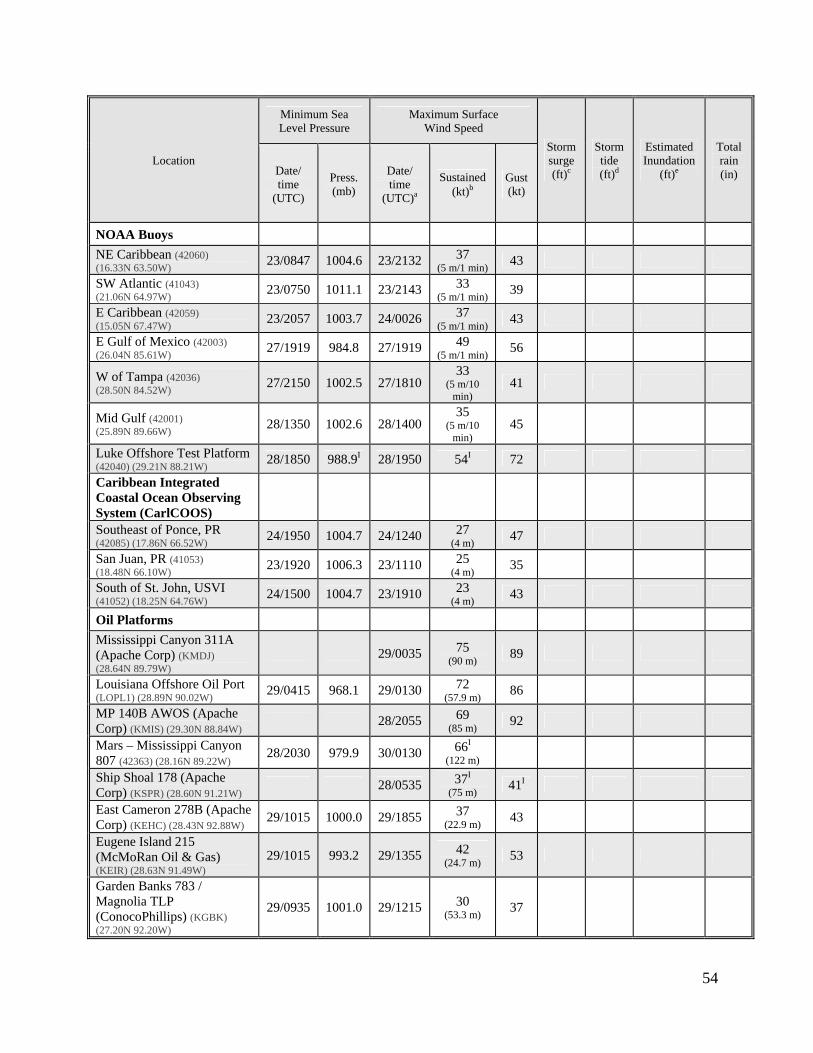
54
Location
Minimum Sea Level Pressure
Maximum Surface Wind Speed
Storm surge (ft)c
Storm tide (ft)d
Estimated Inundation
(ft)e
Total rain (in) Date/
time (UTC)
Press. (mb)
Date/ time
(UTC)a
Sustained (kt)b
Gust (kt)
NOAA Buoys
NE Caribbean (42060) (16.33N 63.50W) 23/0847 1004.6 23/2132 37
(5 m/1 min) 43
SW Atlantic (41043) (21.06N 64.97W) 23/0750 1011.1 23/2143 33
(5 m/1 min) 39
E Caribbean (42059) (15.05N 67.47W) 23/2057 1003.7 24/0026 37
(5 m/1 min) 43
E Gulf of Mexico (42003) (26.04N 85.61W)
27/1919 984.8 27/1919 49 (5 m/1 min)
56
W of Tampa (42036) (28.50N 84.52W)
27/2150 1002.5 27/1810 33
(5 m/10 min)
41
Mid Gulf (42001) (25.89N 89.66W)
28/1350 1002.6 28/1400 35
(5 m/10 min)
45
Luke Offshore Test Platform (42040) (29.21N 88.21W)
28/1850 988.9I 28/1950 54I 72
Caribbean Integrated Coastal Ocean Observing System (CarlCOOS)
Southeast of Ponce, PR (42085) (17.86N 66.52W)
24/1950 1004.7 24/1240 27 (4 m)
47
San Juan, PR (41053) (18.48N 66.10W)
23/1920 1006.3 23/1110 25 (4 m)
35
South of St. John, USVI (41052) (18.25N 64.76W)
24/1500 1004.7 23/1910 23 (4 m)
43
Oil Platforms
Mississippi Canyon 311A (Apache Corp) (KMDJ) (28.64N 89.79W)
29/0035 75 (90 m)
89
Louisiana Offshore Oil Port (LOPL1) (28.89N 90.02W)
29/0415 968.1 29/0130 72 (57.9 m)
86
MP 140B AWOS (Apache Corp) (KMIS) (29.30N 88.84W)
28/2055 69 (85 m)
92
Mars – Mississippi Canyon 807 (42363) (28.16N 89.22W)
28/2030 979.9 30/0130 66I (122 m)
Ship Shoal 178 (Apache Corp) (KSPR) (28.60N 91.21W)
28/0535 37I
(75 m) 41I
East Cameron 278B (Apache Corp) (KEHC) (28.43N 92.88W)
29/1015 1000.0 29/1855 37 (22.9 m)
43
Eugene Island 215 (McMoRan Oil & Gas) (KEIR) (28.63N 91.49W)
29/1015 993.2 29/1355 42 (24.7 m)
53
Garden Banks 783 / Magnolia TLP (ConocoPhillips) (KGBK) (27.20N 92.20W)
29/0935 1001.0 29/1215 30 (53.3 m)
37
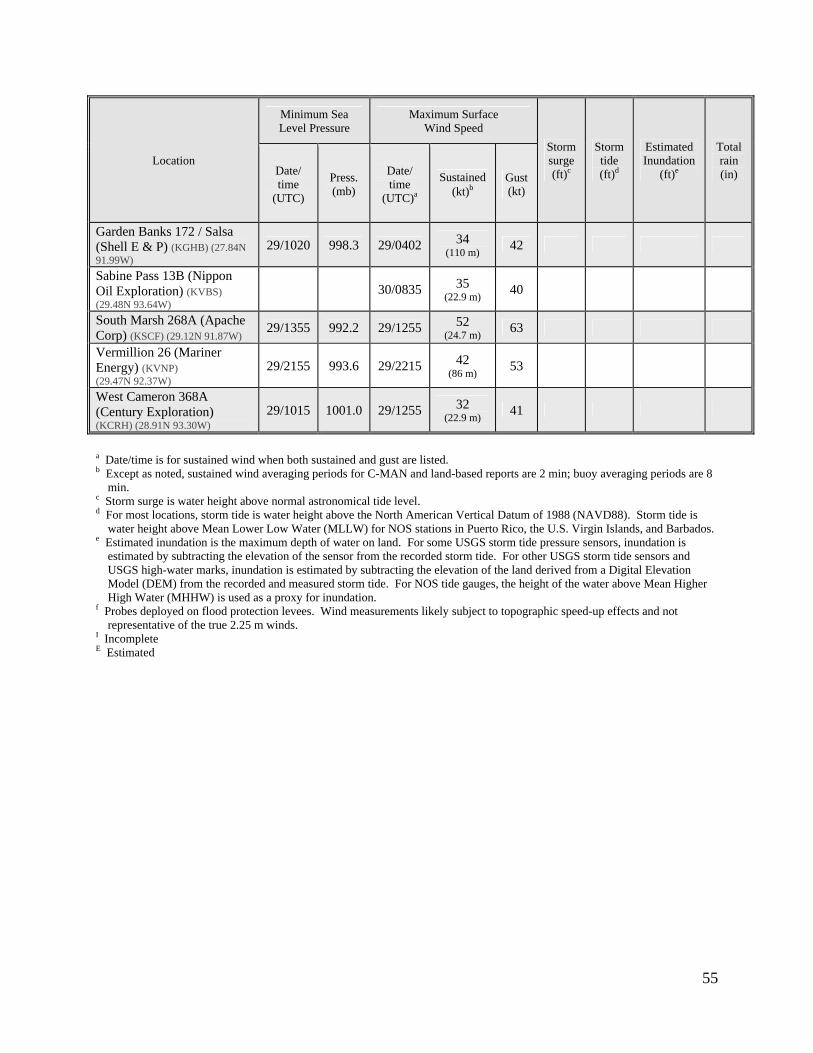
55
Location
Minimum Sea Level Pressure
Maximum Surface Wind Speed
Storm surge (ft)c
Storm tide (ft)d
Estimated Inundation
(ft)e
Total rain (in) Date/
time (UTC)
Press. (mb)
Date/ time
(UTC)a
Sustained (kt)b
Gust (kt)
Garden Banks 172 / Salsa (Shell E & P) (KGHB) (27.84N 91.99W)
29/1020 998.3 29/0402 34 (110 m)
42
Sabine Pass 13B (Nippon Oil Exploration) (KVBS) (29.48N 93.64W)
30/0835 35 (22.9 m)
40
South Marsh 268A (Apache Corp) (KSCF) (29.12N 91.87W)
29/1355 992.2 29/1255 52 (24.7 m)
63
Vermillion 26 (Mariner Energy) (KVNP) (29.47N 92.37W)
29/2155 993.6 29/2215 42 (86 m)
53
West Cameron 368A (Century Exploration) (KCRH) (28.91N 93.30W)
29/1015 1001.0 29/1255 32 (22.9 m)
41
a Date/time is for sustained wind when both sustained and gust are listed. b Except as noted, sustained wind averaging periods for C-MAN and land-based reports are 2 min; buoy averaging periods are 8
min. c Storm surge is water height above normal astronomical tide level. d For most locations, storm tide is water height above the North American Vertical Datum of 1988 (NAVD88). Storm tide is
water height above Mean Lower Low Water (MLLW) for NOS stations in Puerto Rico, the U.S. Virgin Islands, and Barbados. e Estimated inundation is the maximum depth of water on land. For some USGS storm tide pressure sensors, inundation is
estimated by subtracting the elevation of the sensor from the recorded storm tide. For other USGS storm tide sensors and USGS high-water marks, inundation is estimated by subtracting the elevation of the land derived from a Digital Elevation Model (DEM) from the recorded and measured storm tide. For NOS tide gauges, the height of the water above Mean Higher High Water (MHHW) is used as a proxy for inundation.
f Probes deployed on flood protection levees. Wind measurements likely subject to topographic speed-up effects and not representative of the true 2.25 m winds.
I Incomplete E Estimated
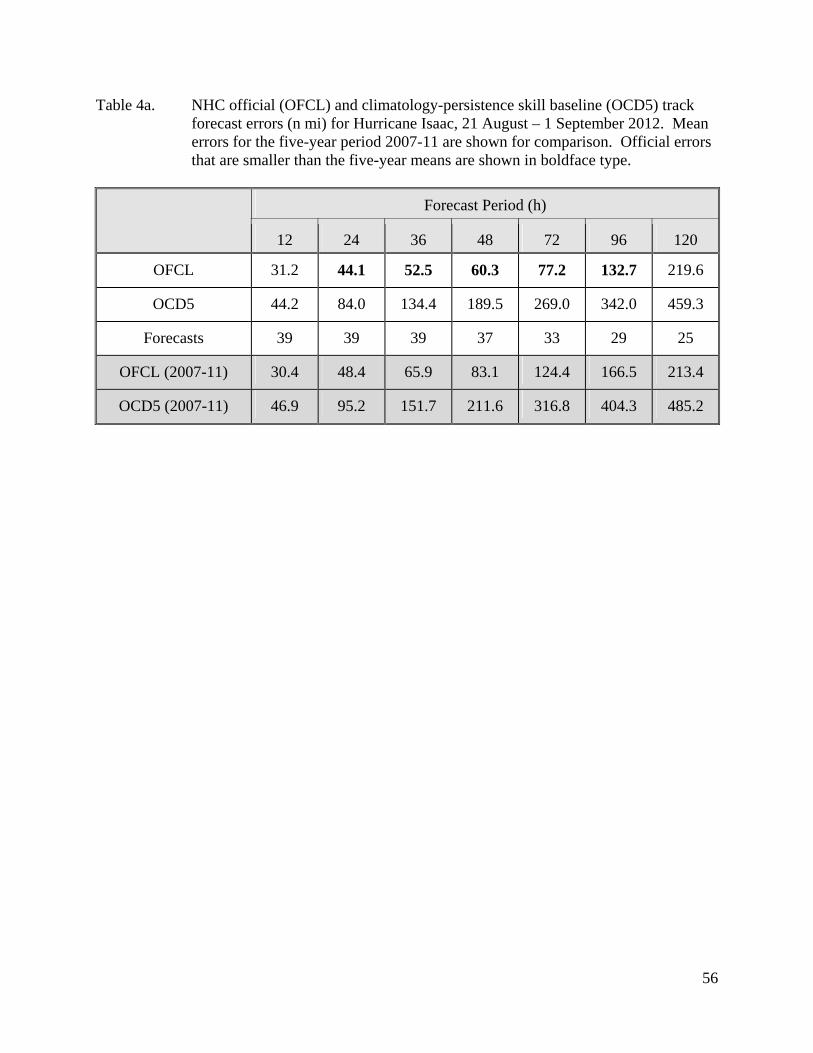
56
Table 4a. NHC official (OFCL) and climatology-persistence skill baseline (OCD5) track forecast errors (n mi) for Hurricane Isaac, 21 August – 1 September 2012. Mean errors for the five-year period 2007-11 are shown for comparison. Official errors that are smaller than the five-year means are shown in boldface type.
Forecast Period (h)
12 24 36 48 72 96 120
OFCL 31.2 44.1 52.5 60.3 77.2 132.7 219.6
OCD5 44.2 84.0 134.4 189.5 269.0 342.0 459.3
Forecasts 39 39 39 37 33 29 25
OFCL (2007-11) 30.4 48.4 65.9 83.1 124.4 166.5 213.4
OCD5 (2007-11) 46.9 95.2 151.7 211.6 316.8 404.3 485.2
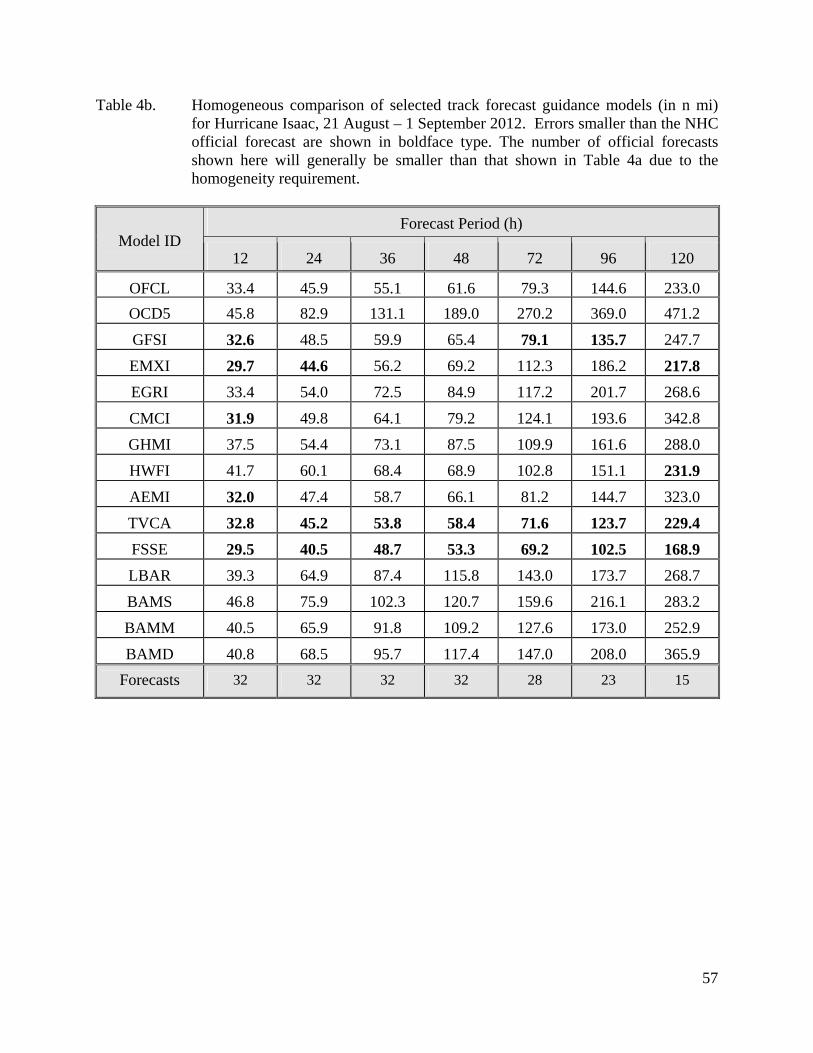
57
Table 4b. Homogeneous comparison of selected track forecast guidance models (in n mi) for Hurricane Isaac, 21 August – 1 September 2012. Errors smaller than the NHC official forecast are shown in boldface type. The number of official forecasts shown here will generally be smaller than that shown in Table 4a due to the homogeneity requirement.
Model ID Forecast Period (h)
12 24 36 48 72 96 120
OFCL 33.4 45.9 55.1 61.6 79.3 144.6 233.0
OCD5 45.8 82.9 131.1 189.0 270.2 369.0 471.2
GFSI 32.6 48.5 59.9 65.4 79.1 135.7 247.7
EMXI 29.7 44.6 56.2 69.2 112.3 186.2 217.8
EGRI 33.4 54.0 72.5 84.9 117.2 201.7 268.6
CMCI 31.9 49.8 64.1 79.2 124.1 193.6 342.8
GHMI 37.5 54.4 73.1 87.5 109.9 161.6 288.0
HWFI 41.7 60.1 68.4 68.9 102.8 151.1 231.9
AEMI 32.0 47.4 58.7 66.1 81.2 144.7 323.0
TVCA 32.8 45.2 53.8 58.4 71.6 123.7 229.4
FSSE 29.5 40.5 48.7 53.3 69.2 102.5 168.9
LBAR 39.3 64.9 87.4 115.8 143.0 173.7 268.7
BAMS 46.8 75.9 102.3 120.7 159.6 216.1 283.2
BAMM 40.5 65.9 91.8 109.2 127.6 173.0 252.9
BAMD 40.8 68.5 95.7 117.4 147.0 208.0 365.9
Forecasts 32 32 32 32 28 23 15
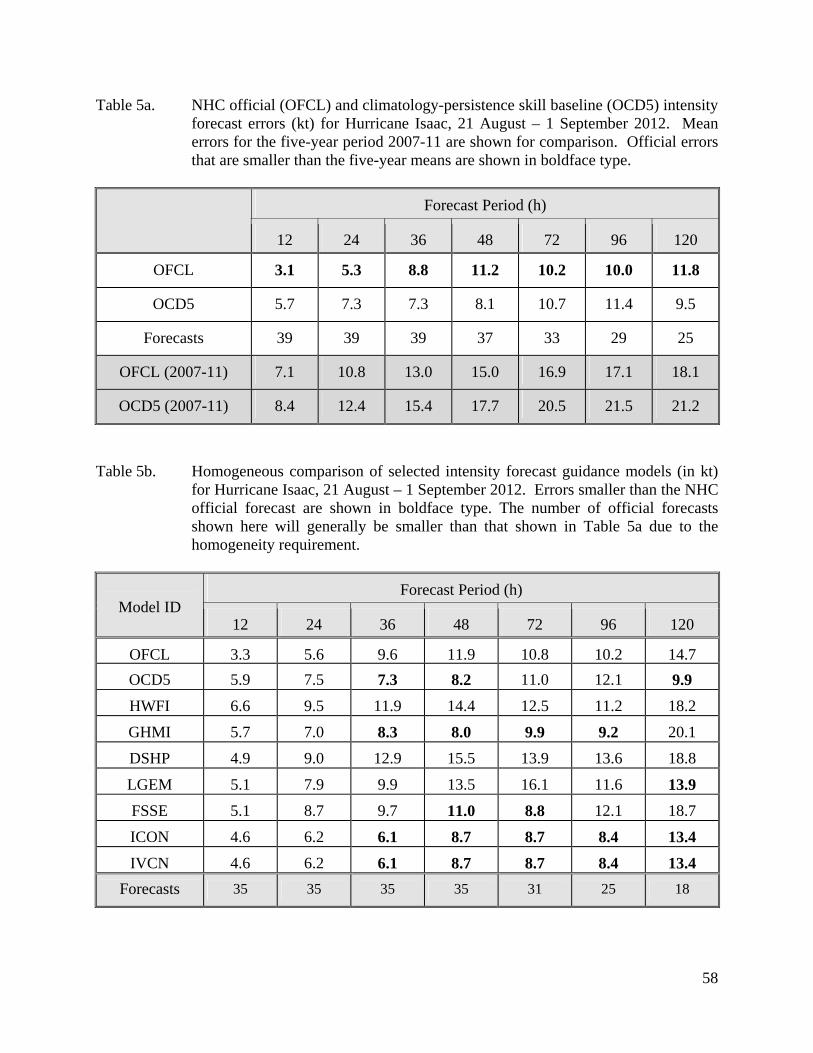
58
Table 5a. NHC official (OFCL) and climatology-persistence skill baseline (OCD5) intensity forecast errors (kt) for Hurricane Isaac, 21 August – 1 September 2012. Mean errors for the five-year period 2007-11 are shown for comparison. Official errors that are smaller than the five-year means are shown in boldface type.
Forecast Period (h)
12 24 36 48 72 96 120
OFCL 3.1 5.3 8.8 11.2 10.2 10.0 11.8
OCD5 5.7 7.3 7.3 8.1 10.7 11.4 9.5
Forecasts 39 39 39 37 33 29 25
OFCL (2007-11) 7.1 10.8 13.0 15.0 16.9 17.1 18.1
OCD5 (2007-11) 8.4 12.4 15.4 17.7 20.5 21.5 21.2
Table 5b. Homogeneous comparison of selected intensity forecast guidance models (in kt)
for Hurricane Isaac, 21 August – 1 September 2012. Errors smaller than the NHC official forecast are shown in boldface type. The number of official forecasts shown here will generally be smaller than that shown in Table 5a due to the homogeneity requirement.
Model ID Forecast Period (h)
12 24 36 48 72 96 120
OFCL 3.3 5.6 9.6 11.9 10.8 10.2 14.7
OCD5 5.9 7.5 7.3 8.2 11.0 12.1 9.9
HWFI 6.6 9.5 11.9 14.4 12.5 11.2 18.2
GHMI 5.7 7.0 8.3 8.0 9.9 9.2 20.1
DSHP 4.9 9.0 12.9 15.5 13.9 13.6 18.8
LGEM 5.1 7.9 9.9 13.5 16.1 11.6 13.9
FSSE 5.1 8.7 9.7 11.0 8.8 12.1 18.7
ICON 4.6 6.2 6.1 8.7 8.7 8.4 13.4
IVCN 4.6 6.2 6.1 8.7 8.7 8.4 13.4
Forecasts 35 35 35 35 31 25 18
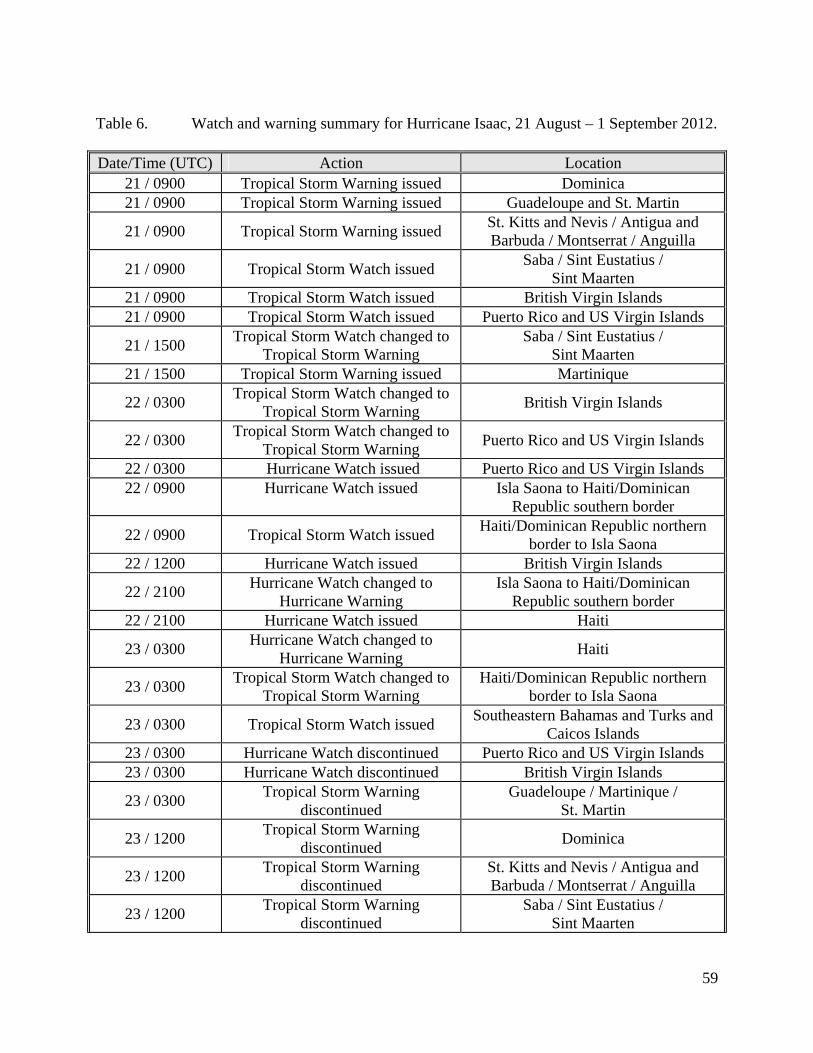
59
Table 6. Watch and warning summary for Hurricane Isaac, 21 August – 1 September 2012. Date/Time (UTC) Action Location
21 / 0900 Tropical Storm Warning issued Dominica 21 / 0900 Tropical Storm Warning issued Guadeloupe and St. Martin
21 / 0900 Tropical Storm Warning issued St. Kitts and Nevis / Antigua and Barbuda / Montserrat / Anguilla
21 / 0900 Tropical Storm Watch issued Saba / Sint Eustatius /
Sint Maarten 21 / 0900 Tropical Storm Watch issued British Virgin Islands 21 / 0900 Tropical Storm Watch issued Puerto Rico and US Virgin Islands
21 / 1500 Tropical Storm Watch changed to
Tropical Storm Warning Saba / Sint Eustatius /
Sint Maarten 21 / 1500 Tropical Storm Warning issued Martinique
22 / 0300 Tropical Storm Watch changed to
Tropical Storm Warning British Virgin Islands
22 / 0300 Tropical Storm Watch changed to
Tropical Storm Warning Puerto Rico and US Virgin Islands
22 / 0300 Hurricane Watch issued Puerto Rico and US Virgin Islands 22 / 0900 Hurricane Watch issued Isla Saona to Haiti/Dominican
Republic southern border
22 / 0900 Tropical Storm Watch issued Haiti/Dominican Republic northern
border to Isla Saona 22 / 1200 Hurricane Watch issued British Virgin Islands
22 / 2100 Hurricane Watch changed to
Hurricane Warning Isla Saona to Haiti/Dominican
Republic southern border 22 / 2100 Hurricane Watch issued Haiti
23 / 0300 Hurricane Watch changed to
Hurricane Warning Haiti
23 / 0300 Tropical Storm Watch changed to
Tropical Storm Warning Haiti/Dominican Republic northern
border to Isla Saona
23 / 0300 Tropical Storm Watch issued Southeastern Bahamas and Turks and
Caicos Islands 23 / 0300 Hurricane Watch discontinued Puerto Rico and US Virgin Islands 23 / 0300 Hurricane Watch discontinued British Virgin Islands
23 / 0300 Tropical Storm Warning
discontinued Guadeloupe / Martinique /
St. Martin
23 / 1200 Tropical Storm Warning
discontinued Dominica
23 / 1200 Tropical Storm Warning
discontinued St. Kitts and Nevis / Antigua and Barbuda / Montserrat / Anguilla
23 / 1200 Tropical Storm Warning
discontinued Saba / Sint Eustatius /
Sint Maarten
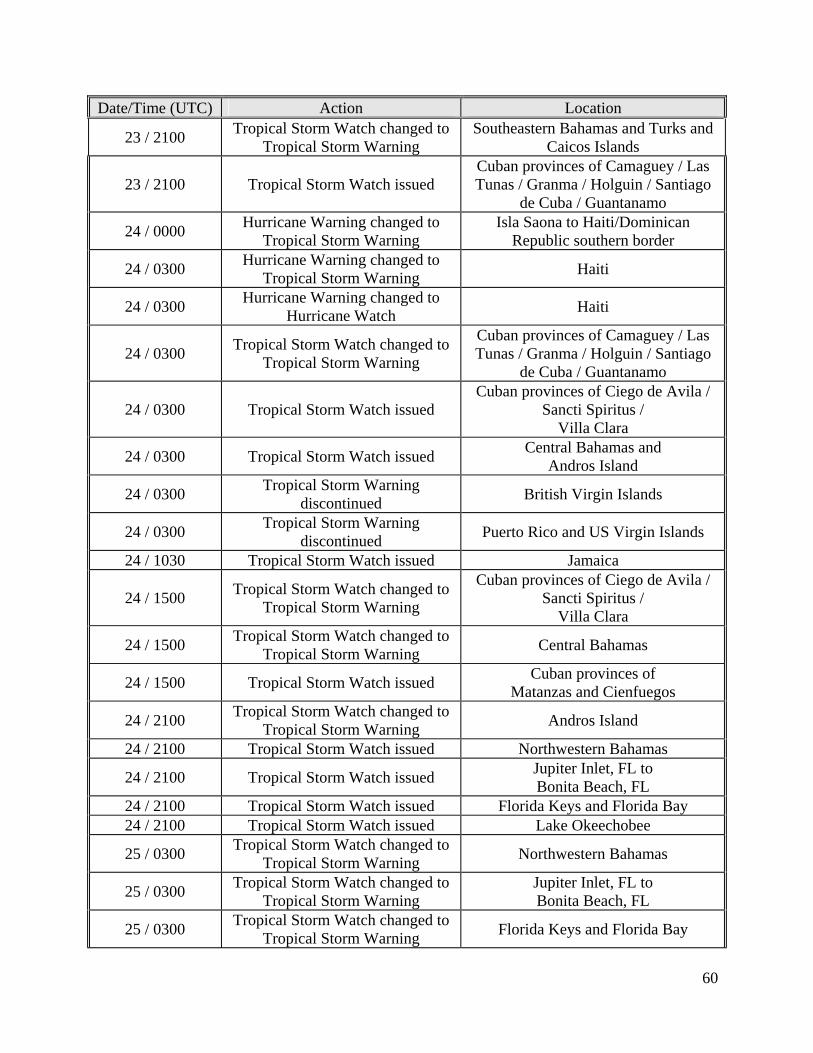
60
Date/Time (UTC) Action Location
23 / 2100 Tropical Storm Watch changed to
Tropical Storm Warning Southeastern Bahamas and Turks and
Caicos Islands
23 / 2100 Tropical Storm Watch issued Cuban provinces of Camaguey / Las Tunas / Granma / Holguin / Santiago
de Cuba / Guantanamo
24 / 0000 Hurricane Warning changed to
Tropical Storm Warning Isla Saona to Haiti/Dominican
Republic southern border
24 / 0300 Hurricane Warning changed to
Tropical Storm Warning Haiti
24 / 0300 Hurricane Warning changed to
Hurricane Watch Haiti
24 / 0300 Tropical Storm Watch changed to
Tropical Storm Warning
Cuban provinces of Camaguey / Las Tunas / Granma / Holguin / Santiago
de Cuba / Guantanamo
24 / 0300 Tropical Storm Watch issued Cuban provinces of Ciego de Avila /
Sancti Spiritus / Villa Clara
24 / 0300 Tropical Storm Watch issued Central Bahamas and
Andros Island
24 / 0300 Tropical Storm Warning
discontinued British Virgin Islands
24 / 0300 Tropical Storm Warning
discontinued Puerto Rico and US Virgin Islands
24 / 1030 Tropical Storm Watch issued Jamaica
24 / 1500 Tropical Storm Watch changed to
Tropical Storm Warning
Cuban provinces of Ciego de Avila / Sancti Spiritus /
Villa Clara
24 / 1500 Tropical Storm Watch changed to
Tropical Storm Warning Central Bahamas
24 / 1500 Tropical Storm Watch issued Cuban provinces of
Matanzas and Cienfuegos
24 / 2100 Tropical Storm Watch changed to
Tropical Storm Warning Andros Island
24 / 2100 Tropical Storm Watch issued Northwestern Bahamas
24 / 2100 Tropical Storm Watch issued Jupiter Inlet, FL to Bonita Beach, FL
24 / 2100 Tropical Storm Watch issued Florida Keys and Florida Bay 24 / 2100 Tropical Storm Watch issued Lake Okeechobee
25 / 0300 Tropical Storm Watch changed to
Tropical Storm Warning Northwestern Bahamas
25 / 0300 Tropical Storm Watch changed to
Tropical Storm Warning Jupiter Inlet, FL to Bonita Beach, FL
25 / 0300 Tropical Storm Watch changed to
Tropical Storm Warning Florida Keys and Florida Bay
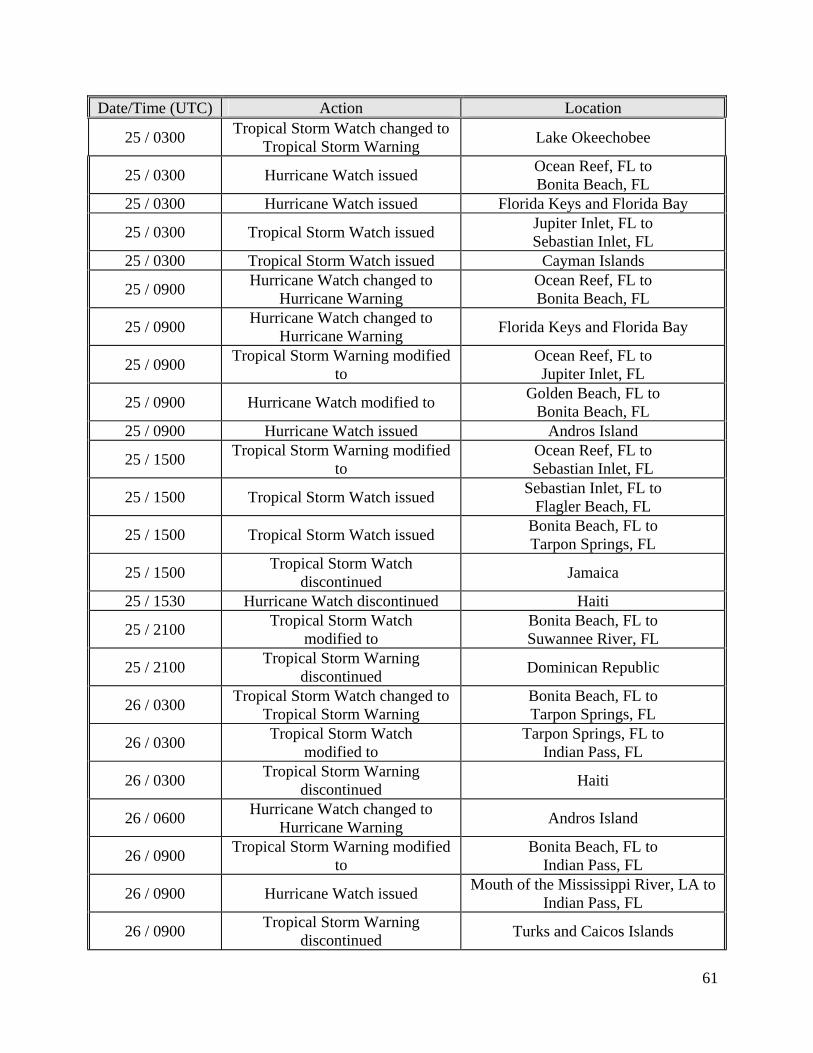
61
Date/Time (UTC) Action Location
25 / 0300 Tropical Storm Watch changed to
Tropical Storm Warning Lake Okeechobee
25 / 0300 Hurricane Watch issued Ocean Reef, FL to Bonita Beach, FL
25 / 0300 Hurricane Watch issued Florida Keys and Florida Bay
25 / 0300 Tropical Storm Watch issued Jupiter Inlet, FL to Sebastian Inlet, FL
25 / 0300 Tropical Storm Watch issued Cayman Islands
25 / 0900 Hurricane Watch changed to
Hurricane Warning Ocean Reef, FL to Bonita Beach, FL
25 / 0900 Hurricane Watch changed to
Hurricane Warning Florida Keys and Florida Bay
25 / 0900 Tropical Storm Warning modified
to Ocean Reef, FL to Jupiter Inlet, FL
25 / 0900 Hurricane Watch modified to Golden Beach, FL to
Bonita Beach, FL 25 / 0900 Hurricane Watch issued Andros Island
25 / 1500 Tropical Storm Warning modified
to Ocean Reef, FL to Sebastian Inlet, FL
25 / 1500 Tropical Storm Watch issued Sebastian Inlet, FL to
Flagler Beach, FL
25 / 1500 Tropical Storm Watch issued Bonita Beach, FL to Tarpon Springs, FL
25 / 1500 Tropical Storm Watch
discontinued Jamaica
25 / 1530 Hurricane Watch discontinued Haiti
25 / 2100 Tropical Storm Watch
modified to Bonita Beach, FL to Suwannee River, FL
25 / 2100 Tropical Storm Warning
discontinued Dominican Republic
26 / 0300 Tropical Storm Watch changed to
Tropical Storm Warning Bonita Beach, FL to Tarpon Springs, FL
26 / 0300 Tropical Storm Watch
modified to Tarpon Springs, FL to
Indian Pass, FL
26 / 0300 Tropical Storm Warning
discontinued Haiti
26 / 0600 Hurricane Watch changed to
Hurricane Warning Andros Island
26 / 0900 Tropical Storm Warning modified
to Bonita Beach, FL to
Indian Pass, FL
26 / 0900 Hurricane Watch issued Mouth of the Mississippi River, LA to
Indian Pass, FL
26 / 0900 Tropical Storm Warning
discontinued Turks and Caicos Islands
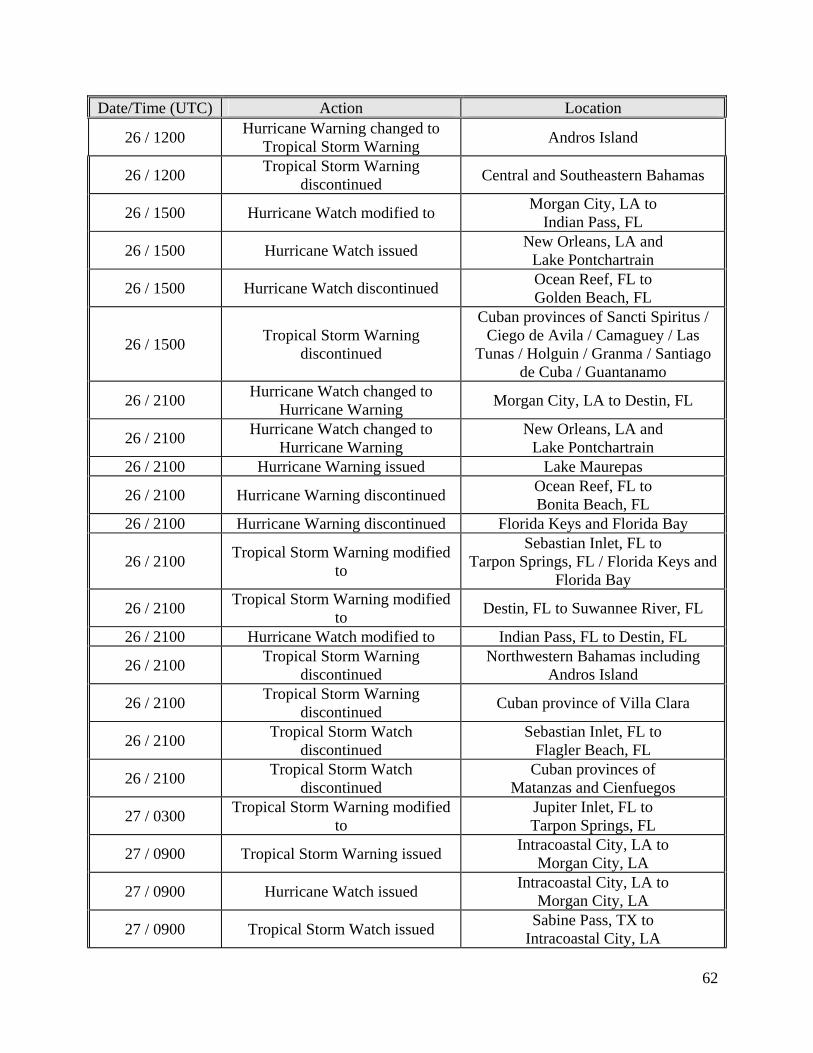
62
Date/Time (UTC) Action Location
26 / 1200 Hurricane Warning changed to
Tropical Storm Warning Andros Island
26 / 1200 Tropical Storm Warning
discontinued Central and Southeastern Bahamas
26 / 1500 Hurricane Watch modified to Morgan City, LA to
Indian Pass, FL
26 / 1500 Hurricane Watch issued New Orleans, LA and
Lake Pontchartrain
26 / 1500 Hurricane Watch discontinued Ocean Reef, FL to Golden Beach, FL
26 / 1500 Tropical Storm Warning
discontinued
Cuban provinces of Sancti Spiritus / Ciego de Avila / Camaguey / Las
Tunas / Holguin / Granma / Santiago de Cuba / Guantanamo
26 / 2100 Hurricane Watch changed to
Hurricane Warning Morgan City, LA to Destin, FL
26 / 2100 Hurricane Watch changed to
Hurricane Warning New Orleans, LA and
Lake Pontchartrain 26 / 2100 Hurricane Warning issued Lake Maurepas
26 / 2100 Hurricane Warning discontinued Ocean Reef, FL to Bonita Beach, FL
26 / 2100 Hurricane Warning discontinued Florida Keys and Florida Bay
26 / 2100 Tropical Storm Warning modified
to
Sebastian Inlet, FL to Tarpon Springs, FL / Florida Keys and
Florida Bay
26 / 2100 Tropical Storm Warning modified
to Destin, FL to Suwannee River, FL
26 / 2100 Hurricane Watch modified to Indian Pass, FL to Destin, FL
26 / 2100 Tropical Storm Warning
discontinued Northwestern Bahamas including
Andros Island
26 / 2100 Tropical Storm Warning
discontinued Cuban province of Villa Clara
26 / 2100 Tropical Storm Watch
discontinued Sebastian Inlet, FL to
Flagler Beach, FL
26 / 2100 Tropical Storm Watch
discontinued Cuban provinces of
Matanzas and Cienfuegos
27 / 0300 Tropical Storm Warning modified
to Jupiter Inlet, FL to Tarpon Springs, FL
27 / 0900 Tropical Storm Warning issued Intracoastal City, LA to
Morgan City, LA
27 / 0900 Hurricane Watch issued Intracoastal City, LA to
Morgan City, LA
27 / 0900 Tropical Storm Watch issued Sabine Pass, TX to
Intracoastal City, LA
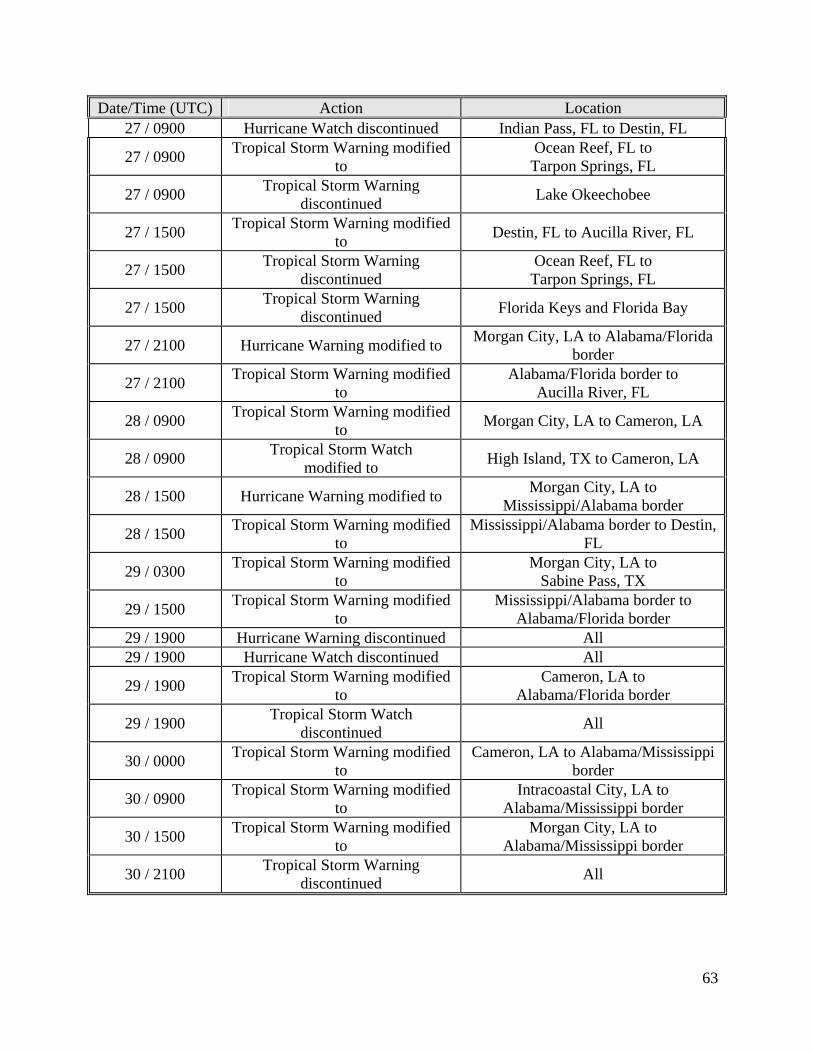
63
Date/Time (UTC) Action Location 27 / 0900 Hurricane Watch discontinued Indian Pass, FL to Destin, FL
27 / 0900 Tropical Storm Warning modified
to Ocean Reef, FL to Tarpon Springs, FL
27 / 0900 Tropical Storm Warning
discontinued Lake Okeechobee
27 / 1500 Tropical Storm Warning modified
to Destin, FL to Aucilla River, FL
27 / 1500 Tropical Storm Warning
discontinued Ocean Reef, FL to Tarpon Springs, FL
27 / 1500 Tropical Storm Warning
discontinued Florida Keys and Florida Bay
27 / 2100 Hurricane Warning modified to Morgan City, LA to Alabama/Florida
border
27 / 2100 Tropical Storm Warning modified
to Alabama/Florida border to
Aucilla River, FL
28 / 0900 Tropical Storm Warning modified
to Morgan City, LA to Cameron, LA
28 / 0900 Tropical Storm Watch
modified to High Island, TX to Cameron, LA
28 / 1500 Hurricane Warning modified to Morgan City, LA to
Mississippi/Alabama border
28 / 1500 Tropical Storm Warning modified
to Mississippi/Alabama border to Destin,
FL
29 / 0300 Tropical Storm Warning modified
to Morgan City, LA to
Sabine Pass, TX
29 / 1500 Tropical Storm Warning modified
to Mississippi/Alabama border to
Alabama/Florida border 29 / 1900 Hurricane Warning discontinued All 29 / 1900 Hurricane Watch discontinued All
29 / 1900 Tropical Storm Warning modified
to Cameron, LA to
Alabama/Florida border
29 / 1900 Tropical Storm Watch
discontinued All
30 / 0000 Tropical Storm Warning modified
to Cameron, LA to Alabama/Mississippi
border
30 / 0900 Tropical Storm Warning modified
to Intracoastal City, LA to
Alabama/Mississippi border
30 / 1500 Tropical Storm Warning modified
to Morgan City, LA to
Alabama/Mississippi border
30 / 2100 Tropical Storm Warning
discontinued All
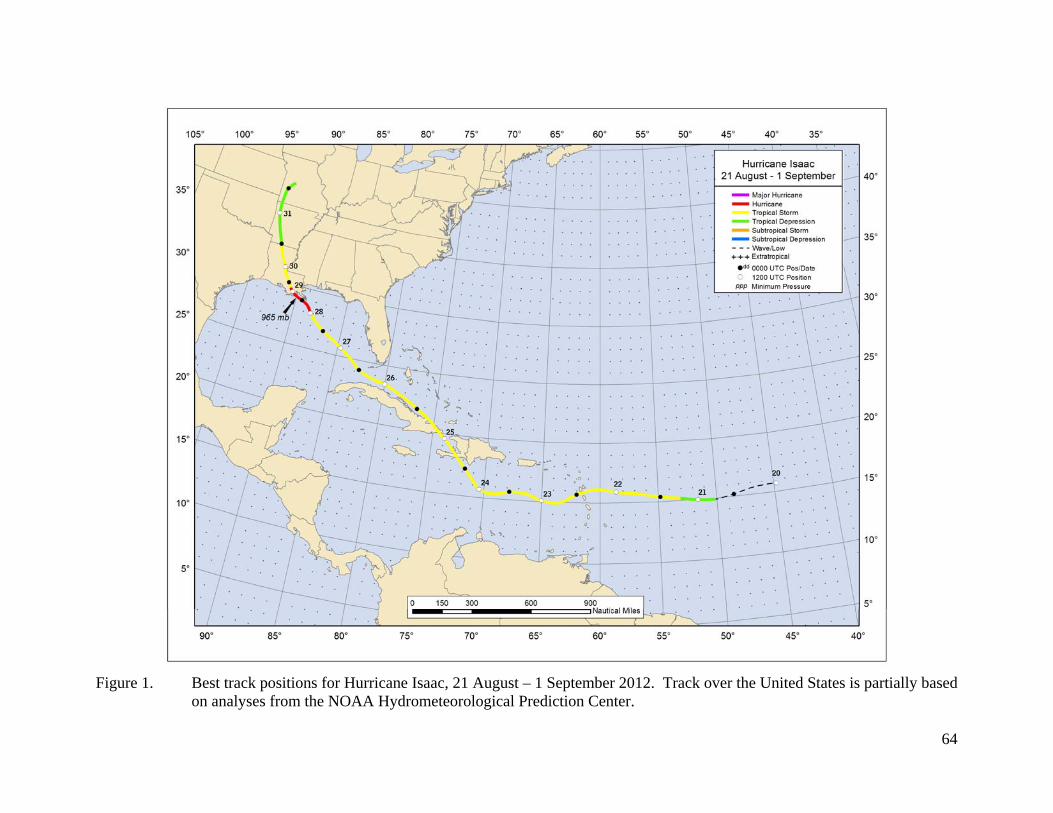
64
Figure 1. Best track positions for Hurricane Isaac, 21 August – 1 September 2012. Track over the United States is partially based
on analyses from the NOAA Hydrometeorological Prediction Center.
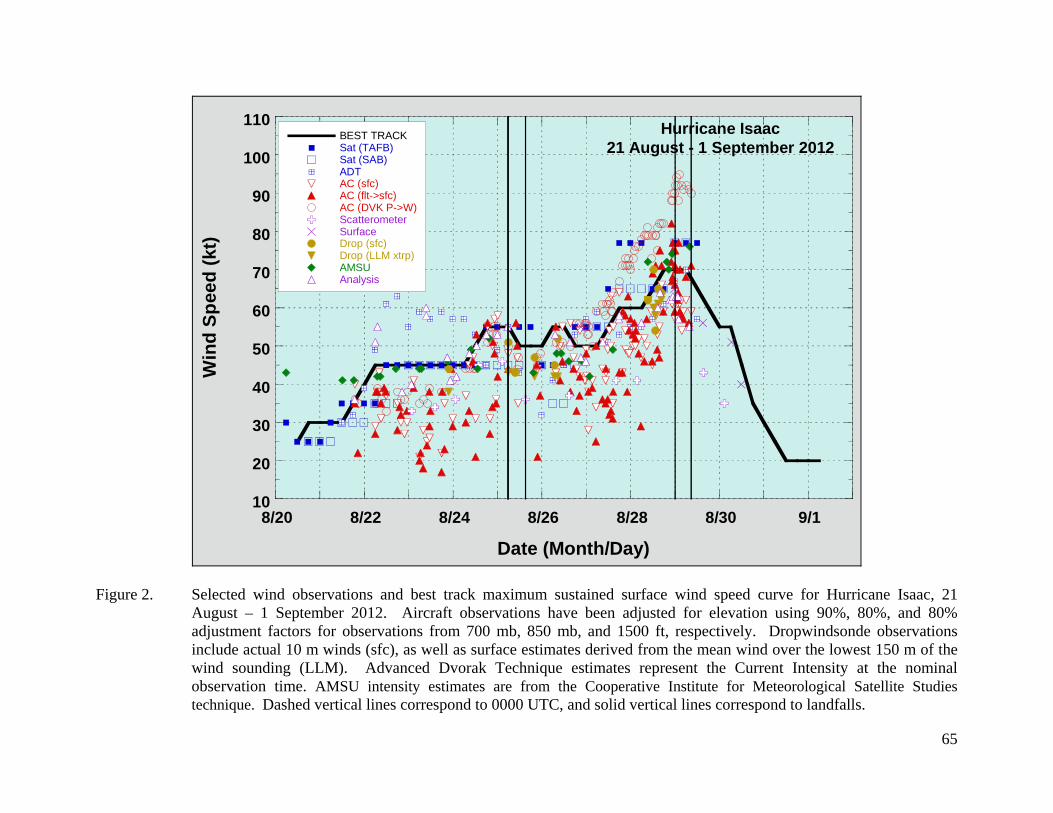
65
10
20
30
40
50
60
70
80
90
100
110
8/20 8/22 8/24 8/26 8/28 8/30 9/1
BEST TRACKSat (TAFB)Sat (SAB)ADTAC (sfc)AC (flt->sfc)AC (DVK P->W)ScatterometerSurfaceDrop (sfc)Drop (LLM xtrp)AMSUAnalysis
Win
d Sp
eed
(kt)
Date (Month/Day)
Hurricane Isaac21 August - 1 September 2012
Figure 2. Selected wind observations and best track maximum sustained surface wind speed curve for Hurricane Isaac, 21
August – 1 September 2012. Aircraft observations have been adjusted for elevation using 90%, 80%, and 80% adjustment factors for observations from 700 mb, 850 mb, and 1500 ft, respectively. Dropwindsonde observations include actual 10 m winds (sfc), as well as surface estimates derived from the mean wind over the lowest 150 m of the wind sounding (LLM). Advanced Dvorak Technique estimates represent the Current Intensity at the nominal observation time. AMSU intensity estimates are from the Cooperative Institute for Meteorological Satellite Studies technique. Dashed vertical lines correspond to 0000 UTC, and solid vertical lines correspond to landfalls.
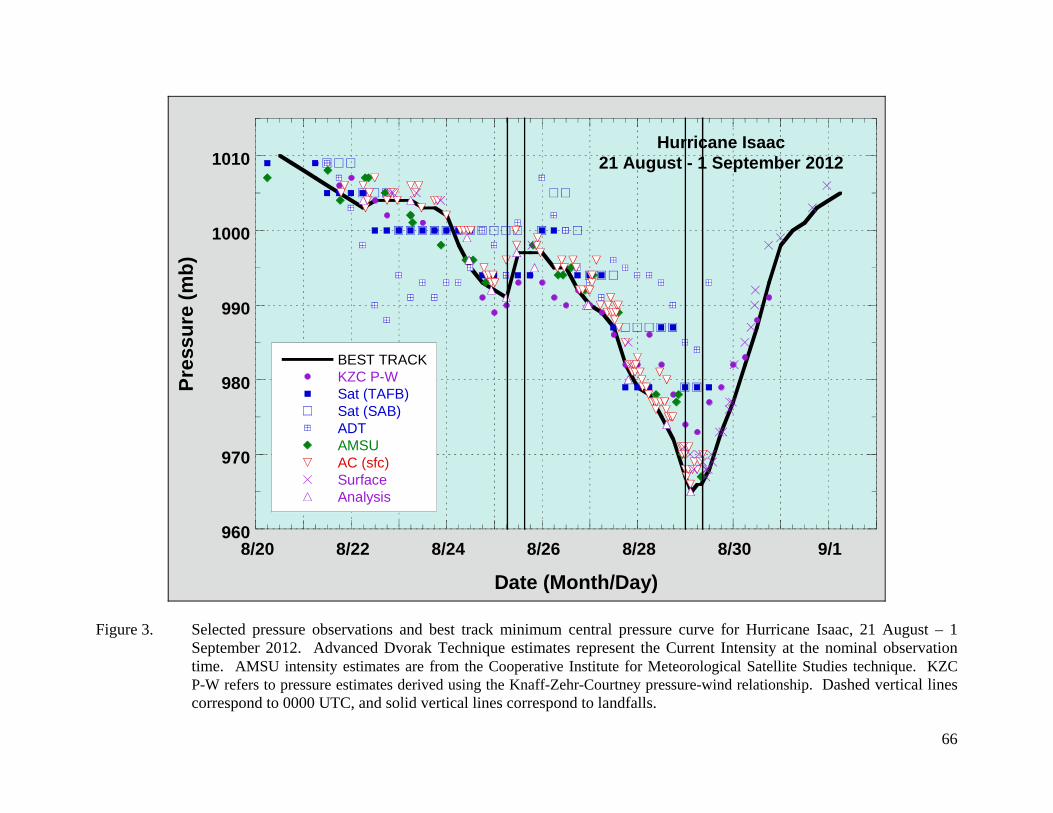
66
960
970
980
990
1000
1010
8/20 8/22 8/24 8/26 8/28 8/30 9/1
BEST TRACKKZC P-WSat (TAFB)Sat (SAB)ADTAMSUAC (sfc)SurfaceAnalysis
Pres
sure
(mb)
Date (Month/Day)
Hurricane Isaac21 August - 1 September 2012
Figure 3. Selected pressure observations and best track minimum central pressure curve for Hurricane Isaac, 21 August – 1
September 2012. Advanced Dvorak Technique estimates represent the Current Intensity at the nominal observation time. AMSU intensity estimates are from the Cooperative Institute for Meteorological Satellite Studies technique. KZC P-W refers to pressure estimates derived using the Knaff-Zehr-Courtney pressure-wind relationship. Dashed vertical lines correspond to 0000 UTC, and solid vertical lines correspond to landfalls.

67
Figure 4. GOES-13 visible satellite image of Hurricane Isaac approaching the coast of Louisiana at 1815 UTC 28 August 2012
when it reached its peak intensity of 70 kt.
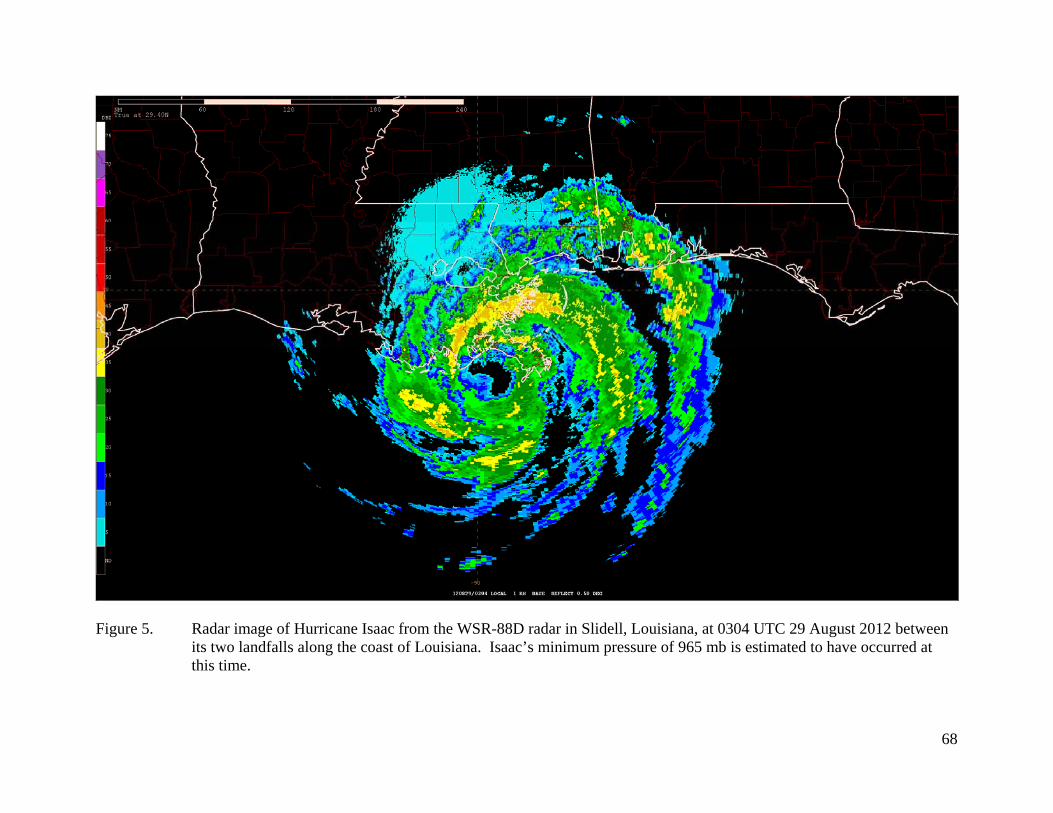
68
Figure 5. Radar image of Hurricane Isaac from the WSR-88D radar in Slidell, Louisiana, at 0304 UTC 29 August 2012 between its two landfalls along the coast of Louisiana. Isaac’s minimum pressure of 965 mb is estimated to have occurred at this time.
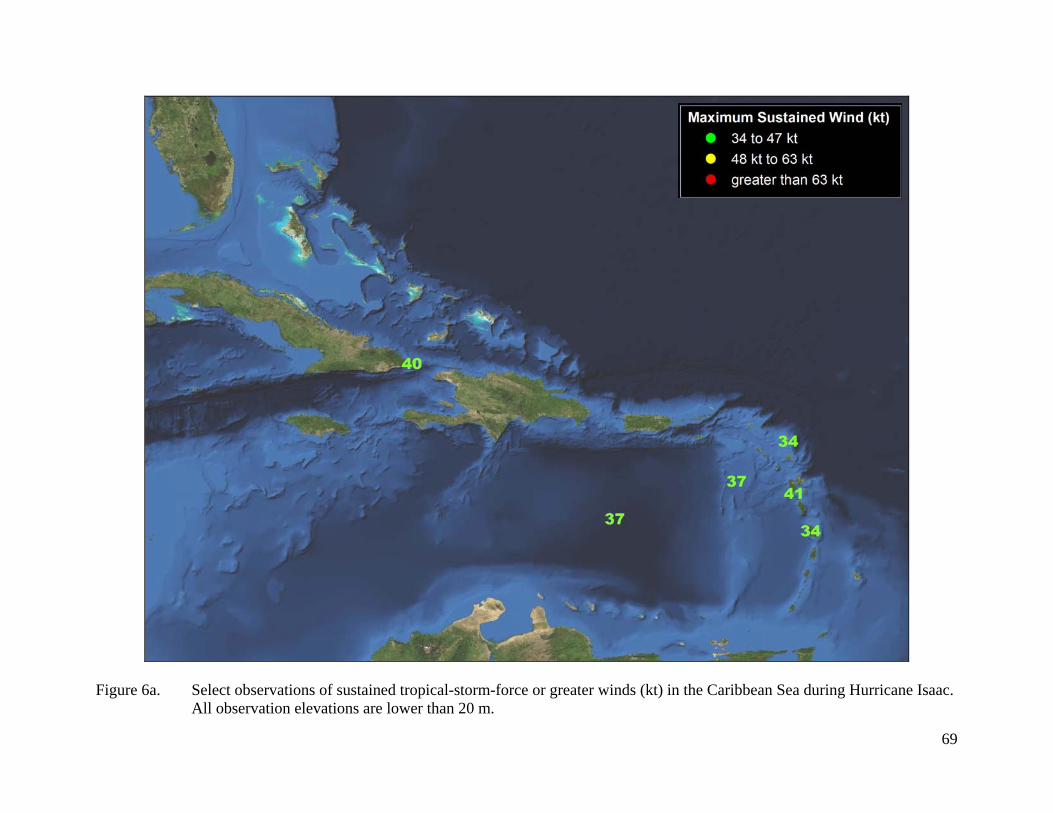
69
Figure 6a. Select observations of sustained tropical-storm-force or greater winds (kt) in the Caribbean Sea during Hurricane Isaac.
All observation elevations are lower than 20 m.
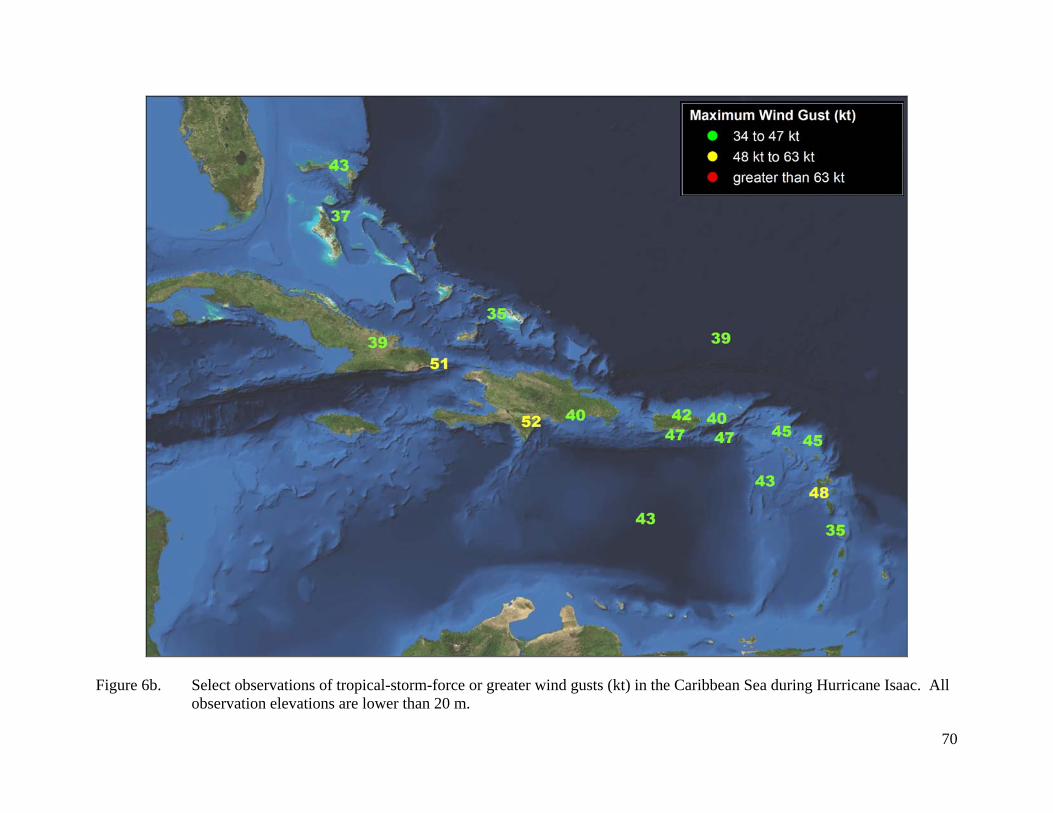
70
Figure 6b. Select observations of tropical-storm-force or greater wind gusts (kt) in the Caribbean Sea during Hurricane Isaac. All
observation elevations are lower than 20 m.
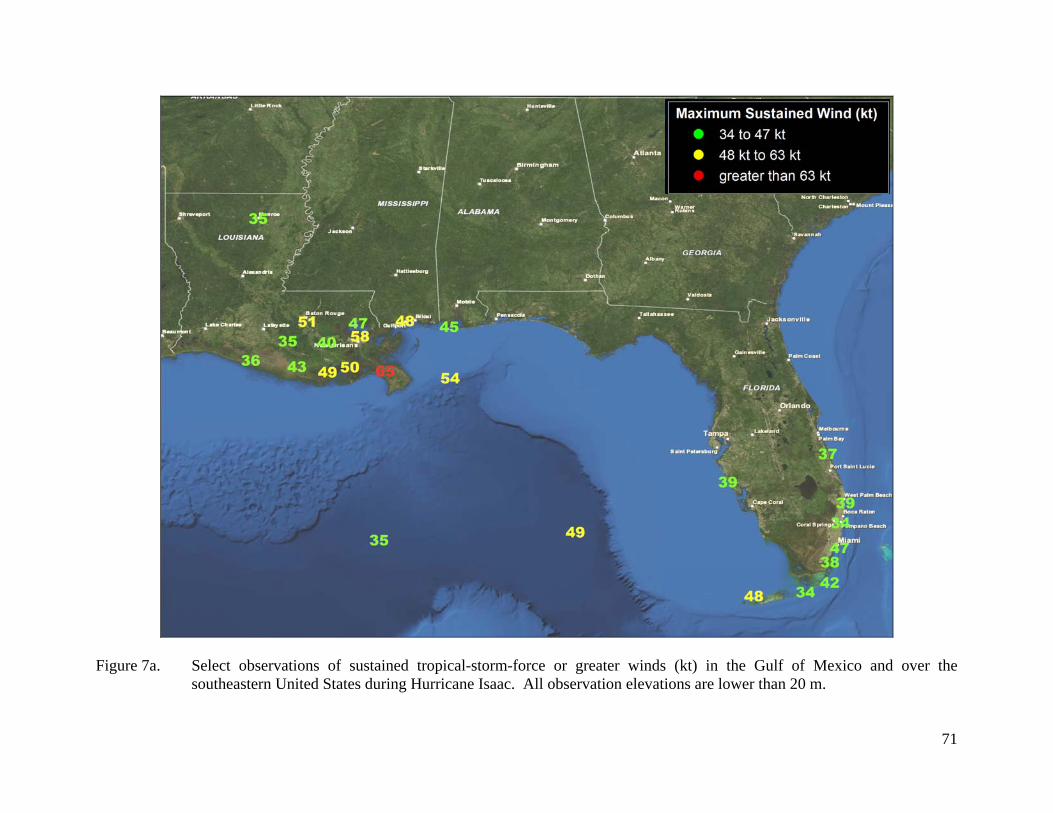
71
Figure 7a. Select observations of sustained tropical-storm-force or greater winds (kt) in the Gulf of Mexico and over the
southeastern United States during Hurricane Isaac. All observation elevations are lower than 20 m.
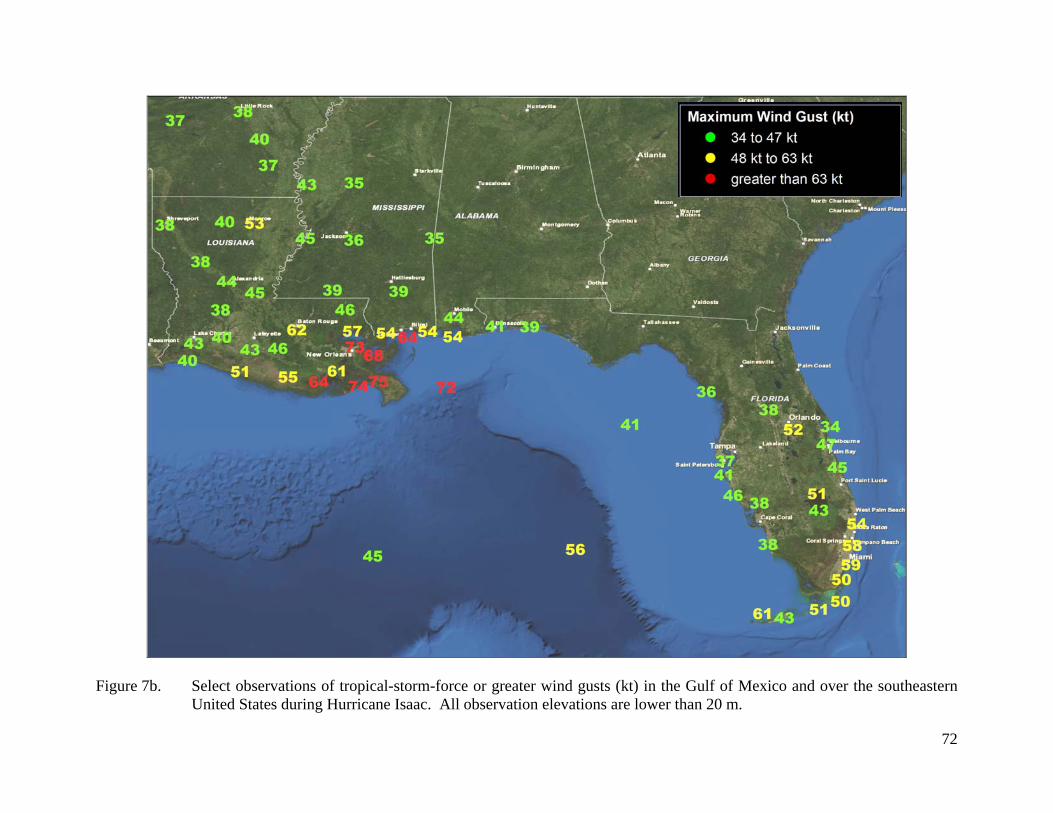
72
Figure 7b. Select observations of tropical-storm-force or greater wind gusts (kt) in the Gulf of Mexico and over the southeastern
United States during Hurricane Isaac. All observation elevations are lower than 20 m.
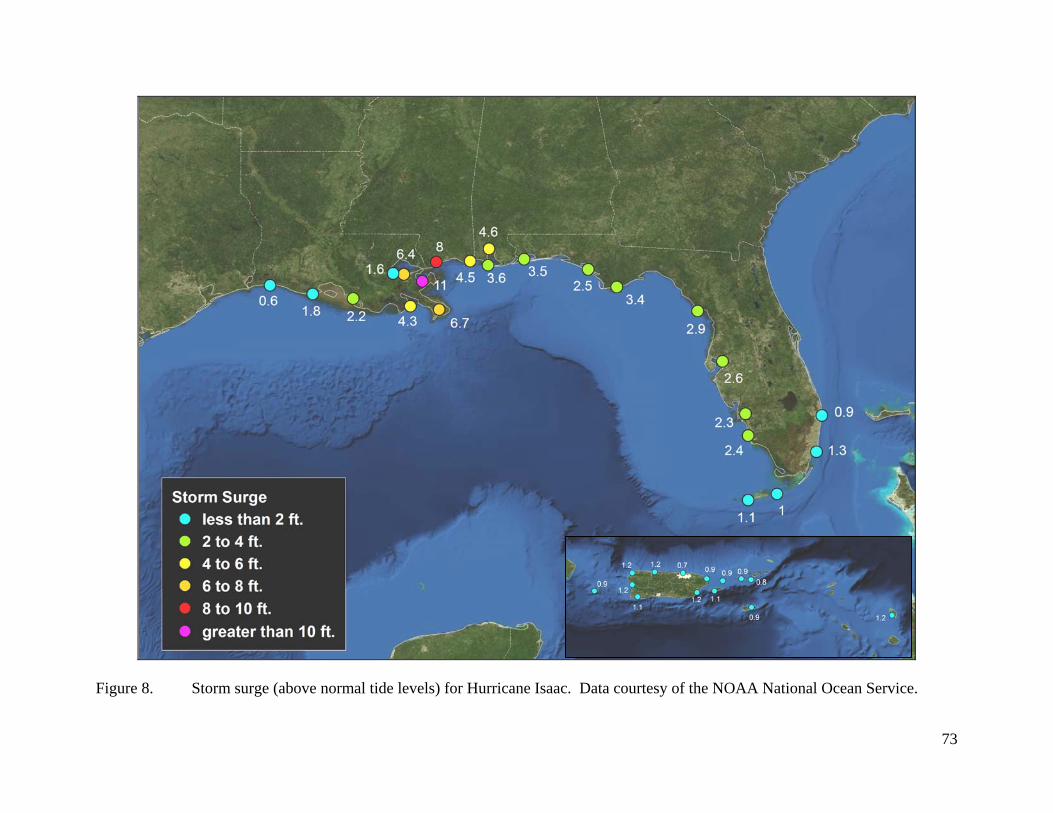
73
Figure 8. Storm surge (above normal tide levels) for Hurricane Isaac. Data courtesy of the NOAA National Ocean Service.
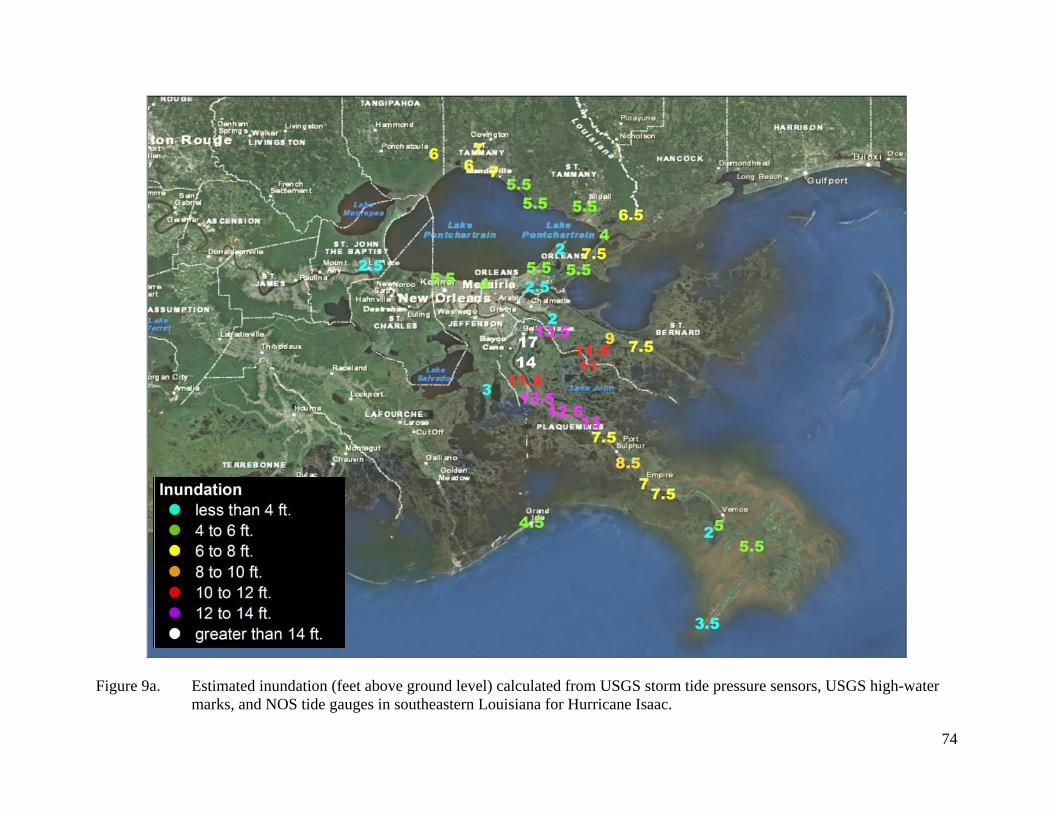
74
Figure 9a. Estimated inundation (feet above ground level) calculated from USGS storm tide pressure sensors, USGS high-water
marks, and NOS tide gauges in southeastern Louisiana for Hurricane Isaac.
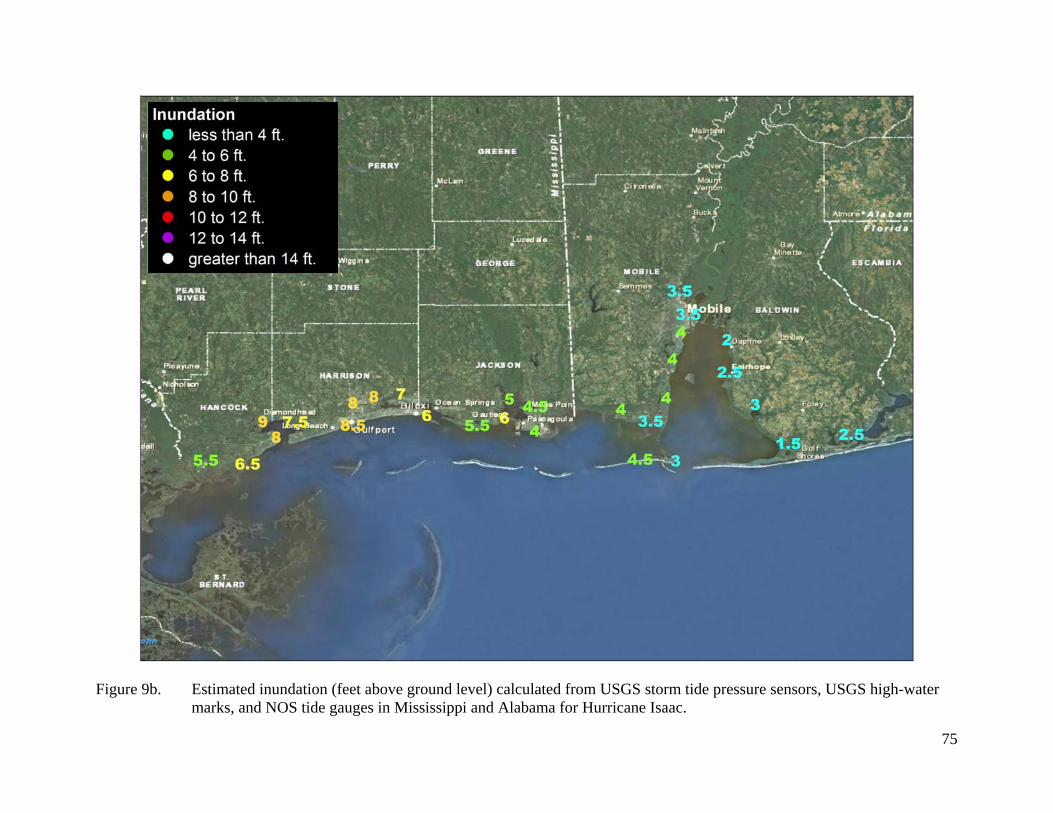
75
Figure 9b. Estimated inundation (feet above ground level) calculated from USGS storm tide pressure sensors, USGS high-water marks, and NOS tide gauges in Mississippi and Alabama for Hurricane Isaac.
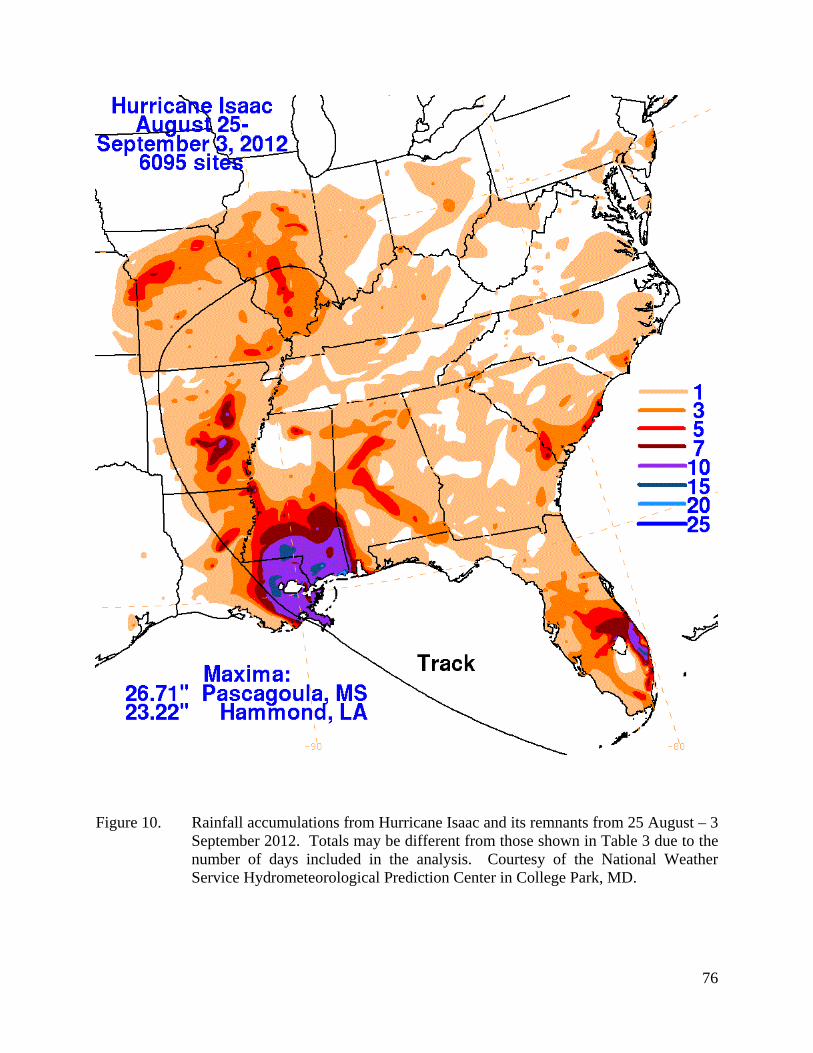
76
Figure 10. Rainfall accumulations from Hurricane Isaac and its remnants from 25 August – 3
September 2012. Totals may be different from those shown in Table 3 due to the number of days included in the analysis. Courtesy of the National Weather Service Hydrometeorological Prediction Center in College Park, MD.
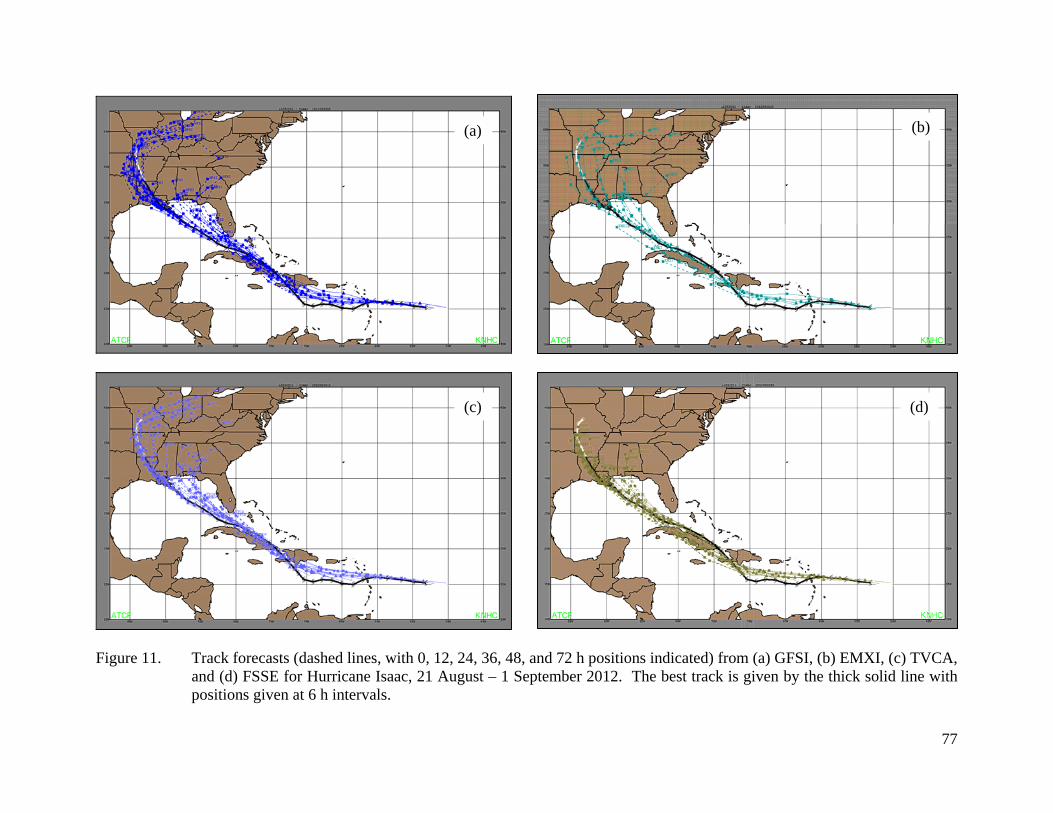
77
Figure 11. Track forecasts (dashed lines, with 0, 12, 24, 36, 48, and 72 h positions indicated) from (a) GFSI, (b) EMXI, (c) TVCA,
and (d) FSSE for Hurricane Isaac, 21 August – 1 September 2012. The best track is given by the thick solid line with positions given at 6 h intervals.
(a) (b)
(c) (d)
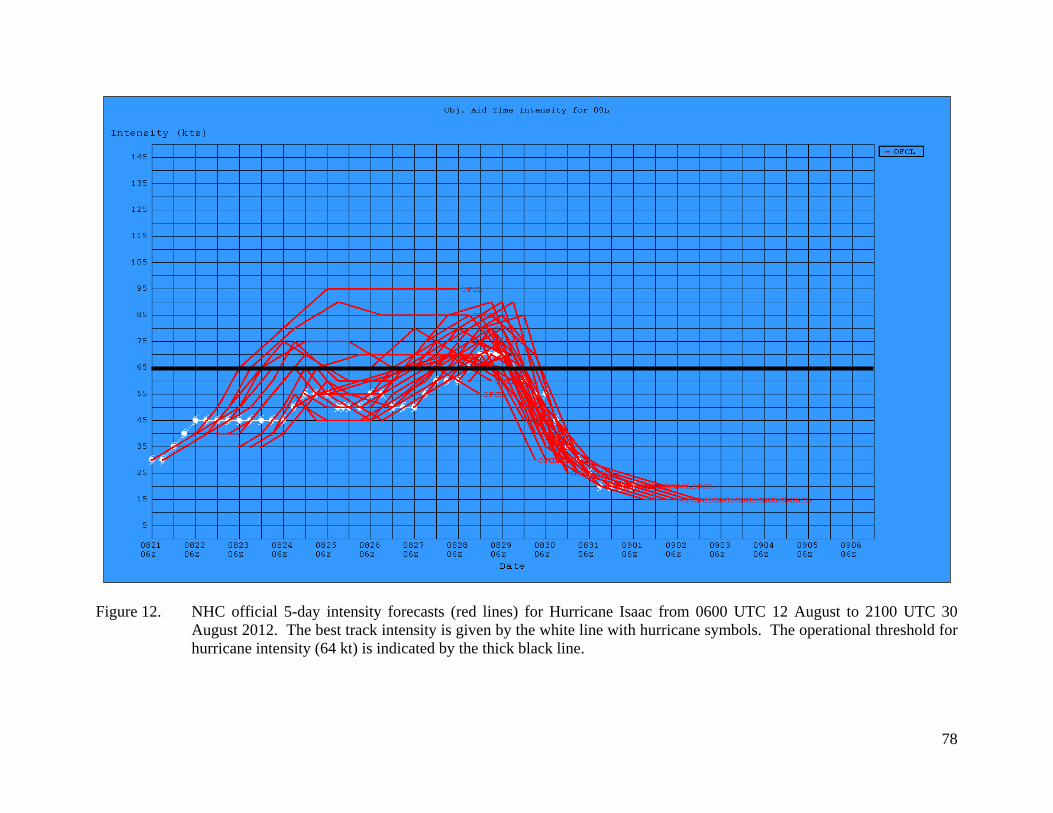
78
Figure 12. NHC official 5-day intensity forecasts (red lines) for Hurricane Isaac from 0600 UTC 12 August to 2100 UTC 30
August 2012. The best track intensity is given by the white line with hurricane symbols. The operational threshold for hurricane intensity (64 kt) is indicated by the thick black line.