Embed Size (px)
Citation preview
_, _o l "/ "; '• "/_ ¢/
Tropospheric- Stratospheric
Measurement Studies SmnInary
Stuart W. Bowen
May 1998
https://ntrs.nasa.gov/search.jsp?R=19990026876 2018-05-25T08:32:50+00:00Z
TROPOSPHERIC-STRATOSPHERIC MEASUREMENT STUDIES
1998-1999
5/05/98
Stuart W. Bowen
INTRODUCTION
The two high altitude aircraft,, ER-2 NASA #706,709 and the DC-8 NASA _¢717
are in active use in several programs of upper atmospheric research to study po-
lar ozone changes, stratospheric - tropospheric exchange processes and atmospheric
effects of aviation aircraft. The ER-2's have participated in seven major missions;
STEP (1986- 1987), AAOE (1987), AASE (1989), AASE II (1992), SPADE (1992-
1993), ASHOE/MAESA (1994), STRAT (1995) and POLARIS (1997) These expe-
ditions mainly concentrated on vortex dynamics and the large losses of Ozone in the
Polar regions (Ozone hole) observed in the spring, with SPADE verifying the com-
plex dynamical chemical and physical processes that occur during sunrise and sunset,
STRAT designed to obtain background measurements using the full ER-2 suite of
instruments, and POLARIS (1997) to understand the mid-latitude and Arctic Ozone
losses during the Northern Summer. The DC-8 with the MMS has participated in
the SUCCESS (1996) and the SONEX (1997) nfissions.
The Meteorological Measurement System (MMS) with its sophisticated software
accurately measures ground speed and attitude, in-situ static and dynamic pres-
sure.total temperature, which are used to calculate the three dimensional wind fields,
static pressure, temperature and turbulence values to meteorological accuracy. The
meteorological data is not only of interest for its own sake in atmospheric dynam-
ical processes such as momltain waves and flux measurements; but is also required
by other ER-2 experimentsthat simultaneouslymeasurewater vapor, O3,aerosols,
NO, HC1,CH4,N20, C10, BrO, CO2, NOy, HOx and temperature gradients. MMS
products areextensivelyusedto assist in the interpretation of their results in under-
standing the importance of convectiveeffectsrelative to in-situ chemicalchanges,as
may be noted by examining the list of referencesattached.
The MMS consistsof three subsystems:
(a) aircraft instrumentation, inertial navigation system (INS), static and dynamic
pressuretaps,
(b) additional dedicated instrumentation measuring angle of attack, yaw, total
temperature, and a GPSwtfich on the DC-8 measuresposition, velocity and attitude
(c) an on board data, storageand computing acquisitionsystem.
This instrumentation and the associatedsoftware requiresboth an on-going lab-
oratory ground calibration procedurefor the total air temperature, static and total
pressureinputs, verification of the INS dynamic responseand alsoextensiveair mea-
surementsand intercomparisonswhich ultimately verify and calibrate the complete
systemand its software. More than the usualaccuracyis requiredbecauseof the near
cancellation occurring in the difference between the ground speed and true airspeed
vectors used to give the wind vector.
In the past year we have redesigned, recalibiated and used the MMS system on
the NASA DC-8 that was previously used in the SUCCESS mission for the SONEX
mission
2
I participated in SONEX, attending a planning meeting at Goddard SFC inJune 1997and flying on the DC-8 in support of its checkoutflights, the transitflights, and many of the local data flights. The SONEX mission left Ames inOct 1997,toucheddown at BangorMaine, then onto ShannonIreland for severallocal flights, then to the Azoresfor onelocal flight, back to Bangor for local flightsand finally home to Ames toward the end of November. (18 flights, 112hrs inthe air)
Two paperswerewritten with coauthors,basedon the SUCCESSflights, oneon mountain waves,one on our new turbulence measurements. Both paperswerepeer reviewed,extensivelyrevisedand acceptedfor publication in GRL.
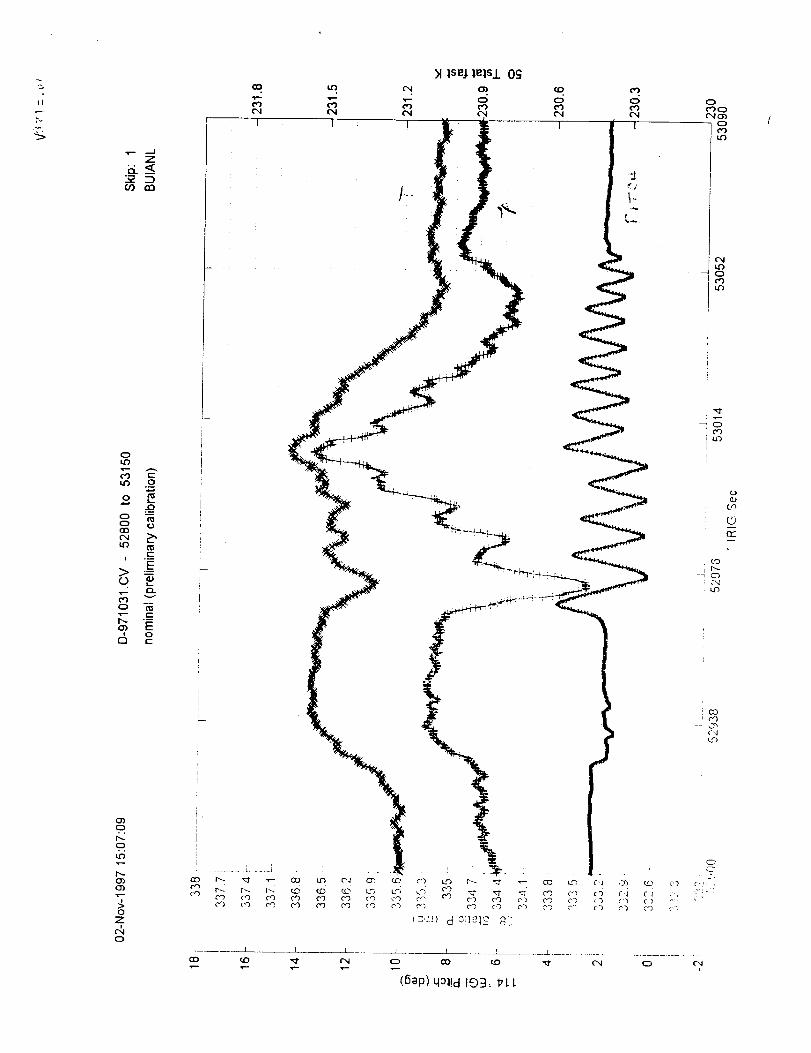
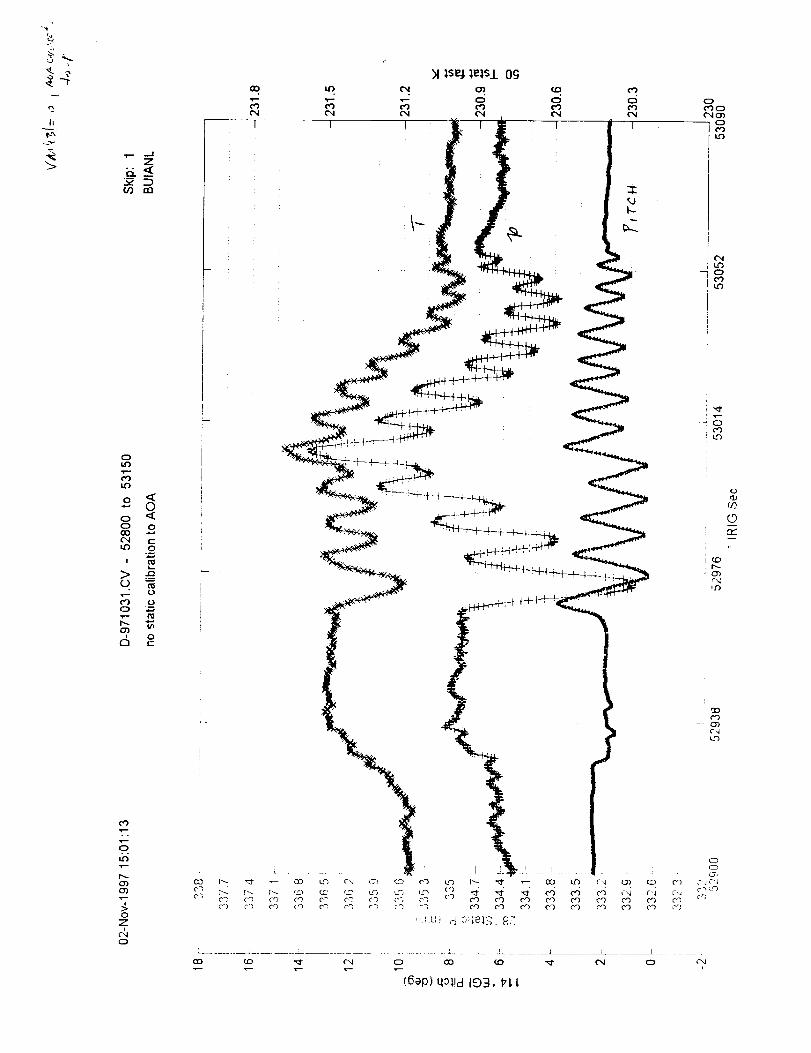
Several reports and handouts were written for SONEX. These included a
MMS Maneuvers or Why We Suffer,, _eritten to explain the necessity of
our maneuvers to the experimenters, MMS DC-8 Calibration Maneuvers
SONEX given to the pilots to explain just what we required, and _ set of
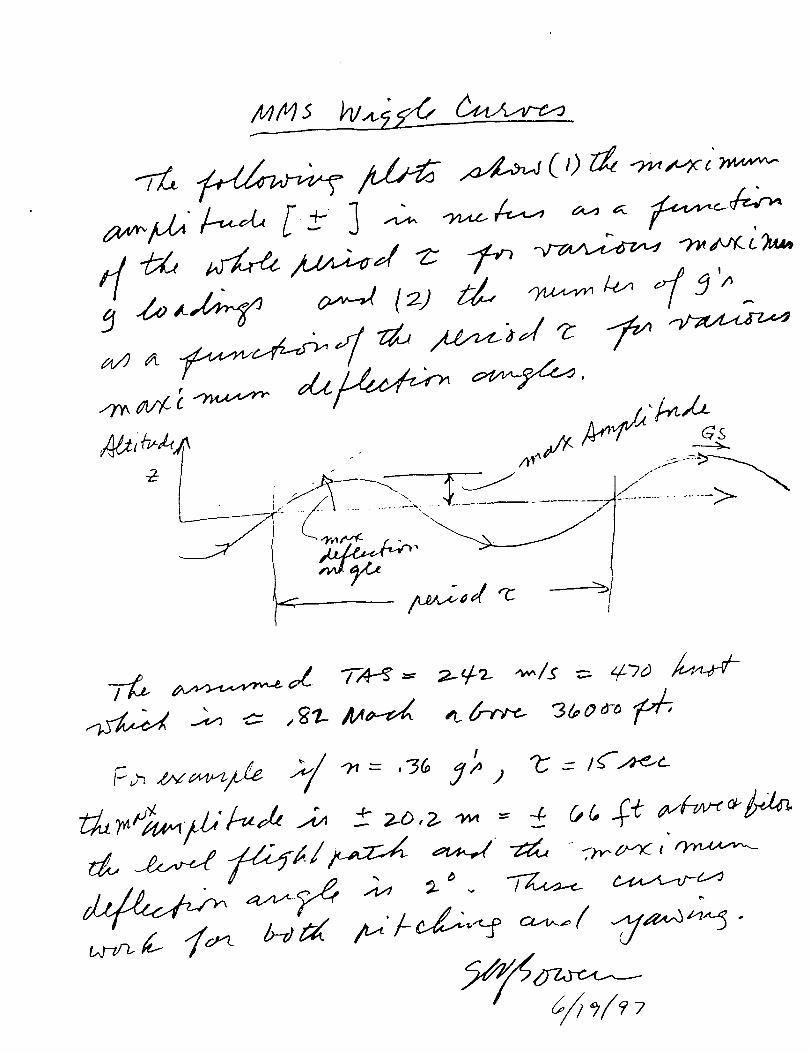
MMS Wiggle Curves that showed the + excursions for our maneuvers as we
were flying in the controlled track system over the North Atlantic.
Calibration of the DC-8 pressure transducer temperature measuring thermis-
tors was completed, and an extensive analysis spanning several years of data files
of the DC-8 Rosemount pressure transducer calibrations was done, including a
new digital transducer m_de by Druck.
In SONEX we had two INS units on the DC-8 separated by about 15 meters.
By comparing their outputs we discovered flexures of a few tenths of a degree
during both normal flight operations and our MMS maneuvers which are useflfi
in correcting the AOA and yaw measurements.
For further details please refer to the final yearly reports Tropospheric-
Stratospheric Measurement Studies for 1996-1997, 1997-1998 and 1998-1999
PROGRESS AND STATUS OF TROPOSPHERIC-STATOSPHERIC
STUDIES
(1) General items
I attended the SONEX three day planning meeting at Goddard Space Flight
Center in June 1997.
I went on the entire one month SONEX mission (18 flights, 112 hrs in the air)
in early fall of 1997 which went from Ames to Bangor Maine to Shannon Ireland to
Terceira Azores returning to Bangor and finally back to Ames. I flew most of the
local flights and all of the transits. Aside from the data calibration and verification
of data quality, a fairly extensive communication and interaction between the flight
crew, other experimenters, (who were primarily atmospheric chemists) and the mission
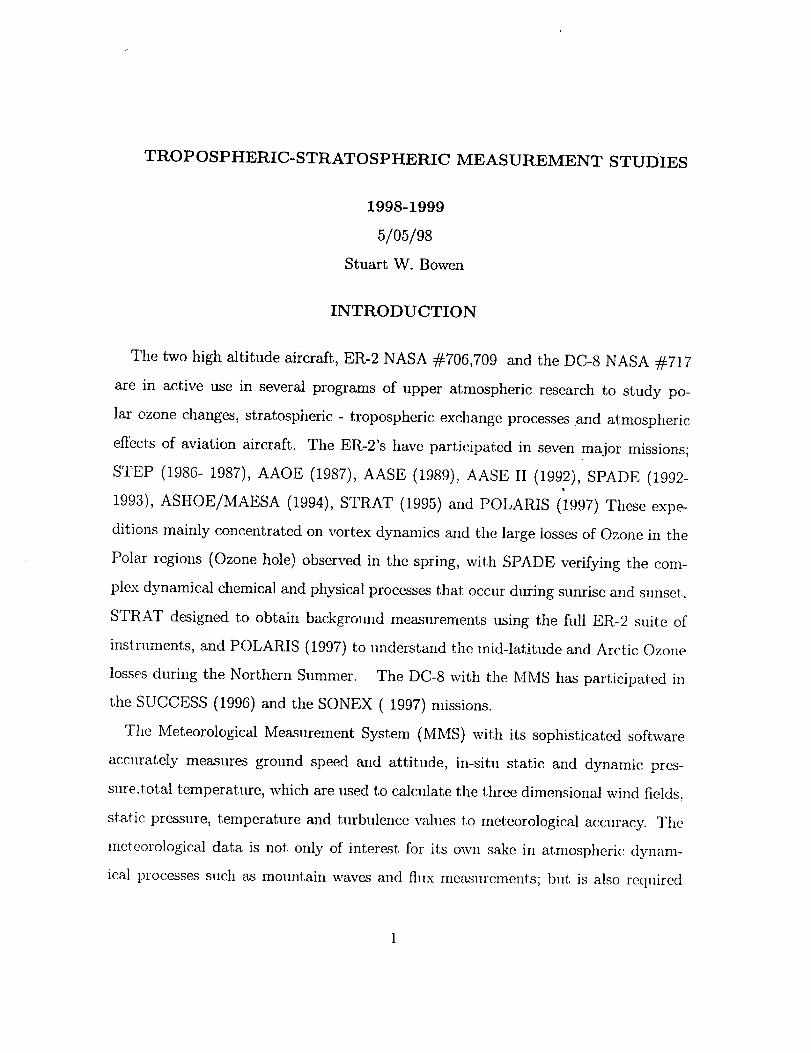
scientists was required during the mission to get a set of satisfactory MMS maneuvers.
Note the presentation I gave regarding these maneuvers to the experimenters, the
MMS DC-8 Calibration Maneuvers SONEX hand out given to the pilots, and
the "Wiggle" curves a._ noted below.
Dr. E. Moore wrote a Matlab shell, adapting the FORTRAN MhIS routines, that
is a very good first, cut to upgrading our whole calibration procedure and making up
to date presentation quality graphs.
Two papers were written with coauthors, based on the SUCCESS flights. Both
papers were peer reviewed, extensively revised and accepted for publication in GRL
(see Publications).
(2)Reports and Memos
A presentation explaining to the DC-8 experimenters the necessity for the MMS
maneuvers w_ given during the SONEX mission and is included as MMS Maneu-
vers, or Why we suffer.
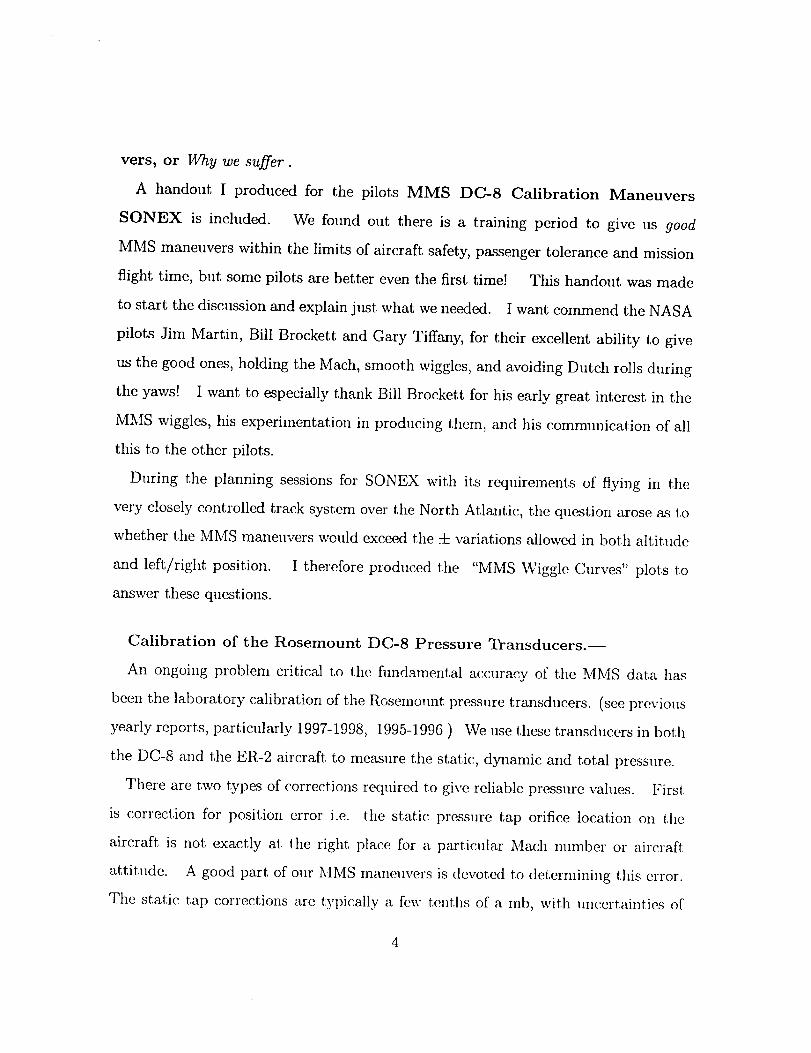
A handout I produced for the pilots MMS DC-8 Calibration Maneuvers
SONEX is included. We found out there is a training period to give us good
MMS maneuvers within the limits of aircraft, safety, passenger tolerance and mission
flight time, but some pilots are better even the first time! This handout was made
to start the discussion and explain just what we needed. I want commend the NASA
pilots Jim Martin, Bill Brockett and Gary Tiffany, for their excellent ability to give
us the good ones, holding the Mach, smooth wiggles, and avoiding Dutch rolls during
the yaws! I want to especially thank Bill Brockett for his early great interest in the
MMS wiggles, his experimentation in producing them, and his communication of all
this to the other pilots.
During the planning sessions for SONEX with its requirements of flying in the
very closely controlled track system over the North Atlantic, the question arose as to
whether the MMS maneuvers would exceed the i variations allowed in both altitudc
and left/right position. I therefore produced the "MMS Wiggle Curves" plots to
answer these questions.
Calibration of the Rosemount DC-8 Pressure Transducers.-
An ongoing problem critical to the fundamental accuracy of the MMS data has
been the laboratory calibration of the Rosemo_mt pressure transducers. (see previous
yearly reports, particularly 1997-1998, 1995-1996 ) We use these transducers in both
the DC-8 and the ER-2 aircraft to measure the static, dynamic and total pressure.
There are two types of corrections required to give reliable pressure values. First
is correction for position error i.e. the static pressure tap orifice location on the
aircraft, is not exactly at the right place for a particular Math number or aircraft
attitude. A good part of our MMS maneuvers is devoted to determining this error.
The static tap corrections are typically a few _,ent,hs of a rob, with uncertainties of
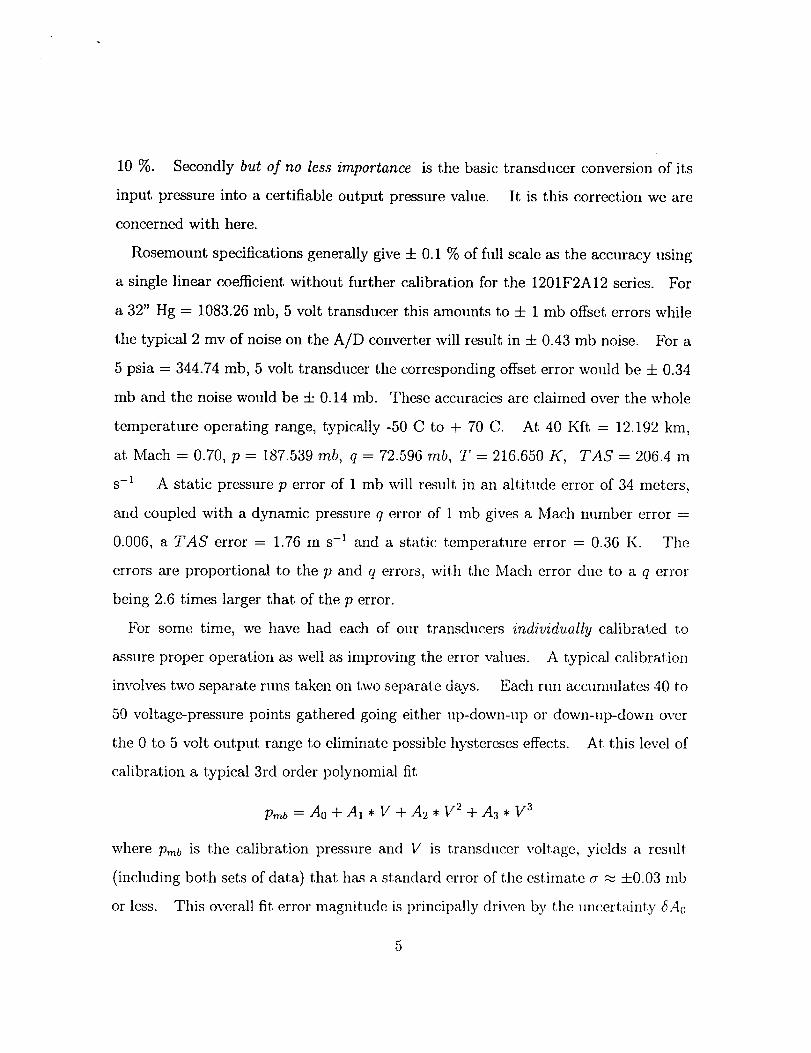
10%. Secondlybut of no less importance is the basic transducer conversion of its
input pressure into a certifiable output pressure vahm. It is this correction we are
concerned with here.
Rosemount specifications generally give ± 0.1% of fifll scale as the accuracy using
a single linear coefficient without further calibration for the 1201F2A12 series. For
a 32" Hg = 1083.26 mb, 5 volt transducer this amounts to ± 1 mb offset errors while
the typical 2 mv of noise on the A/D converter will result in ± 0.43 mb noise. For a
5 psia = 344.74 mb, 5 volt transducer the corresponding offset error would be ± 0.34
mb and the noise would be ± 0.14 mb. These accuracies are claimed over the whole
temperature operating range, typically -50 C to + 70 C. At 40 Kfl, = 12.192 kin,
at Mach = 0.70, p = 187.539 rob, q = 72.596 rob, T = 216.650 K, TAS = 206.4 m
s -1 A static pressure p error of 1 mb will result in an altitude error of 34 meters,
and coupled with a dynamic pressure q error of 1 mb gives a Math number error =
0.006, a TAS error = 1.76 m s -1 and a static temperature error - 0.36 K. The
errors are proportional to the p and q errors, with the Mach error due to a q en'or
being 2.6 times larger that of the p error.
For some time, we have had each of our transducers individually calibrated to
assure proper operation as well as improving the error values. A typical calibration
involves two separate runs taken on two separate days. Each rml accumulates 40 to
50 voltage-pressure points gathered going either up-down-up or down-up-down over
the 0 to 5 volt output range to eliminate possible hystereses effects. At this level of
calibration a typical 3rd order polynomial fit
Pmb = A0 + A1 * V + A2 * V 2 + Aa * V 3
where Pmb is the calibration pressure and V is transducer voltage, yields a result
(including both sets of data) that has a standard error of the estimate a _ +0.03 mb
or less. This overall fit error magnitude is principally driven by the uImertainty 6.40
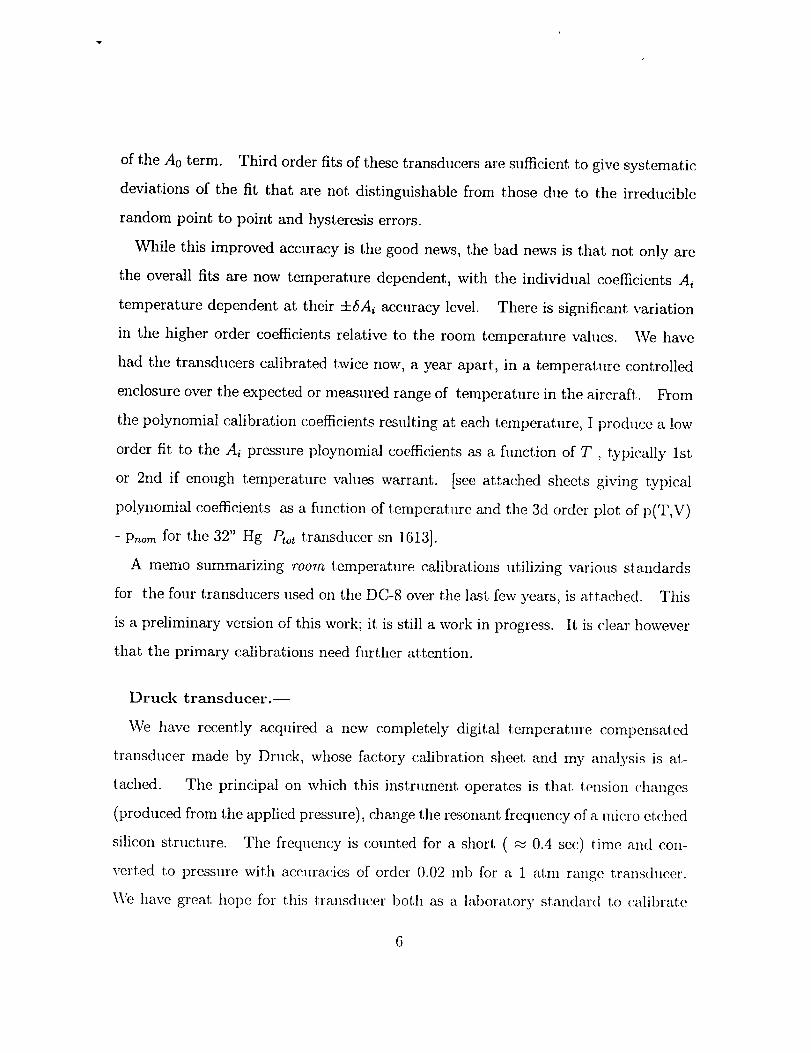
of the A0 term. Third order fits of these transducers are sufficient to give systematic
deviations of the fit that are not distinguishable from those due to the irreducible
random point to point and hysteresis errors.
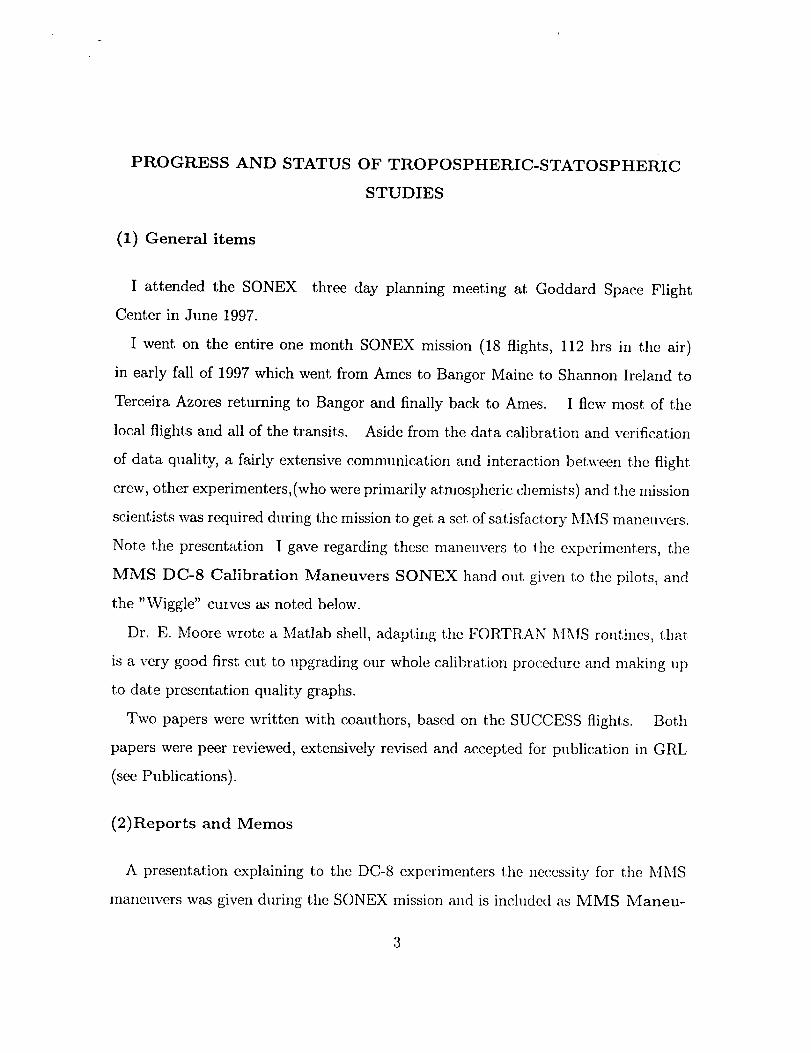
While this improved accuracy is the good news, the bad news is that not only are
the overall fits are now temperature dependent, with the individual coefficients Ai
temperature dependent at their ±SAi accuracy level. There is significant variation
in the higher order coefficients relative to the room temperature values. \Ve have
had the transducers calibrated twice now, a year apart, in a temperature controlled
enclosure over the expected or measured range of temperature in the aircraft. From
the polynomial calibration coefficients resulting at each temperature, I produce a low
order fit to the A_ pressure ploynomial coefficients as a function of T, typically 1st
or 2nd if enough temperature values warrant. [see attached sheets giving typical
polynomial coefficients as a fimction of temperature and the 3d order plot of p(T,V)
- P_om for the 32" Hg Ptot transducer sn 1613].
A memo summarizing 'room temperature calibrations utilizing various standards
for the four transducers used on the DC-8 over the last few years, is attached. This
is a preliminary version of this work; it is still a work in progress. It is clear however
tha_ the primary calibrations need further attention.
Druck transducer.
We have recently acquired a new completely digital temperature compensated
transducer made by Druck, whose factory calibration sheet and my analysis is at-
tached. The principal on which this instrument operates is that tension changes
(produced from the applied pressure), change the resonant frequency of a micro etched
silicon structure. The frequency is counted for a short ( ._ 0.4 sec) tiine and con-
verted to pressure with accuracies of order 0.02 mb for a 1 atm rmlgc transducer.
We have great holm for this transducer both as a laboratory standard to calibrat, e
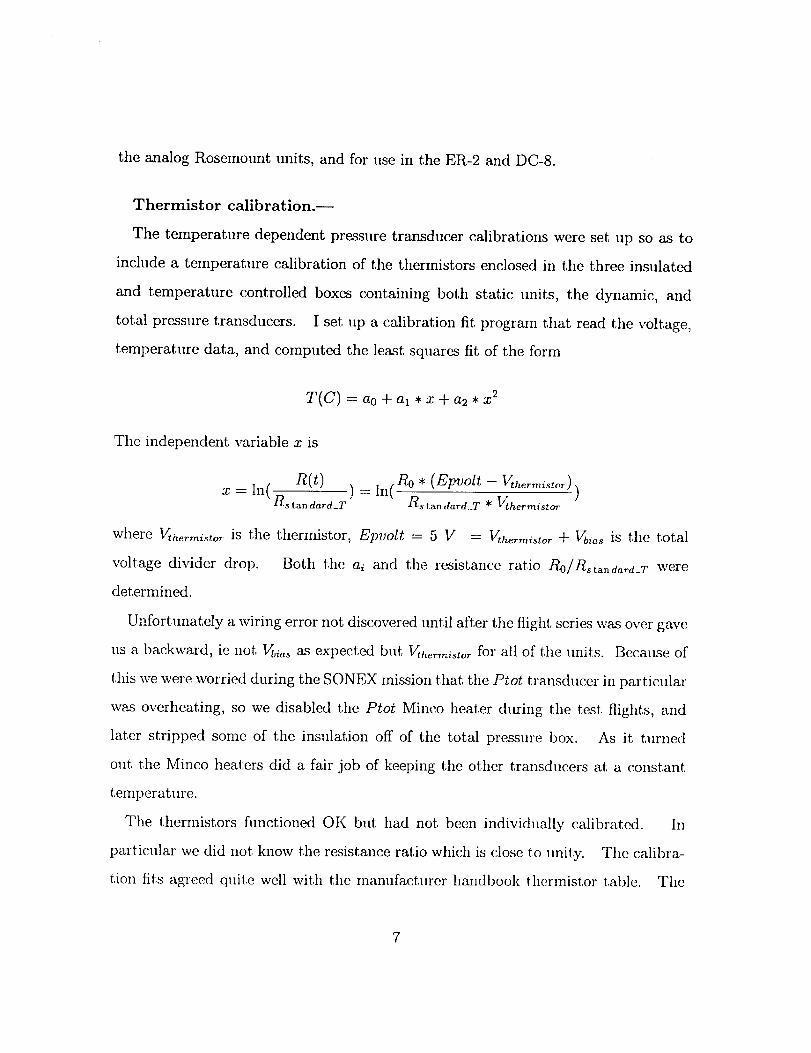
the analog Rosemount units, and for use in the ER-2 and DC-8.
Thermistor calibration.--
The temperature dependent pressure transducer calibrations were set up so as to
include a temperature calibration of the thermistors enclosed in the three insulated
and temperature controlled boxes containing both static units, the dynamic, and
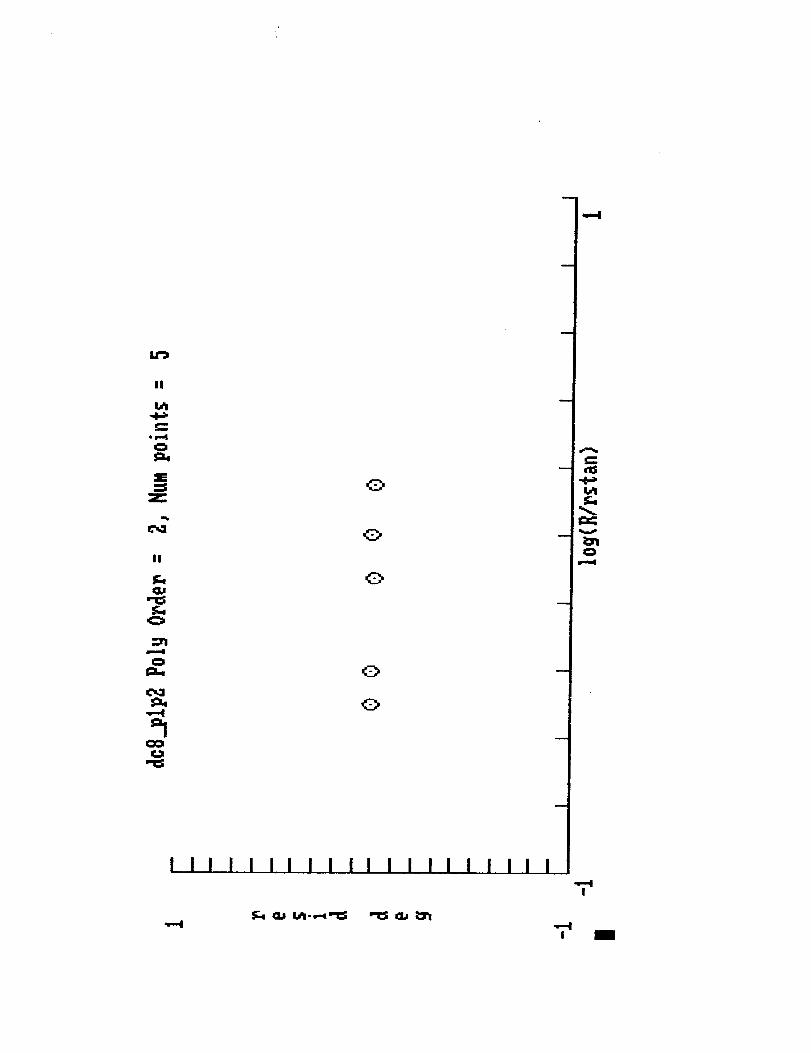
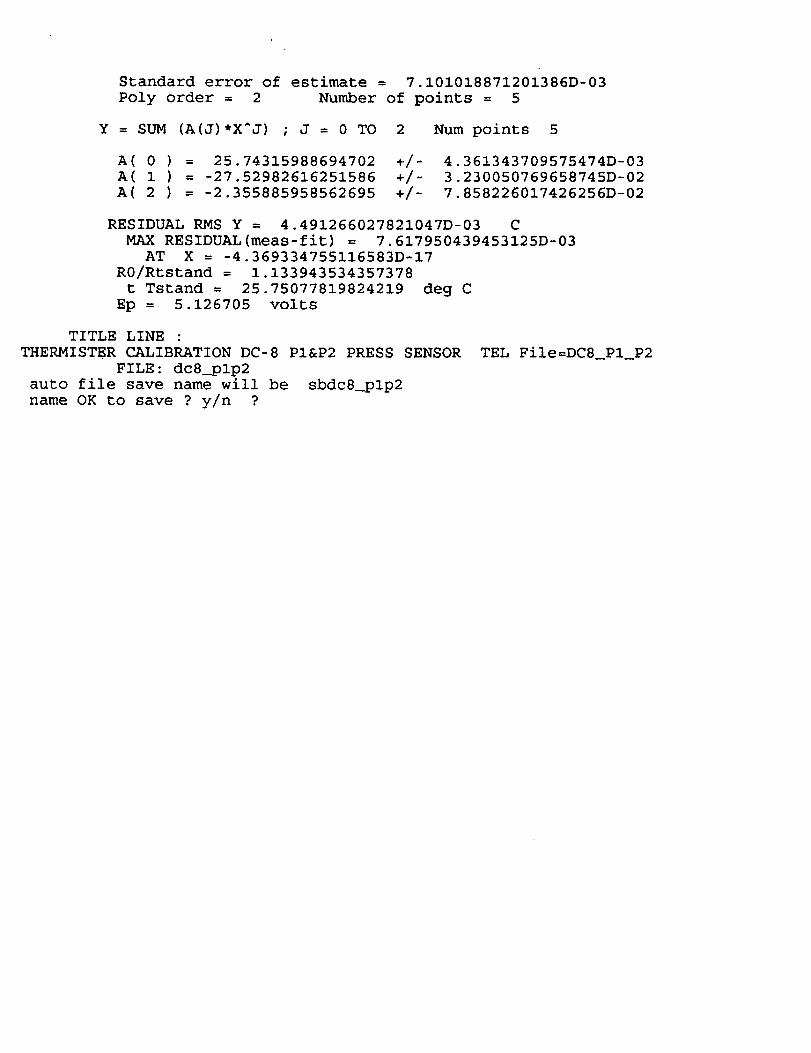
total pressure transducers. I set up a calibration fit program that read the voltage,
temperature data, and computed the least squares fit of the form
T(C) = ao + al * x + a2 * x 2
The independent variable x is
R( t ) ln( Ro * (EpvoU - V,,_erm,_,_o,)ln(Rstandard_T ) = Rstan dard._T * l/ihe_misto_ )
X
where gtherrnisto 7. is the thermistor, Epvolt = 5 V = l/thermistor + Vbias is the total
voltage divider drop. Both the a i and the resistance ratio R0/R_tand_a_r were
determined.
Unfortunately a wiring error not discovered until after the flight, series was over gave
us a backward, ie not Vbi_ as expected but Yther,r.istor for all of the units. Because of
this we were worried during the SONEX mission that the Ptot transducer in particular
wa.s overheating, so we disabled the Ptot Minco heater during the test flights, and
later stripped some of the insulation off of the total pressure box. As it turned
out the Minco heaters did a fair job of keeping the other transducers at a constant
temperature.
The thermistors flmctioned OK but had not been individually calibrated. In
particular we did not know the resistance ratio which is close to unity. The calibra-
tion fits agreed quite well with the manufacturer handbook thermistor table. The
standard error of the estimate of the least squarefits was _<0.2 C.
being_>0.01C Thesefinal calibration resultsareattached.
with only one
(3) DC-8 air data corrections
Becauseof the greatly expandedoperating envelopeof the DC-8 compared to the
ER-2,a muchmorecomplexform of the variousair datacorrectionshasbeendevised.
Fluid dynamic similarity specifiesthat the correctionsto flow related quantities can
be functions of attitude ( yaw, angleof attack ), Reynoldsnumberand Madl number.
Thesechangingflowconditions primarily affect the static tap correctionsand the yaw
and AOA corrections. In addition fuel bum off during flight changesthe required
lifting wing vortex strength which affects the 1,pwashangle. The corrections were
modeledwith adjustable coefficientsto be determined as functions of the similarity
parameters. The constantswere determined for eachcalibration maneuver. These
"constan_,s"werethen leastsquaresfit asa flmctions of the Mach,and attitude (AOA
andyaw asindicated). The ensembleof calibration maneuversoverthewholeSONEX
flight series were planned to span the required range of the Macb number.
A new feature of the SONEX data was the inclusion of a second INU (LTN100G
or EGI) in addition to the LTN 72RH on the DC-8. The comparison of the two INS
outputs has shown that the DC-8 has enough structural bending ( a few tenths of a
degree in the 15 meters longitudinally between the two units) in normal operations as
well as the MMS maneuvers to feed through into the vertical wind in particular. The
flexures which will affect the yaw and AOA measurements are related to the attitude
and body accelerations which we measure with the EGI.
During the SUCCESS mission we included a term in -L[b/TAS, where L is a
fuselage radius lever arm ( fit as a function of Math and AOA) TAS is the true air-
speed, and ¢ is the rolling rate to both yaw and AOA nmasurements, which corrected
apparent spikesin the wind valuesduring the rolling events. During SONEX we
realizedthat the 858AOA probe on the right handside of the DC-8 is mountedwith
a _ 5 degreeupward tilt from the horizontal asviewed from the noseof the aircraft.
This tilt wasshowing up asan erroneousfeedthroughof the yawing motion into the
apparentAOA angleevenwith no,¢ term. The 858yaw probeis properly mounted
in the vertical direction symmetrically on the fuselageon top. We were able to
eliminate this feedthroughby subtracting out about 10%of the yaw angle from the
AOA angle. Surprisingly this non-orthogonal correction then eliminated entirely
the needfor the -L¢/TAS correction. The magnitude of the -L¢/TAS is of order
0.07degreesfor the DC-8.
MMS Maneuvers, or Why we suffer
S. W. Bowen, Paul Bui
Nov 2 1997
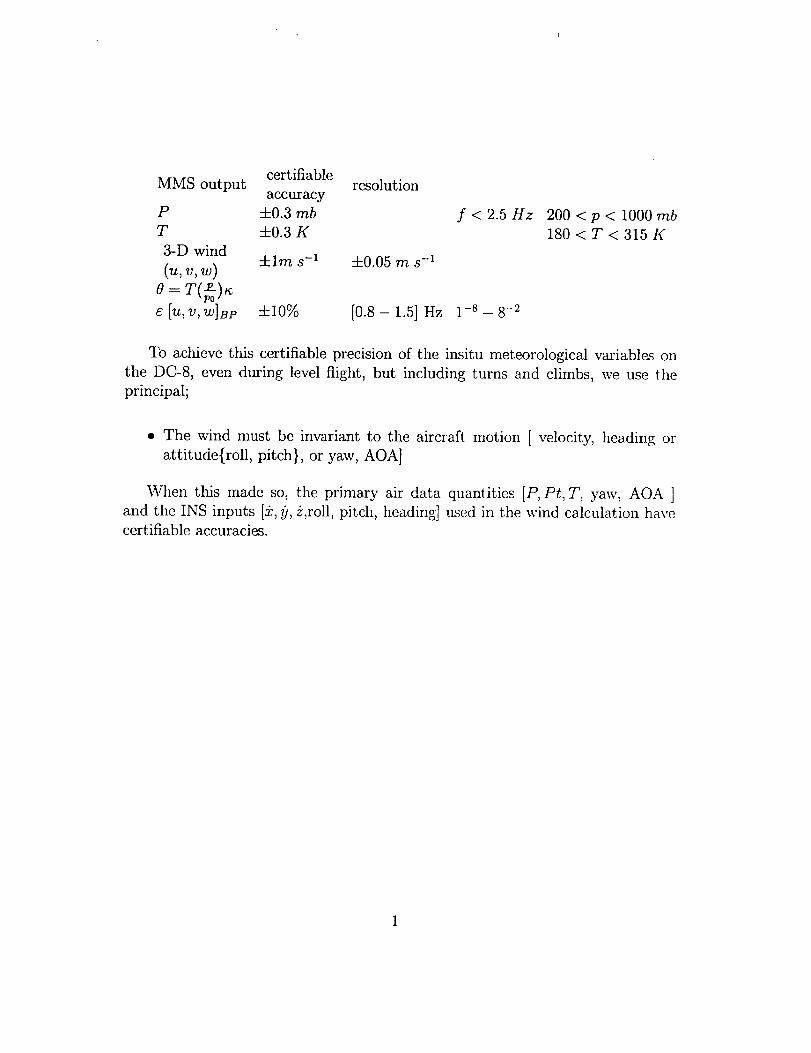
certifiableMMS output resolution
accuracy
P +0.3 mb f < 2.5 HzT +0.3 K
3-D wind+lms -1 +0.05 m s -1
(u,v,w)0 : T(_)_
e[U,V,W]Bp +10% [0.8-1.5]Hz 1-s-8 -2
200 < p < 1000 mb
180 < T < 315 K
To achieve this certifiable precision of the insitu meteorological variables on
the DC-8, even during level flight, but including turns and climbs, we use the
principal;
• The wind nmst be invariant to the aircraft motion [ velocity, heading or
attitude{roll, pitch}, or yaw, AOA]
When this made so, the primary air data quantities [P, Pt, T, yaw, AOA ]
and the INS inputs [2, _), _?,roll, pitch, heading] used in the wind calculation have
certifiable accuracies.

The maneuversare designedto produce a clearly discerniblesignal ( abovethe "noise"- natural variability) due to the known aircraft motion into the yawand AOA , and all of the quantities usedto determine the wind. When all thecorrelations of the known aircraft motion and the wind have been minimized,what remains is the true valueand variation.
We calibrate the P, T transducer output (including time delays) in the lab as
functions of P,T, and frequency.
Our MMS aircraft calibrations combine
(1) Initial calibrations to verify our modeling of the air data corrections over
a range of Mach number,
(2) Recalibrations to verify continuing satisfactory operation of our instru-mentation.
The MMS is a science instrument, not a facility.
2
tl
Z
0lad
Lo .0
o ._
0 0OD
e-
E> =
_-- r_eO v
o
c_ Eot-
0
0
L_
70
Z
0
I
CN
I I
_1lse_tlels.L OS
0
_0'_
0c'_c,O
CN
- 0
0
-4 C_
: C'q
(.)
©I¢Y
L I I _ ± L ....... i..... L ......
(6ap) qol!d 10-3; _,LI.
,k
_4
Ii
.-y
g_Z
is._<
O
¢O
o*" OoO OO3 .-_
O4 e-LO O
O
N o
& oE
I
]J
t",l O4
: I I
O
¢OO¢NO)
O¢O
O4rid
-- O¢O
i
, COCOk.'3
CO
C_
,.O
(.JI1J
©
eo
o
tip
c_
o
Z
o
i
cO• 0'3
c'4
(6ap) qOl!d 1©3_ 171.
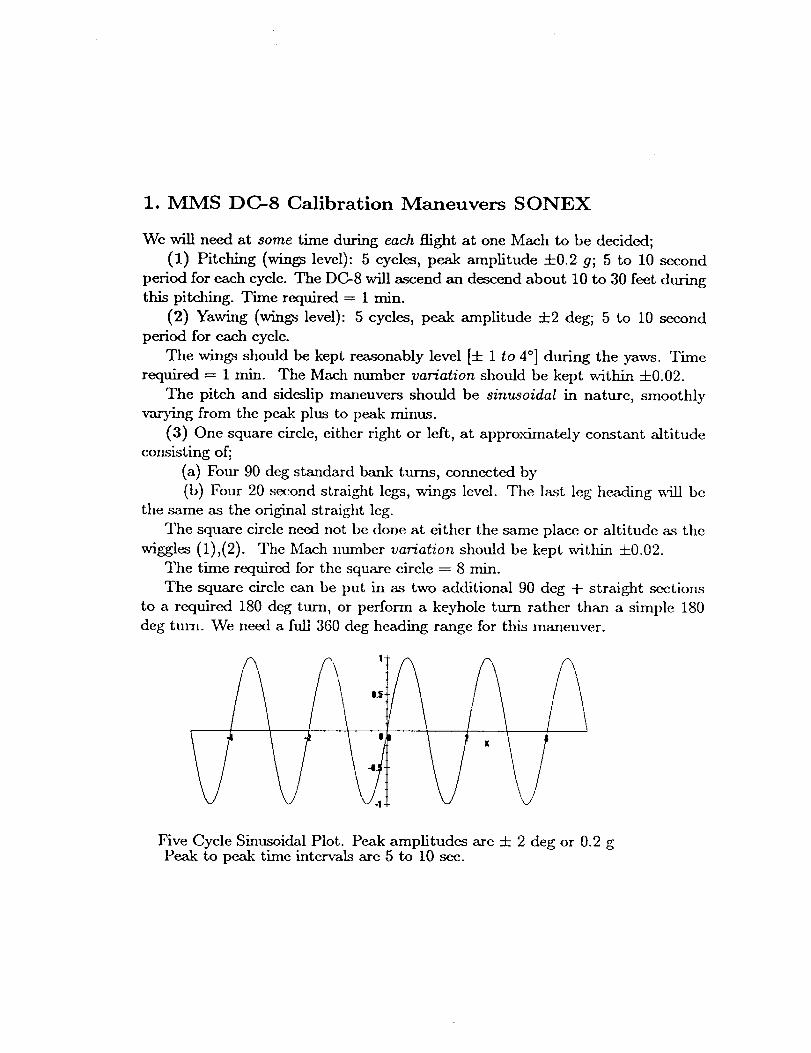
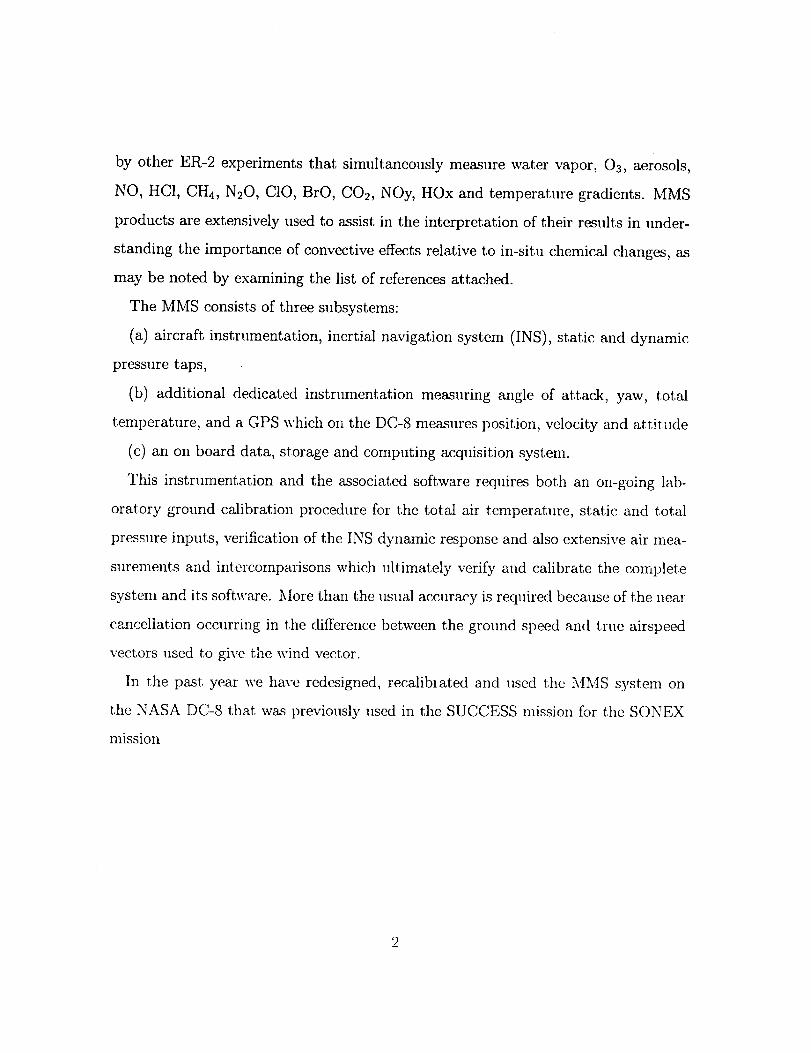
1. MMS DC-8 Calibration Maneuvers SONEX
We will need at some time during each flight at one Mach to be decided;
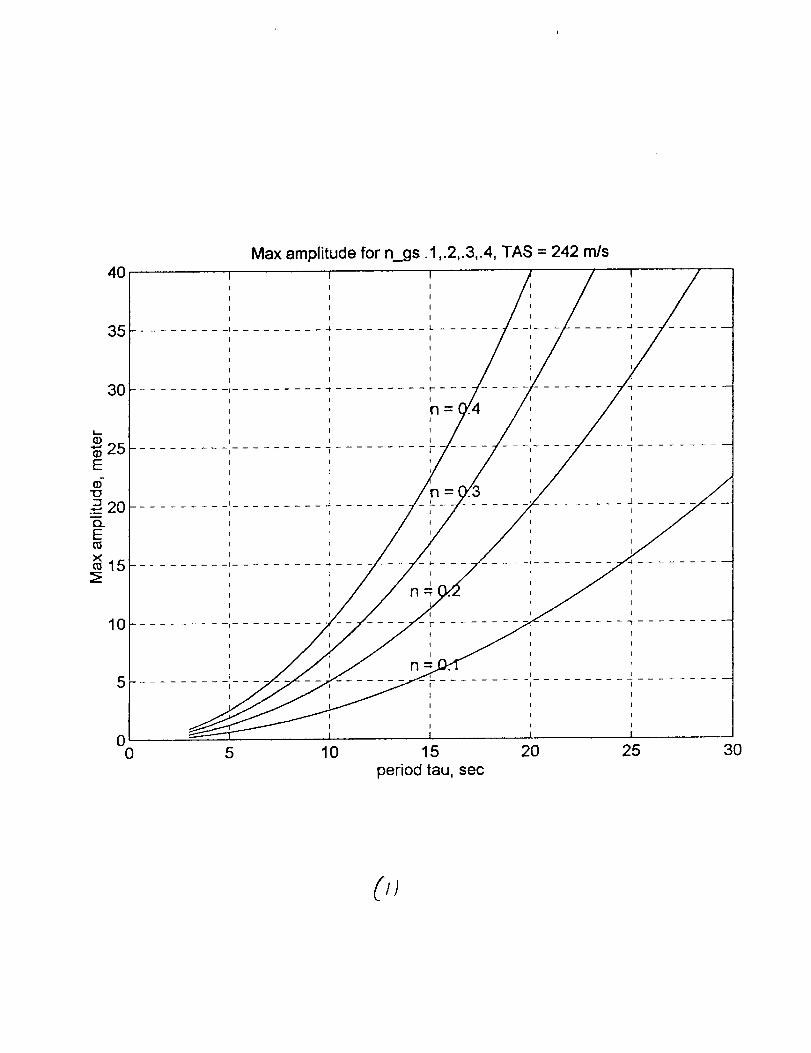
(1) Pitching (wings level): 5 cycles, peak amplitude =k0.2 g; 5 to 10 second
period for each cycle. The DC-8 will ascend an descend about 10 to 30 feet during
this pitching. Time required -- 1 min.
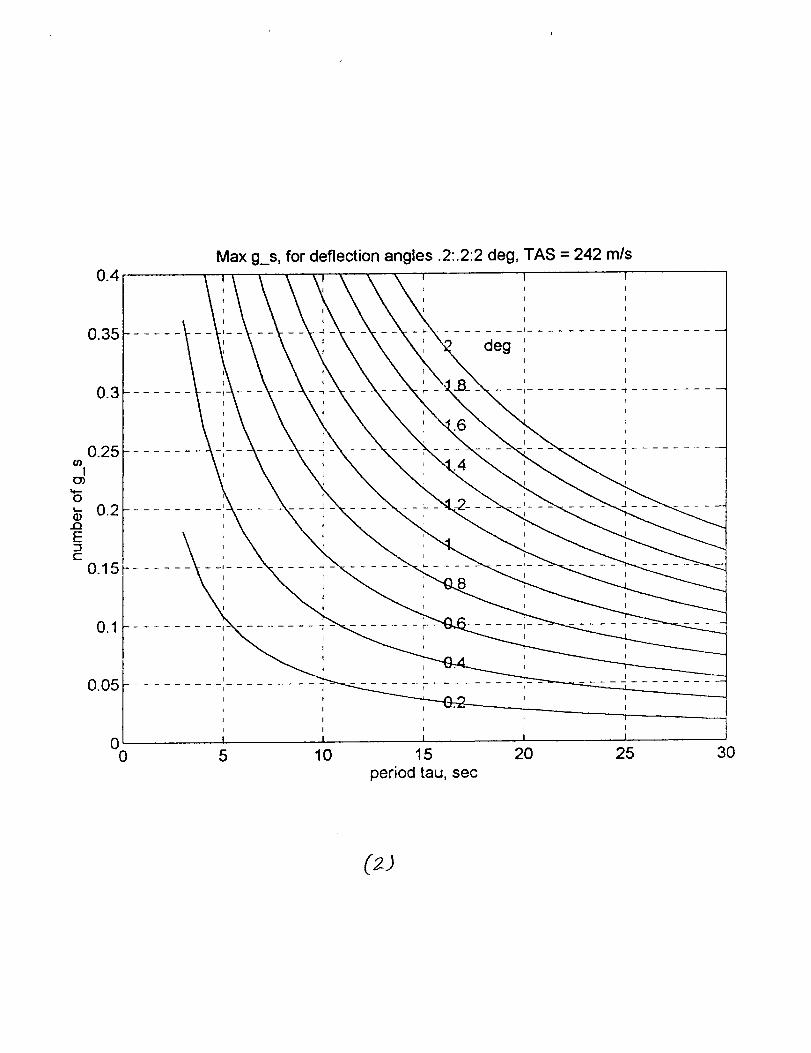
(2) Yawing (wings level): 5 cycles, peak amplitude =k2 deg; 5 to 10 second
period for each cycle.
The wings should be kept reasonably level [+ 1 to 4 °] during the yaws. Time
required ---- 1 min. The Mach number variation should be kept within =t=0.02.
The pitch and sideslip maneuvers should be sinusoidal in naturc, smoothly
vaz34ng from the peak plus to peak minus.
(3) One square circle, either right or left, at appro._dmately constant altitude
consisting of;
(a) Four 90 deg standard bank turns, connected by
(b) Four 20 second straight legs, wings level. The last leg heading will be
the same as the original straight leg.
The square circle need not bc done at either the same place, or altitude as ttle
wiggles (1),(2). The Mach number variation should be kept wittfin :fi0.02.
Tile time required for the square circle -----8 min.
The square circle can be put in as two additional 90 deg q- straight sections
to a required 180 deg turn, or perform a keyhole turn rather than a simple 180
deg tulzL We need a full 360 deg heading range for this maneuver.
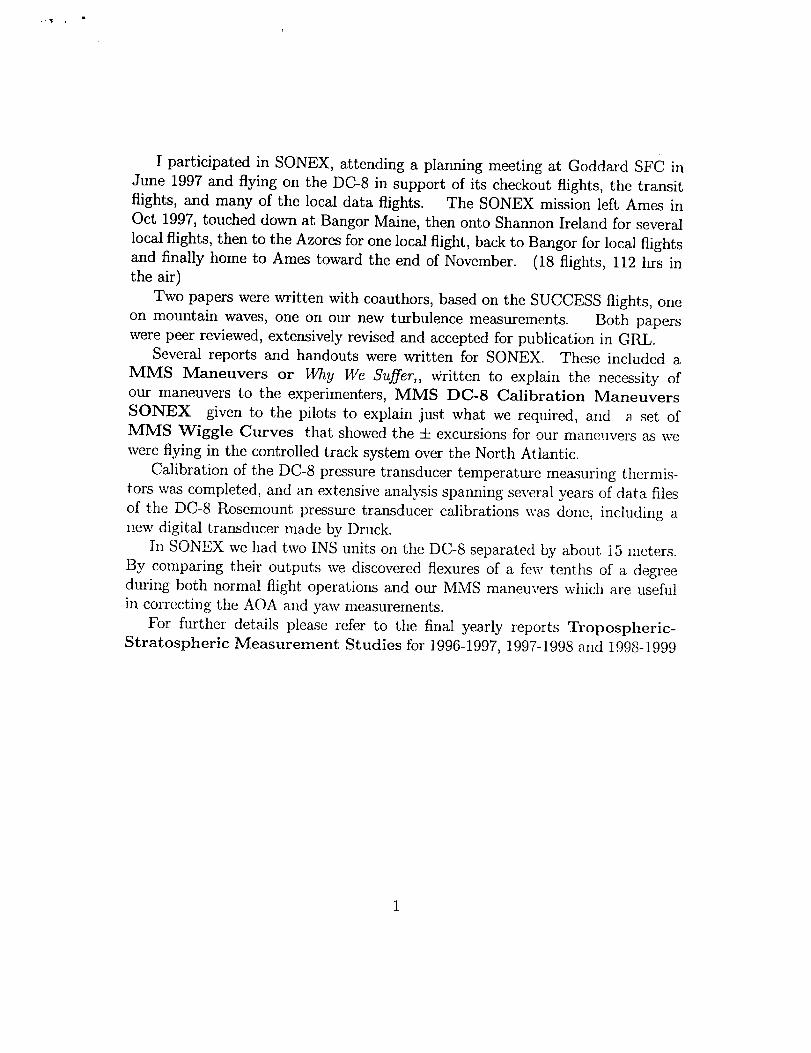
Five Cycle Sinusoidal Plot. Peak amplitudes are + 2 deg or 0.2 gPeak to peak time intervals are 5 to 10 sec.
_ /,4s
!
40
35
3O
Max amplitude for n._.gs .1 ,.2,.3,.4, TAS = 242 m/s
(D"" 25 ..............................
E
_20__ .................... -; .....121_E
X15 .......... '..............
t
I
I
I
10 .........
i
I
I
.......... i _ _
I 'I I
I
I
0 i0 5 10
I
I
i
I
.... I ........
I
I
I
........ "c -
15 20 25
period tau, sec
I3O
(/)
0.35
Max g_s, for deflection angles .2:.2:2 deg, TAS = 242 m/st t
I I
I I
deg' I I
L
I I
J
L
I
I
I
I
0.15
0.05
00
I
5 10 15 20 25period tau, sec
i3O
(2J
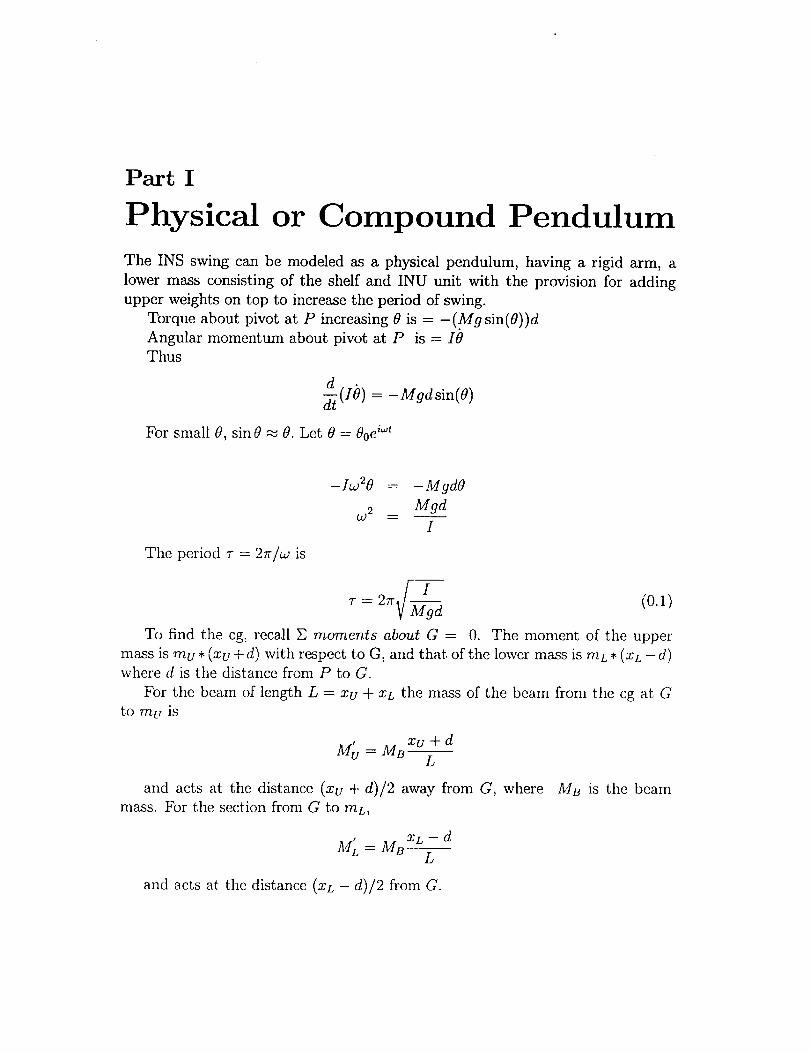
Part I
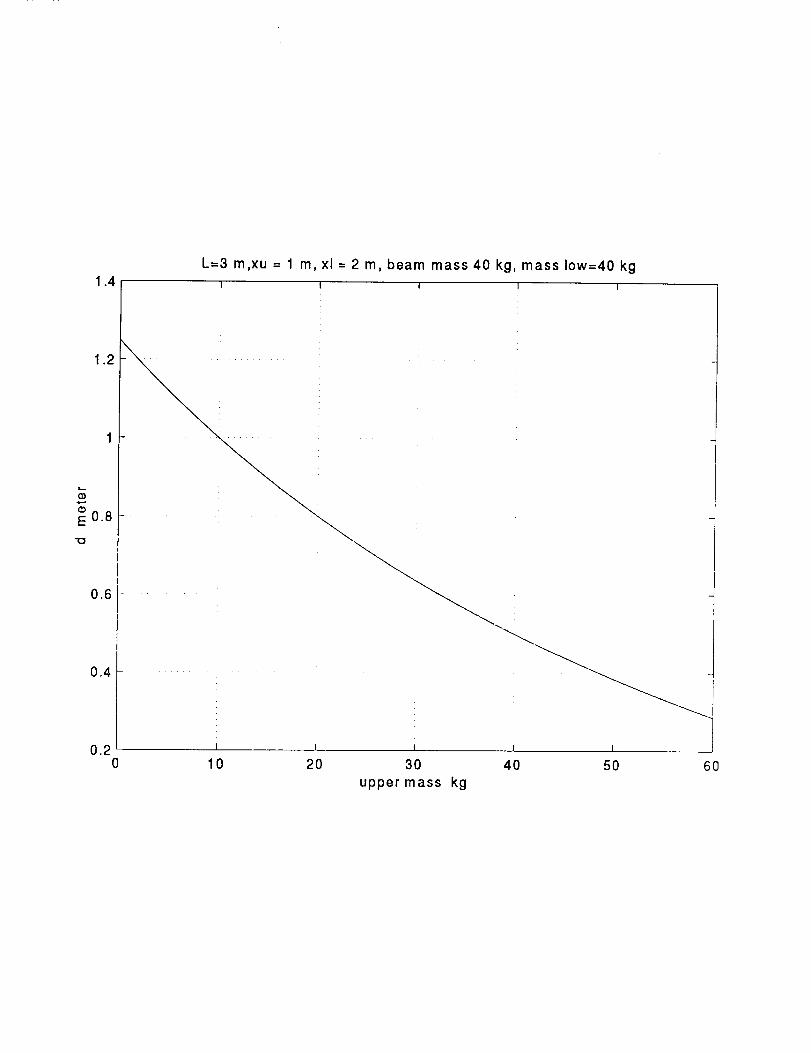
Physical or Compound Pendulum
The INS swing can be modeled as a physical pendulum, having a rigid arm, a
lower mass consisting of the shelf and INU unit with the provision for adding
upper weights on top to increase the period of swing.
Torque about pivot at P increasing 0 is = -(Mgsin(0))dAngular momentum about pivot at P is = I0
Thus
d (Io) = -Mgdsin(O)
For small 0, sin 0 _ 0. Let 0 = Ooei_t
The period 7 = 27r/w is
-Iw20 - -MgdO
Mgd02 2 --
I
/iT-- 2_-V-M-_d (0.1)
To find the cg, recall E moments about G = 0. The moment of the upper
mass is mu * (xu + d) with respect to G, and that of the lower mass is rnL * (XL -- d)
where d is the distance from P to G.
For the beam of length L = xu + xL the mass of the bean, from the cg at G
to mu is
I
Mu = MBzU + dL
and acts at the distance (Xu + d)/2 away from G, where
mass. For the section from G to mL,
Mu is the beam
-d
1_4'L = MB XL L
and acts at the distance (XL -- d)/2 from G.
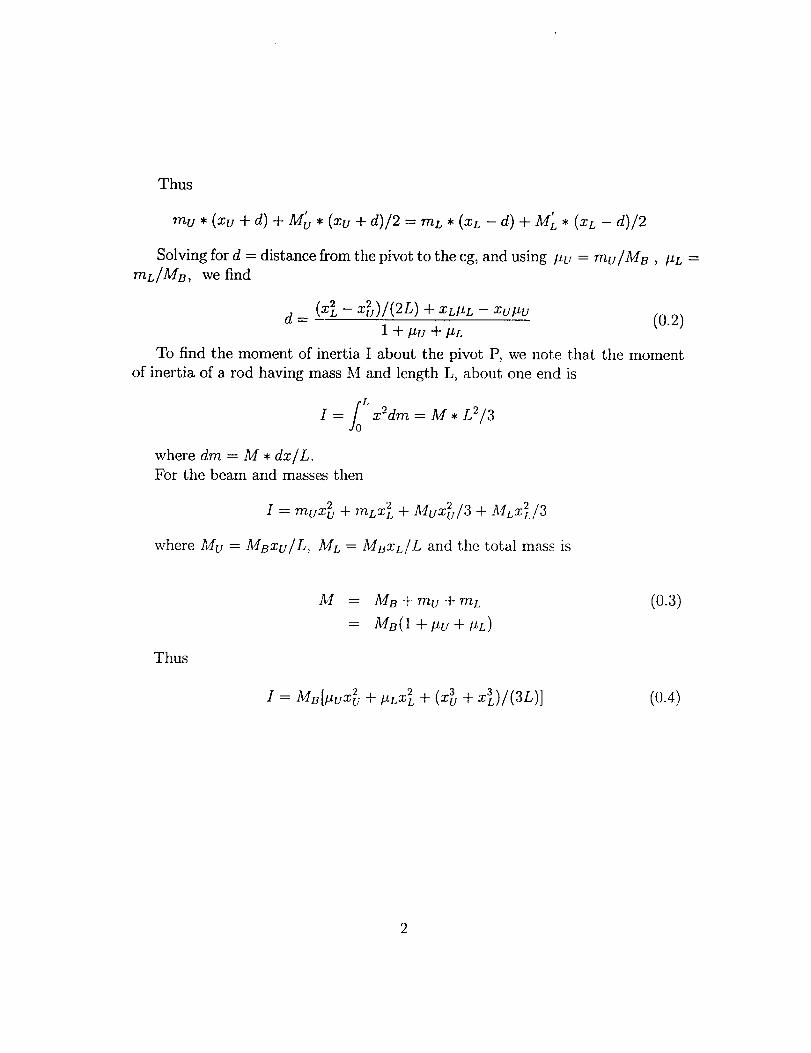
Thus
mu • (xu + d) + M'_• (_ + d)/2 = mL• (_ - d)+ M'L* (_L- d)/2
Solving for d = distance from the pivot to the cg, and using Pu = mu/MB , IAL =
mL/MB, we find
d = (x2L - x_)/(2L) + XLPL -- xU#U (0.2)1 +#u "_-['ZL
To find the moment of inertia I about the pivot P, we note that the moment
of inertia of a rod having mass M and length L, about one end is
_0 LI = x'2dm = M * L2/3
where dm = M • dx / L.
For the beam and masses then
I = mux_ + mLZ2L + Mux_/3 + MLX_/3
where Mu = MBxu/L, ML = MBXL/L and the total mass is
Thus
1_,I = MB + mu + rnL
= M_(1 ,4- PU -_- /AL)
I = MB[#uX'_- + #LX2L + (X3u + x3)/(3L)]
(0.3)
(0.4)
PHYSPEN.M Monday, May 11, 1998 11:42am Page I
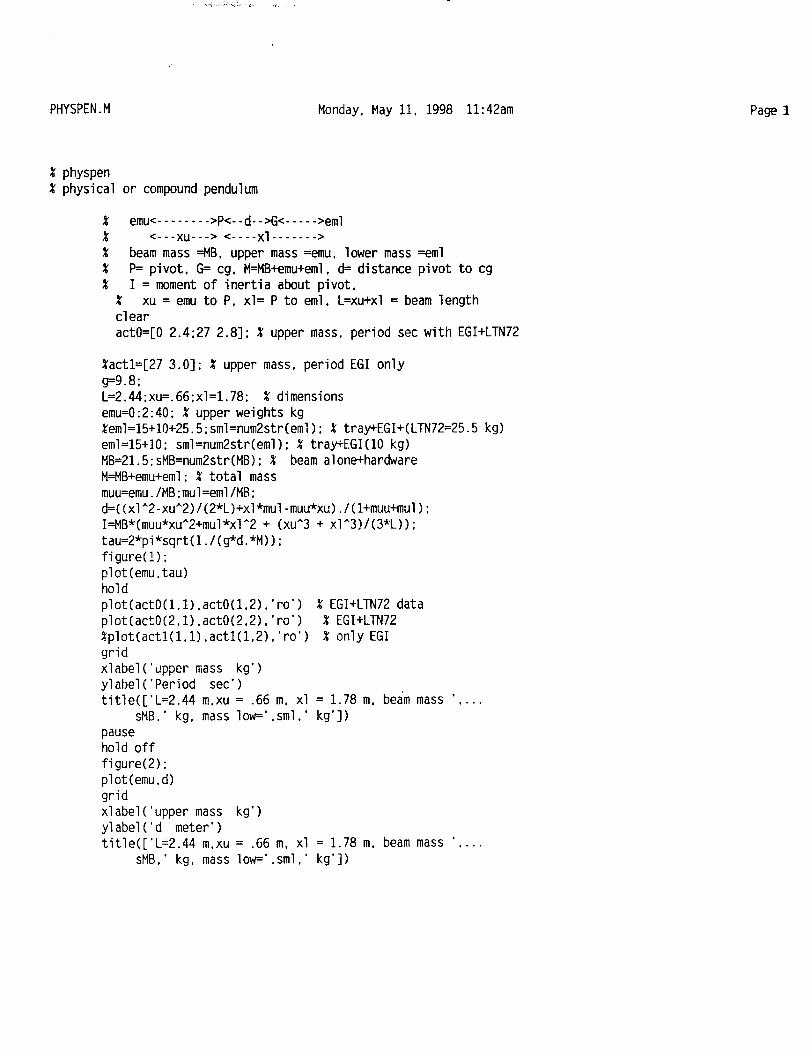
% physpen% physical or compound pendulum
% emu<........ >P<--d-->G< ..... >eml% <---xu---> <.... xl ....... >
% beam mass =MB, upper mass =emu, lower mass =eml% P= pivot, G= cg, M=MB+emu+eml.d= distance pivot to cg% I = moment of inertia about pivot,
% xu = emu to P, xl= P to eml. L=xu+xl = beam lengthclear
actO=[O 2.4;27 2.8]: % upper mass. period sec with EGI+LTN72
%act1=[27 3.0]; % upper mass, period EGI only
g=9.8;L=2.44;xu=.66;xl=1.78; % dimensions
emu=0:2:40;% upper weights kg%eml=15+10+25.5;sml=num2str(eml);% tray+EGI+(LlTI72=25.5kg)
eml=15+]0; sml=num2str(eml);% tray+EGI(10kg)MB=21.5;sMB=num2str(MB);% beam alone+hardware
M=MB+emu+eml;% total mass
muu=emu./MB;mul=eml/MB;
d=((xl^2-xu^2)/(2*L)+xl*mul-muu*xu)./(l+muu+mul);
I=MB*(muu*xuA2+mul*xl^2+ (xu^3 + xIA3)/(3*L));
tau=2*pi*sqrt(I./(g*d.*M));figure(I);
plot(emu,tau)hold
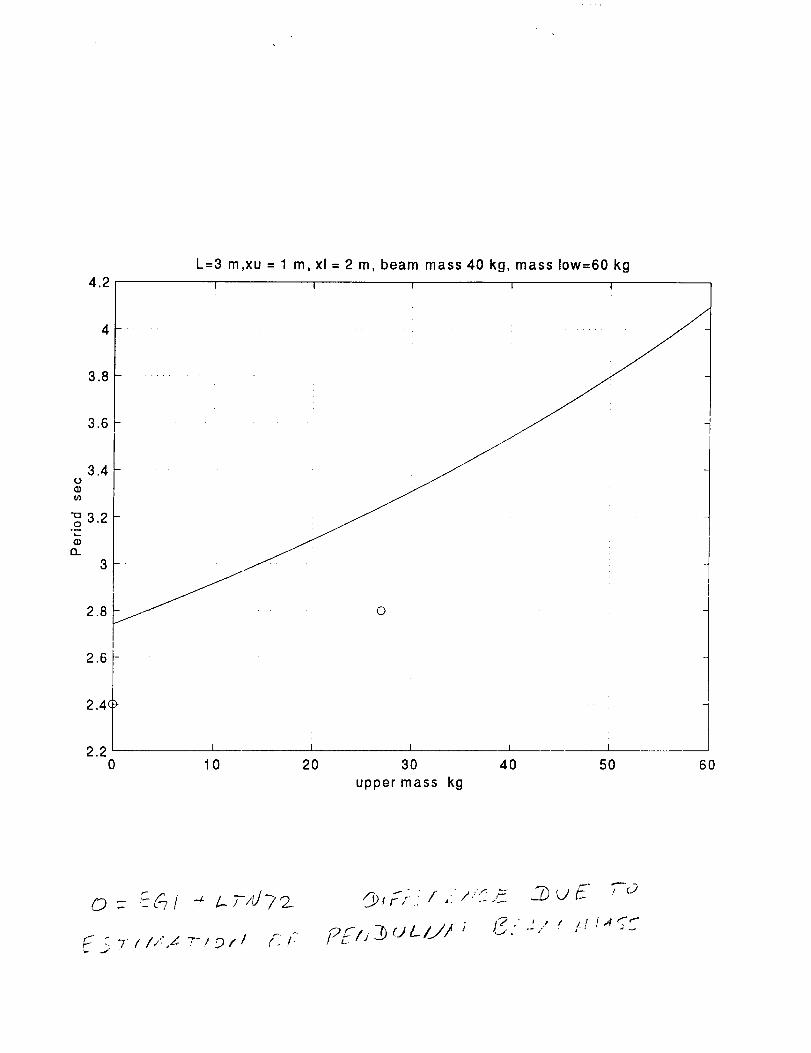
plot(act0(1,1).act0(1,2),'ro')% EGI+LTN72data
plot(act0(2,1),act0(2.2).'ro') % EGI+LTN72
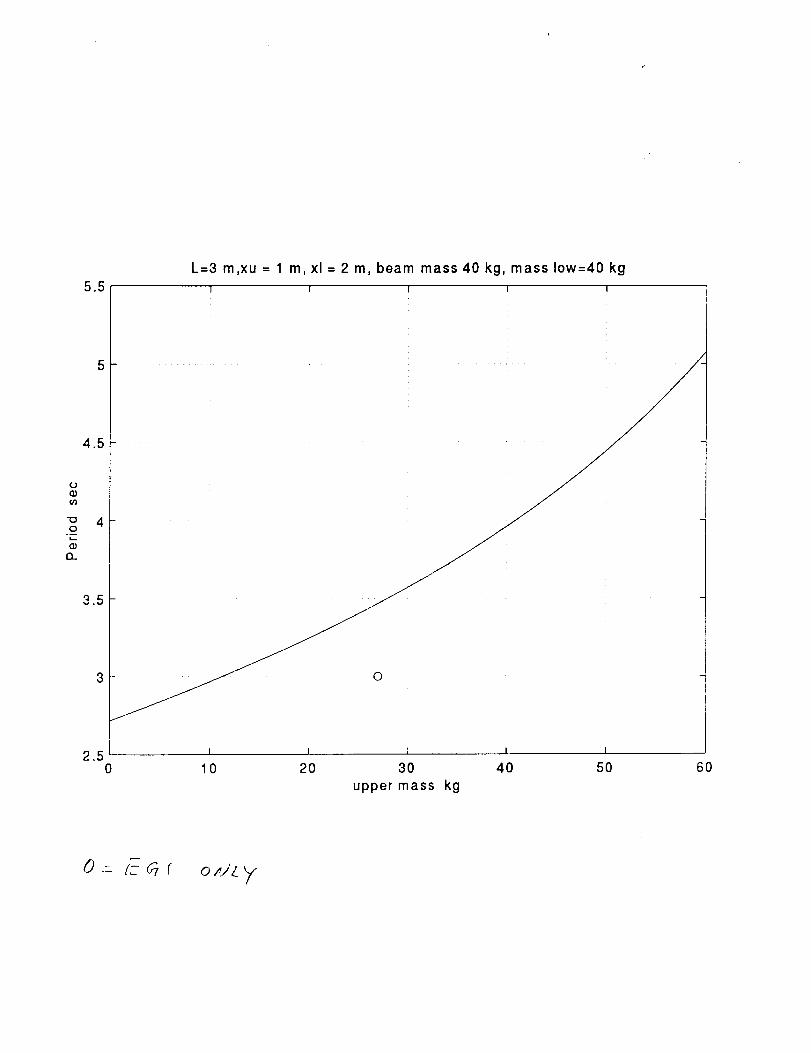
%plot(actl(1,1),actl(1,2),'ro')% only EGIgrid
xlabel('uppermass kg')
ylabel('Period sec')title(['L=2.44m,xu = .66 m, xl = 1.78 m, beam mass ',...
sMB,' kg, mass low=',sml,'kg'])
pausehold off
figure(2)"
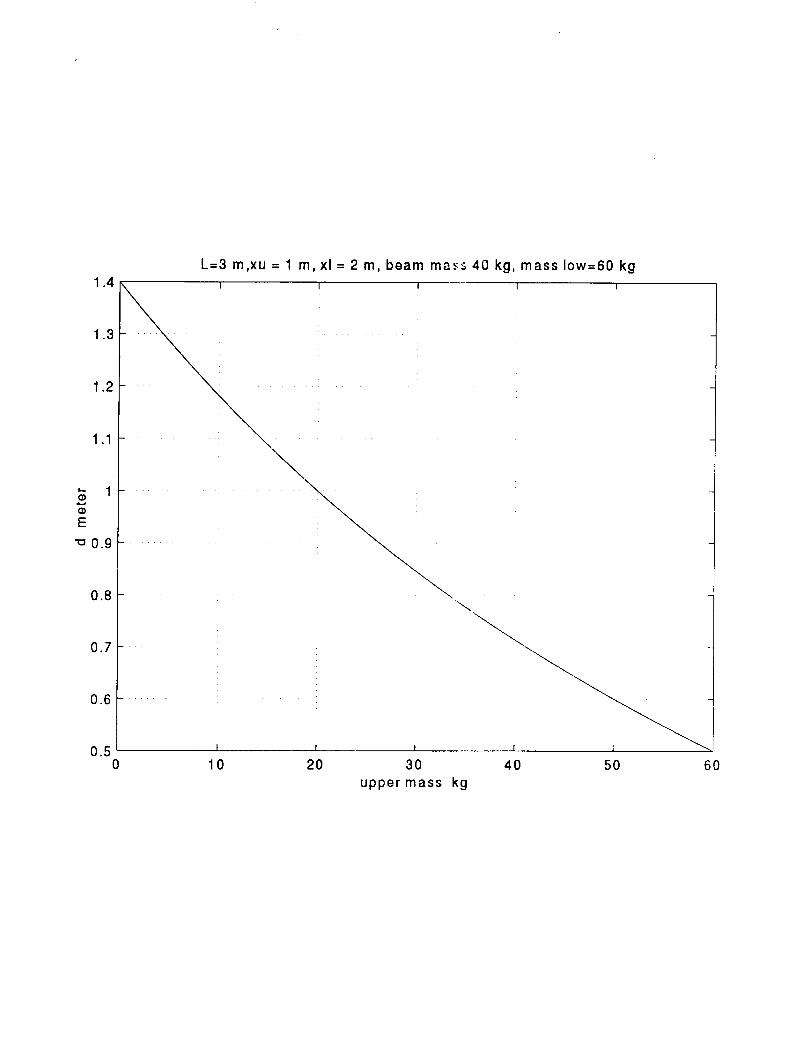
plot(emu,d)
grid
xlabel('uppermass kg')
ylabel('d meter')title(['L=2.44m,xu = .66 m, xl = 1.78 m, beam mass '....
sMB,' kg, mass low='.sml,'kg'])
4.2
4
3.8
3.6
3.4
Q
3.2
Q_
3
2.8
L=3 m,xu = 1 m, xl = 2 m, beam mass 40 kg, mass low=60 kg
I I I I
©
t2.6
2.4(
I I2.20 10 20
I I
30 40
upper mass kg
50 6O
©- '_61 4 z_;-/d?_
1.4
1.3
1.2
1.1
$ 1<D
E
-o0.9
0.8
0.7
0.6
0.50
I
"\
.\\
\
\\
\\
\
!
L=3 m,xu = 1 m, xl = 2 m, beam mass 40 kg, mass low=60 kgI I I I
10
\\
\.\
\\
\,\
\\
\\
I
2O
\\
\\
I 1
30 40
upper mass kg
t
50 60
5.5L=3 m,xu = 1 m, xl = 2 m, beam mass 40 kg, mass low=40 kg
I I I
"00
°M
13.
4.5
4
3.5
2.50
t I i I 1
10 20 30 40 50
upper mass kg
6O
o ---E _ r o_,,'zy
1.4
1.2
$
E 0.8
0.6
0.4
0.2
L=3 m,xu = 1 m, xl = 2 m, beam mass 40 kg, mass low=40 kgI f I I I
10 20 30
upper mass kg
40 50 60
II
E
II
o
C:,
C:,
I !1 I I I.I I I II ! I II! I II I
m
,,,--I
V
o
!
Standard error of estimate = 7.101018871201386D-03
Poly order = 2 Number of points = 5
Y = SUM (A(J)*X^J) ; J = 0 TO 2 Num points 5
A( 0 ) = 25.74315988694702 +/-
A( 1 ) = -27.52982616251586 +/-
A( 2 ) = -2.355885958562695 +/-
4.361343709575474D-03
3.230050769658745D-02
7.858226017426256D-02
RESIDUAL RMS Y = 4.491266027821047D-03 C
MAX RESIDUAL(meas-fit) = 7.617950439453125D-03
AT X = -4.369334755116583D-17
R0/Rtstand = 1.133943534357378
t Tstand = 25.75077819824219 deg C
Ep = 5.126705 volts
TITLE LINE :
THERMISTER CALIBRATION DC-8 PI&P2 PRESS SENSOR
FILE: dc8_plp2
auto file save name will be sbdcS_plp2
name OK to save ? y/n ?
TEL File=DC8 P1 P2
II
o
aE
II
0
.4.a,I
r_
O
w
I I! I I II I ! II I I II I I!11
i
V
o
I
P2291.M Tuesday, May 5, 1998 11:15am Page 4
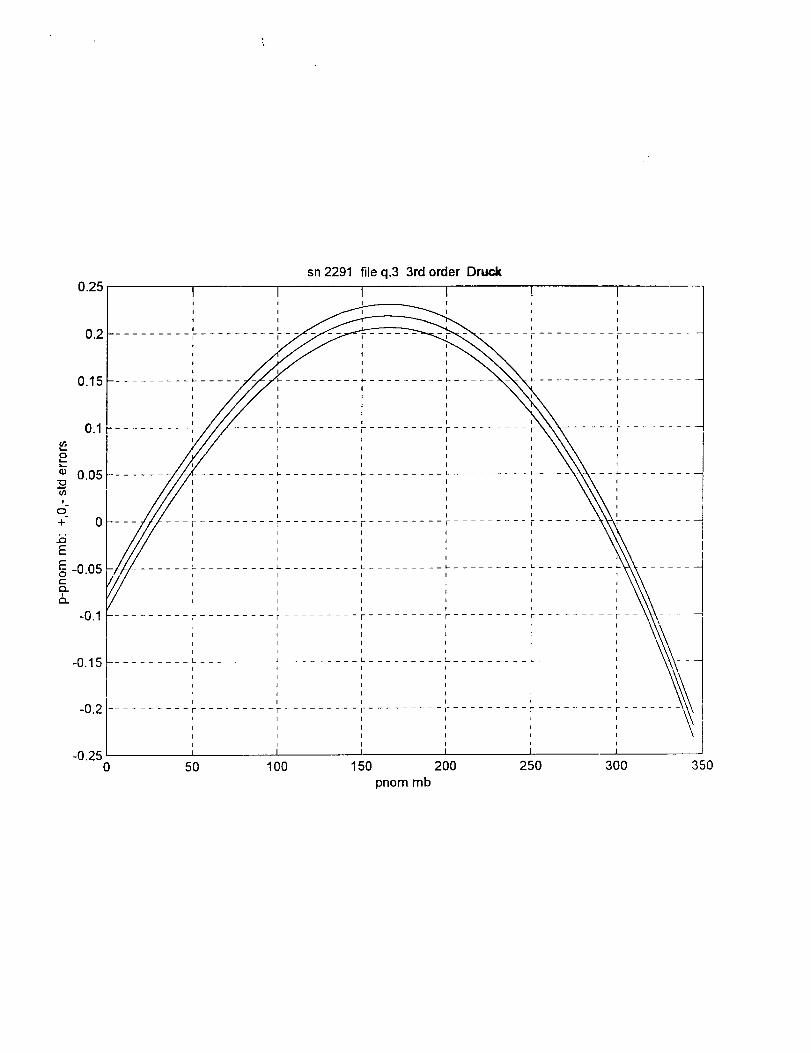
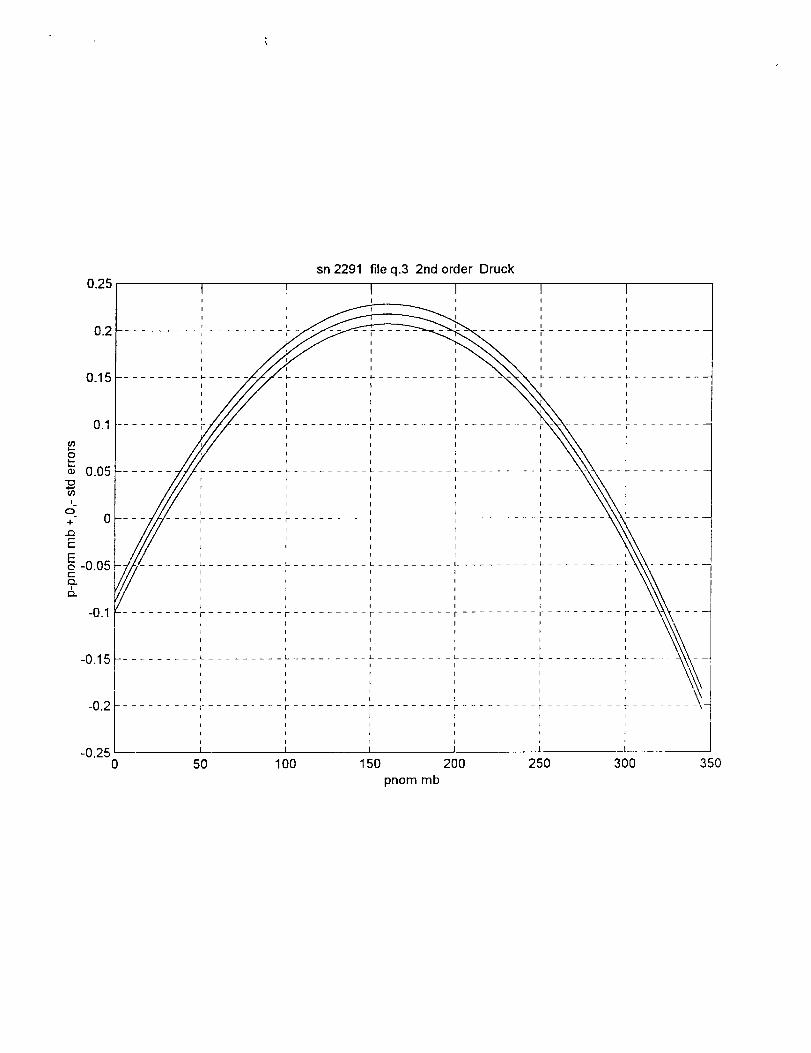
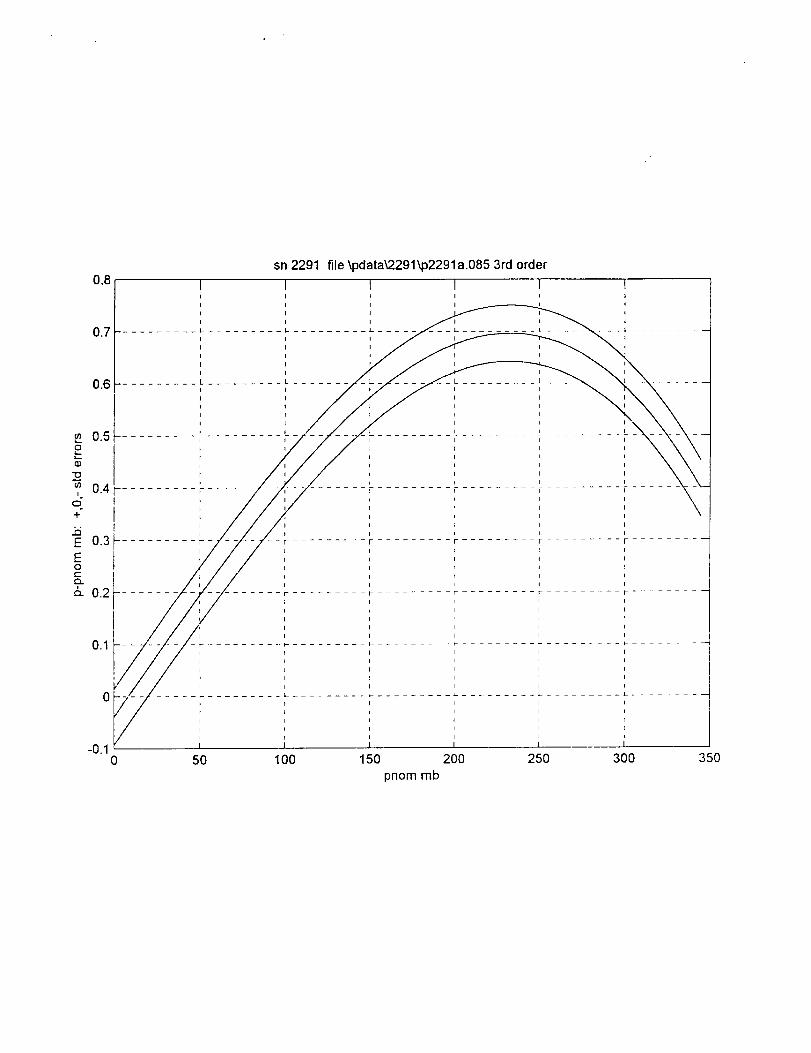
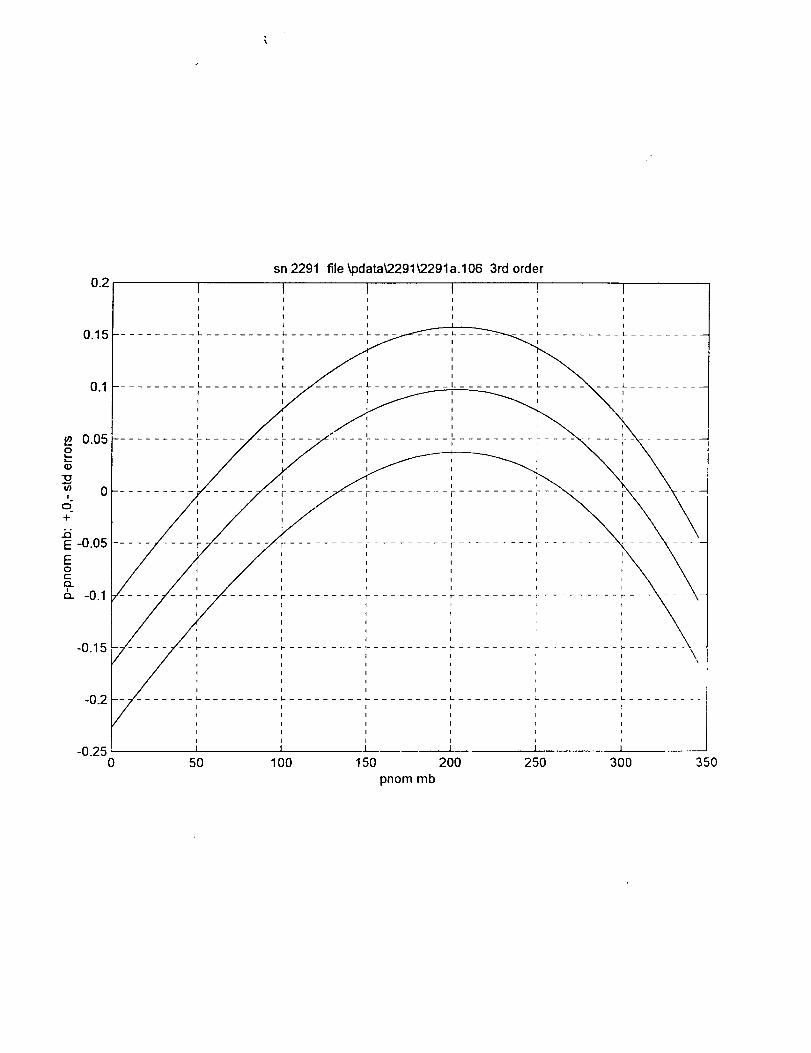
figure(7)clear A
A=A7(:,1);siga=flipud(A7(:,2));
p0=polyval(A,v);
dp0=p0-pnom;
plot(pnom,dp0-siga(1),pnom,dp0,pnom,dp0+siga(1))
xlabel('pnommb')
ylabel('p-pnommb: +,0,- std errors')
title('sn 2291 file \pdata\2291\2291a.1063rd order ')
grid
pause
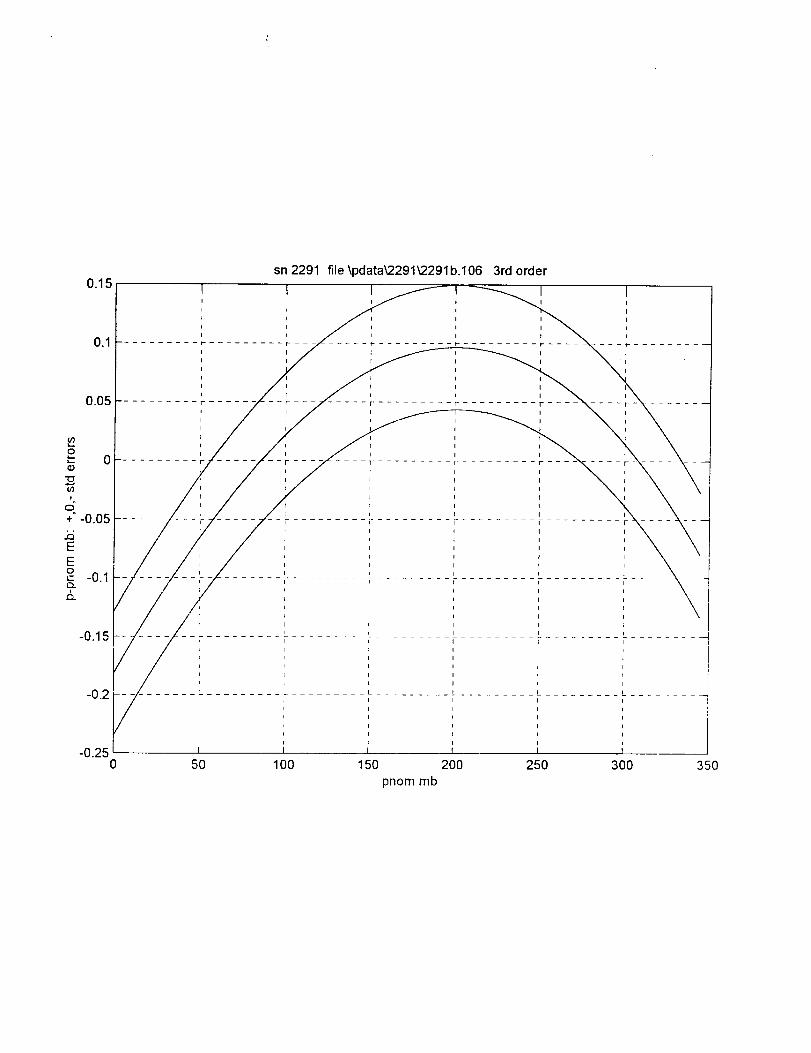
figure(8)clear A
A=A8(:,l);siga=flipud(A8(:,2));
p0=polyval(A,v);
dp0=p0-pnom;
plot(pnom,dp0-siga(1).pnom,dp0,pnom.dp0+siga(1))
xlabel('pnommb')
ylabel('p-pnommb: +.0.- std errors')
title('sn 2291 file \pdata\2291\2291b.106 3rd order
grid
pause
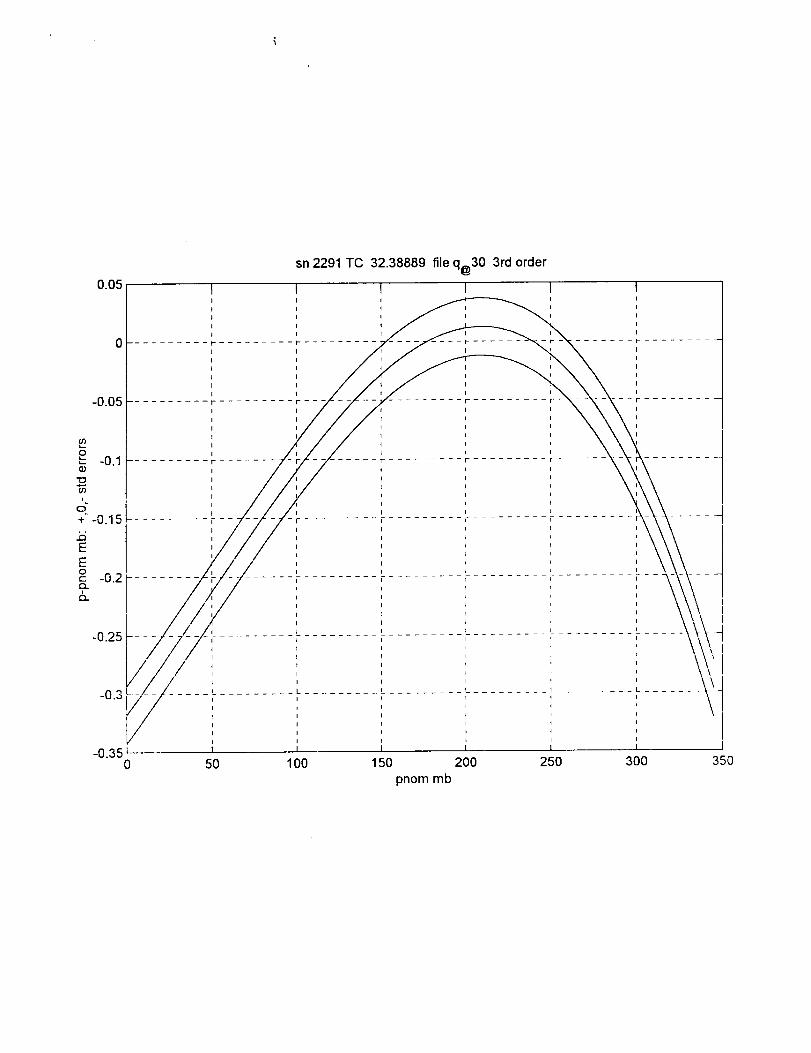
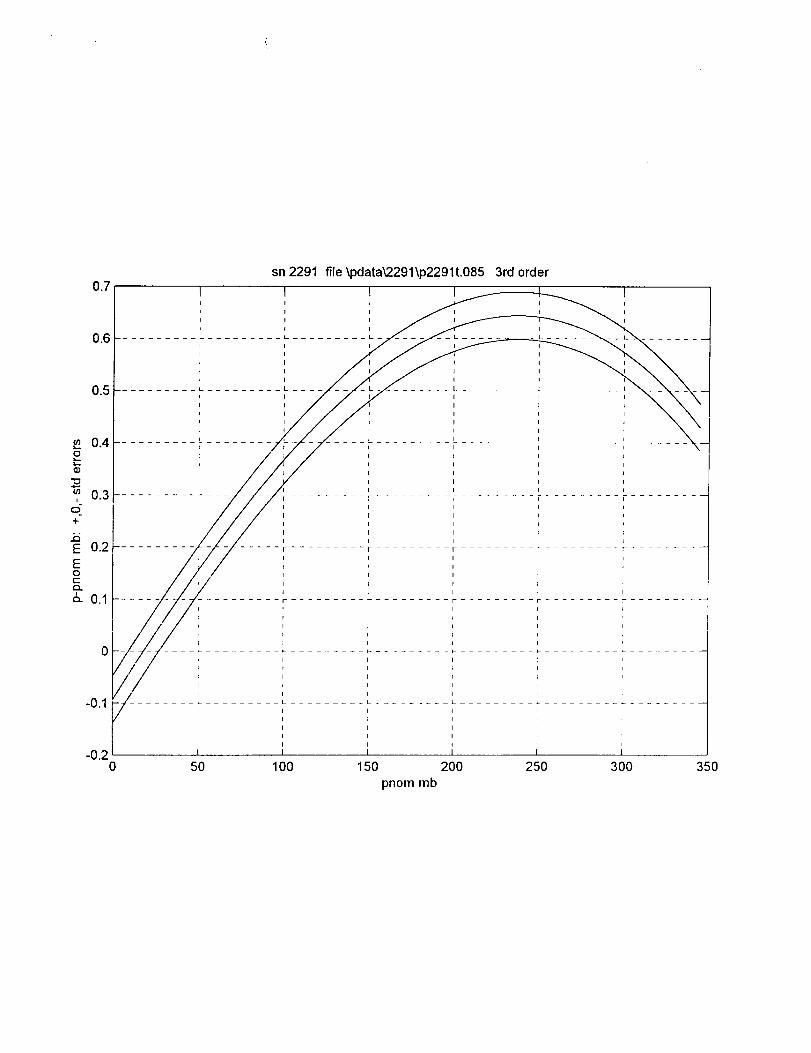
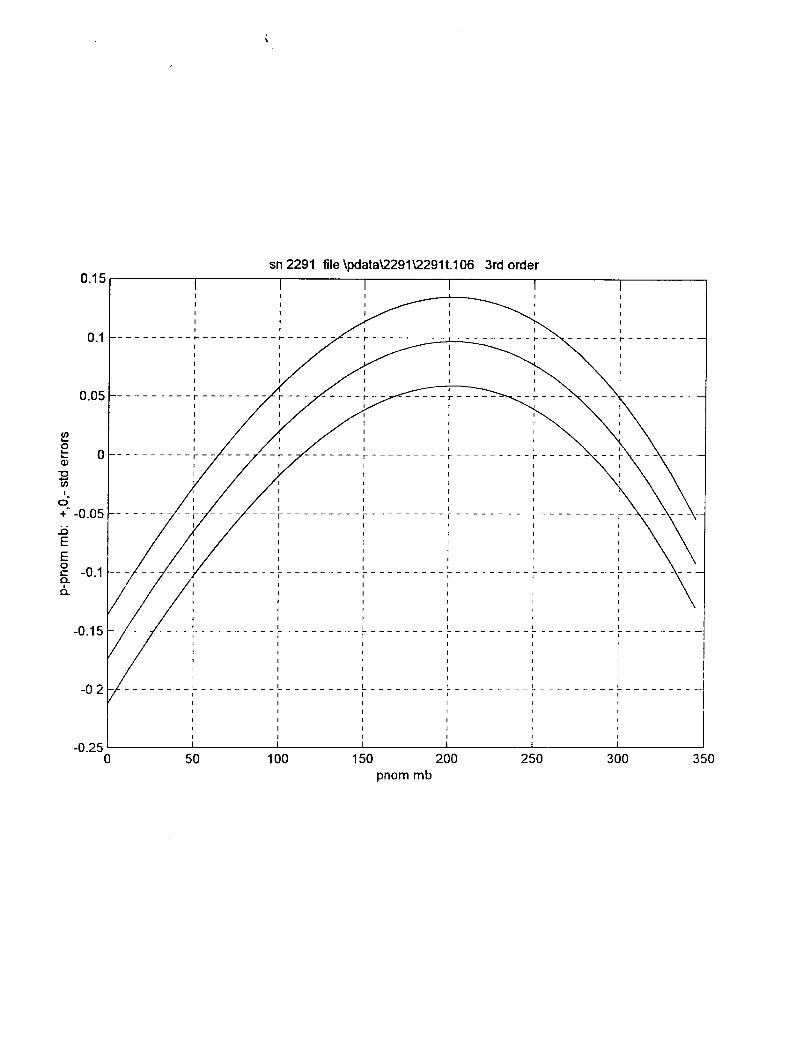
figure(9)clear AA=A9(:,l);siga=flipud(A9(:,2));p0=polyval(A,v); % nomdp0=p0-pnom;plot(pnom.dp0-siga(1),pnom.dp0,pnom.dp0+siga(1))xlabel('pnom mb')ylabel('p-pnom mb: +o0.- std errors')title('sn 2291 file \pdata\2291\2291t.106 3rd ordergrid
,)
.)
0.25
o.15 ....... :-....I
I
I
I0.1 r .......... +
0.05 l ......
sn 2291 file q.3 3rd order Druck
I II
I I
I
I
i" [- .....
I
l
I
I
..... i
-0.15 ..............................................................
-0.2.................................................. r ..........+
I
I
I
-0.25 i =0 50 100 150 200 250 300 350
pnom mb
0.1
0.05"O
i
O
+ 0,,Q
E
oE-0.05Q.
0.25 tI
I
I
I0.2 .................... c
0.15 ..............I
I
I
I
i
-0.2
sn 2291 file q.3 2nd order Druck
I
I
.......... I- ...................
I
I
I
i
.................... L .......... L .........
I i
I t
I I
I I
I I
................... F ......... f- .........
I I
I I
I I
I I
I 1 I
50 100
I
.......... L. ......... L
I
d
J I
I I
......... I........... r
I I
I
I I
; I
......... L .......... L
I I
r I
t
......... F ......... F
I I
t I
d f
I 1
150 200 250 300pnom mb
...... i
350
0.05
-0.05
1I
I
I
l
I
.......... t- ..........
.......... i- .........
'9-o -0.1 .......... r .......
U)
i
o"+" -0.15 .............i5EE0c -0.2F-........Q_ I
sn 2291 TO 32.38889 file q@30 3rd order
I
I
I
I
I
I
I
I
.......... F
.................. F ......
I/ :
i
.... L ............................... _ ...........................
i
i50 100 250 300150 200
pnom mb
350


o
I
o-+
i5EEOt--
6.
08
07
06
sn 2291 file \pdata_291\p2291a.085 3rd order
I I I 1
°5 ......................
04
.3 ..........
02 ......
01
t
-010 50 100 150 200 250 300 350
pn0m mb
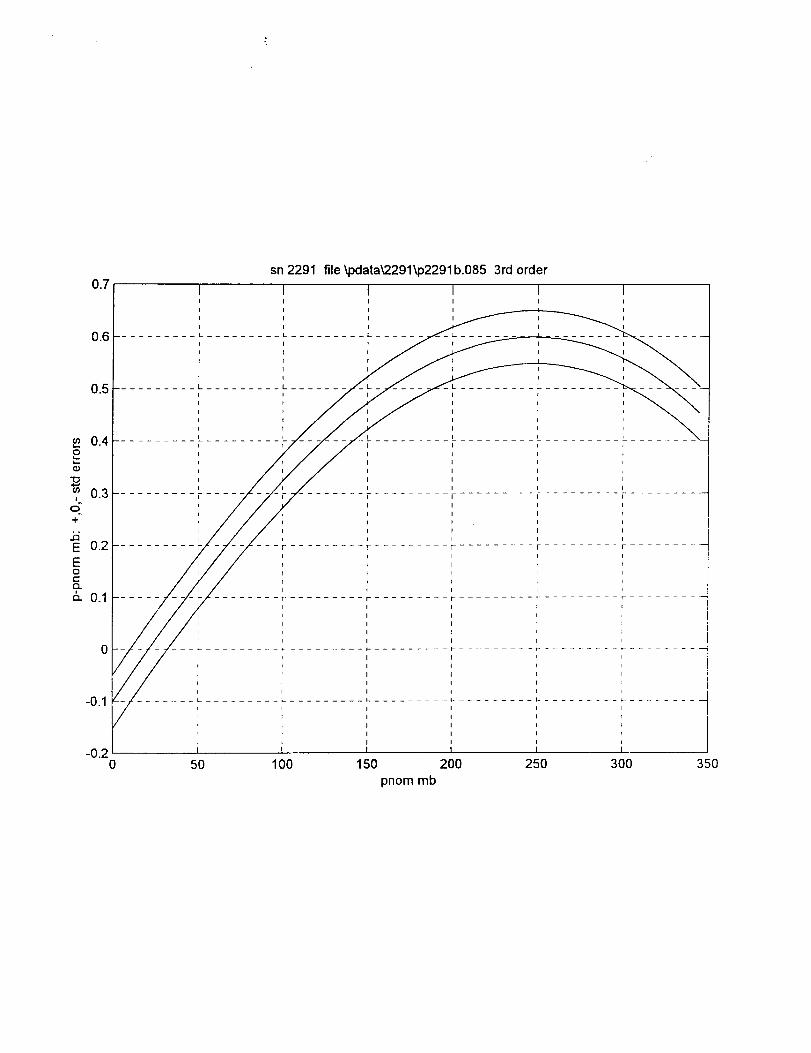
sn2291file\pdata_2291_p2291b.0853rdorder
......... L .........
i
0
-0.20
F" ......... F ..........
i I
r
i
r .........
i
i
i
i
i
r i
......... F ..........
i
i
i
I
i
a
I
I I I I I
I I I I i
I l I I I
T _ I I I
I I I I I
50 100 150 200 250 300 350
pnom mb
I
0
-0.20
sn 2291 file \pdata_291\p2291t.085 3rd order
1 II I
I I
I I
I
I
........ L ............
................ I- ......... 1- .........
I I
I I
t i I
i I I
t
50 1O0 150 200
pnom mb
1
I
--L .......
I
I
I
....... L ..................
.................................. r
I
I
I
...........................
t
t
I
I
I
........................... F ....................
: I
I
I I
i I
......... L ......... _ .........
I I
r I
I
= i _250 300 350
0.15
-0.250
sn 2291 file _pdata_2291_2291a.106 3rd order
I
I
I
I
I I I
..... L ......... L ......... L ....
: : LI I h I
.... F ......... C ......... T ........ i-
I I I I
' iI I I
II
I I I
I I I
r- .................. F ................... F -"
; I I
I I I
I I d
Ii
_lt
50 100 150 200 250 300 350
pnom mb
-7 ..............................., , ,'-..........................., , \I I I ' II
I I I I I I
I I I I I I
--1- ......... I- ......... _ ......... I- ......... _ ......... I- ..........
I I I I r
I I I I I I
I I I I I I
I I I I I I
1 I ....I I I I
sn 22910.15 I I
I i
I I
I I
l I
I I
u.1 .......... _ ......... _- -I
I
I
i
I
o.o5 .......... " ....I
i
i
i
I
.......... i
-0.1
/
-0.2
-0.250 50 100
I
file \pdata_2291_291b.106 3rd order
Ii
I
i I
i I
I I
......... t- ......... t- ....I
I t
I
I I
I I
--_ ............. F ......... r ........ P ........, _ ,\ 7_,'_ ,/-/- : _ \', I
,,,r J ' ' _ \_ \ I
: / : ', :\ \ \I--F ........ T .......... F ......... F ........ F .......
L ...................
150 200 250pnom mb
1
300 350
0.15
0.05
-0.2
-0.25
sn 2291 file \pdata_.291_291t.106 3rd order
I II I
I I
I I
I
I
.... I- ....
1I
l
I
t
t- .......
I
I
0 50 100 150 200 250 300 350
pnom mb
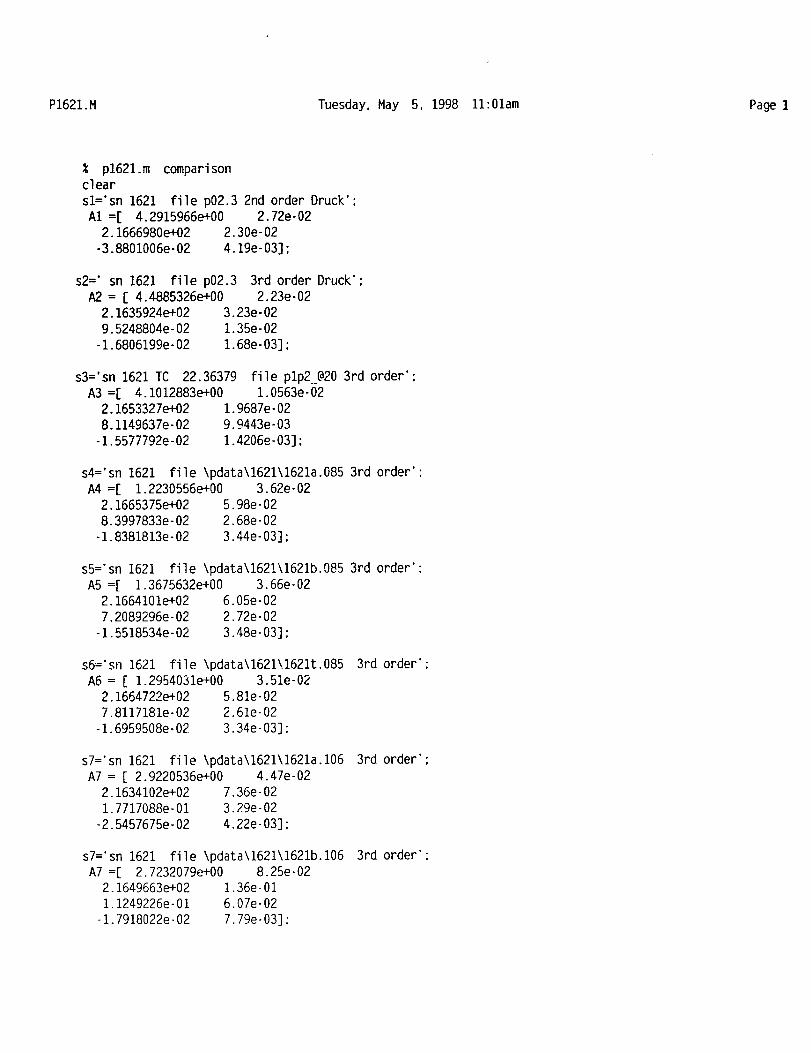
P1621.M Tuesday, May 5, 1998 11:01am Page I
% p1621.m comparisonclear
sl='sn 1621 file p02.3 2nd order Druck':A1 =[ 4.2915966e+00 2.72e-02
2.1666980e+02 2.30e-02
-3.8801006e-02 4.19e-03];
s2=' sn 1621 file p02.3 3rd order Druck';
A2 = [ 4.4885326e+00 2.23e-022.1635924e+02 3.23e-02
9.5248804e-02 1.35e-02
-1.6806199e-02 1.68e-03];
s3='sn 1621TC 22.36379 file plp2_@20 3rd order':A3 =[ 4.1012883e+00 1.0563e-02
2.1653327e+02 1.9687eo028.1149637e-02 9.9443e-03
-1.5577792e-02 1.4206e-03]:
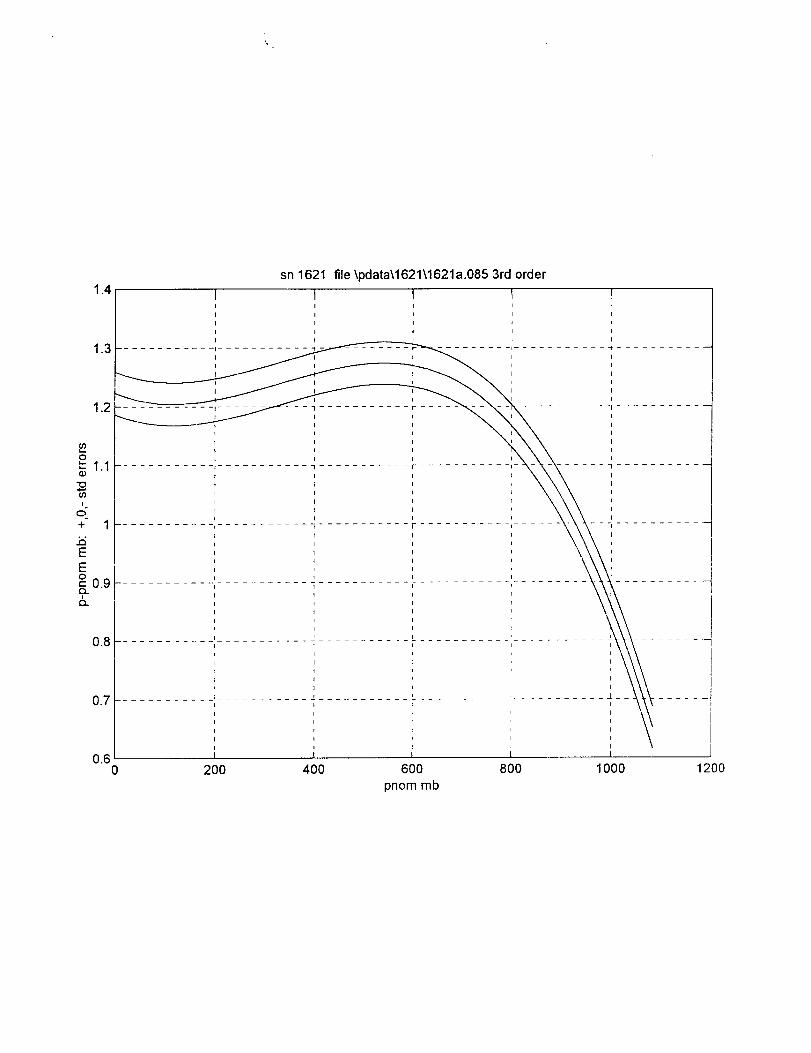
s4='sn 1621 file \pdata\1621\1621a.085 3rd order':A4 =[ 1.2230556e+00 3.62e-02
2.1665375e+02 5.98e-028.3997833e-02 2,68e-02
-I.8381813e-02 3.44e-03];
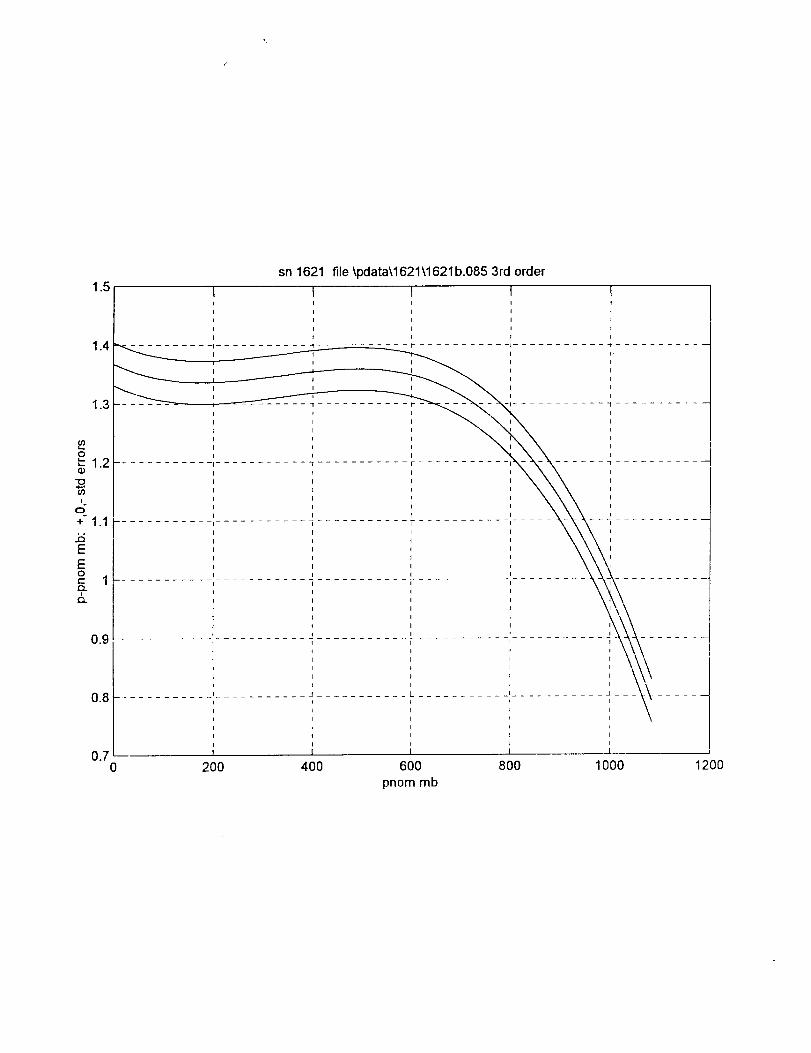
s5=°sn 1621 file \pdata\1621\1621b.085 3rd order';A5 =[ 1.3675632e+00 3.66e-02
2.1664101e+02 6.05e-027.2089296e-02 272e-02
-I.5518534e-02 3,48e-03];
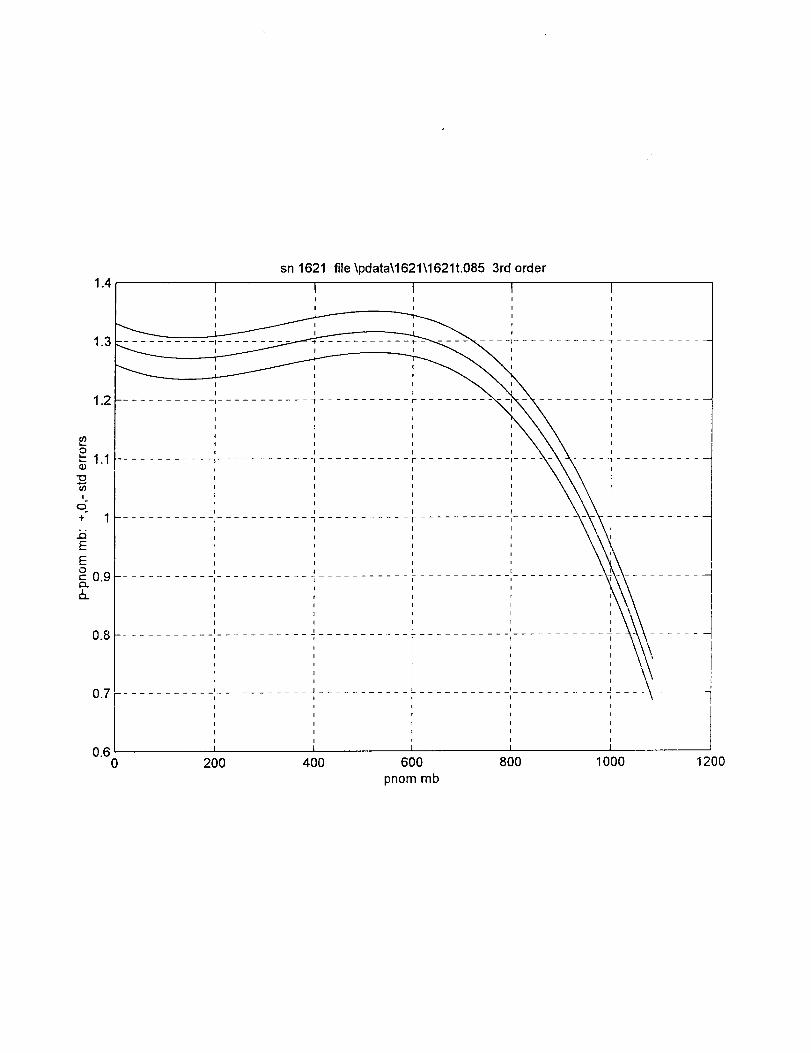
s6='sn 1621 file \pdata\1621\1621t.085
A6 = [ 1.2954031e+00 3.51e-02
2.1664722e+02 5.81e-02
7.8117181e-02 2.61e-02
-1.6959508e-02 3.34e-03]:
3rd order':
s7='sn 1621 file \pdata\1621\1621a.106A7 = [ 2.9220536e+00 4.47e-02
2.1634102e+02 7.36e-021.7717088e-01 3.29e-02
-2.5457675e-02 4.22e-03];
3rd order';
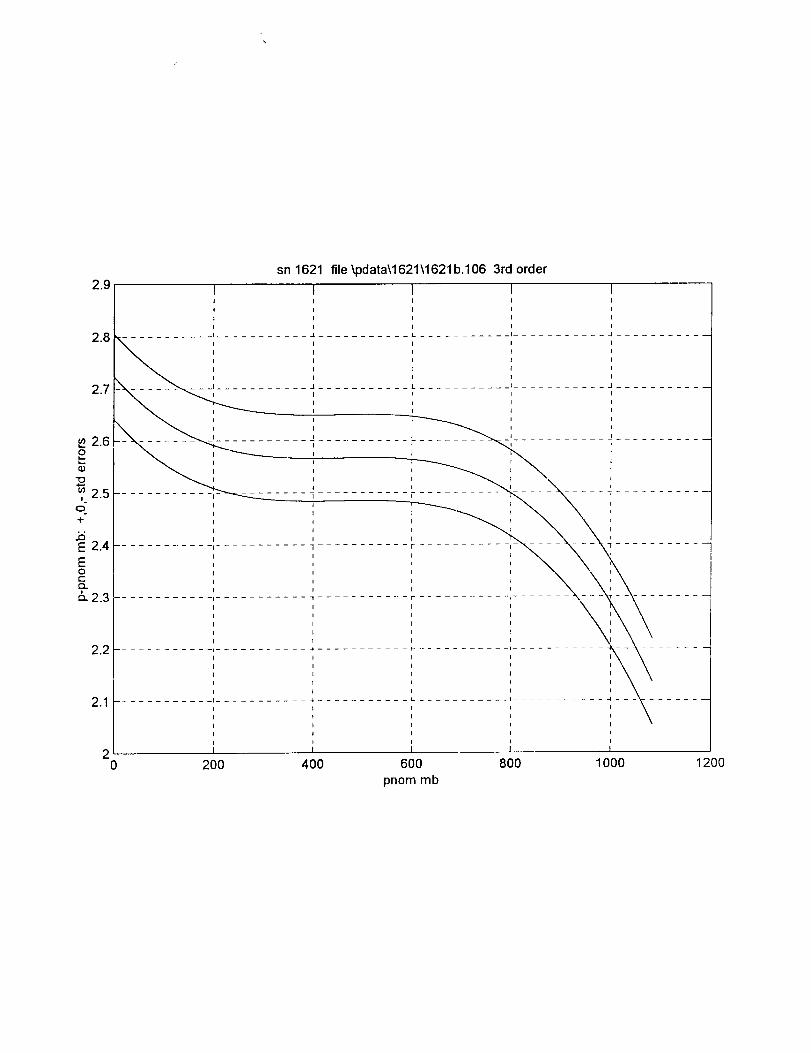
s7='sn 1621 file \pdata\1621\1621b.106A7 =[ 2.7232079e+00 8.25eo02
2.1649663e+02 1.36e-0111249226e-01 6.07e-02
-I.7918022e-02 7 79e-03];
3rd order';
P1621.M Tuesday.May 5. 1998 11:01am Page 2
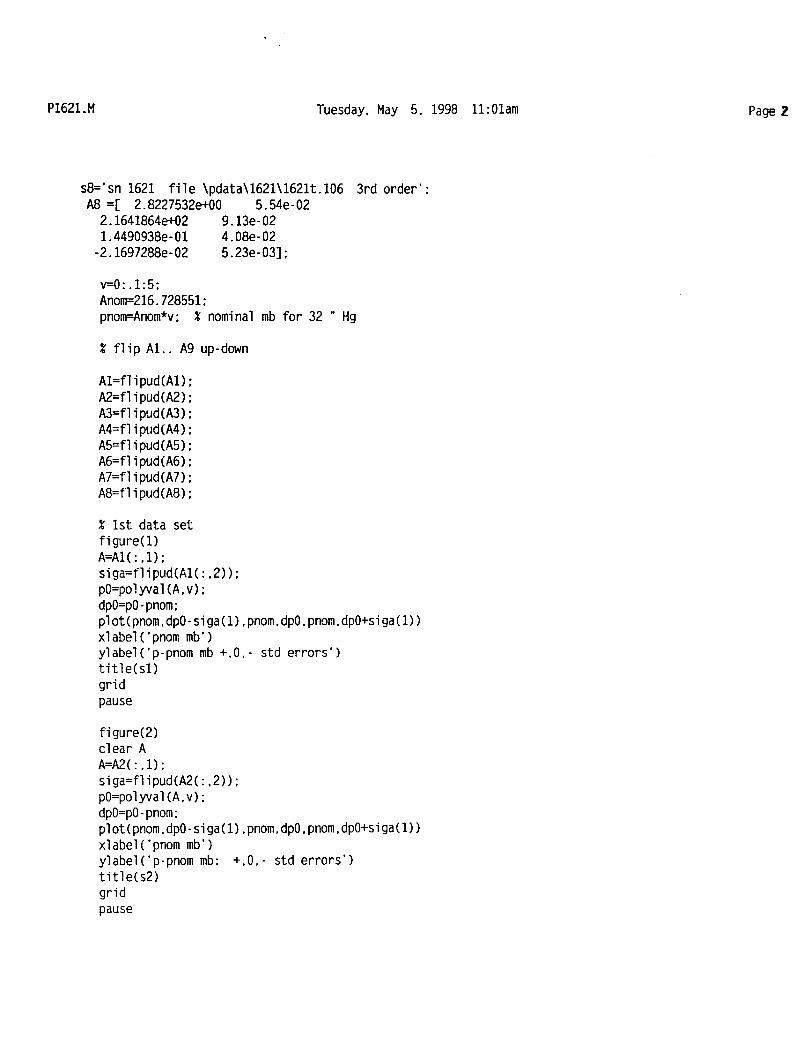
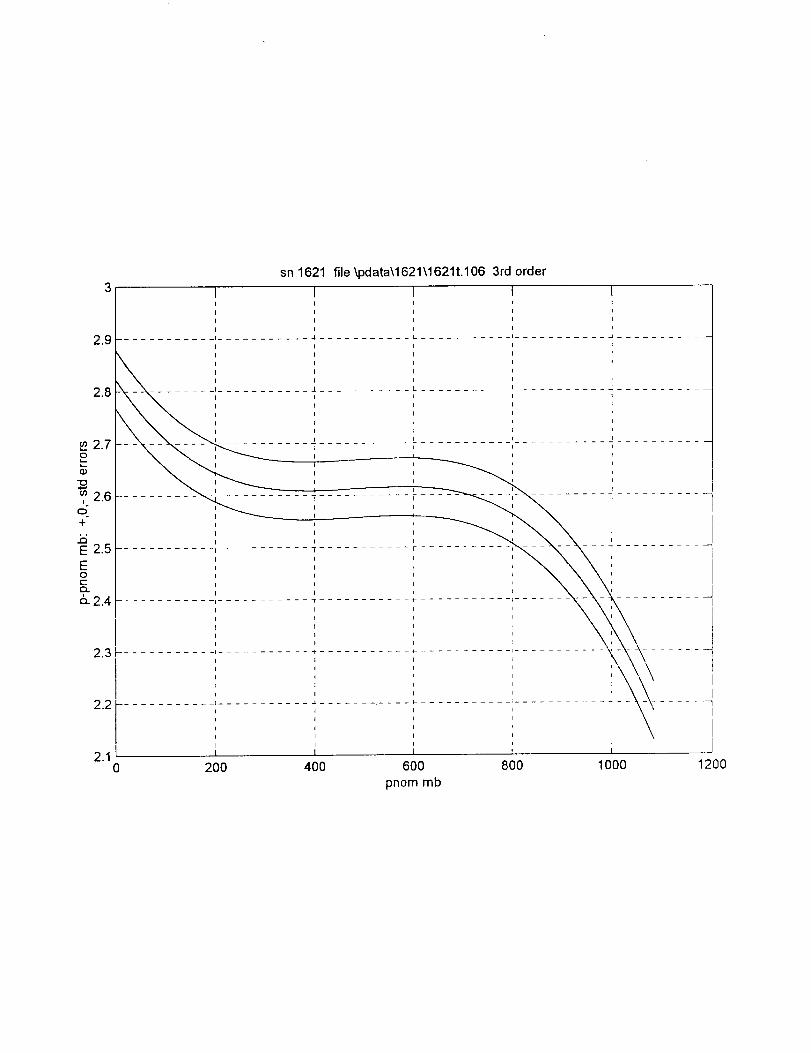
s8='sn 1621 file \pdata\1621\1621t.106
A8 =[ 2.8227532e+00 5.54e-022.1641864e+02 9.13e-02
1.4490938e-01 4.08e-02
-2.1697288e-02 5.23e-03];
3rd order':
v=0:.1:5;Anom=216.728551;
pnom=Anom*v; % nominal mb for 32 " Hg
% flip AI.. A9 up-down
A1=flipud(A1);
A2=flipud(A2);
A3=flipud(A3);
A4=flipud(A4):
A5=flipud(A5):
A6=flipud(A6):
A7=flipud(A7);
AB=flipud(A8):
% 1st data set
figure(I)A=AI(:,I):
siga=flipud(Al(:,2)):
pO=po!yval(A.v):
dpO=pO-pnom:plot(pnom,dpO-siga(1).pnom,dpO,pnom.dpO+siga(1))
xlabel('pnommb')
ylabel('p-pnommb +,0.- std errors')title(s1)
grid
pause
figure(2)clear A
A=A2(:,I):
siga=flipud(A2(:,2)):
pO=polyval(A.v):
dpO=pO-pnom:plot(pnom.dpO-siga(1).pnom.dpO.pnom.dpO+siga(1))xlabel('pnommb')
ylabel('p-pnommb: +,0,- std errors')
title(s2)
grid
pause
P1621.M Tuesday,May 5. 1998 11:01am Page 3
figure(3)clear A
A=A3(:,I);
siga=flipud(A3(:,2));pO=polyval(A.v):
dpO=pO-pnom;
plot(pnom,dpO-siga(1),pnom,dpO,pnom,dpO+siga(1))xlabel('pnom mb')
ylabel('p-pnommb: +,0,- std errors')title(s3)
grid
pause
figure(4)clear A
A=A4(:,I);
siga=flipud(A4(:,2)):
pO=polyval(A,v):
dpO=pO-pnom;
plot(pnom.dpO-siga(1),pnom.dpO,pnom.dpO+siga(1))
xlabel('pnom mb')
ylabel('p-pnommb: +.0,- std errors')title(s4)
grid
pause
figur'e(5)clear A
A=A5(:,I);
siga=flipud(A5(:,2));
pO=polyval(A.v);
dpO=pO-pnom;
plot(pnom.dpO-siga(1),pnom,dpO.pnom.dpO+siga(1))
xlabel('pnommb')
ylabel('p-pnommb: +,0,- std errors')title(s5)
grid
pause
figure(6)clear A
A=A6(:.I);
siga=flipud(A6(:.2));pO=polyval(A.v);
dpO=pO-pnom;
plot(pnom.dpO-siga(1).pnom.dpO.pnom.dpO+siga(1))
P1621.M Tuesday,May 5, 1998 11:01am Page 4
xlabel('pnommb')
ylabel('p-pnommb:title(s6)
grid
pause
+.0.- std errors')
figure(7)clear A
A=A7(:,I);
siga=flipud(A7(:,2)):
pO=polyval(A,v);
dpO=pO-pnom;
plot(pnom,dpO-siga(1),pnom.dpO,pnom,dpO+siga(1))
xlabel('pnommb')
ylabel('p-pnommb: +,0,- std errors')title(s7)
grid
pause
figure(8)clear A
A=A8(:,I):
siga=flipud(A8(:,2)):
pO=polyval(A,v);
dpO=pO-pnom:
plot(pnom,dpO-siga(1).pnom,dpO,pnom.dpO+siga(1))
xlabel('pnom mb')
ylabel('p-pnommb: +.0,- std errors')title(s8)
grid
pause
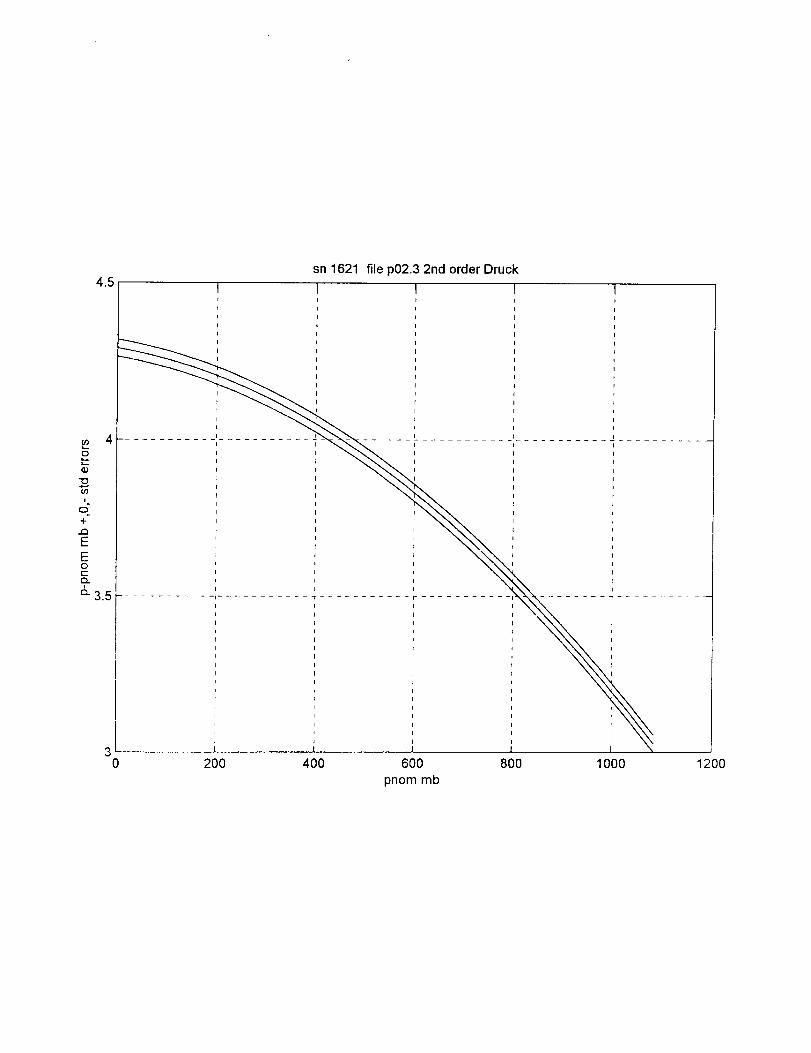
4.5sn 1621 file p02.3 2nd order Druck
4o_J
_9
i
o"+
..Q
EEO
t'-r'_
6- 3.5 l- .......... ,.............
1
0 200 400 600 800 1000 1200pn0m mb
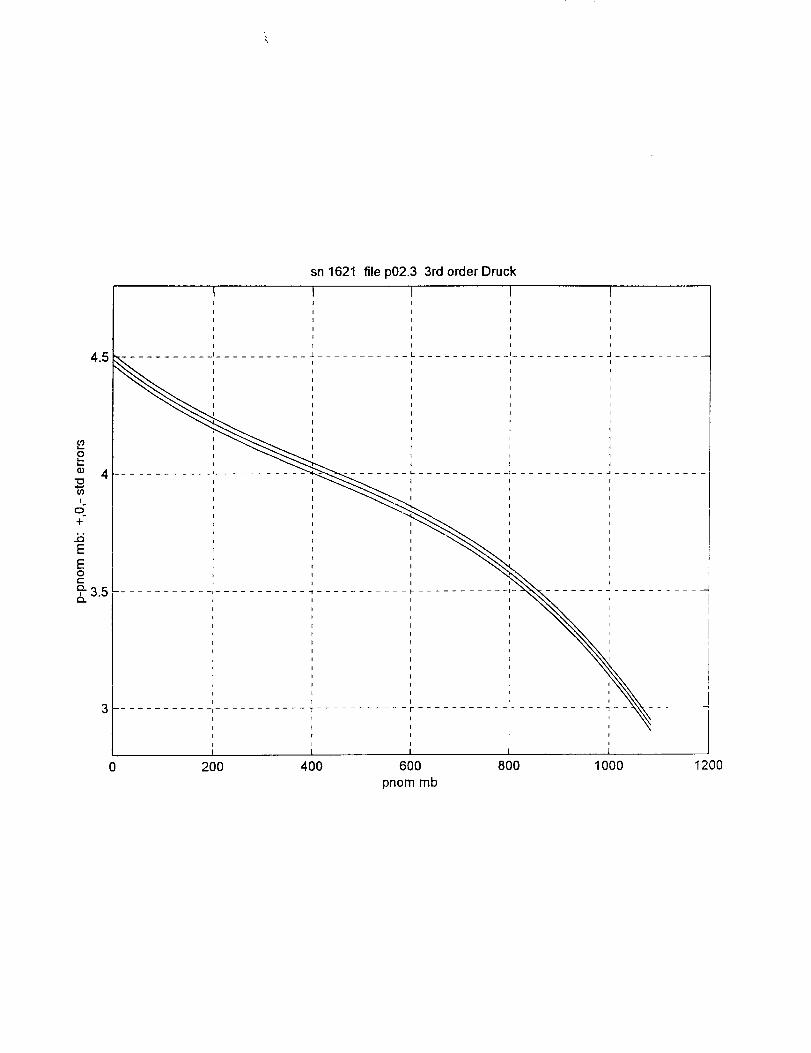
sn1621filep02.33rdorderDruck
0 200 400 600 800 1000 1200pnom mb
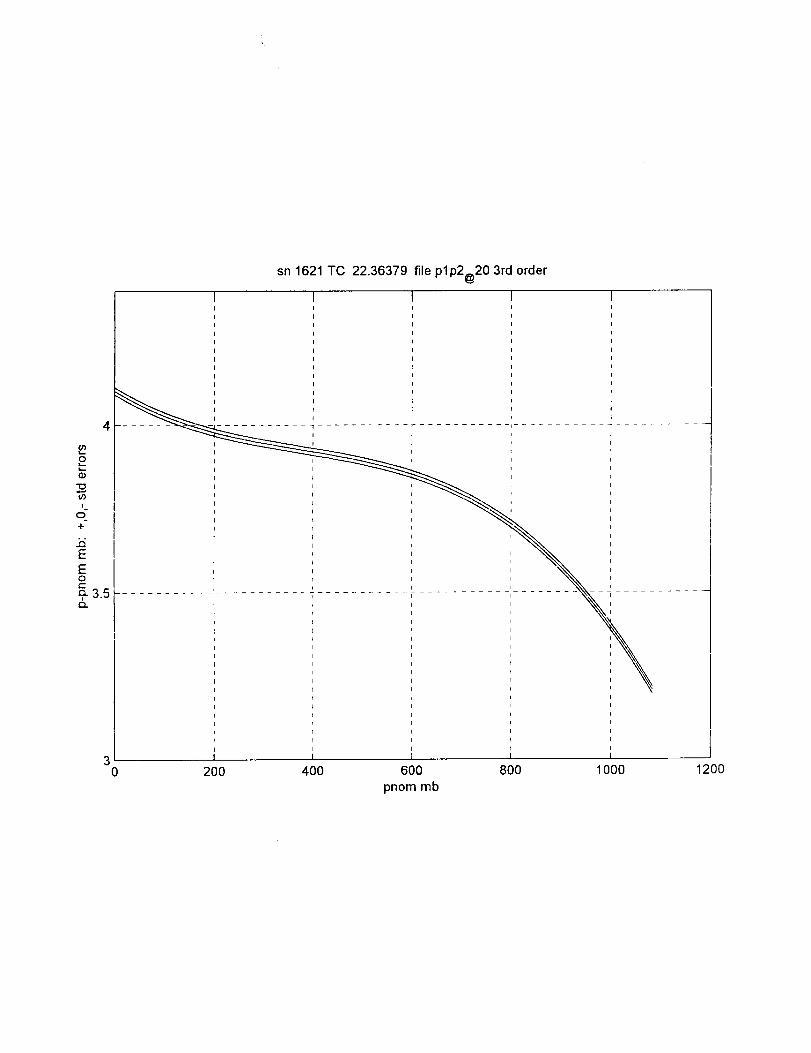
sn1621TC 22.36379fileplp2@20 3rd order
4
2Q)
(/)
i
-I-
EEO¢-
_- 3.5 .................................................,5.
3
........... II...........
i
J
I
0 200 400 600pnom mb
8OO 1000 1200
%
1.4
1.2_---_ -
sn 1621 file _)data\1621\1621a.085 3rd order
I I I
I I I
I I I
I I I
I I I
......... I ........... "t ................ I ...........
, r
I
I
........... I- ....
0
1.1 ...................................
I
o-+ 1
E
o.o1-.........................................................Q.
&
0.8 ........................ =..................................
0.7--
0.60 200 400 600 800
pnom mb
1000 1200
1.5
1.4
1.3
0
1.2Q;
i
0
+'1.1
EE0
= 1
&
sn 1621 file \pdata\1621\1621 b.085 3rd order
I II I
I I
I I
I I
tI
T I
I I
_ .... : ........ ',I
I
I
I
r
........... I ...........
\I0.9 ...........................................................J
r
i
I
I
,_vn._................................... L ..........................1
I
I
I
I
0.7 J0 200 400 600 800
pnom mb
1000 1200
1.4sn1621 file \pdata\1621\1621t.085 3rd order
I I 1I I I
I I I
,
II
I
I
-I ...........
.......... I........................ I- ...........
0.71-...................................
0.6
0 200 400 6OOpnom mb
800 1000 1200
2.9
2.8
2.7
E 2.6
"o
2.5I
-t-
E 2.4Eor-Q.._-2.3
2.2
sn 1621 file _pdata\1621\1621b.106 3rd order
2.1
20
I
I
I
1
I
I
I
I
............ I ...........
I
I
t
I
I
I
20O 4OO
I I II ! I
I I I
I I l
I I I
, ,I I I
I I I
I I I
I I I
.......... I........... A ........... L .................................I I I I
I I I
I I
I I I I
I I I I
I I I I
...................... _ ............ r ......... ,........... _ ...........I I I I I
I I i l
I I I i I
I I I
............. p................... F ........... I ...................
i - - I I
, \ ,I •
I I I
I I
I !
I I
........... L ........... I ..........
I I
I I
I I I
I I I
I I I
800 1000 1200600pnom mb
._ 2.72L--
2.6I
o"+
J5E 2.5
EOc:
_-2.4
sn 1621 file \pdata\1621\1621t.106 3rd order
3 I 1 II I t
1 I I
I I I
I I t
_a ............ ,.........................................................I I I
__. I I r
I I I
f--u"_.Q ........... I ................... L ...................... J ..........I t i t
I I I i
I I I I
1 , I I
__t I I t
......... _........... -; ........... F ........... , ........... -_ ...........I I I I
:'I I _................... ',...................... _-..............
I , I
I I
2.2
2.10 2OO 4OO
I
I
I
I
............ I .............
I
I
t
I
I
............. I ...........
I
I
I
I
I
I
I I
I
I I
t I
I I
r r
t
t
I I
i I
600 800 1000 1200
pnom mb
2.3
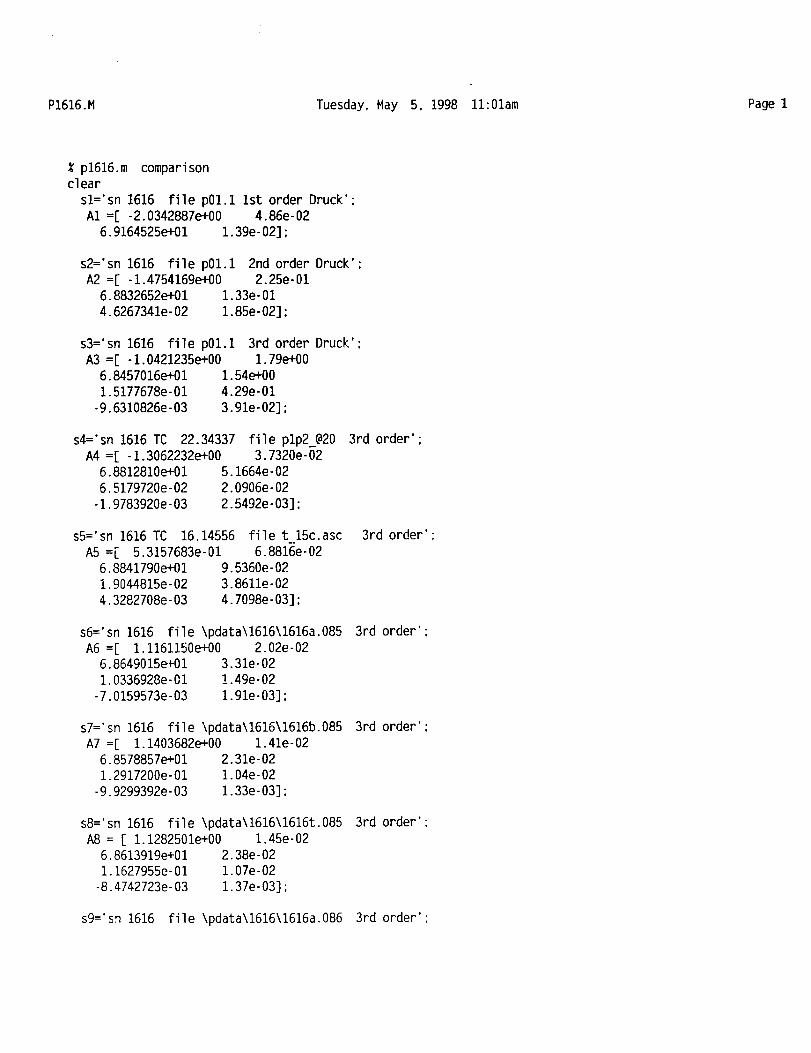
P1616.M Tuesday, May 5, 1998 11:01am Page1
% p1616.m comparisonclear
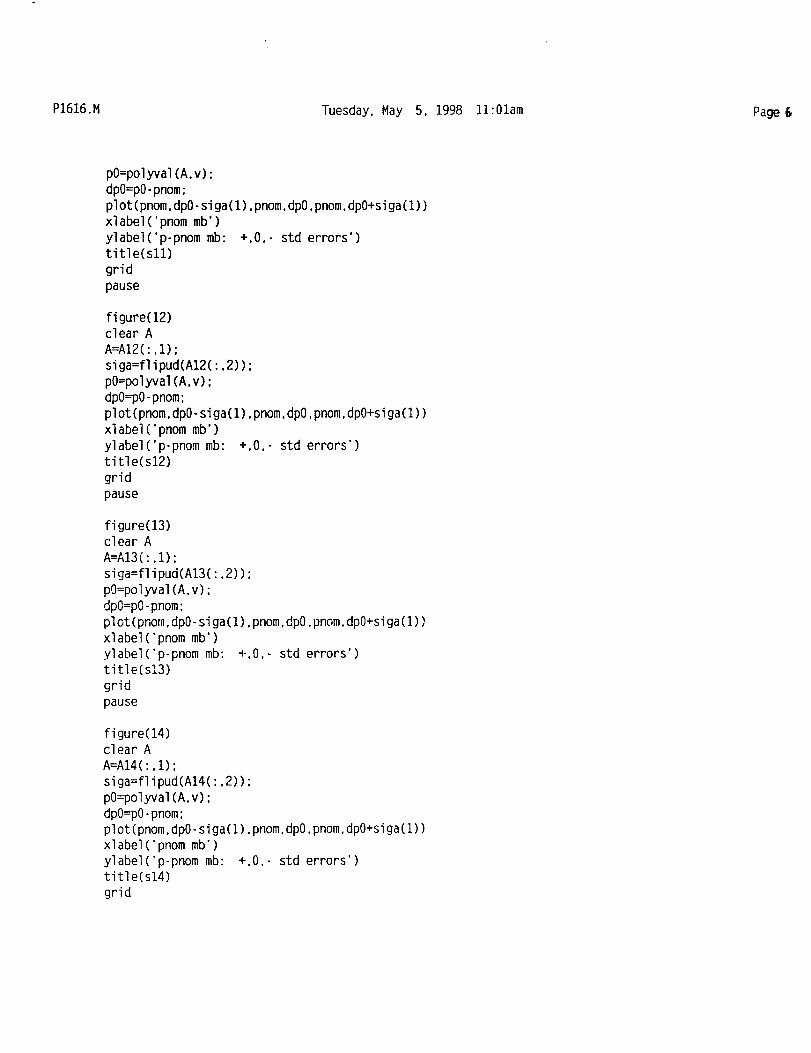
s1='sn 1616 file p01.1 1st order Druck';
A1 =[ -2.0342887e+00 4.86e-02
6.9164525e+01 1.39e-02];
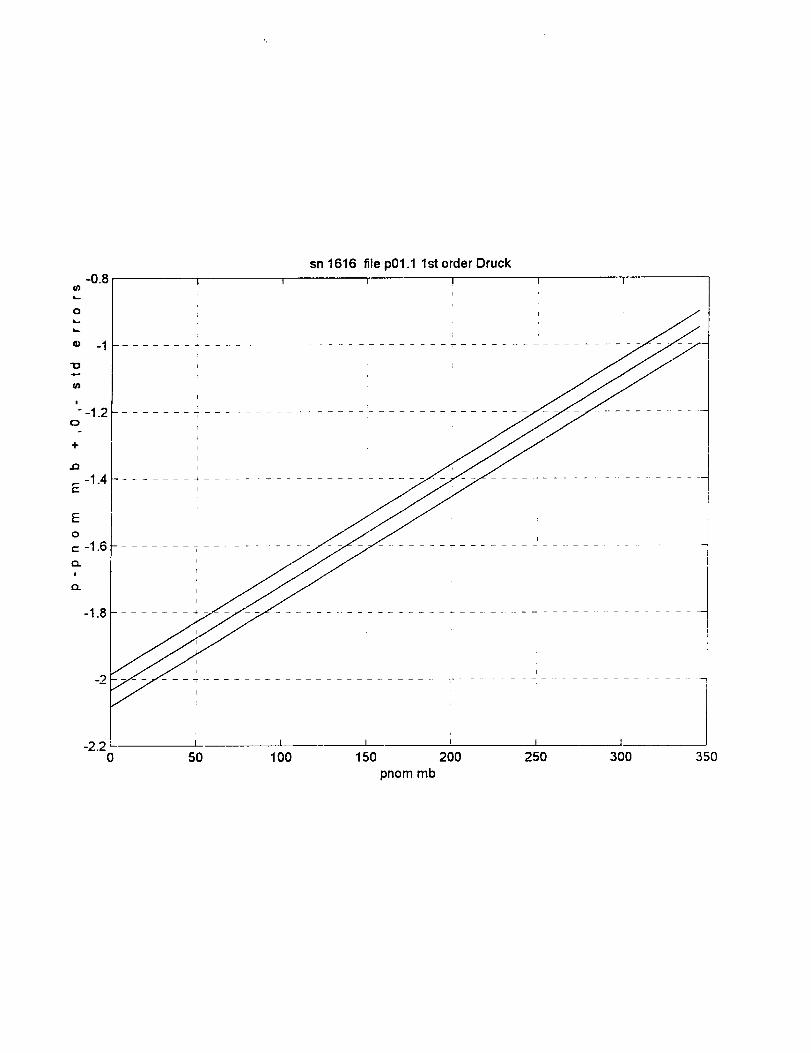
s2='sn 1616 file p01.1 2nd order Druck';
A2 =[ -1.4754169e+00 2.25e-016.8832652e+01 1.33e-01
4.6267341e-02 1.85e-02];
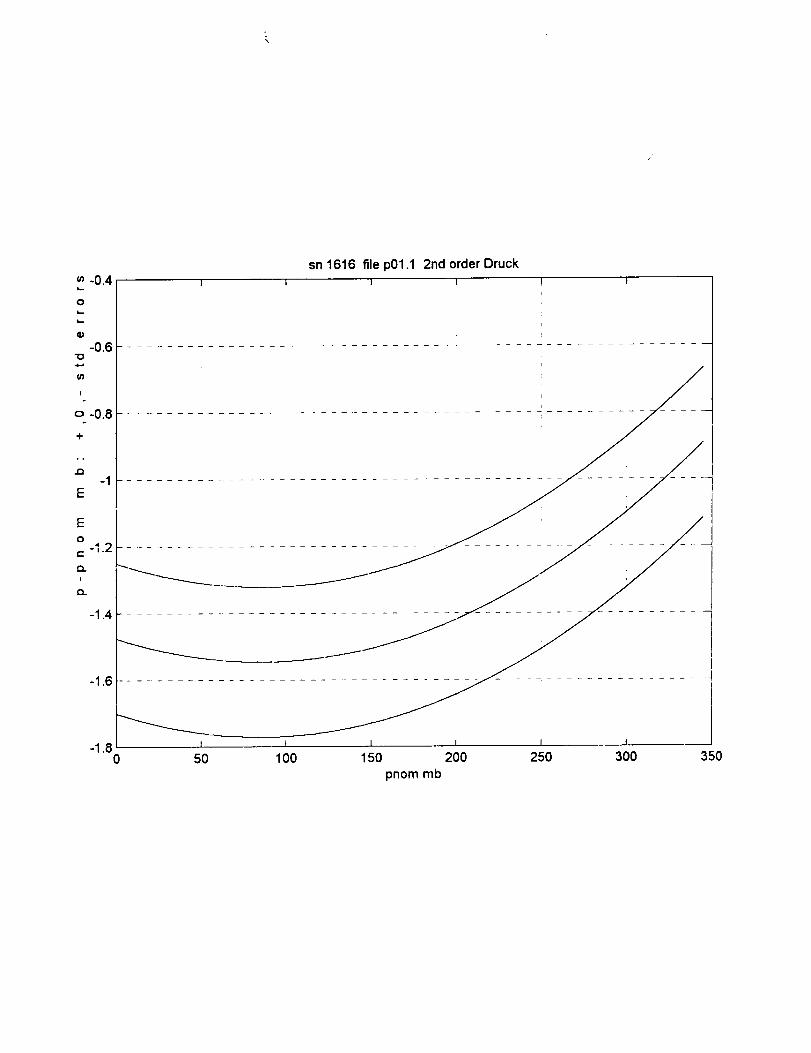
s3='sn 1616 file p01.1 3rd order Druck';
A3 =[ -1.0421235e+00 1.79e+006.8457016e+01 1.54e+00
1.5177678e-01 4.29e-01
-9.6310826e-03 3.91e-02];
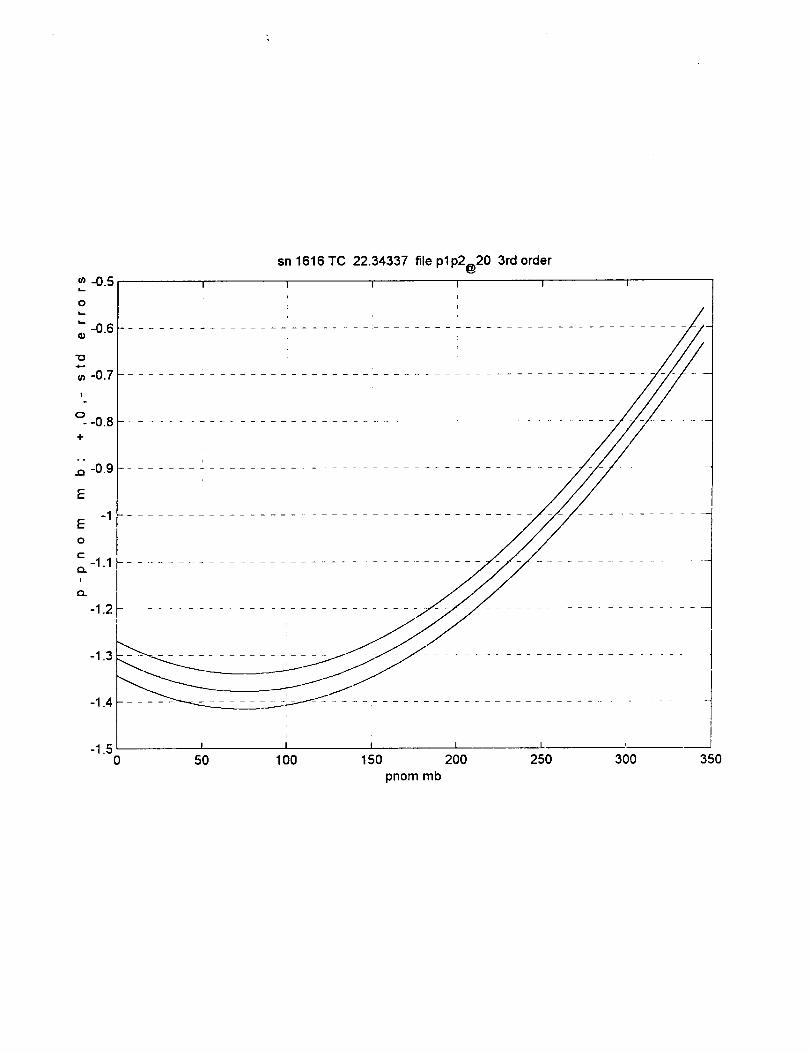
s4='sn 1616 TC 22.34337 file plp2_@20A4 =[ -1.3062232e+00 3.7320e-02
6.8812810e+01 5.1664e-02
6.5179720e-02 2.0906e-02
-1.9783920e-03 2.5492e-03]:
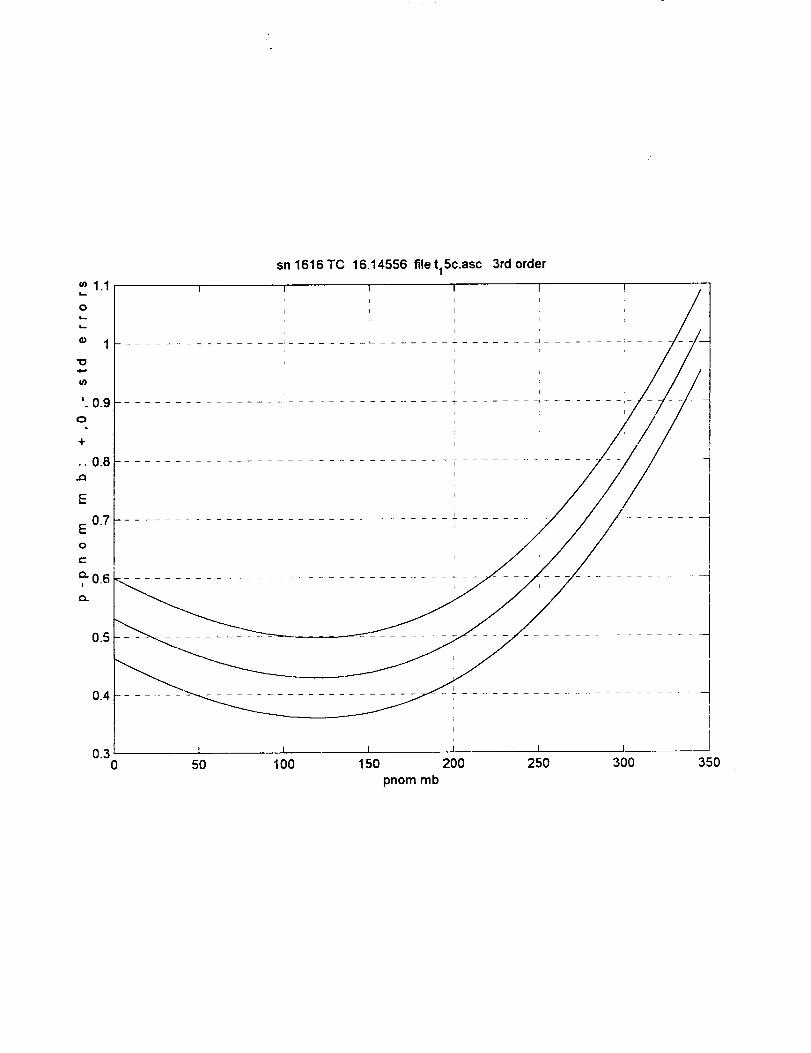
s5='sn 1616 TC 16.14556 file t 15c.asc
A5 =[ 5.3157683e-01 6.8816e-02
6.8841790e+01 9.5360e-02
1.9044815e-02 3.8611e-02
4.3282708e-03 4.7098e-03]:
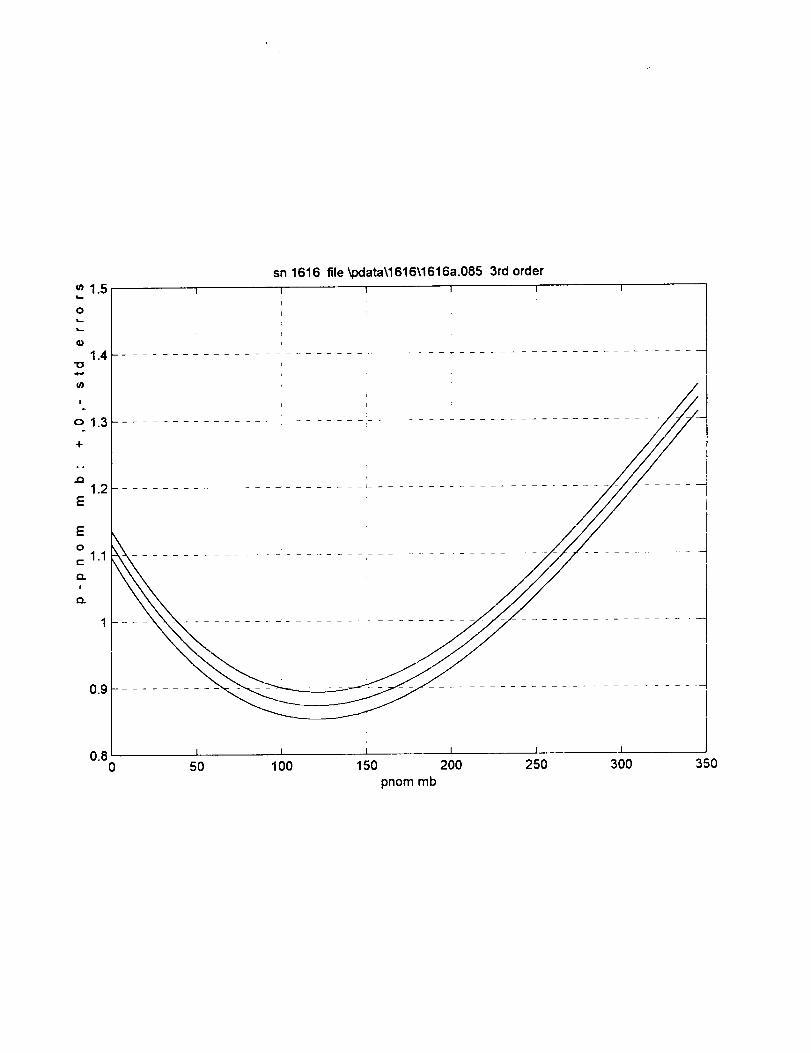
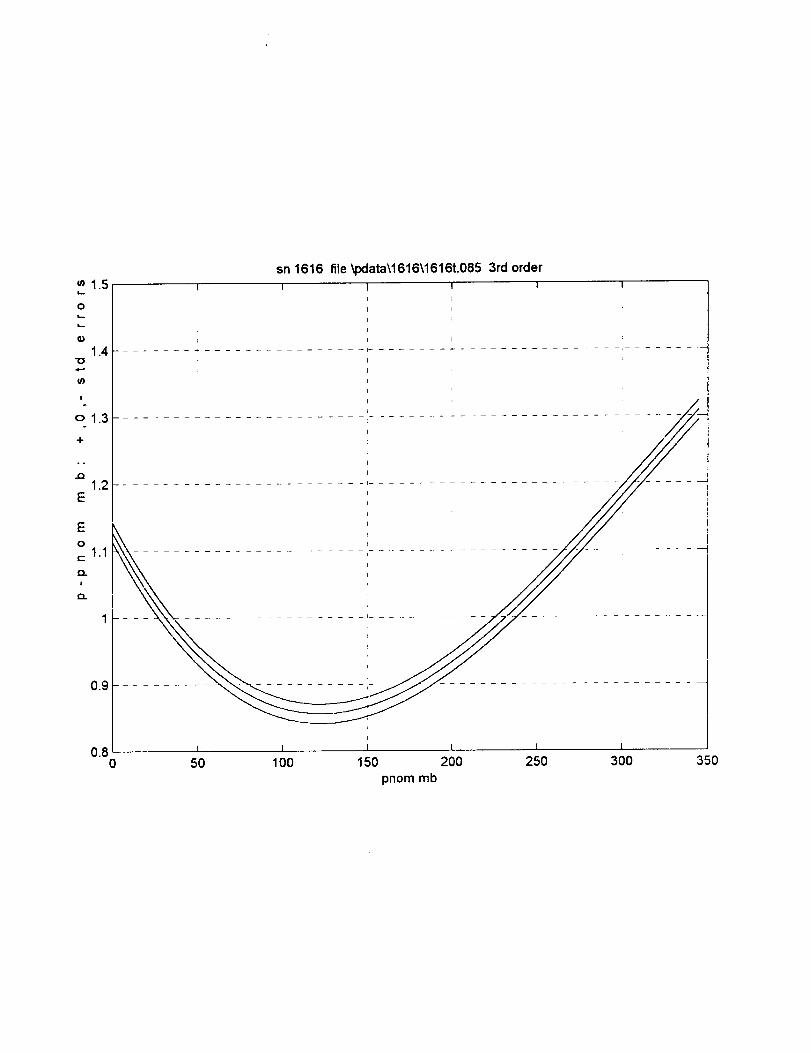
s6='sn 1616 file \pdata\1616\1616a.085
A6 =[ 1.1161150e+00 2.02e-026.8649015e*01 3.31e-02
1.0336928e-01 1.49e-02
-7.0159573e-03 1.91e-03];
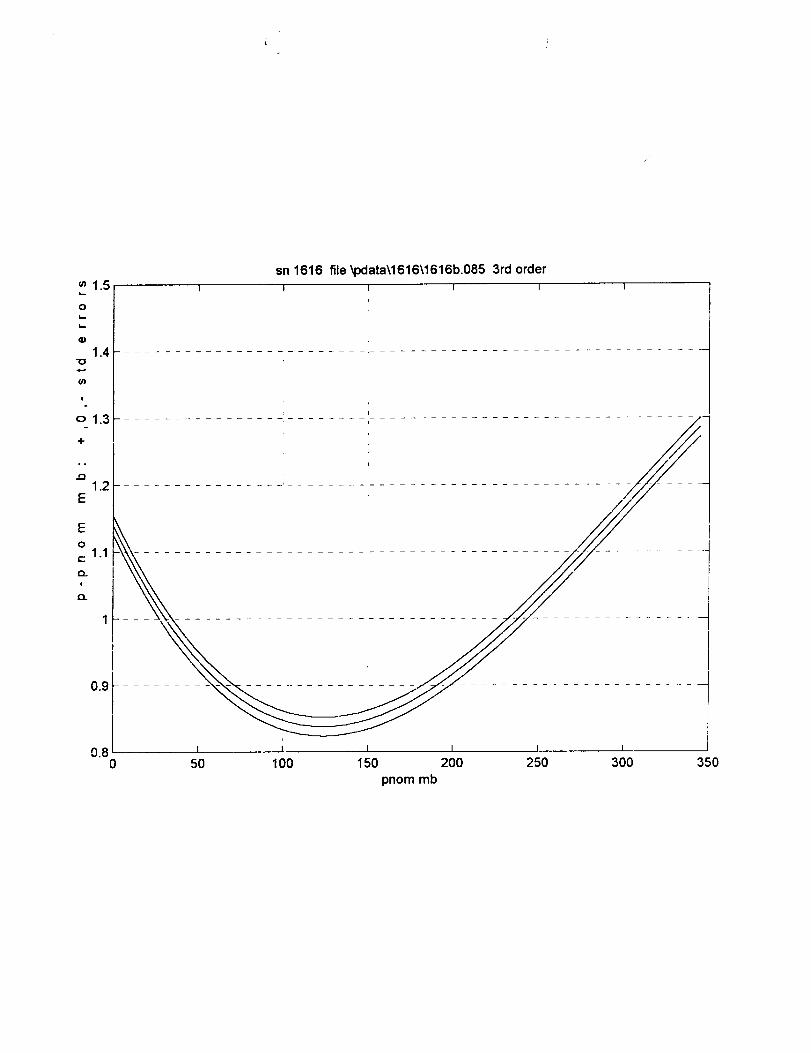
s7='sn 1616 file \pdata\1616\1616b.085A7 =[ 1.1403682e+00 1.41e-02
6.8578857e+01 2.31e-02
1.2917200e-01 1.04e-02
-9.9299392e-03 1.33e-03];
s8='sn 1616 file \pdata\1616\1616t.085
A8 = [ 1.1282501e+00 1.45e-026.8613919e+01 2.38e-021.1627955e-01 1.07e-02
-8.4742723e-03 1.37e-03];
3rd order';
3rd order';
3rd order';
3rd order';
3rd order';
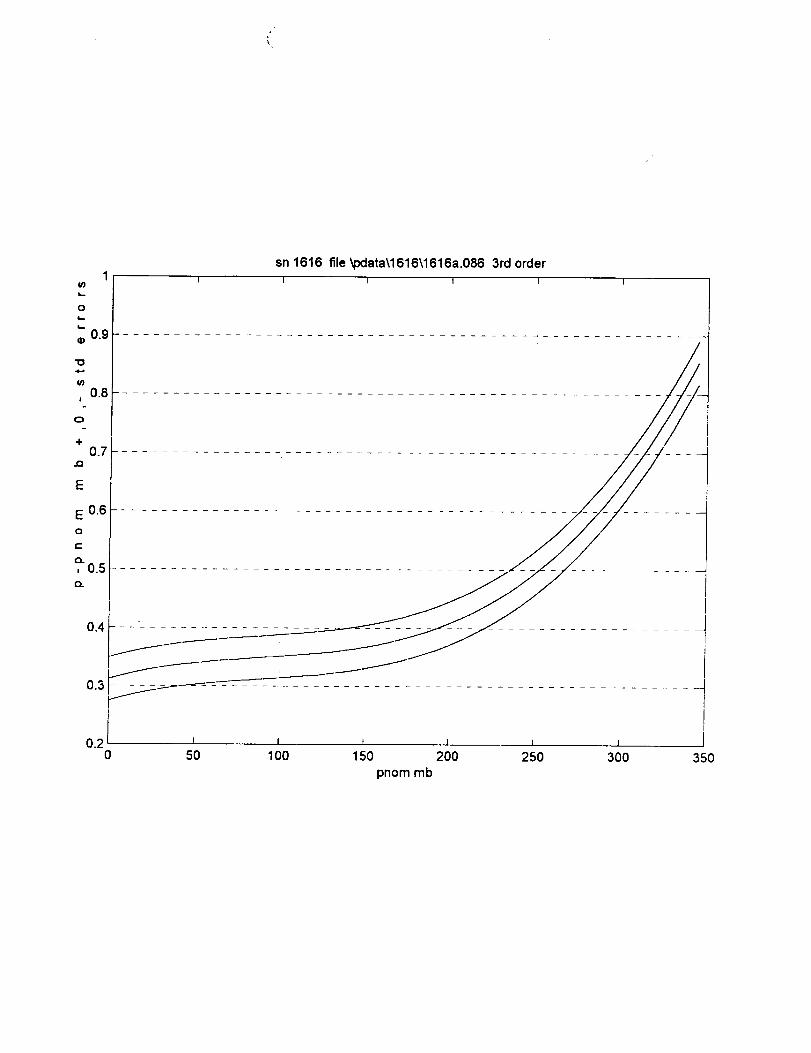
s9='sn 1616 file \pdata\1616\1616a.086 3rd order';
P1616.M Tuesday.May 5. 1998 11:01am Page 2
A9 =[ 3.1190773e-01 3.70e-02
6.9005438e+01 5.28e-02
-3.4469315e-02 2.15e-02
8.9067393e-03 2.58e-03];
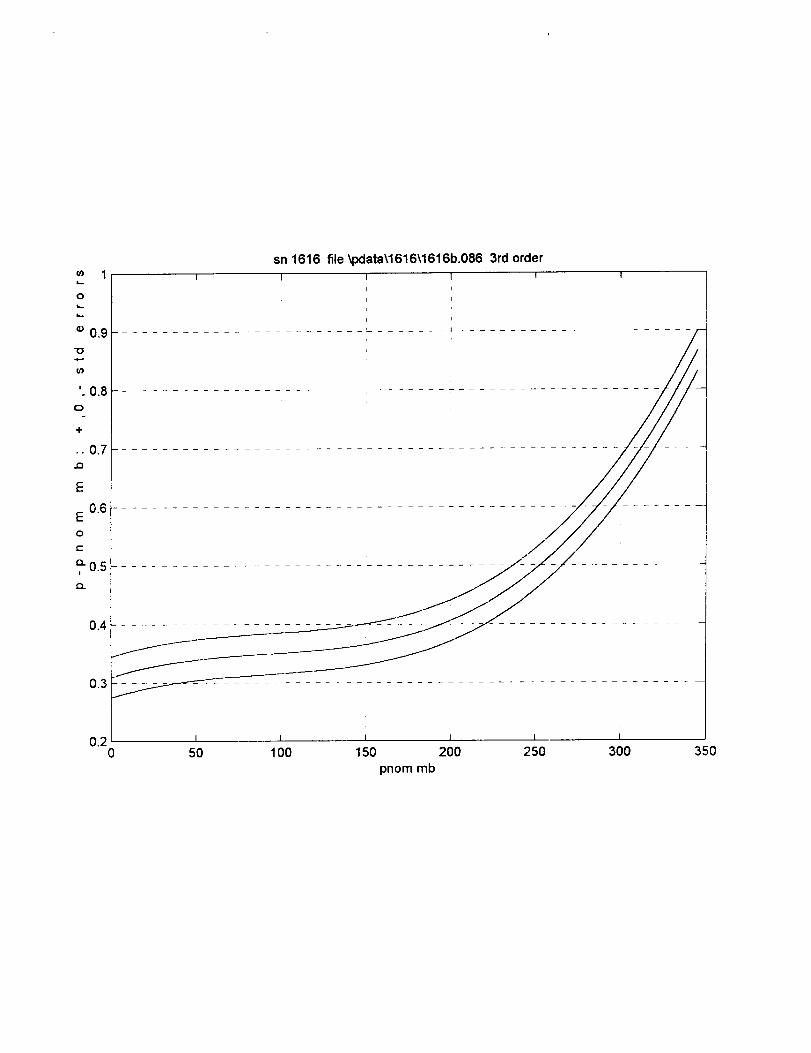
slO=-'sn1616 file \pdata\1616\1616b.086
AIO =[ 3.0911100e-01 3.51e-026.9010719e+01 5.01e-02
-3.7982301e-02 2.04e-02
9.5184661e-03 2.45e-03];
3rd order';
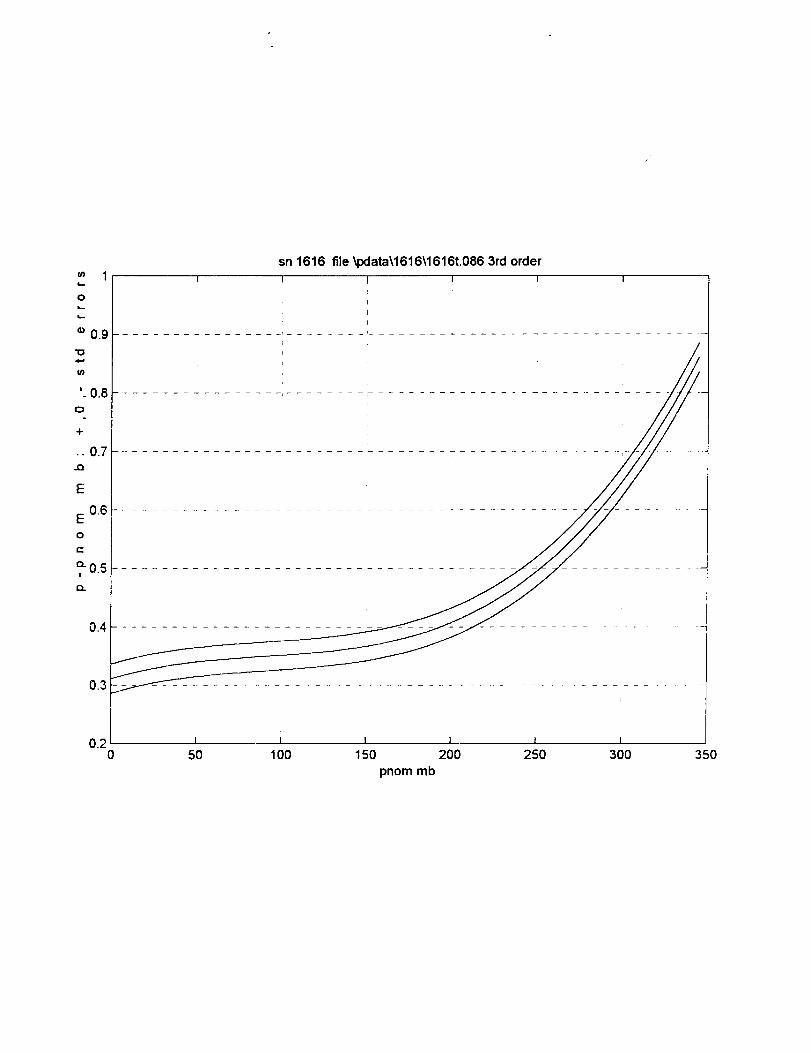
sll='sn 1616 file \pdata\1616\1616t.0863rd order';
A11 =[ 3.1051072e-01 2.49e-026.9008076e+01 3.56e-02
-3.6224641e-02 1.45e-02
9.2124461e-03 1.74e-03];
s12='sn 1616 file \pdata\1616\1616a.106
A12 =[ 6.9478759e-01 3.70e-026.8465538e+01 6.07e-02
1.6127949e-01 2.71e-02
-1.3025883e-02 3.47e-03];
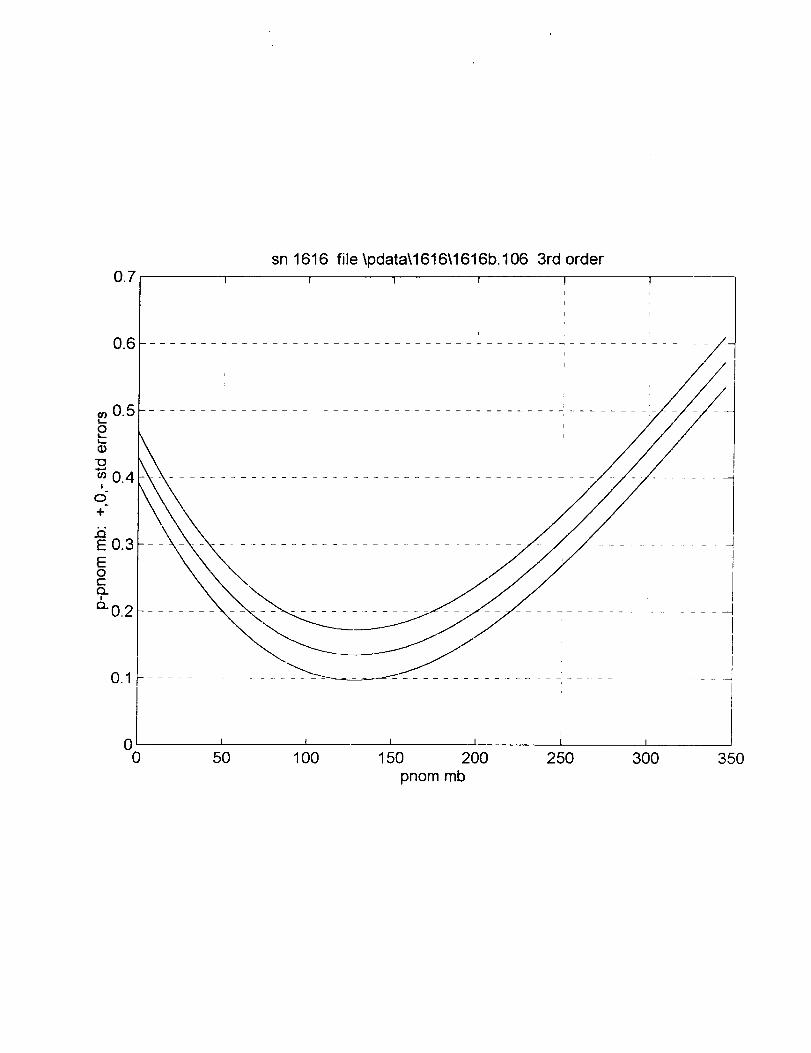
3rd order':
s13='sn 1616 file \pdata\1616\1616b.106A13 :[ 4.3083494e-01 3.78e-02
6.8601901e+01 6,20e-021.1515427e-01 2,76e-02
-8.0808769e-03 3.54e-03]:
3rd order';
s14='sn 1616 file \pdata\1616\1616t.106A14 =[ 5.6351001e-01 5.01e-02
6.8532651e+01 8,22e-021.3865431e-01 3,67e-02
-I.0605926e-02 4.70e-03];
3rd order':
v=0:.1:5;
Anom=68.94733;
pnom=Anom*v; % nominal mb for 5 psi
% flip AI.. A14 up-down
Al=flipud(A1):A2=flipud(A2);
A3=flipud(A3);
A4=flipud(A4);
A5=flipud(AS);
A6=flipud(A6);A7=flipud(A7);
P1616.M Tuesday,May 5, 1998 11:01am Page 3
A8=flipud(A8);
A9=-flipud(A9);
AlO=flipud(AlO);
A11=flipud(A11);
A12=flipud(A12);
A13=flipud(A13);
A14=flipud(A14);
% 1st data set
figure(i)A=AI(:,I):
siga=flipud(Al(:.2)):
pO=polyval(A.v);
dpO=pO-pnom;
plot(pnom.dpO-siga(1).pnom,dpO,pnom,dpO+siga(1))
xlabel('pnommb')
ylabel('p-pnommb +.0,- std errors')title(s1)
grid
pause
figure(2)clear A
A=A2(:.I);
siga=flipud(A2(:,2));
pO=polyval(A,v);
dpO=pO-pnom;
plot(pnom,dpO-siga(1),pnom.dpO.pnom.dpO+siga(1))
xlabel('pnommb')
ylabel('p-pnommb: +,0.- std errors')title(s2)
grid
pause
figure(3)clear A
A=A3(:.I);
siga=flipud(A3(:,2));
pO=polyval(A,v);
dpO=pO-pnom;
plot(pnom,dpO-siga(1).pnom.dpO,pnom,dpO+siga(1))
xlabel('pnommb')
ylabel('p-pnommb: +,0,- std errors')title(s3)
grid
pause
figure(4)
P1616.MTuesday,May 5, 1998 11:01am
Page 4
clear AA=A4(:,I);siga=flipud(A4(:,2)):pO=polyval(A.v);dpO=pO-pnom:
plot(pnom.dpO-siga(1),pnom,dpO,pnom,dpO+siga(1))xlabel('pnommb')
ylabel('p-pnommb: +,0.- std errors')title(s4)
grid
pause
figure(5)clear A
A=A5(:,I):
siga=flipud(A5(:,2)):
pO=polyval(A,v);
dpO=pO-pnom:
plot(pnom,dpO-siga(1),pnom,dpO.pnom,dpO+siga(1))xlabel('pnommb')
ylabel('p-pnommb: +,0,- std errors')title(s5)
grid
pause
Figure(6)clear A
A=A6(:,I);
siga=flipud(A6(:,2));
pO=pol)_al(A.v);
dpO=pO-pnom:
plot(pnom.dpO-siga(1),pnom,dpO,pnom,dpO+siga(1))xlabel('pnom mb')
ylabel('p-pnommb: +,0,- std errors')title(s6)
grid
pause
figure(7)clear A
A=A7(:,I);
siga=flipud(A7(:.2));
pO=polyval(A.v);dpO=pO-pnom:
plot(pnom,dpO-siga(1),pnom.dpO.pnom,dpO+siga(1))xlabel('pnom mb')
P1616.M Tuesday.May 5, 1998 11:01am Page5
ylabel('p-pnommb:title(s7)
grid
pause
+.0.- std errors')
figure(8)clear A
A=A8(:,I);
siga=flipud(A8(:,2));
p0=polyval(A,v);
dp0=p0-pnom;
plot(pnom,dp0-siga(1).pnom,dp0,pnom,dp0+siga(1))xlabel('pnommb')
ylabel('p-pnommb: +,0,- std errors')
title(s8)
grid
pause
figure(9)clear AA=Ag(:.I);siga=flipud(A9(:.2));pO=polyval(A.v):dpO=pO-pnom:plot(pnom,dpO-siga(1),pnom,dpO,pnom,dpO+siga(1))xlabel('pnom mb')ylabel('p-pnom mb +,0.- std errors')title(s9)gridpause
figure(10)clear A
A=AI0(:.I);
siga=flipud(A10(:.2));
p0=polyval(A.v):
dp0=p0-pnom;
plot(pnom.dp0-siga(1).pnom,dp0,pnom.dp0+siga(1))xlabel('pnommb')
ylabel('p-pnommb: +,0,- std errors')title(s10)
grid
pause
figure(11)clear A
A=A11(:.1);
siga=flipud(A11(:.2));
P1616.M Tuesday.May 5, 1998 11:01am Page &
p0=polyval(A.v);
dp0=p0-pnom;
plot(pnom,dp0-siga(1),pnom.dp0,pnom.dp0+siga(1))
xlabel('pnommb')
ylabel('p-pnommb: +.0,- std errors')title(s11)
grid
pause
figure(12)clear A
A=A12(:.1);
siga=flipud(A12(:.2));
p0=polyval(A.v):
dp0=p0-pnom;
plot(pnom,dp0-siga(1),pnom,dp0,pnom.dp0+siga(1))
xlabel('pnommb')
ylabel('p-pnommb: +,0.- std errors')title(s12)
grid
pause
figure(13)clear A
A=A13(:.1);
siga=flipud(A13(:,2)):
p0=polyval(A,v);
dp0=p0-pnom;
plot(pnom,dp0-siga(1),pnom,dp0.pnom,dp0+siga(1))
xlabel('pnommb')ylabel('p-pnommb: +,0,- std errors')title(s13)
grid
pause
figure(14)clear A
A=A14(:.1);
siga=flipud(A14(:,2)):
p0=polyval(A.v):
dp0=p0-pnom;plot(pnom.dp0-siga(1).pnom.dp0.pnomodp0+siga(1))
xlabel('pnommb')
ylabel('p-pnommb: +.0,- std errors')title(s14)
grid
03
O
O')
I
sn 1616 file p01.1 1st order Druck
- -1.2 .........................................O
+
.J_
-1.4 .............................E
EO
,'- -1.6
!
-1.8 ........
-2.20
I I I
50 100 150 200 250 300 350pnom mb
-0.4
0
"O
ffl
!
o -0.8
÷
°°
..Q
-1E
Eo
-I .2
0..
|
-1.4
-1.6
-1.60
: I
I t I I I I
50 1O0 150 200 250 300 350pnom mb
0i,,,..
t...
0.5
ffl0
I
0
+ -0.5
E -1
Eo -1.5dE
0...
!
o.. -2
-2.5
-3
-3.50
sn 1616 file p01.1 3rd order DruckI I I I
I I
i
I
I
....... -- ........ , ................................. q ........
: I
! I
1
................ : ................................. i .........
i
......... - ...... I ..........................................
P I I I I I
50 1O0 150 200 250 300 350pnom mb
-1.4
-1.50
i
I I
50 100 150 200pnom mb
L i
250 300 350
i
I
I
i
I
0.30
i
I
1 , I i i ,50 100 150 200 250 300 350
pnom mb
sn 1616 file _data\1616\1616a.065 3rd order1.5 i , l , , '
0
s.=
I=.
"I0.¢...
!
I
I
=
J
!
1.4 ..........................................................
o 1.3........................
-I-
..
E
E
01.1
r'
Q.
I
I
1.2 ............................
I
I I I I I
.9 ...........
0.8 i0 50 100 150 200
pnom mb
250 300 350
+
: I
°.
..Q
E
E0
C
|
E).
0"9 1 ........
0.8 = I I I I
0 50 100 150 200 250 300 350pnom mb
sn1616file_odata\1616\1616t.085 3rd orderI I ! I I I
I I I
I I ;
4 I
I I r
1.4 ...........................................................
1
I
!
I
i
I I I
0 50 1O0 150 200 250 300 350pnom mb
sn 1616 file _clata\1616\1616a.086 3rd orderI I I I I I
I t t I I
0 50 100 150 200 250 300 350pnom mb
L--
0
i.-
o 0.9
"0
'. 0.80
+
.. 0.7..a
E
0.6E0
l"-
°-0. 5i
0.4
0.3
0.20
I I I I I I
50 100 150 200 250 300 350
pnom mb
0.3
sn 1616 file _odata\1616\1616t.086 3rd order
i ! I ! I
! I
I [ i
I I
I I
0.2 I i i ] f i0 50 1O0 150 200 250 300
pnom mb
350
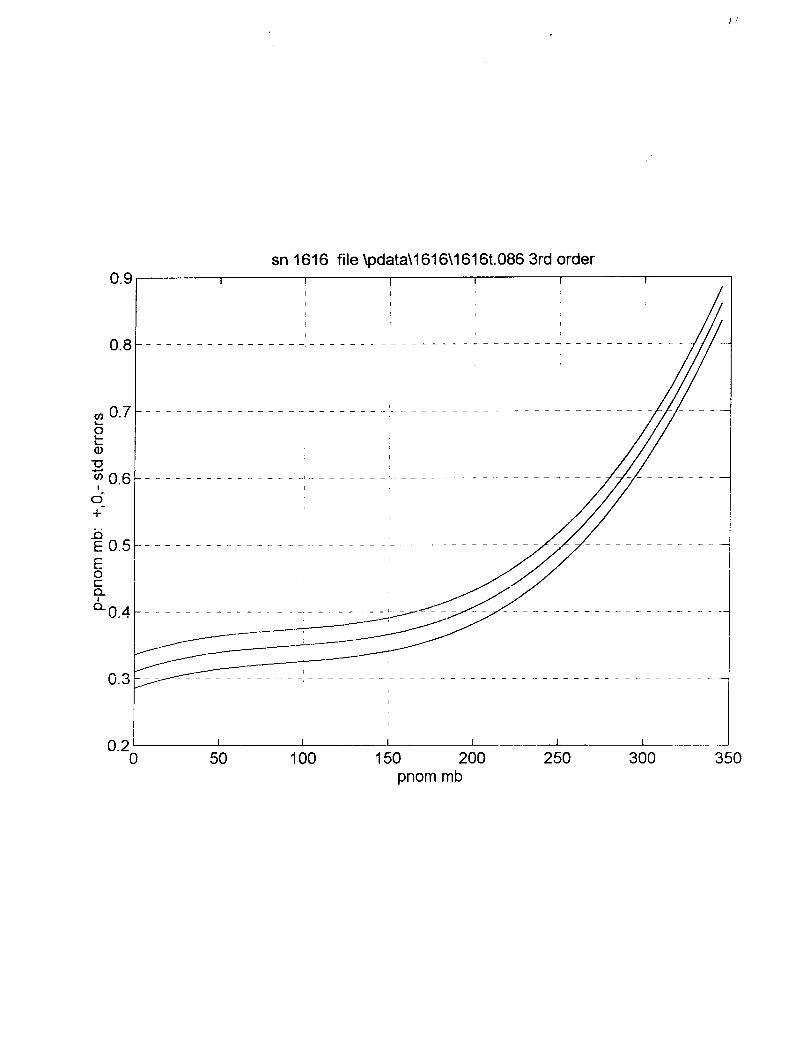
sn 1616 file \pdata\1616\1616t.086 3rd order
0.3
0.20
I
/
i
I
I I I I I
50 1O0 150 200 250 300
pnom mb
35O
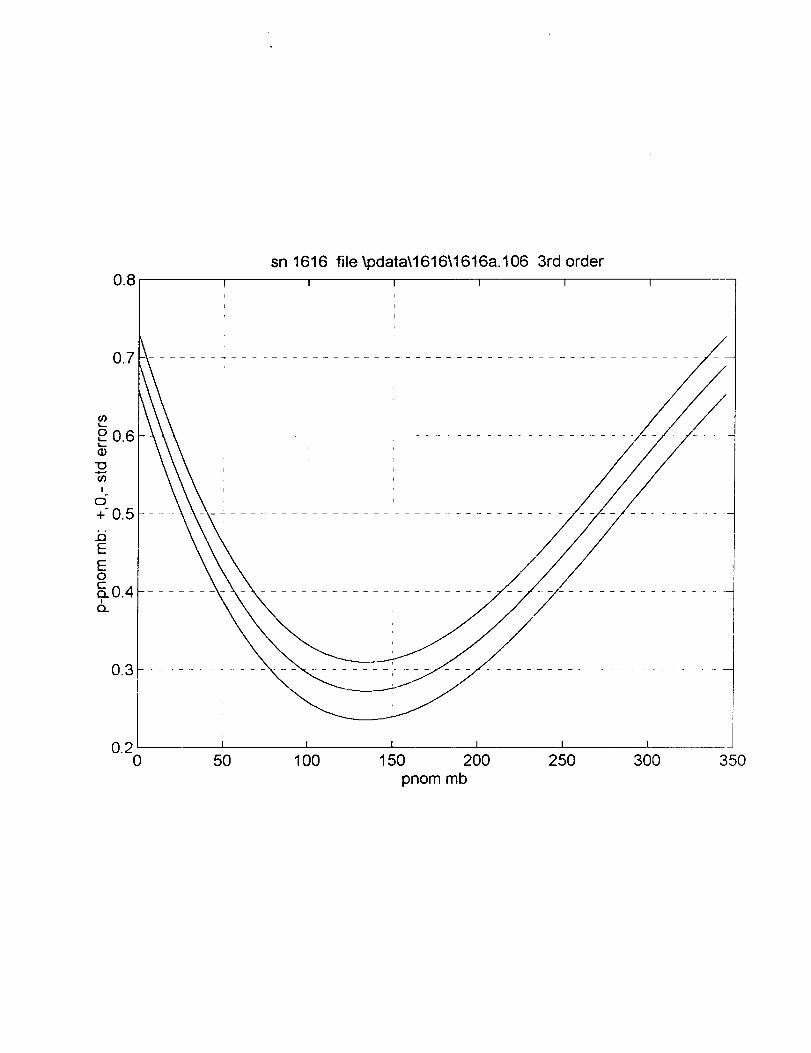
0.8sn 1616 file \pdata\1616\1616a.106 3rd order
! I
°7 ...... 4.
I I I
0 50 100 150 200 250 300 350
pnom mb
_0.50
0.4I
0+
1=0.3E0c
!
o-02
\
0 1 I0 50 1O0 150 200 250 300 350
pnom mb
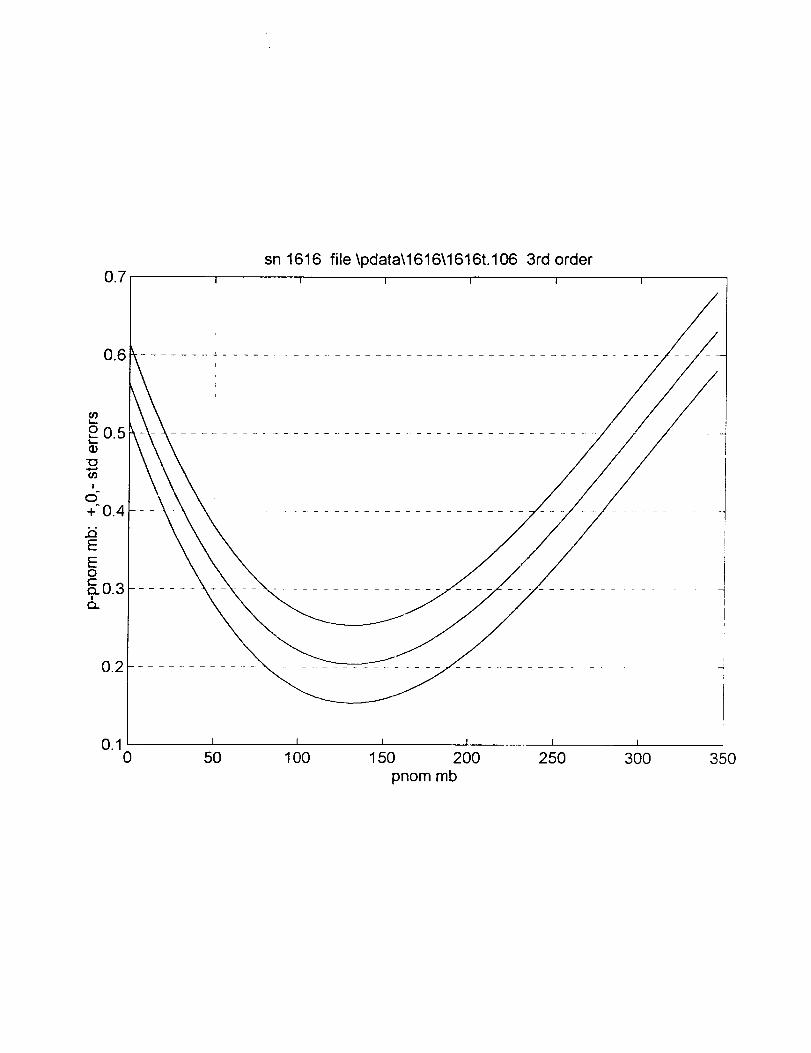
sn 1616 file \pdata\1616\1616t.106 3rd orderI I I l
I
II
J
0.10
I I I I
50 100 150 200 250 300 350
pnom mb

C E_ r _I:_ d.4 TJo zJ
Druck
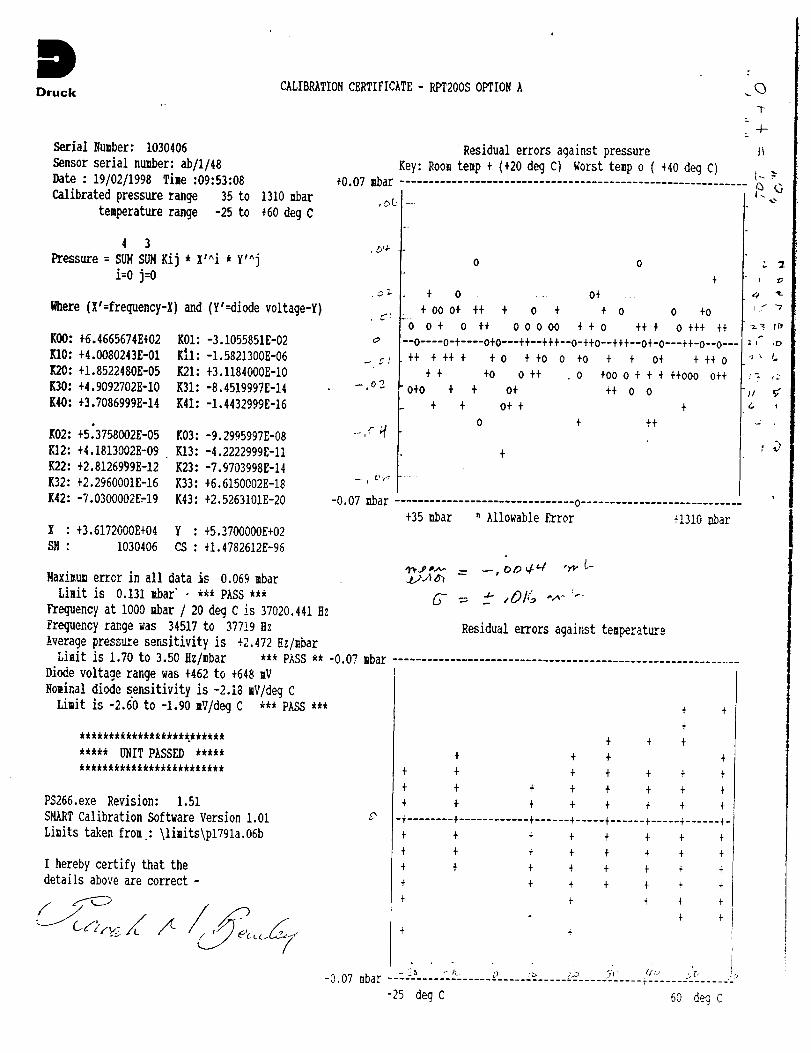
Serial _umber: 1030406
Sensor serial number: ab/1/48
Date : 19/02/1998 Time :09:53:08
Calibrated pressure range 35 to
temperature range -25 to
CALIBRATION CERTIFICATE - RPT200S OPTION A _<_
T
-4-
Residualerrorsagainstpressure _
Key: Room temp + (+20 deg C) Worst tempo ( +40 deg C) 1--+0.07 Bar ............................................................ %
4 3
Pressure : SUH SUM Ki9 * X'^i * Y'^j
i:o j:o
1310 mbar
+60 deg C
Where(X':frequency-X)and (Y'=diodevoltage-Y)
KO0:+6.4665674E+02 KOI: -3.1055851E-02
KIO: +4.0080243E-01 KII: -1.5821300E-06
K20:+1.8522480E-05 K21:+3.1184000E-I0
K30:+4.9092702E-I0 K31:-8.4519997E-14
K40:+3.7086999E-14 K41:-1.4432999E-16
K02:+5,3758002E-05 K03:-9.2995997E-08
[d2:+4.1813002E-09 KI3: -4.2222999E-II
K22:+2.8126999E-12 K23:-7.9703998E-14
K32:+2.2960001E-16 K33:+6.6150002E-18
K42:-7.0300002E=19 K43:+2.5263101E-20
X : +3.6172000E+04 Y : +5.3700000E+02
SN : 1030406 CS : +1.4782612E-96
c-
Q
--,o2
._.d_
0 o
+
+ 0 - o÷ -
+ O0 O+ ++ + 0 + + 0 0 +0
0 0 + 0 ++ 0 0 0 O0 + + 0 ++ + 0 +++ ÷÷
-'0....0-+....0+0"--++--+++--0-++0--+++'-0+-0"--++-0-'0---
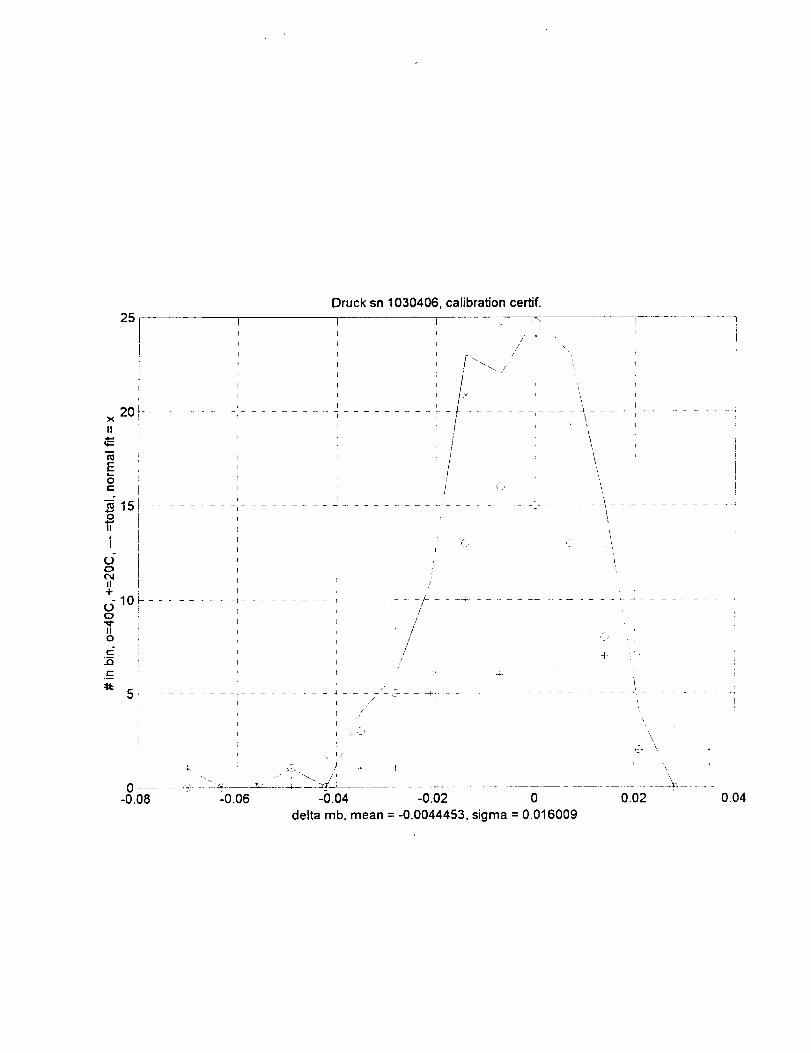
Maximum error in all data is 0.069 mbar
Limitis 0.131 mbar" - *_* PASS ***
Frequency at I000 _bar / 20 deg C is 37020.441 Hz
Freguency range was 34517 to 37719 Hz
Average pressure sensitivity is +2.472 Hz/mbar
++ + +÷ + + o + +o o +o + + o+ + ++ o
+ + +o o ++ . o +oo o + + + ++ooo o++
o+o + + o+ ++ o o
+ + o+ + +
0 + ++
-0.07 mbar ............................... o............................
+35 _bar n Allowable Error +1310 _bar
Residual errors against temperature
Limitis 1.70 to 3.50 Hz/mbar
Diodevoltage range was +462 to +648 mV
Nominal diode sensitivity is -2.18 mV/deg C
Limit is -2.60 to -1.90 mV/deg C *** PASS ***
*************************
***** UNIT PASSED *****
*************************
PS266.exeRevision: 1.51
SMART Calibration Software Version 1.01
Limits taken from : \limits\p1791a.O6b
I hereby certify that the
details above are correct -
*** P_S ** +0.07 mbar ............................................................
+ +
+
+ + +
+ + + +
+ + + + + + +
+ + + + + + + +
+ + + + ÷ + + +
D -4........+............ +......+.....+...... +.....+......+-
+ + + + + + + +
+ + + + + + + +
+ + + + + + + +
+ + + + + + +
+ + + + +
+ + +
÷ +
-0.07 mbar - z_ " _ o _ ;_ -,-,, +__I_, ;_,
-25 deg C 60 deg C
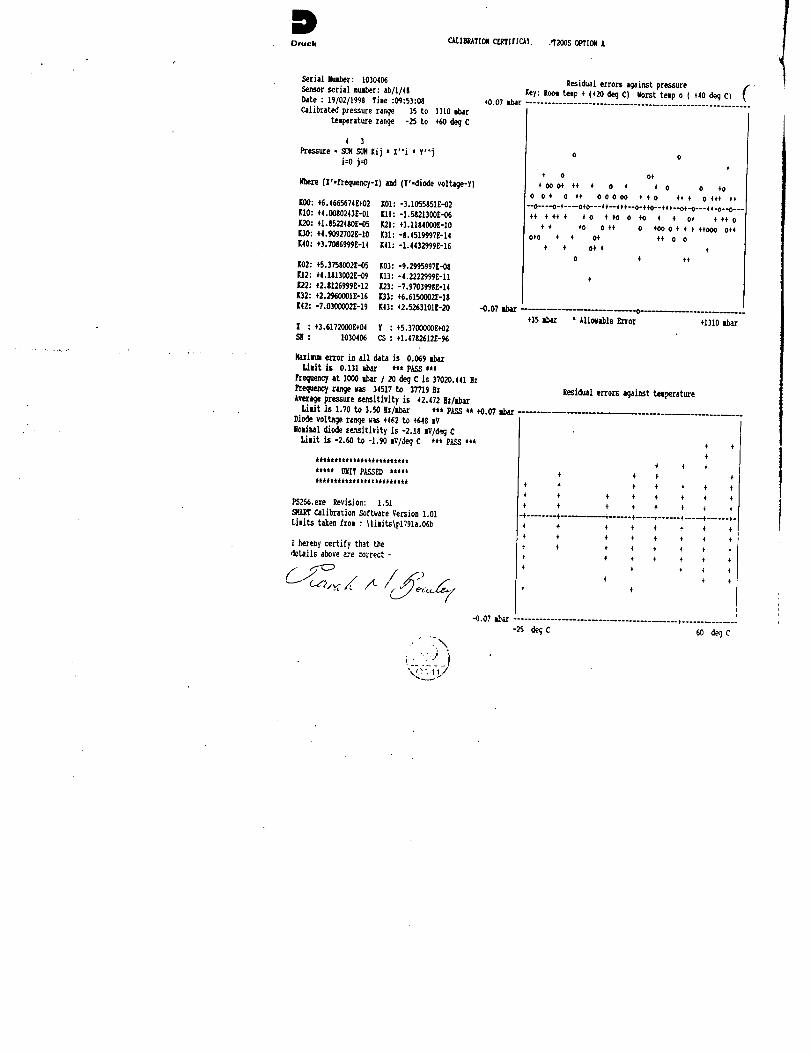
OruckCM,I_T[ON CE_IP[C_I. ._1'200S OPTIONA
Serial _u_er: 101o4o6
Sensor serial number: ab/l/48
Date : 19/02/1998 TiRe :09:53:0SCalibrated pressure ranqe 35 to 1310 ,bar
te,perature r_nge -25 to +60 deq C
4 3
Pte_ute = S_ _ Ki) * l'^i * Y'^)
i:O j=O
(Z':frequency-X) and (Y'--diode voltage-Y)
[00:+6.4665674E+02 KOI: -3,1055951£.-02
K10:*4.0080243E.-01 Ell: -1._21300£-06
I_0:÷1.6522|80£-05 _1:+3.1154000E-10
[30:÷4.9092702E-10 K31:-$,4519997E-14
[40:÷3.70_6999E-14 Kll: -1.1432999E-16
[02:4,5.37MOO2E-05 K03: -9.29%997E-_
rJ2:4,4.1513002E-09 [13:-4.2222999E-11
E22:+2.$1_999E-12 _3:-7.9703995go14
K32:÷2.296_01E-16 K33:÷6.6150002E-15
[42:-7.0300002E-19 K43:4.2.5_3101E-20
Z : +3.6172000E÷04 Y : 45.3700000E+02
: 1030406 CS : ÷1.47S2612£-%
Re_id_al errors _ai,st pressure /,
Key: Root telp ÷ 020 deq C) Worst teup o ( ÷40 de<]C) t+0.07 ml_r ............................................................
-0.07 Ibar
I_xi_ error in all &ta is 0,069
IJsit is 0.131 _ber t** pASS .*
rcequency at I0¢0 _bar 1 2O decjC is 37020.441 Kz
Prsque.n_ ra_e was 34517 to 37719 n|
Averacje pressure se_itivJty is +2.472 llz/Ib_Linit Js 1.70 to 3.50 _z]_r t** P),_S ** +0.07
Diode voltage r_nc_e v_s 4.4_2 to ÷648 sV
lloai_t diode e_sitivit_ is -2.18 sV/_ C
ti,it is -2.60 to -1.90 mV/_eq C *-- P_SS *--
i¢¢i¢_¢¢¢_t¢¢t_t¢lltt_¢t¢
***** _(IT PL._D ***"
_2_.eze Revision: 1.51
Calibration So_tvare version 1.01
i hereby certify _at the
details abo_e a:e _rrect -
•+" 2 \
o o
O00t ÷_ _ 0 4- t 0 0 TO0 0 4" 0 4+ 0 0 0 O0 _' 4. 0 ++ _ 0 J_+ _+
°-0----0-+----0+0---+ +--+ t _--O*÷+O--t +÷-"0+-0---_-0--0°-°
+÷ t ++ ÷ t 0 _ TO 0 ÷O t t O+ + +÷ 0
t + TO 0 ÷+ 0 400 0 + + ÷ ÷TO00 0÷+oTO ÷ + o÷ ÷t o o
4+ o_' 4- ÷0 4" I'+
4.35 _r • Allowable Error +1310 abar
Residual errors against temperature
÷ 4,
÷
4, 4 4.
4. + ,I+ +
4" 4. 4. 4. F 4- 4+
+ 4+ 4. .F 4+ 4+ +. ÷
at ÷ ÷ +++ ÷ <+ 'i t
-'I-....... -4....... +----÷ ..... _+-----÷ ..... ÷...... {.-
4 4- 4 4, + _. +. 4+
,+ ,I. + + + ÷ <+ ÷
÷ ++ ÷ + 4+ +. <. ÷
÷ 4' +.+ at + ÷ ++ 'I" ÷ "_ 4
+ ÷ ÷
÷ ÷
•-q.07 _r ........................................ +-..............
-_s de_ c 60 d_ c
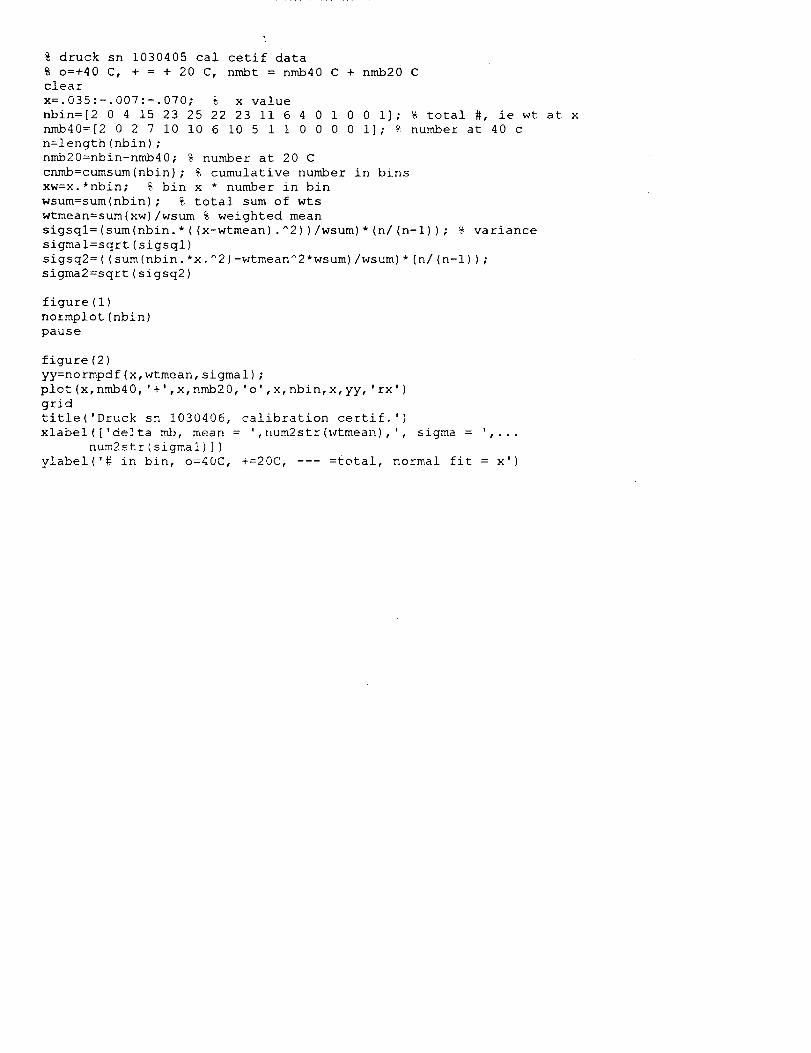
% druck sn 1030405 cal cetif data
% o=+40 C, + = + 20 C, nmbt = nmb40 C + nmb20 C
clear
x=.035:-.007:-.070; % x value
nbin=[2 0 4 15 23 25 22 23 ii 6 4 0 1 0 0 i]; % total #, ie wt at x
nmb40=[2 0 2 7 i0 i0 6 i0 5 1 1 0 0 0 0 i]; % number at 40 c
n=length(nbin);
nmb20=nbin-nmb40; % number at 20 C
cnmb=cumsum(nbin); % cumulative number in bins
xw=x.*nbin; % bin x * number in bin
wsum=sum(nbin); % total sum of wts
wtmean=sum(xw)/wsum % weighted mean
sigsql=(sum(nbin.*((x-wtmean).^2))/wsum)*(n/(n-l)); % variance
sigmal=sqrt(sigsql)
sigsq2=((sum(nbin.*x.^2)-wtmean^2*wsum)/wsum)*(n/(n-l));
sigma2=sqrt(sigsq2)
figure(l)
normplot(nbin)
pause
figure(2)
yy=normpdf(x, wtmean,sigmal);
plot(x,nmb40,'+',x, nmb20,'o',x,nbin, x,yy,'rx')
grid
title('Druck sn 1030406, calibration certif.')
xlabel(['delta mb, mean = ',num2str(wtmean),', sigma = ',...
num2str(sigmal)])
ylabe!('# in bin, o=40C, +=20C, =total, normal fit = x')
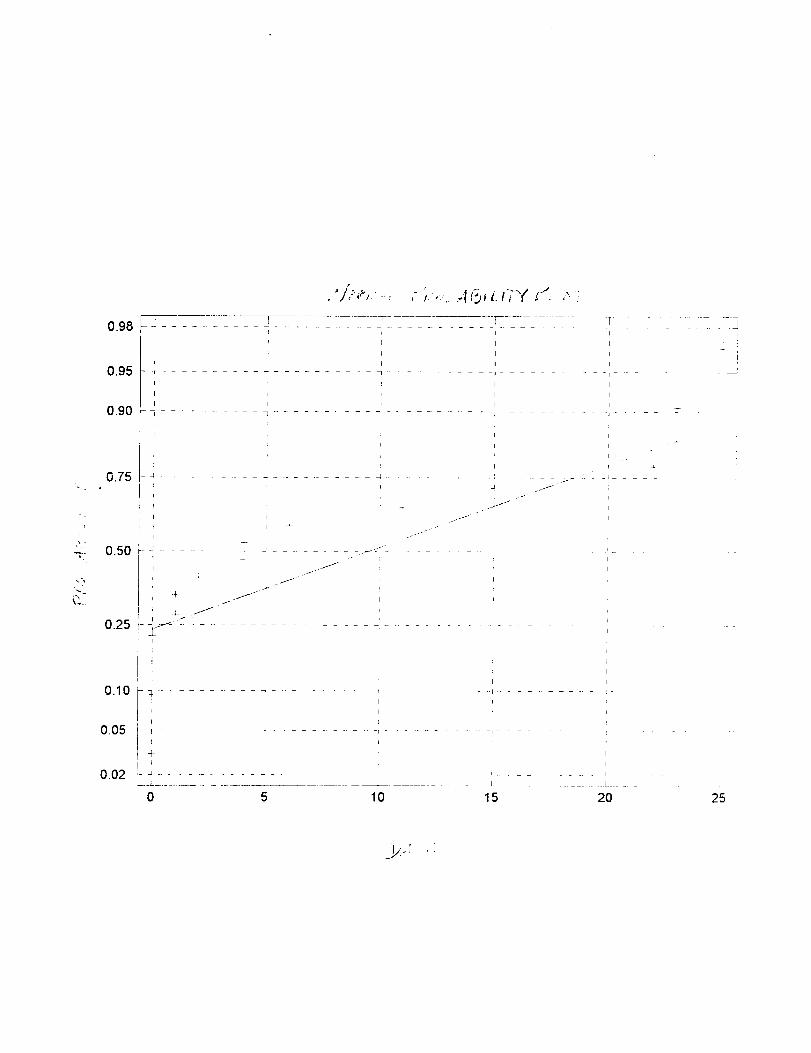
v._o _ .......... _ ....................... ,..........P r i
i I I ]l
I I IA A_
i s I
I I t
u._u _ _ .......... _ ...................... _ ............ - -_I
I I
b : 4
i p
1 I I J
-- I
j-
i /
0.25 - ±:-'.i_--1. i ................ ;' ......... ,' . _I i
; I
? ,1 :
F I
0.10 i?_ ......................... _' ,'_........ ,"-
0.05 i-' ....
-L _ I I
F L : I
0.02 _ ..........................
0 5 10 15 20 25
0.75
-- 0.50
25Druck sn 1030406, calibration certif.
'l" [
X
II
Oc-
2O
I
=
i
/ \
: r I
...... I ]
t 'I
t ...............
I
ii
0-0.08 -0.06
/
!
-0.04 -0.02 0 0.02
delta mb, mean = -0.0044453, sigma = 0.016009
0.04
5_i 16r_
CA-co i:; ie_ _, , o,,j
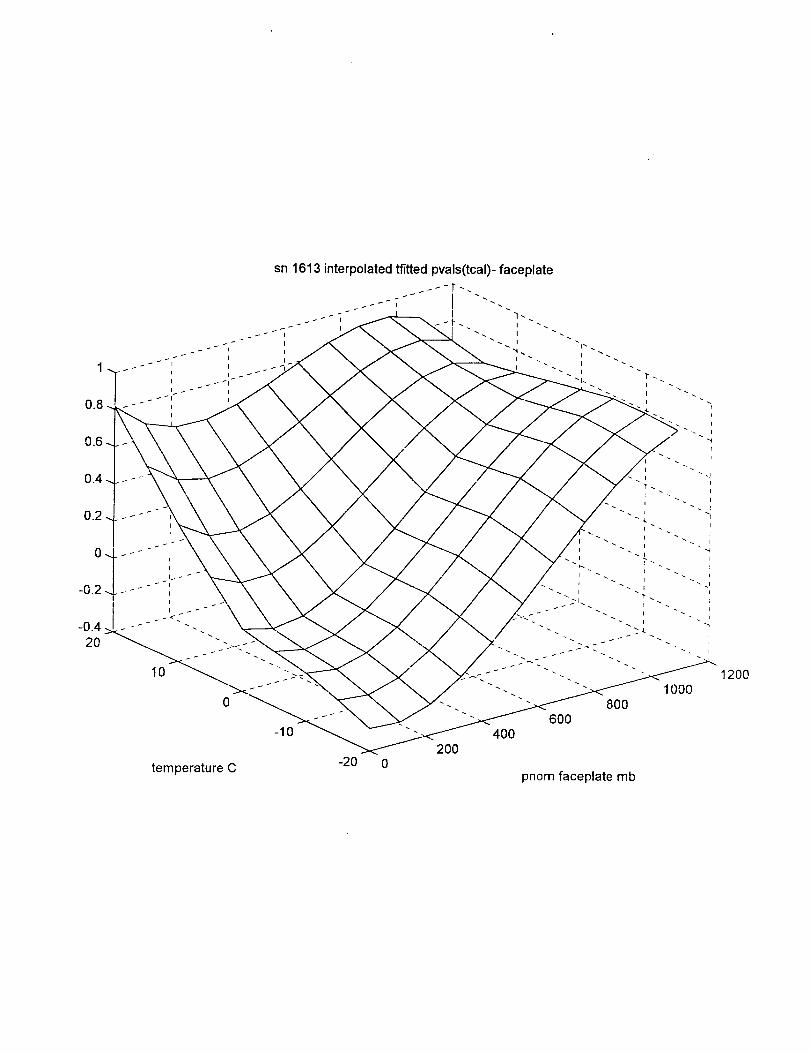
sn 1613 interpolated tfitted pvals(tcal)- faceplate
I
1200
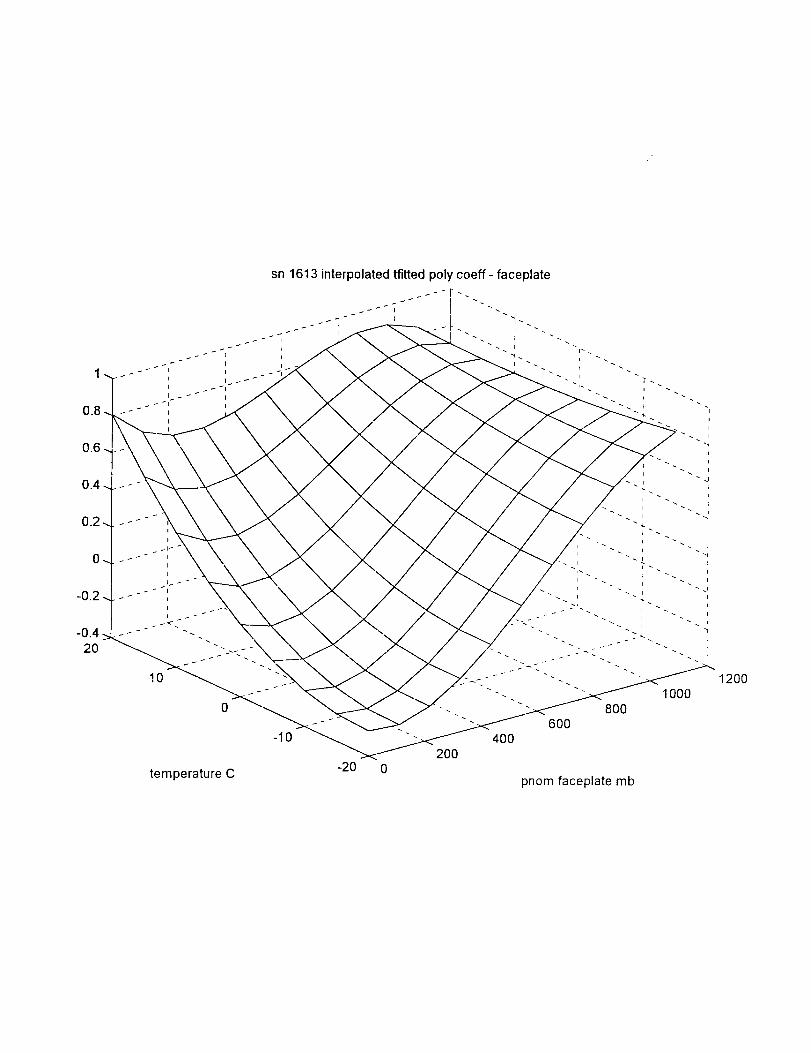
sn 1613 interpolated tfitted poly coeff- faceplate
I
I
t:- ,,_ J I,,)-_ 3 '_d
I_o L "/d o_...,.'A i.
/Is k-c,,,.'<:.'_,_i
I_ i'¢-S ,-",,?"T.!U
tl _t'f t_- T ':3 f _;._ - _
d c)1_la Cd/ v_
OOE_
I
I
S16131-T.M Monday, May 11, 1998 10:37am Page I
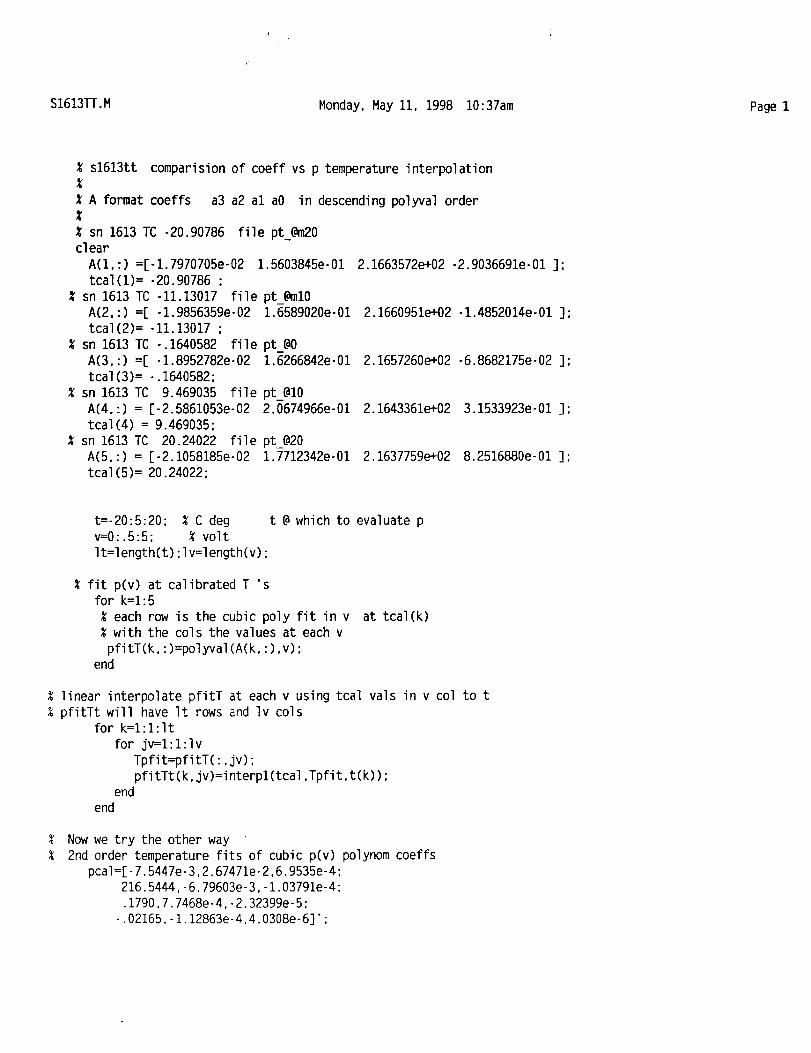
% s1613tt comparisionof coeff vs p temperatureinterpolation%
% A format coeffs a3 a2 al a0 in descending polyval order%
% sn 1613 TC -20.90786 file pt_@m20clear
A(1,:) =[-1.7970705e-02 1.5603845e-01
tcal(1)= -20.90786 :% sn 1613 TC -11.13017 file
A(2,:) =[ -1.9856359e-02
tcal(2)= -11.13017 ;% sn 1613 TC -.1640582 file
A(3,:) =[ -I.8952782e-02tcal(3)= -.1640582;
% sn 1613 TC 9.469035 file
A(4,:) = [-2.5861053e-02tcal(4) = 9.469035:
% sn 1613 TC 20.24022 file
A(5,:) = [-2.1058185e-02tcal(5)= 20.24022;
2.1663572e+02 -2.9036691e-01];
2.1660951e+02-1.4852014e-01];
2.1657260e+02-6.8682175e-02];
2.1643361e+02 3.1533923e-01];
2o1637759e+02 8.2516880e-01];
t=-20:5:20; % C deg t @ which to evaluate pv=0:.5:5; % volt
It=length(t);Iv=length(v);
% fit p(v) at calibrated T'sfor k=1:5
% each row is the cubic poly fit in v% with the cols the values at each v
pfitT(k,:)=polyval(A(k.:).v);end
at tcal(k)
% linear interpolate pfitT at each v using tcal vals in v col to t% pfitTt will have It rows and Iv cols
for k=l:l:Itfor jv=l:l:Iv
Tpfit=pfitT(:,jv);pfitTt(k,jv)=interpl(tcal,Tpfit,t(k));
endend
Now we try the other way
2nd order temperature fits of cubic p(v) polynom coeffs
pcal=[-7.5447e-3,2.67471e-2.6.9535e-4:216.5444,-6.79603e-3,-1.03791e-4:
.1790,7.7468e-4.-2.32399e-5:
-.02165.-1.12863e-4,4.0308e-6]';
S16131-F.M Monday, May 11, 1998 10:37am Page_
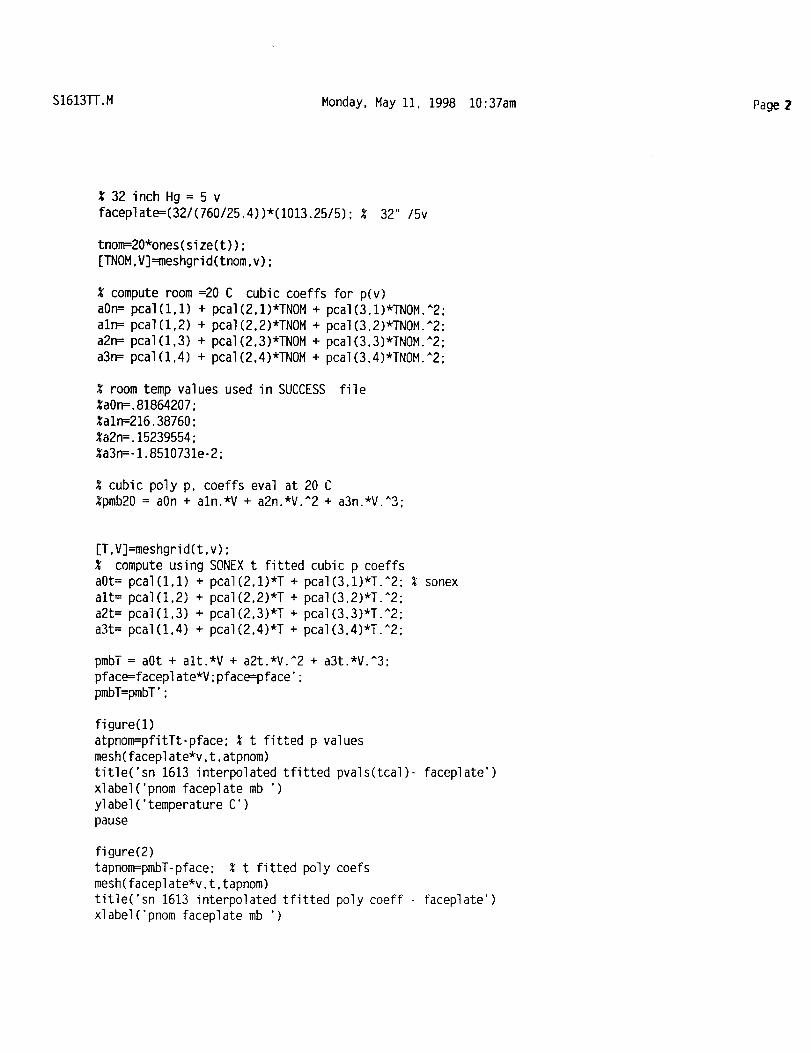
% 32 inch Hg = 5 v
faceplate=(32/(760/25.4))*(1013.25/5);% 32" /5v
tnom=20*ones(size(t));
[TNOM,V]=meshgrid(tnom,v);
% compute room =20 C cubic coeffs for p(v)
aOn= pcal(1,1) + pcal(2,1)*TNOM+ pcaI(3.1)*TNOM.A2;aln= pcal(1,2) + pcal(2,2)*TNOM+ pcal(3.2)*TNOM.^2:
a2n= pcal(1,3) + pcal(2,3)*TNOM+ pcal(3,3)*TNOM.A2;
a3n= pcal(1,4) + pcal(2,4)*TNOM+ pcal(3.4)*TNOM.^2;
% room temp values used in SUCCESS%aOn=.81864207;%aln=216.38760;%a2n=.15239554;%a3n=-1.8510731e-2;
file
% cubic poly p, coeffs eval at 20 C%pmb20= aOn + aln.*V + a2n.*V.^2 + a3n.*V.^3;
[T.V]=meshgrid(t,v);
% compute using SONEX t Fittedcubic p coeffs
aOt= pcal(1,1)+ pcal(2,1)*T+ pcal(3,1)*T.A2;% sonex
alt= pcal(1.2) + pcal(2,2)*T+ pcal(3.2)*T._2;
a2t= pcal(1,3) + pcal(2,3)*T+ pcal(3.3)*T.^2;
a3t= pcal(1,4) + pcal(2,4)*T+ pcal(3.4)*T._2;
pmbT = aOt + alt.*V + a2t.*V.^2 + a3t.*V.^3;pface=faceplate*V;pface=pface';pmbT=pmbT';
figure(I)atpnom:pfitTt-pface; % t fitted p valuesmesh(faceplate*v,t,atpnom)title('sn 1613 interpolated tfitted pvals(tcal)- faceplate °)xlabel('pnom faceplate mb ')ylabel('temperature C')pause
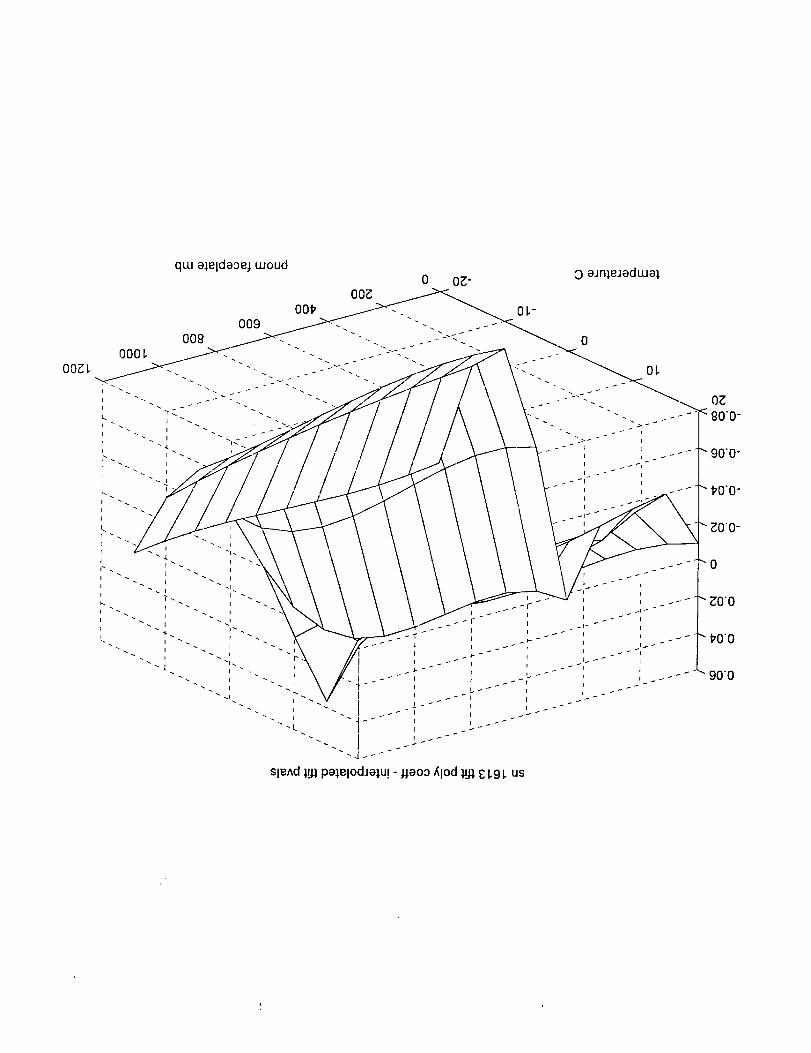
figure(2)tapnom=pmbT-pface; % t fitted poly coefsmesh(faceplate*v,t,tapnom)title('sn 1613 interpolated tfitted poly coeff - faceplate')xlabel('pnom faceplate mb ')
S16131-F.M Monday, May 11, 1998 10:37am Page 3
ylabel('temperatureC')
pause
figure(3)
mesh(faceplate*v,t,tapnom-atpnom)
title('sn 1613 tfit poly coeff - interpolatedtfit pvals')
xlabel('pnom faceplatemb ')
ylabel('temperatureC')
0,8"
0 200 40O 600 800 1000 1200
pface mb
sn1613 SONEX quad temperature interpolated cubic V coeffs
I
I
I
E 0.6
200 400 600 800 1000
place mb
1200
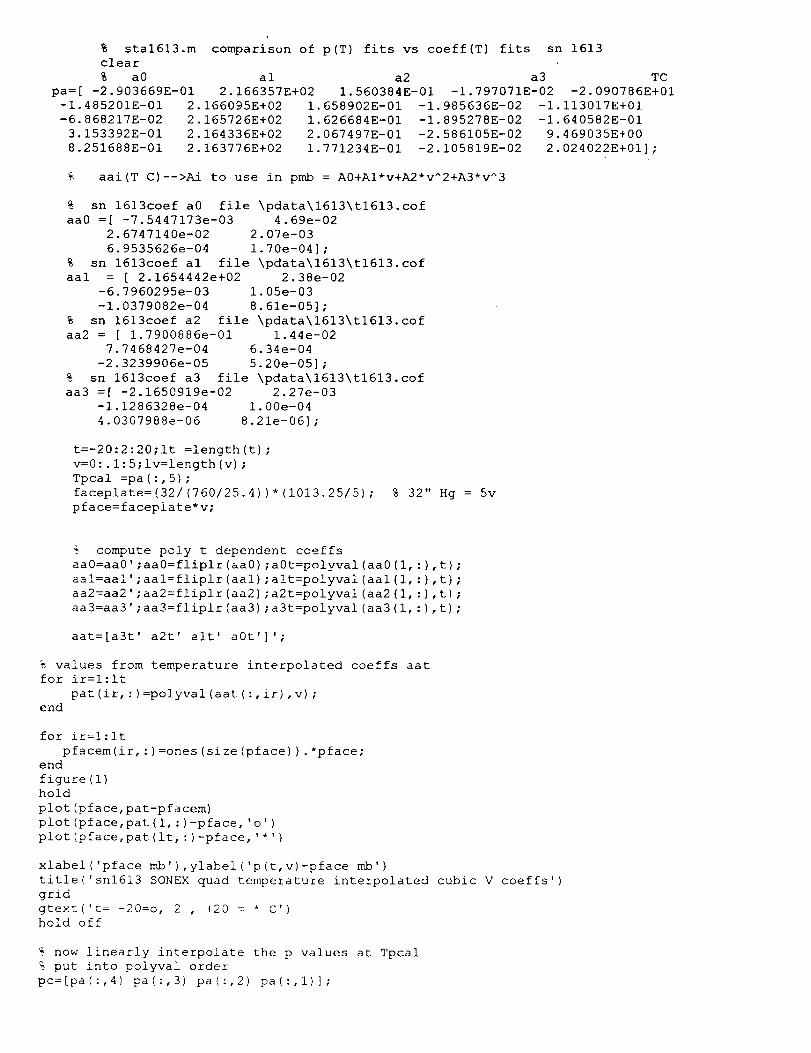
% stal613.m comparison of p(T) fits vs coeff(T) fits sn 1613clear
% a0 al a2 a3 TC
pa=[ -2.903669E-01 2.166357E+02 1.560384E-01 -1.797071E-02 -2.090786E+01
-1.485201E-01 2.166095E+02 1.658902E-01 -1.985636E-02 -I.I13017E+01
-6.868217E-02 2.165726E+02 1.626684E-01 -1.895278E-02 -1.640582E-01
3.153392E-01 2.164336E+02 2.067497E-01 -2.586105E-02 9.469035E+00
8.251688E-01 2.163776E+02 1.771234E-01 -2.105819E-02 2.024022E+01];
% aai(T C)-->Ai to use in pmb = A0+AI*v+A2*v^2+A3*v^3
% sn 1613coef a0 file \pdata\1613\tl613.cof
aa0 =[ -7.5447173e-03 4.69e-02
2.6747140e-02 2.07e-03
6.9535626e-04 1.70e-04];
% sn 1613coef al file \pdata\1613ktl613.cof
aal = [ 2.1654442e+02 2.38e-02
-6.7960295e-03 1.05e-03
-I.0379082e-04 8.61e-05];
% sn 1613coef a2 file \pdatakl613\tl613.cof
aa2 = [ 1.7900886e-01 1.44e-02
7.7468427e-04 6.34e-04
-2.3239906e-05 5.20e-05];
% sn 1613coef a3 file \pdata\1613\tl613.cof
aa3 =[ -2.1650919e-02 2.27e-03
-i.1286328e-04 1.00e-04
4.0307988e-06 8.21e-06];
t=-20:2:20;it =length(t);
v=0:.l:5;lv=length(v);
Tpcal =pa(:,5);
faceplate=(32/(760/25.4))*(lO13.25/5);
pface=faceplate*v;
% 32" Hg = 5v
compute poly t dependent coeffs
aa0=aa0';aa0=fliplr(aa0);a0t=polyval(aa0(l,:),t);
aal=aal';aal=fliplr(aal);a!t=po!yval(aal(l,:),t);
aa2=aa2';aa2=fliplr(aa2);a2t=polyval(aa2(l,:),tl;
aa3=aa3';aa3=fliplr(aa3);a3t=polyval(aa3(l,:),t);
aat=[a3t' a2t' alt' a0t']';
% values from temperaturefor ir=l:lt
pat(ir,:)=polyval(aat(end
interpolated coeffs aat
:,ir),v);
for ir=l:it
pfacem(ir,:)=ones(size(pface)).*pface;end
figure(l)
hold
plot (pface, pat-pfacem)
plot (pface, pat (l, :)-pface, 'o')
plot (pface,pat (it, :)-pface, '*')
xlabel('pface mb'),ylabel('p(t,v)-pface mb')
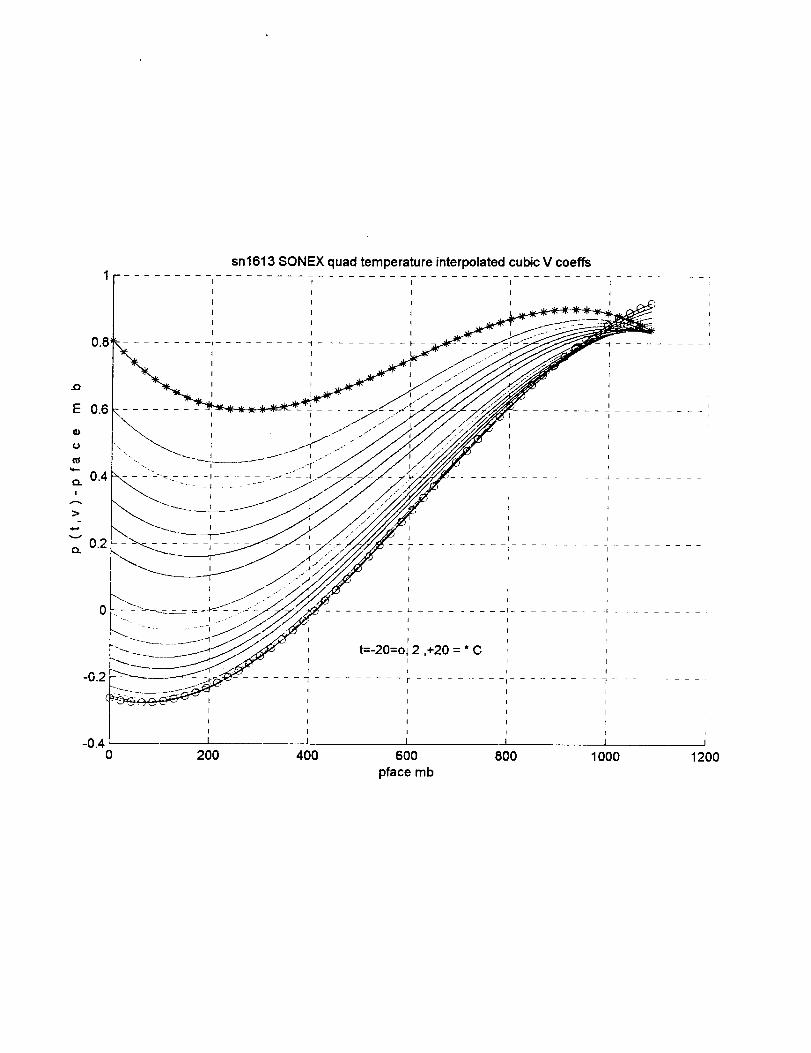
title('snl613 SONEX quad temperature interpolated
grid
gtext('t= -20=0, 2 , +20 = * C')hold off
cubic
% now linearly interpolate the p values
% put into polyval order
pc=[pa(:,4) pa(:,3) pa(:,2) pa(:,l)];
at Tpcal
V coeffs')
for ir=l : 5pcalT(ir, :)=polyval(pc(ir, :),v) ;
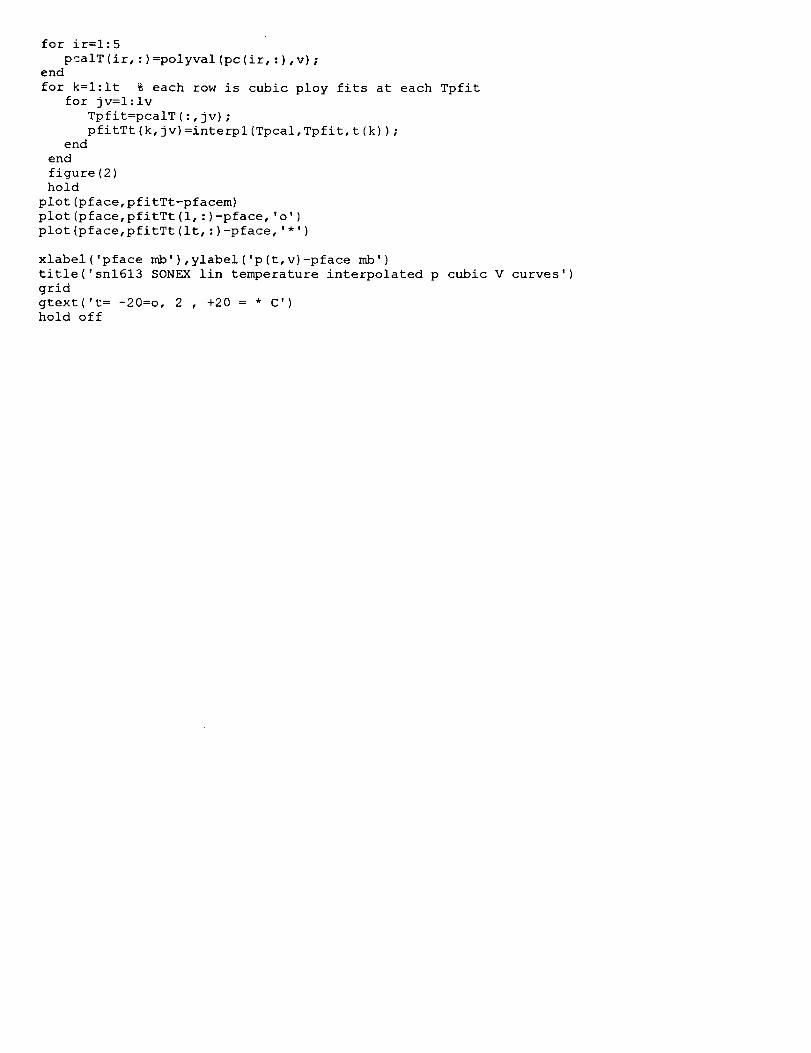
endfor k=l:it %each row is cubic ploy fits at each Tpfit
for jv=l: IvTpfit=pcalT (:, jv) ;pfitTt (k, jv)=interpl (Tpcal, Tpfit, t (k)) ;
endendfigure (2)hold
plot (pface, pfitTt-pfacem)plot(pface,pfitTt(l, :)-pface, 'o')plot (pface, pfitTt (it, : )-pface, ' * ' )
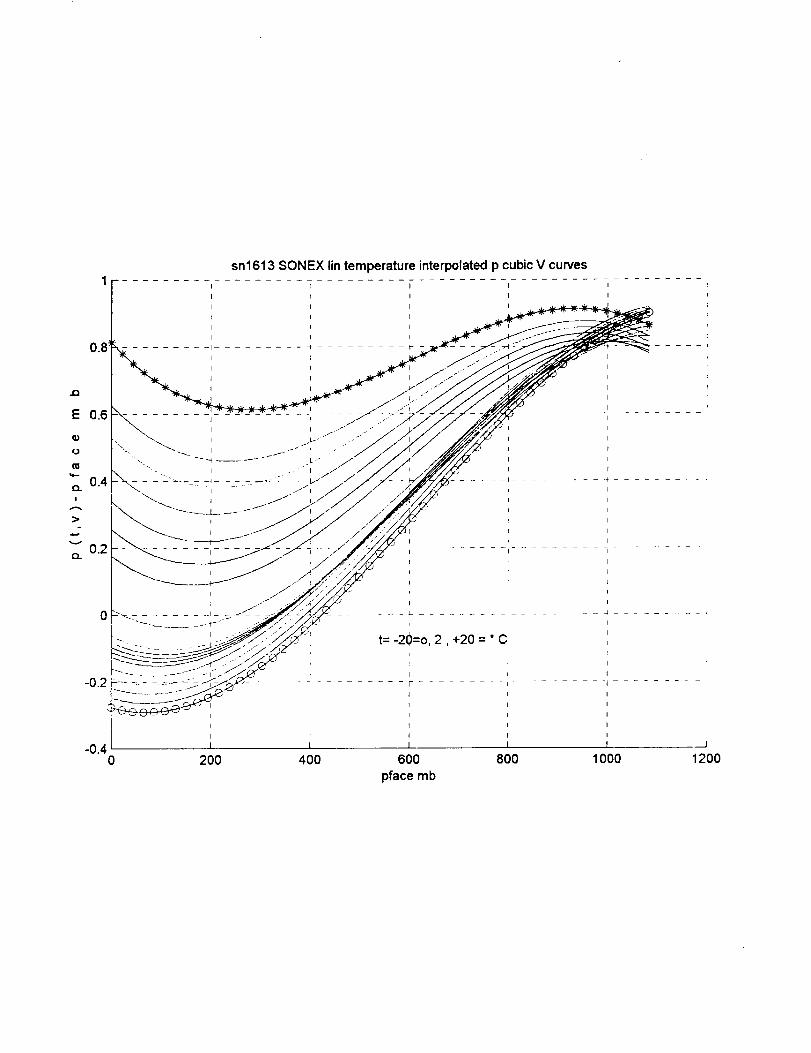
xlabel('pface mb'),ylabel('p(t,v)-pface rob')title('snl613 SONEXlin temperature interpolated p cubic V curves')gridgtext('t= -20=0, 2 , +20 = * C')hold off
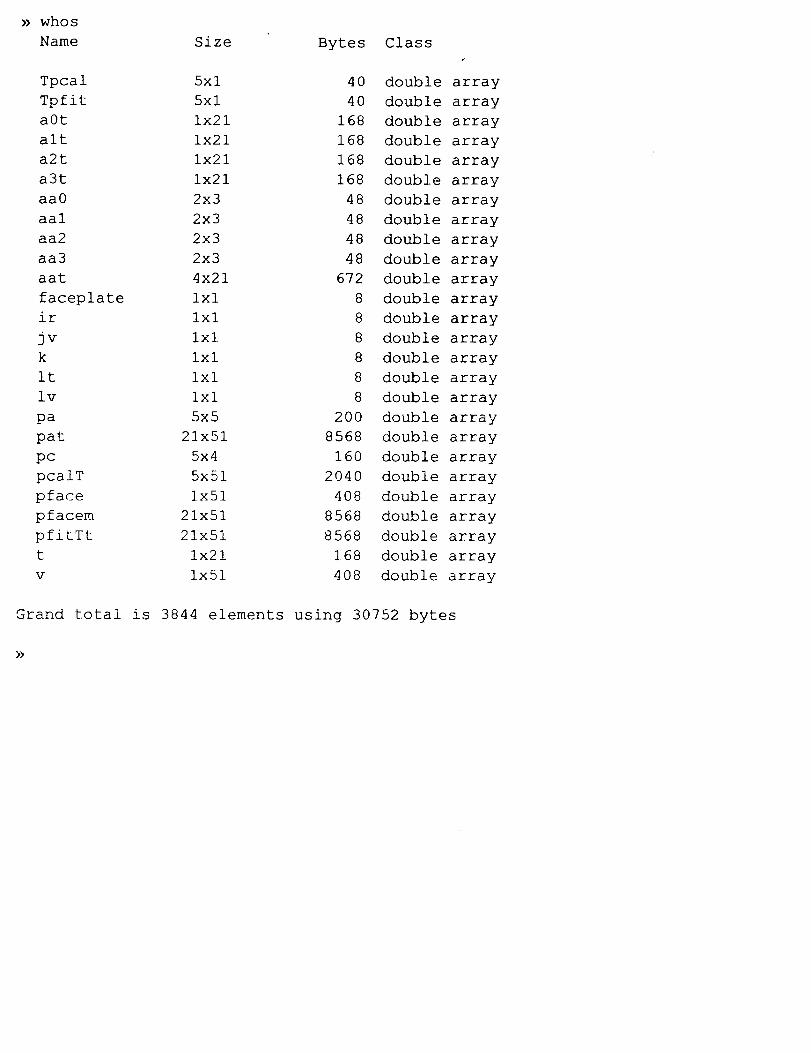
whos
Name Size Bytes Class
Tpcal 5xl 40 double array
Tpfit 5xl 40 double array
a0t ix21 168 double array
alt ix21 168 double array
a2t ix21 168 double array
a3t ix21 168 double array
aa0 2x3 48 double array
aal 2x3 48 double array
aa2 2x3 48 double array
aa3 2x3 48 double array
aat 4x21 672 double array
faceplate ixl 8 double array
ir Ixl 8 double array
jv ixl 8 double array
k ixl 8 double array
it ixl 8 double array
iv ixl 8 double array
pa 5x5 200 double array
pat 21x51 8568 double array
pc 5x4 160 double array
pcalT 5x51 2040 double array
place Ix51 408 double array
pfacem 21x51 8568 double array
pfitTt 21x51 8568 double array
t ix21 ].68 double array
v Ix51 408 double array
Grand total is 3844 elements using 30752 bytes
>>
whos
Name Size Bytes Class
Tpcal 5xl 40
Tpfit 5xl 40
a0t ix21 168
alt ix21 168
a2t ix21 168
a3t ix21 168
aa0 2x3 48
aal 2x3 48
aa2 2x3 48
aa3 2x3 48
aat 4x21 672
faceplate ixl 8
ir ixl 8
jv ixl 8
k Ixl 8
it ixl 8
iv ixl 8
pa 5x5 200
pat 21x51 8568
pc 5x4 160
pcalT 5x51 2040
pface !x51 408
pfacem 21x51 8568
pfitTt 21x51 8568
t ix21 168
v ix51 408
double array
double array
double array
double array
double array
double array
double array
double array
double array
double array
double array
double array
double array
double array
double array
double array
double array
double array
double array
double array
double array
double array
double array
double array
double array
double array
Grand total is 3844 elements using 30752 bytes
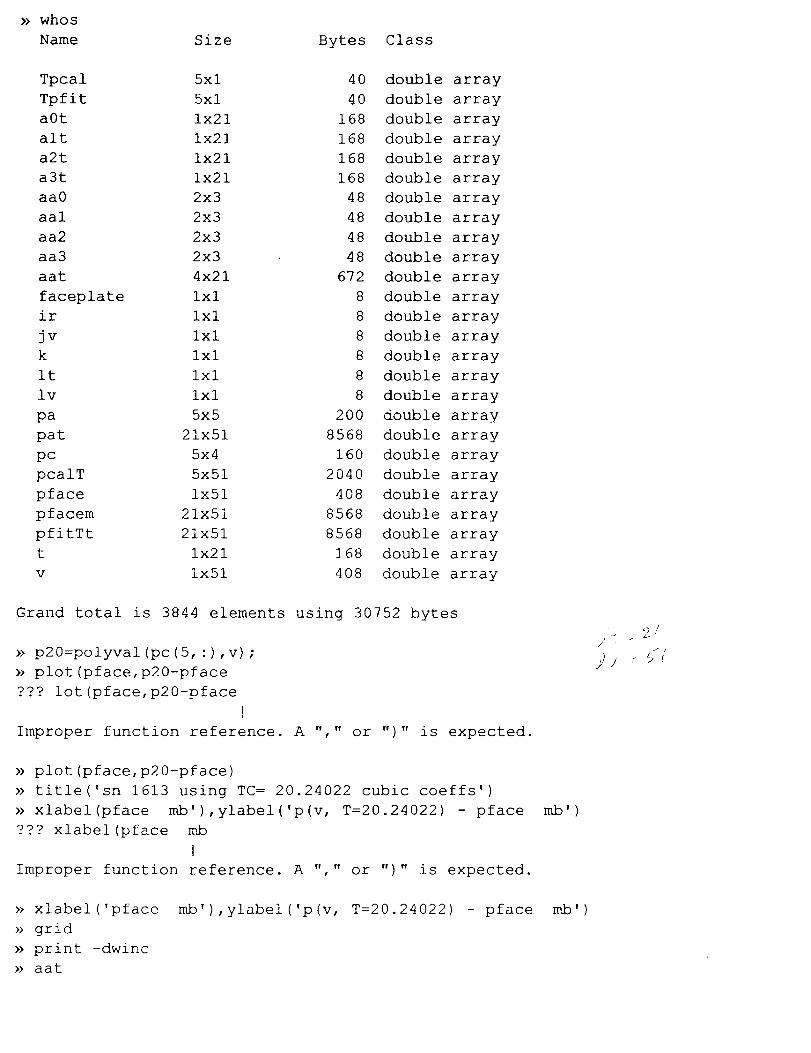
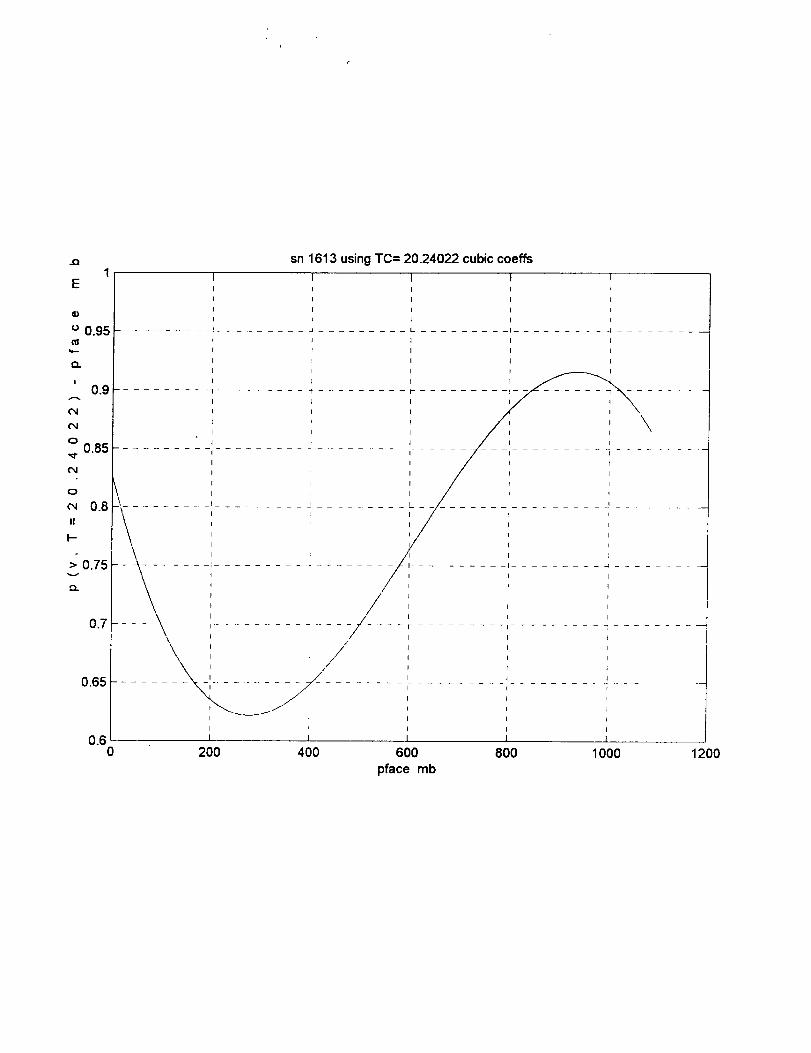
>> p20=polyval (pc (5, :),v) ;
>> plot (pface,p20-pface
??? lot(pface,p20-pface
I
Improper function reference. A ", " or ")" is expected.
/, I
i _"/.,;,.I :
>> plot (pface, p20-pface)
>> title('sn 1613 using TC = 20.24022 cubic coeffs')
>> xlabel(pface mb'),ylabel('p(v, T=20.24022) - pface
??? xlabel(pface mb
I
Improper function reference. A "," or ")" is expected.
rob')
xlabel('pface
>> grid
print -dwinc
aat
mb'),ylabel('p(v, T=20.24022) - pface mb')
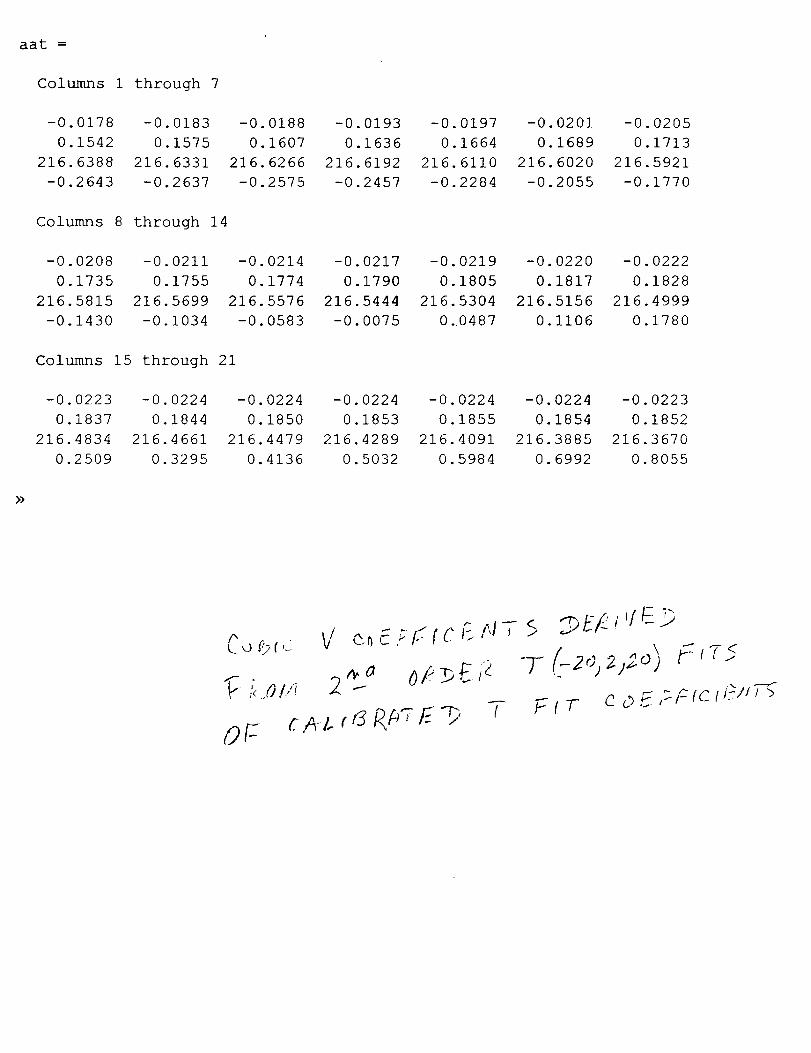
aat =
Columns 1 through 7
-0.0178 -0.0183 -0.01880.1542 0.1575 0.1607
216.6388 216.6331 216.6266-0.2643 -0.2637 -0.2575
-0.0193 -0.0197 -0.0201 -0.02050.1636 0.1664 0.1689 0.1713
216.6192 216.6110 216.6020 216.5921-0.2457 -0.2284 -0.2055 -0.1770
Columns 8 through 14
-0.0208 -0.0211 -0.02140.1735 0.1755 0.1774
216.5815 216.5699 216.5576-0.1430 -0.1034 -0.0583
-0.0217 -0.0219 -0.0220 -0.02220.1790 0.1805 0.1817 0.1828
216.5444 216.5304 216.5156 216.4999-0.0075 0.0487 0.1106 0.1780
Columns 15 through 21
-0.0223 -0.0224 -0.02240.1837 0.1844 0.1850
216.4834 216.4661 216.44790.2509 0.3295 0.4136
-0.0224 -0.0224 -0.0224 -0.02230.1853 0.1855 0.1854 0.1852
216.4289 216.4091 216.3885 216.3670
0.5032 0.5984 0.6992 0.8055
>>
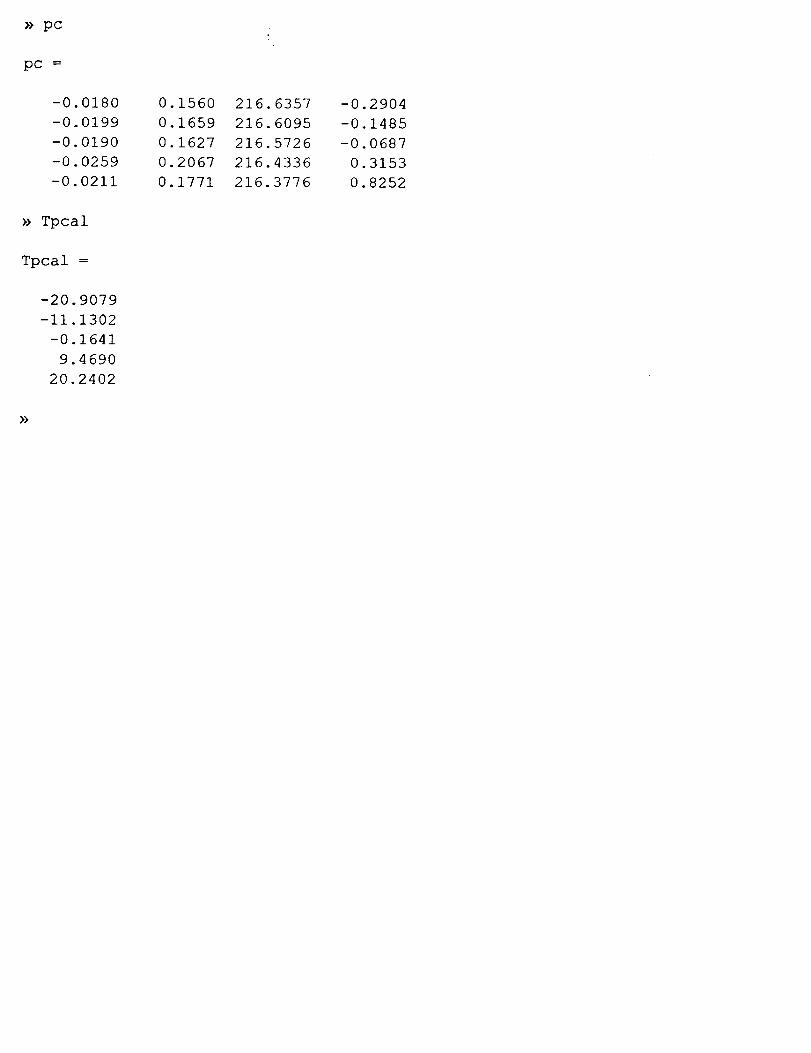
_ pc
pc =
-0.0180
-0.0199
-0.0190
-0.0259
-0.0211
7> Tpcal
Tpcal =
-20.9079
-11.1302
-0.1641
9.4690
20.2402
0.1560
0.1659
0.1627
0.2067
0.1771
216.6357
216.6095
216.5726
216.4336
216.3776
-0.2904
-0.1485
-0.0687
0.3153
0.8252
>>
.Q sn 1613 using TC= 20.24022 cubic coeffs1 I I I I I
E I I I I I
I I I I I
I I I I I
I I I I I
131 0.95 .......... ,......... _ ......... L ......... ,......... . .........11_ I I I I
Q. i i I t
i i i i
' 0.9 ' ' -_\¢_I i i
' I I I
, I IO
0.85 ......... ........... =.......... r ......... ,........ _ ........I I I I I
I : I t I
0 I I I I
b........ I I .......... I I
(w 0.8 _ ........... ! .....
I--
• F -i-
X l
......\ ..................../ ;.................'I
u.uo , r ; ........
I I I I
0.6 i I I i0 200 400 600 800 1000 1200
place mb