Embed Size (px)
Citation preview
TroubleshootingVirtual Desktop ServiceNetAppMarch 02, 2022
This PDF was generated from https://docs.netapp.com/us-en/virtual-desktop-service/Troubleshooting.reviewing_vds_logs.html on March 02, 2022. Always check docs.netapp.com forthe latest.
Table of Contents
Troubleshooting . . . . . . . . . . . . . . . . . . . . . . . . . . . . . . . . . . . . . . . . . . . . . . . . . . . . . . . . . . . . . . . . . . . . . . . . . . 1
Troubleshooting Failed VDS Actions . . . . . . . . . . . . . . . . . . . . . . . . . . . . . . . . . . . . . . . . . . . . . . . . . . . . . . . . 1
Internet Connection Quality Troubleshooting . . . . . . . . . . . . . . . . . . . . . . . . . . . . . . . . . . . . . . . . . . . . . . . . . . 6
Enable Desktop Wallpaper for User Sessions . . . . . . . . . . . . . . . . . . . . . . . . . . . . . . . . . . . . . . . . . . . . . . . . . 9
Troubleshooting Printing Issues . . . . . . . . . . . . . . . . . . . . . . . . . . . . . . . . . . . . . . . . . . . . . . . . . . . . . . . . . . . 11
Azure vCPU Core Quota . . . . . . . . . . . . . . . . . . . . . . . . . . . . . . . . . . . . . . . . . . . . . . . . . . . . . . . . . . . . . . . . 12
Unlocking User Accounts . . . . . . . . . . . . . . . . . . . . . . . . . . . . . . . . . . . . . . . . . . . . . . . . . . . . . . . . . . . . . . . . 15
Troubleshooting Virtual Machine Performance . . . . . . . . . . . . . . . . . . . . . . . . . . . . . . . . . . . . . . . . . . . . . . . 17
DNS Forwards for Azure ADDS & SSO via O365 identity . . . . . . . . . . . . . . . . . . . . . . . . . . . . . . . . . . . . . . . 28
Troubleshooting Application Issues . . . . . . . . . . . . . . . . . . . . . . . . . . . . . . . . . . . . . . . . . . . . . . . . . . . . . . . . 34
Troubleshooting
Troubleshooting Failed VDS Actions
Overview
Much of the logging that happens in VDS is not exposed in the web UI due to the sheer volume of it. More
detailed logs are found on the end point. These logs are described below.
In VDS v5.4+, the logs are found in the following folder path:
C:\programdata\cloudworkspace
In previous version of VDS, they can reside in the following paths:
C:\Program Files\CloudWorkspace\
C:\Program Files\CloudJumper\
C:\Program Files\IndependenceIT\
File type also varies by VDS version, log files are either .txt or .log files found in sub-folders of
the above outlined path.
Automation logs
CW VM Automation Service log
CwVmAutomationService.log
The CW VM Automation service is a Windows Service that is responsible for the management of all Virtual
Machines in the deployment. As a Windows Service it is always running in a deployment, but has two main
modes of operation: Scheduled Task Mode and Event Mode.
Scheduled Task Mode consists of activities that are performed on the VMs as part of a schedule, including
collection sizing and performance data, rebooting VMs, checking on state (on or off) vs rule sets generated by
the Workload Schedule and Live Scaling features. The logs denote these action types in the 5th column with
names like “Daily Actions”, “Weekly Actions” and “Daily Maintenance”. If you are troubleshooting questions like
“Why did Server X reboot last night at 2:00 am” or “Why is this server on when I think it should be off” then the
scheduled tasks for those specific VMs are usually the best place to look.
Event Mode is activated when a user or other VDS Service such as the CW Automation Service asks for a
Task to be completed. Examples of this type of activity include a user request to Create a new Server or CW
Automation requesting the sizing and state of servers to be checked because more users were added to the
workspace. These events typically have log entries with both the event name “Create Server” and the actual
name of the VM right next to it (ex: Create Server NNXTS2). When troubleshooting these types of events, its
usually best to scroll to the bottom of the log and then to an upwards search for the VM name. You can then
scroll up more rows to see where the process started.
1
CW Automation Service log
CWAutomationService.log
The CW Automation Service log is the primary Windows services for managing the components of a
Workspace deployment. It runs the tasks required to manage users, applications, data devices, and policy. In
addition, it can create tasks for the CW VM Automation Service when changes need to be made to size, count,
or state of the VMs in the deployment.
Like the CW VM Automation Service, the CW Automation service executes both scheduled tasks and event
driven tasks, with the latter being the more frequent type. The log for the CW Automation Service starts each
line with the entity and action being worked on (ex: Start Server NNXTS1) so searching for the entity name
from the bottom of the file is the quickest way to find the specific log lines that apply to the task.
CW Agent Service log
CwAgent.log
The CW Agent Service performs all the tasks that are local to a specific VM, including checking the resource
levels and utilization for the VM, checking that the VM has a valid certificate for TLS traffic, and checking to see
if the mandatory reboot period has been reached. Besides checking on detail information on these tasks, this
log can also be used to check for unexpected VM restarts or unexpected network or resource activity.
CWManagerX log
CWManagerX.log
CWManagerX is a web service that provides the communication link between the local Deployment and the
VDS global control plane. Tasks and data requests that originate in the VDS Web Application or VDS API are
communicated to the local deployment through this web service. From there, the tasks and requests are
directed to the appropriate web service (described above) or in rare cases directly to Active Directory. Since
this is mostly a communications link there isn’t much logging that occurs during normal communication, but this
log will contain errors when the communication link is broken or performing incorrectly.
DC Config log
DCConfig.log
DC Config is a Windows application that provides Deployment specific configuration parameters that are not
exposed in the VDS Web Application interface. The DC Config log details the activities runs when configuration
changes are made in DC Config.
CAVDCDeployment log
CAVDCDeployment.log
2
CW vDC Deployment is a Windows application that performs the tasks necessary to create a Deployment in
Azure. The log tracks the configuration of the Cloud Workspace windows services, default GPOs, and routing
and resource rules.
Miscellaneous logs
CwVmAutomationService-Installing.log
CwAgent-Installing.log
The remaining logs track the installation of the Windows Services and application described above. Since VDS
services auto-update when a new version is targeted at that specific deployment, these logs track the upgrade
process since the Service or application typically needs to be off while being upgraded. If you find the Services
are consistently Stopped these logs can help identify if a failed upgrade to a specific service is the cause. In
these cases, we would expect to see an error in these logs detailing why the upgrade failed.
Accessing logs and reviewing information
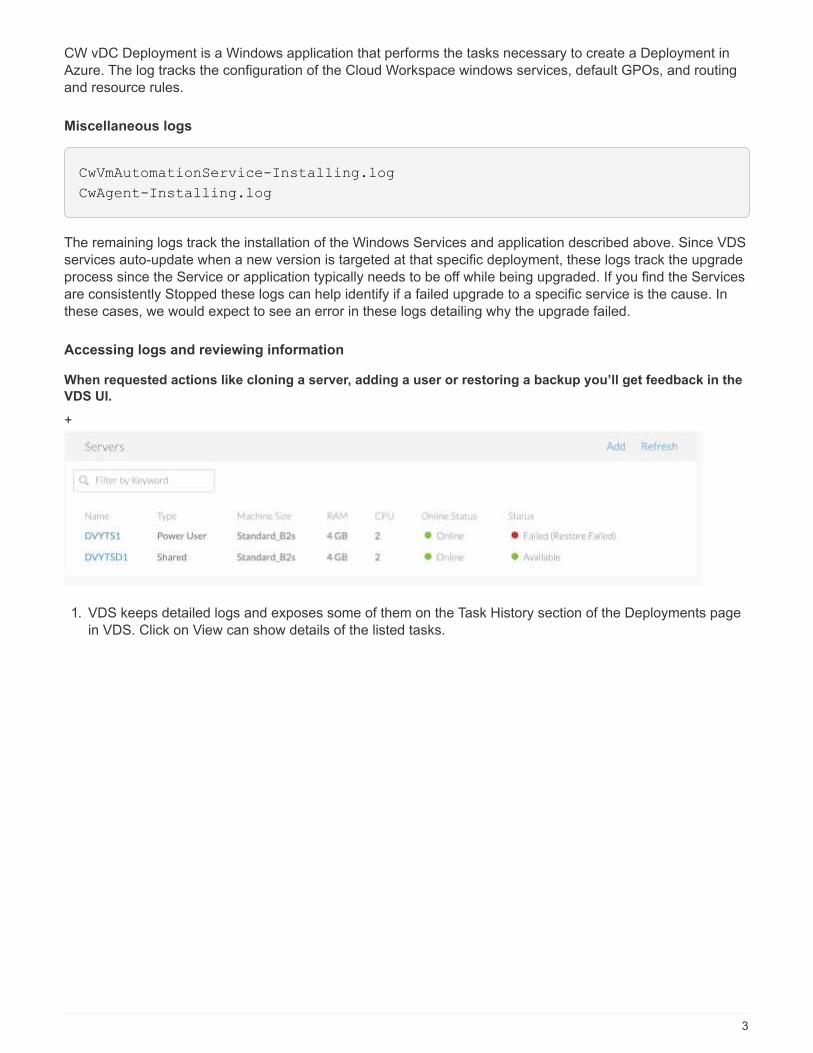
When requested actions like cloning a server, adding a user or restoring a backup you’ll get feedback in the
VDS UI.
+
1. VDS keeps detailed logs and exposes some of them on the Task History section of the Deployments page
in VDS. Click on View can show details of the listed tasks.
3
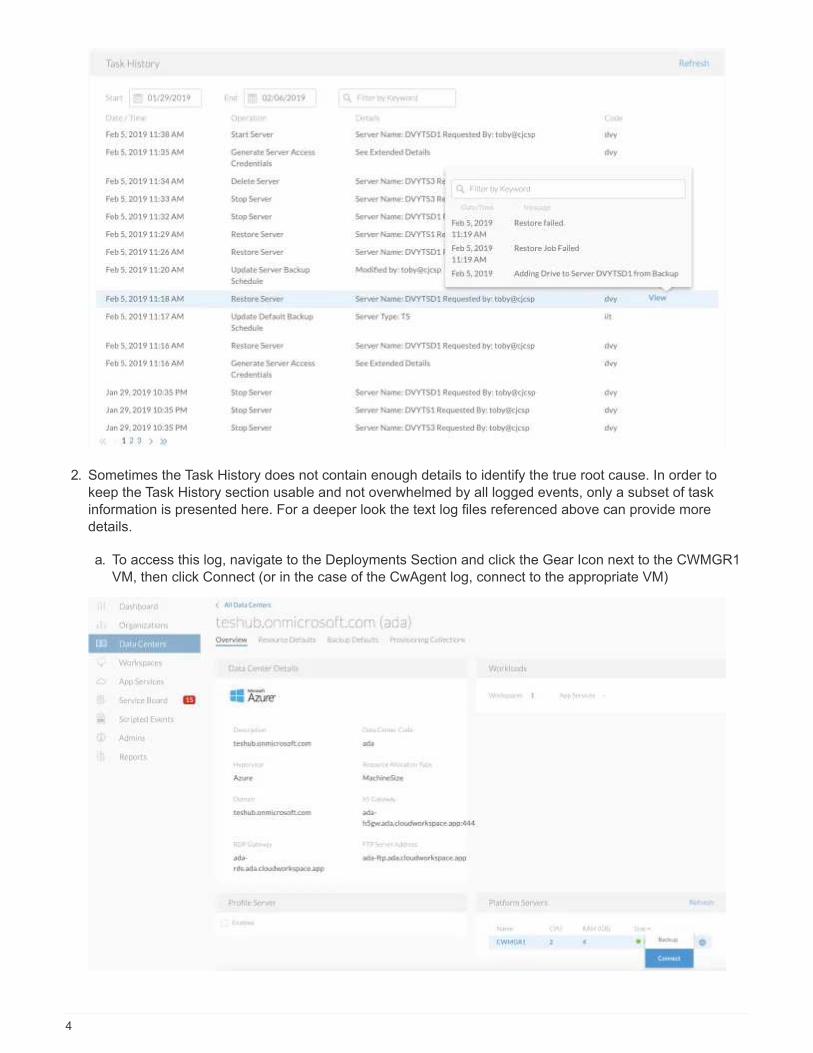
2. Sometimes the Task History does not contain enough details to identify the true root cause. In order to
keep the Task History section usable and not overwhelmed by all logged events, only a subset of task
information is presented here. For a deeper look the text log files referenced above can provide more
details.
a. To access this log, navigate to the Deployments Section and click the Gear Icon next to the CWMGR1
VM, then click Connect (or in the case of the CwAgent log, connect to the appropriate VM)
4
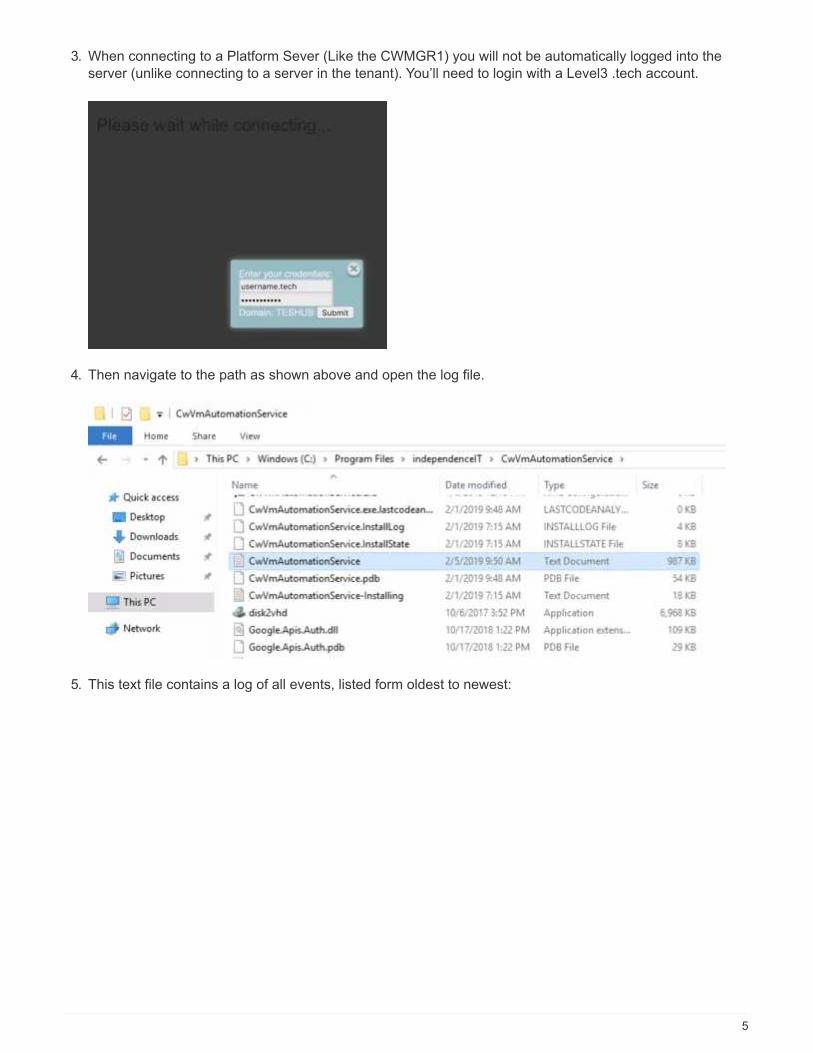
3. When connecting to a Platform Sever (Like the CWMGR1) you will not be automatically logged into the
server (unlike connecting to a server in the tenant). You’ll need to login with a Level3 .tech account.
4. Then navigate to the path as shown above and open the log file.
5. This text file contains a log of all events, listed form oldest to newest:
5
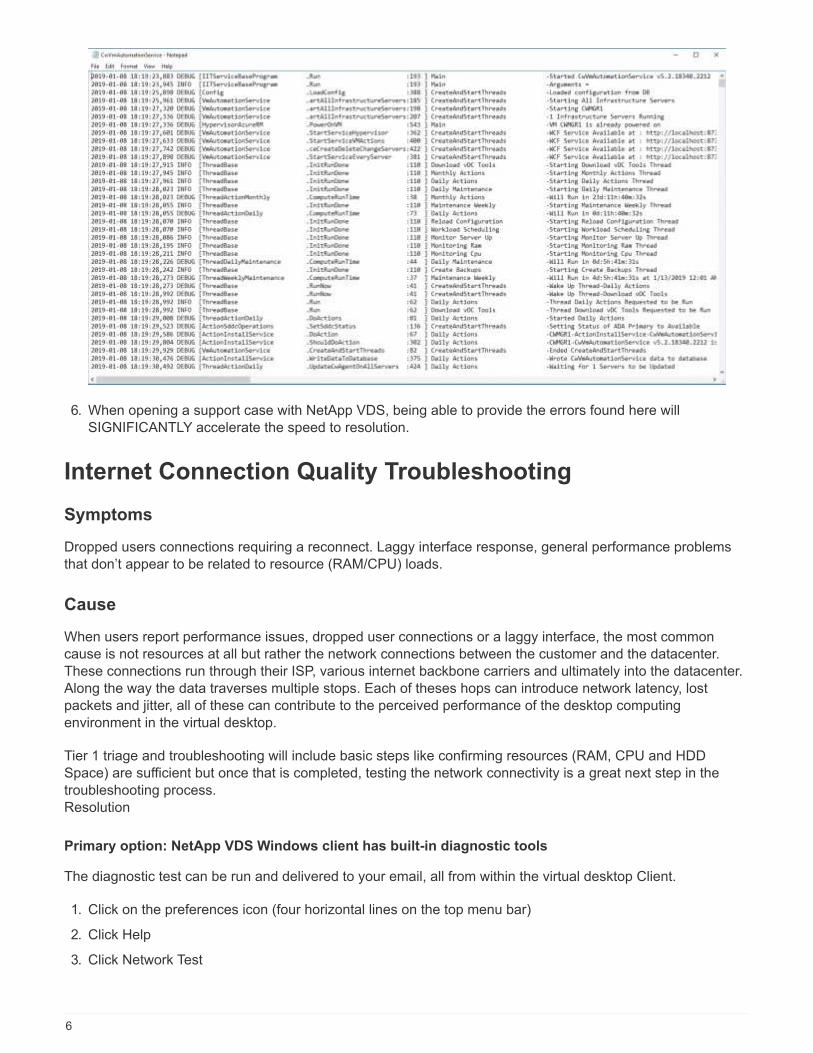
6. When opening a support case with NetApp VDS, being able to provide the errors found here will
SIGNIFICANTLY accelerate the speed to resolution.
Internet Connection Quality Troubleshooting
Symptoms
Dropped users connections requiring a reconnect. Laggy interface response, general performance problems
that don’t appear to be related to resource (RAM/CPU) loads.
Cause
When users report performance issues, dropped user connections or a laggy interface, the most common
cause is not resources at all but rather the network connections between the customer and the datacenter.
These connections run through their ISP, various internet backbone carriers and ultimately into the datacenter.
Along the way the data traverses multiple stops. Each of theses hops can introduce network latency, lost
packets and jitter, all of these can contribute to the perceived performance of the desktop computing
environment in the virtual desktop.
Tier 1 triage and troubleshooting will include basic steps like confirming resources (RAM, CPU and HDD
Space) are sufficient but once that is completed, testing the network connectivity is a great next step in the
troubleshooting process.
Resolution
Primary option: NetApp VDS Windows client has built-in diagnostic tools
The diagnostic test can be run and delivered to your email, all from within the virtual desktop Client.
1. Click on the preferences icon (four horizontal lines on the top menu bar)
2. Click Help
3. Click Network Test
6
4. Enter the user name experiencing the issues, click Run
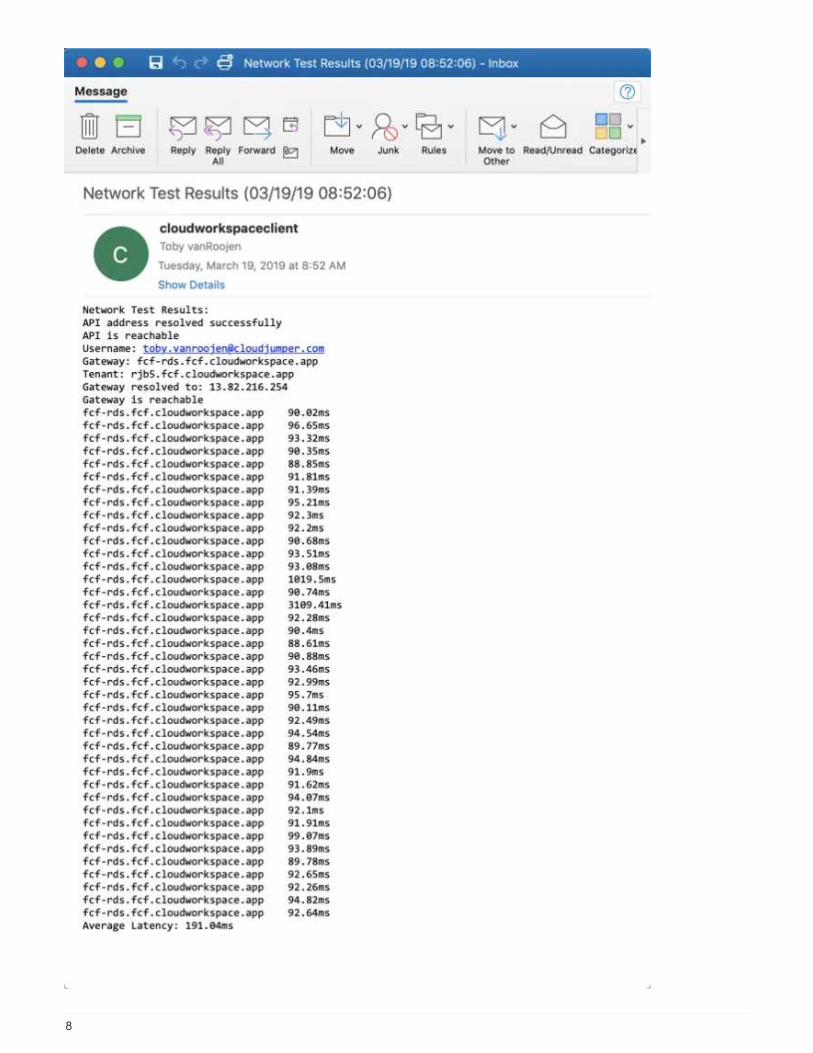
5. Once complete, enter your email address to receive an email report
6. Review the report to troubleshoot potential connection issues
7
8
Secondary option: Manual analysis using PingPlotter
To confirm the client’s network connection is the culprit you can run the free utility PingPlotter. This utility sends
a ping every few seconds and reports on the speed (latency) of the round trip of that ping. It also notes the
packet loss (PL) percentage at each hop along the route. When high latency and/or high packet loss is
observed it is a good indication that the performance issues are caused by the quality of the internet
connection at the hop that is displaying those issues.
1. Download and install Ping Plotter (Available for MacOS, Windows and iOS).
2. Enter the gateway of the data center in which the tenant is deployed.
3. Let it run for several minutes. Ideally while the performance issues or disconnections are being
experienced.
4. Capture the data by choosing “Save Image…” from the File Menu if it is needed for additional
troubleshooting.
Enable Desktop Wallpaper for User Sessions
Overview
By default remote sessions have Wallpaper display disabled to improve performance. The result is a black
wallpaper that users often wish to customize. This setting can be changed with a simple GPO edit
Instructions:
1. Login to a platform server (e.g. CWMGR1) using level3 .tech account
2. Open Group Policy Management Console
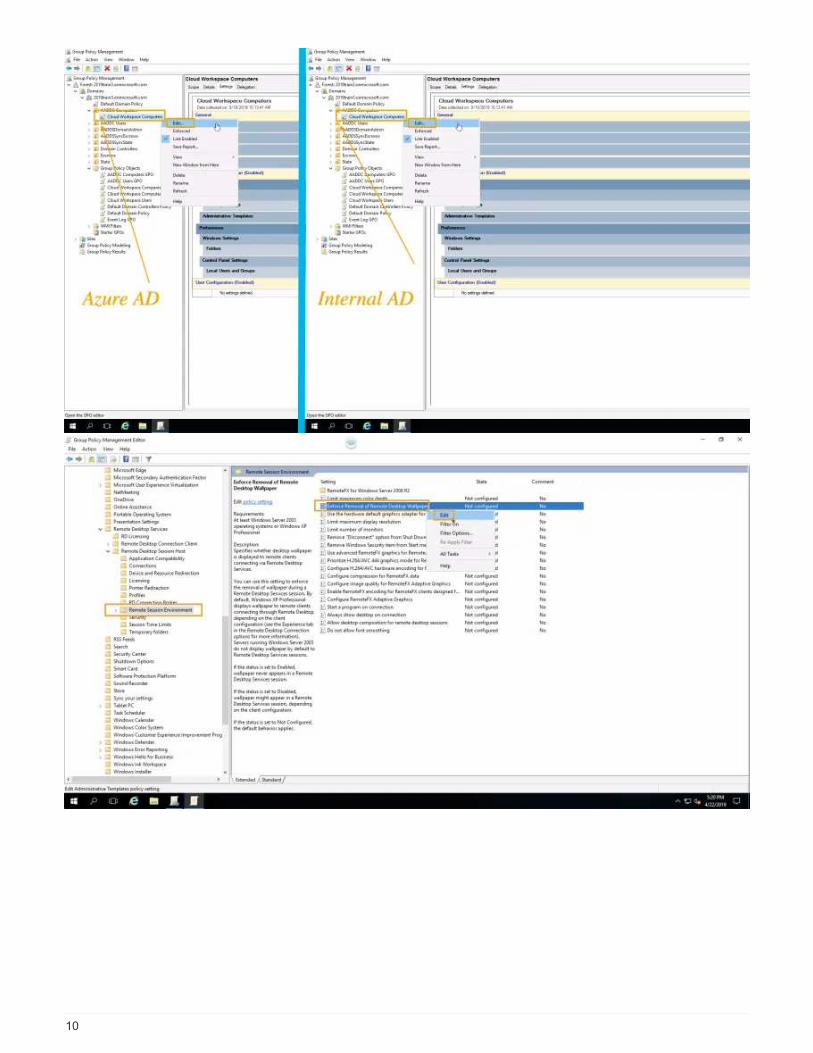
3. Locate the rdsh GPO (labeled as “company code” rdsh (e.g. “xyz1 rdsh”)) Right click “xyz1 rdsh” GPO,
choose edit
a. In Azure AD Domain Services the GPO is called “AADDC “Computers > Cloud Workspace Computers”
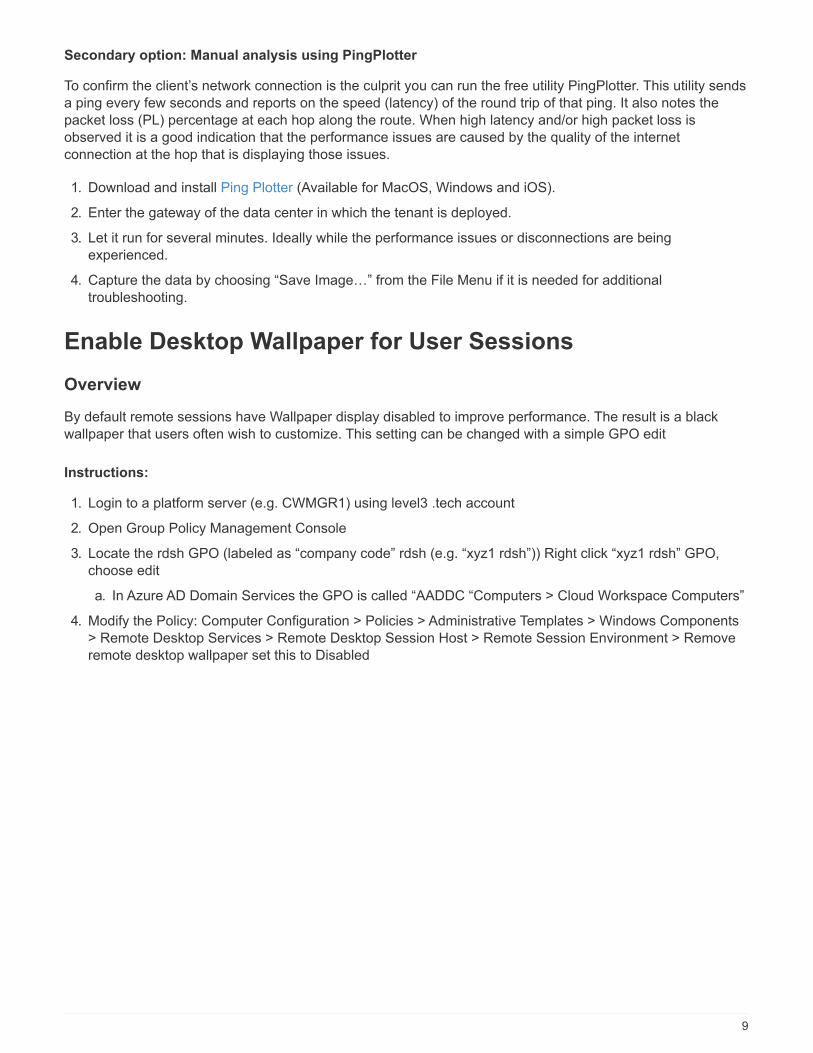
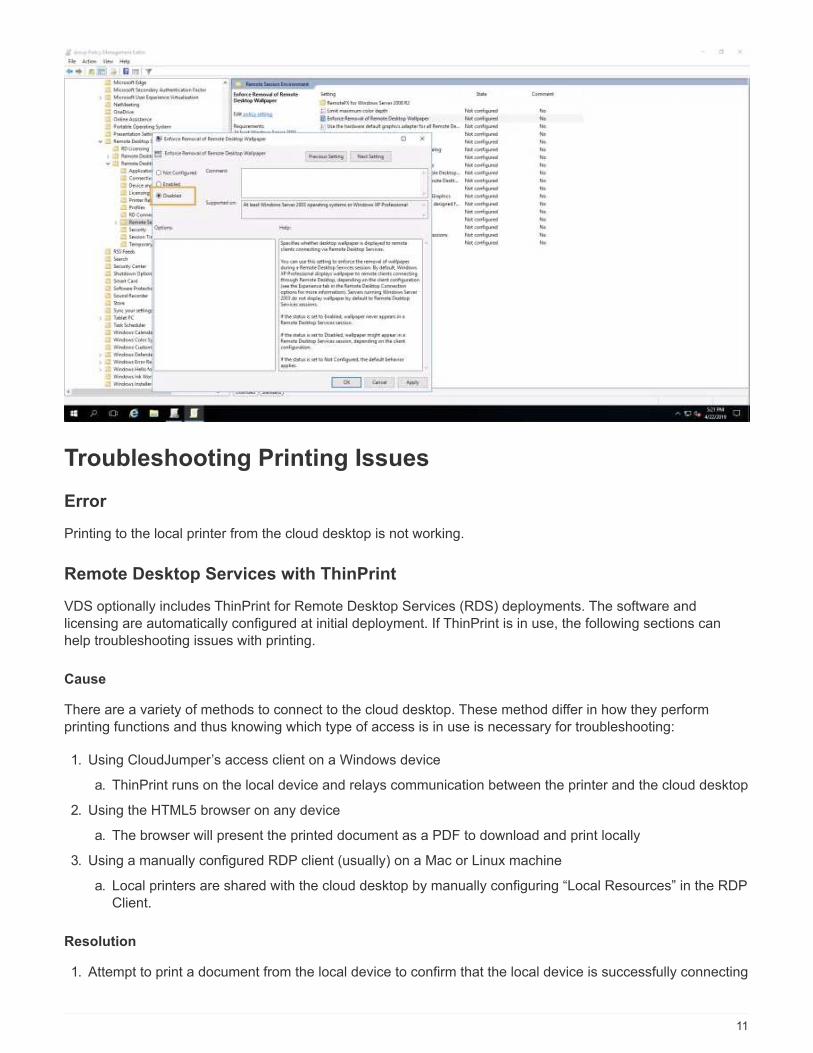
4. Modify the Policy: Computer Configuration > Policies > Administrative Templates > Windows Components
> Remote Desktop Services > Remote Desktop Session Host > Remote Session Environment > Remove
remote desktop wallpaper set this to Disabled
9
10
Troubleshooting Printing Issues
Error
Printing to the local printer from the cloud desktop is not working.
Remote Desktop Services with ThinPrint
VDS optionally includes ThinPrint for Remote Desktop Services (RDS) deployments. The software and
licensing are automatically configured at initial deployment. If ThinPrint is in use, the following sections can
help troubleshooting issues with printing.
Cause
There are a variety of methods to connect to the cloud desktop. These method differ in how they perform
printing functions and thus knowing which type of access is in use is necessary for troubleshooting:
1. Using CloudJumper’s access client on a Windows device
a. ThinPrint runs on the local device and relays communication between the printer and the cloud desktop
2. Using the HTML5 browser on any device
a. The browser will present the printed document as a PDF to download and print locally
3. Using a manually configured RDP client (usually) on a Mac or Linux machine
a. Local printers are shared with the cloud desktop by manually configuring “Local Resources” in the RDP
Client.
Resolution
1. Attempt to print a document from the local device to confirm that the local device is successfully connecting
11
to the printer.
2. Uninstall and re-install ThinPrint if using the Access Client on a Windows device. https://www.thinprint.com/
en/resources-support/software/clientsandtools/
3. Make a note of the access type and the results of the first two steps in a new case with CloudJumper
Support.
Azure Virtual Desktop
VDS does not implement any printing solution or unique printing configuration for AVD environments. Printing
questions should be directed to Microsoft or (if one was implemented) the printing technology vendor.
Azure vCPU Core Quota
View Current Quota
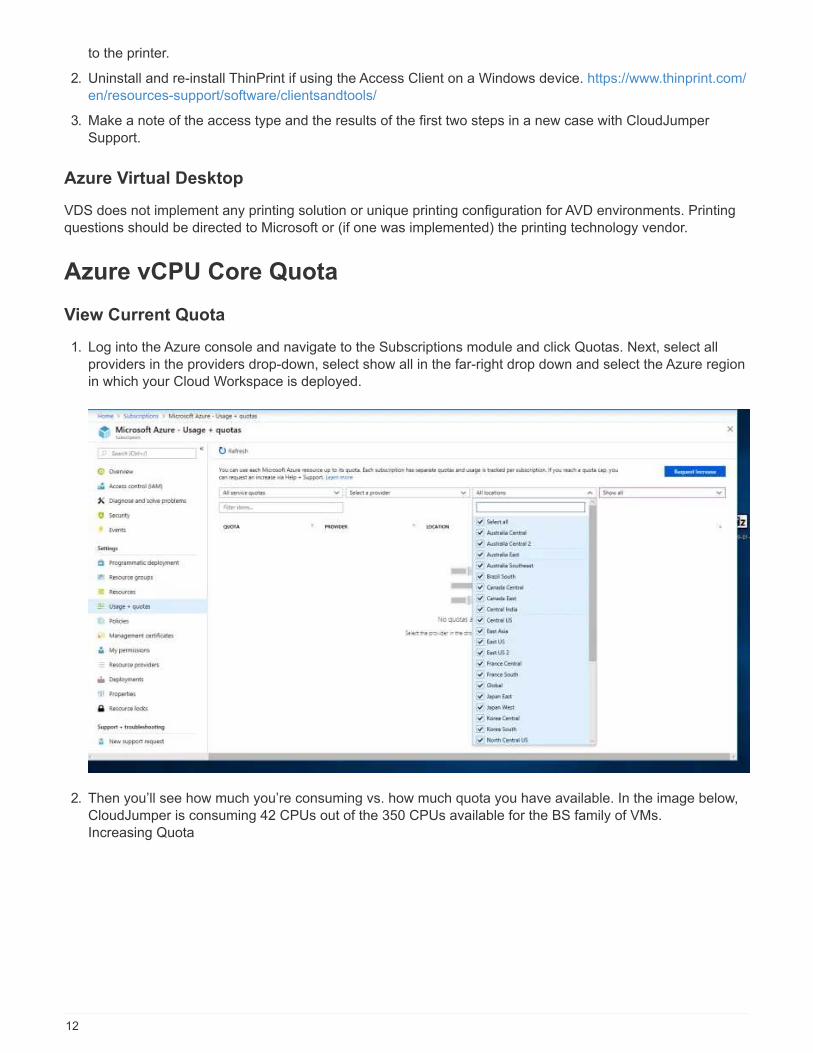
1. Log into the Azure console and navigate to the Subscriptions module and click Quotas. Next, select all
providers in the providers drop-down, select show all in the far-right drop down and select the Azure region
in which your Cloud Workspace is deployed.
2. Then you’ll see how much you’re consuming vs. how much quota you have available. In the image below,
CloudJumper is consuming 42 CPUs out of the 350 CPUs available for the BS family of VMs.
Increasing Quota
12
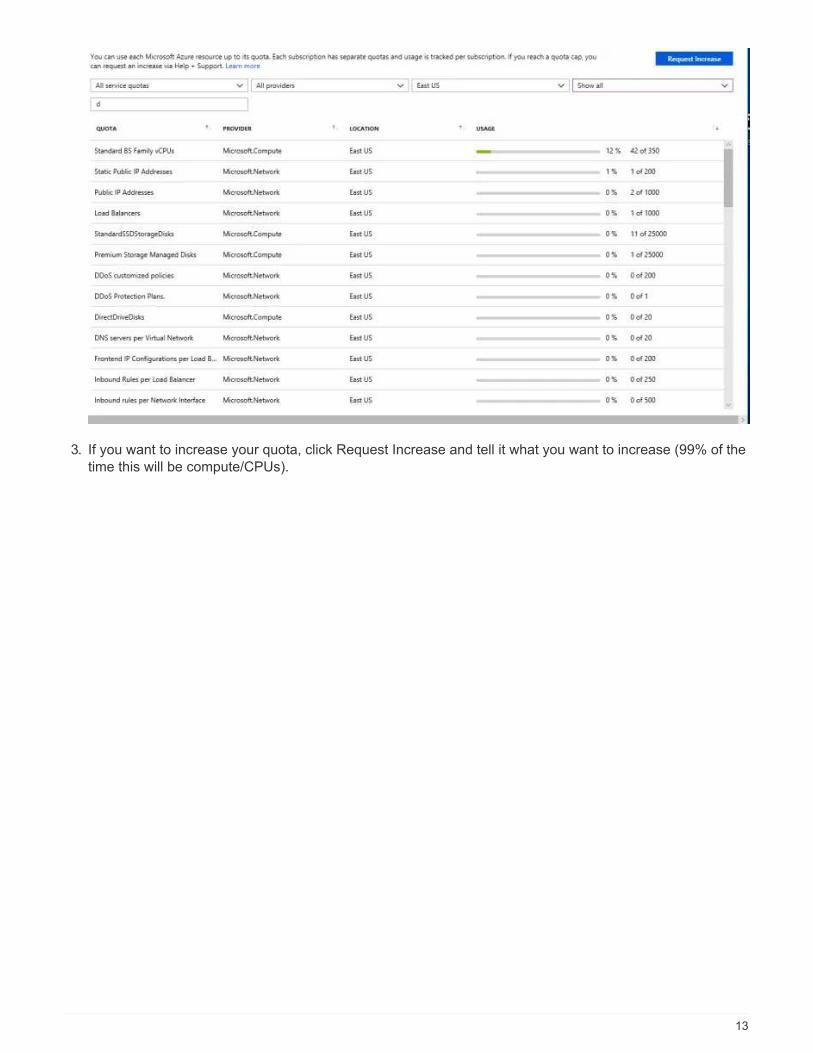
3. If you want to increase your quota, click Request Increase and tell it what you want to increase (99% of the
time this will be compute/CPUs).
13
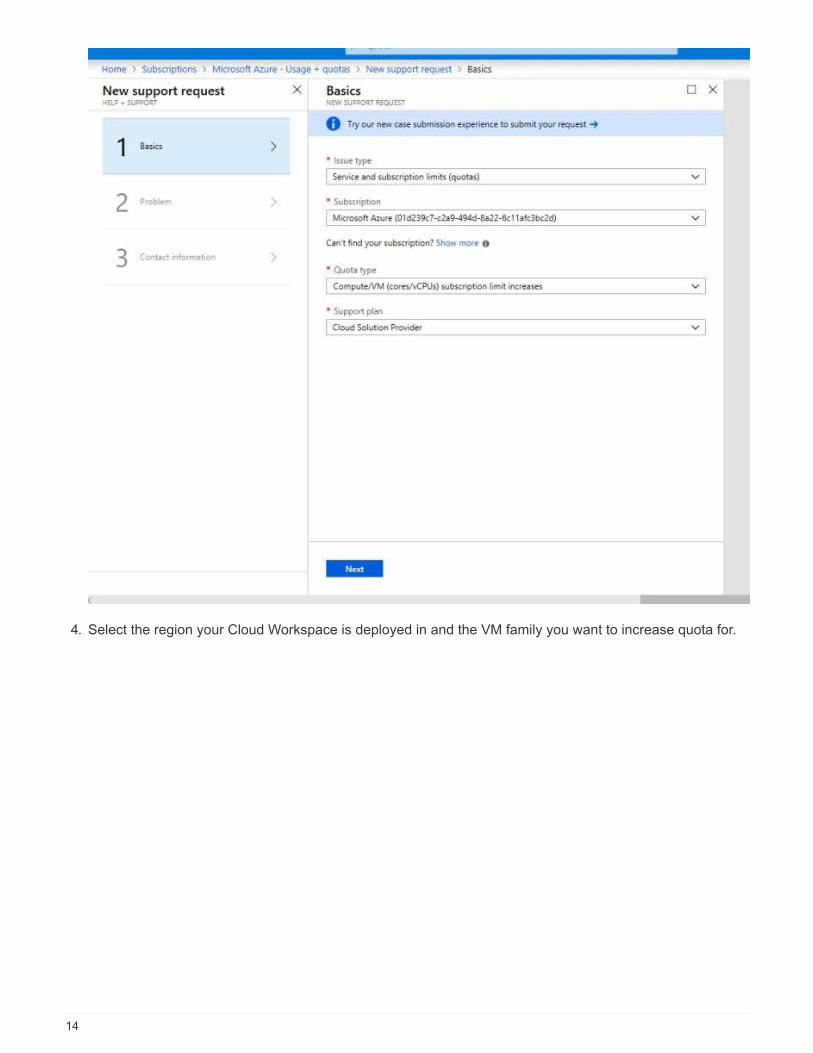
4. Select the region your Cloud Workspace is deployed in and the VM family you want to increase quota for.
14
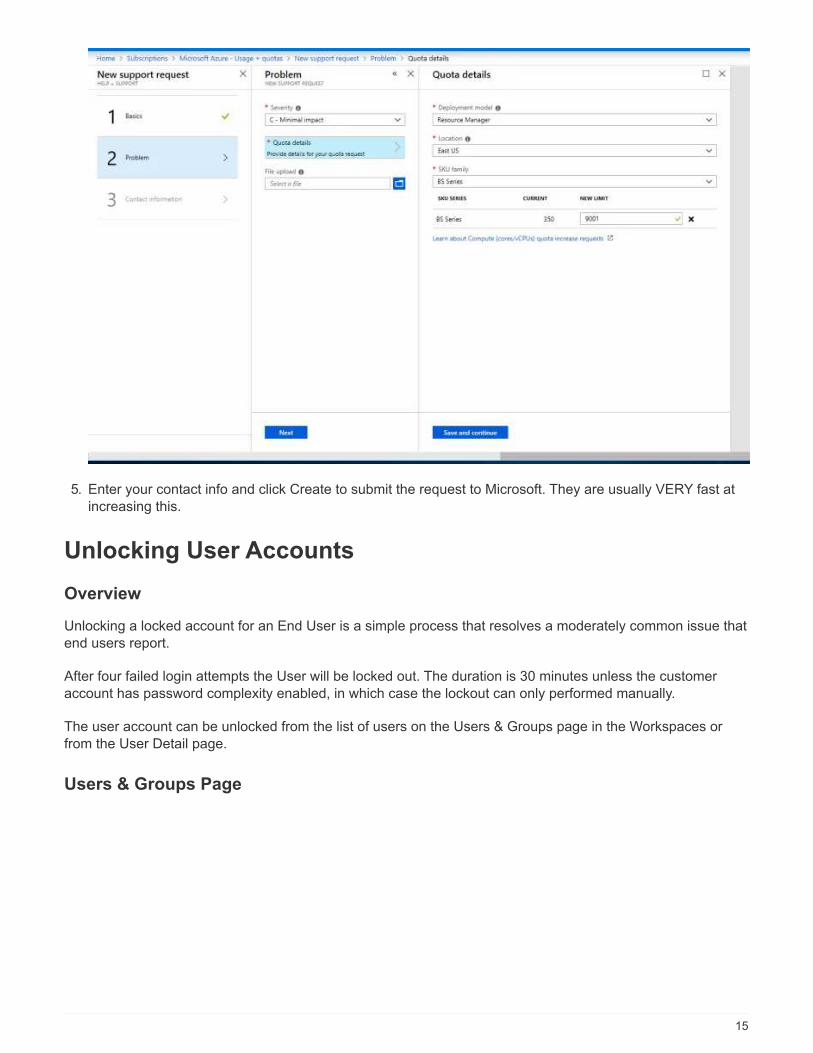
5. Enter your contact info and click Create to submit the request to Microsoft. They are usually VERY fast at
increasing this.
Unlocking User Accounts
Overview
Unlocking a locked account for an End User is a simple process that resolves a moderately common issue that
end users report.
After four failed login attempts the User will be locked out. The duration is 30 minutes unless the customer
account has password complexity enabled, in which case the lockout can only performed manually.
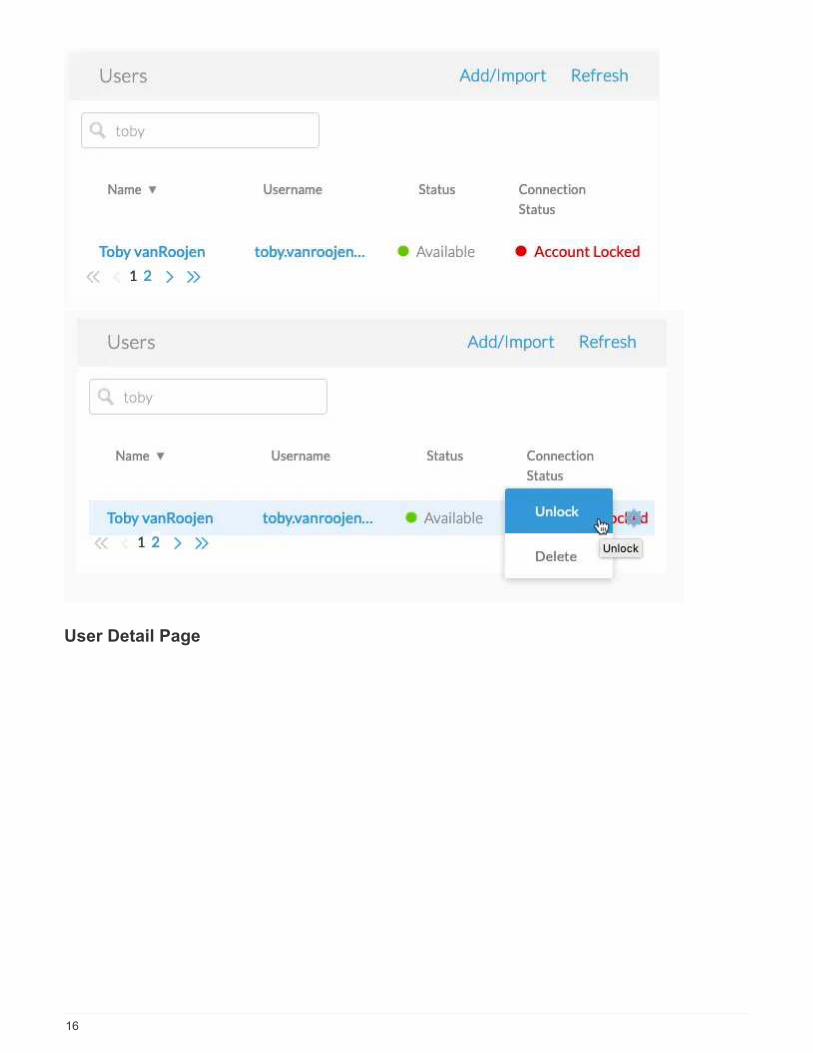
The user account can be unlocked from the list of users on the Users & Groups page in the Workspaces or
from the User Detail page.
Users & Groups Page
15
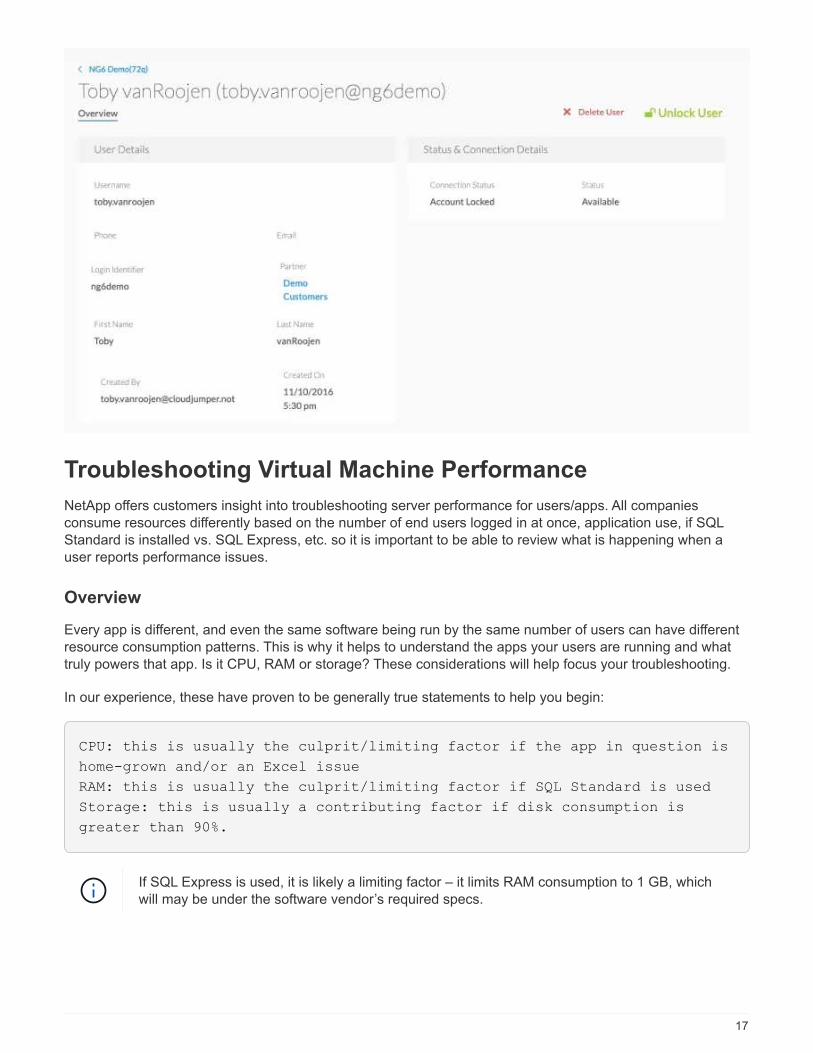
User Detail Page
16
Troubleshooting Virtual Machine Performance
NetApp offers customers insight into troubleshooting server performance for users/apps. All companies
consume resources differently based on the number of end users logged in at once, application use, if SQL
Standard is installed vs. SQL Express, etc. so it is important to be able to review what is happening when a
user reports performance issues.
Overview
Every app is different, and even the same software being run by the same number of users can have different
resource consumption patterns. This is why it helps to understand the apps your users are running and what
truly powers that app. Is it CPU, RAM or storage? These considerations will help focus your troubleshooting.
In our experience, these have proven to be generally true statements to help you begin:
CPU: this is usually the culprit/limiting factor if the app in question is
home-grown and/or an Excel issue
RAM: this is usually the culprit/limiting factor if SQL Standard is used
Storage: this is usually a contributing factor if disk consumption is
greater than 90%.
If SQL Express is used, it is likely a limiting factor – it limits RAM consumption to 1 GB, which
will may be under the software vendor’s required specs.
17
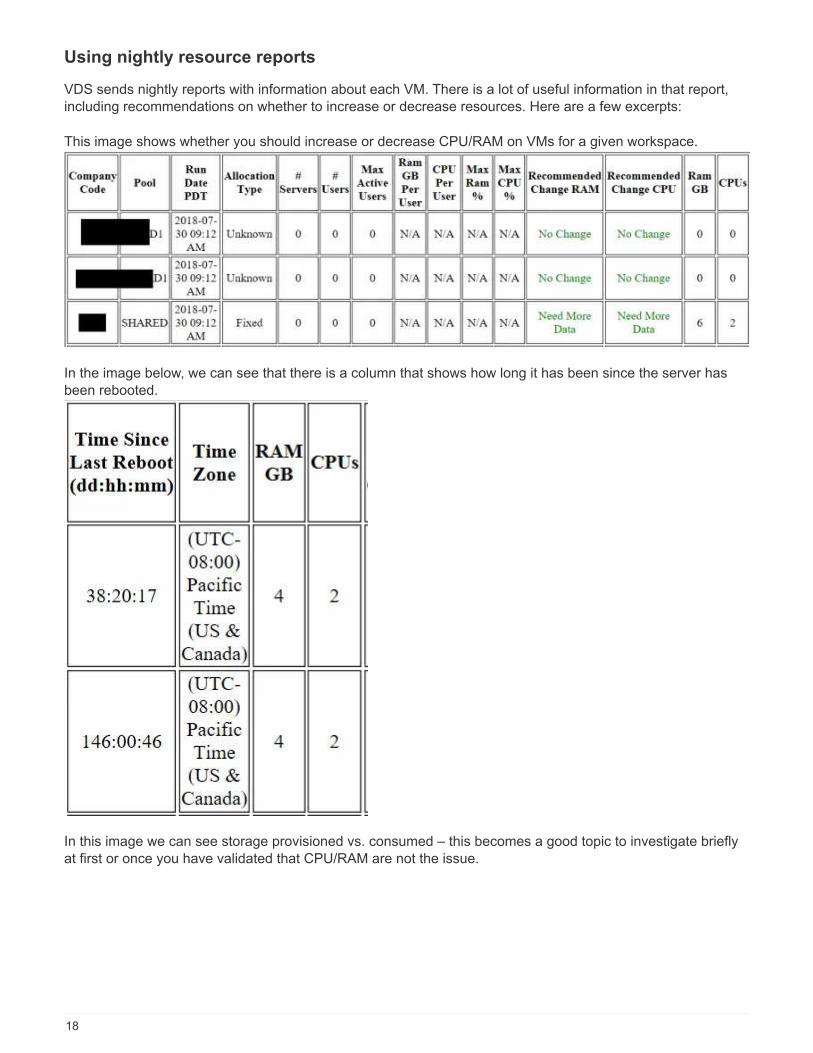
Using nightly resource reports
VDS sends nightly reports with information about each VM. There is a lot of useful information in that report,
including recommendations on whether to increase or decrease resources. Here are a few excerpts:
This image shows whether you should increase or decrease CPU/RAM on VMs for a given workspace.
In the image below, we can see that there is a column that shows how long it has been since the server has
been rebooted.
In this image we can see storage provisioned vs. consumed – this becomes a good topic to investigate briefly
at first or once you have validated that CPU/RAM are not the issue.
18
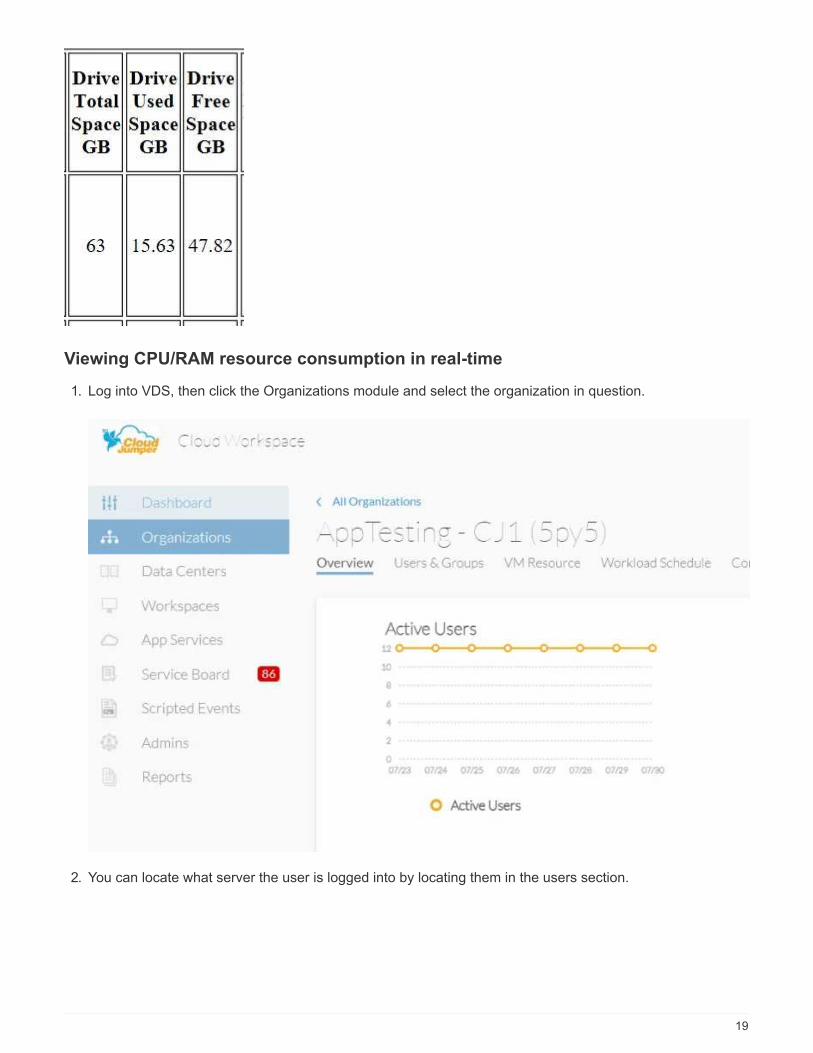
Viewing CPU/RAM resource consumption in real-time
1. Log into VDS, then click the Organizations module and select the organization in question.
2. You can locate what server the user is logged into by locating them in the users section.
19
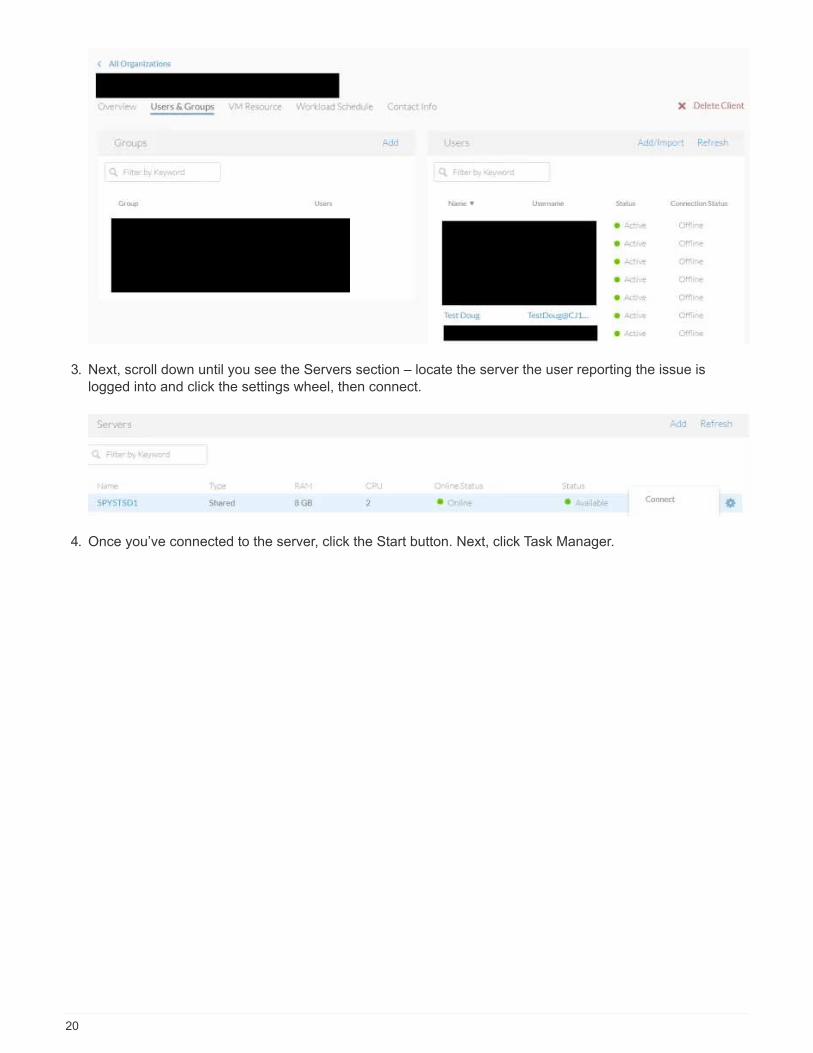
3. Next, scroll down until you see the Servers section – locate the server the user reporting the issue is
logged into and click the settings wheel, then connect.
4. Once you’ve connected to the server, click the Start button. Next, click Task Manager.
20
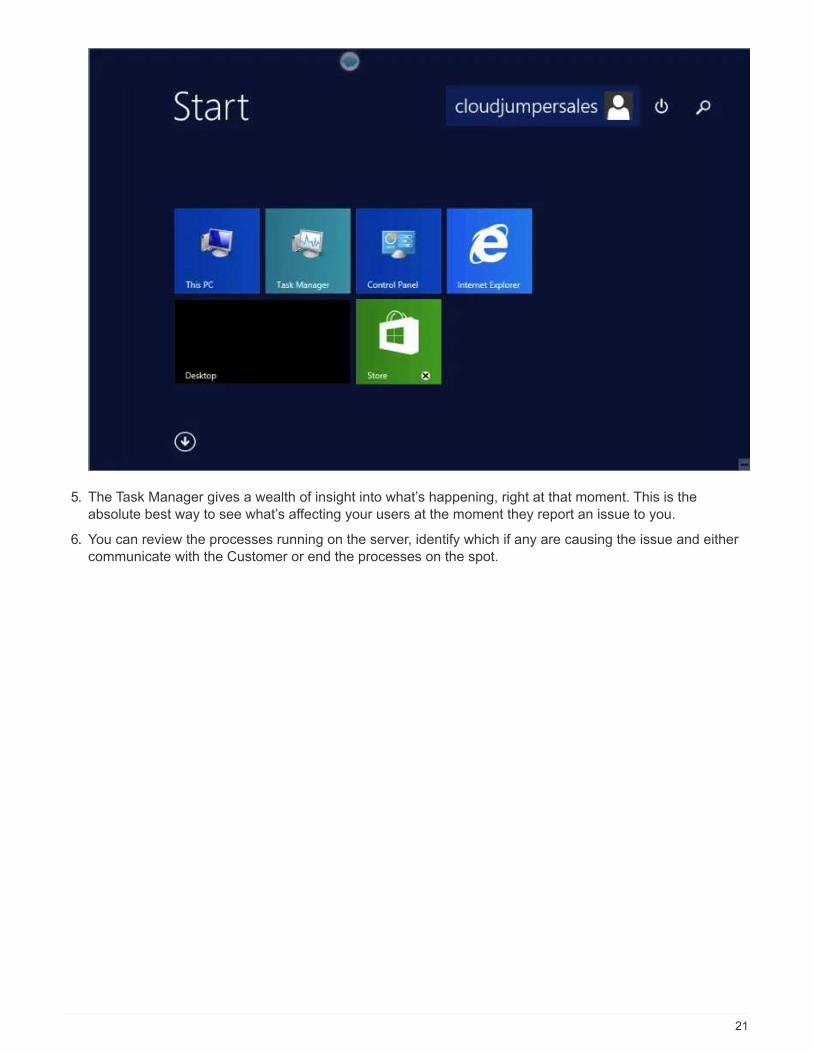
5. The Task Manager gives a wealth of insight into what’s happening, right at that moment. This is the
absolute best way to see what’s affecting your users at the moment they report an issue to you.
6. You can review the processes running on the server, identify which if any are causing the issue and either
communicate with the Customer or end the processes on the spot.
21
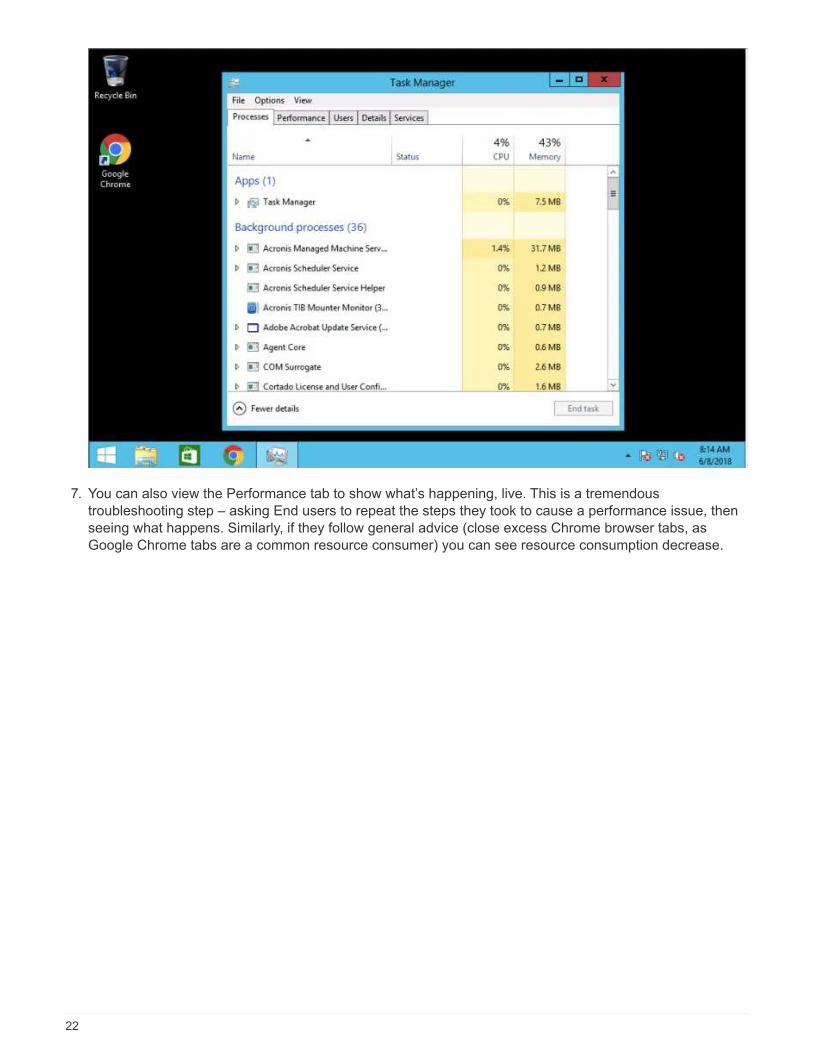
7. You can also view the Performance tab to show what’s happening, live. This is a tremendous
troubleshooting step – asking End users to repeat the steps they took to cause a performance issue, then
seeing what happens. Similarly, if they follow general advice (close excess Chrome browser tabs, as
Google Chrome tabs are a common resource consumer) you can see resource consumption decrease.
22
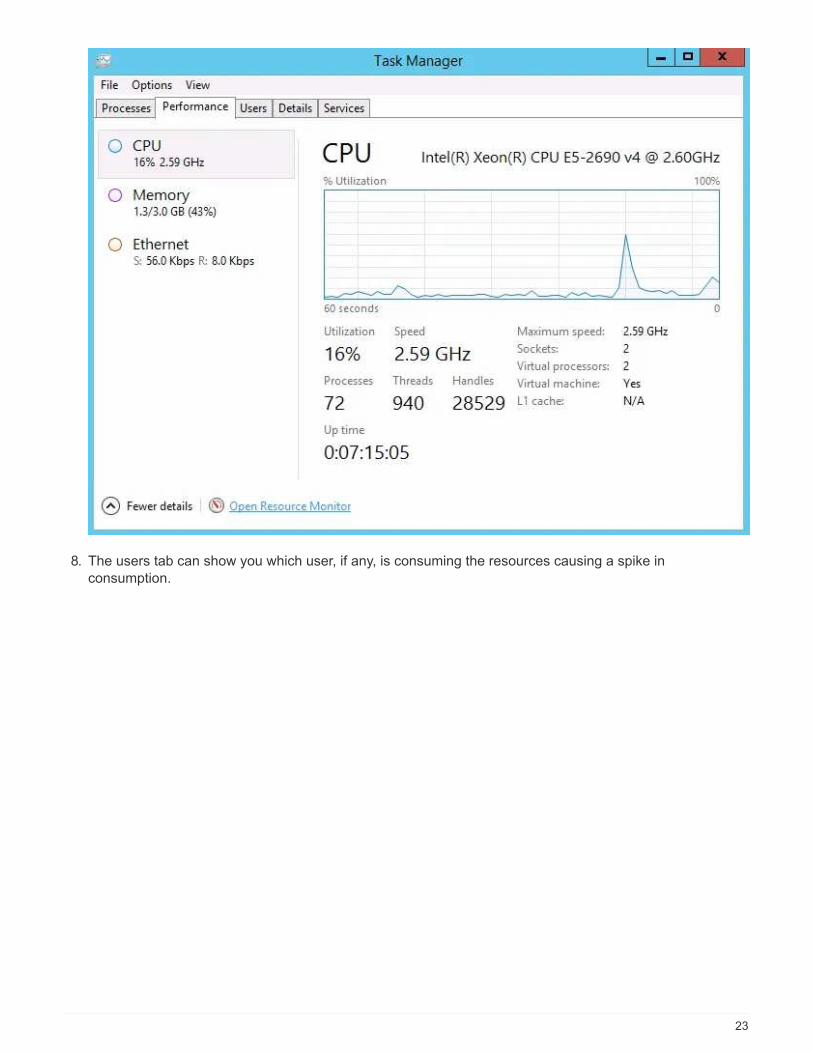
8. The users tab can show you which user, if any, is consuming the resources causing a spike in
consumption.
23
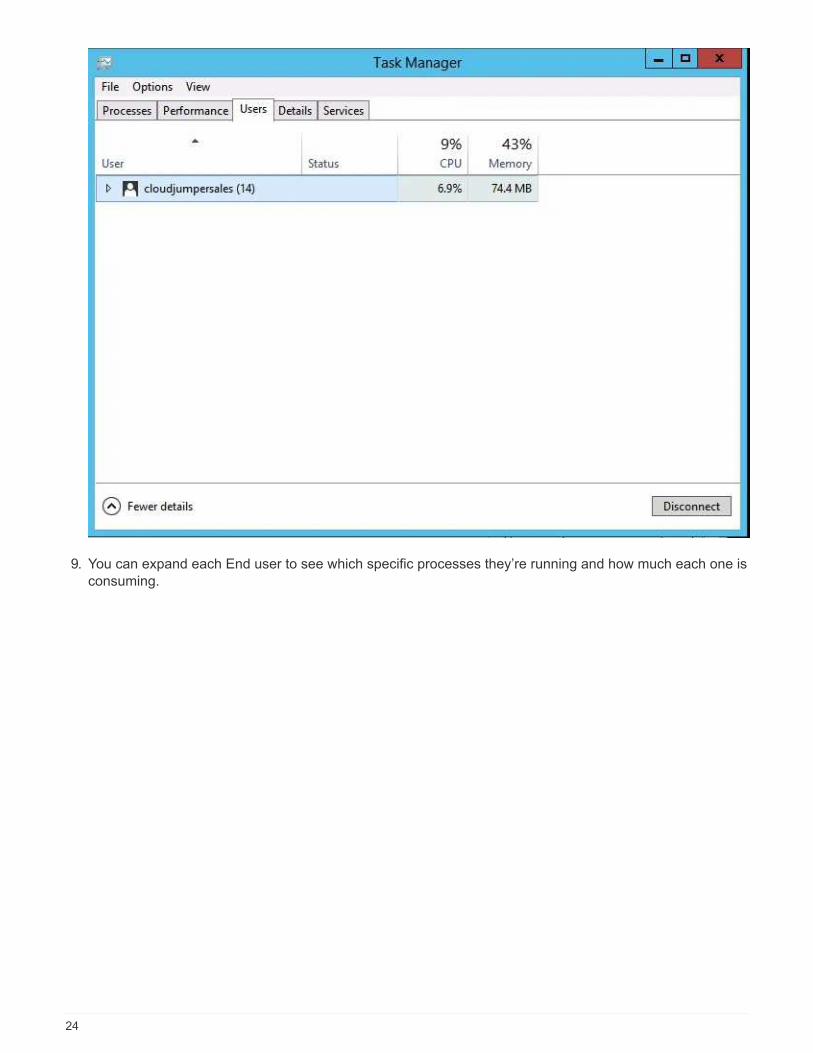
9. You can expand each End user to see which specific processes they’re running and how much each one is
consuming.
24
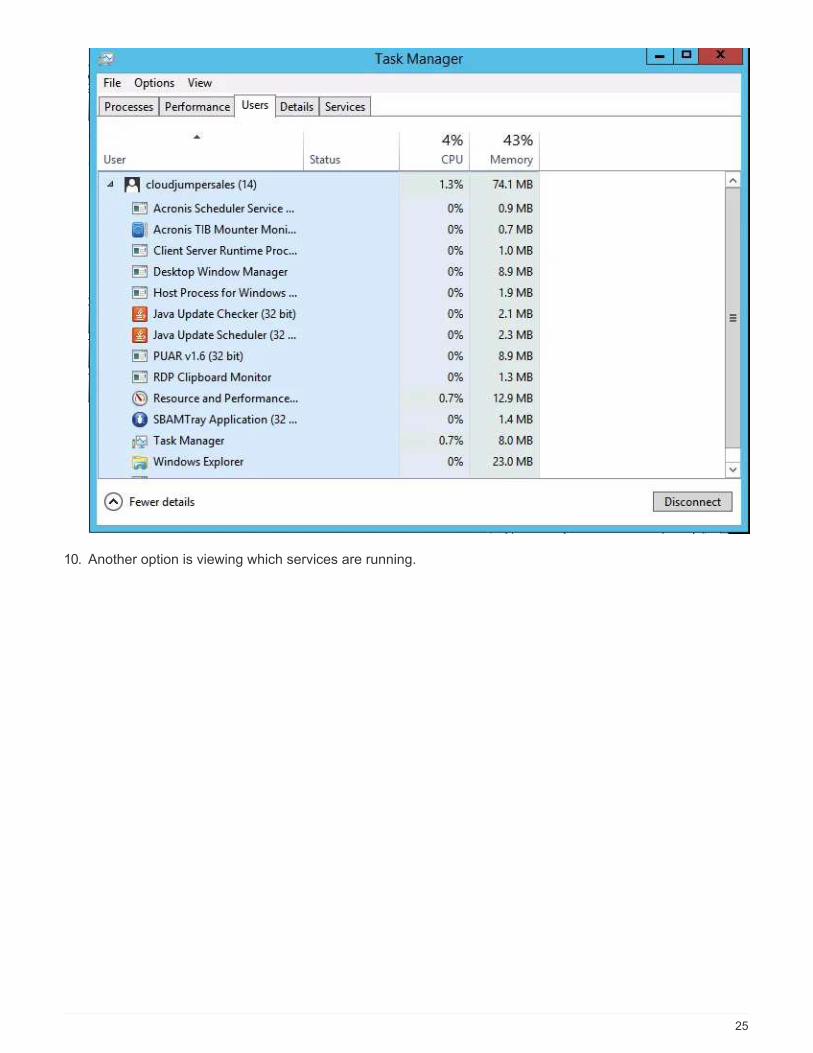
10. Another option is viewing which services are running.
25
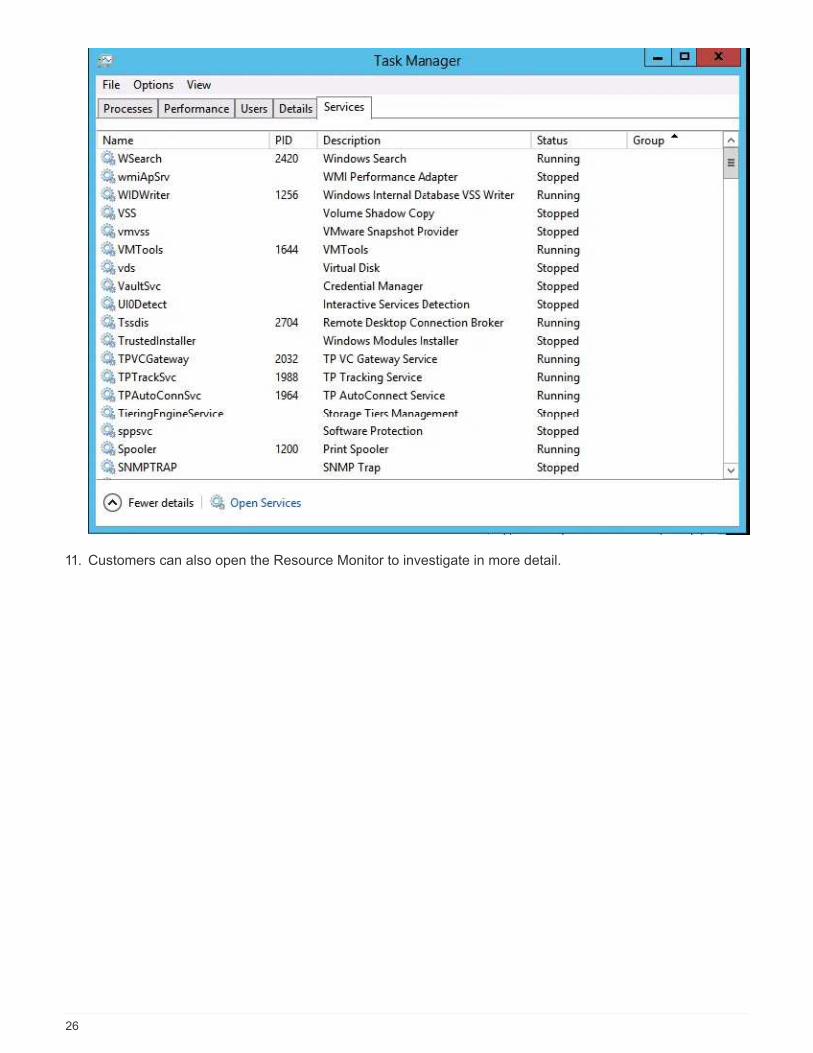
11. Customers can also open the Resource Monitor to investigate in more detail.
26
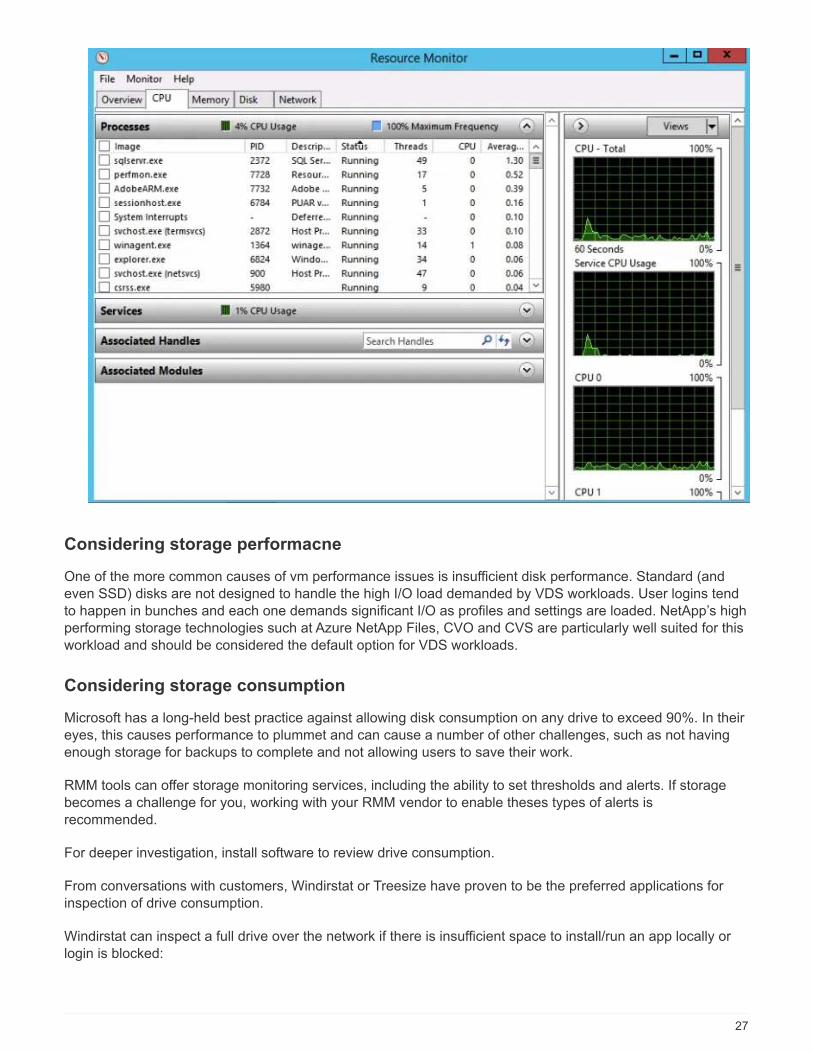
Considering storage performacne
One of the more common causes of vm performance issues is insufficient disk performance. Standard (and
even SSD) disks are not designed to handle the high I/O load demanded by VDS workloads. User logins tend
to happen in bunches and each one demands significant I/O as profiles and settings are loaded. NetApp’s high
performing storage technologies such at Azure NetApp Files, CVO and CVS are particularly well suited for this
workload and should be considered the default option for VDS workloads.
Considering storage consumption
Microsoft has a long-held best practice against allowing disk consumption on any drive to exceed 90%. In their
eyes, this causes performance to plummet and can cause a number of other challenges, such as not having
enough storage for backups to complete and not allowing users to save their work.
RMM tools can offer storage monitoring services, including the ability to set thresholds and alerts. If storage
becomes a challenge for you, working with your RMM vendor to enable theses types of alerts is
recommended.
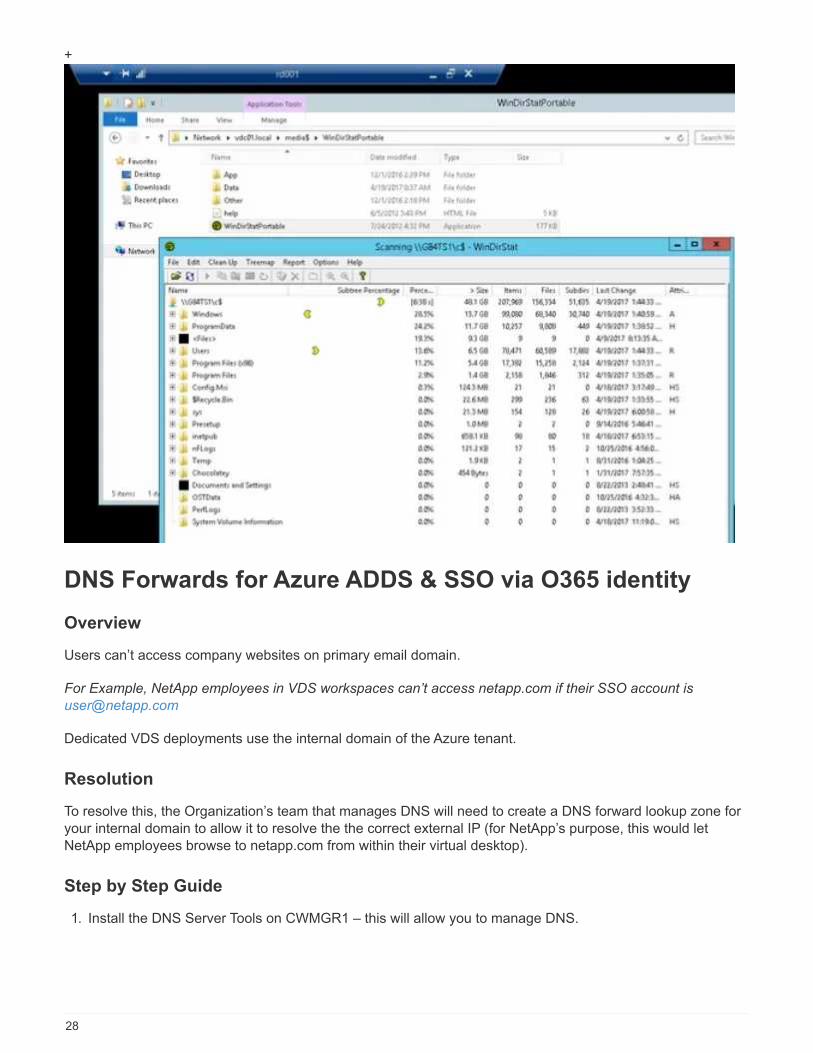
For deeper investigation, install software to review drive consumption.
From conversations with customers, Windirstat or Treesize have proven to be the preferred applications for
inspection of drive consumption.
Windirstat can inspect a full drive over the network if there is insufficient space to install/run an app locally or
login is blocked:
27
+
DNS Forwards for Azure ADDS & SSO via O365 identity
Overview
Users can’t access company websites on primary email domain.
For Example, NetApp employees in VDS workspaces can’t access netapp.com if their SSO account is
Dedicated VDS deployments use the internal domain of the Azure tenant.
Resolution
To resolve this, the Organization’s team that manages DNS will need to create a DNS forward lookup zone for
your internal domain to allow it to resolve the the correct external IP (for NetApp’s purpose, this would let
NetApp employees browse to netapp.com from within their virtual desktop).
Step by Step Guide
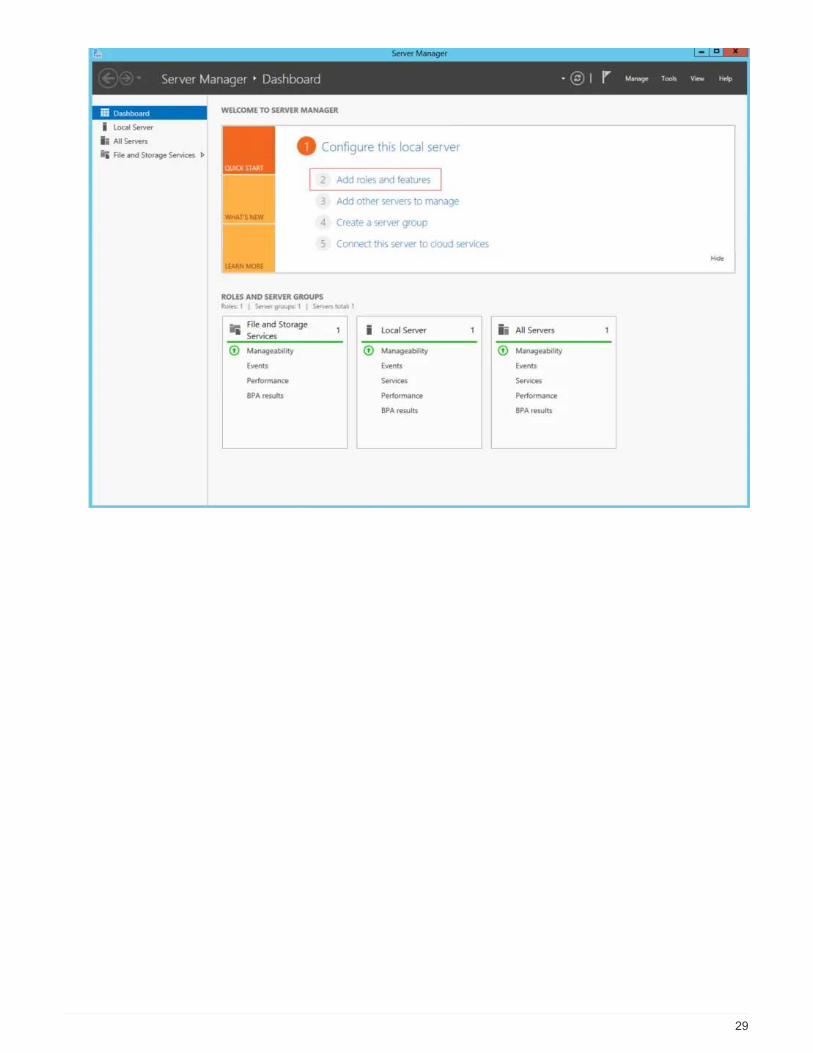
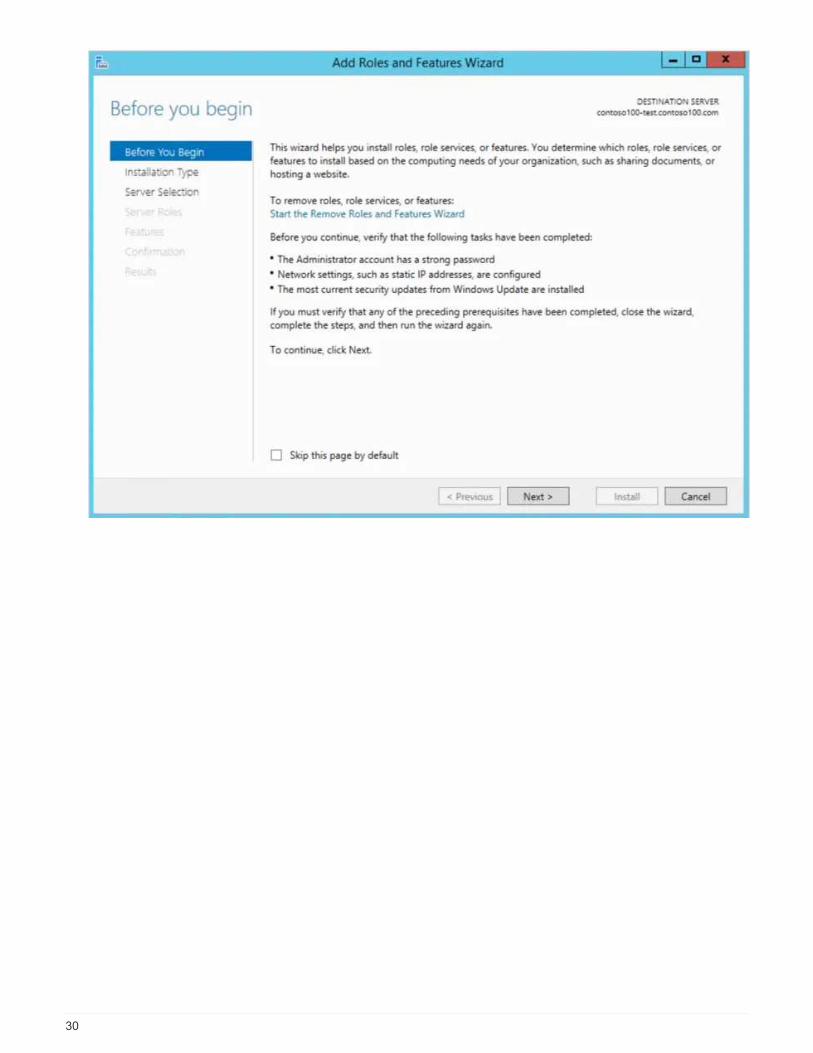
1. Install the DNS Server Tools on CWMGR1 – this will allow you to manage DNS.
28
29
30
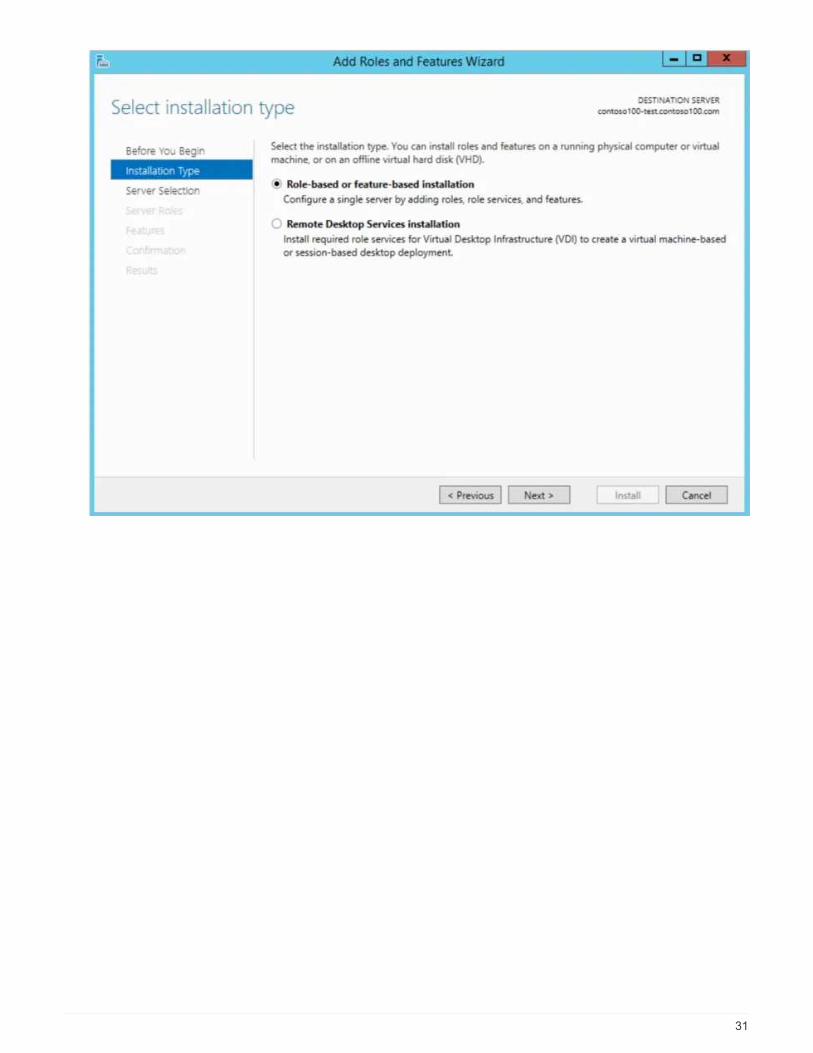
31
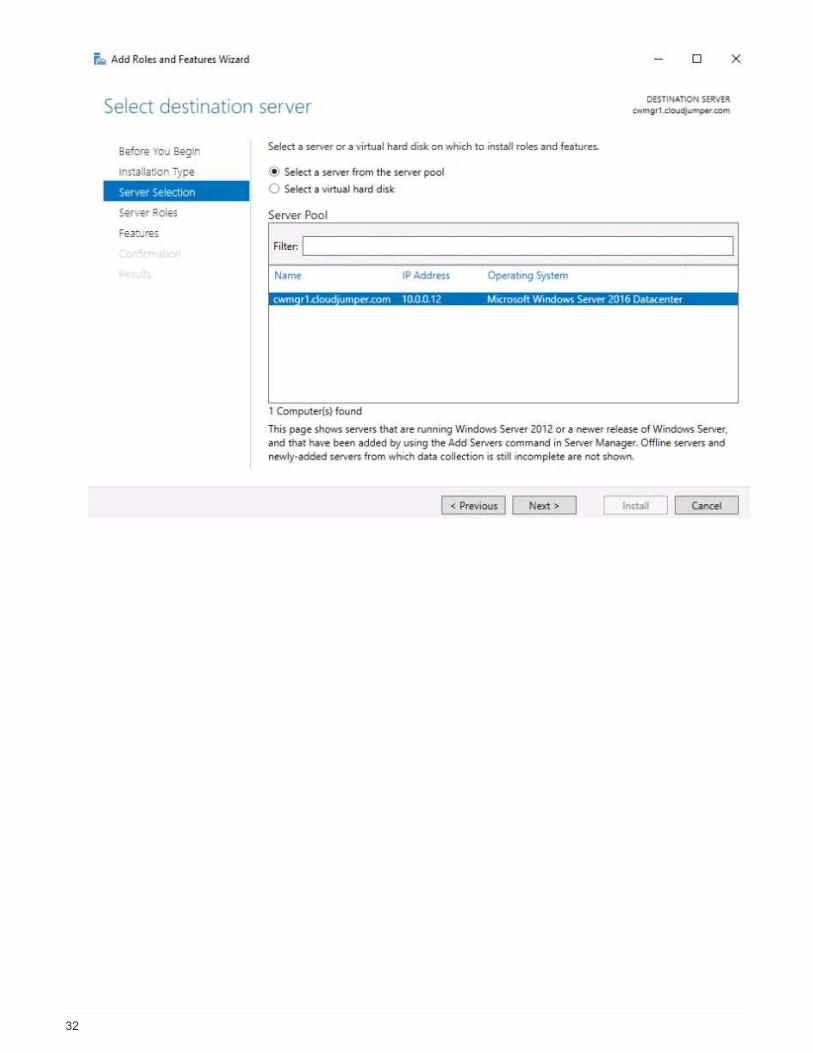
32
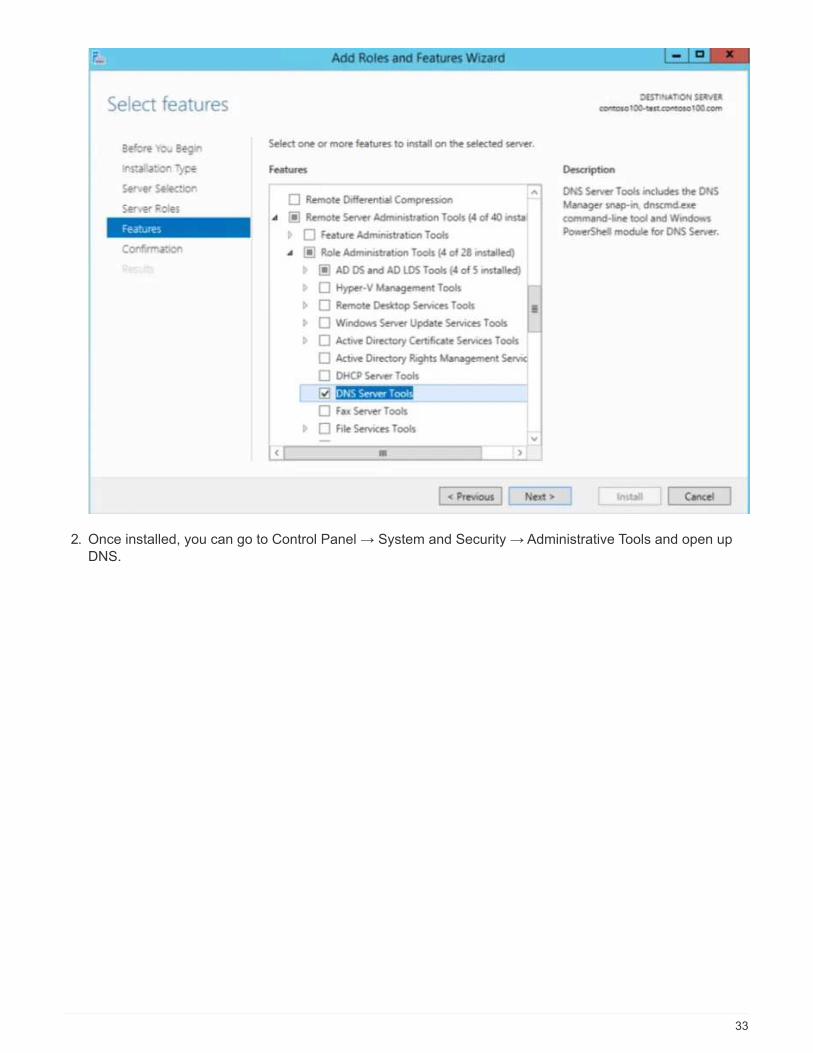
2. Once installed, you can go to Control Panel → System and Security → Administrative Tools and open up
DNS.
33

3. When asked for the DNS server running DNS you will want to put in your domain name (in the example
we’ve been using, this would be netapp.com).
Troubleshooting Application Issues
Overview
Troubleshooting an application error is a common administrative practice that doesn’t involve VDS itself, but is
greatly assisted by VDS and the level of control it provides administrators. While NetApp VDS does not
troubleshoot these issues for Customers, our experience allows us to advice administrators after identifying
some basic information like the following in order to dig deeper and troubleshoot with end users and/or third
parties.
• Name of the user experiencing the issue
• Name of the application the user was working with
• The server the user’s session was on
• Steps to reproduce the issue
Reviewing Your Tools
34
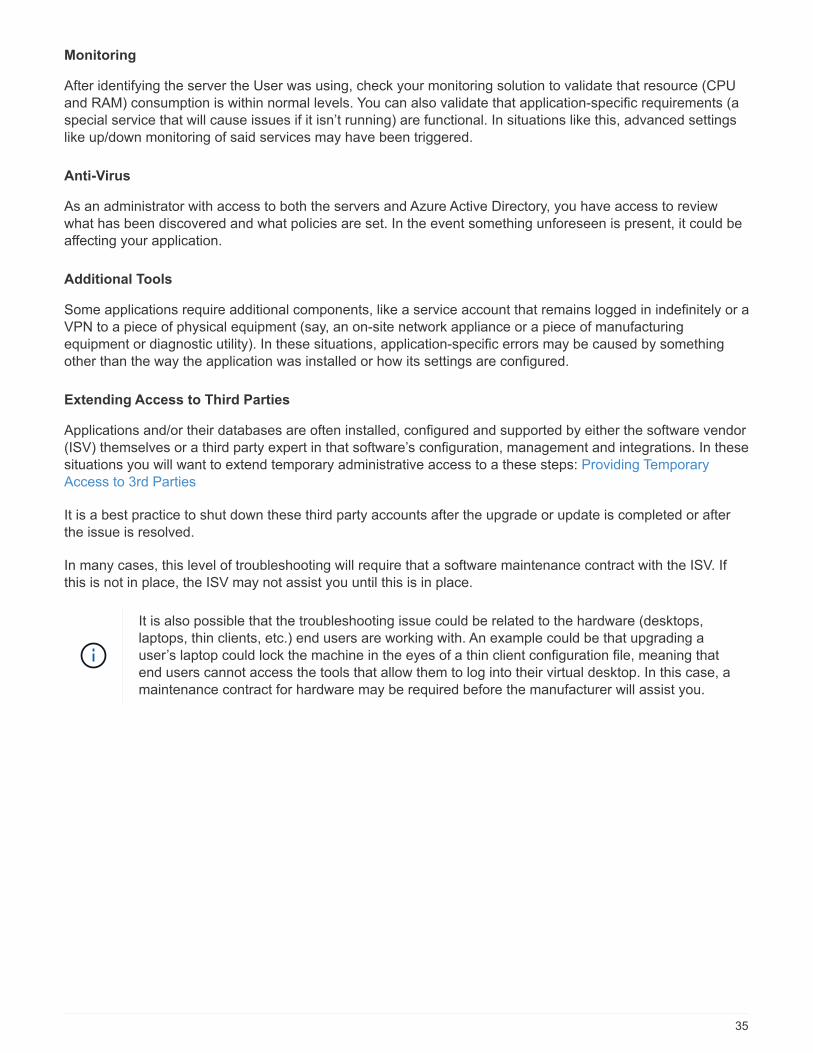
Monitoring
After identifying the server the User was using, check your monitoring solution to validate that resource (CPU
and RAM) consumption is within normal levels. You can also validate that application-specific requirements (a
special service that will cause issues if it isn’t running) are functional. In situations like this, advanced settings
like up/down monitoring of said services may have been triggered.
Anti-Virus
As an administrator with access to both the servers and Azure Active Directory, you have access to review
what has been discovered and what policies are set. In the event something unforeseen is present, it could be
affecting your application.
Additional Tools
Some applications require additional components, like a service account that remains logged in indefinitely or a
VPN to a piece of physical equipment (say, an on-site network appliance or a piece of manufacturing
equipment or diagnostic utility). In these situations, application-specific errors may be caused by something
other than the way the application was installed or how its settings are configured.
Extending Access to Third Parties
Applications and/or their databases are often installed, configured and supported by either the software vendor
(ISV) themselves or a third party expert in that software’s configuration, management and integrations. In these
situations you will want to extend temporary administrative access to a these steps: Providing Temporary
Access to 3rd Parties
It is a best practice to shut down these third party accounts after the upgrade or update is completed or after
the issue is resolved.
In many cases, this level of troubleshooting will require that a software maintenance contract with the ISV. If
this is not in place, the ISV may not assist you until this is in place.
It is also possible that the troubleshooting issue could be related to the hardware (desktops,
laptops, thin clients, etc.) end users are working with. An example could be that upgrading a
user’s laptop could lock the machine in the eyes of a thin client configuration file, meaning that
end users cannot access the tools that allow them to log into their virtual desktop. In this case, a
maintenance contract for hardware may be required before the manufacturer will assist you.
35
Copyright Information
Copyright © 2022 NetApp, Inc. All rights reserved. Printed in the U.S. No part of this document
covered by copyright may be reproduced in any form or by any means-graphic, electronic, or
mechanical, including photocopying, recording, taping, or storage in an electronic retrieval system-
without prior written permission of the copyright owner.
Software derived from copyrighted NetApp material is subject to the following license and disclaimer:
THIS SOFTWARE IS PROVIDED BY NETAPP “AS IS” AND WITHOUT ANY EXPRESS OR IMPLIED
WARRANTIES, INCLUDING, BUT NOT LIMITED TO, THE IMPLIED WARRANTIES OF
MERCHANTABILITY AND FITNESS FOR A PARTICULAR PURPOSE, WHICH ARE HEREBY
DISCLAIMED. IN NO EVENT SHALL NETAPP BE LIABLE FOR ANY DIRECT, INDIRECT,
INCIDENTAL, SPECIAL, EXEMPLARY, OR CONSEQUENTIAL DAMAGES (INCLUDING, BUT NOT
LIMITED TO, PROCUREMENT OF SUBSTITUTE GOODS OR SERVICES; LOSS OF USE, DATA, OR
PROFITS; OR BUSINESS INTERRUPTION) HOWEVER CAUSED AND ON ANY THEORY OF
LIABILITY, WHETHER IN CONTRACT, STRICT LIABILITY, OR TORT (INCLUDING NEGLIGENCE OR
OTHERWISE) ARISING IN ANY WAY OUT OF THE USE OF THIS SOFTWARE, EVEN IF ADVISED OF
THE POSSIBILITY OF SUCH DAMAGE.
NetApp reserves the right to change any products described herein at any time, and without notice.
NetApp assumes no responsibility or liability arising from the use of products described herein,
except as expressly agreed to in writing by NetApp. The use or purchase of this product does not
convey a license under any patent rights, trademark rights, or any other intellectual property
rights of NetApp.
The product described in this manual may be protected by one or more U.S. patents,
foreign patents, or pending applications.
RESTRICTED RIGHTS LEGEND: Use, duplication, or disclosure by the government is subject to
restrictions as set forth in subparagraph (c)(1)(ii) of the Rights in Technical Data and
Computer Software clause at DFARS 252.277-7103 (October 1988) and FAR 52-227-19 (June 1987).
Trademark Information
NETAPP, the NETAPP logo, and the marks listed at http://www.netapp.com/TM are trademarks of
NetApp, Inc. Other company and product names may be trademarks of their respective owners.
36
![[MS-RDPECLIP]: Remote Desktop Protocol: Clipboard … · Remote Desktop Protocol: Clipboard Virtual Channel ... Remote Desktop Protocol: Clipboard Virtual ... Remote Desktop Protocol:](https://img.pdfslide.net/doc/110x75/5ae3205b7f8b9a097a8dc1a3/ms-rdpeclip-remote-desktop-protocol-clipboard-desktop-protocol-clipboard.jpg)