Embed Size (px)
Citation preview
1
NOT FOR DISTRIBUTION TO UNITED STATES NEWSWIRE SERVICES OR FOR DISSEMINATION IN THE
UNITED STATES PRESS RELEASE 28 February 2011
TROY HALF YEAR ENDED DECEMBER 31, 2010 FINANCIAL RESULTS PERTH, Western Australia: Troy Resources NL (“Troy”) (ASX, TSX: TRY) HIGHLIGHTS
Troy announced a profit of A$6.05m for the first half of FY2011, this compares to a loss of A$5.5m in the corresponding period last year.
Gold production for the half was 28,316 ounces compared to 34,182 ounces in the corresponding period last year.
Revenues from ordinary activities up 30% to A$38.8m. Exploration expenditure of A$2.5m during the half-year period was fully expensed. During the half the Company poured first gold at its Casposo gold project. The mine
has completed commissioning but still ramping up to full production. Subsequent to the half year end Troy signed an Amending Agreement with Investec
Bank (Australia) Limited to increase its debt facility by A$10m to A$35m. The funds are primarily targeted at funding the Casposo project through the ramp up in production.
Troy Resources NL (“Troy”) today announced a profit of A$6.05m for the half year ended December 31, 2010. This result compares to a loss of A$5.5m in the previous corresponding period. Gold production for the half year was 28,316 ounces compared to 34,182 ounces in the corresponding period last year. Sales for the period were 28,322 ounces (2009: 25,490) generating total revenue of A$38.8m (2009: A$29.8m). The result was achieved after allowing A$2.5m for exploration expenditure (2009: A$3.7m) and A$9.3m for amortisation and depreciation (2009: A$6.6m). It is important to note that Troy has an aggressive exploration program aimed at increasing Reserves and Resources and nearly all of this exploration expenditure is expensed. The Casposo gold and silver project is continuing to ramp up production and we expect to steadily increase throughput. Currently, the areas that restrict higher and continuous treatment rates are the filtering operations in the tailings (waste) filtering unit and the Merrill Crowe precious metals recovery unit. The flowsheet for the Casposo plant is different and more complex than most gold operations because it produces dry tailings after running the waste stream over two large vacuum belt filters.
TROY RESOURCES NLABN 33 006 243 750
All Correspondence to: REGISTERED OFFICE
Ground Floor 44 Ord Street
West Perth 6005 Western Australia
Telephone: (61 8) 9481 1277 Facsimile: (61 8) 9321 8237 Email: [email protected]
Web Site: www.troyres.com.au
2
The decision to use dry tailings was made in the pre-feasibility trade-off studies completed in 2007, before Troy acquired the project, which concluded dry tailings disposal was the most appropriate for the project due to the high level of seismic activity in the Argentinean Andes. Permitting for the plant was obtained on the basis of using dry tailings. The Casposo ore bodies have typical levels of clay for this style of low sulphidation epithermal mineralisation. To date we have seen that although the clay content is not particularly high, variability in the types and amount of clay restricts flow rates through the tailing filters. This eventually requires the remainder of the plant to be shut down while the excess stocks are processed. The type of clays encountered has necessitated a change of flocculent being used and resulted in a more difficult process to achieve the desired clarity in the feed for the Merrill Crowe section. We have clearly identified plans to remedy these restrictions to enable us to run the facility at budgeted levels. In the short term we will be using higher aperture filter cloth, antiscalant to assist in cleaning the filters and reassigning duties across already installed filtering capacity. We will make a number of modifications to the filters in the Merrill Crowe section to better handle variations in feed rate and liquor quality. Although these changes will not require significant capital expenditure, they will take time to complete and optimise. We are also looking to acquire additional tailings filter capacity. We now expect to reach full production in the June quarter. Mining at Casposo has continued to focus on the high grade Kamila pit. During initial commissioning we treated lower grade material. Now that commissioning is complete and we are focused on optimising the plant performance, we will start to process higher grade (plus 8g/t Au_eq) ore. Commenting on the results Troy CEO Paul Benson said; “Obviously it is pleasing for the Company to return to profitability. The result has been driven by a strong performance at Andorinhas in Brazil, in addition to the profitable sale of the stake in Volta Resources and the initial payment received for the iron ore transaction at Andorinhas. “Ramp up at Casposo has been slower than planned. We do however have a good understanding of what changes need to be made and have plans in place to move forward with the modifications as quickly as possible and are confident we will be achieving budget throughput rates in the June quarter. “The Board reconfirms its intention to pay a dividend to shareholders once Casposo reaches budget levels”. ENDS For further information please contact: Paul Benson Annette Ellis / Warrick Hazeldine Chief Executive Officer Media Relations Troy Resources NL Purple Communications T: (61 8) 9481 1277 T: (61 8) 6314 6300 E: [email protected] E: [email protected] Geological information in this Report has been compiled by Troy’s Vice President Exploration & Business Development, Peter Doyle, who:
Is a full time employee of Troy Resources NL Has sufficient experience which is relevant to the type of deposit under consideration and to the activity which he is undertaking to
qualify as a Competent Person as defined in the 2004 Edition of the ‘Australasian Code for Reporting of Exploration Results, Mineral Resources and Ore Reserves’
Is a Fellow of the Australasian Institute of Mining and Metallurgy Has consented in writing to the inclusion of this data

3
Information of a scientific or technical nature in this report was prepared under the supervision of Peter J. Doyle, Vice President Exploration and Business Development of Troy, a “qualified person” under National Instrument 43-101 – “Standards of Disclosure for Mineral Projects”, a member of the Australasian Institute of Mining and Metallurgy. Mr. Doyle has sufficient experience, which is relevant to the style of mineralisation and type of deposit under consideration, and to the activity he is undertaking, to qualify as a “competent person” as defined in the 2004 edition of the “Australasian Code for Reporting of Exploration Results, Mineral Resources and Ore Reserves”. Mr. Doyle has reviewed and approved the information contained in this report. For further information regarding the Company’s projects in Brazil, Australia and Argentina, including a description of Troy’s quality assurance program, quality control measures, the geology, samples collection and testing procedures in respect of the Sandstone project please refer to the technical reports filed which is available under the Company’s profile at sedar.com or on the Company’s website. This report contains forward-looking statements. These forward-looking statements reflect management’s current beliefs based on information currently available to management and are based on what management believes to be reasonable assumptions. A number of factors could cause actual results, performance, or achievements to differ materially from the results expressed or implied in the forward looking statements. Such factors include, among others, future prices of gold, the actual results of current production, development and/or exploration activities, changes in project parameters as plans continue to be refined, variations in ore grade or recovery rates, plant and/or equipment failure, delays in obtaining governmental approvals or in the commencement of operations. For purposes of Clause 3.4(e) in Canadian Instrument 43-101, the Company warrants that Mineral Resources which are not Mineral Reserves do not have demonstrated economic viability.
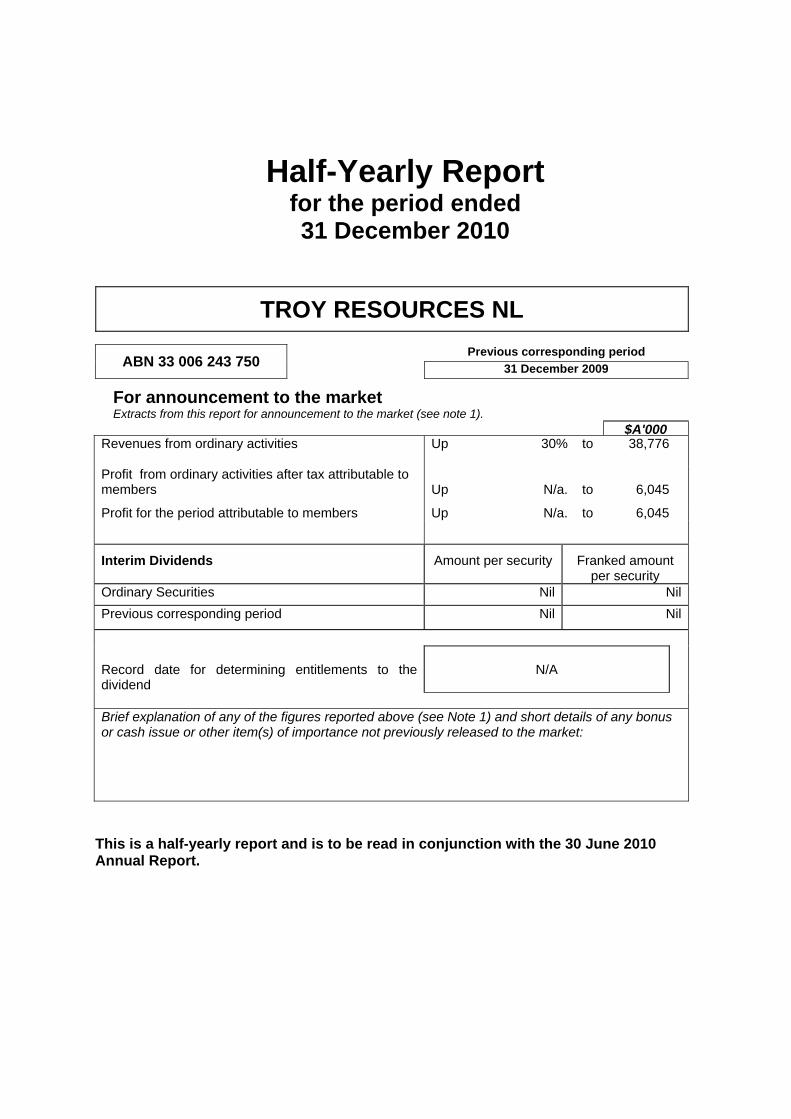
Half-Yearly Report for the period ended 31 December 2010
TROY RESOURCES NL
ABN 33 006 243 750 Previous corresponding period
31 December 2009
For announcement to the market Extracts from this report for announcement to the market (see note 1).
$A'000Revenues from ordinary activities
Up 30% to 38,776
Profit from ordinary activities after tax attributable to members
Up
N/a.
to
6,045
Profit for the period attributable to members Up N/a. to 6,045
Interim Dividends Amount per security Franked amount per security
Ordinary Securities Nil Nil
Previous corresponding period Nil Nil
Record date for determining entitlements to the dividend
N/A
Brief explanation of any of the figures reported above (see Note 1) and short details of any bonus or cash issue or other item(s) of importance not previously released to the market:
This is a half-yearly report and is to be read in conjunction with the 30 June 2010 Annual Report.
Troy Resources NL Financial Report for the
Half Year ended 31 December 2010
1
TROY RESOURCES NL
ABN 33 006 243 750
CONSOLIDATED FINANCIAL REPORT
FOR THE HALF YEAR ENDED
31 DECEMBER 2010
Troy Resources NL Financial Report for the
Half Year ended 31 December 2010
2
TROY RESOURCES NL DIRECTORS' REPORT
The Directors of Troy Resources NL submit herewith the financial report for the half-year ended 31 December 2010. In order to comply with the provisions of the Corporations Act 2001, the Directors report as follows: DIRECTORS The names of the Directors of the Company during and since the end of the half-year are: Mr D R Dix, Non-Executive Director & Chairman (appointed as Chairman, 25 November 2010) Mr P Benson, Chief Executive Officer and Managing Director (reappointed as Managing
Director, 13 September 2010) Mr K K Nilsson, Executive Director Operations Mr G R Chambers, Non-Executive Director Mr J A S Dow, Non-Executive Director (Chairman up until 25 November 2010) Mr F S Grimwade, Non-Executive Director (elected, 25 November 2010) Mr J L C Jones, Non-Executive Director Mr C R W Parish, Non-Executive Director REVIEW OF OPERATIONS (a) Production and Sales
Total gold production for the half-year was 28,316 ounces (2009: 34,182 ounces). This production was made up of 5,321 ounces (2009: 17,055 ounces) from the Sandstone gold operation in Western Australia and 22,995 ounces (2009: 17,127 ounces) from the company’s gold operation at Andorinhas in Brazil. Production ceased at the Sandstone operation during September 2010, and the site has now moved into a care and maintenance phase. Gold production from the Andorinhas operation in Brazil improved by approximately thirty four percent (34%) compared with the corresponding half year. The increase in gold production was due to both an increase in the underground ore grade and an increase in the mining and processing of underground ore during the half year, as opposed to processing of low grade stockpiles. The Casposo Gold and Silver project in San Juan Argentina continued in the development and production commissioning phase during the half year including the first pour of gold and silver dore. No commercial production had been forwarded to the refinery as at 31 December 2010.
Gold sales for the period were 28,322 ounces (2009: 25,490 ounces) on a consolidated basis giving total revenue of $38,776,000 (2009: $29,803,000). At the end of the previous corresponding half year to 31 December 2009, 6,399 ounces of gold were retained at the refinery in Brazil and then sold during January 2010.
(b) Results
The consolidated profit from ordinary activities before tax and minority interests for the December half-year was $6,477,000 (2009: loss $5,797,000). The net profit after tax was $6,037,000 (2009: loss $5,491,000).
Troy Resources NL Financial Report for the
Half Year ended 31 December 2010
3
DIRECTORS' REPORT Continued Gold sales totalled $38,776,000, up 30% from $29,803,000 reported in the corresponding half year. The profit (2009: loss) reported included:
i. $4,207,000 (pre-tax) profit from the sale of the company’s equity stake in Volta Resources Inc. (2009: $3,092,000 from sale of Alchemy Resources Limited shares);
ii. $1,018,000 (pre-tax) income, from an initial license payment as part of Troy’s iron ore royalty agreement in Brazil (2009: $Nil);
iii. expensing exploration expenditure of $2,512,000 (2009: $3,704,000); and iv. amortisation and depreciation of $9,249,000 (2009: $5,715,000).
Earnings per share on a fully diluted basis were 6.85 cents profit, compared with (6.93) cents loss in 2009. As at 31 December 2010, total shareholders’ equity was $108,014,000 representing a decrease in comparison with $129,186,000 as at 30 June 2010. This was principally driven by foreign exchange revaluation of Troy’s South American assets.
During the half year to 31 December 2010 the Australian dollar strengthened against the Brazilian Real by 10.6% and the Argentinean Peso by 19.9% along with 19.6% against the US dollar. This impacted the carrying value of the Troy’s South American Mineral Resources and Plant and Equipment translated from Brazilian Reals and Argentinean Pesos. At Casposo where the project is still commissioning; mining, processing and on costs for the month of December have been capitalised in inventories totalling $3,241,000 as at 31 December 2010.
(c) Investec Debt Facilities
At December 31 Troy had a debt facility with Investec Bank (Australia) Limited, totalling A$25.0m. The facility has a three-year term and the first 25% is repayable by 30 September 2011. As part of the facility the Troy group is required to maintain a minimum available cash balance of A$5.0m. As at 31 December 2010 Troy has fully drawn down all A$25.0m of this facility. During January 2011 Investec signed an Amending Agreement to the debt facility increasing the facility by A$10.0m to A$35.0m in total with the same key terms. As at 31 January 2011 these additional funds were available for draw.
(d) Dividends
No interim dividend has been declared, nor any final dividend for the 2009/10 financial year declared or paid.
(e) Exploration
During the half-year $2,512,000 (2009: $3,704,000) was spent on exploration all of which was expensed. During the half year to date $250,000 was related to Troy’s Sandstone tenements in Australian which is stated net of the Western Areas Nickel Joint Venture Share, $562,000 related to Brazil and $1,700,000 to Argentina.
(f)
(g)
INDE The a ROU The Ein accRepo SigneAct 2
Mr DChair28 Fe
Subsequ For detai18 of this
Addition Additionaweb site report forGovernan
EPENDENC
auditor’s inde
UNDING OF
Entity is an ecordance wi
ort have been
ed in accord001.
avid R Dix rman of Direcebruary 2011
uent Events
ls of significas Half-Year F
al Informati
al informationat www.try.c
r the Septemnce policies a
CE DECLAR
ependence d
FF OF AMO
entity of the kth that Classn rounded of
ance with a
ctors 1
DIRECT
ant events suinancial Rep
on
n on the Cocom.au. Info
mber and Deand other Co
RATION BY
declaration is
OUNTS
kind referreds Order amoff to the neare
resolution of
TORS' RE
ubsequent toport.
ompany’s actormation avacember 201ompany infor
Y AUDITOR
s included on
d to in ASIC ounts in the rest thousand
f directors m
EPORT Co
o balance da
tivities durinailable includ0 periods, thrmation and
R
n page 5 of th
Class Order Directors’ Red dollars, unl
made pursua
ontinued
te please ref
g the half yees the detai
he 2010 Annpublications
he Half-Year
98/0100, daeport, and thess otherwis
nt to s.306 (
Troy ReFinancial Re
Half Y31 Dece
fer to Note 1
ear is availailed quarterlynual Report, .
r Financial R
ated 10 July he Half Yearse indicated.
(3) of the Co
sources NL eport for the Year ended ember 2010
4
0 on page
able on its y activities Corporate
eport.
1998, and r Financial
orporations
Liability limited by a scheme approved under Professional Standards Legislation. Member of Deloitte Touche Tohmatsu Limited
28 February 2011 Dear Board Members
Auditors Independence Declaration to Troy Resources NL In accordance with section 307C of the Corporations Act 2001, I am pleased to provide the following declaration of independence to the directors of Troy Resources NL. As lead audit partner for the review of the financial statements of Troy Resources NL for the half-year ended 31 December 2010, I declare that to the best of my knowledge and belief, there have been no contraventions of:
(i) the auditor independence requirements of the Corporations Act 2001 in relation to the review; and
(ii) any applicable code of professional conduct in relation to the review. Yours sincerely
DELOITTE TOUCHE TOHMATSU
Ross Jerrard Partner Chartered Accountants
Deloitte Touche Tohmatsu A.B.N. 74 490 121 060 Woodside Plaza Level 14 240 St Georges Terrace Perth WA 6000
GPO Box A46 Perth WA 6837 Australia DX 206 Tel: +61 (0) 2 9365 7000 Fax: +61 (0) 2 9365 7001 www.deloitte.com.au
The Board of Directors Troy Resources NL Ground Floor 44 Ord Street West Perth WA 6005
Troy Resources NL Financial Report for the
Half Year ended 31 December 2010
6
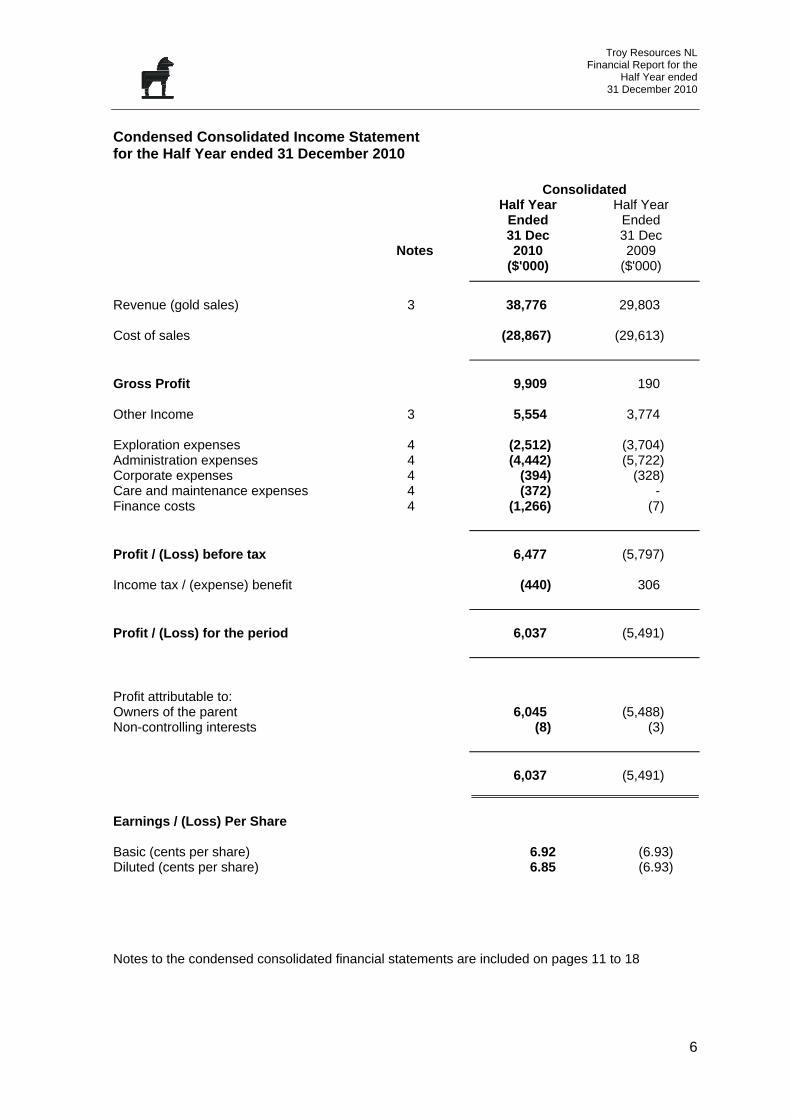
Condensed Consolidated Income Statement for the Half Year ended 31 December 2010 Consolidated Half Year Half Year Ended Ended 31 Dec 31 Dec Notes 2010 2009 ($'000) ($'000)
Revenue (gold sales) 3 38,776 29,803 Cost of sales (28,867) (29,613)
Gross Profit 9,909 190 Other Income 3 5,554 3,774 Exploration expenses 4 (2,512) (3,704) Administration expenses 4 (4,442) (5,722) Corporate expenses 4 (394) (328) Care and maintenance expenses 4 (372) - Finance costs 4 (1,266) (7)
Profit / (Loss) before tax 6,477 (5,797) Income tax / (expense) benefit (440) 306
Profit / (Loss) for the period 6,037 (5,491)
Profit attributable to: Owners of the parent 6,045 (5,488) Non-controlling interests (8) (3)
6,037 (5,491) Earnings / (Loss) Per Share Basic (cents per share) 6.92 (6.93) Diluted (cents per share) 6.85 (6.93) Notes to the condensed consolidated financial statements are included on pages 11 to 18
Troy Resources NL Financial Report for the
Half Year ended 31 December 2010
7
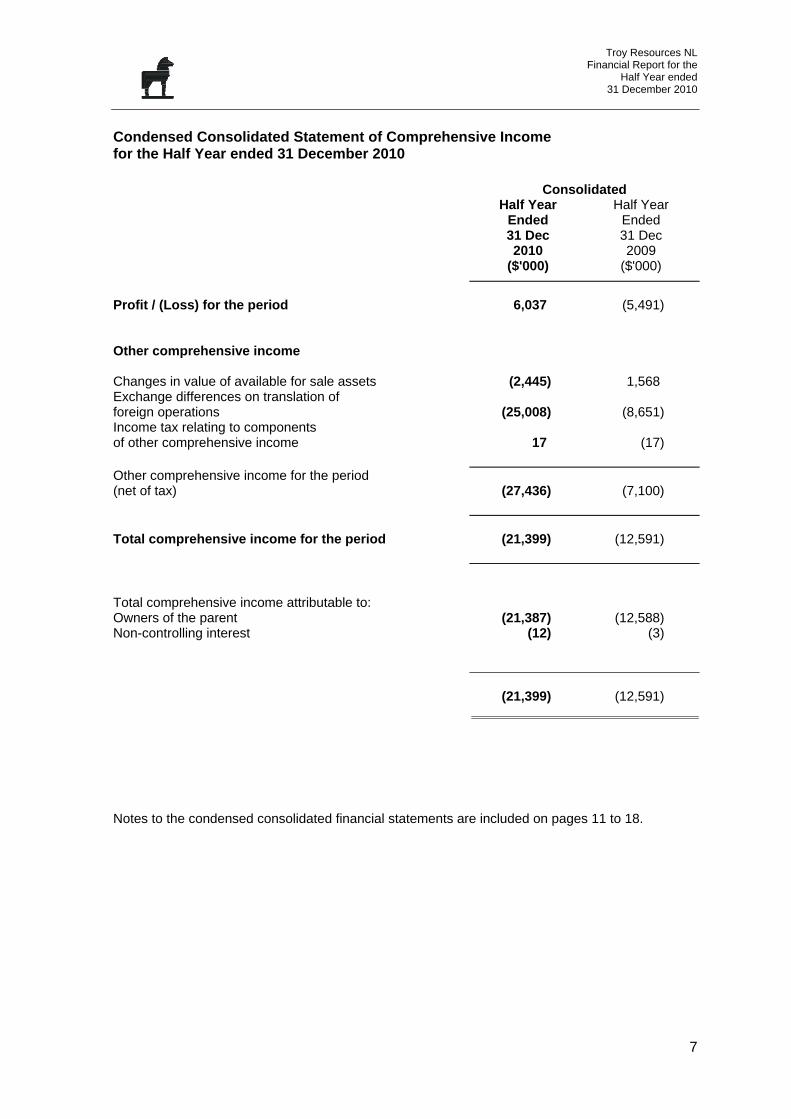
Condensed Consolidated Statement of Comprehensive Income for the Half Year ended 31 December 2010 Consolidated Half Year Half Year Ended Ended 31 Dec 31 Dec 2010 2009 ($'000) ($'000)
Profit / (Loss) for the period 6,037 (5,491) Other comprehensive income Changes in value of available for sale assets (2,445) 1,568 Exchange differences on translation of foreign operations (25,008) (8,651) Income tax relating to components of other comprehensive income 17 (17)
Other comprehensive income for the period (net of tax) (27,436) (7,100)
Total comprehensive income for the period (21,399) (12,591)
Total comprehensive income attributable to: Owners of the parent (21,387) (12,588) Non-controlling interest (12) (3)
(21,399) (12,591) Notes to the condensed consolidated financial statements are included on pages 11 to 18.
Troy Resources NL Financial Report for the
Half Year ended 31 December 2010
8
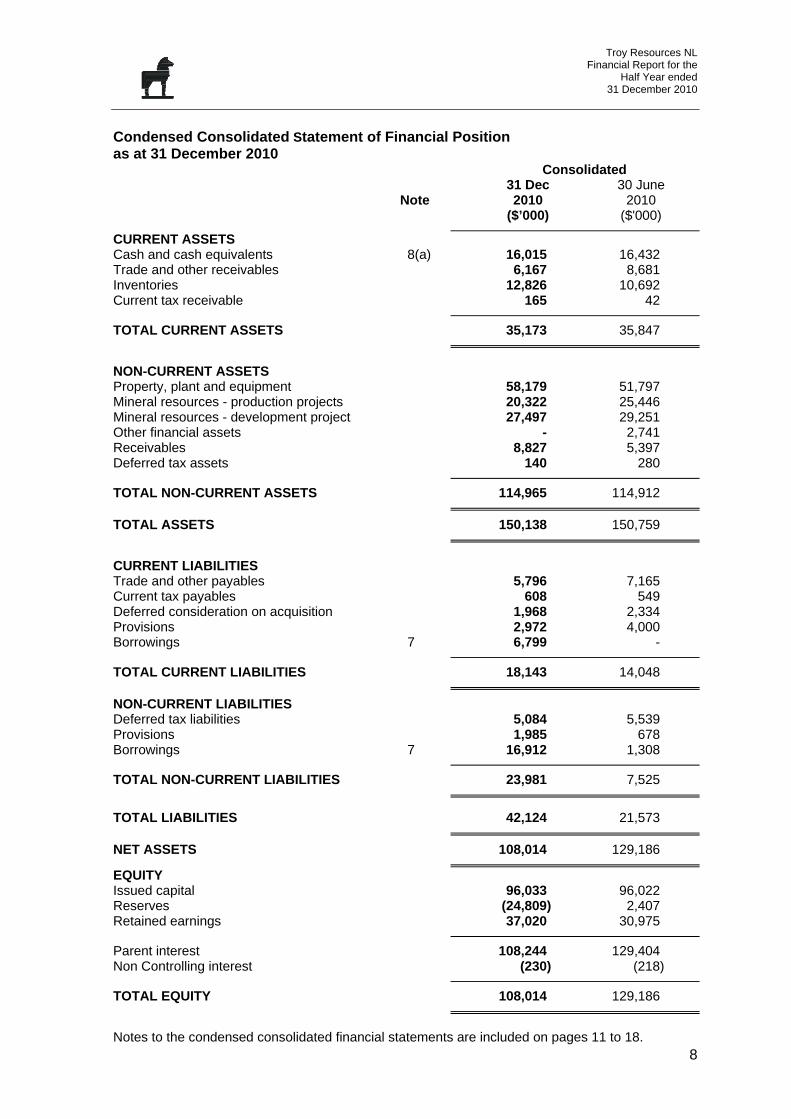
Condensed Consolidated Statement of Financial Position as at 31 December 2010 Consolidated 31 Dec 30 June Note 2010 2010 ($’000) ($'000)
CURRENT ASSETS Cash and cash equivalents 8(a) 16,015 16,432 Trade and other receivables 6,167 8,681 Inventories 12,826 10,692 Current tax receivable 165 42
TOTAL CURRENT ASSETS 35,173 35,847
NON-CURRENT ASSETS Property, plant and equipment 58,179 51,797 Mineral resources - production projects 20,322 25,446 Mineral resources - development project 27,497 29,251 Other financial assets - 2,741 Receivables 8,827 5,397 Deferred tax assets 140 280
TOTAL NON-CURRENT ASSETS 114,965 114,912
TOTAL ASSETS 150,138 150,759
CURRENT LIABILITIES Trade and other payables 5,796 7,165 Current tax payables 608 549 Deferred consideration on acquisition 1,968 2,334 Provisions 2,972 4,000 Borrowings 7 6,799 -
TOTAL CURRENT LIABILITIES 18,143 14,048
NON-CURRENT LIABILITIES Deferred tax liabilities 5,084 5,539 Provisions 1,985 678 Borrowings 7 16,912 1,308
TOTAL NON-CURRENT LIABILITIES 23,981 7,525
TOTAL LIABILITIES 42,124 21,573
NET ASSETS 108,014 129,186
EQUITY Issued capital 96,033 96,022 Reserves (24,809) 2,407 Retained earnings 37,020 30,975
Parent interest 108,244 129,404 Non Controlling interest (230) (218)
TOTAL EQUITY 108,014 129,186
Notes to the condensed consolidated financial statements are included on pages 11 to 18.
Troy Resources NL Financial Report for the
Half Year ended 31 December 2010
9
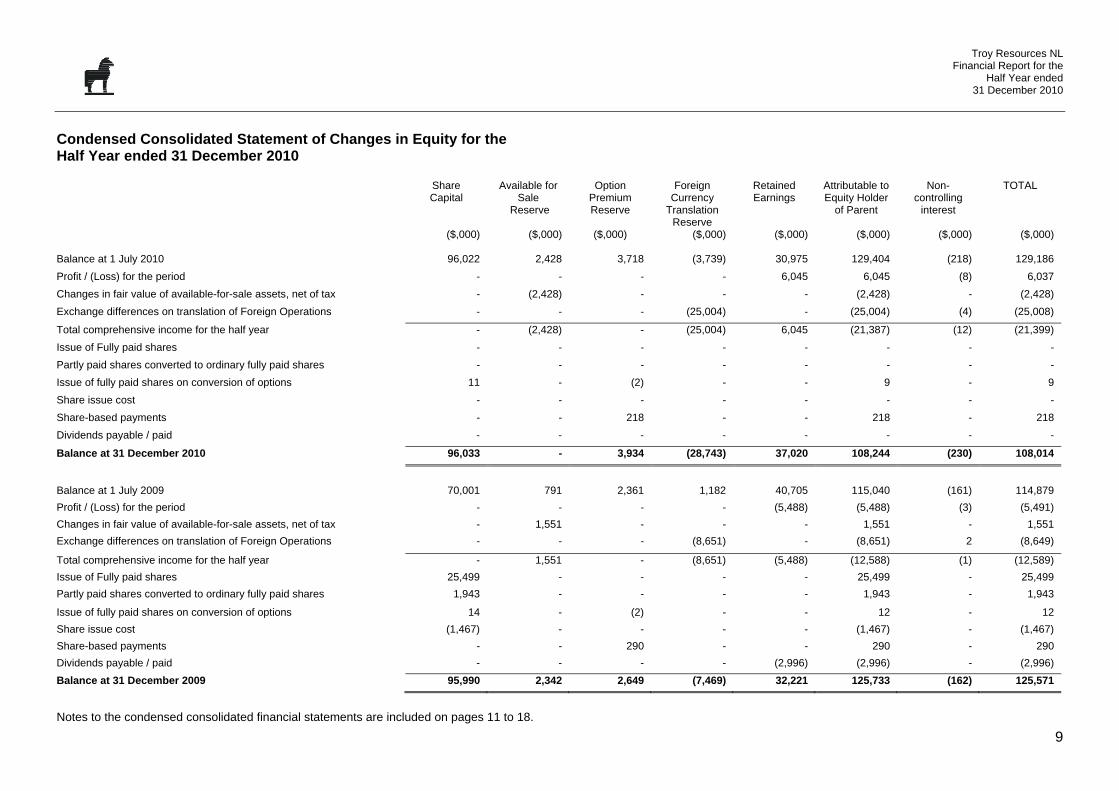
Condensed Consolidated Statement of Changes in Equity for the Half Year ended 31 December 2010 Share
Capital ($,000)
Available for Sale
Reserve ($,000)
Option Premium Reserve
($,000)
Foreign Currency
Translation Reserve
($,000)
Retained Earnings
($,000)
Attributable to Equity Holder
of Parent ($,000)
Non-controlling
interest ($,000)
TOTAL ($,000)
Balance at 1 July 2010 96,022 2,428 3,718 (3,739) 30,975 129,404 (218) 129,186
Profit / (Loss) for the period - - - - 6,045 6,045 (8) 6,037
Changes in fair value of available-for-sale assets, net of tax - (2,428) - - - (2,428) - (2,428)
Exchange differences on translation of Foreign Operations - - - (25,004) - (25,004) (4) (25,008)
Total comprehensive income for the half year - (2,428) - (25,004) 6,045 (21,387) (12) (21,399)
Issue of Fully paid shares - - - - - - - -
Partly paid shares converted to ordinary fully paid shares - - - - - - - -
Issue of fully paid shares on conversion of options 11 - (2) - - 9 - 9
Share issue cost - - - - - - - -
Share-based payments - - 218 - - 218 - 218
Dividends payable / paid - - - - - - - -
Balance at 31 December 2010 96,033 - 3,934 (28,743) 37,020 108,244 (230) 108,014
Balance at 1 July 2009 70,001 791 2,361 1,182 40,705 115,040 (161) 114,879
Profit / (Loss) for the period - - - - (5,488) (5,488) (3) (5,491)
Changes in fair value of available-for-sale assets, net of tax - 1,551 - - - 1,551 - 1,551
Exchange differences on translation of Foreign Operations - - - (8,651) - (8,651) 2 (8,649)
Total comprehensive income for the half year - 1,551 - (8,651) (5,488) (12,588) (1) (12,589)
Issue of Fully paid shares 25,499 - - - - 25,499 - 25,499
Partly paid shares converted to ordinary fully paid shares 1,943 - - - - 1,943 - 1,943
Issue of fully paid shares on conversion of options 14 - (2) - - 12 - 12
Share issue cost (1,467) - - - - (1,467) - (1,467)
Share-based payments - - 290 - - 290 - 290
Dividends payable / paid - - - - (2,996) (2,996) - (2,996)
Balance at 31 December 2009 95,990 2,342 2,649 (7,469) 32,221 125,733 (162) 125,571
Notes to the condensed consolidated financial statements are included on pages 11 to 18.
Troy Resources NL Financial Report for the
Half Year ended 31 December 2010
10
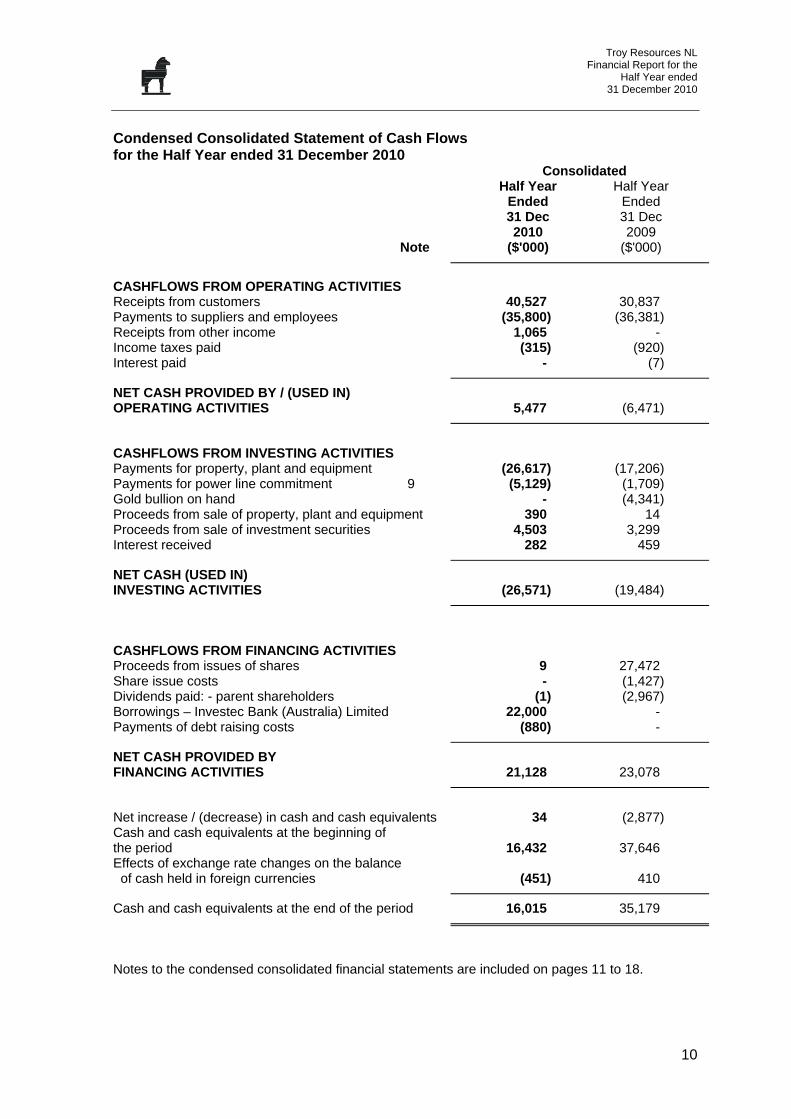
Condensed Consolidated Statement of Cash Flows for the Half Year ended 31 December 2010 Consolidated Half Year Half Year Ended Ended 31 Dec 31 Dec 2010 2009 Note ($'000) ($'000)
CASHFLOWS FROM OPERATING ACTIVITIES Receipts from customers 40,527 30,837 Payments to suppliers and employees (35,800) (36,381) Receipts from other income 1,065 - Income taxes paid (315) (920) Interest paid - (7)
NET CASH PROVIDED BY / (USED IN) OPERATING ACTIVITIES 5,477 (6,471)
CASHFLOWS FROM INVESTING ACTIVITIES Payments for property, plant and equipment (26,617) (17,206) Payments for power line commitment 9 (5,129) (1,709) Gold bullion on hand - (4,341) Proceeds from sale of property, plant and equipment 390 14 Proceeds from sale of investment securities 4,503 3,299 Interest received 282 459
NET CASH (USED IN) INVESTING ACTIVITIES (26,571) (19,484)
CASHFLOWS FROM FINANCING ACTIVITIES Proceeds from issues of shares 9 27,472 Share issue costs - (1,427) Dividends paid: - parent shareholders (1) (2,967) Borrowings – Investec Bank (Australia) Limited 22,000 - Payments of debt raising costs (880) -
NET CASH PROVIDED BY FINANCING ACTIVITIES 21,128 23,078
Net increase / (decrease) in cash and cash equivalents 34 (2,877) Cash and cash equivalents at the beginning of the period 16,432 37,646 Effects of exchange rate changes on the balance of cash held in foreign currencies (451) 410
Cash and cash equivalents at the end of the period 16,015 35,179
Notes to the condensed consolidated financial statements are included on pages 11 to 18.
Troy Resources NL Financial Report for the
Half Year ended 31 December 2010
11
TROY RESOURCES NL AND CONTROLLED ENTITIES Notes to the Condensed Consolidated Financial Statements for the Half Year ended 31 December 2010 1. Significant accounting policies Statement of compliance
The Half Year financial report is a general purpose financial report prepared in accordance with the Corporations Act 2001 and AASB 134 ‘Interim Financial Reporting’. Compliance with AASB 134 ensures compliance with International Financial Reporting Standard IAS 34 ‘Interim Financial Reporting’. The Half Year report does not include notes of the type normally included in an annual financial report and should be read in conjunction with the most recent annual financial report. Basis of preparation The condensed consolidated financial statements have been prepared on the basis of historical cost, except for the revaluation of certain non-current assets and financial instruments. Cost is based on the fair values of the consideration given in exchange for assets. All amounts are presented in Australian dollars, unless otherwise noted. The accounting policies and methods of computation adopted in the preparation of the half-year financial report are consistent with those adopted and disclosed in the company’s 2010 annual financial report for the financial year ended 30 June 2010, except for the impact of the Standards and Interpretations described below. These accounting policies are consistent with Australian Accounting Standards and with International Financial Reporting Standards.
The Group has adopted all of the new and revised Standards and Interpretations issued by the Australian Accounting Standards Board (the AASB) that are relevant to their operations and effective for the current reporting period. New and revised Standards and amendments thereof and Interpretations effective for the current reporting period that are relevant to the Group include: • Amendments to AASB 5, 8, 101, 107, 117, 118, 136 and 139 as a consequence of AASB 2009-5 Further Amendments to Australian Accounting Standards arising from the Annual Improvements Project AASB 2009-5 Introduces amendments into Accounting Standards that are equivalent to those made by the IASB under its program of annual improvements to its standards. A number of the amendments are largely technical, clarifying particular terms, or eliminating unintended consequences. Other changes are more substantial, such as the current/non-current classification of convertible instruments, the classification of expenditures on unrecognised assets in the statement of cash flows and the classification of leases of land and buildings.
The adoption of these amendments has not resulted in any changes to the Group’s accounting policies and have no affect on the amounts reported for the current or prior periods.
2. Segment Information
AASB 8 requires operating segments to be identified on the basis of internal reports about components of the consolidated entity that are regularly reviewed by the chief operating decision maker in order to allocate resources to the segment and to assess its performance.
Troy Resources NL Financial Report for the
Half Year ended 31 December 2010
12
TROY RESOURCES NL AND CONTROLLED ENTITIES Notes to the Condensed Consolidated Financial Statements for the Half Year ended 31 December 2010 2. Segment Information (continued)
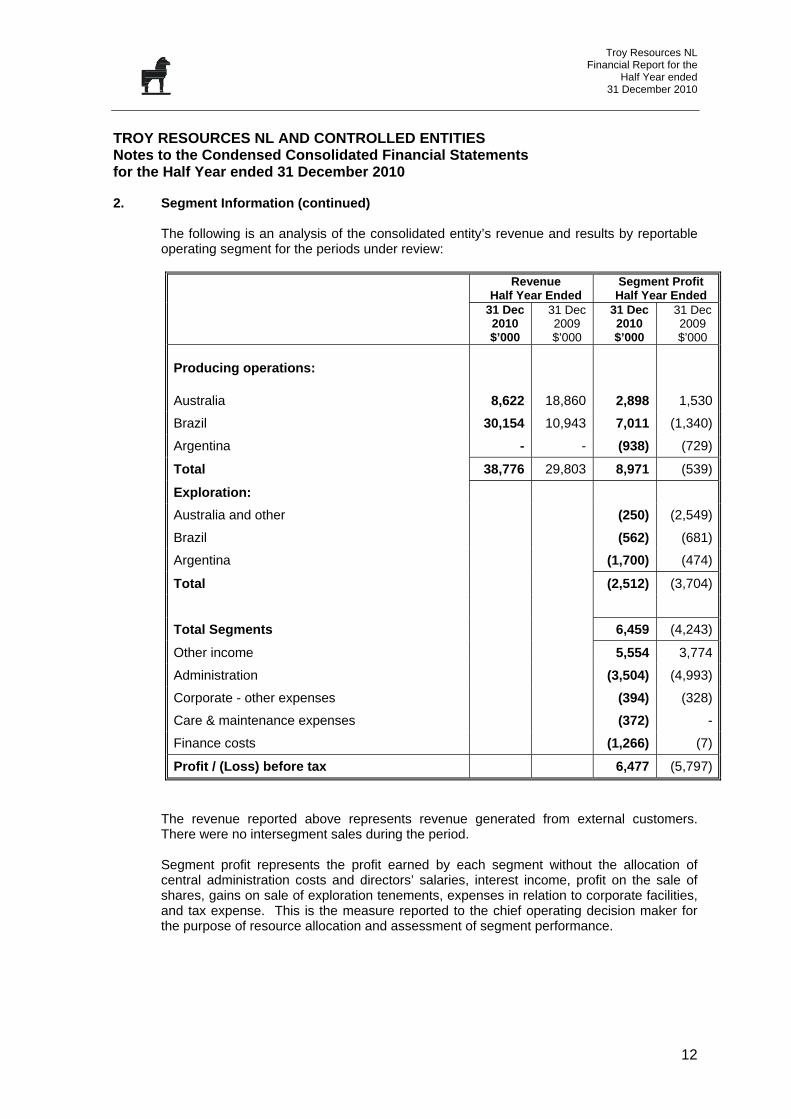
The following is an analysis of the consolidated entity’s revenue and results by reportable operating segment for the periods under review:
Revenue Half Year Ended
Segment ProfitHalf Year Ended
31 Dec2010 $’000
31 Dec 2009 $’000
31 Dec 2010 $’000
31 Dec 2009 $’000
Producing operations:
Australia 8,622 18,860 2,898 1,530
Brazil 30,154 10,943 7,011 (1,340)
Argentina - - (938) (729)
Total 38,776 29,803 8,971 (539)
Exploration:
Australia and other (250) (2,549)
Brazil (562) (681)
Argentina (1,700) (474)
Total (2,512) (3,704)
Total Segments 6,459 (4,243)
Other income 5,554 3,774
Administration (3,504) (4,993)
Corporate - other expenses (394) (328)
Care & maintenance expenses (372) -
Finance costs (1,266) (7)
Profit / (Loss) before tax 6,477 (5,797)
The revenue reported above represents revenue generated from external customers. There were no intersegment sales during the period. Segment profit represents the profit earned by each segment without the allocation of central administration costs and directors’ salaries, interest income, profit on the sale of shares, gains on sale of exploration tenements, expenses in relation to corporate facilities, and tax expense. This is the measure reported to the chief operating decision maker for the purpose of resource allocation and assessment of segment performance.
Troy Resources NL Financial Report for the
Half Year ended 31 December 2010
13
TROY RESOURCES NL AND CONTROLLED ENTITIES Notes to the Condensed Consolidated Financial Statements for the Half Year ended 31 December 2010 2. Segment Information (continued)
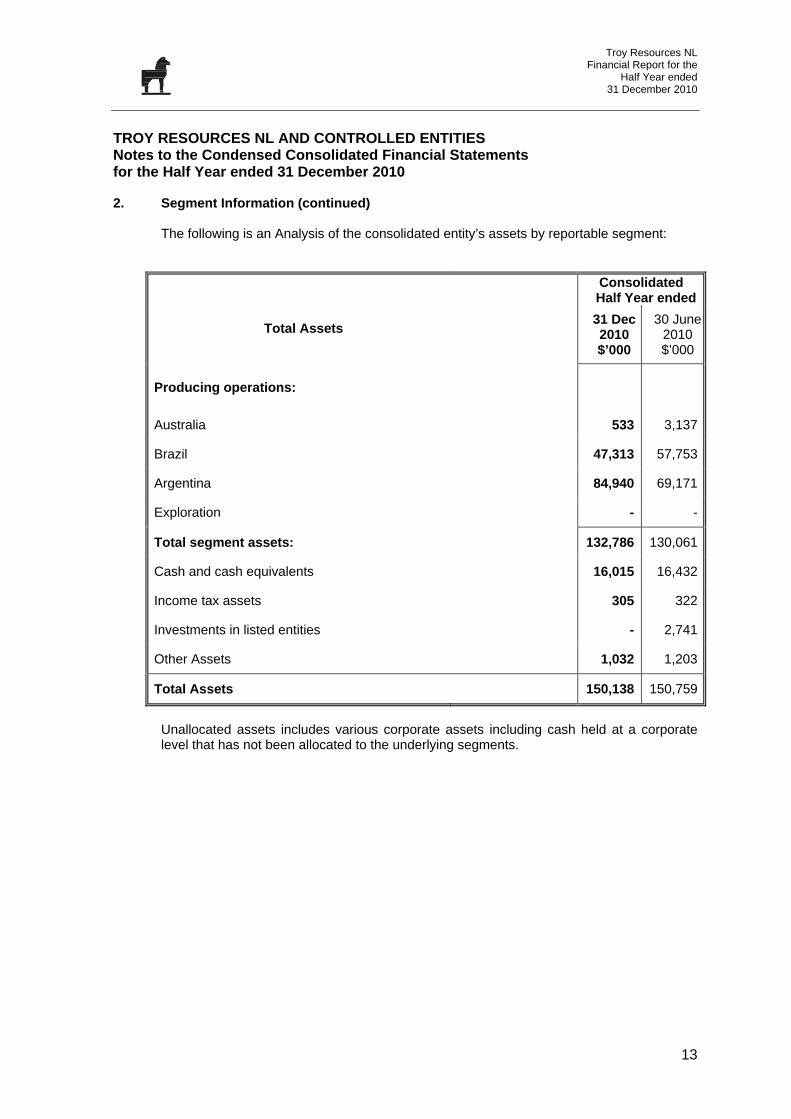
The following is an Analysis of the consolidated entity’s assets by reportable segment:
Consolidated Half Year ended
Total Assets
31 Dec 2010 $’000
30 June2010 $’000
Producing operations:
Australia 533 3,137
Brazil 47,313 57,753
Argentina 84,940 69,171
Exploration - -
Total segment assets: 132,786 130,061
Cash and cash equivalents 16,015 16,432
Income tax assets 305 322
Investments in listed entities - 2,741
Other Assets 1,032 1,203
Total Assets 150,138 150,759
Unallocated assets includes various corporate assets including cash held at a corporate level that has not been allocated to the underlying segments.
Troy Resources NL Financial Report for the
Half Year ended 31 December 2010
14
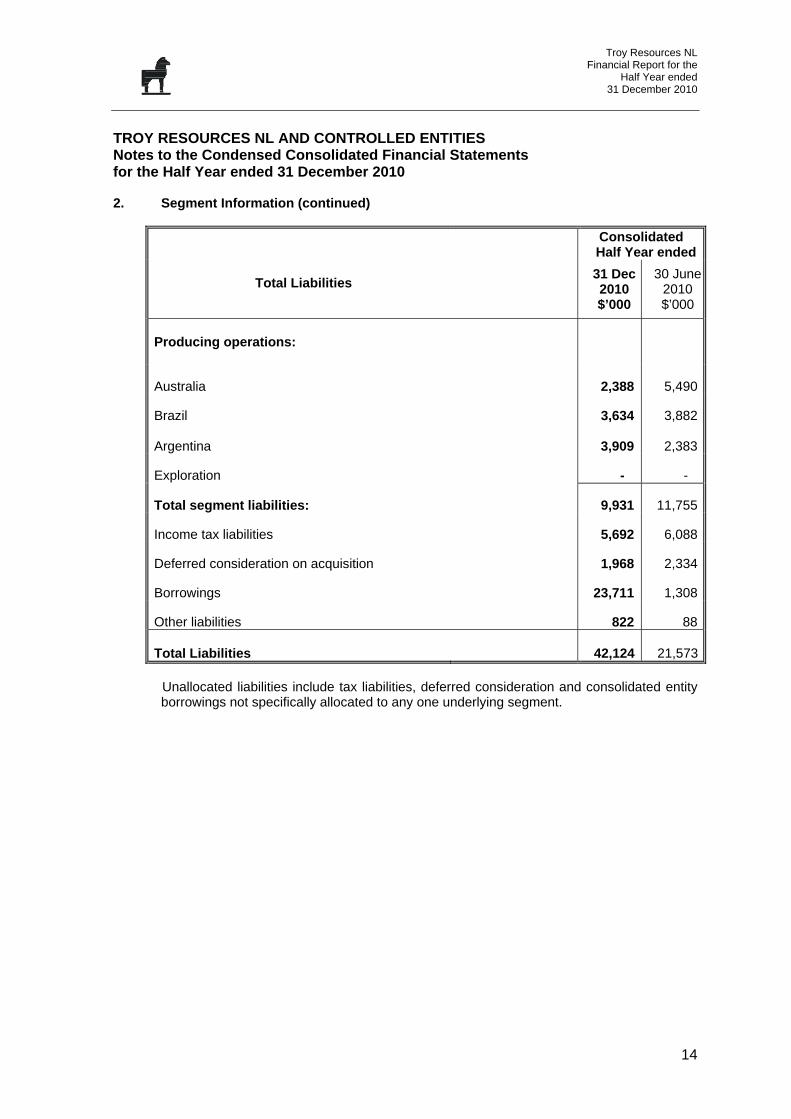
TROY RESOURCES NL AND CONTROLLED ENTITIES Notes to the Condensed Consolidated Financial Statements for the Half Year ended 31 December 2010 2. Segment Information (continued)
Consolidated Half Year ended
Total Liabilities
31 Dec 2010 $’000
30 June2010 $’000
Producing operations:
Australia
2,388 5,490
Brazil
3,634 3,882 Argentina
3,909 2,383
Exploration
- -
Total segment liabilities:
9,931 11,755
Income tax liabilities
5,692 6,088
Deferred consideration on acquisition
1,968 2,334
Borrowings
23,711 1,308
Other liabilities
822 88
Total Liabilities
42,124 21,573
Unallocated liabilities include tax liabilities, deferred consideration and consolidated entity borrowings not specifically allocated to any one underlying segment.
Troy Resources NL Financial Report for the
Half Year ended 31 December 2010
15
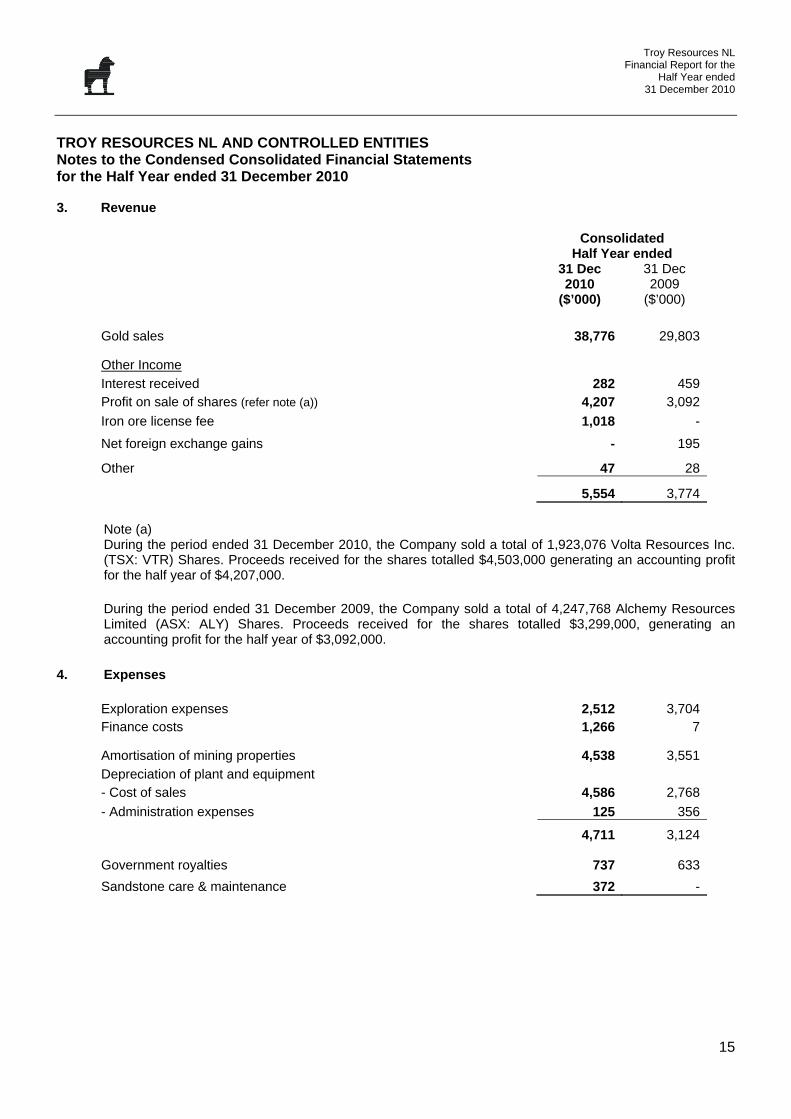
TROY RESOURCES NL AND CONTROLLED ENTITIES Notes to the Condensed Consolidated Financial Statements for the Half Year ended 31 December 2010 3. Revenue
Consolidated Half Year ended
31 Dec 2010
($’000)
31 Dec 2009
($’000)
Gold sales 38,776 29,803
Other Income
Interest received 282 459Profit on sale of shares (refer note (a)) 4,207 3,092
Iron ore license fee 1,018 -
Net foreign exchange gains - 195
Other 47 28
5,554 3,774
Note (a)
During the period ended 31 December 2010, the Company sold a total of 1,923,076 Volta Resources Inc. (TSX: VTR) Shares. Proceeds received for the shares totalled $4,503,000 generating an accounting profit for the half year of $4,207,000. During the period ended 31 December 2009, the Company sold a total of 4,247,768 Alchemy Resources Limited (ASX: ALY) Shares. Proceeds received for the shares totalled $3,299,000, generating an accounting profit for the half year of $3,092,000.
4. Expenses
Exploration expenses 2,512 3,704Finance costs 1,266 7
Amortisation of mining properties 4,538 3,551
Depreciation of plant and equipment - Cost of sales 4,586 2,768
- Administration expenses 125 356
4,711 3,124
Government royalties 737 633
Sandstone care & maintenance 372 -
Troy Resources NL Financial Report for the
Half Year ended 31 December 2010
16
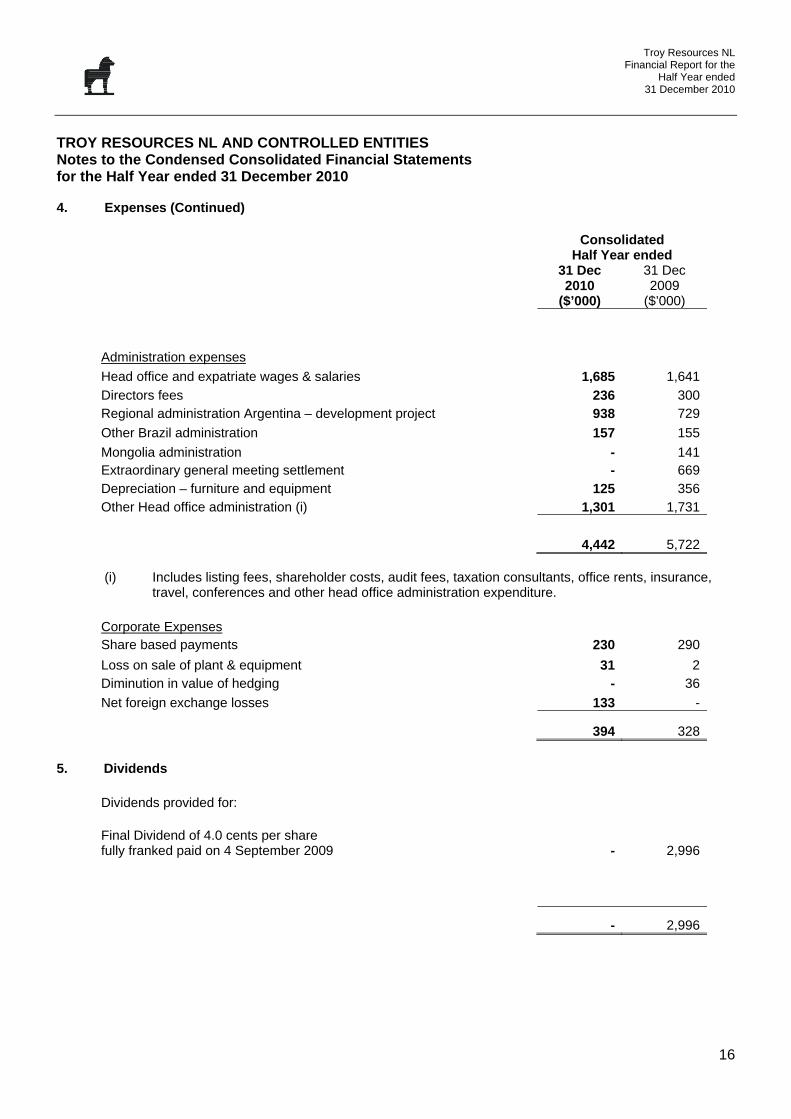
TROY RESOURCES NL AND CONTROLLED ENTITIES Notes to the Condensed Consolidated Financial Statements for the Half Year ended 31 December 2010 4. Expenses (Continued)
Consolidated Half Year ended
31 Dec 2010
($’000)
31 Dec 2009
($’000)
Administration expenses
Head office and expatriate wages & salaries 1,685 1,641
Directors fees 236 300Regional administration Argentina – development project 938 729
Other Brazil administration 157 155
Mongolia administration - 141Extraordinary general meeting settlement - 669Depreciation – furniture and equipment 125 356Other Head office administration (i) 1,301 1,731
4,442 5,722
(i) Includes listing fees, shareholder costs, audit fees, taxation consultants, office rents, insurance, travel, conferences and other head office administration expenditure.
Corporate Expenses Share based payments 230 290
Loss on sale of plant & equipment 31 2Diminution in value of hedging - 36
Net foreign exchange losses 133 -
394 328
5. Dividends
Dividends provided for:
Final Dividend of 4.0 cents per share fully franked paid on 4 September 2009 - 2,996
- 2,996
Troy Resources NL Financial Report for the
Half Year ended 31 December 2010
17
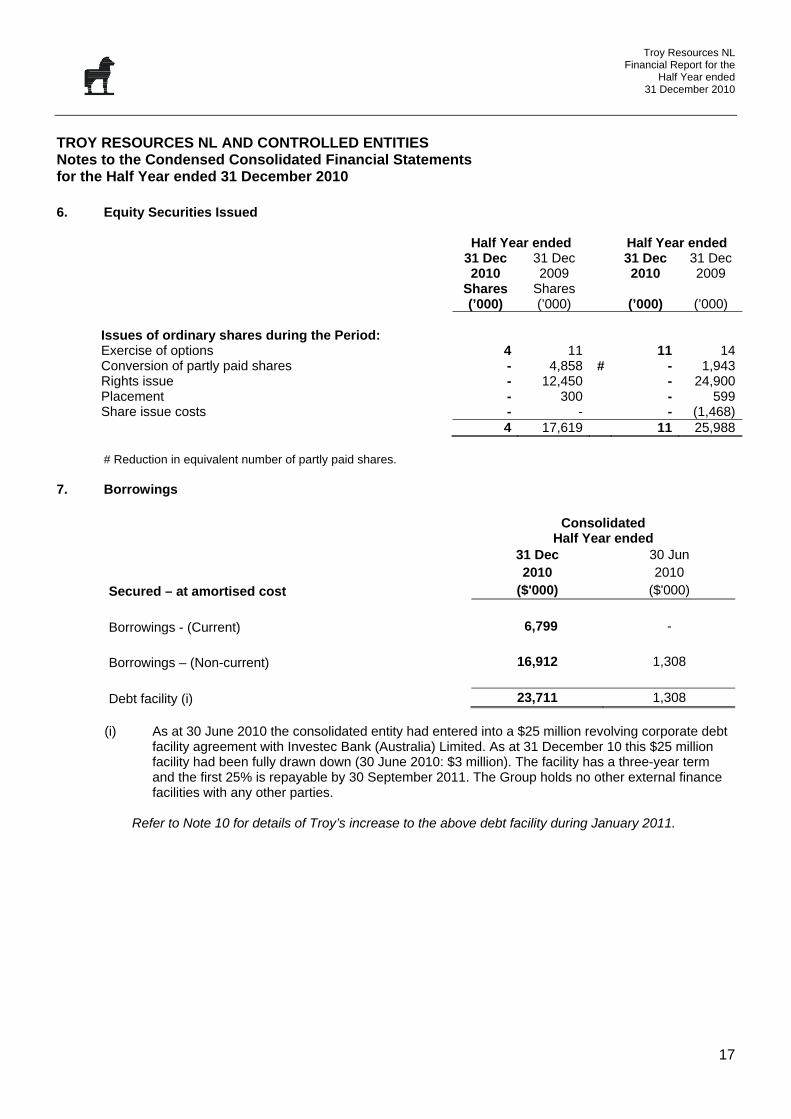
TROY RESOURCES NL AND CONTROLLED ENTITIES Notes to the Condensed Consolidated Financial Statements for the Half Year ended 31 December 2010 6. Equity Securities Issued
Half Year ended Half Year ended 31 Dec
2010 Shares (’000)
31 Dec 2009
Shares (’000)
31 Dec 2010
(’000)
31 Dec 2009
(’000)
Issues of ordinary shares during the Period: Exercise of options 4 11 11 14Conversion of partly paid shares - 4,858 # - 1,943Rights issue - 12,450 - 24,900Placement - 300 - 599Share issue costs - - - (1,468) 4 17,619 11 25,988
# Reduction in equivalent number of partly paid shares. 7. Borrowings
Consolidated
Half Year ended 31 Dec 30 Jun
2010 2010
Secured – at amortised cost ($'000) ($'000)
Borrowings - (Current) 6,799 -
Borrowings – (Non-current) 16,912 1,308
Debt facility (i) 23,711 1,308
(i) As at 30 June 2010 the consolidated entity had entered into a $25 million revolving corporate debt facility agreement with Investec Bank (Australia) Limited. As at 31 December 10 this $25 million facility had been fully drawn down (30 June 2010: $3 million). The facility has a three-year term and the first 25% is repayable by 30 September 2011. The Group holds no other external finance facilities with any other parties.
Refer to Note 10 for details of Troy’s increase to the above debt facility during January 2011.
Troy Resources NL Financial Report for the
Half Year ended 31 December 2010
18
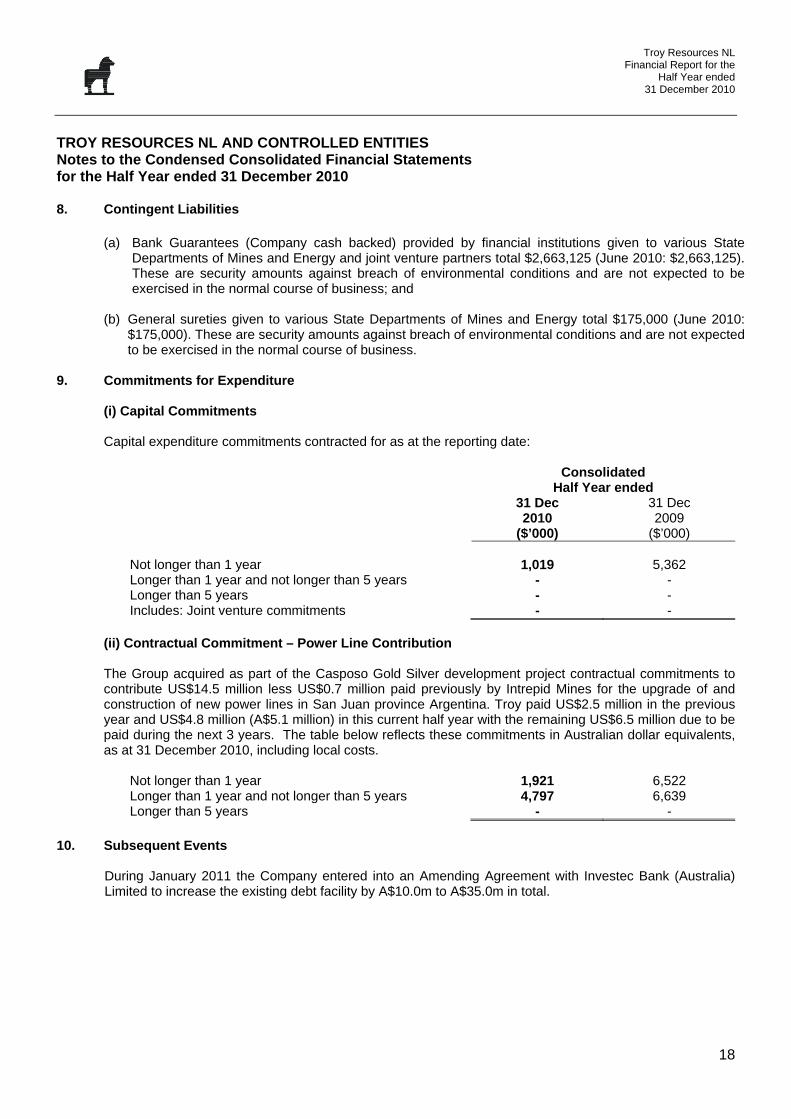
TROY RESOURCES NL AND CONTROLLED ENTITIES Notes to the Condensed Consolidated Financial Statements for the Half Year ended 31 December 2010 8. Contingent Liabilities
(a) Bank Guarantees (Company cash backed) provided by financial institutions given to various State Departments of Mines and Energy and joint venture partners total $2,663,125 (June 2010: $2,663,125). These are security amounts against breach of environmental conditions and are not expected to be exercised in the normal course of business; and
(b) General sureties given to various State Departments of Mines and Energy total $175,000 (June 2010:
$175,000). These are security amounts against breach of environmental conditions and are not expected to be exercised in the normal course of business.
9. Commitments for Expenditure
(i) Capital Commitments
Capital expenditure commitments contracted for as at the reporting date:
Consolidated Half Year ended
31 Dec 31 Dec 2010 2009 ($’000) ($’000) Not longer than 1 year 1,019 5,362 Longer than 1 year and not longer than 5 years - - Longer than 5 years - - Includes: Joint venture commitments - -
(ii) Contractual Commitment – Power Line Contribution
The Group acquired as part of the Casposo Gold Silver development project contractual commitments to contribute US$14.5 million less US$0.7 million paid previously by Intrepid Mines for the upgrade of and construction of new power lines in San Juan province Argentina. Troy paid US$2.5 million in the previous year and US$4.8 million (A$5.1 million) in this current half year with the remaining US$6.5 million due to be paid during the next 3 years. The table below reflects these commitments in Australian dollar equivalents, as at 31 December 2010, including local costs.
Not longer than 1 year 1,921 6,522 Longer than 1 year and not longer than 5 years 4,797 6,639 Longer than 5 years - -
10. Subsequent Events
During January 2011 the Company entered into an Amending Agreement with Investec Bank (Australia) Limited to increase the existing debt facility by A$10.0m to A$35.0m in total.
Th (a) (b)
(c)
(d)
Sig20 On
MrCh PeDa
e Directors d
) the atta
) the attperform
) in the Corpor
) in the debts a
gned in acc01.
n behalf of t
r David R Dihairman of D
erth, Westernate: 28 Febru
declare that:
ached financ
tached financmance of the
Directors’ orations Act 2
Directors’ opas and when
cordance wi
he Directors
x irectors
n Australia uary 2011
D
cial statemen
cial statemee Consolidate
pinion, the a001; and
pinion, theren they becom
ith a resolut
s
DIRECTOR
nts and notes
nts and noteed Entity;
attached fina
are reasoname due and p
tion of the D
RS’ DECL
s thereto com
es thereto g
ancial statem
able groundspayable.
Directors m
LARATIO
mply with acc
ive a true a
ments and n
s to believe
made pursua
ON
counting stan
nd fair view
notes thereto
that the Com
ant to s.303(
Fina
ndards;
of the finan
o are in acc
mpany will b
(5) of the C
Troy Resourcesancial Report for
Half Year en31 December 2
ncial position
ordance with
be able to pa
Corporations
s NL r the nded 2010
19
n and
h the
ay its
s Act
Liability limited by a scheme approved under Professional Standards Legislation. Member of Deloitte Touche Tohmatsu Limited
Independent Auditor’s Review Report to the members of Troy Resources NL We have reviewed the accompanying half-year financial report of Troy Resources NL, which comprises the condensed statement of financial position as at 31 December 2010, and the condensed income statement, the condensed statement of comprehensive income, the condensed statement of cash flows and the condensed statement of changes in equity for the half-year ended on that date, selected explanatory notes and, the directors’ declaration of the consolidated entity comprising the company and the entities it controlled at the end of the half-year or from time to time during the half-year as set out on pages 6 to 19. Directors’ Responsibility for the Half-Year Financial Report The directors of the company are responsible for the preparation of the half-year financial report that gives a true and fair view in accordance with Australian Accounting Standards and the Corporations Act 2001 and for such internal control as the directors determine is necessary to enable the preparation of the half-year financial report that is free from material misstatement, whether due to fraud or error. Auditor’s Responsibility Our responsibility is to express a conclusion on the half-year financial report based on our review. We conducted our review in accordance with Auditing Standard on Review Engagements ASRE 2410 Review of a Financial Report Performed by the Independent Auditor of the Entity, in order to state whether, on the basis of the procedures described, we have become aware of any matter that makes us believe that the half-year financial report is not in accordance with the Corporations Act 2001 including: giving a true and fair view of the consolidated entity’s financial position as at 31 December 2010 and its performance for the half-year ended on that date; and complying with Accounting Standard AASB 134 Interim Financial Reporting and the Corporations Regulations 2001. As the auditor of Troy Resources NL, ASRE 2410 requires that we comply with the ethical requirements relevant to the audit of the annual financial report. A review of a half-year financial report consists of making enquiries, primarily of persons responsible for financial and accounting matters, and applying analytical and other review procedures. A review is substantially less in scope than an audit conducted in accordance with Australian Auditing Standards and consequently does not enable us to obtain assurance that we would become aware of all significant matters that might be identified in an audit. Accordingly, we do not express an audit opinion.
Deloitte Touche Tohmatsu ABN 74 490 121 060 Woodside Plaza Level 14 240 St Georges Terrace Perth WA 6000 GPO Box A46 Perth WA 6837 Australia DX 206 Tel: +61 (0) 8 9365 7000 Fax: +61 (0) 8 9365 7001 www.deloitte.com.au
Auditor’s Independence Declaration In conducting our review, we have complied with the independence requirements of the Corporations Act 2001. We confirm that the independence declaration required by the Corporations Act 2001, which has been given to the directors of Troy Resources NL on 28 February 2011 would be in the same terms if given to the directors as at the time of this auditor’s review report. Conclusion Based on our review, which is not an audit, we have not become aware of any matter that makes us believe that the half-year financial report of Troy Resources NL is not in accordance with the Corporations Act 2001, including: (a) giving a true and fair view of the consolidated entity’s financial position as at 31
December 2010 and of its performance for the half-year ended on that date; and (b) complying with Accounting Standard AASB 134 Interim Financial Reporting and the
Corporations Regulations 2001.
DELOITTE TOUCHE TOHMATSU
Ross Jerrard Partner Chartered Accountants Perth, 28 February 2011