Embed Size (px)
Citation preview

TRUESDELL EC800 INGRAHAM ST NW WASHINGTON, DC 20011
2010 – 2011 SCHOOL REPORT CARD
DISTRICT OF COLUMBIA OFFICE OF THE STATE SUPERINTENDENT OF EDUCATION
© 2011 Office of the State Superintendent of Education. All Rights Reserved. Report produced for OSSE by GreatSchools.org 1
2010 – 2011 SCHOOL REPORT CARDTRUESDELL EC
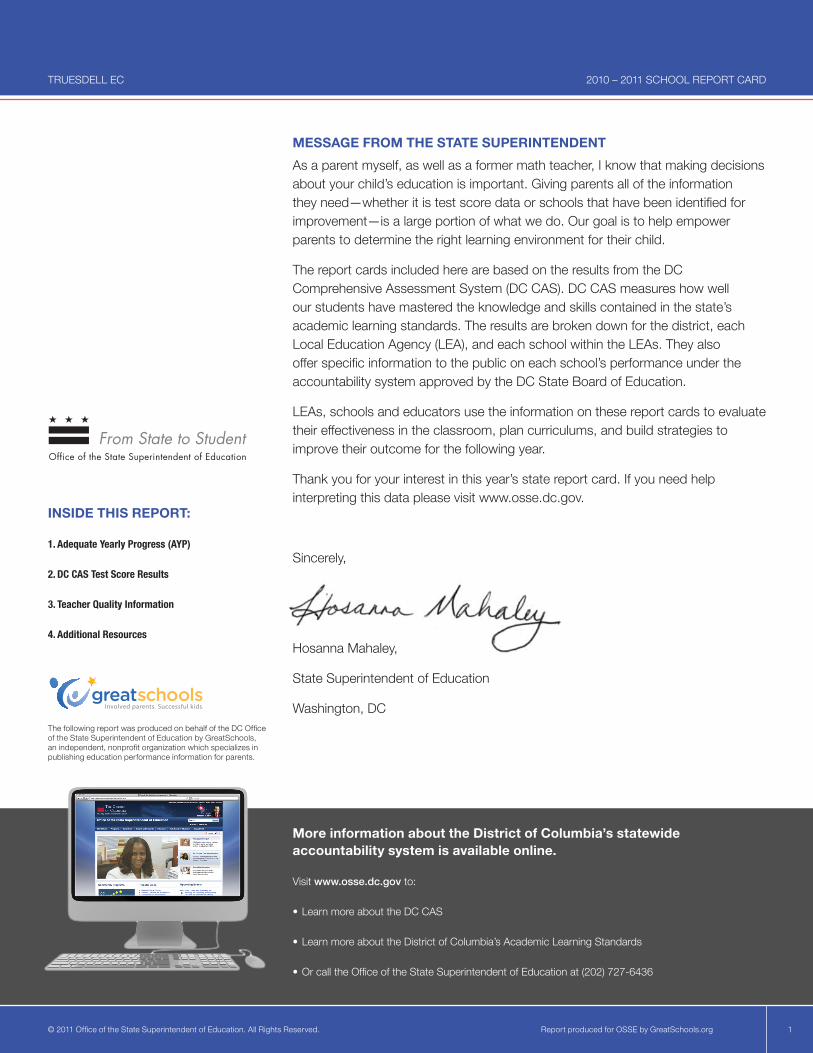
MESSAGE FROM THE STATE SUPERINTENDENT
More information about the District of Columbia’s statewide accountability system is available online.
Visit www.osse.dc.gov to:
• Learn more about the DC CAS
• Learn more about the District of Columbia’s Academic Learning Standards
• Or call the Office of the State Superintendent of Education at (202) 727-6436
INSIDE THIS REPORT:
1.AdequateYearlyProgress(AYP)
2.DCCASTestScoreResults
3.TeacherQualityInformation
4.AdditionalResources
The following report was produced on behalf of the DC Office of the State Superintendent of Education by GreatSchools, an independent, nonprofit organization which specializes in publishing education performance information for parents.
As a parent myself, as well as a former math teacher, I know that making decisions about your child’s education is important. Giving parents all of the information they need—whether it is test score data or schools that have been identified for improvement—is a large portion of what we do. Our goal is to help empower parents to determine the right learning environment for their child.
The report cards included here are based on the results from the DC Comprehensive Assessment System (DC CAS). DC CAS measures how well our students have mastered the knowledge and skills contained in the state’s academic learning standards. The results are broken down for the district, each Local Education Agency (LEA), and each school within the LEAs. They also offer specific information to the public on each school’s performance under the accountability system approved by the DC State Board of Education.
LEAs, schools and educators use the information on these report cards to evaluate their effectiveness in the classroom, plan curriculums, and build strategies to improve their outcome for the following year.
Thank you for your interest in this year’s state report card. If you need help interpreting this data please visit www.osse.dc.gov.
Sincerely,
Hosanna Mahaley,
State Superintendent of Education
Washington, DC
© 2011 Office of the State Superintendent of Education. All Rights Reserved. Report produced for OSSE by GreatSchools.org 2
2010 – 2011 SCHOOL REPORT CARDTRUESDELL EC
Adequate Yearly Progress (AYP)
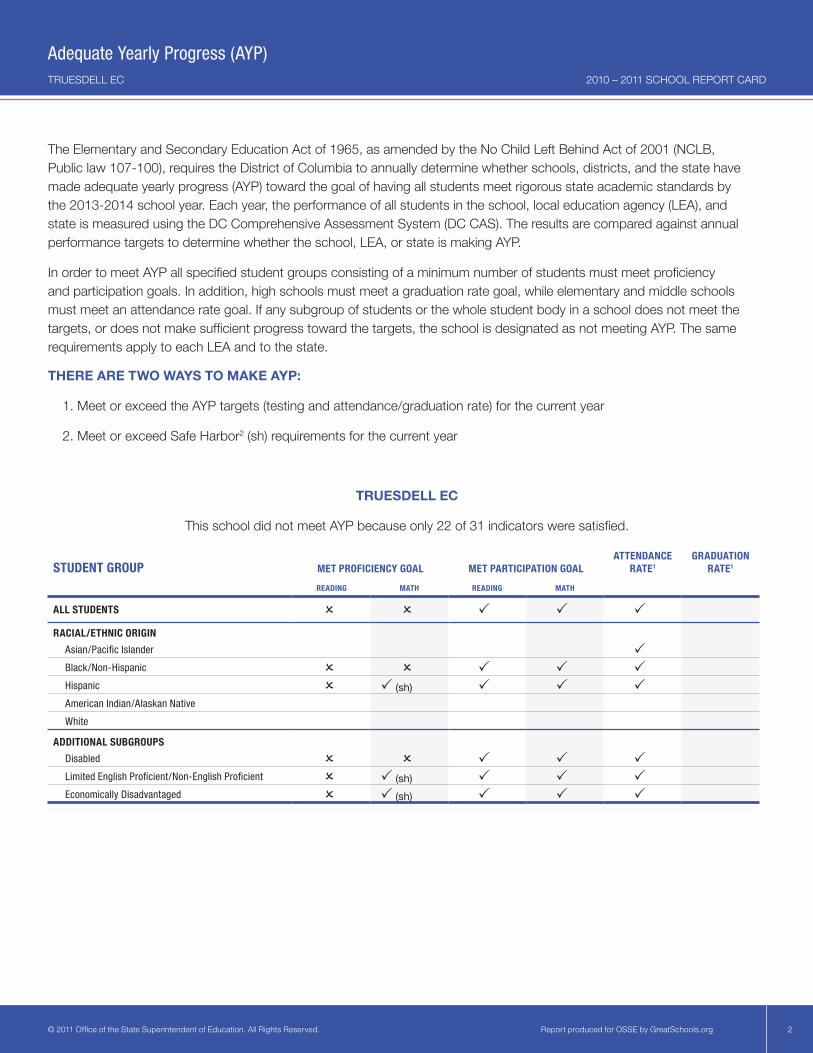
This school did not meet AYP because only 22 of 31 indicators were satisfied.
TRUESDELL EC
The Elementary and Secondary Education Act of 1965, as amended by the No Child Left Behind Act of 2001 (NCLB, Public law 107-100), requires the District of Columbia to annually determine whether schools, districts, and the state have made adequate yearly progress (AYP) toward the goal of having all students meet rigorous state academic standards by the 2013-2014 school year. Each year, the performance of all students in the school, local education agency (LEA), and state is measured using the DC Comprehensive Assessment System (DC CAS). The results are compared against annual performance targets to determine whether the school, LEA, or state is making AYP.
In order to meet AYP all specified student groups consisting of a minimum number of students must meet proficiency and participation goals. In addition, high schools must meet a graduation rate goal, while elementary and middle schools must meet an attendance rate goal. If any subgroup of students or the whole student body in a school does not meet the targets, or does not make sufficient progress toward the targets, the school is designated as not meeting AYP. The same requirements apply to each LEA and to the state.
THERE ARE TWO WAYS TO MAKE AYP:
1. Meet or exceed the AYP targets (testing and attendance/graduation rate) for the current year
2. Meet or exceed Safe Harbor2 (sh) requirements for the current year
STUDENTGROUP METPROFICIENCYGOAL METPARTICIPATIONGOALATTENDANCE
RATE1
GRADUATIONRATE1
READING MATH READING MATH
ALLSTUDENTS
RACIAL/ETHNICORIGIN
Asian/Pacific Islander Black/Non-Hispanic Hispanic (sh) American Indian/Alaskan Native
White
ADDITIONALSUBGROUPS
Disabled Limited English Proficient/Non-English Proficient (sh) Economically Disadvantaged (sh)
© 2011 Office of the State Superintendent of Education. All Rights Reserved. Report produced for OSSE by GreatSchools.org 3
2010 – 2011 SCHOOL REPORT CARDTRUESDELL EC
Adequate Yearly Progress (AYP)
FootnotesDisabled: 3 students participated in the DC CAS Alternate Assessment.Limited English/Non-English Proficient: 4 students in this subgroup were exempted from the reading test due to their arrival in the US in the last 12 months.2
1
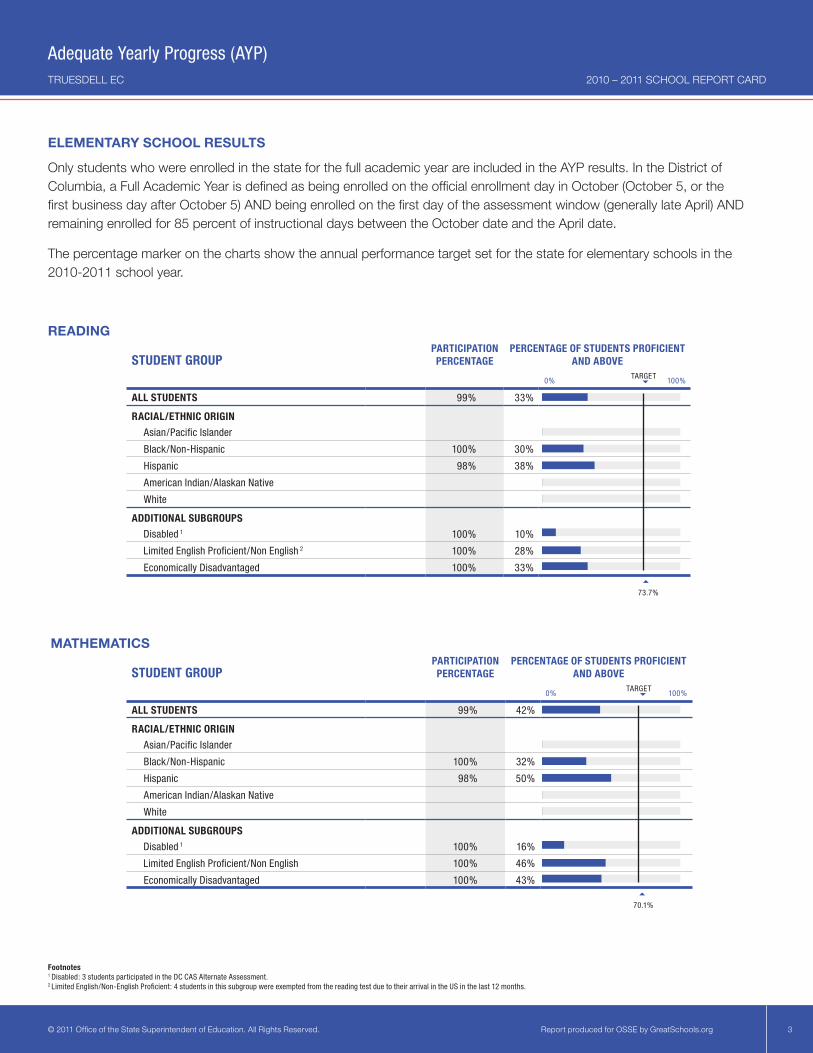
Only students who were enrolled in the state for the full academic year are included in the AYP results. In the District of Columbia, a Full Academic Year is defined as being enrolled on the official enrollment day in October (October 5, or the first business day after October 5) AND being enrolled on the first day of the assessment window (generally late April) AND remaining enrolled for 85 percent of instructional days between the October date and the April date.
The percentage marker on the charts show the annual performance target set for the state for elementary schools in the 2010-2011 school year.
ELEMENTARY SCHOOL RESULTS
MATHEMATICS
READING
STUDENTGROUPPARTICIPATIONPERCENTAGE
PERCENTAGEOFSTUDENTSPROFICIENTANDABOVE
0% 100%
ALLSTUDENTS 99% 33%
RACIAL/ETHNICORIGIN
Asian/Pacific Islander
Black/Non-Hispanic 100% 30%
Hispanic 98% 38%
American Indian/Alaskan Native
White
ADDITIONALSUBGROUPS
100% 10%
100% 28%
Economically Disadvantaged 100% 33%0% 73.7% 100%
STUDENTGROUPPARTICIPATIONPERCENTAGE
PERCENTAGEOFSTUDENTSPROFICIENTANDABOVE
0% 100%
ALLSTUDENTS 99% 42%
RACIAL/ETHNICORIGIN
Asian/Pacific Islander
Black/Non-Hispanic 100% 32%
Hispanic 98% 50%
American Indian/Alaskan Native
White
ADDITIONALSUBGROUPS
100% 16%
100% 46%
Economically Disadvantaged 100% 43%0% 70.1% 100%
Limited English Proficient/Non English 2
Disabled 1
Limited English Proficient/Non English
Disabled 1
TARGET
TARGET
© 2011 Office of the State Superintendent of Education. All Rights Reserved. Report produced for OSSE by GreatSchools.org 4
2010 – 2011 SCHOOL REPORT CARD
STUDENTGROUP
ATTENDANCERATE
RATE TARGET 90%
GRADUATIONRATE
RATE TARGET 85%
0% 50% 100% 0% 50% 100%
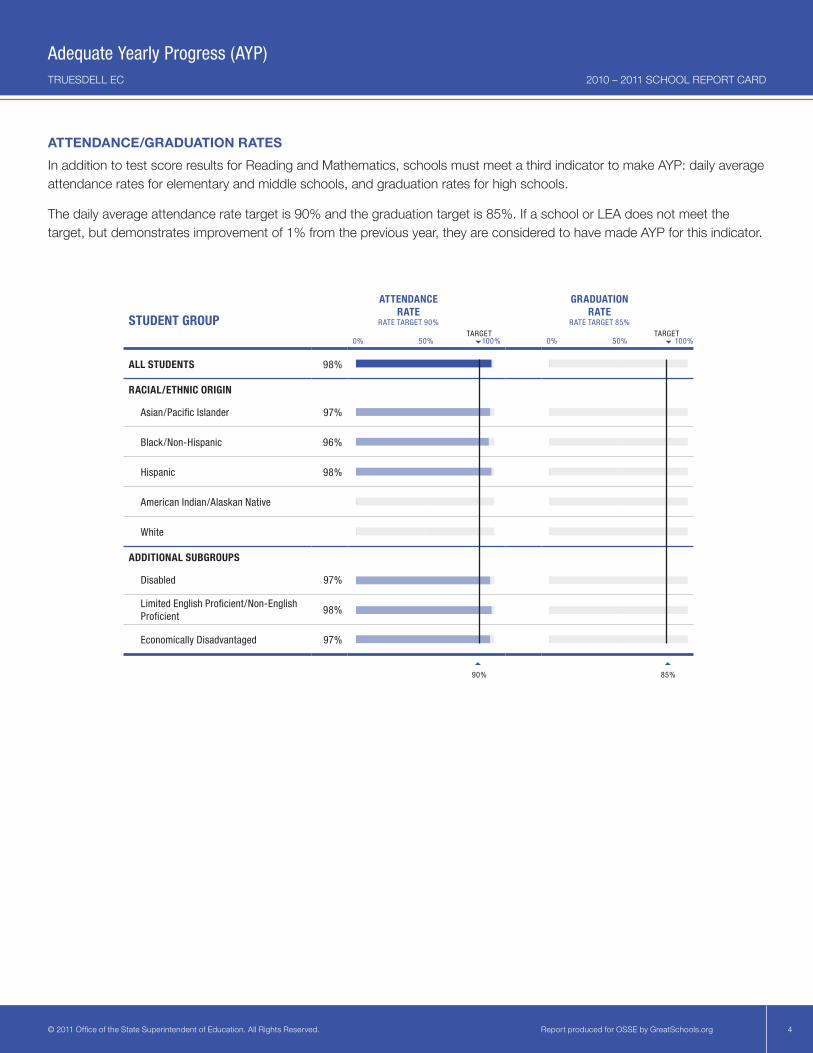
ALLSTUDENTS 98%
RACIAL/ETHNICORIGIN
Asian/Pacific Islander 97%
Black/Non-Hispanic 96%
Hispanic 98%
American Indian/Alaskan Native
White
ADDITIONALSUBGROUPS
Disabled 97%
Limited English Proficient/Non-English Proficient
98%
Economically Disadvantaged 97%
90%
85%
ATTENDANCE/GRADUATION RATESIn addition to test score results for Reading and Mathematics, schools must meet a third indicator to make AYP: daily average attendance rates for elementary and middle schools, and graduation rates for high schools.
The daily average attendance rate target is 90% and the graduation target is 85%. If a school or LEA does not meet the target, but demonstrates improvement of 1% from the previous year, they are considered to have made AYP for this indicator.
TRUESDELL EC
Adequate Yearly Progress (AYP)
TARGETTARGET
© 2011 Office of the State Superintendent of Education. All Rights Reserved. Report produced for OSSE by GreatSchools.org 5
2010 – 2011 SCHOOL REPORT CARD
ALL GRADES READING - ELEMENTARY
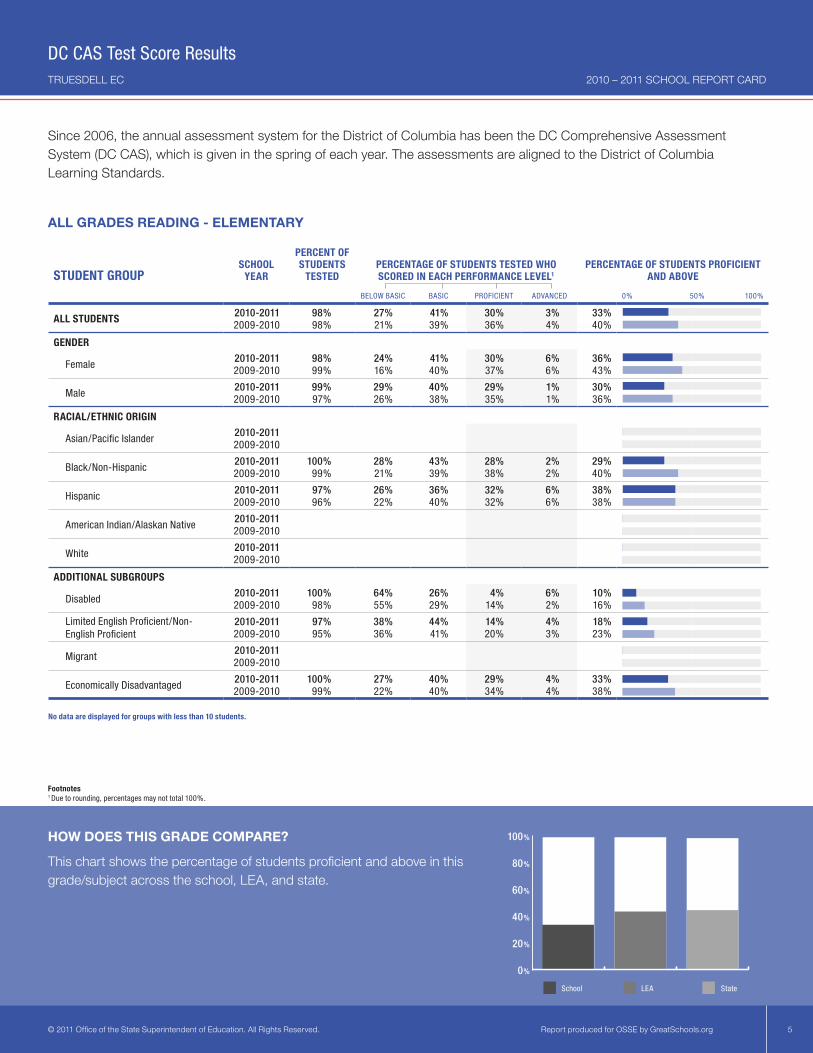
Since 2006, the annual assessment system for the District of Columbia has been the DC Comprehensive Assessment System (DC CAS), which is given in the spring of each year. The assessments are aligned to the District of Columbia Learning Standards.
HOW DOES THIS GRADE COMPARE?
This chart shows the percentage of students proficient and above in this grade/subject across the school, LEA, and state.
Footnotes1 Due to rounding, percentages may not total 100%.
TRUESDELL EC
DC CAS Test Score Results
STUDENTGROUPSCHOOL
YEAR
PERCENTOFSTUDENTS
TESTEDPERCENTAGEOFSTUDENTSTESTEDWHOSCOREDINEACHPERFORMANCELEVEL1
PERCENTAGEOFSTUDENTSPROFICIENTANDABOVE
BELOW BASIC BASIC PROFICIENT ADVANCED 0% 50% 100%
ALLSTUDENTS 2010-2011 98% 27% 41% 30% 3% 33%2009-2010 98% 21% 39% 36% 4% 40%
GENDER
Female2010-2011 98% 24% 41% 30% 6% 36%2009-2010 99% 16% 40% 37% 6% 43%
Male2010-2011 99% 29% 40% 29% 1% 30%2009-2010 97% 26% 38% 35% 1% 36%
RACIAL/ETHNICORIGIN
Asian/Pacific Islander2010-20112009-2010
Black/Non-Hispanic2010-2011 100% 28% 43% 28% 2% 29%2009-2010 99% 21% 39% 38% 2% 40%
Hispanic2010-2011 97% 26% 36% 32% 6% 38%2009-2010 96% 22% 40% 32% 6% 38%
American Indian/Alaskan Native2010-20112009-2010
White2010-20112009-2010
ADDITIONALSUBGROUPS
Disabled2010-2011 100% 64% 26% 4% 6% 10%2009-2010 98% 55% 29% 14% 2% 16%
Limited English Proficient/Non-English Proficient
2010-2011 97% 38% 44% 14% 4% 18%2009-2010 95% 36% 41% 20% 3% 23%
Migrant2010-20112009-2010
Economically Disadvantaged2010-2011 100% 27% 40% 29% 4% 33%2009-2010 99% 22% 40% 34% 4% 38%
Nodataaredisplayedforgroupswithlessthan10students.
School LEA State
100%
80%
60%
40%
20%
0%
© 2011 Office of the State Superintendent of Education. All Rights Reserved. Report produced for OSSE by GreatSchools.org 6
2010 – 2011 SCHOOL REPORT CARD
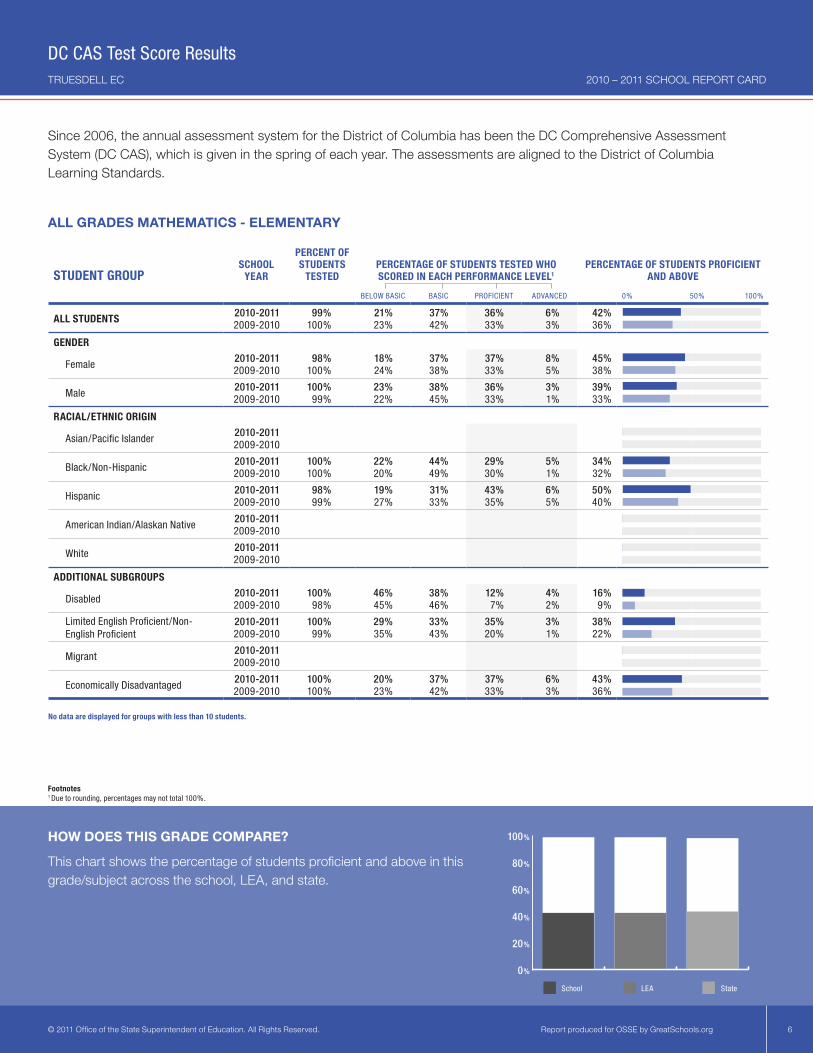
ALL GRADES MATHEMATICS - ELEMENTARY
Since 2006, the annual assessment system for the District of Columbia has been the DC Comprehensive Assessment System (DC CAS), which is given in the spring of each year. The assessments are aligned to the District of Columbia Learning Standards.
HOW DOES THIS GRADE COMPARE?
This chart shows the percentage of students proficient and above in this grade/subject across the school, LEA, and state.
TRUESDELL EC
DC CAS Test Score Results
Footnotes1 Due to rounding, percentages may not total 100%.
STUDENTGROUPSCHOOL
YEAR
PERCENTOFSTUDENTS
TESTEDPERCENTAGEOFSTUDENTSTESTEDWHOSCOREDINEACHPERFORMANCELEVEL1
PERCENTAGEOFSTUDENTSPROFICIENTANDABOVE
BELOW BASIC BASIC PROFICIENT ADVANCED 0% 50% 100%
ALLSTUDENTS 2010-2011 99% 21% 37% 36% 6% 42%2009-2010 100% 23% 42% 33% 3% 36%
GENDER
Female2010-2011 98% 18% 37% 37% 8% 45%2009-2010 100% 24% 38% 33% 5% 38%
Male2010-2011 100% 23% 38% 36% 3% 39%2009-2010 99% 22% 45% 33% 1% 33%
RACIAL/ETHNICORIGIN
Asian/Pacific Islander2010-20112009-2010
Black/Non-Hispanic2010-2011 100% 22% 44% 29% 5% 34%2009-2010 100% 20% 49% 30% 1% 32%
Hispanic2010-2011 98% 19% 31% 43% 6% 50%2009-2010 99% 27% 33% 35% 5% 40%
American Indian/Alaskan Native2010-20112009-2010
White2010-20112009-2010
ADDITIONALSUBGROUPS
Disabled2010-2011 100% 46% 38% 12% 4% 16%2009-2010 98% 45% 46% 7% 2% 9%
Limited English Proficient/Non-English Proficient
2010-2011 100% 29% 33% 35% 3% 38%2009-2010 99% 35% 43% 20% 1% 22%
Migrant2010-20112009-2010
Economically Disadvantaged2010-2011 100% 20% 37% 37% 6% 43%2009-2010 100% 23% 42% 33% 3% 36%
Nodataaredisplayedforgroupswithlessthan10students.
School LEA State
100%
80%
60%
40%
20%
0%
© 2011 Office of the State Superintendent of Education. All Rights Reserved. Report produced for OSSE by GreatSchools.org 7
2010 – 2011 SCHOOL REPORT CARD
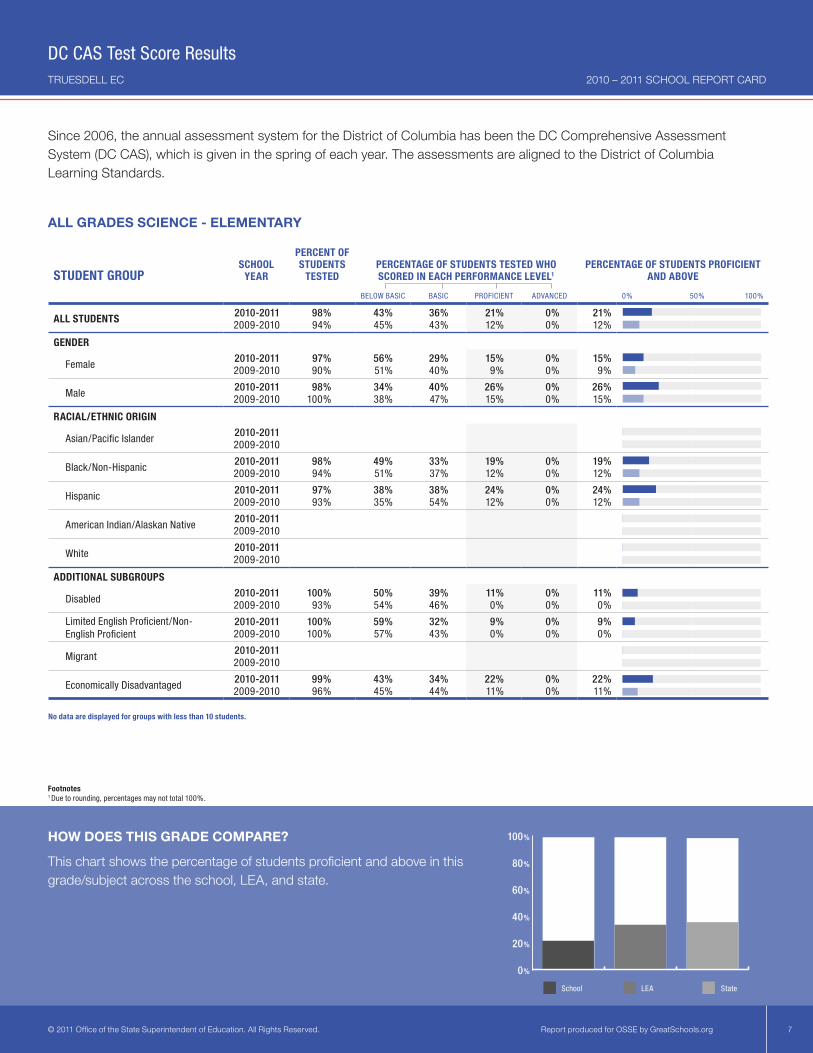
HOW DOES THIS GRADE COMPARE?
This chart shows the percentage of students proficient and above in this grade/subject across the school, LEA, and state.
Footnotes1 Due to rounding, percentages may not total 100%.
ALL GRADES SCIENCE - ELEMENTARY
Since 2006, the annual assessment system for the District of Columbia has been the DC Comprehensive Assessment System (DC CAS), which is given in the spring of each year. The assessments are aligned to the District of Columbia Learning Standards.
TRUESDELL EC
DC CAS Test Score Results
STUDENTGROUPSCHOOL
YEAR
PERCENTOFSTUDENTS
TESTEDPERCENTAGEOFSTUDENTSTESTEDWHOSCOREDINEACHPERFORMANCELEVEL1
PERCENTAGEOFSTUDENTSPROFICIENTANDABOVE
BELOW BASIC BASIC PROFICIENT ADVANCED 0% 50% 100%
ALLSTUDENTS 2010-2011 98% 43% 36% 21% 0% 21%2009-2010 94% 45% 43% 12% 0% 12%
GENDER
Female2010-2011 97% 56% 29% 15% 0% 15%2009-2010 90% 51% 40% 9% 0% 9%
Male2010-2011 98% 34% 40% 26% 0% 26%2009-2010 100% 38% 47% 15% 0% 15%
RACIAL/ETHNICORIGIN
Asian/Pacific Islander2010-20112009-2010
Black/Non-Hispanic2010-2011 98% 49% 33% 19% 0% 19%2009-2010 94% 51% 37% 12% 0% 12%
Hispanic2010-2011 97% 38% 38% 24% 0% 24%2009-2010 93% 35% 54% 12% 0% 12%
American Indian/Alaskan Native2010-20112009-2010
White2010-20112009-2010
ADDITIONALSUBGROUPS
Disabled2010-2011 100% 50% 39% 11% 0% 11%2009-2010 93% 54% 46% 0% 0% 0%
Limited English Proficient/Non-English Proficient
2010-2011 100% 59% 32% 9% 0% 9%2009-2010 100% 57% 43% 0% 0% 0%
Migrant2010-20112009-2010
Economically Disadvantaged2010-2011 99% 43% 34% 22% 0% 22%2009-2010 96% 45% 44% 11% 0% 11%
Nodataaredisplayedforgroupswithlessthan10students.
School LEA State
100%
80%
60%
40%
20%
0%
© 2011 Office of the State Superintendent of Education. All Rights Reserved. Report produced for OSSE by GreatSchools.org 8
2010 – 2011 SCHOOL REPORT CARD
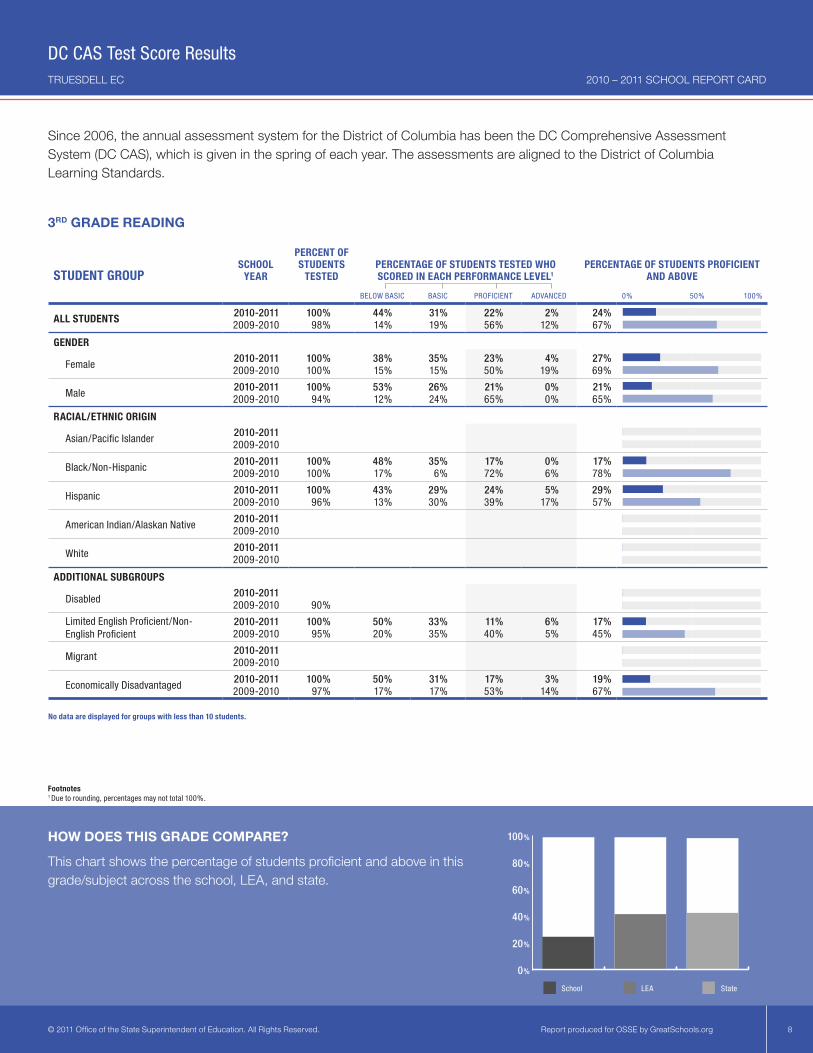
3RD GRADE READING
Since 2006, the annual assessment system for the District of Columbia has been the DC Comprehensive Assessment System (DC CAS), which is given in the spring of each year. The assessments are aligned to the District of Columbia Learning Standards.
HOW DOES THIS GRADE COMPARE?
This chart shows the percentage of students proficient and above in this grade/subject across the school, LEA, and state.
TRUESDELL EC
DC CAS Test Score Results
Footnotes1 Due to rounding, percentages may not total 100%.
STUDENTGROUPSCHOOL
YEAR
PERCENTOFSTUDENTS
TESTEDPERCENTAGEOFSTUDENTSTESTEDWHOSCOREDINEACHPERFORMANCELEVEL1
PERCENTAGEOFSTUDENTSPROFICIENTANDABOVE
BELOW BASIC BASIC PROFICIENT ADVANCED 0% 50% 100%
ALLSTUDENTS 2010-2011 100% 44% 31% 22% 2% 24%2009-2010 98% 14% 19% 56% 12% 67%
GENDER
Female2010-2011 100% 38% 35% 23% 4% 27%2009-2010 100% 15% 15% 50% 19% 69%
Male2010-2011 100% 53% 26% 21% 0% 21%2009-2010 94% 12% 24% 65% 0% 65%
RACIAL/ETHNICORIGIN
Asian/Pacific Islander2010-20112009-2010
Black/Non-Hispanic2010-2011 100% 48% 35% 17% 0% 17%2009-2010 100% 17% 6% 72% 6% 78%
Hispanic2010-2011 100% 43% 29% 24% 5% 29%2009-2010 96% 13% 30% 39% 17% 57%
American Indian/Alaskan Native2010-20112009-2010
White2010-20112009-2010
ADDITIONALSUBGROUPS
Disabled2010-20112009-2010 90%
Limited English Proficient/Non-English Proficient
2010-2011 100% 50% 33% 11% 6% 17%2009-2010 95% 20% 35% 40% 5% 45%
Migrant2010-20112009-2010
Economically Disadvantaged2010-2011 100% 50% 31% 17% 3% 19%2009-2010 97% 17% 17% 53% 14% 67%
Nodataaredisplayedforgroupswithlessthan10students.
School LEA State
100%
80%
60%
40%
20%
0%
© 2011 Office of the State Superintendent of Education. All Rights Reserved. Report produced for OSSE by GreatSchools.org 9
2010 – 2011 SCHOOL REPORT CARD
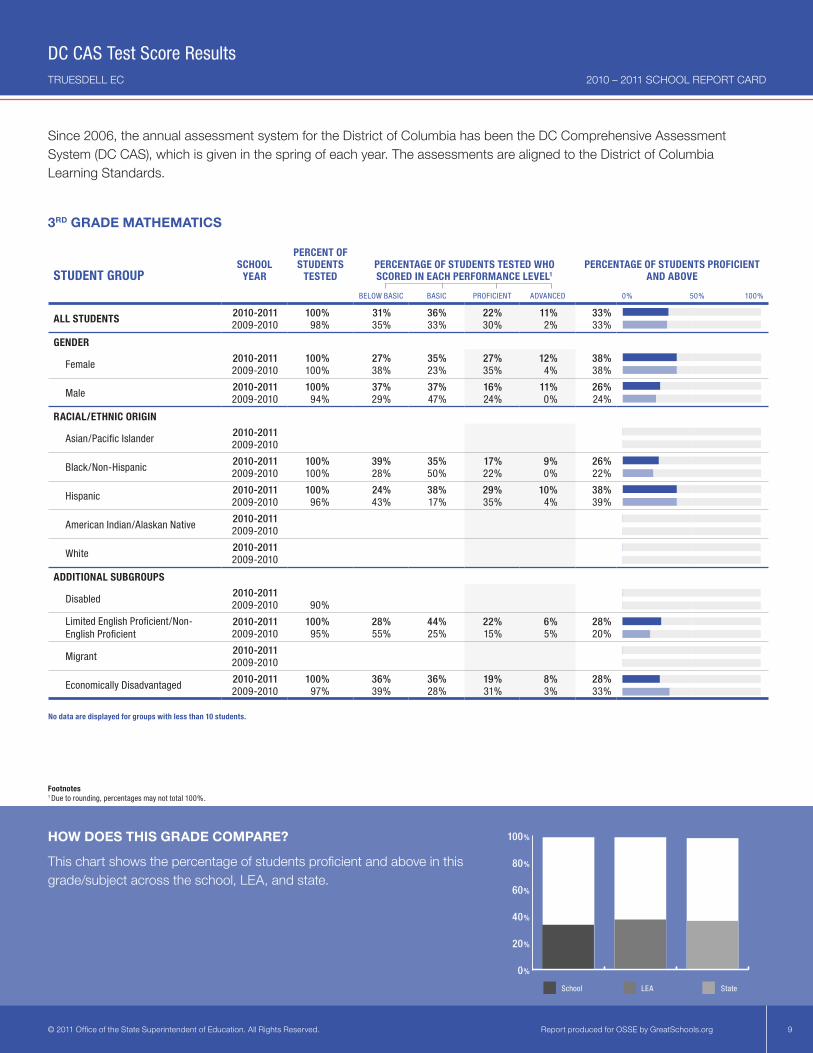
3RD GRADE MATHEMATICS
Since 2006, the annual assessment system for the District of Columbia has been the DC Comprehensive Assessment System (DC CAS), which is given in the spring of each year. The assessments are aligned to the District of Columbia Learning Standards.
HOW DOES THIS GRADE COMPARE?
This chart shows the percentage of students proficient and above in this grade/subject across the school, LEA, and state.
TRUESDELL EC
DC CAS Test Score Results
Footnotes1 Due to rounding, percentages may not total 100%.
STUDENTGROUPSCHOOL
YEAR
PERCENTOFSTUDENTS
TESTEDPERCENTAGEOFSTUDENTSTESTEDWHOSCOREDINEACHPERFORMANCELEVEL1
PERCENTAGEOFSTUDENTSPROFICIENTANDABOVE
BELOW BASIC BASIC PROFICIENT ADVANCED 0% 50% 100%
ALLSTUDENTS 2010-2011 100% 31% 36% 22% 11% 33%2009-2010 98% 35% 33% 30% 2% 33%
GENDER
Female2010-2011 100% 27% 35% 27% 12% 38%2009-2010 100% 38% 23% 35% 4% 38%
Male2010-2011 100% 37% 37% 16% 11% 26%2009-2010 94% 29% 47% 24% 0% 24%
RACIAL/ETHNICORIGIN
Asian/Pacific Islander2010-20112009-2010
Black/Non-Hispanic2010-2011 100% 39% 35% 17% 9% 26%2009-2010 100% 28% 50% 22% 0% 22%
Hispanic2010-2011 100% 24% 38% 29% 10% 38%2009-2010 96% 43% 17% 35% 4% 39%
American Indian/Alaskan Native2010-20112009-2010
White2010-20112009-2010
ADDITIONALSUBGROUPS
Disabled2010-20112009-2010 90%
Limited English Proficient/Non-English Proficient
2010-2011 100% 28% 44% 22% 6% 28%2009-2010 95% 55% 25% 15% 5% 20%
Migrant2010-20112009-2010
Economically Disadvantaged2010-2011 100% 36% 36% 19% 8% 28%2009-2010 97% 39% 28% 31% 3% 33%
Nodataaredisplayedforgroupswithlessthan10students.
School LEA State
100%
80%
60%
40%
20%
0%
© 2011 Office of the State Superintendent of Education. All Rights Reserved. Report produced for OSSE by GreatSchools.org 10
2010 – 2011 SCHOOL REPORT CARD
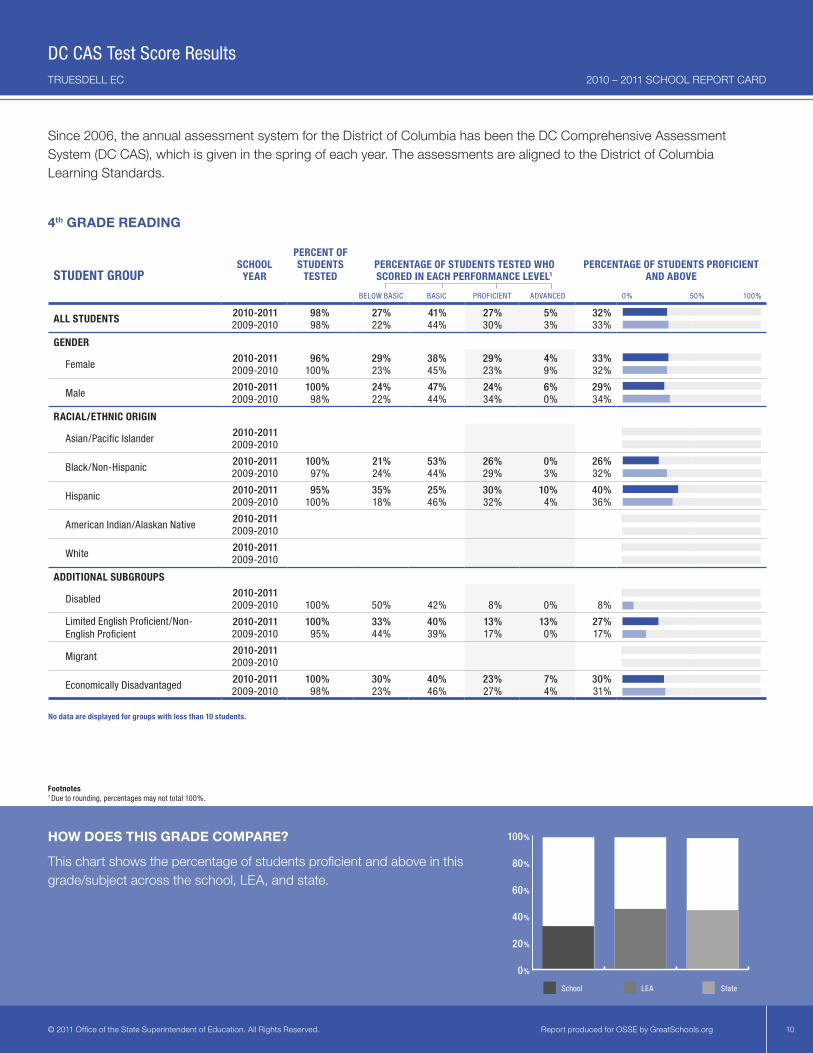
4th GRADE READING
Since 2006, the annual assessment system for the District of Columbia has been the DC Comprehensive Assessment System (DC CAS), which is given in the spring of each year. The assessments are aligned to the District of Columbia Learning Standards.
HOW DOES THIS GRADE COMPARE?
This chart shows the percentage of students proficient and above in this grade/subject across the school, LEA, and state.
TRUESDELL EC
DC CAS Test Score Results
Footnotes1 Due to rounding, percentages may not total 100%.
STUDENTGROUPSCHOOL
YEAR
PERCENTOFSTUDENTS
TESTEDPERCENTAGEOFSTUDENTSTESTEDWHOSCOREDINEACHPERFORMANCELEVEL1
PERCENTAGEOFSTUDENTSPROFICIENTANDABOVE
BELOW BASIC BASIC PROFICIENT ADVANCED 0% 50% 100%
ALLSTUDENTS 2010-2011 98% 27% 41% 27% 5% 32%2009-2010 98% 22% 44% 30% 3% 33%
GENDER
Female2010-2011 96% 29% 38% 29% 4% 33%2009-2010 100% 23% 45% 23% 9% 32%
Male2010-2011 100% 24% 47% 24% 6% 29%2009-2010 98% 22% 44% 34% 0% 34%
RACIAL/ETHNICORIGIN
Asian/Pacific Islander2010-20112009-2010
Black/Non-Hispanic2010-2011 100% 21% 53% 26% 0% 26%2009-2010 97% 24% 44% 29% 3% 32%
Hispanic2010-2011 95% 35% 25% 30% 10% 40%2009-2010 100% 18% 46% 32% 4% 36%
American Indian/Alaskan Native2010-20112009-2010
White2010-20112009-2010
ADDITIONALSUBGROUPS
Disabled2010-20112009-2010 100% 50% 42% 8% 0% 8%
Limited English Proficient/Non-English Proficient
2010-2011 100% 33% 40% 13% 13% 27%2009-2010 95% 44% 39% 17% 0% 17%
Migrant2010-20112009-2010
Economically Disadvantaged2010-2011 100% 30% 40% 23% 7% 30%2009-2010 98% 23% 46% 27% 4% 31%
Nodataaredisplayedforgroupswithlessthan10students.
School LEA State
100%
80%
60%
40%
20%
0%
© 2011 Office of the State Superintendent of Education. All Rights Reserved. Report produced for OSSE by GreatSchools.org 11
2010 – 2011 SCHOOL REPORT CARD
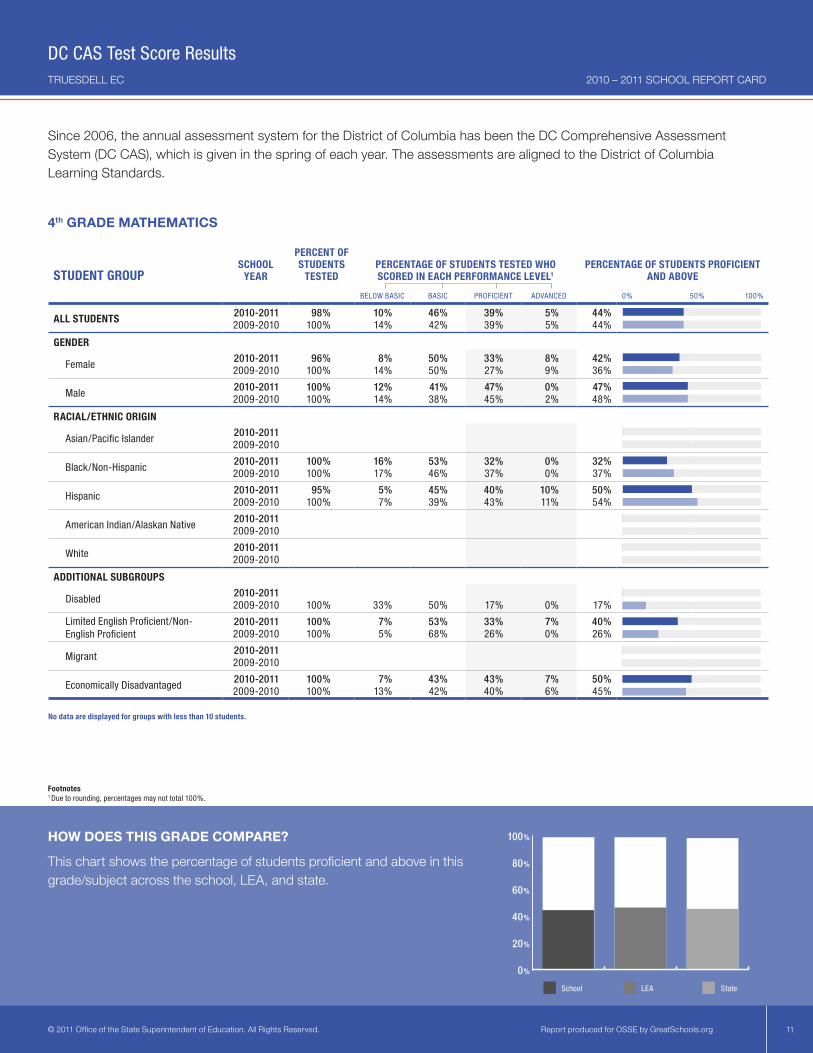
4th GRADE MATHEMATICS
Since 2006, the annual assessment system for the District of Columbia has been the DC Comprehensive Assessment System (DC CAS), which is given in the spring of each year. The assessments are aligned to the District of Columbia Learning Standards.
HOW DOES THIS GRADE COMPARE?
This chart shows the percentage of students proficient and above in this grade/subject across the school, LEA, and state.
TRUESDELL EC
DC CAS Test Score Results
Footnotes1 Due to rounding, percentages may not total 100%.
STUDENTGROUPSCHOOL
YEAR
PERCENTOFSTUDENTS
TESTEDPERCENTAGEOFSTUDENTSTESTEDWHOSCOREDINEACHPERFORMANCELEVEL1
PERCENTAGEOFSTUDENTSPROFICIENTANDABOVE
BELOW BASIC BASIC PROFICIENT ADVANCED 0% 50% 100%
ALLSTUDENTS 2010-2011 98% 10% 46% 39% 5% 44%2009-2010 100% 14% 42% 39% 5% 44%
GENDER
Female2010-2011 96% 8% 50% 33% 8% 42%2009-2010 100% 14% 50% 27% 9% 36%
Male2010-2011 100% 12% 41% 47% 0% 47%2009-2010 100% 14% 38% 45% 2% 48%
RACIAL/ETHNICORIGIN
Asian/Pacific Islander2010-20112009-2010
Black/Non-Hispanic2010-2011 100% 16% 53% 32% 0% 32%2009-2010 100% 17% 46% 37% 0% 37%
Hispanic2010-2011 95% 5% 45% 40% 10% 50%2009-2010 100% 7% 39% 43% 11% 54%
American Indian/Alaskan Native2010-20112009-2010
White2010-20112009-2010
ADDITIONALSUBGROUPS
Disabled2010-20112009-2010 100% 33% 50% 17% 0% 17%
Limited English Proficient/Non-English Proficient
2010-2011 100% 7% 53% 33% 7% 40%2009-2010 100% 5% 68% 26% 0% 26%
Migrant2010-20112009-2010
Economically Disadvantaged2010-2011 100% 7% 43% 43% 7% 50%2009-2010 100% 13% 42% 40% 6% 45%
Nodataaredisplayedforgroupswithlessthan10students.
School LEA State
100%
80%
60%
40%
20%
0%
© 2011 Office of the State Superintendent of Education. All Rights Reserved. Report produced for OSSE by GreatSchools.org 12
2010 – 2011 SCHOOL REPORT CARD
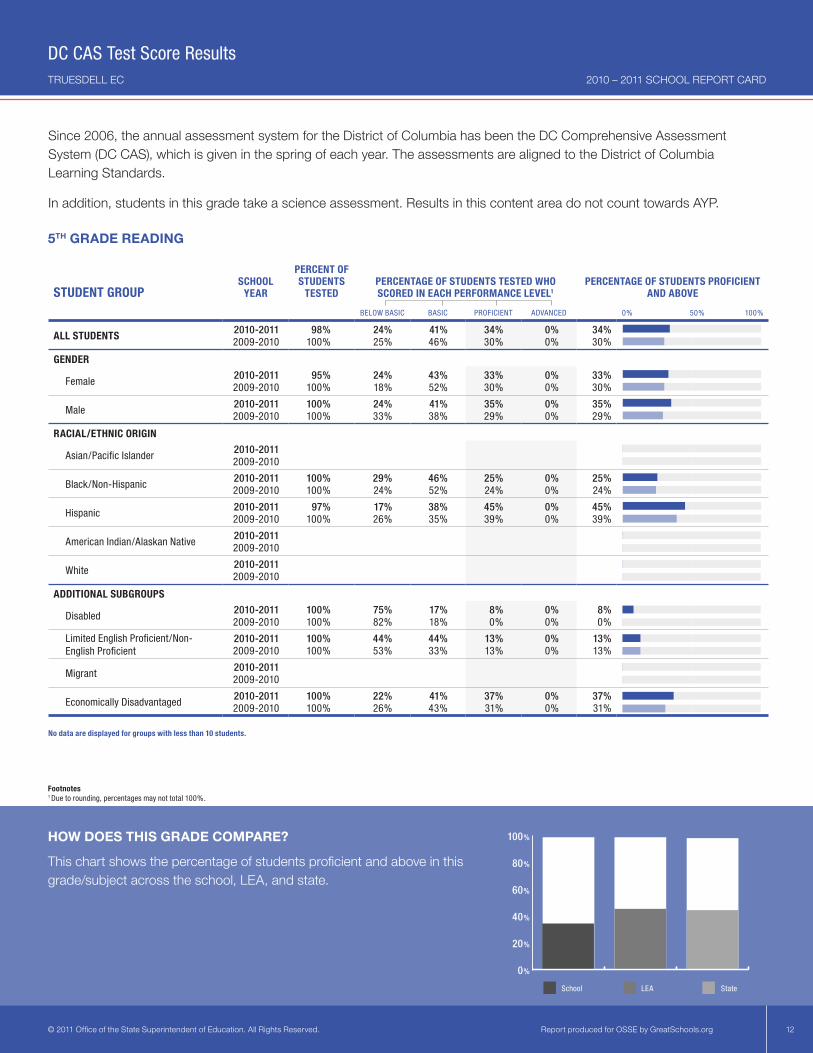
Since 2006, the annual assessment system for the District of Columbia has been the DC Comprehensive Assessment System (DC CAS), which is given in the spring of each year. The assessments are aligned to the District of Columbia Learning Standards.
In addition, students in this grade take a science assessment. Results in this content area do not count towards AYP.
5TH GRADE READING
TRUESDELL EC
DC CAS Test Score Results
HOW DOES THIS GRADE COMPARE?
This chart shows the percentage of students proficient and above in this grade/subject across the school, LEA, and state.
Footnotes1 Due to rounding, percentages may not total 100%.
STUDENTGROUPSCHOOL
YEAR
PERCENTOFSTUDENTS
TESTEDPERCENTAGEOFSTUDENTSTESTEDWHOSCOREDINEACHPERFORMANCELEVEL1
PERCENTAGEOFSTUDENTSPROFICIENTANDABOVE
BELOW BASIC BASIC PROFICIENT ADVANCED 0% 50% 100%
ALLSTUDENTS 2010-2011 98% 24% 41% 34% 0% 34%2009-2010 100% 25% 46% 30% 0% 30%
GENDER
Female2010-2011 95% 24% 43% 33% 0% 33%2009-2010 100% 18% 52% 30% 0% 30%
Male2010-2011 100% 24% 41% 35% 0% 35%2009-2010 100% 33% 38% 29% 0% 29%
RACIAL/ETHNICORIGIN
Asian/Pacific Islander2010-20112009-2010
Black/Non-Hispanic2010-2011 100% 29% 46% 25% 0% 25%2009-2010 100% 24% 52% 24% 0% 24%
Hispanic2010-2011 97% 17% 38% 45% 0% 45%2009-2010 100% 26% 35% 39% 0% 39%
American Indian/Alaskan Native2010-20112009-2010
White2010-20112009-2010
ADDITIONALSUBGROUPS
Disabled2010-2011 100% 75% 17% 8% 0% 8%2009-2010 100% 82% 18% 0% 0% 0%
Limited English Proficient/Non-English Proficient
2010-2011 100% 44% 44% 13% 0% 13%2009-2010 100% 53% 33% 13% 0% 13%
Migrant2010-20112009-2010
Economically Disadvantaged2010-2011 100% 22% 41% 37% 0% 37%2009-2010 100% 26% 43% 31% 0% 31%
Nodataaredisplayedforgroupswithlessthan10students.
School LEA State
100%
80%
60%
40%
20%
0%
© 2011 Office of the State Superintendent of Education. All Rights Reserved. Report produced for OSSE by GreatSchools.org 13
2010 – 2011 SCHOOL REPORT CARD
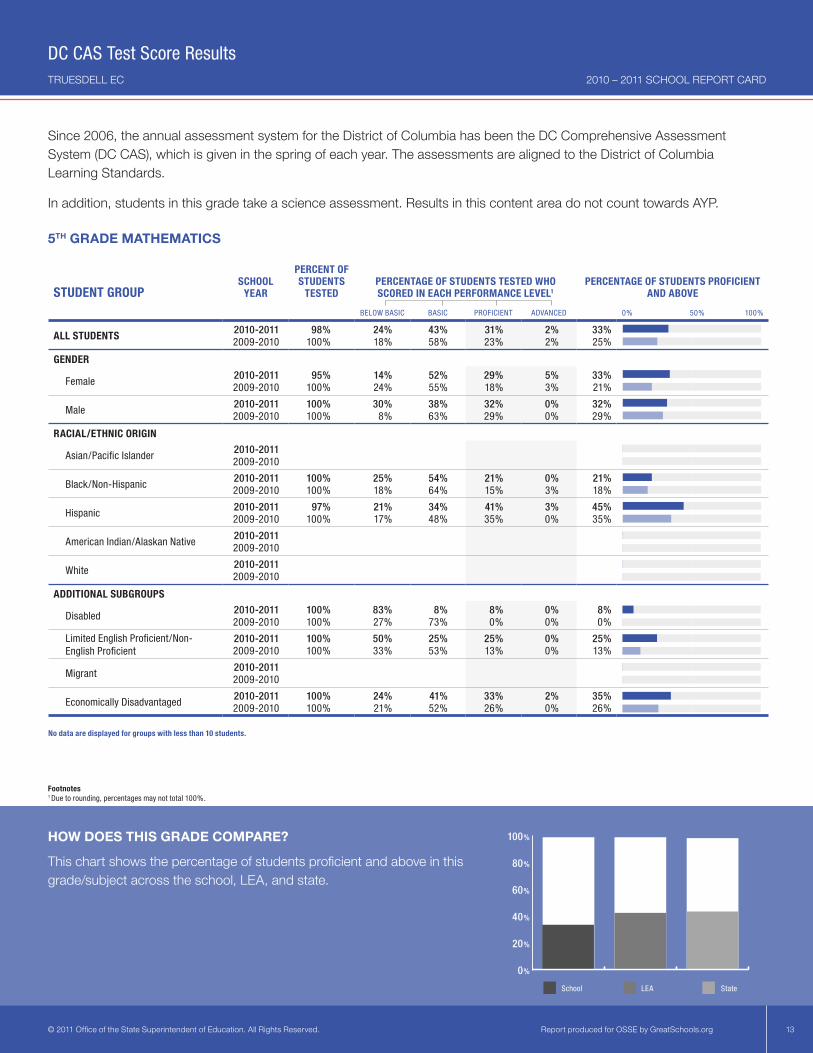
Since 2006, the annual assessment system for the District of Columbia has been the DC Comprehensive Assessment System (DC CAS), which is given in the spring of each year. The assessments are aligned to the District of Columbia Learning Standards.
In addition, students in this grade take a science assessment. Results in this content area do not count towards AYP.
5TH GRADE MATHEMATICS
TRUESDELL EC
DC CAS Test Score Results
HOW DOES THIS GRADE COMPARE?
This chart shows the percentage of students proficient and above in this grade/subject across the school, LEA, and state.
Footnotes1 Due to rounding, percentages may not total 100%.
STUDENTGROUPSCHOOL
YEAR
PERCENTOFSTUDENTS
TESTEDPERCENTAGEOFSTUDENTSTESTEDWHOSCOREDINEACHPERFORMANCELEVEL1
PERCENTAGEOFSTUDENTSPROFICIENTANDABOVE
BELOW BASIC BASIC PROFICIENT ADVANCED 0% 50% 100%
ALLSTUDENTS 2010-2011 98% 24% 43% 31% 2% 33%2009-2010 100% 18% 58% 23% 2% 25%
GENDER
Female2010-2011 95% 14% 52% 29% 5% 33%2009-2010 100% 24% 55% 18% 3% 21%
Male2010-2011 100% 30% 38% 32% 0% 32%2009-2010 100% 8% 63% 29% 0% 29%
RACIAL/ETHNICORIGIN
Asian/Pacific Islander2010-20112009-2010
Black/Non-Hispanic2010-2011 100% 25% 54% 21% 0% 21%2009-2010 100% 18% 64% 15% 3% 18%
Hispanic2010-2011 97% 21% 34% 41% 3% 45%2009-2010 100% 17% 48% 35% 0% 35%
American Indian/Alaskan Native2010-20112009-2010
White2010-20112009-2010
ADDITIONALSUBGROUPS
Disabled2010-2011 100% 83% 8% 8% 0% 8%2009-2010 100% 27% 73% 0% 0% 0%
Limited English Proficient/Non-English Proficient
2010-2011 100% 50% 25% 25% 0% 25%2009-2010 100% 33% 53% 13% 0% 13%
Migrant2010-20112009-2010
Economically Disadvantaged2010-2011 100% 24% 41% 33% 2% 35%2009-2010 100% 21% 52% 26% 0% 26%
Nodataaredisplayedforgroupswithlessthan10students.
School LEA State
100%
80%
60%
40%
20%
0%
© 2011 Office of the State Superintendent of Education. All Rights Reserved. Report produced for OSSE by GreatSchools.org 14
2010 – 2011 SCHOOL REPORT CARD
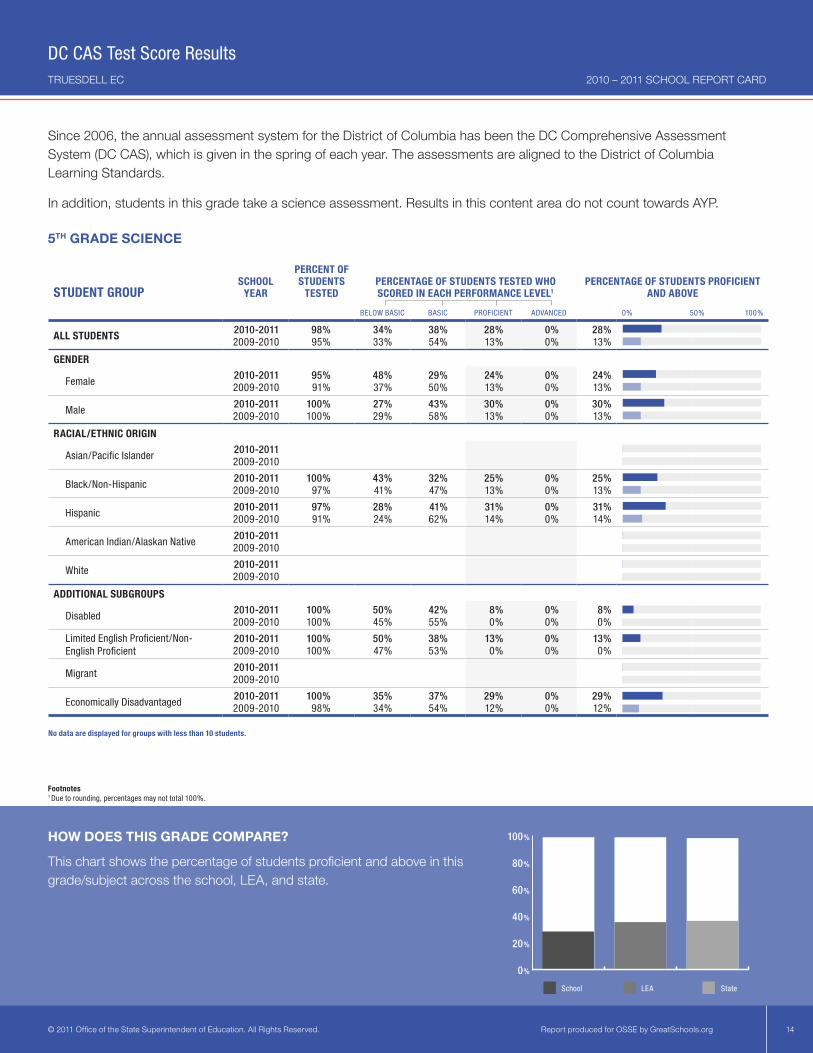
Since 2006, the annual assessment system for the District of Columbia has been the DC Comprehensive Assessment System (DC CAS), which is given in the spring of each year. The assessments are aligned to the District of Columbia Learning Standards.
In addition, students in this grade take a science assessment. Results in this content area do not count towards AYP.
5TH GRADE SCIENCE
TRUESDELL EC
DC CAS Test Score Results
HOW DOES THIS GRADE COMPARE?
This chart shows the percentage of students proficient and above in this grade/subject across the school, LEA, and state.
Footnotes1 Due to rounding, percentages may not total 100%.
STUDENTGROUPSCHOOL
YEAR
PERCENTOFSTUDENTS
TESTEDPERCENTAGEOFSTUDENTSTESTEDWHOSCOREDINEACHPERFORMANCELEVEL1
PERCENTAGEOFSTUDENTSPROFICIENTANDABOVE
BELOW BASIC BASIC PROFICIENT ADVANCED 0% 50% 100%
ALLSTUDENTS 2010-2011 98% 34% 38% 28% 0% 28%2009-2010 95% 33% 54% 13% 0% 13%
GENDER
Female2010-2011 95% 48% 29% 24% 0% 24%2009-2010 91% 37% 50% 13% 0% 13%
Male2010-2011 100% 27% 43% 30% 0% 30%2009-2010 100% 29% 58% 13% 0% 13%
RACIAL/ETHNICORIGIN
Asian/Pacific Islander2010-20112009-2010
Black/Non-Hispanic2010-2011 100% 43% 32% 25% 0% 25%2009-2010 97% 41% 47% 13% 0% 13%
Hispanic2010-2011 97% 28% 41% 31% 0% 31%2009-2010 91% 24% 62% 14% 0% 14%
American Indian/Alaskan Native2010-20112009-2010
White2010-20112009-2010
ADDITIONALSUBGROUPS
Disabled2010-2011 100% 50% 42% 8% 0% 8%2009-2010 100% 45% 55% 0% 0% 0%
Limited English Proficient/Non-English Proficient
2010-2011 100% 50% 38% 13% 0% 13%2009-2010 100% 47% 53% 0% 0% 0%
Migrant2010-20112009-2010
Economically Disadvantaged2010-2011 100% 35% 37% 29% 0% 29%2009-2010 98% 34% 54% 12% 0% 12%
Nodataaredisplayedforgroupswithlessthan10students.
School LEA State
100%
80%
60%
40%
20%
0%
© 2011 Office of the State Superintendent of Education. All Rights Reserved. Report produced for OSSE by GreatSchools.org 15
2010 – 2011 SCHOOL REPORT CARD
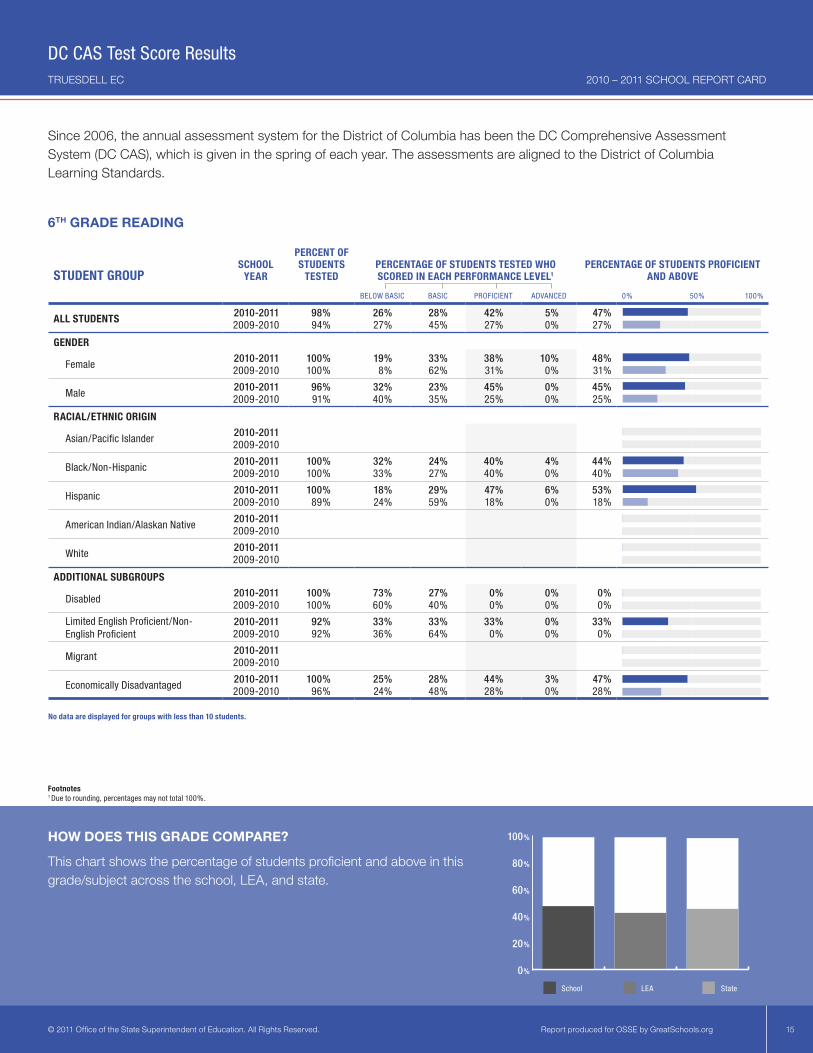
6TH GRADE READING
Since 2006, the annual assessment system for the District of Columbia has been the DC Comprehensive Assessment System (DC CAS), which is given in the spring of each year. The assessments are aligned to the District of Columbia Learning Standards.
TRUESDELL EC
DC CAS Test Score Results
HOW DOES THIS GRADE COMPARE?
This chart shows the percentage of students proficient and above in this grade/subject across the school, LEA, and state.
Footnotes1 Due to rounding, percentages may not total 100%.
STUDENTGROUPSCHOOL
YEAR
PERCENTOFSTUDENTS
TESTEDPERCENTAGEOFSTUDENTSTESTEDWHOSCOREDINEACHPERFORMANCELEVEL1
PERCENTAGEOFSTUDENTSPROFICIENTANDABOVE
BELOW BASIC BASIC PROFICIENT ADVANCED 0% 50% 100%
ALLSTUDENTS 2010-2011 98% 26% 28% 42% 5% 47%2009-2010 94% 27% 45% 27% 0% 27%
GENDER
Female2010-2011 100% 19% 33% 38% 10% 48%2009-2010 100% 8% 62% 31% 0% 31%
Male2010-2011 96% 32% 23% 45% 0% 45%2009-2010 91% 40% 35% 25% 0% 25%
RACIAL/ETHNICORIGIN
Asian/Pacific Islander2010-20112009-2010
Black/Non-Hispanic2010-2011 100% 32% 24% 40% 4% 44%2009-2010 100% 33% 27% 40% 0% 40%
Hispanic2010-2011 100% 18% 29% 47% 6% 53%2009-2010 89% 24% 59% 18% 0% 18%
American Indian/Alaskan Native2010-20112009-2010
White2010-20112009-2010
ADDITIONALSUBGROUPS
Disabled2010-2011 100% 73% 27% 0% 0% 0%2009-2010 100% 60% 40% 0% 0% 0%
Limited English Proficient/Non-English Proficient
2010-2011 92% 33% 33% 33% 0% 33%2009-2010 92% 36% 64% 0% 0% 0%
Migrant2010-20112009-2010
Economically Disadvantaged2010-2011 100% 25% 28% 44% 3% 47%2009-2010 96% 24% 48% 28% 0% 28%
Nodataaredisplayedforgroupswithlessthan10students.
School LEA State
100%
80%
60%
40%
20%
0%
© 2011 Office of the State Superintendent of Education. All Rights Reserved. Report produced for OSSE by GreatSchools.org 16
2010 – 2011 SCHOOL REPORT CARD
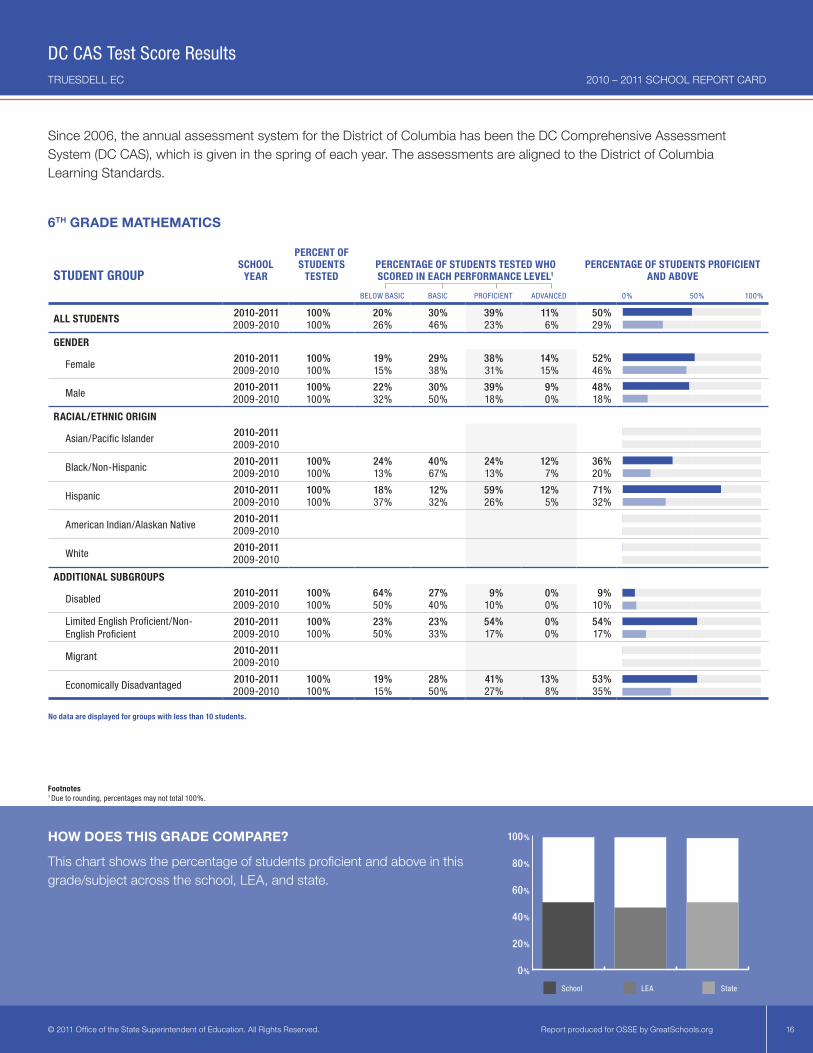
6TH GRADE MATHEMATICS
Since 2006, the annual assessment system for the District of Columbia has been the DC Comprehensive Assessment System (DC CAS), which is given in the spring of each year. The assessments are aligned to the District of Columbia Learning Standards.
TRUESDELL EC
DC CAS Test Score Results
HOW DOES THIS GRADE COMPARE?
This chart shows the percentage of students proficient and above in this grade/subject across the school, LEA, and state.
Footnotes1 Due to rounding, percentages may not total 100%.
STUDENTGROUPSCHOOL
YEAR
PERCENTOFSTUDENTS
TESTEDPERCENTAGEOFSTUDENTSTESTEDWHOSCOREDINEACHPERFORMANCELEVEL1
PERCENTAGEOFSTUDENTSPROFICIENTANDABOVE
BELOW BASIC BASIC PROFICIENT ADVANCED 0% 50% 100%
ALLSTUDENTS 2010-2011 100% 20% 30% 39% 11% 50%2009-2010 100% 26% 46% 23% 6% 29%
GENDER
Female2010-2011 100% 19% 29% 38% 14% 52%2009-2010 100% 15% 38% 31% 15% 46%
Male2010-2011 100% 22% 30% 39% 9% 48%2009-2010 100% 32% 50% 18% 0% 18%
RACIAL/ETHNICORIGIN
Asian/Pacific Islander2010-20112009-2010
Black/Non-Hispanic2010-2011 100% 24% 40% 24% 12% 36%2009-2010 100% 13% 67% 13% 7% 20%
Hispanic2010-2011 100% 18% 12% 59% 12% 71%2009-2010 100% 37% 32% 26% 5% 32%
American Indian/Alaskan Native2010-20112009-2010
White2010-20112009-2010
ADDITIONALSUBGROUPS
Disabled2010-2011 100% 64% 27% 9% 0% 9%2009-2010 100% 50% 40% 10% 0% 10%
Limited English Proficient/Non-English Proficient
2010-2011 100% 23% 23% 54% 0% 54%2009-2010 100% 50% 33% 17% 0% 17%
Migrant2010-20112009-2010
Economically Disadvantaged2010-2011 100% 19% 28% 41% 13% 53%2009-2010 100% 15% 50% 27% 8% 35%
Nodataaredisplayedforgroupswithlessthan10students.
School LEA State
100%
80%
60%
40%
20%
0%
© 2011 Office of the State Superintendent of Education. All Rights Reserved. Report produced for OSSE by GreatSchools.org 17
2010 – 2011 SCHOOL REPORT CARD
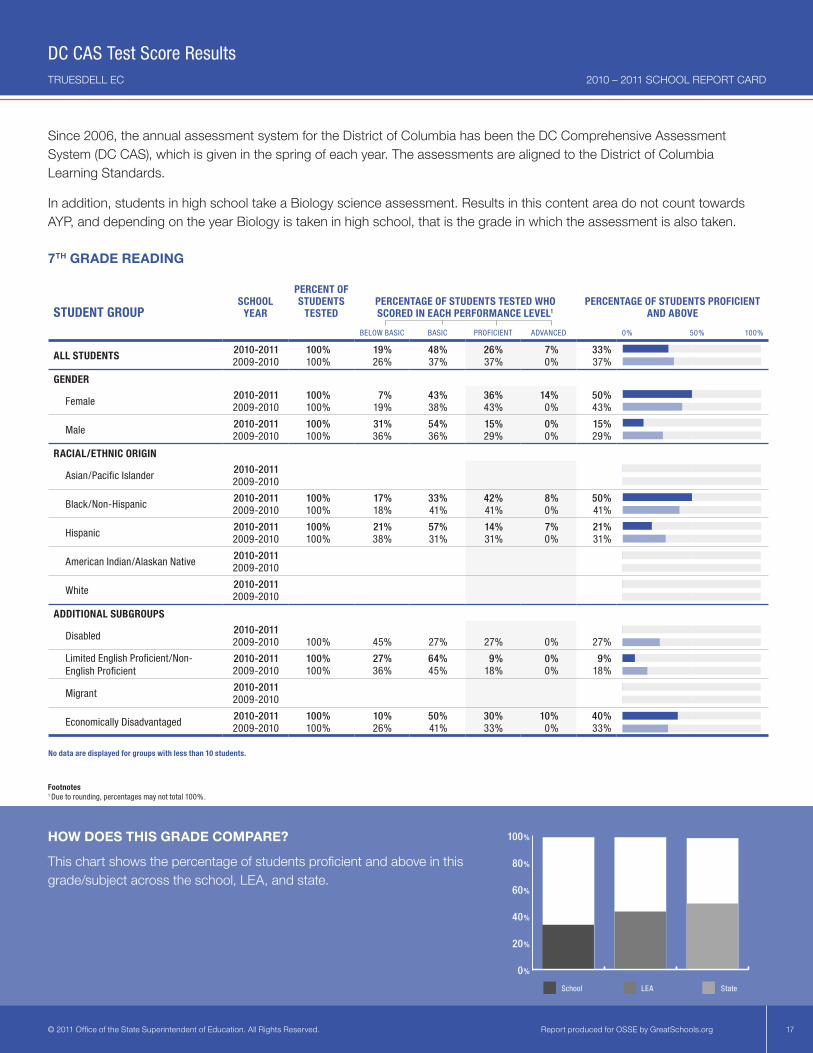
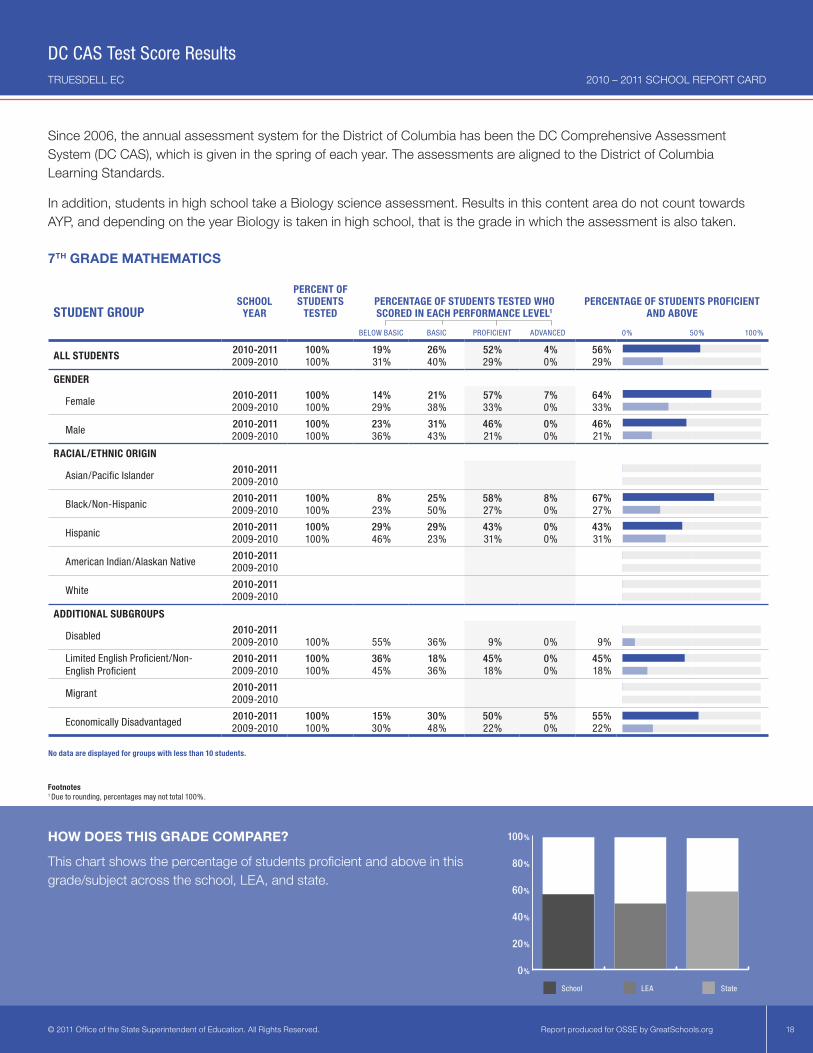
Since 2006, the annual assessment system for the District of Columbia has been the DC Comprehensive Assessment System (DC CAS), which is given in the spring of each year. The assessments are aligned to the District of Columbia Learning Standards.
In addition, students in high school take a Biology science assessment. Results in this content area do not count towards AYP, and depending on the year Biology is taken in high school, that is the grade in which the assessment is also taken.
7TH GRADE READING
TRUESDELL EC
DC CAS Test Score Results
Footnotes1 Due to rounding, percentages may not total 100%.
HOW DOES THIS GRADE COMPARE?
This chart shows the percentage of students proficient and above in this grade/subject across the school, LEA, and state.
STUDENTGROUPSCHOOL
YEAR
PERCENTOFSTUDENTS
TESTEDPERCENTAGEOFSTUDENTSTESTEDWHOSCOREDINEACHPERFORMANCELEVEL1
PERCENTAGEOFSTUDENTSPROFICIENTANDABOVE
BELOW BASIC BASIC PROFICIENT ADVANCED 0% 50% 100%
ALLSTUDENTS 2010-2011 100% 19% 48% 26% 7% 33%2009-2010 100% 26% 37% 37% 0% 37%
GENDER
Female2010-2011 100% 7% 43% 36% 14% 50%2009-2010 100% 19% 38% 43% 0% 43%
Male2010-2011 100% 31% 54% 15% 0% 15%2009-2010 100% 36% 36% 29% 0% 29%
RACIAL/ETHNICORIGIN
Asian/Pacific Islander2010-20112009-2010
Black/Non-Hispanic2010-2011 100% 17% 33% 42% 8% 50%2009-2010 100% 18% 41% 41% 0% 41%
Hispanic2010-2011 100% 21% 57% 14% 7% 21%2009-2010 100% 38% 31% 31% 0% 31%
American Indian/Alaskan Native2010-20112009-2010
White2010-20112009-2010
ADDITIONALSUBGROUPS
Disabled2010-20112009-2010 100% 45% 27% 27% 0% 27%
Limited English Proficient/Non-English Proficient
2010-2011 100% 27% 64% 9% 0% 9%2009-2010 100% 36% 45% 18% 0% 18%
Migrant2010-20112009-2010
Economically Disadvantaged2010-2011 100% 10% 50% 30% 10% 40%2009-2010 100% 26% 41% 33% 0% 33%
Nodataaredisplayedforgroupswithlessthan10students.
School LEA State
100%
80%
60%
40%
20%
0%
© 2011 Office of the State Superintendent of Education. All Rights Reserved. Report produced for OSSE by GreatSchools.org 18
2010 – 2011 SCHOOL REPORT CARD
Since 2006, the annual assessment system for the District of Columbia has been the DC Comprehensive Assessment System (DC CAS), which is given in the spring of each year. The assessments are aligned to the District of Columbia Learning Standards.
In addition, students in high school take a Biology science assessment. Results in this content area do not count towards AYP, and depending on the year Biology is taken in high school, that is the grade in which the assessment is also taken.
7TH GRADE MATHEMATICS
TRUESDELL EC
DC CAS Test Score Results
Footnotes1 Due to rounding, percentages may not total 100%.
HOW DOES THIS GRADE COMPARE?
This chart shows the percentage of students proficient and above in this grade/subject across the school, LEA, and state.
STUDENTGROUPSCHOOL
YEAR
PERCENTOFSTUDENTS
TESTEDPERCENTAGEOFSTUDENTSTESTEDWHOSCOREDINEACHPERFORMANCELEVEL1
PERCENTAGEOFSTUDENTSPROFICIENTANDABOVE
BELOW BASIC BASIC PROFICIENT ADVANCED 0% 50% 100%
ALLSTUDENTS 2010-2011 100% 19% 26% 52% 4% 56%2009-2010 100% 31% 40% 29% 0% 29%
GENDER
Female2010-2011 100% 14% 21% 57% 7% 64%2009-2010 100% 29% 38% 33% 0% 33%
Male2010-2011 100% 23% 31% 46% 0% 46%2009-2010 100% 36% 43% 21% 0% 21%
RACIAL/ETHNICORIGIN
Asian/Pacific Islander2010-20112009-2010
Black/Non-Hispanic2010-2011 100% 8% 25% 58% 8% 67%2009-2010 100% 23% 50% 27% 0% 27%
Hispanic2010-2011 100% 29% 29% 43% 0% 43%2009-2010 100% 46% 23% 31% 0% 31%
American Indian/Alaskan Native2010-20112009-2010
White2010-20112009-2010
ADDITIONALSUBGROUPS
Disabled2010-20112009-2010 100% 55% 36% 9% 0% 9%
Limited English Proficient/Non-English Proficient
2010-2011 100% 36% 18% 45% 0% 45%2009-2010 100% 45% 36% 18% 0% 18%
Migrant2010-20112009-2010
Economically Disadvantaged2010-2011 100% 15% 30% 50% 5% 55%2009-2010 100% 30% 48% 22% 0% 22%
Nodataaredisplayedforgroupswithlessthan10students.
School LEA State
100%
80%
60%
40%
20%
0%
© 2011 Office of the State Superintendent of Education. All Rights Reserved. Report produced for OSSE by GreatSchools.org 19
2010 – 2011 SCHOOL REPORT CARD
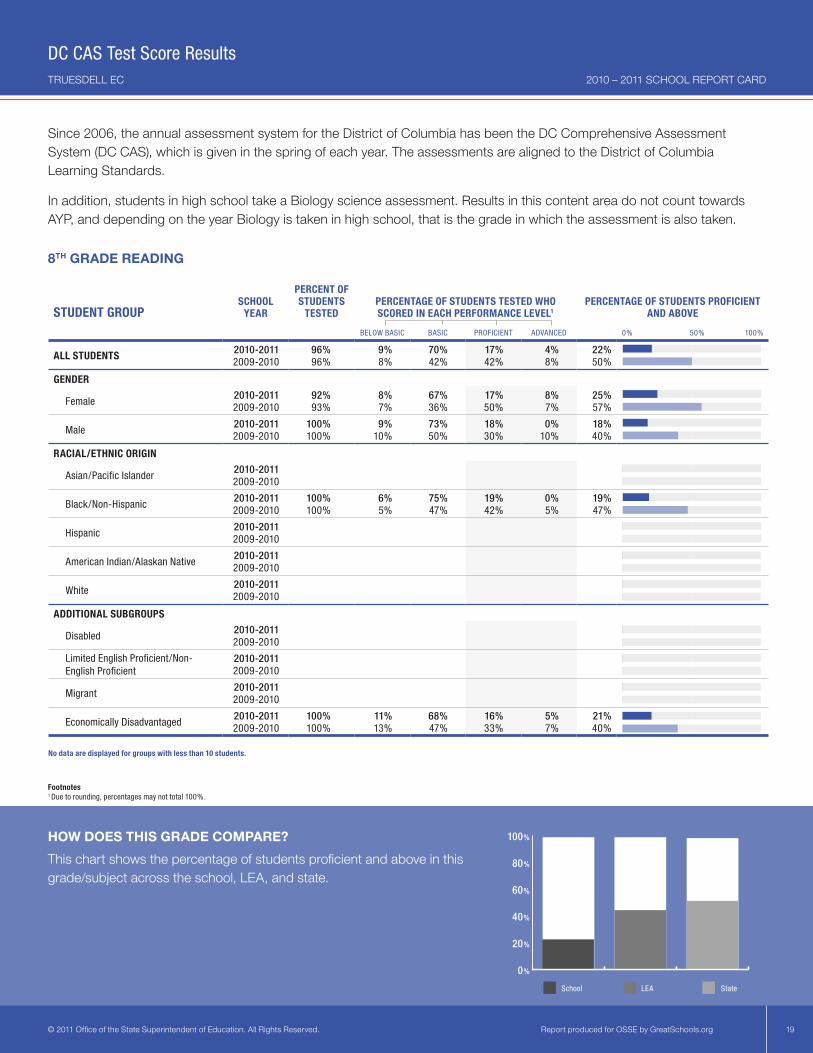
Since 2006, the annual assessment system for the District of Columbia has been the DC Comprehensive Assessment System (DC CAS), which is given in the spring of each year. The assessments are aligned to the District of Columbia Learning Standards.
In addition, students in high school take a Biology science assessment. Results in this content area do not count towards AYP, and depending on the year Biology is taken in high school, that is the grade in which the assessment is also taken.
8TH GRADE READING
TRUESDELL EC
DC CAS Test Score Results
Footnotes1 Due to rounding, percentages may not total 100%.
HOW DOES THIS GRADE COMPARE?This chart shows the percentage of students proficient and above in this grade/subject across the school, LEA, and state.
STUDENTGROUPSCHOOL
YEAR
PERCENTOFSTUDENTS
TESTEDPERCENTAGEOFSTUDENTSTESTEDWHOSCOREDINEACHPERFORMANCELEVEL1
PERCENTAGEOFSTUDENTSPROFICIENTANDABOVE
BELOW BASIC BASIC PROFICIENT ADVANCED 0% 50% 100%
ALLSTUDENTS 2010-2011 96% 9% 70% 17% 4% 22%2009-2010 96% 8% 42% 42% 8% 50%
GENDER
Female2010-2011 92% 8% 67% 17% 8% 25%2009-2010 93% 7% 36% 50% 7% 57%
Male2010-2011 100% 9% 73% 18% 0% 18%2009-2010 100% 10% 50% 30% 10% 40%
RACIAL/ETHNICORIGIN
Asian/Pacific Islander2010-20112009-2010
Black/Non-Hispanic2010-2011 100% 6% 75% 19% 0% 19%2009-2010 100% 5% 47% 42% 5% 47%
Hispanic2010-20112009-2010
American Indian/Alaskan Native2010-20112009-2010
White2010-20112009-2010
ADDITIONALSUBGROUPS
Disabled2010-20112009-2010
Limited English Proficient/Non-English Proficient
2010-20112009-2010
Migrant2010-20112009-2010
Economically Disadvantaged2010-2011 100% 11% 68% 16% 5% 21%2009-2010 100% 13% 47% 33% 7% 40%
Nodataaredisplayedforgroupswithlessthan10students.
School LEA State
100%
80%
60%
40%
20%
0%
© 2011 Office of the State Superintendent of Education. All Rights Reserved. Report produced for OSSE by GreatSchools.org 20
2010 – 2011 SCHOOL REPORT CARD
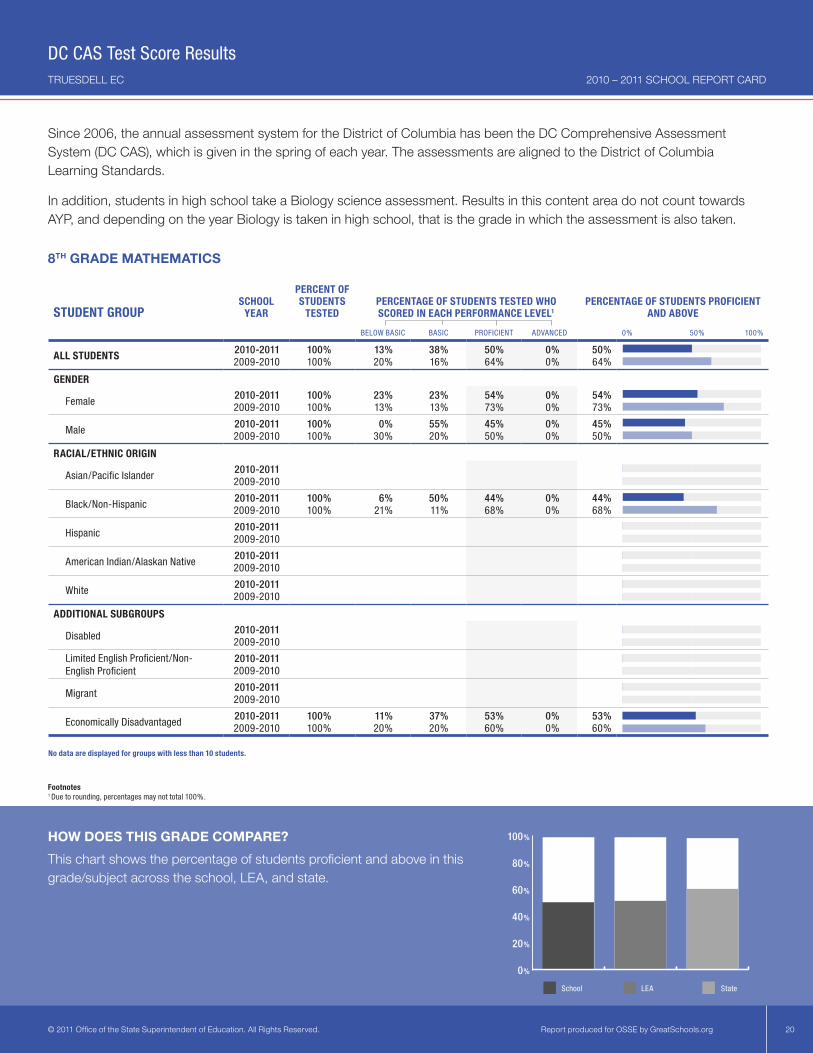
Since 2006, the annual assessment system for the District of Columbia has been the DC Comprehensive Assessment System (DC CAS), which is given in the spring of each year. The assessments are aligned to the District of Columbia Learning Standards.
In addition, students in high school take a Biology science assessment. Results in this content area do not count towards AYP, and depending on the year Biology is taken in high school, that is the grade in which the assessment is also taken.
8TH GRADE MATHEMATICS
TRUESDELL EC
DC CAS Test Score Results
Footnotes1 Due to rounding, percentages may not total 100%.
HOW DOES THIS GRADE COMPARE?This chart shows the percentage of students proficient and above in this grade/subject across the school, LEA, and state.
STUDENTGROUPSCHOOL
YEAR
PERCENTOFSTUDENTS
TESTEDPERCENTAGEOFSTUDENTSTESTEDWHOSCOREDINEACHPERFORMANCELEVEL1
PERCENTAGEOFSTUDENTSPROFICIENTANDABOVE
BELOW BASIC BASIC PROFICIENT ADVANCED 0% 50% 100%
ALLSTUDENTS 2010-2011 100% 13% 38% 50% 0% 50%2009-2010 100% 20% 16% 64% 0% 64%
GENDER
Female2010-2011 100% 23% 23% 54% 0% 54%2009-2010 100% 13% 13% 73% 0% 73%
Male2010-2011 100% 0% 55% 45% 0% 45%2009-2010 100% 30% 20% 50% 0% 50%
RACIAL/ETHNICORIGIN
Asian/Pacific Islander2010-20112009-2010
Black/Non-Hispanic2010-2011 100% 6% 50% 44% 0% 44%2009-2010 100% 21% 11% 68% 0% 68%
Hispanic2010-20112009-2010
American Indian/Alaskan Native2010-20112009-2010
White2010-20112009-2010
ADDITIONALSUBGROUPS
Disabled2010-20112009-2010
Limited English Proficient/Non-English Proficient
2010-20112009-2010
Migrant2010-20112009-2010
Economically Disadvantaged2010-2011 100% 11% 37% 53% 0% 53%2009-2010 100% 20% 20% 60% 0% 60%
Nodataaredisplayedforgroupswithlessthan10students.
School LEA State
100%
80%
60%
40%
20%
0%
© 2011 Office of the State Superintendent of Education. All Rights Reserved. Report produced for OSSE by GreatSchools.org 21
2010 – 2011 SCHOOL REPORT CARD
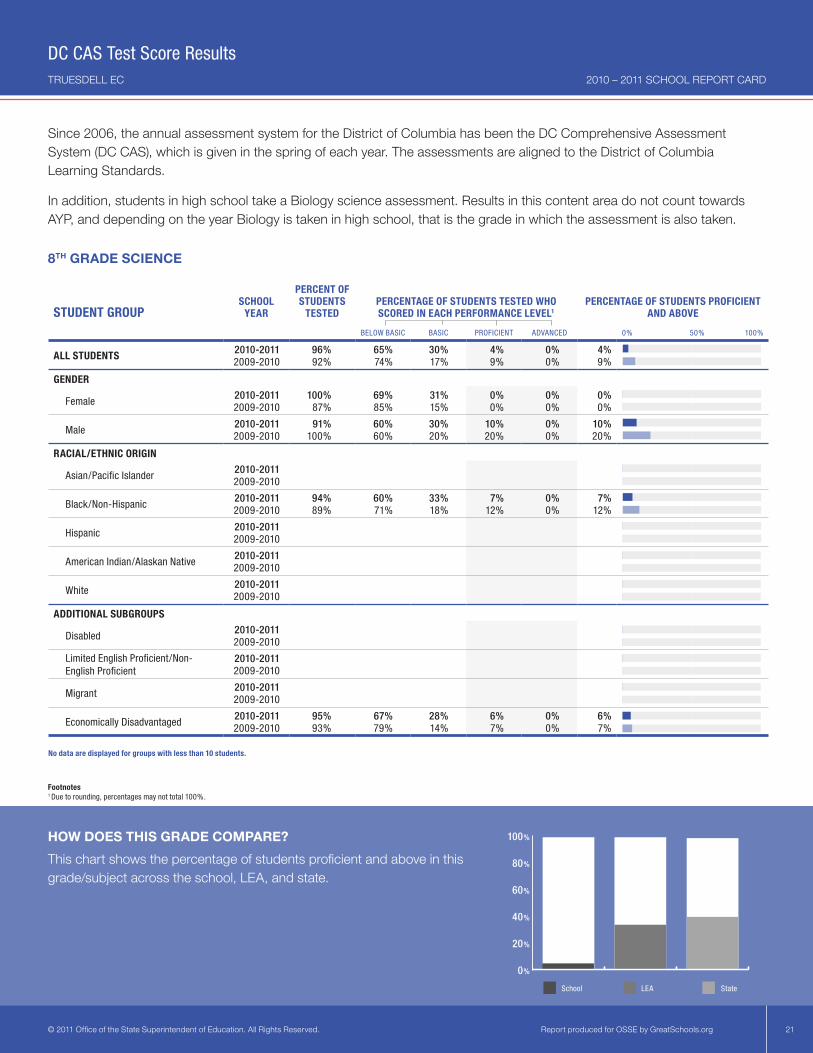
Since 2006, the annual assessment system for the District of Columbia has been the DC Comprehensive Assessment System (DC CAS), which is given in the spring of each year. The assessments are aligned to the District of Columbia Learning Standards.
In addition, students in high school take a Biology science assessment. Results in this content area do not count towards AYP, and depending on the year Biology is taken in high school, that is the grade in which the assessment is also taken.
8TH GRADE SCIENCE
TRUESDELL EC
DC CAS Test Score Results
Footnotes1 Due to rounding, percentages may not total 100%.
HOW DOES THIS GRADE COMPARE?This chart shows the percentage of students proficient and above in this grade/subject across the school, LEA, and state.
STUDENTGROUPSCHOOL
YEAR
PERCENTOFSTUDENTS
TESTEDPERCENTAGEOFSTUDENTSTESTEDWHOSCOREDINEACHPERFORMANCELEVEL1
PERCENTAGEOFSTUDENTSPROFICIENTANDABOVE
BELOW BASIC BASIC PROFICIENT ADVANCED 0% 50% 100%
ALLSTUDENTS 2010-2011 96% 65% 30% 4% 0% 4%2009-2010 92% 74% 17% 9% 0% 9%
GENDER
Female2010-2011 100% 69% 31% 0% 0% 0%2009-2010 87% 85% 15% 0% 0% 0%
Male2010-2011 91% 60% 30% 10% 0% 10%2009-2010 100% 60% 20% 20% 0% 20%
RACIAL/ETHNICORIGIN
Asian/Pacific Islander2010-20112009-2010
Black/Non-Hispanic2010-2011 94% 60% 33% 7% 0% 7%2009-2010 89% 71% 18% 12% 0% 12%
Hispanic2010-20112009-2010
American Indian/Alaskan Native2010-20112009-2010
White2010-20112009-2010
ADDITIONALSUBGROUPS
Disabled2010-20112009-2010
Limited English Proficient/Non-English Proficient
2010-20112009-2010
Migrant2010-20112009-2010
Economically Disadvantaged2010-2011 95% 67% 28% 6% 0% 6%2009-2010 93% 79% 14% 7% 0% 7%
Nodataaredisplayedforgroupswithlessthan10students.
School LEA State
100%
80%
60%
40%
20%
0%
© 2011 Office of the State Superintendent of Education. All Rights Reserved. Report produced for OSSE by GreatSchools.org 22
2010 – 2011 SCHOOL REPORT CARD
PERCENTAGEOFTEACHERS
0% 50% 100%
87%
13%
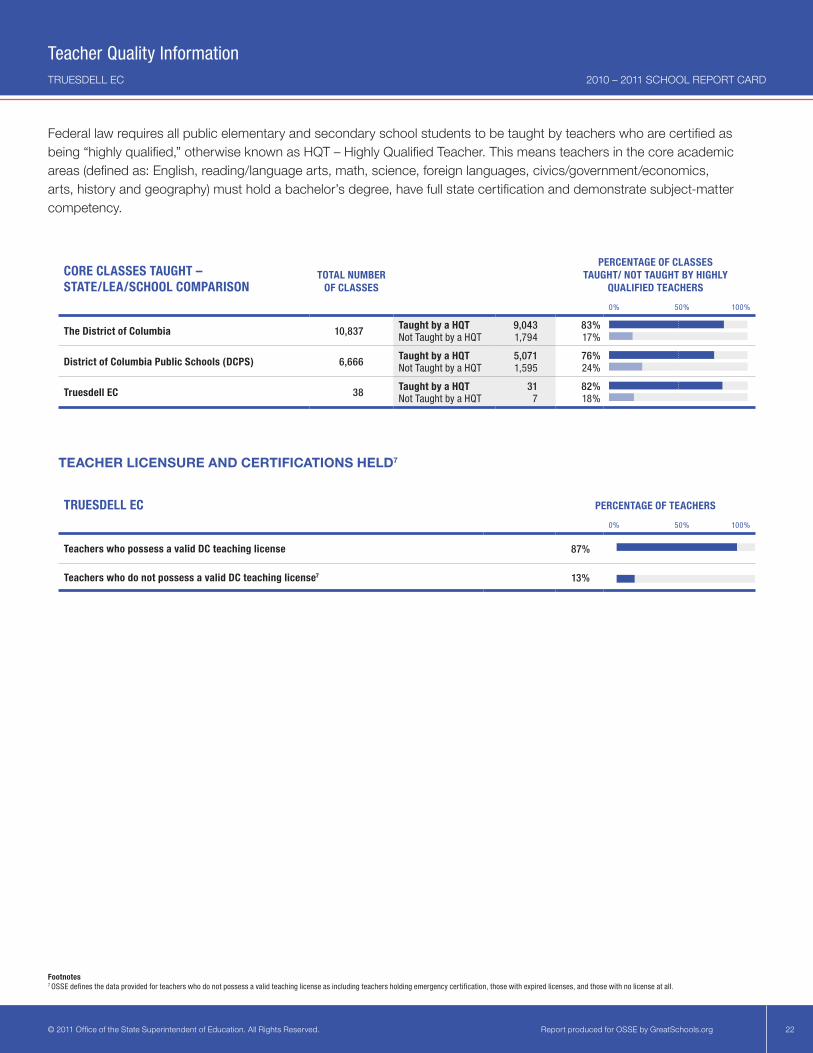
Federal law requires all public elementary and secondary school students to be taught by teachers who are certified as being “highly qualified,” otherwise known as HQT – Highly Qualified Teacher. This means teachers in the core academic areas (defined as: English, reading/language arts, math, science, foreign languages, civics/government/economics, arts, history and geography) must hold a bachelor’s degree, have full state certification and demonstrate subject-matter competency.
CORECLASSESTAUGHT–STATE/LEA/SCHOOLCOMPARISON
TOTALNUMBEROFCLASSES
PERCENTAGEOFCLASSESTAUGHT/NOTTAUGHTBYHIGHLY
QUALIFIEDTEACHERS
0% 50% 100%
TheDistrictofColumbia 10,837 TaughtbyaHQT 9,043 83%Not Taught by a HQT 1,794 17%
DistrictofColumbiaPublicSchools(DCPS) 6,666 TaughtbyaHQT 5,071 76%Not Taught by a HQT 1,595 24%
TruesdellEC 38 TaughtbyaHQT 31 82%Not Taught by a HQT 7 18%
TEACHER LICENSURE AND CERTIFICATIONS HELD7
TRUESDELL EC
Teacher Quality Information
TRUESDELLEC
TeacherswhopossessavalidDCteachinglicense
TeacherswhodonotpossessavalidDCteachinglicense7
Footnotes7 OSSE defines the data provided for teachers who do not possess a valid teaching license as including teachers holding emergency certification, those with expired licenses, and those with no license at all.
© 2011 Office of the State Superintendent of Education. All Rights Reserved. Report produced for OSSE by GreatSchools.org 23
2010 – 2011 SCHOOL REPORT CARD
If you are looking for additional information on public schools in the District of Columbia, please consider these online resources:
• Office of the State Superintendent of Education: www.osse.dc.gov
• GreatSchools:www.greatschools.org/dc
• District of Columbia Public Schools:www.dcps.dc.gov
• District of Columbia Public Charter School Board:www.dcpubliccharter.com
• District of Columbia Public Charter School Directory:www.dcpubliccharter.com/data/files/DC_Public_Charter_School_Listing.pdf
• District of Columbia Comprehensive Assessment System (DC CAS) results:www.nclb.osse.dc.gov
• FOCUS (Friends of Choice in Urban Schools) School Quality Database:www.focusdc.org/data-center
In addition, paper copies of state, LEA, and school report cards are available for viewing in select locations of the D.C. Public Library. For branch locations, please visit www.dclibrary.org.
TRUESDELL EC
Additional Resources