Embed Size (px)
Citation preview
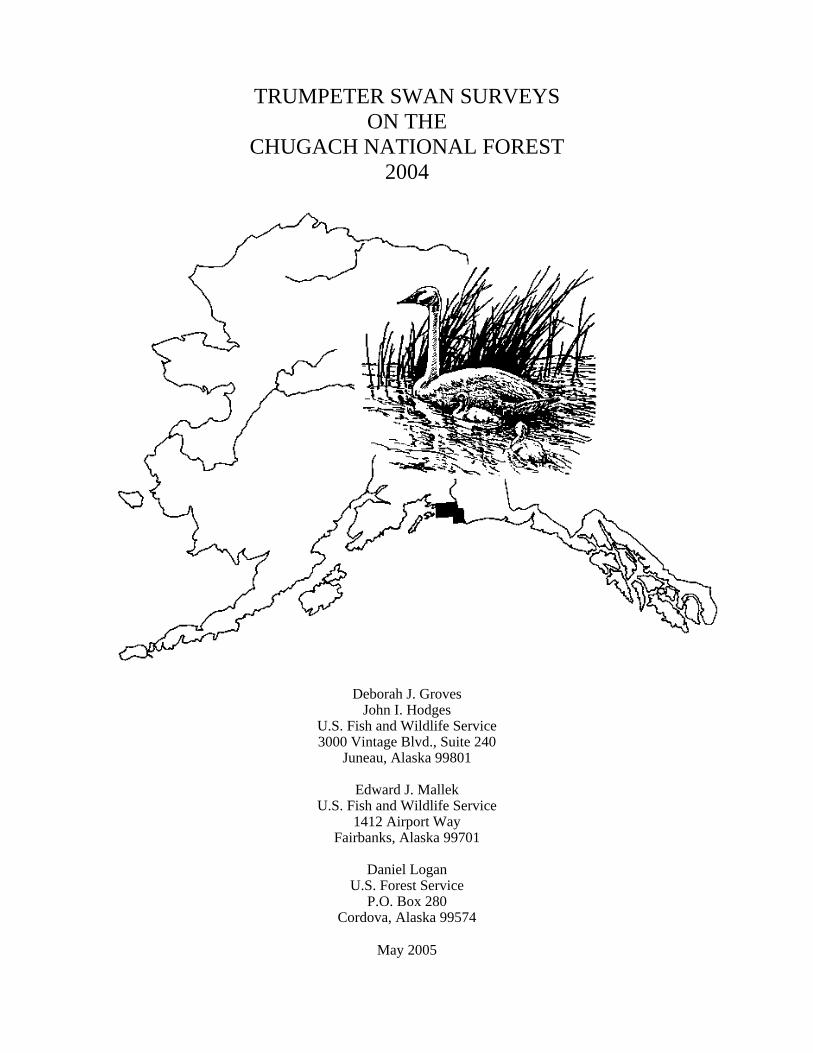
TRUMPETER SWAN SURVEYS ON THE CHUGACH NATIONAL FOREST 2004 Deborah J. Groves John I. Hodges U.S. Fish and Wildlife Service 3000 Vintage Blvd., Suite 240 Juneau, Alaska 99801 Edward J. Mallek U.S. Fish and Wildlife Service 1412 Airport Way Fairbanks, Alaska 99701 Daniel Logan U.S. Forest Service P.O. Box 280 Cordova, Alaska 99574 May 2005
ABSTRACT Trumpeter swan (Cygnus buccinator) aerial surveys were conducted during May and August 2004 on the Copper River Delta and surrounding areas of the Chugach National Forest in southcentral Alaska. The surveys were accomplished through cooperation between the U.S. Fish and Wildlife Service and the U.S. Forest Service. In May 940 white (adult and subadult) swans and 161 nests were counted. In August 970 white swans and 189 cygnets in 59 broods were recorded. Production was average. Nest success was 0.37, mean brood size was 3.2, and young made up 16% of the early fall population. The total fall swan population decreased 2% from 2003 and was 33% above the mean. There are now 55 comparable swan surveys in 29 different years for this area. A continued standardized trumpeter swan survey program is recommended. INTRODUCTION The Copper River Delta and surrounding coastal wetlands in the Chugach National Forest support a large and dense nesting and summering population of trumpeter swans (Cygnus buccinator). Aerial surveys were conducted in this area as part of U.S. Fish and Wildlife Service (USFWS) statewide trumpeter censuses in 1968, 1975, 1980, 1985, 1990, 1995, and 2000 (Hansen et al. 1971, King 1976, King and Conant 1981, Conant et al. 1985, Conant et al. 1991, Conant et al. 1996, Conant et al. 2001). The U.S. Forest Service (USFS) initiated aerial surveys in 1978, and annual swan surveys have been jointly accomplished under a formal agreement between the USFWS and USFS since 1981. SURVEY AREA The survey area was comprised of portions of the Copper River Delta and Controller Bay drainages within 11 U.S. Geological Survey 1:63,360 scale topographic maps (Figure 1). The area actually surveyed consisted of all potential swan nesting and summering habitat delineated on these maps (1787 km2). In general, potential swan habitat included most lakes, rivers, streams and all wetland areas under 760 m (2500 ft) elevation. METHODS Aerial surveys were conducted 26-28 May 2004 with a Cessna 206 and on 23-25 August 2004 with the USFWS Turbo-Beaver (N754). The aerial survey method used for both surveys was described by King (1973). Generally, a system of parallel tracks was flown over all known and suspected habitat within each 1:63,360 quadrangle map at an altitude of 150-180 m above ground. The pilot was responsible for navigation, making swan observations, and ensuring that all swan habitat was adequately surveyed, considering factors such as visibility and observer experience. The primary observer was responsible for making swan observations, recording the type and exact location of each observation onto computerized or paper 1:63,360 maps, and tracking the flight path if using paper maps (the flight path was recorded automatically for crews using an onboard computer). During five previous USFS surveys in which chartered aircraft
1
were used, all duties were assumed by the observers. Back seat observers were used, when available, to increase the eye power from the aircraft. Swan attribute data from completed paper maps were entered into a personal computer. The latitude and longitude of each observation were determined from the original survey maps using an Altek digitizing system. The geographic coordinates were then merged with the attribute data to form the final data files. When the onboard computer system was used to record data, digitizing was not necessary because the file output already included both the attribute data and the geographic coordinates for each observation. The software used for this onboard system was developed by John I. Hodges, USFWS, Migratory Bird Management, Juneau, Alaska. RESULTS Population Trend In May 2004, 940 white swans (adults and sub-adults) were counted, up 3% from spring 2003 and 44% above the mean (Table 1). The number of single/paired birds decreased from last year but was still the second-highest count on record for the survey (Table 1). In August 2004, 970 white swans were counted, up 5% from August 2003 and 42% above the mean (Table 2, Figures 1 and 2). This represents a new high count for the survey area. The number of single/paired birds decreased from 2003, while flocked birds increased dramatically (Table 2). The total number of swans, including cygnets, was 1159 in 2004, down 2% from 2003 and 33% above the mean (Table 2, Figure 2). Productivity Forty seven percent of pairs had a nest in May, 10% below the mean (Table 3). The below-average value reflects the large number of pairs that were present, because the actual number of nests (161) reached a new record high, surpassing last year’s record by 12%. A total of 189 cygnets in 59 broods were observed in August, equal to and 5% above the mean, respectively (Table 3, Figure 3). Nest success, defined as the proportion of occupied nests in May that produced at least one cygnet still alive in August, was 26% below the mean at 0.37 (Table 3). The number of young per occupied nest, a productivity statistic based on the number of known territorial pairs (as evidenced by the presence of a nest or brood), was 1.2, mean brood size was 3.2, and young made up 16% of the early fall population (Tables 2 and 3). DISCUSSION The size of the fall swan population in the survey area has fluctuated between about 500 and 1200 birds since surveys began in 1968. The population increased in the early survey years until it peaked at 1118 birds in 1984, then decreased to 662 in 1991. Since that time, the population has fluctuated somewhat from year to year but overall has increased back to its previous high
2

level seen in the mid-1980’s. In 2001 it reached a new high of 1222 birds and has remained above 1000 since. Nesting effort as measured by the number of nests was very good this year, but parameters measuring reproductive success were mainly average to below average. Overall, trumpeter swans experienced average production on the Copper River Delta and Controller Bay drainages in 2004. BIAS Possible sources of bias in these data come from using different pilots and observers with variable levels of experience and training, using more than one type of aircraft, and surveying in variable weather conditions. However, by using a standardized system, comparable sets of data were collected as evidenced by comparable recorded flight paths and mileages flown. RECOMMENDATIONS We now have 55 comparable trumpeter swan surveys (26 spring and 29 fall) on the Copper River Delta, one of the most complete records for any swan population in Alaska. We recommend continuing a cooperative program of two surveys per year. Information acquired from both the early and late phases of the breeding season has greatly enhanced our ability to understand the factors influencing the population's reproductive success. Long term, standardized data sets such as these are an invaluable tool for evaluating population dynamics and properly managing trumpeter swan breeding populations.
3
SURVEY PERSONNEL Swan surveys summarized in this report were conducted by the following individuals and agencies: Year Spring Survey Personnel Fall Survey Personnel 1968 J. King, J. Bartonek - USFWS 1975 J. King, T. Schoenfelder - USFWS 1978 G. Bucaria, S. Watson – USFS G. Bucaria, S. Watson – USFS 1979 C. Moitoret – USFS 1980 G. Bucaria, D. Logan – USFS J. King, B. Conant – USFWS 1981 G. Bucaria – USFS J. King, B. Conant – USFWS 1982 R. King, G. Bucaria – USFWS, USFS J. King, B. Conant – USFWS 1983 R. King, Zimmerman – USFWS B. Conant, D. Derksen, J. Baker, M.
Jacobson, G. Covel, Broekema – USFWS, USFS
1984 R. King, R. Leedy – USFWS B. Conant, J. Hodges – USFWS 1985 R. King, T. Simon-Jackson – USFWS B. Conant, S. Cain – USFWS 1986 R. King, K. Bollinger – USFWS B. Conant, J. Hodges – USFWS 1987 R. King, M. North – USFWS B. Conant, J. Hodges – USFWS 1988 R. King, R. Pospahala – USFWS B. Conant, J. Hodges – USFWS 1989 R. King, F. Gerhardt – USFWS B. Conant, R. Oates, M. Jacobson –
USFWS 1990 R. King, A. Brackney – USFWS B. Conant, D. Groves, J. King –
USFWS 1991 R. King, A. Brackney – USFWS B. Conant, D. Groves – USFWS 1992 R. King, D. Youkey – USFWS, USFS J. Hodges, J. King – USFWS 1993 R. King, D. Youkey – USFWS, USFS J. Hodges, D. Groves, D. Youkey –
USFWS, USFS 1994 R. King, P. Greene – USFWS, USFS B. Conant, D. Groves – USFWS 1995 R. King, R. Leedy – USFWS B. Conant, E. Lucas – USFWS 1996 R. King, S. Hill – USFWS J. Hodges, D. Groves – USFWS 1997 R. King, T. Tiplady – USFWS B. Conant, G. Fowler – USFWS,
Ducks Unlimited Canada 1998 W. Larned, J. King – USFWS B. Conant, J. King – USFWS 1999 W. Larned, T. Tiplady – USFWS B. Conant, J. King – USFWS 2000 J. Sarvis, R. Oates – USFWS B. Conant, D. Petersen – USFWS 2001 E. Mallek, P. Anderson – USFWS B. Conant, J. King – USFWS 2002 E. Mallek, L. Lysne – USFWS B. Conant, L. Lysne, D. Groves –
USFWS 2003 E. Mallek, L. Lysne - USFWS B. Conant, H. Wilson – USFWS 2004 E. Mallek, J. King – USFWS J. Hodges, H. Wilson - USFWS
4

LITERATURE CITED Conant, B., J. I. Hodges, J. G. King, and S. L. Cain. 1985. Alaska trumpeter swan status report -
1985. U.S. Fish and Wildlife Service Report, Juneau, Alaska. 10pp. _____, _____, D. J. Groves, and J. G. King. 1991. Alaska trumpeter swan status report - 1990.
U.S. Fish and Wildlife Service Report, Juneau, Alaska. 31pp. _____, _____, _____,and _____. 1996. Alaska trumpeter swan status report - 1995. U.S. Fish
and Wildlife Service Report, Juneau, Alaska. _____, _____, _____,and _____. 2001. Alaska trumpeter swan status report - 2000. U.S. Fish
and Wildlife Service Report, Juneau, Alaska. 37pp. Hansen, H. A., P. E. K. Shepherd, J. G. King, and W. A. Troyer. 1971. The trumpeter swan in
Alaska. Wildl. Mono. No. 26: 1-83. King, J. G. 1973. The use of small airplanes to gather swan data in Alaska. Wildfowl 24:15-20. ______. 1976. Trumpeter swan survey in Alaska. The 5th Trumpeter Swan Society
Conference. ______ and B. Conant. 1981. The 1980 census of trumpeter swans in Alaskan nesting habitats.
American Birds, vol. 35, no. 5, pp. 789-93.
5

Table 1. Spring survey swan observations - Chugach National Forest (1978-2004).
Dates White Swans TotalYear Flown Observations Paired Single Flocked Subtotal Cygnets Swans
1978 5/15-5/18 192 278 20 362 660 -- 660
1980 Maya 222 320 45 169 534 -- 534
1981 5/21-5/23 244 350 37 235 622 -- 622
1982 6/2-6/4 247 356 44 200 600 -- 600
1983 6/6-6/8 297 448 47 144 639 23 662
1984 5/21-5/23 324 502 43 190 735 -- 735
1985 6/8-6/10 309 452 50 235 737 -- 737
1986 5/22-5/24 304 508 35 123 666 -- 666
1987 5/22-5/26 291 462 39 101 602 -- 602
1988 5/25-5/26 263 418 42 116 576 5 581
1989 5/17-5/19 241 400 28 174 602 -- 602
1990 5/23-5/25 226 374 25 121 520 -- 520
1991 5/20-5/22 250 394 34 152 580 -- 580
1992 5/19-5/20 249 412 25 195 632 -- 632
1993 5/15-5/17 248 394 25 159 578 -- 578
1994 5/24-5/25 278 436 31 204 671 -- 671
1995 5/25-5/26 246 402 24 157 583 -- 583
1996 5/21-5/22 267 442 27 125 594 -- 594
1997 5/26-5/27 246 406 27 84 517 -- 517
1998 5/26-5/29 285 462 40 110 612 -- 612
1999 6/3-6/5 229 358 33 79 470 -- 470
2000 5/25-5/26 256 408 28 255 691 -- 691
2001 5/29-5/31 261 410 39 117 566 31 597
2002 5/29-5/31 400 536 88 391 1015 -- 1015
2003 5/27-5/29 417 632 76 205 913 -- 913
2004 5/26-5/28 389 606 52 282 940 -- 940
Mean 276 429 39 180 648 -- 651
a Exact dates unknown.
6

Table 2. Fall survey swan observations - Chugach National Forest (1968-2004).
Dates White Swans Young in TotalYear Flown Observations Paired Single Flocked Subtotal Cygnets Pop.(%) Swans
1968 8/14-8/16 199 326 24 181 531 267 33 798
1975 8/14-8/20 196 312 24 142 478 131 22 609
1978 8/9-8/12 186 248 36 127 411 103 20 514
1979 8/18-8/23 160 234 20 217 471 143 23 614
1980 8/5-8/12 262 410 33 187 630 216 26 846
1981 8/4-8/22 234 374 16 287 677 266 28 943
1982 8/11-8/14 271 436 27 227 690 152 18 842
1983 8/4-8/15 314 512 32 219 763 259 25 1022
1984 8/6-8/10 303 448 42 400 890 228 20 1118
1985 8/11-8/16 348 534 45 319 898 111 11 1009
1986 8/6-8/8 298 490 25 200 715 188 22 903
1987 8/1-8/3 318 510 46 175 731 64 8 795
1988 8/3-8/5 281 472 29 145 646 217 25 863
1989 8/3-8/6 278 460 41 98 599 117 16 716
1990 8/5-8/12 267 424 35 169 628 245 28 873
1991 8/2-8/4 253 400 36 90 526 136 21 662
1992 8/29-9/1 197 314 19 231 564 250 31 814
1993 8/22-8/24 237 368 29 218 615 201 25 816
1994 8/24-8/28 260 382 24 404 810 131 14 941
1995 8/2-8/6 280 408 51 185 644 97 13 741
1996 8/25-8/28 259 430 23 176 629 151 19 780
1997 8/14-8/17 259 416 25 157 598 175 23 773
1998 8/2-8/4 273 428 37 185 650 217 25 867
1999 8/10-8/14 258 408 27 199 634 182 22 816
2000 8/2-8/7 325 512 41 202 755 209 22 964
2001 8/22-8/24 314 520 26 324 870 352 29 1222
2002 8/4-8/6 313 472 50 376 898 228 20 1126
2003 8/6-8/8 349 518 50 360 928 259 22 1187
2004 8/23-8/25 284 446 27 497 970 189 16 1159
Mean 268 421 32 231 684 189 22 874
7
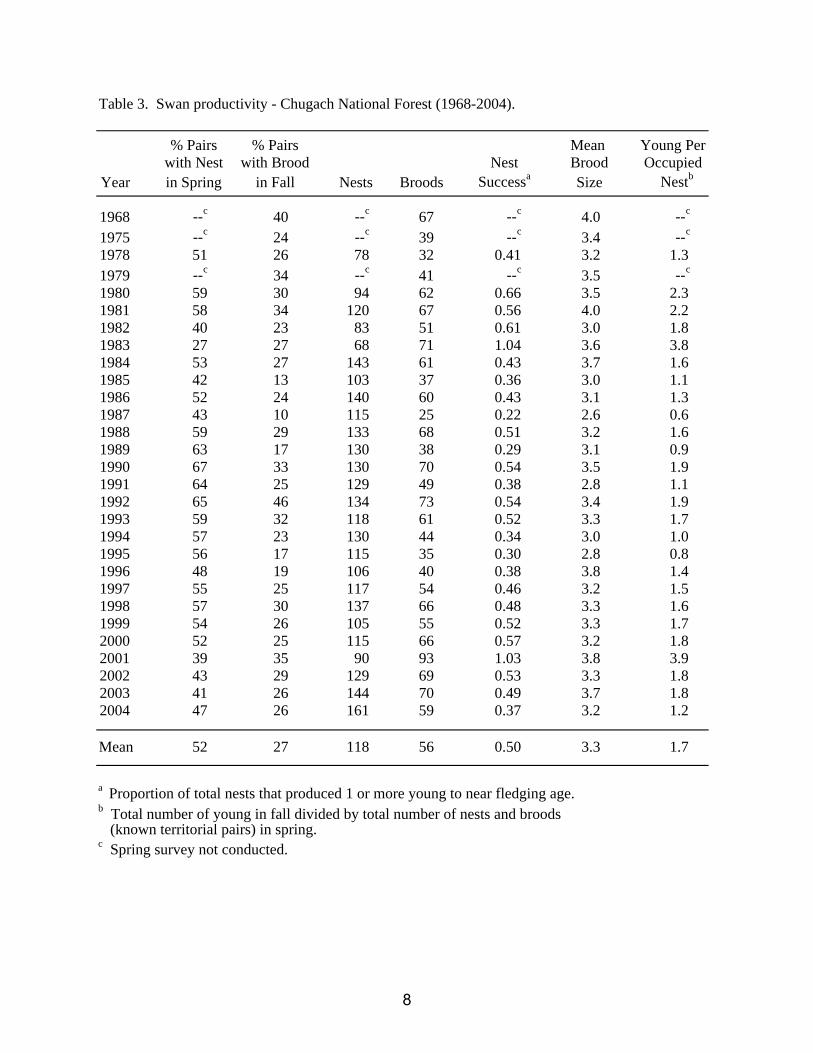
Table 3. Swan productivity - Chugach National Forest (1968-2004).
% Pairs % Pairs Mean Young Perwith Nest with Brood Nest Brood Occupied
Year in Spring in Fall Nests Broods Successa Size Nestb
1968 --c 40 --c 67 --c 4.0 --c
1975 --c 24 --c 39 --c 3.4 --c
1978 51 26 78 32 0.41 3.2 1.31979 --c 34 --c 41 --c 3.5 --c
1980 59 30 94 62 0.66 3.5 2.31981 58 34 120 67 0.56 4.0 2.21982 40 23 83 51 0.61 3.0 1.81983 27 27 68 71 1.04 3.6 3.81984 53 27 143 61 0.43 3.7 1.61985 42 13 103 37 0.36 3.0 1.11986 52 24 140 60 0.43 3.1 1.31987 43 10 115 25 0.22 2.6 0.61988 59 29 133 68 0.51 3.2 1.61989 63 17 130 38 0.29 3.1 0.91990 67 33 130 70 0.54 3.5 1.91991 64 25 129 49 0.38 2.8 1.11992 65 46 134 73 0.54 3.4 1.91993 59 32 118 61 0.52 3.3 1.71994 57 23 130 44 0.34 3.0 1.01995 56 17 115 35 0.30 2.8 0.81996 48 19 106 40 0.38 3.8 1.41997 55 25 117 54 0.46 3.2 1.51998 57 30 137 66 0.48 3.3 1.61999 54 26 105 55 0.52 3.3 1.72000 52 25 115 66 0.57 3.2 1.82001 39 35 90 93 1.03 3.8 3.92002 43 29 129 69 0.53 3.3 1.82003 41 26 144 70 0.49 3.7 1.82004 47 26 161 59 0.37 3.2 1.2
Mean 52 27 118 56 0.50 3.3 1.7
a Proportion of total nests that produced 1 or more young to near fledging age.b Total number of young in fall divided by total number of nests and broods (known territorial pairs) in spring.c Spring survey not conducted.
8

Y
S
SU
S
S
S
SSS
SSS
S
Y
SS S
S
SS
S
S
UU
SSS
SU S
USY
S
SSY
Y
S
S
S
S
S
S
YSSY
SS
S
S
S
TS
STT
T
T
T
S
SSU
S S
S
S
Y
Y
T
T
S
TY
S
S
Y
SSYS
S
U
Y
T
S
SY
Y
SSSS S
S
SSU
YT
SS
S
S
YY
S
SS
S
S
SSSST
SS
S
SSS
S
S
SS
SU
YS
S
YU
SS
SU
S
Y
Y
YS
S
U
Y
Y
YST
U
YS
Y
YYS
S
S
SS
S
UU
Y
UTTY
U
Y
S
Y
TS
YSS
T
S
SS Y Y
TT
T
Y
SS
SYTS
Y
S
TY
U
USU
YUS
SS TTSUTSS
Y
Y
SSS
SSSS
YTS
SS
Y
SY[
S
T
SYY
Y
S
T
SSYS
S
Y
Y
Y
USUSS
S
S
S TU
YT
SS
Y
S
SS
SU
S
S
Y
S
TY
STS
T
SS
ST
Y
S
SU
S
S
S
SSS
SSS
S
Y
SS S
S
SS
S
S
UU
SSS
SU S
USY
S
SSY
Y
S
S
S
S
S
S
YSSY
SS
S
S
S
TS
STT
T
T
T
S
SSU
S S
S
S
Y
Y
T
T
S
TY
S
S
Y
SSYS
S
U
Y
T
S
SY
Y
SSSS S
S
SSU
YT
SS
S
S
YY
S
SS
S
S
SSSST
SS
S
SSS
S
S
SS
SU
YS
S
YU
SS
SU
S
Y
Y
YS
S
U
Y
Y
YST
U
YS
Y
YYS
S
S
SS
S
UU
Y
UTTY
U
Y
S
Y
TS
YSS
T
S
SS Y Y
TT
T
Y
SS
SYTS
Y
S
TY
U
USU
YUS
SS TTSUTSS
Y
Y
SSS
SSSS
YTS
SS
Y
SY[
S
T
SYY
Y
S
T
SSYS
S
Y
Y
Y
USUSS
S
S
S TU
YT
SS
Y
S
SS
SU
S
S
Y
S
TY
STS
T
SS
ST
CORDOVA QUADRANGLES
Copper River
Orca
Inlet
Controller Bay
A1A2
B1B2B3B4B5
C2C3C4C5
Figure 1. Copper River Delta survey area showing fall 2004 trumpeter swan distribution.
0 5 10 15
Km
SingleSingle with BroodPairPair with BroodFlock
U
[
S
Y
T
9
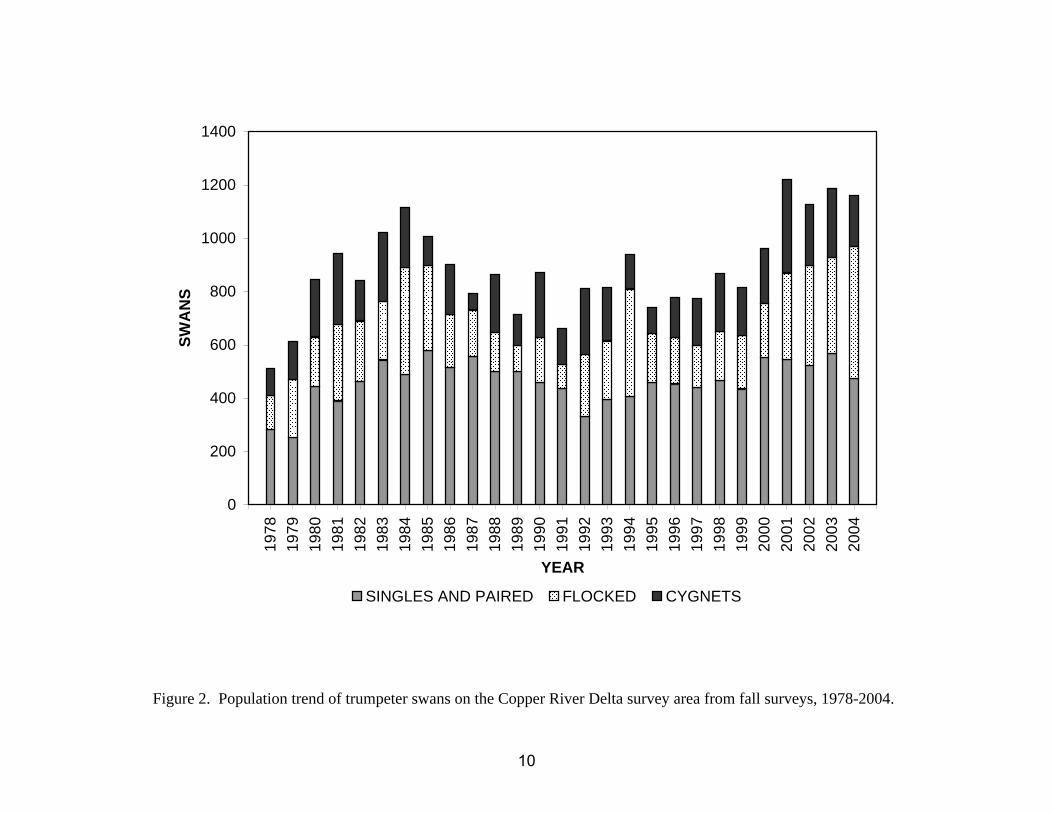
Figure 2. Population trend of trumpeter swans on the Copper River Delta survey area from fall surveys, 1978-2004.
0
200
400
600
800
1000
1200
1400
1978
1979
1980
1981
1982
1983
1984
1985
1986
1987
1988
1989
1990
1991
1992
1993
1994
1995
1996
1997
1998
1999
2000
2001
2002
2003
2004
YEAR
SWAN
S
SINGLES AND PAIRED FLOCKED CYGNETS
10

T
TT
T
TT
TTT
TTTT
T
T
TT
T
T
T
TT
T
T
T
T
T
T
T
TTT
TT
TT
TT
T
T
TT
T
T
T
T
T
T
T
TT
T
T
TTT
T T
T
T
T
T
TTTTTT T
T
T
T
T
T
T
TTT
T
T
TT
T
T
TTTTTTT
T
TTT
TT
T
TTTT
T
TT
TT
T
TTT
TTTTT
T
TT
T
T
TT T
TT T
TT
TT
TT
TT
TT
T
TTT
T
TTT
TT
TTT
TT
T
T
T
T TTTT
T
Ñ
Ñ
Ñ
ÑÑ
ÑÑ
Ñ
Ñ
Ñ
Ñ
Ñ
Ñ
ÑÑ
Ñ
ÑÑ
Ñ
Ñ
Ñ
Ñ
Ñ
Ñ
Ñ
Ñ
Ñ
Ñ
ÑÑ
Ñ
ÑÑ
Ñ
ÑÑ Ñ
Ñ
Ñ
Ñ
Ñ
Ñ
Ñ
Ñ
ÑÑ
ÑÑ
ÑÑ
Ñ
ÑÑ
Ñ
Ñ
Ñ
Ñ
Ñ
Ñ
T
TT
T
TT
TTT
TTTT
T
T
TT
T
T
T
TT
T
T
T
T
T
T
T
TTT
TT
TT
TT
T
T
TT
T
T
T
T
T
T
T
TT
T
T
TTT
T T
T
T
T
T
TTTTTT T
T
T
T
T
T
T
TTT
T
T
TT
T
T
TTTTTTT
T
TTT
TT
T
TTTT
T
TT
TT
T
TTT
TTTTT
T
TT
T
T
TT T
TT T
TT
TT
TT
TT
TT
T
TTT
T
TTT
TT
TTT
TT
T
T
T
T TTTT
T
Ñ
Ñ
Ñ
ÑÑ
ÑÑ
Ñ
Ñ
Ñ
Ñ
Ñ
Ñ
ÑÑ
Ñ
ÑÑ
Ñ
Ñ
Ñ
Ñ
Ñ
Ñ
Ñ
Ñ
Ñ
Ñ
ÑÑ
Ñ
ÑÑ
Ñ
ÑÑ Ñ
Ñ
Ñ
Ñ
Ñ
Ñ
Ñ
Ñ
ÑÑ
ÑÑ
ÑÑ
Ñ
ÑÑ
Ñ
Ñ
Ñ
Ñ
Ñ
Ñ
CORDOVA QUADRANGLES
Copper River
Orca
Inlet
Controller Bay
A1A2
B1B2B3B4B5
C2C3C4C5
Figure 3. Copper River Delta study area showing spring 2004 trumpeter swan nest and fall 2004 brood locations.
T
Ñ
SPRING NESTFALL BROOD
0 10 205Km
11

Appendix. Results of 2004 spring and fall trumpeter swan surveys by 1:63,360 topographic map.
TRUMPETER SWAN SURVEYS COPPER RIVER DELTA
SPRING 2004
NO. NO. NO. PRS SNG PRS SNG 0 NO. NO.OF AS IN IN OF OF w/ w/ w/ w/ w/ OF OF TOT TOT TOT
MAP QUAD DATE OBS SNG PRS FKS PRS FKS NEST NEST BRD BRD BRD NESTS BRDS ADU YNG SWANS
CORDOVA A1 05/26/04 52 6 80 77 40 6 20 4 0 0 0 24 0 163 0 163CORDOVA A2 05/26/04 9 2 10 6 5 2 4 0 0 0 0 4 0 18 0 18CORDOVA B1 05/26/04 40 4 64 48 32 4 13 1 0 0 0 14 0 116 0 116CORDOVA B2 05/26/04 40 6 56 38 28 6 9 1 0 0 0 10 0 100 0 100CORDOVA B3 05/26/04 76 9 128 15 64 3 28 4 0 0 0 32 0 152 0 152CORDOVA B4 05/27/04 107 16 168 55 84 7 45 6 0 0 0 51 0 239 0 239CORDOVA B5 05/26/04 38 4 60 31 30 4 13 2 0 0 0 15 0 95 0 95CORDOVA C2 05/26/04 4 1 6 0 3 0 2 0 0 0 0 2 0 7 0 7CORDOVA C3 05/28/04 6 3 6 0 3 0 2 1 0 0 0 3 0 9 0 9CORDOVA C4 05/27/04 3 0 6 0 3 0 0 0 0 0 0 0 0 6 0 6CORDOVA C5 05/27/04 14 1 22 12 11 2 6 0 0 0 0 6 0 35 0 35
TOTAL 389 52 606 282 303 34 142 19 0 0 0 161 0 940 0 940
FALL 2004
NO. NO. NO. PRS SNG PRS SNG 0 NO. NO.OF AS IN IN OF OF w/ w/ w/ w/ w/ OF OF TOT TOT TOT
MAP QUAD DATE OBS SNG PRS FKS PRS FKS NEST NEST BRD BRD BRD NESTS BRDS ADU YNG SWANS
CORDOVA A1 08/23/04 31 4 54 0 27 0 -- -- 2 0 0 -- 2 58 5 63CORDOVA A2 08/24/04 4 1 6 0 3 0 -- -- 1 0 0 -- 1 7 4 11CORDOVA B1 08/23/04 28 0 44 231 22 6 -- -- 4 0 0 -- 4 275 11 286CORDOVA B2 08/23/04 26 2 40 60 20 4 -- -- 6 0 0 -- 6 102 16 118CORDOVA B3 08/23/04 56 4 100 7 50 2 -- -- 10 0 0 -- 10 111 29 140CORDOVA B4 08/24/04 94 12 134 104 67 15 -- -- 26 1 0 -- 27 250 89 339CORDOVA B5 08/24/04 23 3 34 44 17 3 -- -- 6 0 0 -- 6 81 25 106CORDOVA C2 08/23/04 2 0 4 0 2 0 -- -- 0 0 0 -- 0 4 0 4CORDOVA C3 08/23/04 6 1 10 0 5 0 -- -- 1 0 0 -- 1 11 3 14CORDOVA C4 08/24/04 3 0 6 0 3 0 -- -- 1 0 0 -- 1 6 1 7CORDOVA C5 08/25/04 11 0 14 51 7 4 -- -- 1 0 0 -- 1 65 6 71
TOTAL 284 27 446 497 223 34 -- -- 58 1 0 -- 59 970 189 1159
12