Embed Size (px)
Citation preview

1
Trussell Trust data briefing on end-of-year
statistics relating to use of food banks: April
2020 – March 2021
This data briefing provides information on how the statistics released by the Trussell Trust on 22 April
2021 were gathered and summarises the key findings. It also identifies and discusses some of the
operational and external factors which may lie behind variation in the figures at local, regional and
national levels.
Introduction
Since the introduction of significant measures to restrict the spread of Covid-19 in the United Kingdom,
there has been an unprecedented increase in the number of people claiming support from the social
security safety net and other forms of support. During this time, the economic impact of the crisis has
been severe, with the number of people supported by Universal Credit in the UK doubling from 3
million in March 2020 to more than 6 million in March 2021.1
During this period, food banks across the country have seen historic levels of need, with many new
food banks opening to support people through the crisis. Alternative providers such as councils,
community groups and schools also began distributing emergency food parcels to support people
shielding in their communities, and those who cannot afford or access food.
For each quarter throughout the crisis, levels of need have continued to be significantly higher than
those seen in the same period in the previous financial year. However, there have been some
fluctuations through the year. As shown in Table 1.2, in 2020/21, the number of parcels distributed
was lowest in the summer quarter (Q2: July to September). However, need was still at an all-time high
for the quarter compared with previous years. The increases seen in the last year come after what
were record levels of food bank use the previous year – with 1.9 million parcels distributed in 2019/20.
Destitution – and the resulting inability to afford essentials – is the main reason for people needing to
use a food bank. This lack of income is most often associated with the social security system, either
directly due to the value of benefits not being sufficient to meet living costs, or through design or
operational issues such as the five-week wait, or delays to payment.
People are more likely to need support from a food bank if they are living with ill health or have
experienced challenging life experiences such as eviction or divorce. Those without access to informal
support networks such as friends and family, or more formal support are also more likely to need
support from a food bank.2
The ongoing crisis will have drained many people’s financial and interpersonal resources and forced
many to take on debt, meaning the pandemic will likely continue to affect people’s ability to afford
essentials – even as restrictions ease and the wider economy begins to recover.3
1 People on Universal Credit, DWP, Stat-Xplore 2 State of Hunger (2019), Trussell Trust, https://www.stateofhunger.org/wp-content/uploads/2019/11/State-of-Hunger-Report-November2019-Digital.pdf 3 Caught in a (Covid) Trap, (2020), Resolution Foundation, https://www.resolutionfoundation.org/publications/caught-in-a-covid-trap/

2
Headline findings for the UK
The Trussell Trust can now publish data covering the whole 2020/21 financial year, 1 April 2020 to 31
March 2021 inclusive, showing the impact that food banks in our network have seen through the
Covid-19 pandemic so far.
• Overall, food banks in the Trussell Trust’s network have distributed more than 2.5 million
emergency food parcels across the UK in the last year. This is a 33% increase in the number of
parcels needed compared to the previous financial year.
• The figures indicate children have been more likely to be impacted by the crisis than adults.
Last year the number of emergency food parcels distributed to children rose by 36%,
compared to an increase for adults of 32%. Between April 2020 and March 2021, 2,685 parcels
were given, on average, to children every day.
• There has been a 53% increase in the total weight of food distributed this year compared to
last. Some food banks have given out larger parcels during the crisis which may have reduced
the total number of parcels given out, while increasing the average weight.
Drivers of food bank use
With 94% of people who use a food bank living in destitution, research shows that the main reason
for needing to use a food bank in the UK is being unable to afford essentials. There are three main
factors which can tip people into crisis, and all three have been prevalent during the pandemic:4
• Welfare benefits that are too low to live on, have gaps or are inaccessible. The social security
system should function to help people keep people afloat during hard times. Before the
pandemic this was frequently not the case, and though some policy changes since the start of
the pandemic – such as the £20 uplift to Universal Credit (UC) and the increase to the Local
Housing Allowance (LHA) – have increased the level of benefits that many people are
receiving, significant issues and gaps remain. Further, policies like the benefit cap mean that
many households haven’t received the uplift amount, and No Recourse to Public Funds visa
conditions means migrant workers who’ve lost their jobs are often unable to receive any
support from the benefit system.
• Difficult life experiences like poor health, job loss, eviction, bereavement, and relationship
breakdown. Challenging life events like these can uproot people’s lives, reduce their incomes,
increase their expenditure and make it harder to engage with support services without
additional support. It’s clear that people have experienced disruptive and difficult life events
at a higher rate as a direct result of the pandemic. As well as the illness and tragic deaths
caused by the virus itself, restrictions have indirectly resulted in further repercussions
including job losses, increased caring responsibilities and pressure on intimate relationships,
and poorer mental health.
In the summer of 2020 72% of households referred to food banks in the Trussell Trust network
had someone living with poor mental health, up from just over half pre-pandemic. This reflects
overall trends seen in the general population. Almost one in five adults (19%) were likely to
Stormy weather, (2021), StepChange, https://www.stepchange.org/Portals/0/assets/pdf/Coronavirus-impact-dashboard-January-2021-StepChange.pdf 4 Lockdown Lifelines, (2020), Trussell Trust, https://www.trusselltrust.org/wp-content/uploads/sites/2/2020/09/the-impact-of-covid-19-on-food-banks-report.pdf

3
be experiencing some form of depression in June 2020. This has almost doubled from around
one in 10 (10%) before the pandemic (July 2019 to March 2020).5
• A lack of informal or formal support. Before the pandemic, the vast majority of people
referred to food banks had either exhausted the support that was available from family and
friends, or had resource-poor social networks who weren’t in a position to help. Others were
unable to access more formal support such as advice services, or debt management agencies.
The pandemic has caused huge disruption to people’s social circles and informal support
networks, as well as civil society organisations, making it harder to receive this kind of support.
Patterns in food bank use
Variation in food parcel distribution
Food banks in the Trussell Trust network UK have seen a 33% increase in the number of parcels
distributed in the 12 months to the end of March 2021, compared to the same period in 2019/20. The
increase has been slightly higher for children than adults (36% v 32%), which indicates that children,
and households with children, have been more likely to need to turn to food banks during the crisis.
When looking at the number of parcels distributed, children are overrepresented among those
receiving a food parcel. This has consistently been the case in previous years, and between April 2020
and March 2021, 39% of parcels went to children. This is despite those aged 0-16 making up just 20%
of the UK population.6
Table 1.1. Nearly 7,000 parcels given out every day during the pandemic
April 2020 – March 2021
No. of parcels % change from
2019/20
Average number distributed per
minute
Average number distributed per
day
Parcels distributed to adults
1,557,116 32% 3.0 4,266
Parcels distributed to children
980,082 36% 1.9 2,685
Total 2,537,198 33% 4.8 6,951
Changes over financial year
Across the UK, the initial stages of the crisis (1 April – 30 June) saw an 84% increase compared to the
same period last year. The increase in the following three months (1 July – 30 September) was lower,
at 16%. Although the rate of increase fell, it’s important to recognise that this 16% increase built on
years of significant growth in need for food banks. Each individual month from July to September
continued to show record levels of need for that period.
In the next quarter, 1 October to 31 December, the year-on-year percentage increase in need rose
again to 22%. The final quarter, 1 January to 31 March, then saw a continued increase in need,
5 Coronavirus and depression in adults, Great Britain: June 2020, (2020), ONS, https://www.ons.gov.uk/peoplepopulationandcommunity/ 6 Estimates of the population for the UK, England and Wales, Scotland and Northern Ireland (2020), ONS, https://www.ons.gov.uk/peoplepopulationandcommunity/populationandmigration/populationestimates/datasets/populationestimatesforukenglandandwalesscotlandandnorthernireland
4
compared to the year before, with a 19% increase on the same period in 2020 – even though the
pandemic crisis began in the middle of March last year. The last two weeks of March 2020 saw an
extraordinary 81% increase in parcels distributed, compared to the same period in 2019, and this will
influence the year-on-year comparisons for the fourth quarter.7 Food banks in the Trussell Trust
network would normally see a drop off in need after the Christmas period. But this data shows need
continued to be high at the start of 2021.
This pattern suggests some correlation between the extent or duration of lockdowns during a period
and the number of parcels distributed, with the quarters that had fewer restrictions in general across
the UK also seeing lower levels of need. This correlates with other research which suggests that the
pressures on people’s incomes increased during lockdowns.8 In 2020/21 governments across the UK
also extended free school meal provision during the summer months and the Christmas holidays: this
may have reduced the level of need seen by food banks in the Trussell Trust network, compared to
the previous year, as in 2019/20 there was no provision of free school meals during school holidays.
Later sections of this briefing discuss potential reasons for varying levels of need across and within
different areas. These factors are also likely to be relevant to understanding the changing levels of
need seen by food banks in the Trussell Trust across the last year.
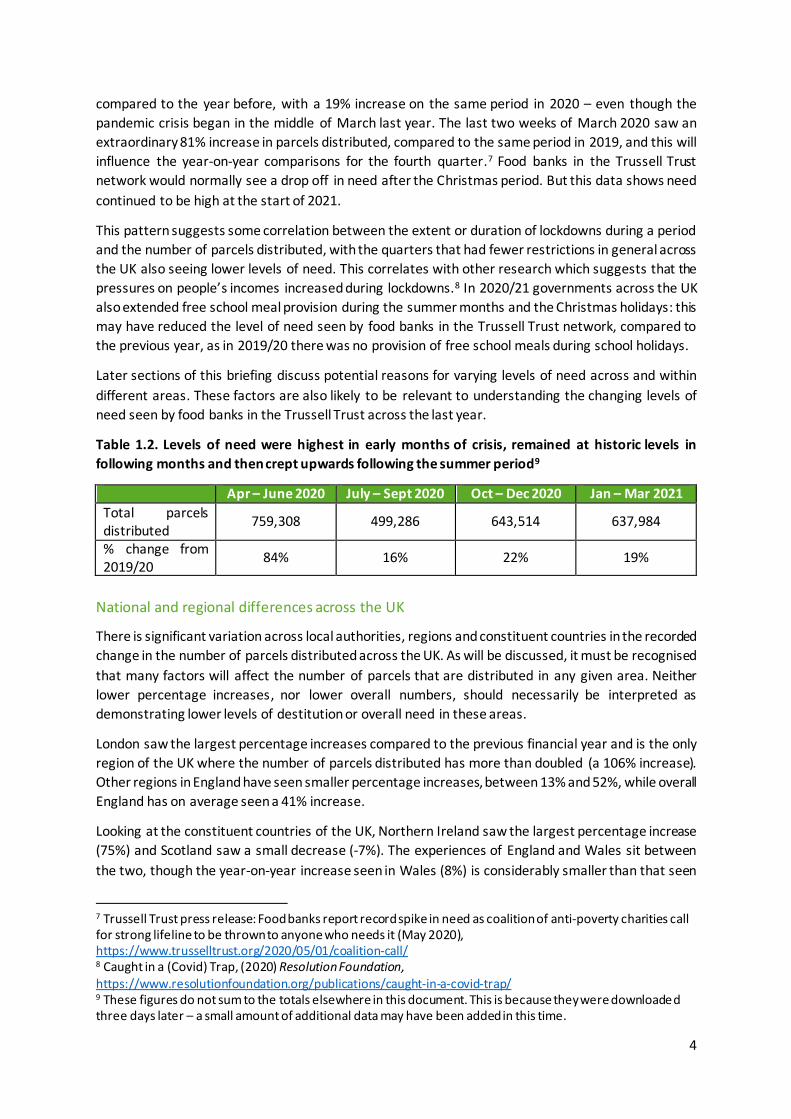
Table 1.2. Levels of need were highest in early months of crisis, remained at historic levels in
following months and then crept upwards following the summer period9
Apr – June 2020 July – Sept 2020 Oct – Dec 2020 Jan – Mar 2021
Total parcels distributed
759,308 499,286 643,514 637,984
% change from 2019/20
84% 16% 22% 19%
National and regional differences across the UK
There is significant variation across local authorities, regions and constituent countries in the recorded
change in the number of parcels distributed across the UK. As will be discussed, it must be recognised
that many factors will affect the number of parcels that are distributed in any given area. Neither
lower percentage increases, nor lower overall numbers, should necessarily be interpreted as
demonstrating lower levels of destitution or overall need in these areas.
London saw the largest percentage increases compared to the previous financial year and is the only
region of the UK where the number of parcels distributed has more than doubled (a 106% increase).
Other regions in England have seen smaller percentage increases, between 13% and 52%, while overall
England has on average seen a 41% increase.
Looking at the constituent countries of the UK, Northern Ireland saw the largest percentage increase
(75%) and Scotland saw a small decrease (-7%). The experiences of England and Wales sit between
the two, though the year-on-year increase seen in Wales (8%) is considerably smaller than that seen
7 Trussell Trust press release: Food banks report record spike in need as coalition of anti-poverty charities call for strong lifeline to be thrown to anyone who needs it (May 2020), https://www.trusselltrust.org/2020/05/01/coalition-call/ 8 Caught in a (Covid) Trap, (2020) Resolution Foundation, https://www.resolutionfoundation.org/publications/caught-in-a-covid-trap/ 9 These figures do not sum to the totals elsewhere in this document. This is because they were downloaded three days later – a small amount of additional data may have been added in this time.

5
in England (41%). This follows the pattern of the data we previously released for our mid-year
statistics, in which Northern Ireland saw the largest percentage increase (80%), followed by England
(57%) and Wales (21%), while Scotland experienced a 1% decrease.10 This pattern emerged at the
beginning of the pandemic crisis, with Northern Ireland seeing the largest growth in the number of
food parcels distributed (141%) and Scotland experiencing the smallest (47%).11 Northern Ireland is
also the only region in which the percentage increase in the number of adults supported is bigger than
that for the number of children.
Scotland’s data stands out as the only area of the UK to experience a decrease. It must be recognised
that this does not indicate that rates of destitution and poverty have declined or remained stable
during the Covid-19 crisis. Indeed, the Scottish Government’s impact assessment suggests that12:
The effects of COVID-19 will layer on top of existing structural imbalances and are predicted to
be particularly severe for people on low incomes, who are more likely to have poorer health
and are also more likely to be in insecure work without financial reserves.
Data from the Scottish Welfare Fund also shows that the number of people struggling on low incomes
is increasing. The most recent data shows a 31% increase in the number of applications for crisis grants
that were received in the 12 months to January 2021 (inclusive: Feb 2020 – Jan 2021), compared to
the 12 months prior (Feb 2019 – Jan 2020). Further, there was a 52% increase in the amount given out
in crisis grants, between these two 12-month periods.13 The Claimant Count statistics presented later
in this document also indicate that Scotland has not seen a significantly different employment shock
than the rest of the UK.
Conversations with food banks, as well as findings from commissioned research from King’s College
London, instead suggest a significant proportion of people in need in Scotland during the crisis have
been supported by additional emergency food provision within their areas.14 This could have included
new emergency food providers set up through the increase in funding through initiatives such as the
Scottish Food Fund.15 As well as food banks, local councils have been distributing food parcels, as have
other community organisations such as churches, football teams and mutual aid groups.
10 Trussell Trust data briefing on mid-year statistics relating to use of food banks – April to September 2020, (2020), The Trussell Trust, https://www.trusselltrust.org/wp-content/uploads/sites/2/2020/11/Mid-year-stats-2020-data-briefing.pdf 11 Food banks report record spike in need… (2020), Trussell Trust, https://www.trusselltrust.org/2020/05/01/coalition-call/ 12 Equality and Fairer Scotland Impact Assessment: Evidence gathered for Scotland’s Route Map through and out of the Crisis, (2020), Scottish Government, https://www.gov.scot/publications/equality-fairer-scotland-impact-assessment-evidence-gathered-scotlands-route-map-through-out-crisis/pages/4/ 13 Scottish Welfare Fund and Discretionary Housing Payments: monthly data, (2021), Social Security Directorate, https://www.gov.scot/publications/swf-monthly-management-information/ 14 This commissioned research, conducted over October and November, led by Dr Rachel Loopstra (King’s College London) and Dr Hannah Lambie-Mumford (University of Sheffield) has involved conducting six case studies in urban areas of England and Scotland to explore outlier trends in Trussell Trust food bank usage. 15 On 18 March 2020, the Scottish Government announced a £70 million Food Fund to put in place support for those who would otherwise be unable to access food through the usual routes.
Example: In one of Kings’ case study areas (a large city in Scotland), before the pandemic, in addition to the 14 Trussell Trust distribution centres operating, there were at least 31 independent food banks involved in weekly food parcel distribution according to the Independent Food Aid Network (IFAN). Based on recent desk-based research, IFAN has now identified at least 14 more independent food banks regularly distributing food parcels each week since the COVID-19 outbreak.

6
Differences in rates of change may also in part be reflective of existing trends in the data. Between
the financial years 2018/19 and 2019/20 there was an 18% increase in parcels distributed by food
banks in the Trussell Trust network. The increase was nine percent in this period for Scotland.
Table 1.4. Regional results show variation in the number of parcels distributed
April 2019 – March 2020 April 2020 – March 2021 % change from 2019/20
Region To adults To
children Total To adults
To children
Total Adults Children Total
UK 1,183,672 722,953 1,906,625 1,557,116 980,082 2,537,198 32% 36% 33%
England 916,330 571,708 1,488,038 1,273,275 817,714 2,090,989 39% 43% 41% Northern
Ireland 26,160 18,974 45,134 47,799 31,028 78,827 83% 64% 75%
Scotland 157,512 81,049 238,561 144,431 77,123 221,554 -8% -5% -7%
Wales 83,670 51,222 134,892 91,611 54,217 145,828 9% 6% 8% East
Midlands 62,501 39,284 101,785 81,728 52,162 133,890 31% 33% 32%
East of England
113,793 76,246 190,039 142,593 102,002 244,595 25% 34% 29%
London 129,323 74,864 204,187 262,436 158,990 421,426 103% 112% 106% North East 62,038 36,483 98,521 78,140 46,084 124,224 26% 26% 26%
North West
153,637 100,135 253,772 192,494 120,521 313,015 25% 20% 23%
South East 120,544 78,698 199,242 180,572 122,333 302,905 50% 55% 52% South West
100,369 62,838 163,207 122,372 79,599 201,971 22% 27% 24%
West Midlands
106,882 62,255 169,137 137,953 88,284 226,237 29% 42% 34%
Yorkshire and The Humber
67,243 40,905 108,148 74,987 47,739 122,726 12% 17% 13%
Variation is also seen at a local authority level. Overall, in 2020/21, there were food banks from the
Trussell Trust network based in 295 local authority areas across the UK. Of those, 292 also had food
banks in those areas in 2019/20.
More than one in six (17%) local authorities which had a food bank from the Trussell Trust network in
both 2019/20 and 2020/21 experienced a doubling in the number of parcels distributed between April
2020 and March 2021 compared to the same period in 2019/20. Three in ten (31%) reported a
decrease.
Local authority level statistics can be affected by changes to the operational structure (e.g. changes to
opening hours, number of days open, or switch to a distribution model) of food banks and of the
agencies and organisations that refer people to food banks.16 Changes to employment and poverty in
the local area may also impact on the magnitude of rates of change. Importantly, while there has been
evidence of some local areas being harder hit by economic impacts of Covid-19 than others, there has
been no evidence of economic hardship, and in turn, food insecurity decreasing in local areas over this
16 Investigating outlier trends in Trussell Trust food bank usage over the COVID-19 crisis in the UK. Loopstra, Goldberg, Gordon & Lambie-Mumford.

7
period. As such, reductions in use in food banks in the Trussell Trust network should not be interpreted
as a decrease in need.17
Table 1.5. One in six local authority areas saw a doubling in the number of food parcels distributed
between 2019/20 and 2020/21
Banded change in number of emergency food parcels distributed within local
authority
% of local authority areas
100% and above 17%
50% – 99% 11% 0%-49% 41% Decrease 31%
Factors that may affect the number of emergency food parcels distributed across the UK
Statistics from the Trussell Trust are often used as a barometer of the scale and change in food
insecurity and levels of destitution at a national and local level. During the Covid-19 crisis it has
become clear that the data collected by food banks in the Trussell Trust network is not the complete
picture of need for this period, and that relative increases seen within the network may not accurately
reflect relative increases in economic hardship across the UK. Many food banks in the network have
seen decreases in reported figures, at the same time as measurements of financial insecurity such as
unemployment have increased in the area that they are based.
Research conducted by the Food Standard Agency suggests that the population of people provided
with food parcels during the crisis has been wider than just those supported by food banks in the
Trussell Trust network. Its figures show 1.8% of the adult population aged 16-75 in England, Wales and
Northern Ireland were delivered food from a food charity or food bank in the month to mid-November
2020 because they did not have enough money to buy food.18 This is equivalent to over 800,000
people.19
The following section draws together evidence from our network and externally to suggest factors
that may contribute to differing levels of use of food banks in the Trussell Trust network during the
crisis.
Operational differences
Food banks in the Trussell Trust network across the UK have faced significant challenges in continuing
to support their local communities during the pandemic. Many have had to change how they operate,
such as by shifting their opening hours, centralising to single distribution locations or implementing a
delivery model.20 Some food banks have also had to adapt to operating with fewer volunteers, for
17 IBID 18 Covid19 Research Tracker – Wave Four, (2020), Food Standards Agency, https://data.food.gov.uk/catalog/datasets/da60fd93-be85-4a6b-8fb6-63eddf32eeab 19 Estimates of the population for the UK, England and Wales, Scotland and Northern Ireland (2020), ONS, https://www.ons.gov.uk/peoplepopulationandcommunity/populationandmigration/populationestimates/datasets/populationestimatesforukenglandandwalesscotlandandnorthernireland 20 Investigating outlier trends in Trussell Trust food bank usage over the COVID-19 crisis in the UK. Loopstra, Goldberg, Gordon & Lambie-Mumford.

8
example when a large proportion of their volunteer base were asked to shield. Any difficulties faced
by partners in making referrals will also need to have been accommodated by food banks, and this
may have had knock-on effects for how the food banks operated. All these factors may affect the
number of parcels that they distributed across 2020/21.
Food banks faced challenges staying open and operating as usual
Food banks across the UK have needed to reduce or alter their service provision to work safely during
the pandemic. This may have included reducing opening hours or choosing to open only some
distribution centres and not others. A temporary closure, or one food bank making changes to their
distribution model and opening hours, will have a more significant impact on the figures for an area
of the UK with fewer food banks.
Between April 2019 and March 2020, 1,504 distribution centres distributed food parcels. This fell to
1,471 between April 2020 and March 2021. The decrease was more significant in particular areas. In
Scotland for instance the number of distribution centres fell by 21%. This may reflect that some food
banks closed distribution centres as they decided to centralise their distribution centres to a single
location to allow for a more effective delivery model, or to manage with fewer volunteers. Research
conducted through June and July showed that two in five (39%) households which received a Trussell
Trust food parcel had it delivered in that period.21
As data is collected based on where the distribution centres are physically located, the closure of
individual distribution centres may impact on the figures for some local authority areas.
Switching to a delivery model may have increased distribution from some food banks due to:
• Increased accessibility and a reduction in the stigma of visiting a food bank.
• An increase in referrals for particular food banks. In urban areas, where referral agencies are
nearby to several food banks, they may be more likely to refer to a food bank in their area
which offered a delivery service, if another didn’t.
The switch to a delivery model may however have reduced the number of parcels distributed by some
food banks due to:
• People believing a food bank was closed or lacking information on how to access their services.
• Delays to delivery, or an inability to guarantee delivery at all due to high levels of need, which
may have pushed people to seek alternative provision.
Parcel sizes
Some food banks have increased the size of some or all the parcels they provide. Food banks typically
distribute a three-day parcel, but during the crisis seven-day parcels have been distributed, both as a
response to increased need and as part of moving to a delivery model. Around 12% of households
who received a parcel between April 2020 and March 2021 received seven days of food. No
adjustment has been made to our figures to attempt to equivalise three- and seven-day parcels, with
just the total number of parcels distributed recorded. Each parcel is counted as one unit regardless of
size.
21 Lockdown, Lifelines and the Long Haul Ahead (2020), Trussell Trust, https://www.trusselltrust.org/wp-content/uploads/sites/2/2020/09/the-impact-of-covid-19-on-food-banks-report.pdf

9
A larger parcel may reduce repeat use of food banks due to the increased level of support being
provided. At a local level, some food banks that have been providing a high proportion of seven-day
parcels may see smaller percentage increases in parcels distributed, despite offering a higher level of
support to people. Some of these differences can be seen in the statistics that the Trussell Trust
collects on the total weight of food distributed. While total parcels distributed in the UK has increased
by 33%, the increase in the weight of food distributed is significantly higher at 53%. This trend is seen
in most places in the UK, with the percentage increase in the weight of food distributed generally
higher than the percentage increase in the number of parcels distributed, except in Northern Ireland.
As can be seen in Table 1.6, this serves to slightly reduce the differences seen in the four nations and
devolved administrations of the UK.
Table 1.6. Comparing changes to parcel numbers to changes to tonnage amounts.
% change in number of parcels distributed
% increase in tonnage of food distributed
UK 33% 53% England 41% 62% Northern Ireland 75% 67% Scotland -7% 6% Wales 8% 25%
Food bank referral agency closures
Just as lockdown, restrictions and social distancing had an impact on the running of individual food
banks, so did they affect the agencies and partners that in normal times refer people to food banks.
Many struggled to operate in the opening weeks of the crisis and had to move to operating online or
over the phone. In some areas there continue to be fewer referral partners than normal, and many
referral partners have continued to deliver telephone or digital referrals only throughout the last year.
In the vast majority of circumstances, food banks in the Trussell Trust network require a referral in
order to access support. These additional barriers may therefore have meant that people had to, or
chose to, access emergency food through alternative emergency food providers that did not require
a referral. Findings from the case study research suggested that fewer referrals from some referral
partners due to their inability to operate as usual had an impact on the numbers being referred to,
and in turn using, food banks in the Trussell Trust network. Other referral partners began to direct
people to new food parcel provision made available in local areas over the pandemic.22
Food banks operate in a variety of local, regional and national contexts
Several factors external to food banks and their operations have also had an impact on the numbers
of parcels that have been distributed by food banks in the Trussell Trust network. These include local,
regional and national variations in policy and populations, as well as the crisis response environment
in each area.
Local community food provision
One of the most significant factors may be the huge increase in alternative emergency food provision
that has occurred since the start of the pandemic. Research indicates that the scale of response to
22 Investigating outlier trends in Trussell Trust food bank usage over the COVID-19 crisis in the UK. Loopstra, Goldberg, Gordon & Lambie-Mumford.

10
food insecurity during the crisis has been of a historic scale and complexity across the UK.23 Additional
support has come from all sectors (public, private and voluntary) and at all levels (local, national and
UK).24 Both this research and work from the Trussell Trust indicate that the scale of alternative
provision may have resulted in people experiencing food insecurity (or destitution) accessing these
forms of provision rather than using food banks in the Trussell Trust network.25
Research carried out on behalf of the APPG on Faith and Society found that 71% of local authority
respondents said at least one new food bank had been started in their area to support people in
financial crisis in response to Covid-19.26 Over two in five (44%) stated that other organisations such
as food pantries had also been started in response to Covid-19.
Similarly, research conducted on behalf of Kellogg’s in February indicated that it was common for
schools to set up new emergency provision for children and families, as a response to the pandemic.
In total, 81% of teachers said their school had started providing some form of emergency support to
children and families as a result of the crisis, including 18% of teachers reporting that their school had
started a food bank and 5% saying their school had started providing emergency loans to families.27
The Independent Food Aid Network (IFAN), which represents more than 500 independent food banks
across the UK, have identified at least 1034 independent food banks operating in the UK in addition
to Trussell Trust, Salvation Army and school-based food banks. Their latest UK-wide data showed an
110% increase in need for emergency food parcels, when comparing February to November 2020 with
the same period in 2019.
Evidently, in many local communities, food banks in the Trussell Trust network have only been a part
of the emergency food provision during the pandemic.
23 Monitoring responses to risk of rising food insecurity during the COVID-19 crisis across the UK http://speri.dept.shef.ac.uk/wp-content/uploads/2020/12/Monitoring-responses-to-risk-of-rising-food-insecurity-during-the-COVID-19-crisis-across-the-UK-FINAL-1.pdf 24 Mapping responses to risk of rising food insecurity during the COVID-19 crisis across the UK, (2020), Lambie-Mumford et al http://speri.dept.shef.ac.uk/wp-content/uploads/2020/08/Food-Vulnerability-During-COVID-19-first-project-report.pdf 25 Lockdown, Lifelines and the Long Haul Ahead (2020), Trussell Trust, https://www.trusselltrust.org/wp-content/uploads/sites/2/2020/09/the-impact-of-covid-19-on-food-banks-report.pdf 26 Keeping the Faith: Partnerships between faith groups and local authorities during and beyond the pandemic, (2020), Baker, C, Report for the APPG on Faith and Society, https://www.faithandsociety.org/wp-content/uploads/APPG_CovidReport_Full_V4.pdf 27 1097 UK Primary and Secondary teachers aged 18+ were interviewed online by YouGov on behalf of Kellogg’s, 8th – 17th February 2021.

11
Food banks in the Trussell Trust network provide support through a referral system where people can
receive emergency food because they are referred by a specific agency or support organisation to the
food bank. This is designed to help the food bank target support to people experiencing financial
hardship and link to external organisations that can help tackle the underlying cause of their crisis.
Some of the new emergency food provision schemes may have chosen not to have formal referral
processes of the type that are in place in food banks in the Trussell Trust network. This may mean that
at points during the crisis people may have found it easier to access food through these routes than
through food banks in the Trussell Trust network.
This may also depend on which services local councils promoted. The case study research identifies
that several agencies actively contacted their client base to ensure that they knew where to access
support. This had contrasting impacts. In some areas it meant people were better equipped to avoid
food insecurity and needing support from a food bank, while in other areas organisations actively
signposted to food bank which could have increased support levels.28
At a personal level people may have also felt more comfortable accessing support from new
community food provision. Research by the Food Standards Agency suggests that for some people
there may be a degree of stigma which makes it harder to use a food bank, or means people look for
other ways of managing first.29 Receiving support from a school, or a community group that a person
is already engaged with, may present less of an emotional barrier than receiving support through a
food bank.30
Government food provision
Much of the additional food provision and distribution in the last six months has been organised or
managed by different levels of government.
Food parcels were provided during April to June 2020 via local and devolved government, to support
people whose health conditions required them to shield. Although these were delivered to people
vulnerable because of their health and not targeted at those experiencing financial crisis, we know
that there is significant overlap between the two. Previous research has found that 75% of people
using a Trussell Trust food bank reported that health issues affected someone in the household, while
28 Investigating outlier trends in Trussell Trust food bank usage over the COVID-19 crisis in the UK. Loopstra, Goldberg, Gordon & Lambie-Mumford. 29 The lived experience of food insecurity under Covid-19 (2020) Food Standards Agency, https://www.food.gov.uk/sites/default/files/media/document/fsa-food-insecurity-2020_-report-v5.pdf 30 Investigating outlier trends in Trussell Trust food bank usage over the COVID-19 crisis in the UK. Loopstra, Goldberg, Gordon & Lambie-Mumford.
Example: In one case study area (a London borough) that saw a decrease in Trussell Trust food bank use over April to September, the council initiated a new food parcel delivery scheme specifically aimed to target people who were classed as “non-shielding vulnerable” over April to August. This targeted both people who were economically vulnerable and not economically vulnerable but in either case, were unable to go out to shop for food. In this same area, existing community organisations were also supported to integrate food provision into their activities through the council and their partners, which provided access to surplus food and emergency individual meals. Of the 34 organisations supported in this way, only 7 had been offering food before the crisis and 19 had not been (it was unclear whether the remaining 7 had or had not offered food before the crisis).

12
a quarter of households were affected by a long-term physical health condition.31 The delivery of food
parcels to people told to shield might therefore have resulted in fewer people in financial crisis
needing to visit a food bank in the Trussell Trust network.
In some areas, however, supporting the delivery of food for shielding people may have had the
opposite effect on the number of food parcels given out by food banks in the Trussell Trust network.
For example, some food banks in Northern Ireland were involved in distribution, although food
delivered to those shielding is not included in this data. This may partially explain why Northern Ireland
has experienced the largest percentage increase in the number of food parcels distributed over the
last year.
Beyond providing support for people who were shielding, many councils have often also been involved
in the co-ordination of emergency food provision for those who are economically vulnerable. This may
have had varied impacts in different areas. For instance, some food banks saw significant increases
from local authorities as people were signposted to them.32 In other areas people may have been
referred directly to other food providers, or they may have been referred to local and devolved
welfare assistance programmes where they would have been referred to a Trussell Trust food bank in
the past.33
Example: In one city where the Trussell Trust food bank was embedded within the local welfare support system before the COVID-19 crisis, during the crisis, partners who would normally have directed people to the Trussell Trust food bank, were instead directing them to the Local Welfare Support Scheme. This operated a triaging system, with the council delivering parcels to those in most urgent need and referring to community hubs throughout the city for those whose need was less pressing.34
There have often been specific programmes run for groups that may be more at risk of financial and
food insecurity. For instance, the UK government made up to £16 million available for frontline
charities and community groups in England – such as refuges and homeless shelters – to enable them
to provide meals.35 Councils have also provided specific schemes for these groups.
Policy differences
Beyond food provision and lockdown measures, other policy differences between different local and
devolved governments may also be a factor in the differing levels of need seen by food banks in the
31 State of Hunger (2019), Trussell Trust, https://www.stateofhunger.org/wp-content/uploads/2019/11/State-of-Hunger-Report-November2019-Digital.pdf 32 Investigating outlier trends in Trussell Trust food bank usage over the COVID-19 crisis in the UK. Loopstra, Goldberg, Gordon & Lambie-Mumford. 33 Local and devolved welfare assistance refers to schemes providing support to low income households in crisis, run by some local authorities in England, and by national governments in Scotland, Wales, and Northern Ireland. 34 IBID 35 £16 million for food charities to provide meals for those in need, (2020), DEFRA and DCMS, https://www.gov.uk/government/news/16-million-for-food-charities-to-provide-meals-for-those-in-need
Some examples from our case study areas include meals being provided by the council for homeless people who were temporarily housed over the lockdown. As rough sleepers have previously been over-represented in food banks, providing meals and shelter may have meant they did not access food banks over this period.

13
Trussell Trust network. Local and devolved welfare assistance, for example, is a form of crisis support
that varies greatly across the UK, with a centralised approach taken in Wales and Northern Ireland, a
central fund delivered through local councils in Scotland, and local councils in England each having
different approaches.36 The criteria and assessment processes for accessing these schemes are varied,
as are the types of support available following a successful application.
In some cases, schemes have been made more generous, more accessible, or both, as a result of the
pandemic. One example is the Discretionary Assistance Fund (DAF) in Wales, a centralised assistance
scheme which provides grants to people in Wales who are experiencing crisis. One aspect of the DAF
is an Emergency Assistance Scheme, which provides cash support to those who are unable to cover
essential costs such as food. Between 1 May 2020 and 31 September 2021, applications made for an
EAP because of hardship caused by the coronavirus pandemic have more relaxed eligibility criteria.
The maximum number of grants a person can receive has increased from three to five, and the
minimum length of time between grants has reduced from 28 days to seven.
Although more evidence is needed on the impact of local and devolved welfare schemes, these
changes have been welcomed by front-line service providers, who generally view these as important
steps for supporting people in crisis.37 Local welfare provision in each area could well have had an
impact on the role food banks in the Trussell Trust network have played within their local crisis support
context.
Access to support for the families of children eligible for free school meals has also varied across the
UK – for example, while 18 of 22 local authorities in Wales opted for a bank transfer to be available in
place of in-kind free school meal provision, the scheme rolled out across England provided
supermarket vouchers.
Differences in lockdown restrictions
Our data suggests that strict lockdowns may play a part in the different levels of need reported by
food banks in the Trussell Trust network. It’s possible that this is related to the availability of informal
support from friends and family: research shows that having informal support available can help
prevent people from needing to use a food bank, and lockdowns severely restrict or even end the
availability of this support for many. The first lockdown in the UK did not include any ‘support bubble’
provision – later lockdowns generally have, although this has varied. Lockdowns have also been
associated with lower levels of economic activity that might reduce people’s incomes.
Since May 2020, restrictions in England, Scotland, Wales, and Northern Ireland have differed from
each other, including with different rules around support bubbles and in-person schooling. Although
restrictions have varied, periods with fewer restrictions generally across the UK saw lower numbers
of parcels provided. It is difficult to identify the extent to which this was a causal factor given the many
other possible factors as outlined here.
National and regional variation in the economic impact of the crisis
36 Local Lifelines (2020), Trussell Trust, https://www.trusselltrust.org/wp-content/uploads/sites/2/2020/10/LWAS_1020_v3.pdf 37 Monitoring responses to risk of rising food insecurity during the COVID-19 crisis across the UK http://speri.dept.shef.ac.uk/wp-content/uploads/2020/12/Monitoring-responses-to-risk-of-rising-food-insecurity-during-the-COVID-19-crisis-across-the-UK-FINAL-1.pdf

14
Other national and regional differences, such as demographic variations and the concentration and
type of employment in the area, are also likely to have affected the number of parcels distributed by
food banks in our network.
For example, experimental DWP data shows regional variation in the alternative Claimant Count, and
the extent to which the alternative Claimant Count has increased since February 2020.38 The table
below indicates that London has seen the greatest increase in claims, with the North East the
smallest.39
Table 1.5. The rates of people receiving unemployment benefits vary across the UK
Region Alternative Claimant
count: Feb 2020 Alternative Claimant
count: Feb 2021 Percentage increase, Feb 2020 – Feb 2021
UK 1,401,527 2,867,136 105% England 1,181,312 2,461,917 108% Northern Ireland 34,357 64,760 88% Scotland 118,237 217,599 84% Wales 66,685 119,040 79%
East Midlands 89,873 177,402 97% East of England 102,479 228,872 123% London 227,414 565,056 148% North East 77,345 121,075 57% North West 176,388 331,465 88% South East 138,581 325,583 135% South West 82,797 182,134 120% West Midlands 157,941 290,009 84% Yorkshire & The Humber
128,494 240,321 87%
Food banks in areas which have experienced larger increases in the rate of unemployment may have
seen increased levels of need as a result. It’s clear that different sectors of the labour market have
been differently affected by the pandemic – and the uneven spread of employment in each sector
across the UK is one reason for the uneven distribution of unemployment increases. For example: the
ONS noted in March 2021 that, of the 693,000 decrease in payrolled employees since February 2020,
more than a third (368,000) are the result of a reduction in employees working in the accommodation
and food services sector, while a further sixth (123,000) of the reduction was experienced in the
wholesale and retail sector.40 Both the accommodation and food services, and retail sectors are
concentrated in urban areas, and in city centres in particular.
Demographic factors may also play a role. The Resolution Foundation notes that young people have
been more likely to experience negative employment consequences than other working-age people,
and have lost working hours, experienced lower pay, been put on furlough and lost jobs at higher
38 The alternative Claimant Count measures unemployment by modelling what the count would be if Universal Credit had been fully rolled out since 2013. This helps provide more meaningful insights to changes in the local labour market than the Claimant Count measure. 39 Alternative Claimant Count statistics January 2013 to February 2021, (2021), DWP, https://www.gov.uk/government/statistics/alternative-claimant-count-statistics-january-2013-to-february-2021/alternative-claimant-count-statistics-january-2013-to-february-2021 40 Labour market overview, UK: March 2021, (2021), ONS, https://www.ons.gov.uk/employmentandlabourmarket/peopleinwork/employmentandemployeetypes/bulle tins/uklabourmarket/march2021#labour-market-data

15
rates.41 Workers under 25 have accounted for nearly two-thirds (437,000) of the total fall in payrolled
employment.42
As well as uneven labour market impacts on different demographic groups, the Food Standards
Agency shows that food insecurity is far higher in some demographic groups: most notably young
people, families with children, people identifying as Black or Black British, and those in poor health.43
Food banks in our network have also noted that people with no recourse to public funds may need
more frequent support from a food bank because they are more likely to be entirely reliant on
voluntary sector support in a financial crisis, and for longer periods of time.
These factors combined may mean that urban areas have seen proportionally bigger increases in need
than rural areas.
41 Uneven steps: Changes in youth unemployment and study since the onset of Covid-19, (2021), Resolution Foundation, https://www.resolutionfoundation.org/app/uploads/2021/04/Uneven-steps.pdf 42 Labour market overview, UK: March 2021, (2021), ONS, https://www.ons.gov.uk/employmentandlabourmarket/peopleinwork/employmentandemployeetypes/bulletins/uklabourmarket/march2021#labour-market-data 43 Food and You 2 Survey: Wave 1, (2021), Food Standards Agency https://www.food.gov.uk/research/food-and-you-2/food-and-you-2-wave-1

16
About the data
Data collection
Data from food banks in the Trussell Trust network is collected via vouchers that are issued by referral
agencies, such as health visitors, schools, social workers, and organisations such as Citizens Advice.
These agencies assess people for financial hardship before referring them to a food bank. This means
that the overwhelming majority of people receiving support via a food bank in the Trussell Trust
network do so because of financial hardship.44
Most vouchers are digital, ensuring data processing is complete as soon as the voucher is fulfilled.
However, a significant minority of vouchers continue to be issued on paper. These vouchers must be
manually uploaded by food bank staff. This can often lead to significant lags in the data collection.
Following a period to allow food banks to complete their data entry, the data set out here acts as a
census of the total number of parcels distributed in the Trussell Trust network during the stated
period. Food banks are included regardless of whether they have confirmed their data is up to date,
or whether they closed for periods during the crisis. Food banks that left the network during the year
are also included in these statistics.
The end-of-year statistics cover the period 1 April 2020 – 31 March 2021 (inclusive) and compares to
the same period in 2019/20. Data was collected up until 5pm 12 April 2021 and comes from the 1,471
distribution centres across the UK which provided emergency food parcels as part of the Trussell Trust
network, in 2020/21. In 2019/20, 1,504 distribution centres supported people with emergency food
parcels at some point between 1 April – 31 March. Distribution centres are not counted as a point in
time. They are instead counted if they’ve distributed food parcels at any stage during the specified
period. Some will have opened and subsequently closed during this period.
Data collected for 2019/20, including on the number of centres in operation, has been revised from
its last publication to account for additional data processing.
Data at regional and local authority level
Data at the local level has been analysed based on the location of the distribution centre which
provided each parcel, rather than where the household receiving each parcel is living. This means that
there might be some changes to local authority statistics that are heavily influenced by the opening
or closing, or other operational changes of the distribution centres based in those local authorities.
As an example, the South London Warehouse is a new food bank based in Lambeth. Due to operational
efficiencies this food bank now distributes all parcels referred via the pre-existing Vauxhall, Waterloo,
Norwood & Brixton, and Clapham Park food banks. The Waterloo food bank was based in Southwark,
so this will have the effect of increasing Lambeth’s numbers, while decreasing Southwark’s.
Some food parcels are distributed as ‘emergency food boxes’ these are made up and given to frontline
services such as the fire service to immediately distribute to those in acute need. Where these parcels
44 Research conducted during the pandemic indicates that 95% of households that needed to use a food bank were living in relative poverty after housing costs. Lockdown, Lifelines and the Long Haul Ahead (2020), Trussell Trust, https://www.trusselltrust.org/wp-content/uploads/sites/2/2020/09/the-impact-of-covid-19-on-food-banks-report.pdf

17
are not recorded as being distributed by a particular distribution centre, they have been proportionally
distributed across the other distribution centres within that food bank.
We would recommend not comparing directly between local authority statistics , this is because our
analysis of the data indicates that there are too many overlapping factors that are driving variations
in the data. This makes comparisons, and the identification of drivers of change and difference
between areas, difficult.
Distribution centres are matched to local authorities using postcodes provided by the food bank, and
looking them up to the national statistic postal lookup file (NSPL). Some food banks provide emergency
food boxes. These are pre-prepared food parcels that are given to frontline organisations such as
firefighters, or police to give immediately to people in need. These parcels are not tagged to any
distribution centre. Where a food bank distributed emergency food boxes these have been
proportionally distributed across the local authorities in which the distribution centres of that food
bank operate.
Parcel size statistics
The Trussell Trust has previous reported parcels as “three-day emergency food parcels”. In response
to the operational challenges that many food banks were facing some took the decision to distribute
larger seven-day parcels. These were more practical to deliver, and it was felt that they may reduce
the incidence of repeat support being needed. Around 12% of households who received a parcel
between April 2020 and March 2021 received seven days of food.
For this release the Trussell Trust has simply combined both three-day and seven-day parcels together
to report the total number of emergency food parcels that were distributed. More work needs to be
carried out to determine what impact providing a seven-day parcel has on repeat visitation before the
Trussell Trust can accurately equivalise between the two. It is unclear whether providing seven days
of food will significantly reduce the likelihood of needing support from a food bank in the near,
medium, or long term.
As discussed, this means that the overall 33% increase that is reported does not fully reflect the
additional support that has been provided, with a 53% increase in the total weight of food distributed.
However, because some food banks distributed a higher proportion of seven-day parcels than others
this may skew some statistics at a local or regional level.