Embed Size (px)
Citation preview

TRUST BOARD
TITLE Operational Performance Report
EXECUTIVE SUMMARY
The Trust missed the 4 hour A&E standard in June with performance recorded at 93.09%. Patient flow was difficult through June due to the closure of the Ashford rehabilitation beds (on schedule) without community rehabilitation resources becoming fully available. Trust wide 18 weeks Admitted Performance remained compliant for June although General Surgery & Urology experienced difficulty at specialty level. The 18 weeks Non-admitted standard also remained compliant whilst the Incomplete standard also continued to be recorded 3% points higher than the national average. All Cancer performance standards for June (including 2 week rule & 62 day referral to treatment) were compliant, except the 62 day screening standard (as a result of one breach due to a lengthy delay at a non-ASPH screening centre).
BOARD ASSURANCE (RISK) / IMPLICATIONS
Compliance is reflected in the Board Assurance Framework. BAF Risk 1.1 National targets and priorities.
ALIGN TO TRUST RISK REGISTER
SO1: To achieve the highest possible quality of care and treatment for our patients, in terms of outcome, safety and experience. SO3: To deliver the Trust’s clinical strategy of joined up healthcare.
STAKEHOLDER / PATIENT IMPACT AND VIEWS
Patient expectations in terms of access are reflected in NHS performance targets.
EQUALITY AND DIVERSITY ISSUES
None identified
LEGAL ISSUES None identified
Trust Board is asked to:
Review the paper and discuss the contents seeking additional assurance as necessary.
Submitted by: Lorraine Knight, Interim COO
Date: 22/07/2015
Decision: For Assurance
Page 2 of 20
DomainCompliance
threshold
Q1
2014
Q2
2014
Q3
2014
Q4
2014Apr May Sparkline
June
(prov)Performance Issues
July
(est)
MONITOR Q1
(prov)
94.2%
92.6%
96.3%
MONITOR - JUNE & Q1 PERFORMANCE UPDATE - inc. JULY ESTIMATE
93.3%
Failure of 1 month
during the Qtr = Qtr
failure (lowest value
reported for Qtr).
Compliant
performance May &
June.
Standard
Maximum time of 18 weeks from point
of referral to treatment in aggregate
(NON-ADMITTED PATIENTS)
95%RTT
A&E
Maximum waiting time of four hours
from arrival to
admission/transfer/discharge
95%
90.6%
95.3%
95.2%
96.3%
Non-Admitted Performance remained compliant for June at 96.3%.
At specialty level;
-General Surgery & Gastroenterology recorded breaches as a result of the
Trust’s position in endoscopy,
-Dermatology due to lost clinical capacity following the departure of two
consultants with locums difficult to obtain. The posts are now covered with
additional capacity planned to recoup the deficit (with recovery expected
within 3 months), &
-Neurology due to high demand, diagnostic delays & waiting the
commencement of the 3rd consultant who has now started.
Underperforming specialties have remedial action plans in place to improve
performance. A Demand & Capacity & action plan review is scheduled with NHS
England's Intensive Support Team (IST) during July to test the robustness of the
Trust's remedial plans for GS, Urology & Gastroenterology.
A&E Performance showed 0.46% improvement ahead of trajectory at 93.1%
although missed the 95% target. Patient flow was difficult through June due to
the closure of the Ashford rehabilitation beds to schedule without community
rehabiliation resources becoming fully available.
An extensive Urgent Care Improvement Programme is underway with the
following workstreams to expedite patient care, signposting & efficient
treatment;
W1 - Revision of the ED Acute Referral to Specialty Policy to expedite clinical
specialty review
W2 - Revision of Standard Operating Procedures to include innovation (Rapid
Assessment & Treat, Acute Hub & Point of Care testing)
W3 - Initiatives to reduce patient ward Length of Stay & Early Supported
Discharge
W4 - Reduce Delayed Transfers of Care & Complex Discharges (including
creation of an Integrated Discharge Team)
W5 - Create an Urgent Care Centre as the front door triage to A&E
W6 - Create a Paediatrics Assessment Unit co-located with Paed's ED
W7 - Local health & social care providers (led by NWS CCG) have engaged with
Alamac Consultancy to improve system healthcare performance & change
management support
95.2%
95.2%
88.6%
92.1%
92.5%
84.9%
88.5%
88.9%
88.5%
Admitted Performance remained compliant for June at 92.2%.
At specialty level;
-General Surgery continues to reduce its admitted backlog although the Trust’s
position with delays in endoscopy continue to impact Upper and Lower GI
pathways,
-Urology continues to tackle its admitted backlog over the course of June, &
-Paediatrics (1 breach out of 5 patients) as a result of a complex pathway &
multiple non-attendances by the patient.
Underperforming specialties have remedial action plans in place to improve
performance. A Demand & Capacity & action plan review is scheduled end July
with NHS England's Intensive Support Team (IST) to test the robustness of the
Trust's remedial plans.
RTT
Maximum time of 18 weeks from point
of referral to treatment (ADMITTED
PATIENTS)
90%92.2%
96.3%
95.2%
95.0%
93.1%

Page 3 of 20
Radiotherapy 94% n/a n/a n/a n/a n/a n/a n/a n/a n/a
100%
96.7%
94.7%
95.3%
97.6%
100%
100%
88.5%
90.0%
93.9%
94.7%
97.3%
100%
100%
CANCER
All cancers: 31-day
wait for second or
subsequent
treatment
Surgery 94%100%
100%
94.7%
86.8%
All urgent
referrals
93.9%
95.4%
95.0%
Cancer: two week
wait from referral to
date first seen
CANCER
Symptomatic
breast patients
The Trust experienced a higher than expected number of breaches (7) during
June although remained compliant. All breaches were as a result of patients
choosing to be seen after 14 days from referral.
Work has been underway with the CCG GP cancer lead to improve patient
information in GP Surgeries in an attempt to mitigate this issue.
100%
The Trust has experienced difficulty achieving this standard due to patients
choosing to book after 14 days and delays to straight-to-test endoscopy
procedures.
With a revised escalation & engagement process having been introduced, we
have seen better engagement, with a return to compliance during May & June
although patient choice remains a significant risk.
Work has been underway with the CCG GP cancer lead to improve patient
information in GP Surgeries in an attempt to mitigate this issue.
RTT
Maximum time of 18 weeks from point
of referral to treatment in aggregate
(INCOMPLETE PATHWAYS)
92%
Incomplete Pathway performance remained compliant for June at 96.3%.
At specialty level;
-General Surgery experienced delays to upper gastro-intestinal and colorectal
pathways as a result of the Trust’s position in endoscopy, &
-Neurology due to high demand, diagnostic delays & waiting the
commencement of the 3rd consultant, who has now started.
98.2%
99.1%
98.0%
n/a
All cancers: 31-day wait from diagnosis
to first treatmentCANCER 96%
100%
98.3%
93%93.4%
96.9%
95.5%
94.7%
91.1%
95.3%
96.1%
93.5%
93.4%
93.8%
91.0%
89.9%
93%
72.0%
82.8%
76.9%
85.0%
This standard is recorded as compliant at 89.1%. The Trust continues to deliver
its Cancer Improvement Action Plan which aims to further address the recent
issues regarding cancer performance. Many of the risks to performance
against this standard require continued careful monitoring.
The Trust is also reviewing a number of key cancer pathways to further reduce
the risk of delays.
100%
100%
Drug Treatment 98%100%
100%
100%
100%
100%
The Trust experienced difficulty achieving this standard in Q4 due to the
backlog in Urology procedures & patient preference to delay treatment.
However April, May & June's position have remained compliant.
89.8%
96.3%
96.1%
93.2%
96.1%
CANCER
All cancers: 62-day
wait for first
treatment
NHS Cancer
Screening Service
referral
90%92.0%
97.3%
100%
100%
100%
The Trust had 1 breach in this standard, although due to very low referrals has
recorded non-compliance at 75.0%.
The Trust treated the patient within a compliant 4 weeks of referral, however a
delay of 4wks & a failed colonoscopy polyp removal by the Screening Centre
caused the breach.
[The Trust position has been revised for May as the late referral breach via the
Frimley Screening Centre has been confirmed as a colonoscopy with polyp
removal counting as First Definitive Treatment].
89.1%
75.0%
n/a
Urgent GP referral
for suspected
cancer
85%82.2%

Page 4 of 20
Feb-15 Mar-15 Apr-15 May-15 Jun-15 Sparkline
Total 6847 8064 7630 8032 7795
Avg Att per day 245 260 254 259 251
Total 1734 1882 1914 1988 1804
Avg Adm per day 62 61 64 64 60
Breaches Total 825 1136 918 715 859
% Breaches late Specialty Total 34.1% 28.5% 25.3% 13.4% 23.9%
% Breaches late Dr/ENP Total 8.8% 4.4% 3.6% 3.5% 2.5%
Number of Breaches by Minors Total 102 146 94 94 85
Delay Transfers of Care Total 644 661 938 748 817
Complex Discharges Total 1324 1509 1214 1424 1099
A&E 4hr Performance % (Monitor) Total 92.79% 91.49% 92.51% 94.25% 93.09%
A&E 4hr Performance % (St Peters) Total 87.95% 85.95% 87.96% 91.07% 88.99%
A&E PERFORMANCE UPDATE
A&E A&E
INPUTS
Attendances
Admissions
CONTROLS
OUTPUTS
Performance:
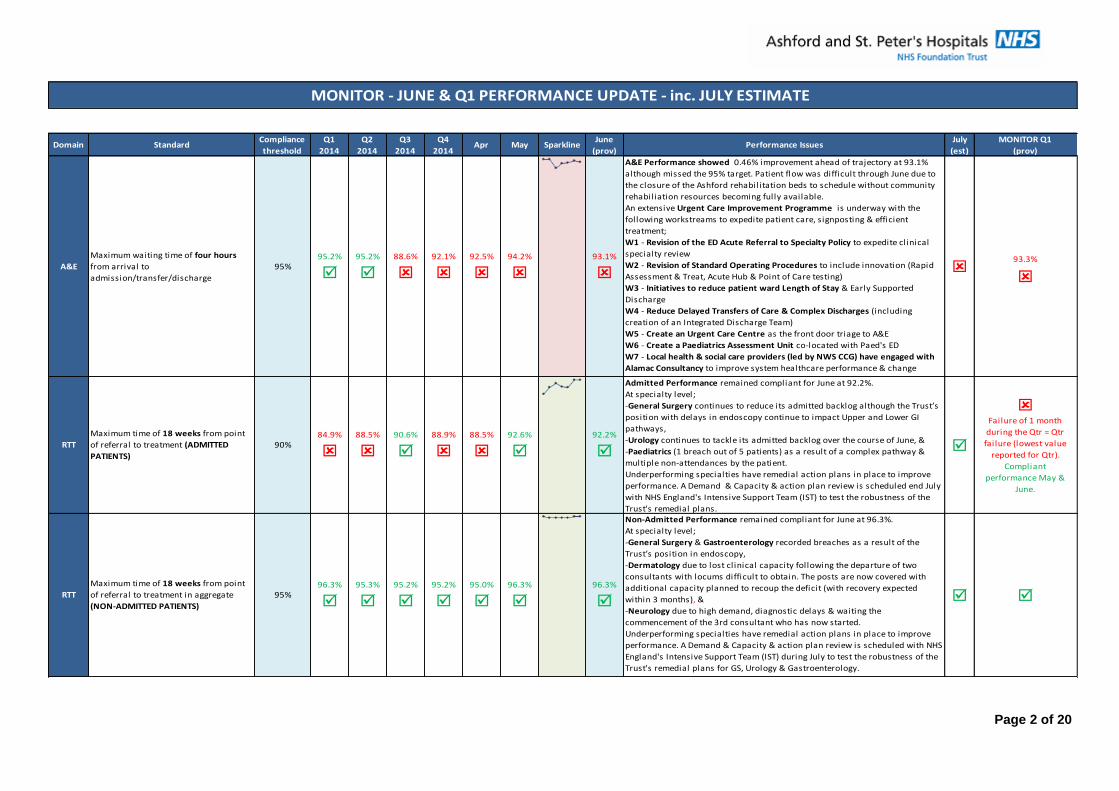
The Trust missed the 4 hour A&E CCG contract standard in June with St Peters site A&E, GUM & EPU performance recorded at 90.36% [Monitor
performance (inc Ashford) = 93.08%]. Although the target of 95% wasn’t achieved, it was 0.46% ahead of the 89.9% Trust recovery trajectory.
June’s A&E attendances at 7,795 were lower than May (8,031) although comparable to June 2014 with a daily average of 260 patients attending
per day (Apr=254 & May=259).
Admissions via A&E for June at 1,804 (daily average = 60) was lower than the previous 4 months (Feb-May where the daily average = 62) although
broadly comparable to last June 2014 when the daily average was 59 per day.
The Trust’s A&E performance showed improvement ahead of trajectory for June, despite the closure of 2 rehabilitation wards at Ashford where
rehabilitation & step-down provision for the closing wards was not readily accessible. This caused difficult patient flow during the month due to
the high levels of delay when discharging patients with complex care to the community.
Improvement Activity:
An extensive Urgent Care Improvement Programme is underway with the following workstreams to expedite patient care, signposting &
efficient treatment;
W1 - Revision of the ED Acute Referral to Specialty Policy to expedite clinical specialty review
W2 - Revision of Standard Operating Procedures to include innovation (Rapid Assessment & Treat, Acute Hub & Point of Care testing)
W3 - Initiatives to reduce patient ward Length of Stay & Early Supported Discharge
W4 - Reduce Delayed Transfers of Care & Complex Discharges (including creation of an Integrated Discharge Team)
W5 - Create an Urgent Care Centre as the front door triage to A&E
W6 - Create a Paediatrics Assessment Unit co-located with Paed's ED
W7 - Local health & social care providers (led by NWS CCG) have engaged with Alamac Consultancy to improve system healthcare
performance & change management support
Page 5 of 20
Performance:
Page 6 of 20
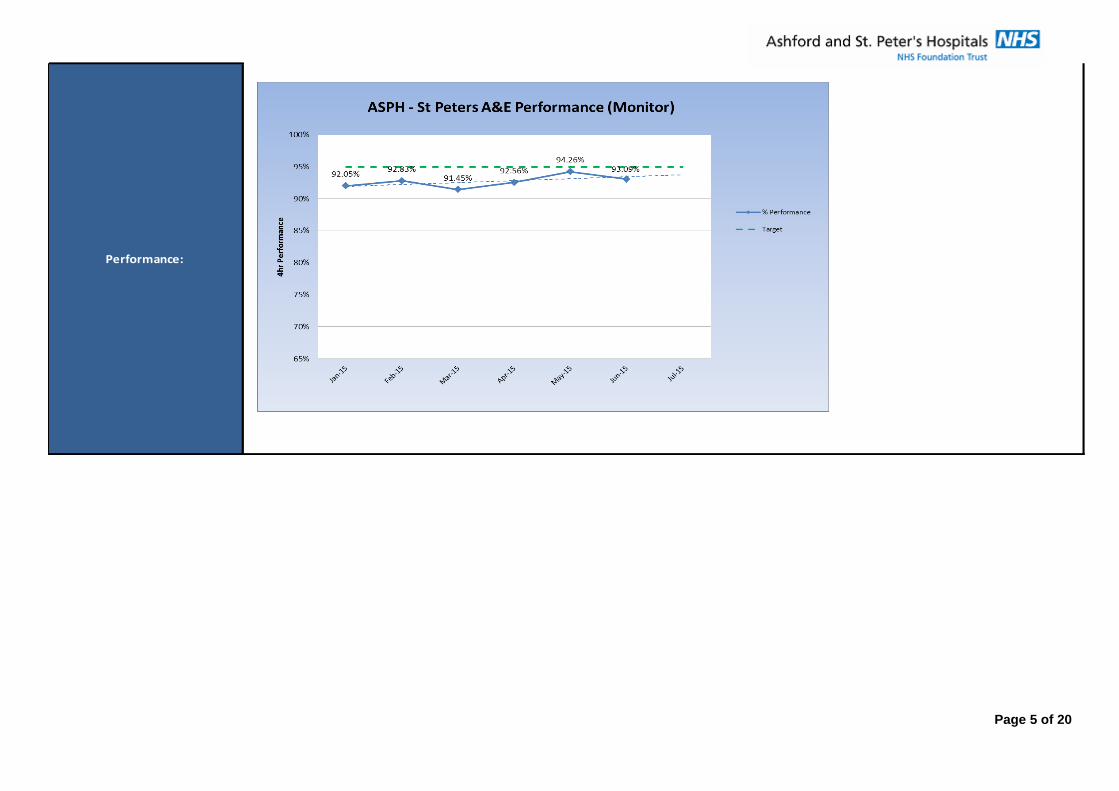
Feb-15 Mar-15 Apr-15 May-15 Jun-15 Sparkline
Colorectal 379 414 395 328 383
Breast 301 269 257 260 295
Upper GI 85 94 98 56 47
Vascular 150 147 160 139 162
Total 915 924 910 783 887
Admitted Pathway Activity Total 273 313 291 293 270
Non-Admitted Pathway Activity Total 594 649 585 531 631
RTT Admitted Pathway % Total 84.13% 78.64% 81.79% 88.21% 87.36%
RTT Non-Admitted Pathway % Total 89.62% 88.64% 88.53% 89.40% 91.18%
RTT Incomplete Pathway % Total 90.83% 90.29% 91.02% 92.93% 90.77%
Waiting List Size Total 2616 2559 2695 2695 2688
Backlog Size (>18wks) Total 235 243 241 196 248
RTT PERFORMANCE UPDATE
RTT GENERAL SURGERY
INPUTS Referrals
CONTROLS
OUTPUTS
Performance:
General Surgery has been making good progress over Q1 recovering from the elective cancellations as a result of emergency bed pressures,
although due to staffing issues at Ashford it has been necessary to reschedule a number of patients from June to July which will cause additional
breaches being recorded. The specialty is also experiencing delays in upper gastro-intestinal and colorectal pathways as a result of the Trust’s
position in endoscopy.
Continuing progress has been seen in General Surgery Non-Admitted Pathway (NAP) standard, although the Trust's endoscopy position is now
impacting the specialties Admitted & Incomplete Pathway standards.
The specialty will continue to treat additional long waiters during July to reduce the admitted backlog with an estimated return to Admitted
compliance from August. Further improvement in NAP & Incomplete Pathway performance is reliant on improvement being seen in the Trust's
endoscopy position. Additional external resources to enhance the Trust's endoscopy capacity commenced mid-June.
Improvement Activity:
A number of improvement actions have been underway, which include;
1 - Adherence to the 6-4-2 rule ensuring theatre sessions are fully booked, staffing optimised & utilisation maximised
2 - Providing additional surgical l ists during the week & at weekends to reduce the backlog
3 - Tracking & expediting long waiting patients
4 - Providing additional outpatient clinics
5 - A Colorectal pathway improvement event where pathways have been reviewed with actions to optimise being implemented
Page 7 of 20
Feb-15 Mar-15 Apr-15 May-15 Jun-15 Sparkline
INPUTS Referrals Total 279 389 380 330 325
Admitted Pathway Activity Total 83 101 126 90 103
Non-Admitted Pathway Activity Total 161 179 237 192 229
RTT Admitted Pathway % Total 80.49% 81.00% 68.25% 80.90% 87.38%
RTT Non-Admitted Pathway % Total 91.25% 97.77% 92.80% 94.82% 97.84%
RTT Incomplete Pathway % Total 91.27% 91.63% 95.26% 96.29% 94.85%
Waiting List Size Total 781 838 805 854 796
Backlog Size (>18wks) Total 69 76 42 36 41
RTT PERFORMANCE UPDATE
RTT UROLOGY
CONTROLS
OUTPUTS
Performance:
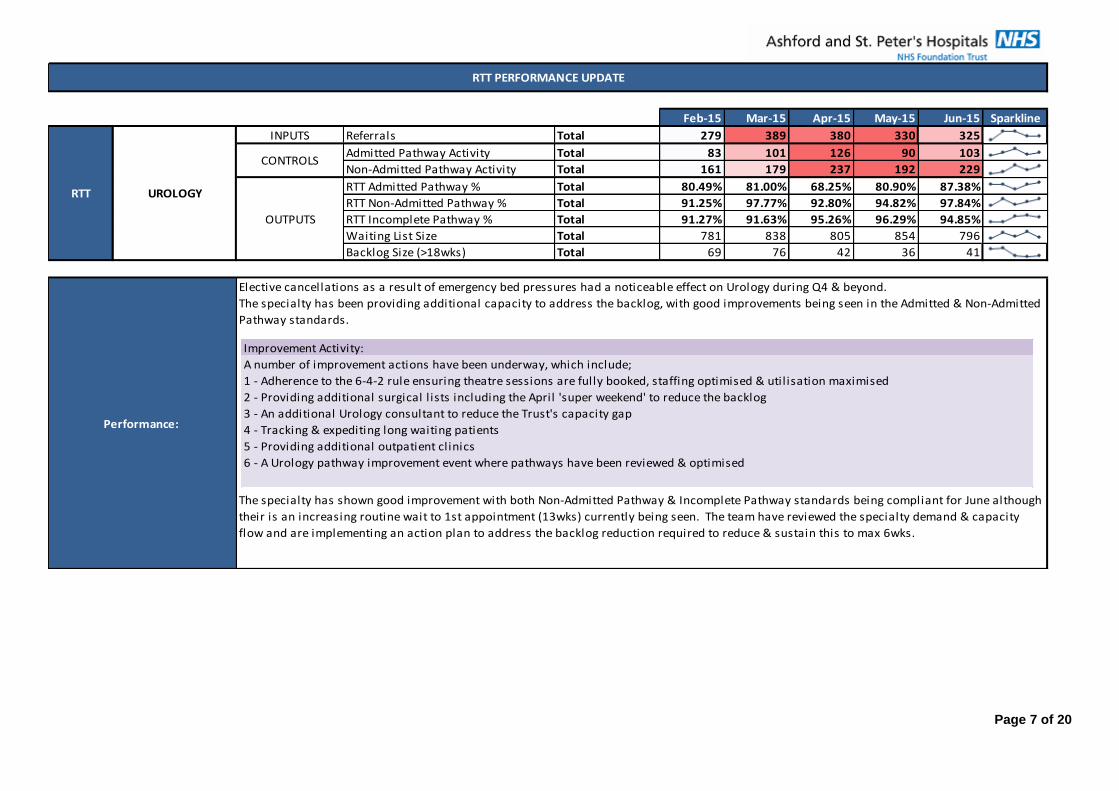
Elective cancellations as a result of emergency bed pressures had a noticeable effect on Urology during Q4 & beyond.
The specialty has been providing additional capacity to address the backlog, with good improvements being seen in the Admitted & Non-Admitted
Pathway standards.
The specialty has shown good improvement with both Non-Admitted Pathway & Incomplete Pathway standards being compliant for June although
their is an increasing routine wait to 1st appointment (13wks) currently being seen. The team have reviewed the specialty demand & capacity
flow and are implementing an action plan to address the backlog reduction required to reduce & sustain this to max 6wks.
Improvement Activity:
A number of improvement actions have been underway, which include;
1 - Adherence to the 6-4-2 rule ensuring theatre sessions are fully booked, staffing optimised & utilisation maximised
2 - Providing additional surgical l ists including the April 'super weekend' to reduce the backlog
3 - An additional Urology consultant to reduce the Trust's capacity gap
4 - Tracking & expediting long waiting patients
5 - Providing additional outpatient clinics
6 - A Urology pathway improvement event where pathways have been reviewed & optimised

Page 8 of 20
Feb-15 Mar-15 Apr-15 May-15 Jun-15 Sparkline
INPUTS Referrals Total 661 764 693 749 744
Breaches due to Patient Choice Total 27 53 48 32 28
% Breaches - Patient Choice Total 4.1% 6.9% 6.9% 4.3% 3.8%
Breaches due to Hospital Capacity Total 12 23 21 8 1
% Breaches - Hospital Capacity Total 1.8% 3.0% 3.0% 1.1% 0.1%
OUTPUTS 2 Week Wait % Total 94.10% 90.10% 91.20% 94.66% 96.10%
CANCER UPDATE
CANCER
Cancer: two week
wait from referral to
date first seen
CONTROLS
Performance:
This standard is recorded as compliant at 96.1% & remains ahead of the agreed recovery trajectory despite an increase in the number of actual
vs. estimated referrals throughout Q1.
The Trust has historically experienced difficulty achieving this standard due to patients choosing to book after 14 days and delays to straight-to-
test endoscopy procedures although remains ahead of the agreed recovery trajectory.
With a revised escalation & engagement process having been introduced, we have seen better engagement during June & ongoing compliance
although patient choice remains a significant risk.Improvement Activity:
A number of improvement actions have been underway, which include;
1 - A revised Cancer Services 2 Week Rule escalation process
2 - Revised 2 Week Rule booking form for GP Surgeries to aid patient engagement
3 - Protected Straight to Test Endscopy slots to enable earlier endoscopy provision for cancer patients (& further availability post 1st
appointment - although stil l within 14 days)
4 - An additional Urology consultant to reduce the Trust's capacity gap
5 - An additional Advanced Practitioner Breast Diagnostician to reduce the Trust's capacity gap
6 - Revised Cancer Services & Radiology reporting to monitor performance
Jan Feb Mar Apr May Jun Jul Aug Sep
Referrals Seen 603 661 764 674 669 647 715 593 656
Referrals Seen Within Standard 533 622 688 615 614 603 668 560 620
Performance Trajectory 88.4% 94.1% 90.1% 91.2% 91.8% 93.2% 93.4% 94.4% 94.5%
Performance Actual 88.4% 94.1% 90.1% 91.2% 94.7% 96.1%
2 Week
Referral

Page 9 of 20
Feb-15 Mar-15 Apr-15 May-15 Jun-15 Sparkline
INPUTS Treatments Total 40 40 61 53 50.5
Breaches - ASPH Total 6 5 5 3 2
Breaches - Shared Total 3.5 4.5 5 3.5 3.5
Total Breaches Total 9.5 9.5 10 6.5 5.5
OUTPUTS 62 Day GP Referral to Treatment % Total 76.3% 76.3% 83.6% 87.7% 89.1%
Performance:
This standard is recorded as compliant at 89.1% & remains ahead of the agreed recovery trajectory despite an increase in the number of actual
vs. estimated treatments throughout Q1.
The Trust continues to deliver its Cancer Improvement Action Plan which aims to further address the recent issues regarding cancer performance.
Many of the risks to performance against this standard require continued careful monitoring.
CANCER
All cancers: 62-day
wait for first
treatment
(GP Referral)
CONTROLS
CANCER UPDATE
Improvement Activity:
A number of improvement actions have been underway, which include;
1 - Revised clinic templates to improve capacity & expedite radiology requests
2 - An additional Urology consultant to reduce the Trust's capacity gap
3 - An additional Advanced Practitioner Breast Diagnostician to reduce the Trust's capacity gap
4 - Review of key cancer pathways to minimise delays
5 - Ongoing discussions with Tertiary Centres to further reduce the risk of delays
6 - Revised Cancer Services & Radiology reporting to monitor performance
Jan Feb Mar Apr May Jun Jul Aug Sep
Patients Treated 61 40 32 40.5 45.5 46 46 44.5 59
Patients Treated Within Standard 48.5 30.5 23 29 36 39 40.5 40 54
Performance Trajectory 79.5% 76.3% 71.9% 71.6% 79.1% 84.8% 88.0% 89.9% 91.5%
Performance Actual 78.4% 76.3% 76.3% 83.6% 87.7% 89.1%
62 Day GP
Referral

Page 10 of 20
Feb-15 Mar-15 Apr-15 May-15 Jun-15 Sparkline
INPUTS Total 41 45 37 53 61
Proportion of patients admitted to stroke ward <4hrs Target = 90% 59% 30% 38% 51% 56%
Proportion of patients spending 90% on stroke ward Target = 80% 80% 59% 57% 83% 83%
Proportion of patients scanned within 1hr Target = 50% 74% 70% 66% 76% 66%
Target = 100% 100% 98% 100% 100% 100%
Target = 100% 100% 100% 100% 100% 100%
Target = 100% 100% 100% 100% 100% 100%
Target = 100% 100% 100% 100% 100% 100%
Performance:
The Trust has experienced difficulty meeting the top 2 KPIs due to 2 reasons;
(1) non-elective bed pressures within the Trust where stroke ward beds had to be used to avoid patients waiting in A&E (inc overnight DTA’s), &
(2) a high number of patients on palliative care requesting to stay on the ward rather than transfer to a hospice.
Since May, item (2) has been managed well and we have seen good transfer to hospices, although we’ve stil l had significant non-elective bed
pressures within the hospital. June’s 'Proportion of patients admitted to a stroke ward within 4hrs' performance has improved to 56% (up from
April’s 38% & May’s 51%) which is based on discharges (which includes patients admitted prior to June). When reviewing performance based on
Admission, June’s performance would be 76% (& if ring fenced beds were available, this would have been 87.9%; just shy of the 90% target).
As the stroke ward beds are now ring fenced, and with the longest length of stay being a patient admitted during June, a step change improvement
should be seen in July’s discharge based performance for this KPI.
An action plan remains underway to improve performance which includes a number of additional activities to upskill colleagues, with regular
monitoring & feedback of breaches to reduce re-occurrence.
STROKE PERFORMANCE UPDATE
STROKEProportion of patients scanned within 24hrs
Patients eligible & receiving thrombolysis
Non-urgent TIA cases assessed within 7 days
High-risk TIA cases treated within 24hrs
OUTPUTS
Total stroke discharges
Improvement Activity:
A number of improvement actions have been underway, which include;
1 - Demand and capacity analysis undertaken to establish the required number of ring-fenced beds
2 - Clear process introduced for CSNPs, Senior Support Managers and Directors on Call for use of ring fenced beds
3 - Protocols for transfer of stroke patients into and out of stroke & rehab beds re-established
4 - Standard Operating Procedure for stroke unit capacity management re-established
5 - Monitoring use of acute stroke beds to ensure they are optimised for stroke patients
6 - Improveing Length Of Stay on Chaucer Ward, including reducing delayed transfers of care
7 - Meeting with ED team reaffirming the pathway for stroke patients
8 - Root cause analysis of each breach with learning & mititations discussed at clinical governance
9 - Stroke performance reviewed at weekly Trustwide Performance meetings

Page 11 of 20
Endoscopy
Additional endoscopy capacity using external specialist GPS resources commenced mid-June. It is then expected that a period of 10-12 weeks will be required to reduce waiting
times in endoscopy to acceptable levels (not exceeding 6 weeks).
NW Surrey CCG are also implementing their own plans for demand management with a GP led revised protocol for reducing endoscopy referrals for a proportion of under 55’s &
through the introduction of a commissioning referral triage centre for these referrals.
The result of the delivery of additional endoscopy activity over an intensive short term timeframe will result in additional pressure on follow-up capacity within Gastroenterology,
as well as Upper and Lower GI surgery. These services have scheduled additional capacity to accommodate the rise in requests for follow-ups and the Trust is also working with its
contracted supplier to avoid unnecessary follow-up requests. Despite this, there remains a risk to RTT performance in the event that the demand for follow-up significantly exceeds
supply; the resultant effect would be a delay to outpatient appointments and the potential for additional breaches. This is being closely monitored.
The reduction in endoscopy waiting list & backlog is detailed below against the originally modelled waiting list & backlog clearance.
The overall waiting list has reduced ahead of projection, although the backlog clearance is slightly behind.
In overall terms, the Trust remains marginally ahead of schedule to deliver the activity required for the backlog reduction, although will need to ensure internal core capacity (28
sessions), cobham capacity (2 sessions) & GPS locums (14 sessions) is delivered & maintained.
Regular meetings with the Endoscopy team will continue & an imminent meeting with GPS Locums representatives is scheduled.
OTHER PERFORMANCE CONCERNS &/OR RISKS
02-Jun 09-Jun 16-Jun 23-Jun 30-Jun 07-Jul
A1 Waiting Actual 1717 1715 1626 1650 1646 1476
A2 Waiting Estimated 1864 1912 1932 1864 1796 1714
A3 Waiting Variation -147 -197 -306 -214 -150 -238
B1 >6wks Actual 740 770 798 801 819 768
B2 >6wks Estimated 619 624 556 674 606 538
B3 >6wks Variation 121 146 242 127 213 230

Page 12 of 20
Reduced delays in the patient pathway from referral to appointment, and to appointment outcomes
Improved frequency, quality and timeliness of communication with patients on an outpatient pathway
Improved access to the Trust for patients and GPs in order to access the information they need
1
IMPROVING OUTPATIENT SERVICES PROJECT
As part of the Trust’s service improvement programme for 2015/2016, the ‘Improving Outpatient Services’ project has been initiated. Areas for improvement have been initially
identified through analysis of complaints information from the last 2 years and have been further developed via workshop exercise with staff. The aims of the project can be
summarised as follows:
The following KPIs have been developed and will be measured to indicate the progress of this project. These measures are currently work-in-progress and are subject to
development as the project progresses, the internal targets relating to these indicators are currently pending agreement through the project board.
(First Appointments) Days from Referral to Booking
The average number of days from referral received to an outpatient appointment booking made on PAS

Page 13 of 20
2
3Avoidable cancelled appointments with <2 weeks notice
Appointments cancelled with less than 2 weeks’ notice as a percentage of all appointments in the period.
(First Appointments) Days from Referral to Attendance
The average number of days from referral received to first outpatient appointment date
Page 14 of 20
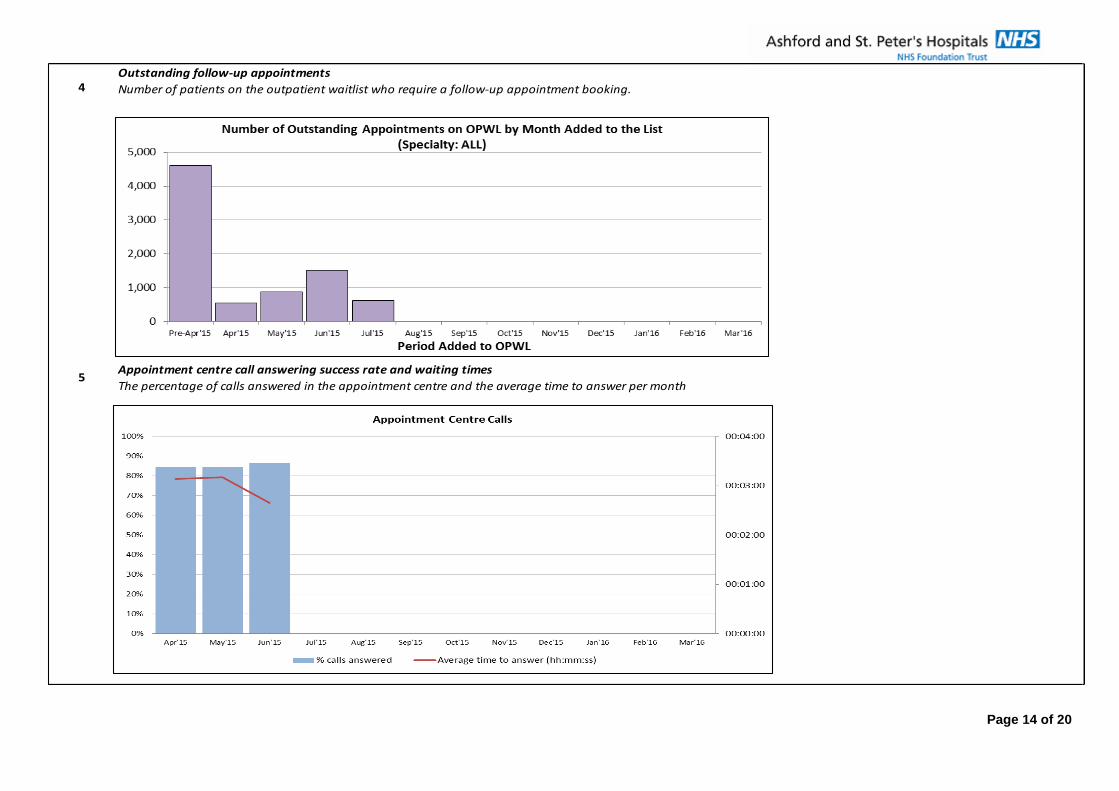
4
5
Outstanding follow-up appointments
Number of patients on the outpatient waitlist who require a follow-up appointment booking.
Appointment centre call answering success rate and waiting times
The percentage of calls answered in the appointment centre and the average time to answer per month

Page 15 of 20
Additional KPIs in development:
6
7
8 Outpatient clinic utilisation
9 Clinic outcome letter turnaround times
Referral triage turnaround times
‘Outstanding’: Referrals added to the Referral Tracking System waiting for a consultant to review
‘Awaiting booking’: Referrals that have been reviewed by a consultant and waiting for appointment to be made
Late clinic starts (ASH & SPH)

Page 16 of 20
APPENDIX 1
FINANCE AND PERFORMANE COMMITTEE - JULY 2015
Changes to the 18 weeks RTT national standards
Summary
NHS England have announced changes to the 18 weeks RTT elective care standards governing the NHS. The below sets out the nature of the changes and their implications. Attached is the communication from NHS England regarding these changes.
1. Background
1.1 The NHS Constitution sets out the entitlement to wait no longer than 18 weeks from GP referral to treatment.
1.2 The 18 Weeks Referral to Treatment standards have historically included three components – completed admitted pathways (AP) delivered within 18 weeks (90% target), completed non-admitted pathways (NAP) delivered within 18 weeks (95% target) and incomplete pathways waiting no longer than 18 weeks (92% target).
2. Changes
2.1 NHS England announced on 4th June that they were accepting Sir Bruce Keogh’s recommendations regarding proposed improvements to the current waiting times standards and reporting arrangements.
2.2 The admitted and non-admitted standards are being abolished and the incomplete standard will become the sole measure of the constitutional right to be seen within 18 weeks.
2.3 These changes took effect on 25th June 2015.
3. Rationale
3.1 NHS England is of the opinion that there are in-built perverse incentives within the AP and NAP targets.
3.2 These standards arguably penalise Trusts for treating their patients that have waited longer than 18 weeks i.e. when clearing a backlog of long waiting patients.
3.3 They also have the potential to encourage ‘booking to quota’ whereby a Trust only treats a quota of breach patients equating to the tolerance level (either 10% or 5%) of its usual monthly activity and therefore ensuring it does not fail the respective standard.
4. Financial implications
4.1 Commissioners will be unable to levy any financial sanctions associated with the AP and NAP standards from the date of the change and the Trust will be reimbursed for any financial sanctions applied since 1st April 2015.
4.2 An in-year variation of the 2015/16 contract will be implemented by the 1st October 2015 removing the provision for AP and NAP non-compliance penalties.
4.3 The penalty applied to Trust’s failing the remaining incomplete pathway standard will be increased from its current level of £100 to £300 per patient over the 8% tolerance. The sanction is applied at individual specialty level rather than aggregate.
Page 17 of 20
5. Regulatory implications
5.1 As of 24th June, no regulator may make any further intervention or increased regulatory actions as a result of deterioration or non-compliance with the AP or NAP standards.
5.2 Monitor will publish the necessary changes to its Risk Assessment Framework in July.
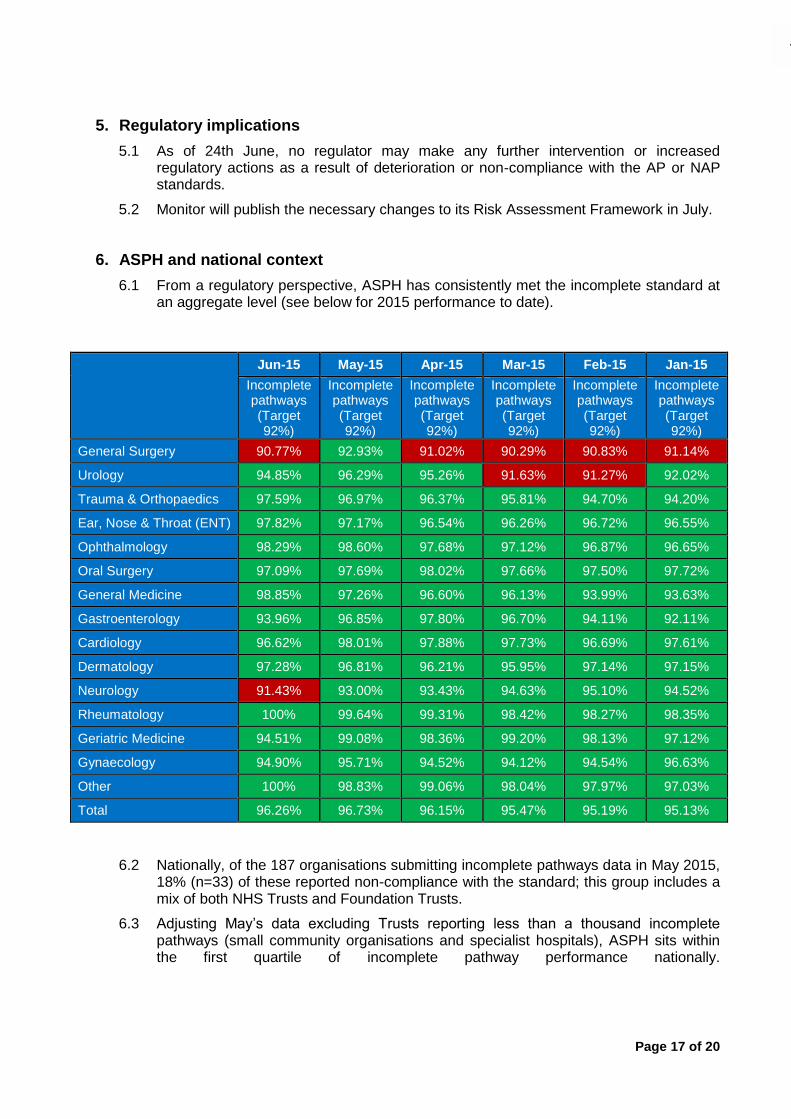
6. ASPH and national context
6.1 From a regulatory perspective, ASPH has consistently met the incomplete standard at an aggregate level (see below for 2015 performance to date).
Jun-15 May-15 Apr-15 Mar-15 Feb-15 Jan-15
Incomplete pathways (Target 92%)
Incomplete pathways (Target 92%)
Incomplete pathways (Target 92%)
Incomplete pathways (Target 92%)
Incomplete pathways (Target 92%)
Incomplete pathways (Target 92%)
General Surgery 90.77% 92.93% 91.02% 90.29% 90.83% 91.14%
Urology 94.85% 96.29% 95.26% 91.63% 91.27% 92.02%
Trauma & Orthopaedics 97.59% 96.97% 96.37% 95.81% 94.70% 94.20%
Ear, Nose & Throat (ENT) 97.82% 97.17% 96.54% 96.26% 96.72% 96.55%
Ophthalmology 98.29% 98.60% 97.68% 97.12% 96.87% 96.65%
Oral Surgery 97.09% 97.69% 98.02% 97.66% 97.50% 97.72%
General Medicine 98.85% 97.26% 96.60% 96.13% 93.99% 93.63%
Gastroenterology 93.96% 96.85% 97.80% 96.70% 94.11% 92.11%
Cardiology 96.62% 98.01% 97.88% 97.73% 96.69% 97.61%
Dermatology 97.28% 96.81% 96.21% 95.95% 97.14% 97.15%
Neurology 91.43% 93.00% 93.43% 94.63% 95.10% 94.52%
Rheumatology 100% 99.64% 99.31% 98.42% 98.27% 98.35%
Geriatric Medicine 94.51% 99.08% 98.36% 99.20% 98.13% 97.12%
Gynaecology 94.90% 95.71% 94.52% 94.12% 94.54% 96.63%
Other 100% 98.83% 99.06% 98.04% 97.97% 97.03%
Total 96.26% 96.73% 96.15% 95.47% 95.19% 95.13%
6.2 Nationally, of the 187 organisations submitting incomplete pathways data in May 2015, 18% (n=33) of these reported non-compliance with the standard; this group includes a mix of both NHS Trusts and Foundation Trusts.
6.3 Adjusting May’s data excluding Trusts reporting less than a thousand incomplete pathways (small community organisations and specialist hospitals), ASPH sits within the first quartile of incomplete pathway performance nationally.

Page 18 of 20

Page 19 of 20
Page 20 of 20