Embed Size (px)
Citation preview

Table of Contents Page Introduction …………………………………………………………………….. 3 Research Findings at a Glance ..……………………………… Sales vs. Budget …………………………………………..
• Significant correlations …………………………………………………….. • Multiple regression .…………………………………………………….. • Key Drivers Analysis
Trust Index© Dimensions …………………………………………………. • Current Year Results …………………………………………………….. • Longitudinal Trends .……………………………………………………..
Trust Index© Statements …………………………………………………. • Current Year Results …………………………………………………….. • Longitudinal Trends .……………………………………………………..
Methodology …………………………………………………………………….
By Ron Grey, Ph.D. and Oscar Cecena
Great Place to Work® Canada 2014
The Impact of High Trust Cultures on Key Performance Indicators
White Paper

Executive Summary: The Business Case for High Trust Cultures
The business proposition is clear: Create and sustain high trust cultures and great workplaces – and reap the benefits of stronger and more sustained performance results. While trust is core to building great workplaces, we see significant differences in how trust impacts key performance indicators, e.g., sales results, customer service, employee turnover, illness in the workplace, etc.
This research study with a large Canadian Retailer clearly demonstrates how trust in the workplace influences key performance indicators (KPIs); and, what specific culture management practices are most important in driving different aspects of business performance. Using advanced statistical analyses, e.g., correlations, key drivers, and multiple regression, this study empirically demonstrates the tangible business importance of trust in the workplace. More specifically:
• Highly significant relationships (ranging from .26 to .50) were found between workplace trust and KPIs. For example, the top 25% of retail stores on GPTW’s Trust Index© (TI) achieve 7% basis points greater sales performance than the bottom quartile TI stores. On a $100 MM budget, the highest trust stores would achieve $7MM more sales than the lowest trust stores!
• Various aspects of high trust cultures and specific management practices correlate more strongly with certain KPIs than others. For example, the strongest predictors of illness in the workplace are employee ratings of work/life balance, physical safety, fast paced environment, and receiving straight/honest feedback daily. In contrast, unit sales per transaction correlates most positively with delegation of responsibility; whereas, employee turnover correlates inversely with flexible work practices, e.g., the greater the flexibility to take off work when necessary, the lower the turnover.
How employees perceive and experience their workplaces and cultures clearly influences business performance. This research provides empirical data and insights into which aspects of trust and underlying culture management practices most strongly influence KPIs. In so doing, it provides a fact-based roadmap for building high trust cultures that drive those business results of greatest importance to the organization.
Trust in the Workplace: Employee Perspective
Great Place to Work® measures trust in the workplace through our Trust Index©, a standardized employee survey administered annually in over 7,200 organizations in 52 countries representing the voices of over 11 million employees – the largest workplace survey in the world.
2 ©2014 Great Place to Work® Institute, Inc. All rights reserved. Any use, publication or reproduction of this information by is not permitted without the expressed written consent of Great Place to Work® Institute.

Trust and Key Performance Indicators
The focus of this research is on how trust in the workplace influences key performance indicators (KPIs) and what specific culture management practices are most important in driving business performance. More specifically, we assess the relationships between high trust cultures and management practices in a large Canadian Retailer and the following KPIs:
• Sales vs. budget – total retail store sales vs. budget
• Sales productivity – average hourly sales per store vs. prior year
• Units per transaction – average number of specific items sold to each customer
• Total employee turnover – percent of voluntary and involuntary turnover combined
• Customer service – store level customer service performance on key criteria assessed through a monthly “Mystery Shopper” program
• Conversion rate vs. last year – number of transactions (retail receipts) divided by number of visitors into a store vs. prior year
• Illness in the workplace – incidence of illness rates vs. last year
As illustrated in this model, trust in the workplace is defined by GPTW in terms of key relationships – between management and employees, employees and their companies and jobs, and employees and their colleagues.
From an employee perspective a great workplace is one where:
“You trust the people you work for, have pride in what you do, and enjoy the people you work with”
3 ©2014 Great Place to Work® Institute, Inc. All rights reserved. Any use, publication or reproduction of this information by is not permitted without the expressed written consent of Great Place to Work® Institute.
Overall Trust Index© and KPIs
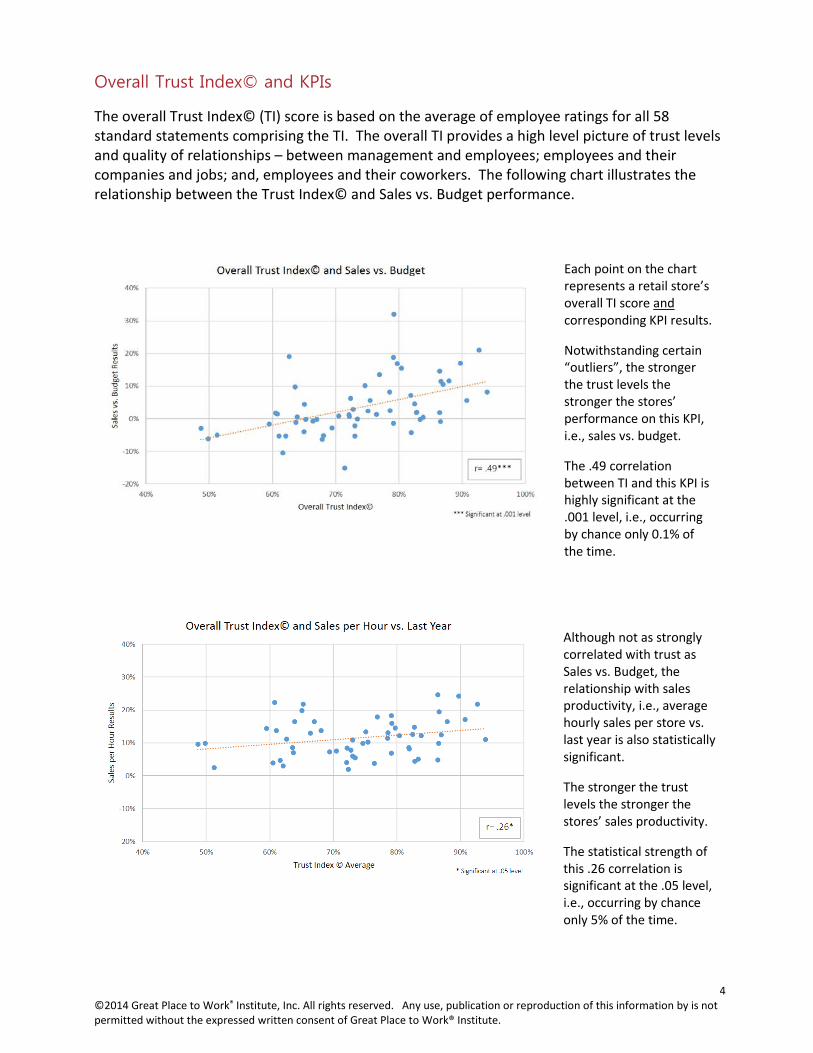
The overall Trust Index© (TI) score is based on the average of employee ratings for all 58 standard statements comprising the TI. The overall TI provides a high level picture of trust levels and quality of relationships – between management and employees; employees and their companies and jobs; and, employees and their coworkers. The following chart illustrates the relationship between the Trust Index© and Sales vs. Budget performance.
Each point on the chart represents a retail store’s overall TI score and corresponding KPI results.
Notwithstanding certain “outliers”, the stronger the trust levels the stronger the stores’ performance on this KPI, i.e., sales vs. budget.
The .49 correlation between TI and this KPI is highly significant at the .001 level, i.e., occurring by chance only 0.1% of the time.
Although not as strongly correlated with trust as Sales vs. Budget, the relationship with sales productivity, i.e., average hourly sales per store vs. last year is also statistically significant.
The stronger the trust levels the stronger the stores’ sales productivity.
The statistical strength of this .26 correlation is significant at the .05 level, i.e., occurring by chance only 5% of the time.
4 ©2014 Great Place to Work® Institute, Inc. All rights reserved. Any use, publication or reproduction of this information by is not permitted without the expressed written consent of Great Place to Work® Institute.

Overall Trust Index© and Sales KPIs
Store TI Quartile TI Average
Sales vs. Budget
Sales per Hr. vs. Last
Year
Q1 87% 7% 14%
Q2 79% 9% 12%
Q3 70% -2% 10%
Q4 60% 0% 10%
These results translate into significant gains in sales performance as a function of higher overall trust levels in the workplace. For example, on a $100 MM annual sales budget, top quartile TI stores would contribute $7MM more sales than the bottom quartile stores. Growth in sales productivity would be 4% greater per hour in the top quartile TI stores.
Overall Rating as a Great Place to Work and KPIs
The last question in GPTW’s Trust Index© standard employee survey assesses employee perceptions of their company as a great place to work overall. It is an important “barometer” of the general trust levels within the organization, taking everything into account.
Here too we see a strong statistical relationship between employees’ overall ratings of their companies as great workplaces and store sales vs. budget. The .43 correlation is significant at the .001 level.
Stores where employees feel strongest about the company being a great place to work overall generally achieve stronger sales results.
This chart illustrates the business impact of TI/sales KPI correlations. The top TI quartile (Q1) stores achieve 7% above budget annual sales vs. on budget performance for the bottom scoring TI quartile.
The top quartile stores further achieve 14% sales productivity gains over last year vs. only 10% for the bottom quartile stores.
5 ©2014 Great Place to Work® Institute, Inc. All rights reserved. Any use, publication or reproduction of this information by is not permitted without the expressed written consent of Great Place to Work® Institute.

Rating as a Great Place to Work and Sales KPIs
Store TI Quartile TI Average
Sales vs. Budget
Sales per Hr. vs. Last
Year
Q1 96% 8% 14%
Q2 84% 9% 7%
Q3 72% 1% 8%
Q4 59% -1% 4%
These results translate into significant gains in sales performance as a function of stronger employee perceptions of their company as a great workplace.
Significant Relationships Between Trust and KPIs
Our research identified over a third of Trust Index© statements that correlate with Sales vs. Budget at the .001 level of significance and many others that are statistically significant at lower levels. Similar patterns were identified for Sales per Hour although not quite as strongly correlated as for Sales vs. Budget.
The research further identifies statistically significant correlations between various dimensions and elements of Trust and additional KPIs. All of the significant correlations are highlighted below:
Stores where employees feel strongest about their company as a great place to work overall also tend to achieve stronger sales productivity, i.e., sale per hour vs. prior year.
This .39 correlation has only a 5% probability of occurring by chance.
Here we can see that employee perceptions of their company as a “great place to work” has a particularly powerful impact on sales KPIs
The top quartile stores on this statement have 10% basis points greater sales productivity than the bottom quartile stores; and 9% basis points greater sales vs. budget.
6 ©2014 Great Place to Work® Institute, Inc. All rights reserved. Any use, publication or reproduction of this information by is not permitted without the expressed written consent of Great Place to Work® Institute.

Significant Correlations Between Trust Index© Dimensions and KPIs
Trust Index© KPI Correlation Significance
CREDIBILITY Sales vs. Budget .50 .001 Sales per Hour .27 .05
Management is honest and ethical Customer Service .34 .01 Management delivers on commitments Customer Service .26 .05 People given lots of responsibility Units per Transaction .29 .01
RESPECT Sales vs. Budget .49 .001 Sales per Hour .30 .05
Physically safe workplace Customer Service .33 .01 Physically safe workplace Illness -.50 .05 Work/life balance encouraged Illness -.50 .05 Fast pace is our nature Illness .51 .05 Straight and honest feedback provided daily Illness -.50 .05 Flexibility to take off work when necessary Employee Turnover -.33 .01
FAIRNESS Sales vs. Budget .47 .001
People treated fairly regardless of gender Customer Service .32 .05 Receive fair share of profits Customer Service .25 .05
PRIDE Sales vs. Budget .47 .001
CAMARADERIE Sales vs. Budget .38 .001
Building High Trust Cultures: Management Perspective
From a management perspective, GPTW’s definition of a great workplace is complimentary to the employee perspective.
7 ©2014 Great Place to Work® Institute, Inc. All rights reserved. Any use, publication or reproduction of this information by is not permitted without the expressed written consent of Great Place to Work® Institute.

Key Drivers Analysis and Workplace Transformation
The correlation analyses and scatter grams presented above highlight those aspects of trust in the workplace that are most strongly related to key business results. However, developing a strategic roadmap for workplace transformation requires much more than this. For one, organizations striving to become best workplaces need to systematically assess the key underlying culture management practices that enable and/or hinder creating high levels of trust and great workplaces, i.e., priority strengths and opportunities for development.
By analyzing employee perceptions of key culture management practices and their correlations with KPIs, GPTW conducts Key Drivers Analysis (KDA) for guiding workplace transformation. Specifically, KDAs quantitatively identify:
• Key workplace strengths – Those aspects of the workplace that not only score highest on the TI vs. Best Workplaces benchmarks, but also have the strongest impact on business results, i.e., KPIs, as determined by the correlation analysis; and,
• Key workplace opportunities – Those aspects of the workplace that score lowest vs. Best Workplaces benchmarks while also having the strongest impact on business results.
Applying this framework, the following two Key Drivers Analysis charts present the Trust Index© results from a culture management perspective.
Our conceptual model identifies the nine critical culture management practices that are instrumental to building and sustaining high trust cultures and great workplaces.
From a management perspective a great workplace is one:
“where you achieve organizational objectives with employees who give their personal best and work together as a team/family – all in an environment of trust”
8 ©2014 Great Place to Work® Institute, Inc. All rights reserved. Any use, publication or reproduction of this information by is not permitted without the expressed written consent of Great Place to Work® Institute.

This KDA chart provides a high level roadmap for strengthening employee perceptions of this Canadian Retailer as a great place to work. For one, the company should maintain and build upon its primary strengths of Celebrating and Caring.
In parallel, it should focus on implementing actions needed to address its various development opportunities, especially the primary ones of Inspiring, Sharing and Listening.
When it comes to Sales vs. Budget, no high impact culture management practices were identified as current strengths.
Indeed, those management practices having greatest impact on this KPI score weakly on the Trust Index© and, hence, should be the priority focal points for development.
In essence, this organization’s workplace transformation should focus on shifting its primary development opportunities into primary strengths. Making this happen will require systematically strengthening its practices for Listening to, Inspiring, Thanking and Developing employees.
9 ©2014 Great Place to Work® Institute, Inc. All rights reserved. Any use, publication or reproduction of this information by is not permitted without the expressed written consent of Great Place to Work® Institute.

Significant Relationships Between Culture Management Practices and KPIs
Our research identified statistically significant correlations between each of the Culture Management Practices measured by the Trust Index© and various KPIs. These are highlighted in the following table:
Correlations Between Culture Management Practices and KPIs
Culture Management Practice KPI Correlation Significance
ACHIEVING ORGANIZATIONAL OBJECTIVES Inspiring Sales vs. Budget .55 .001 Sales per Hour .28 .05 Illness -.28 .05 Speaking Sales vs. Budget .41 .01 Sales per Hour .28 .05 Listening Sales vs. Budget .55 .001 Sales per Hour .31 .05 Illness -.27 .01 GIVING PERSONAL BEST Caring Sales vs. Budget .42 .001 Sales per Hour .25 .05 Illness -.30 .05 Developing Sales vs. Budget .48 .001 Sales per Hour .29 .05 Thanking Sales vs. Budget .48 .001 Sales per Hour .27 .05 Illness -.36 .01 WORKING TOGETHER AS A FAMILY/TEAM Hiring Sales vs. Budget .37 .01 Sharing Sales vs. Budget .48 .001 Sales per Hour .28 .05 Illness -.38 .01 Celebrating Sales vs. Budget .43 .001 Sales per Hour .31 .05
Each of the nine Culture Management Practice areas correlates most significantly with Sales vs. Budget, i.e., the stronger the practice as seen by employees the stronger the total retail sales results. Significant relationships are also evident with regard to sales productivity, i.e., sales per hour, albeit not as strong statistically as with sales vs. budget. Finally, significant inverse relationships exist between illness in the workplace and five of the management practices. Specifically, the stronger employee ratings of Inspiring, Listening, Caring, Thanking and Sharing the lower the incidence of workplace illness.
Drilling down more deeply into the various sub-dimensions and statements comprising these culture management practice areas can provide even greater insights into organizational priorities for building a great workplace and enhancing specific business results.
10 ©2014 Great Place to Work® Institute, Inc. All rights reserved. Any use, publication or reproduction of this information by is not permitted without the expressed written consent of Great Place to Work® Institute.
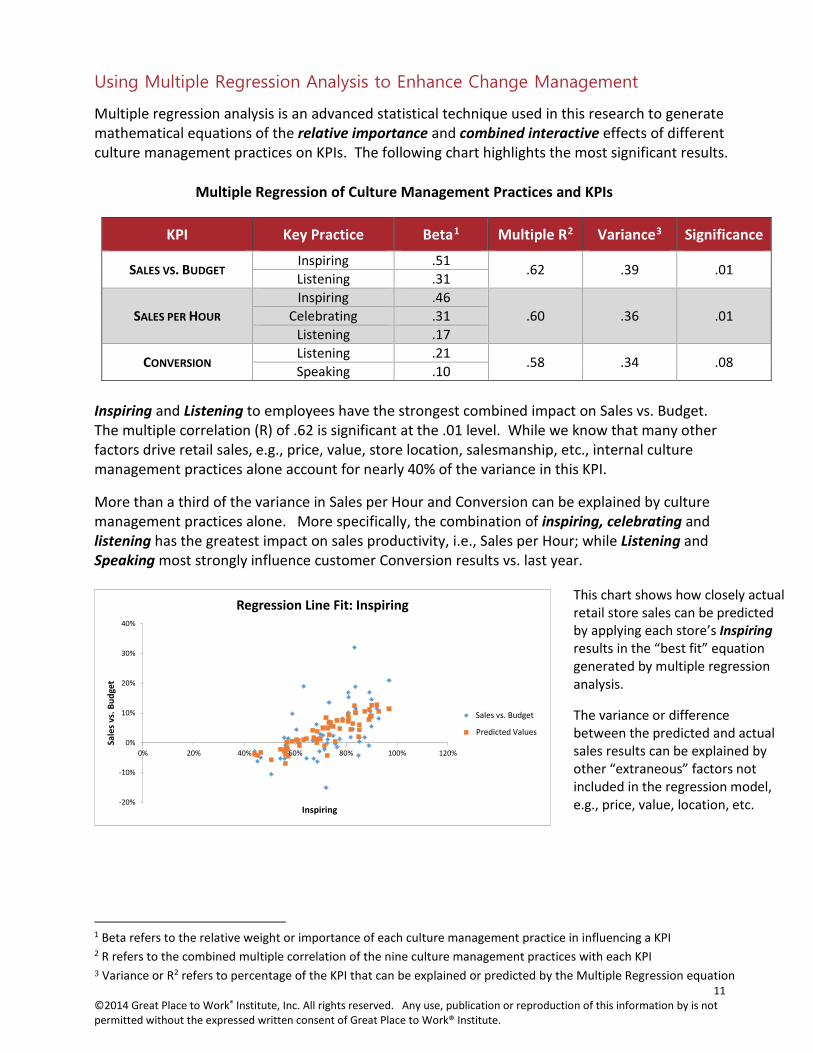
Using Multiple Regression Analysis to Enhance Change Management
Multiple regression analysis is an advanced statistical technique used in this research to generate mathematical equations of the relative importance and combined interactive effects of different culture management practices on KPIs. The following chart highlights the most significant results.
Multiple Regression of Culture Management Practices and KPIs
KPI Key Practice Beta1 Multiple R2 Variance3 Significance
SALES VS. BUDGET Inspiring .51 .62 .39 .01 Listening .31
SALES PER HOUR Inspiring .46
.60 .36 .01 Celebrating .31 Listening .17
CONVERSION Listening .21 .58 .34 .08 Speaking .10 Inspiring and Listening to employees have the strongest combined impact on Sales vs. Budget. The multiple correlation (R) of .62 is significant at the .01 level. While we know that many other factors drive retail sales, e.g., price, value, store location, salesmanship, etc., internal culture management practices alone account for nearly 40% of the variance in this KPI.
More than a third of the variance in Sales per Hour and Conversion can be explained by culture management practices alone. More specifically, the combination of inspiring, celebrating and listening has the greatest impact on sales productivity, i.e., Sales per Hour; while Listening and Speaking most strongly influence customer Conversion results vs. last year.
1 Beta refers to the relative weight or importance of each culture management practice in influencing a KPI 2 R refers to the combined multiple correlation of the nine culture management practices with each KPI 3 Variance or R2 refers to percentage of the KPI that can be explained or predicted by the Multiple Regression equation
-20%
-10%
0%
10%
20%
30%
40%
0% 20% 40% 60% 80% 100% 120%
Sale
s vs.
Bud
get
Inspiring
Regression Line Fit: Inspiring
SvB 10-12
Predicted SvB 10-12
Sales vs. Budget
Predicted Values
This chart shows how closely actual retail store sales can be predicted by applying each store’s Inspiring results in the “best fit” equation generated by multiple regression analysis.
The variance or difference between the predicted and actual sales results can be explained by other “extraneous” factors not included in the regression model, e.g., price, value, location, etc.
11 ©2014 Great Place to Work® Institute, Inc. All rights reserved. Any use, publication or reproduction of this information by is not permitted without the expressed written consent of Great Place to Work® Institute.
Key “Take Away” Messages
This research emphatically underscores the business case for high trust cultures by empirically linking trust in the workplace to key business results.
It provides strategic insights into those specific aspects of trust and culture management practices that are most significant in driving enhanced performance for different KPIs including: retail sales vs. budget, sales productivity, customer service, customer conversion, units per transaction, illness in the workplace and employee turnover.
What’s most important for influencing a given KPI is not the same as for other KPIs. A more sophisticated, “differential” approach vs. “one size fits all” is called for in driving various measures of business performance.
In addition, the research illustrates the power of Key Drivers Analysis for change management. Specifically, KDA helps organizations to transform culture in those management practice areas needed most to build great workplaces and enhance specific KPIs of greatest importance to their success.
Finally, the Multiple Regression Analyses add further insights and guidance for change management by identifying which combinations of specific culture management practices interact to have greatest impact on different KPIs.
12 ©2014 Great Place to Work® Institute, Inc. All rights reserved. Any use, publication or reproduction of this information by is not permitted without the expressed written consent of Great Place to Work® Institute.