Embed Size (px)
Citation preview
Trust Quality and Performance Report
April 2013
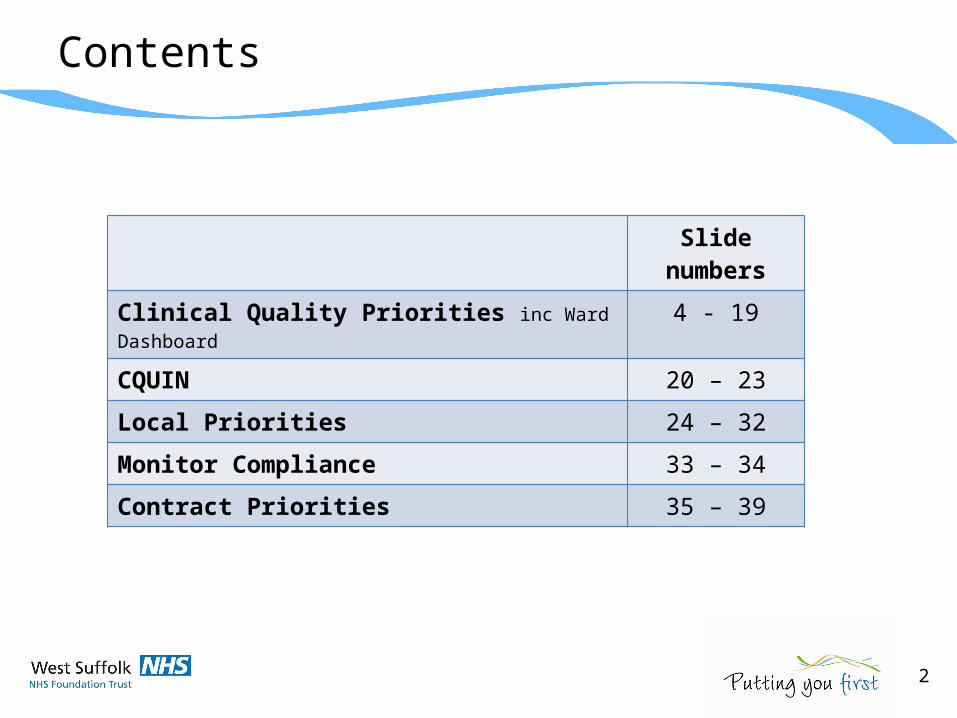
Contents
Slide numbers
Clinical Quality Priorities inc Ward Dashboard 4 - 19
CQUIN 20 – 23
Local Priorities 24 – 32
Monitor Compliance 33 – 34
Contract Priorities 35 – 39
2
Introduction
This Corporate Trust Dashboard provides narrative for performance in five key areas: Clinical Quality Priorities, CQUIN Performance, Local Priorities, Monitor Compliance and Contract Priorities.
3
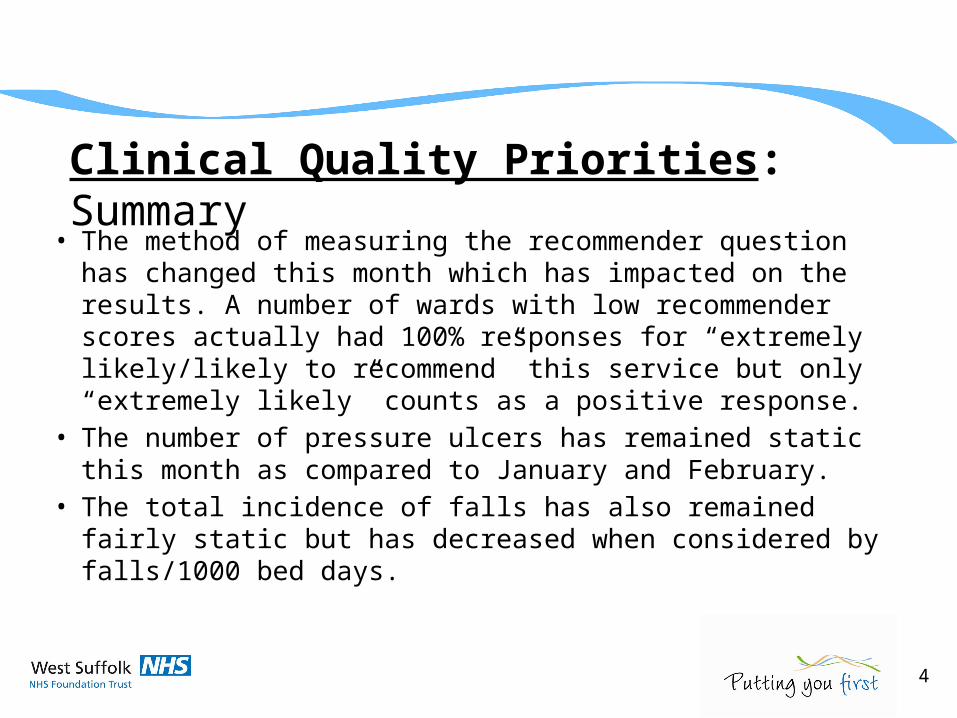
Clinical Quality Priorities: Summary
• The method of measuring the recommender question has changed this month which has impacted on the results. A number of wards with low recommender scores actually had 100% responses for “extremely likely/likely to recommend” this service but only “extremely likely” counts as a positive response.
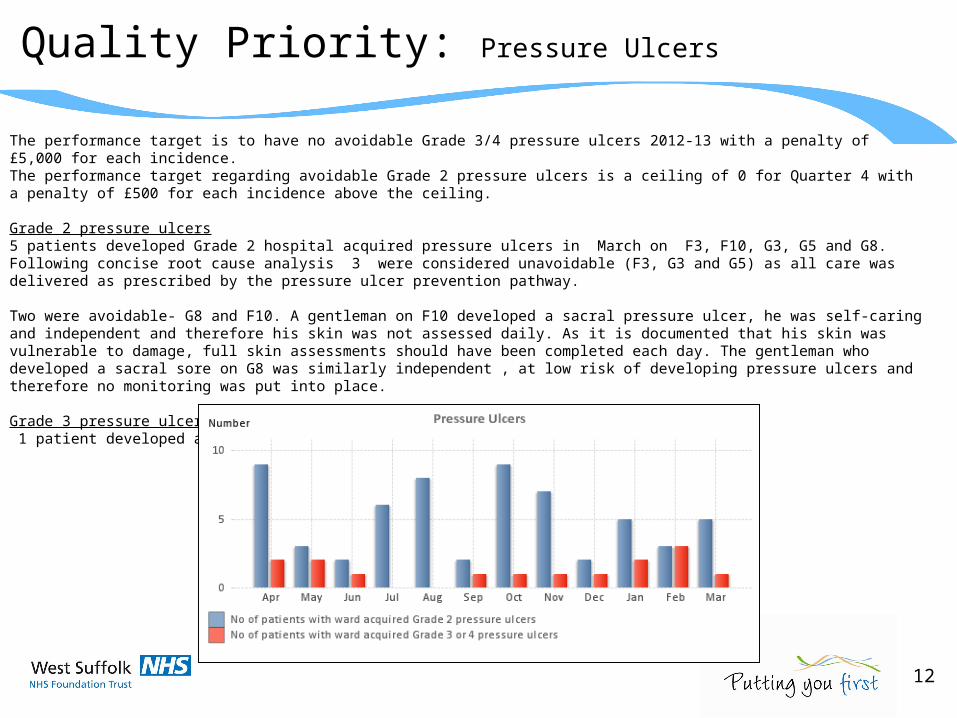
• The number of pressure ulcers has remained static this month as compared to January and February.
• The total incidence of falls has also remained fairly static but has decreased when considered by falls/1000 bed days.
4
Ward dashboard – A3
5-8
Quality Priority: Ward Performance Issues
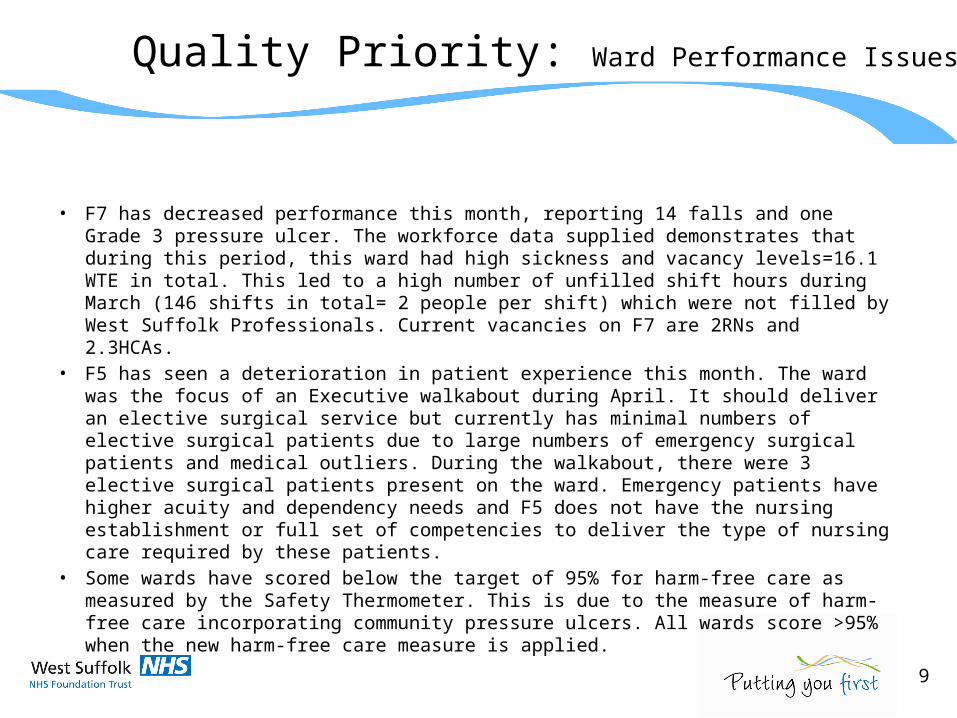
• F7 has decreased performance this month, reporting 14 falls and one Grade 3 pressure ulcer. The workforce data supplied demonstrates that during this period, this ward had high sickness and vacancy levels=16.1 WTE in total. This led to a high number of unfilled shift hours during March (146 shifts in total= 2 people per shift) which were not filled by West Suffolk Professionals. Current vacancies on F7 are 2RNs and 2.3HCAs.
• F5 has seen a deterioration in patient experience this month. The ward was the focus of an Executive walkabout during April. It should deliver an elective surgical service but currently has minimal numbers of elective surgical patients due to large numbers of emergency surgical patients and medical outliers. During the walkabout, there were 3 elective surgical patients present on the ward. Emergency patients have higher acuity and dependency needs and F5 does not have the nursing establishment or full set of competencies to deliver the type of nursing care required by these patients.
• Some wards have scored below the target of 95% for harm-free care as measured by the Safety Thermometer. This is due to the measure of harm-free care incorporating community pressure ulcers. All wards score >95% when the new harm-free care measure is applied.
9
.
Quality Priority: Infection Control
10
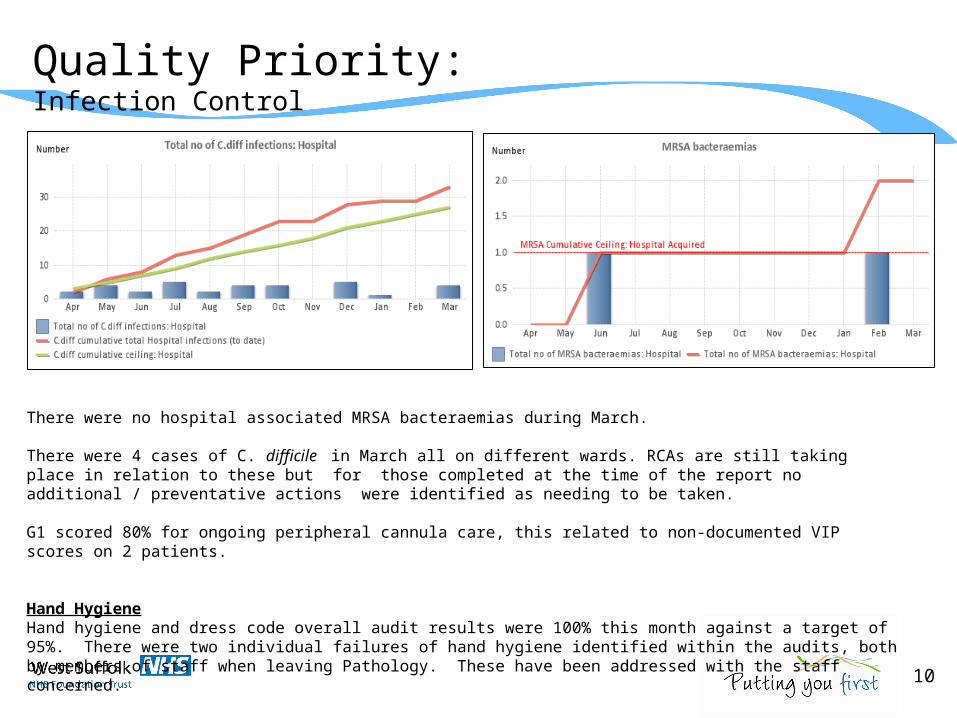
There were no hospital associated MRSA bacteraemias during March.
There were 4 cases of C. difficile in March all on different wards. RCAs are still taking place in relation to these but for those completed at the time of the report no additional / preventative actions were identified as needing to be taken.
G1 scored 80% for ongoing peripheral cannula care, this related to non-documented VIP scores on 2 patients.
Hand HygieneHand hygiene and dress code overall audit results were 100% this month against a target of 95%. There were two individual failures of hand hygiene identified within the audits, both by members of staff when leaving Pathology. These have been addressed with the staff concerned.
.
Quality Priority: Falls
Falls performance
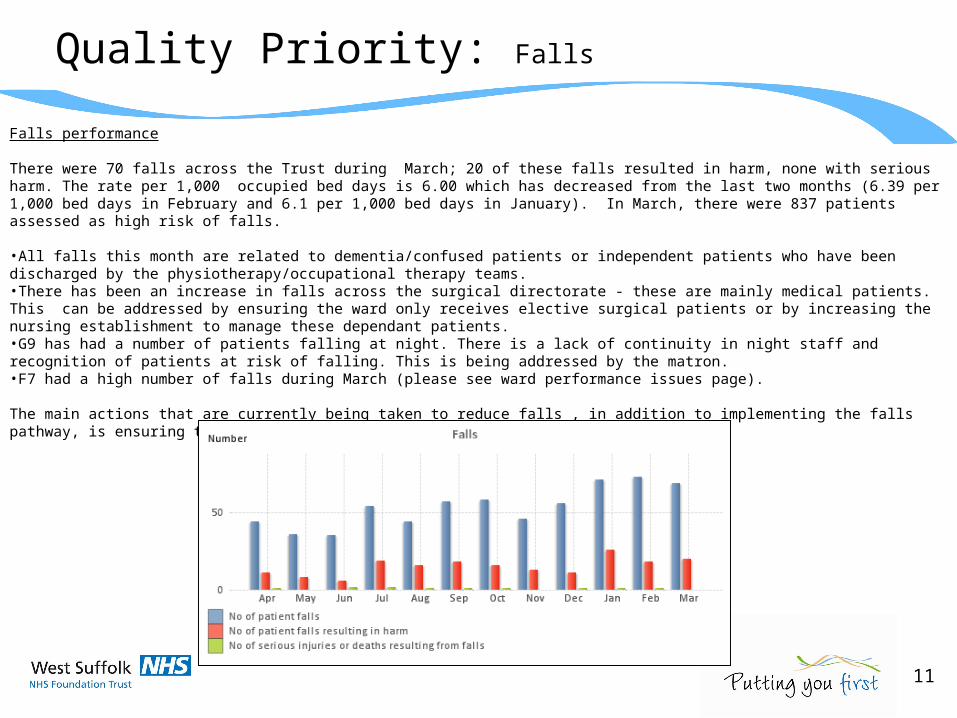
There were 70 falls across the Trust during March; 20 of these falls resulted in harm, none with serious harm. The rate per 1,000 occupied bed days is 6.00 which has decreased from the last two months (6.39 per 1,000 bed days in February and 6.1 per 1,000 bed days in January). In March, there were 837 patients assessed as high risk of falls.
•All falls this month are related to dementia/confused patients or independent patients who have been discharged by the physiotherapy/occupational therapy teams.•There has been an increase in falls across the surgical directorate - these are mainly medical patients. This can be addressed by ensuring the ward only receives elective surgical patients or by increasing the nursing establishment to manage these dependant patients. •G9 has had a number of patients falling at night. There is a lack of continuity in night staff and recognition of patients at risk of falling. This is being addressed by the matron. •F7 had a high number of falls during March (please see ward performance issues page).
The main actions that are currently being taken to reduce falls , in addition to implementing the falls pathway, is ensuring that the wards are staffed adequately.
11
Quality Priority: Pressure Ulcers
12
The performance target is to have no avoidable Grade 3/4 pressure ulcers 2012-13 with a penalty of £5,000 for each incidence.The performance target regarding avoidable Grade 2 pressure ulcers is a ceiling of 0 for Quarter 4 with a penalty of £500 for each incidence above the ceiling.
Grade 2 pressure ulcers5 patients developed Grade 2 hospital acquired pressure ulcers in March on F3, F10, G3, G5 and G8. Following concise root cause analysis 3 were considered unavoidable (F3, G3 and G5) as all care was delivered as prescribed by the pressure ulcer prevention pathway.
Two were avoidable- G8 and F10. A gentleman on F10 developed a sacral pressure ulcer, he was self-caring and independent and therefore his skin was not assessed daily. As it is documented that his skin was vulnerable to damage, full skin assessments should have been completed each day. The gentleman who developed a sacral sore on G8 was similarly independent , at low risk of developing pressure ulcers and therefore no monitoring was put into place.
Grade 3 pressure ulcers 1 patient developed a Grade 3 pressure ulcer on F7. The RCA has not yet been held.
Safety thermometer results
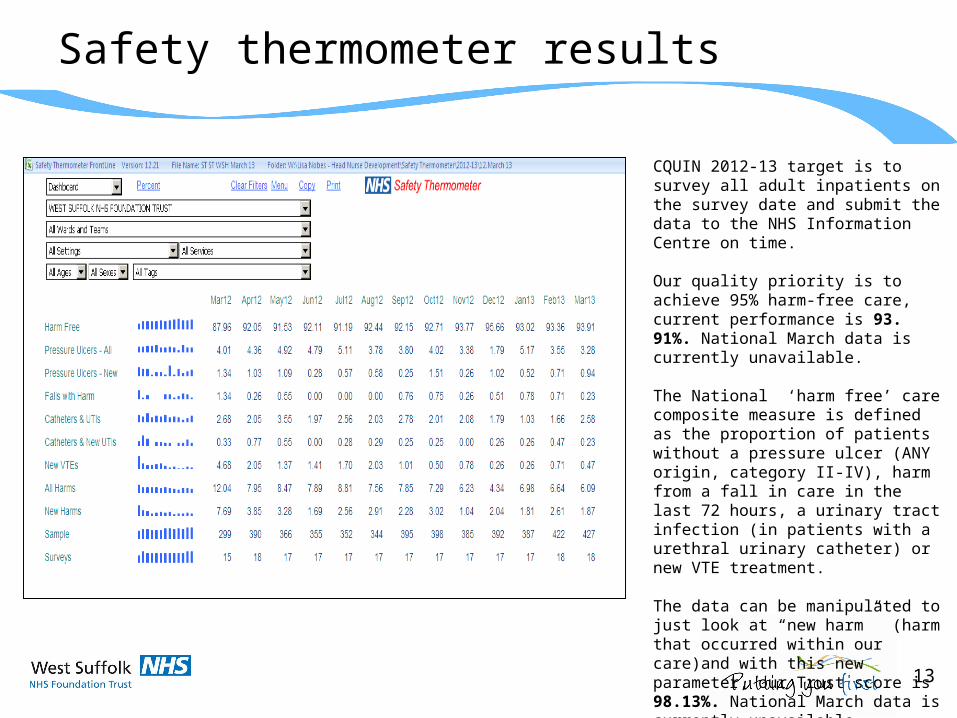
CQUIN 2012-13 target is to survey all adult inpatients on the survey date and submit the data to the NHS Information Centre on time.
Our quality priority is to achieve 95% harm-free care, current performance is 93. 91%. National March data is currently unavailable.
The National ‘harm free’ care composite measure is defined as the proportion of patients without a pressure ulcer (ANY origin, category II-IV), harm from a fall in care in the last 72 hours, a urinary tract infection (in patients with a urethral urinary catheter) or new VTE treatment.
The data can be manipulated to just look at “new harm” (harm that occurred within our care)and with this new parameter, our Trust score is 98.13%. National March data is currently unavailable.
13
Quality Priority: Patient Experience – Achievement of 85% satisfaction
14
‘Achieve at least 85% satisfaction in internal patient satisfaction surveys’ is a Quality Priority for the Trust.
The overall score for the inpatient survey was 89% indicating a high level of satisfaction with most of the areas covered in the survey. The number of responses to the survey increased this month, but further increases are needed.
The Patients Association call bell project commenced week of 9 th April with the training for volunteers taking place on 10th April and the patient interviews and observations have been planned for 4 weeks following this.
Overall satisfaction for the other internal surveys (OPD, short stay, A&E, Maternity, Children, and stroke) have remained stable despite some changes to the Friends and Family test score.
The questions in the surveys will be reviewed following publication of the national inpatient survey results.
Quality Priority: Patient Experience – Recommend the service
15
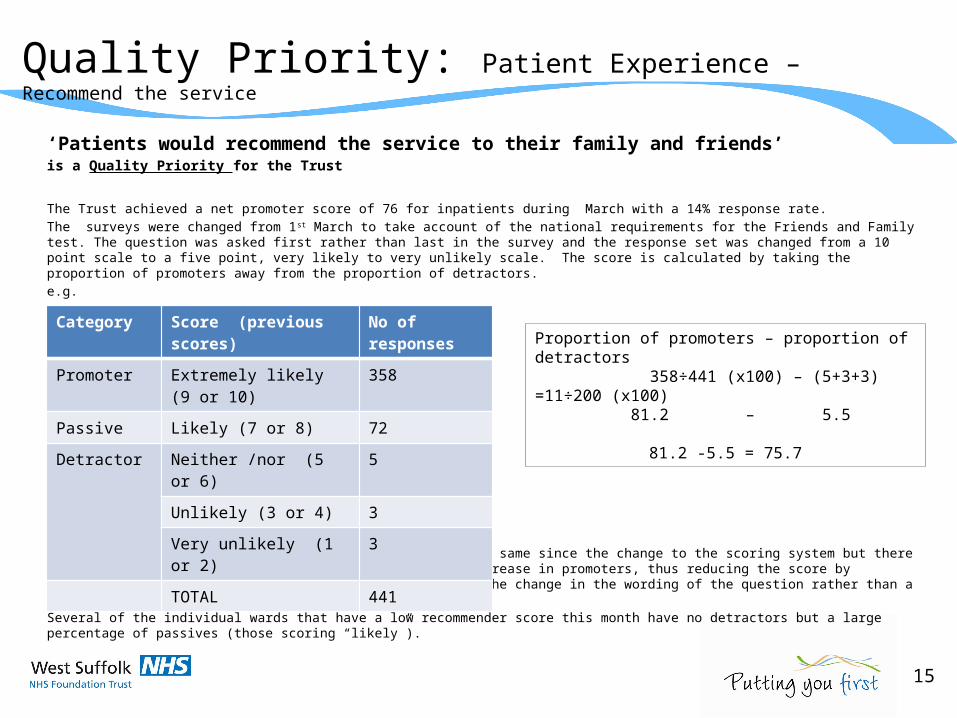
‘Patients would recommend the service to their family and friends’ is a Quality Priority for the Trust
The Trust achieved a net promoter score of 76 for inpatients during March with a 14% response rate.
The surveys were changed from 1st March to take account of the national requirements for the Friends and Family test. The question was asked first rather than last in the survey and the response set was changed from a 10 point scale to a five point, very likely to very unlikely scale. The score is calculated by taking the proportion of promoters away from the proportion of detractors.
e.g.
The proportion of detractors has stayed approximately the same since the change to the scoring system but there has been a increase in the passives and corresponding decrease in promoters, thus reducing the score by approximately 10 points. This is felt to be a result of the change in the wording of the question rather than a change in overall experience.
Several of the individual wards that have a low recommender score this month have no detractors but a large percentage of passives (those scoring “likely”).
Category Score (previous scores) No of responses
Promoter Extremely likely (9 or 10) 358
Passive Likely (7 or 8) 72
Detractor Neither /nor (5 or 6) 5
Unlikely (3 or 4) 3
Very unlikely (1 or 2) 3
TOTAL 441
Proportion of promoters – proportion of detractors 358÷441 (x100) – (5+3+3) =11÷200 (x100)
81.2 – 5.5
81.2 -5.5 = 75.7
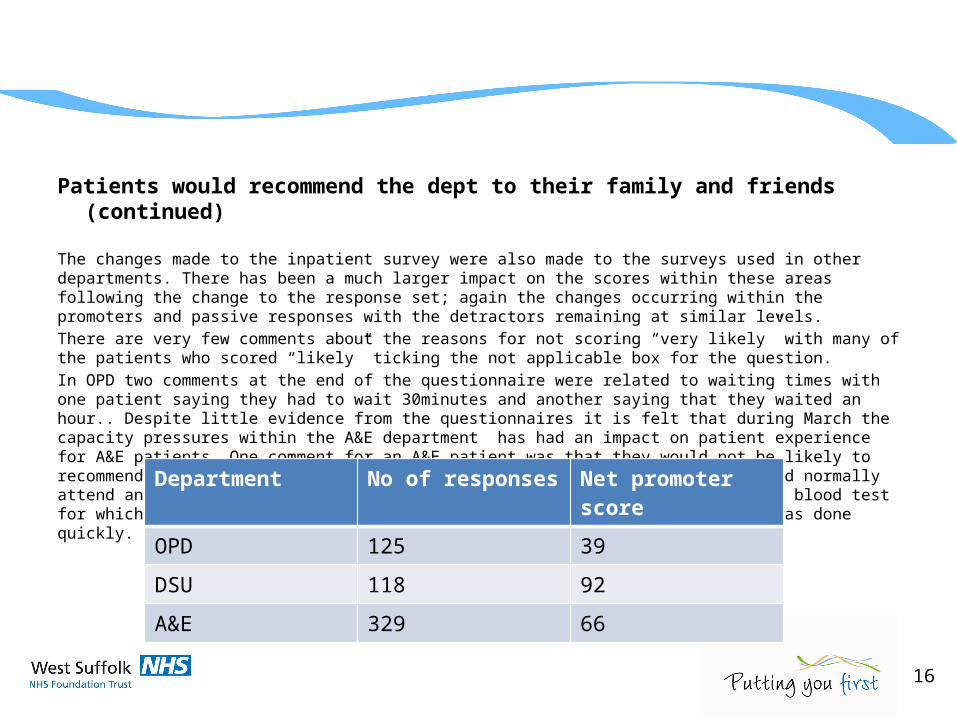
Patients would recommend the dept to their family and friends (continued)
The changes made to the inpatient survey were also made to the surveys used in other departments. There has been a much larger impact on the scores within these areas following the change to the response set; again the changes occurring within the promoters and passive responses with the detractors remaining at similar levels.
There are very few comments about the reasons for not scoring “very likely” with many of the patients who scored “likely” ticking the not applicable box for the question.
In OPD two comments at the end of the questionnaire were related to waiting times with one patient saying they had to wait 30minutes and another saying that they waited an hour.. Despite little evidence from the questionnaires it is felt that during March the capacity pressures within the A&E department has had an impact on patient experience for A&E patients. One comment for an A&E patient was that they would not be likely to recommend the service as the Trust is not their local hospital and they would normally attend another Trust. A second was sent to A&E by her GP for an out of hours blood test for which she then waited a lengthy period before transfer to EAU where it was done quickly.
Department No of responses Net promoter score
OPD 125 39
DSU 118 92
A&E 329 66
16
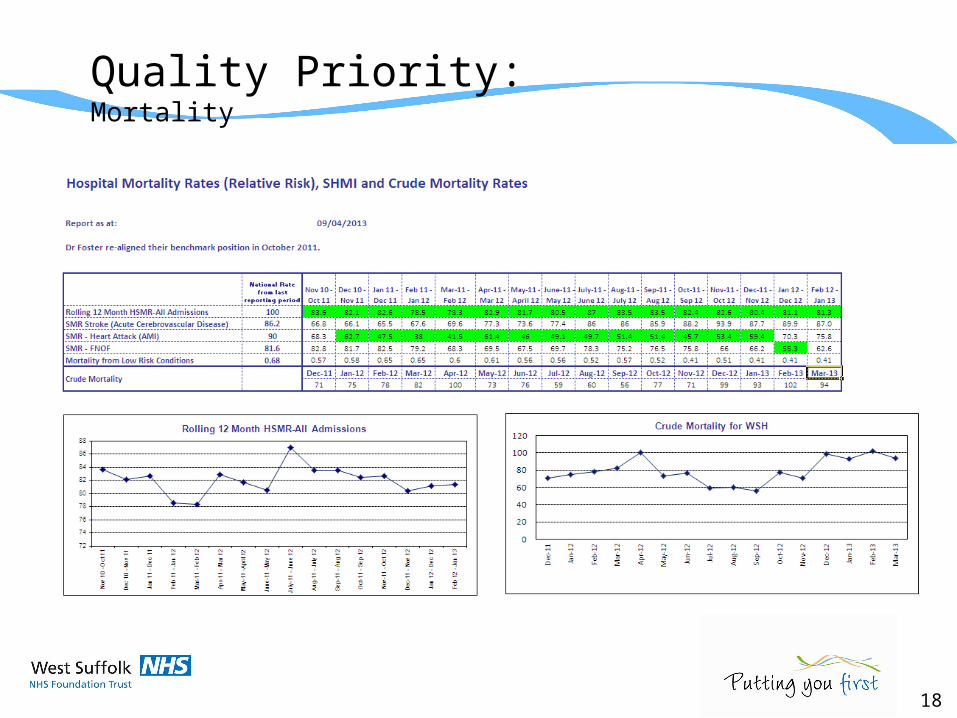
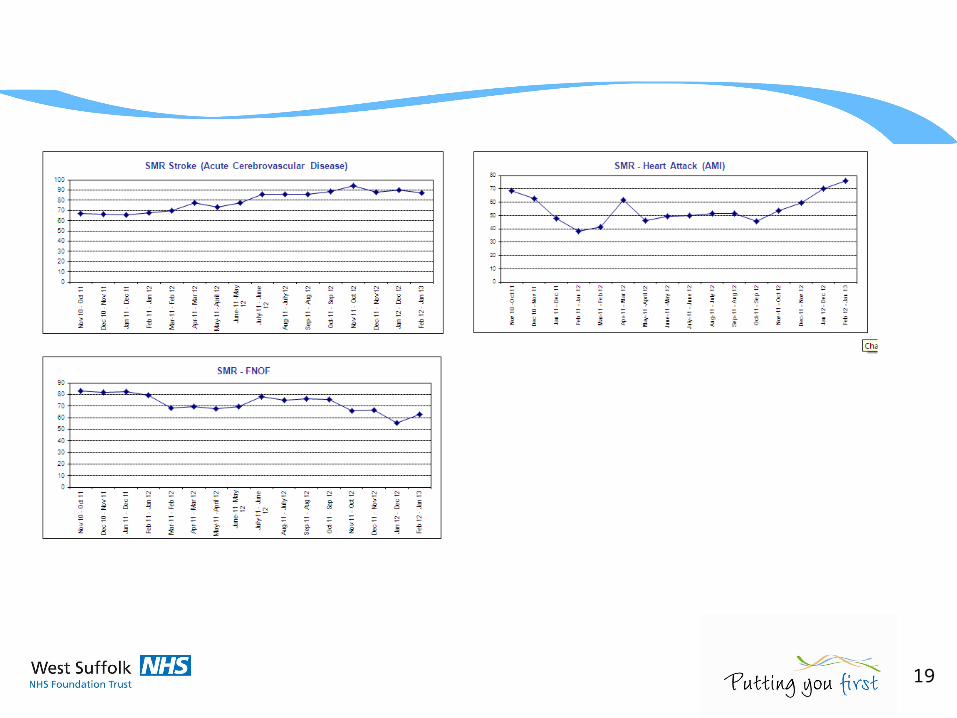
Quality Priority: Mortality
18
19
The Trust has agreed full payment for CQUIN schemes with NHS Suffolk and WSCCG for 2012/13. A number of notable patient benefits have been accrued during the year including improvements in assessment e.g. for dementia, information e.g. cancer site information and discharge summaries and in onward referral including smoking cessation, alcohol treatment and falls prevention.
CQUINSummary & Exceptions report
20
CQUIN dashboard – A3
21 - 23
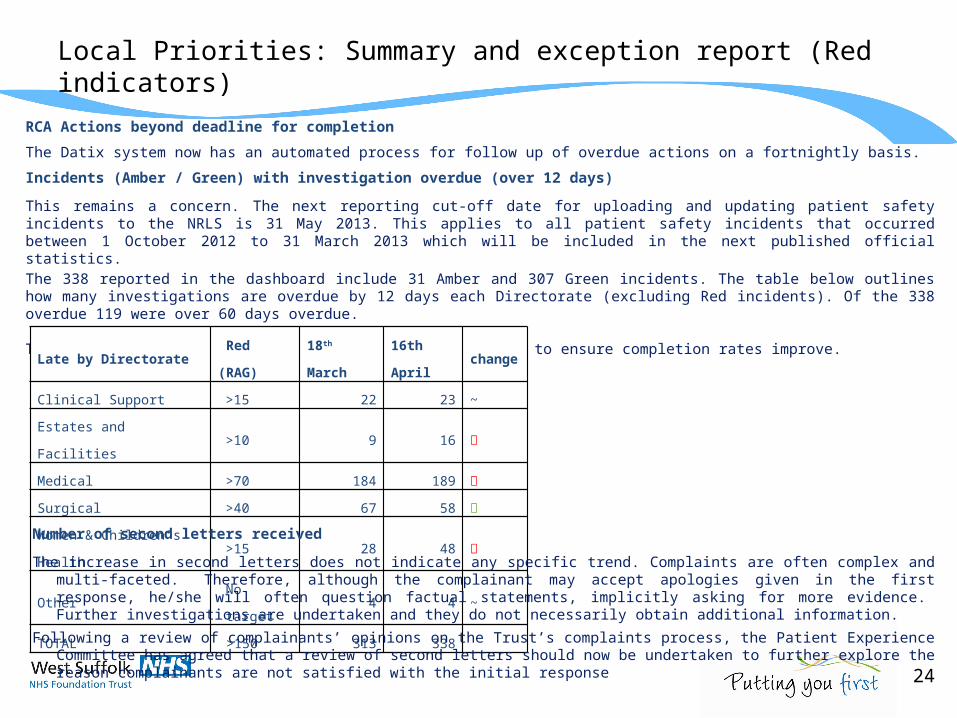
Local Priorities: Summary and exception report (Red indicators)
RCA Actions beyond deadline for completion
The Datix system now has an automated process for follow up of overdue actions on a fortnightly basis.
Incidents (Amber / Green) with investigation overdue (over 12 days)
This remains a concern. The next reporting cut-off date for uploading and updating patient safety incidents to the NRLS is 31 May 2013. This applies to all patient safety incidents that occurred between 1 October 2012 to 31 March 2013 which will be included in the next published official statistics. The 338 reported in the dashboard include 31 Amber and 307 Green incidents. The table below outlines how many investigations are overdue by 12 days each Directorate (excluding Red incidents). Of the 338 overdue 119 were over 60 days overdue.
Targeted support will be provided to staff in A&E and EAU to ensure completion rates improve.
Late by Directorate Red (RAG) 18th March 16th April change
Clinical Support >15 22 23 ~
Estates and Facilities >10 9 16
Medical >70 184 189
Surgical >40 67 58
Women & Children’s Health >15 28 48
Other No target 4 4 ~
TOTAL >150 313 338
Number of second letters received
The increase in second letters does not indicate any specific trend. Complaints are often complex and multi-faceted. Therefore, although the complainant may accept apologies given in the first response, he/she will often question factual statements, implicitly asking for more evidence. Further investigations are undertaken and they do not necessarily obtain additional information.
Following a review of complainants’ opinions on the Trust’s complaints process, the Patient Experience Committee has agreed that a review of second letters should now be undertaken to further explore the reason complainants are not satisfied with the initial response
24
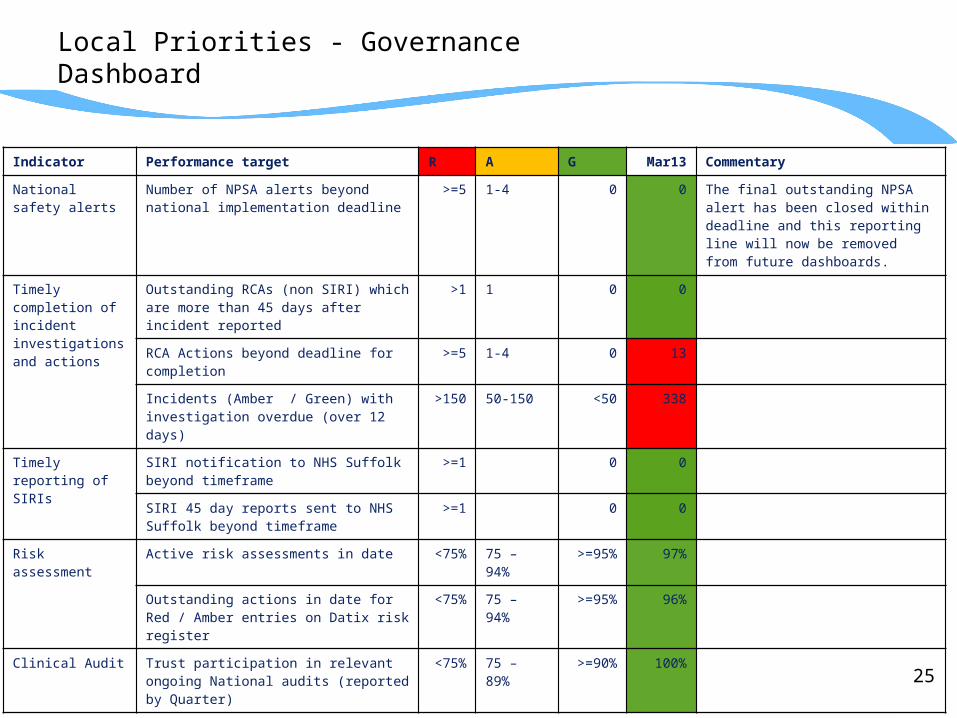
Local Priorities - Governance Dashboard
Indicator Performance target R A G Mar13 Commentary
National safety alerts
Number of NPSA alerts beyond national implementation deadline
>=5 1-4 0 0 The final outstanding NPSA alert has been closed within deadline and this reporting line will now be removed from future dashboards.
Timely completion of incident investigations and actions
Outstanding RCAs (non SIRI) which are more than 45 days after incident reported
>1 1 0 0
RCA Actions beyond deadline for completion >=5 1-4 0 13
Incidents (Amber / Green) with investigation overdue (over 12 days)
>150 50-150 <50 338
Timely reporting of SIRIs
SIRI notification to NHS Suffolk beyond timeframe
>=1 0 0
SIRI 45 day reports sent to NHS Suffolk beyond timeframe
>=1 0 0
Risk assessment Active risk assessments in date <75% 75 – 94% >=95% 97%
Outstanding actions in date for Red / Amber entries on Datix risk register
<75% 75 – 94% >=95% 96%
Clinical Audit Trust participation in relevant ongoing National audits (reported by Quarter)
<75% 75 – 89% >=90% 100%
25
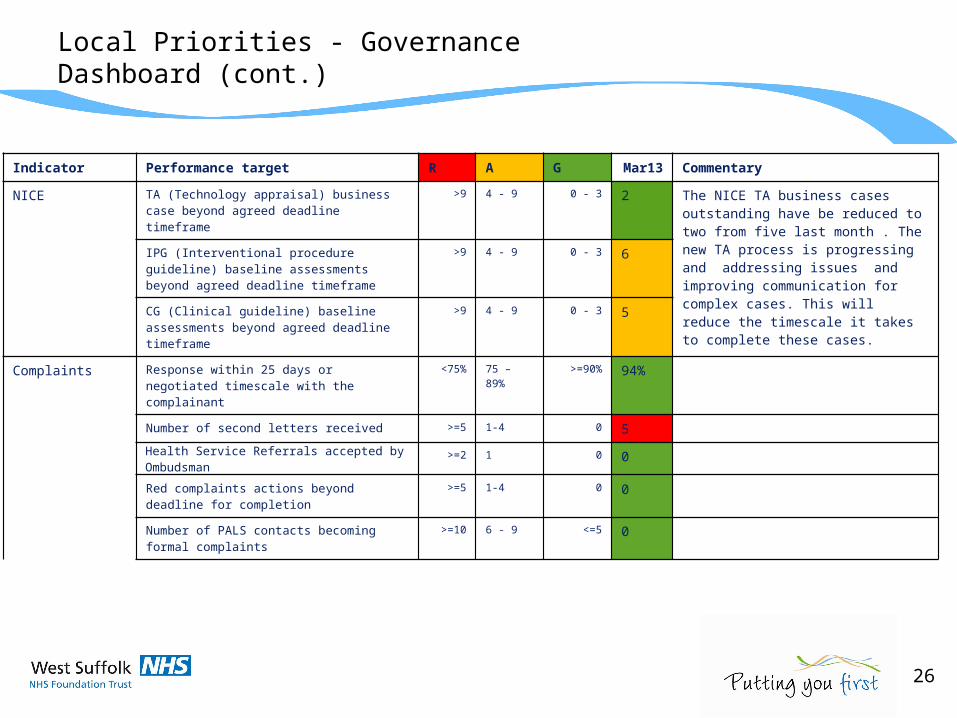
Local Priorities - Governance Dashboard (cont.)
Indicator Performance target R A G Mar13 Commentary
NICE TA (Technology appraisal) business case beyond agreed deadline timeframe
>9 4 - 9 0 - 3 2 The NICE TA business cases outstanding have be reduced to two from five last month . The new TA process is progressing and addressing issues and improving communication for complex cases. This will reduce the timescale it takes to complete these cases.
IPG (Interventional procedure guideline) baseline assessments beyond agreed deadline timeframe
>9 4 - 9 0 - 3 6
CG (Clinical guideline) baseline assessments beyond agreed deadline timeframe
>9 4 - 9 0 - 3 5
Complaints Response within 25 days or negotiated timescale with the complainant
<75% 75 – 89% >=90% 94%
Number of second letters received >=5 1-4 0 5
Health Service Referrals accepted by Ombudsman >=2 1 0 0
Red complaints actions beyond deadline for completion
>=5 1-4 0 0
Number of PALS contacts becoming formal complaints
>=10 6 - 9 <=5 0
26
Patient Safety Incidents reported
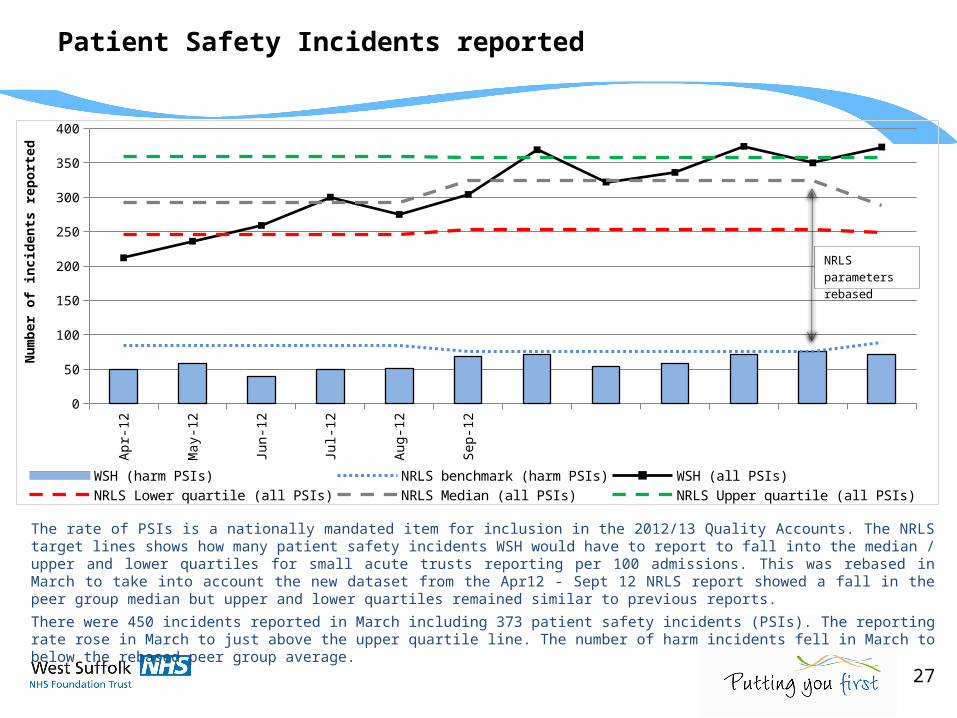
The rate of PSIs is a nationally mandated item for inclusion in the 2012/13 Quality Accounts. The NRLS target lines shows how many patient safety incidents WSH would have to report to fall into the median / upper and lower quartiles for small acute trusts reporting per 100 admissions. This was rebased in March to take into account the new dataset from the Apr12 - Sept 12 NRLS report showed a fall in the peer group median but upper and lower quartiles remained similar to previous reports.
There were 450 incidents reported in March including 373 patient safety incidents (PSIs). The reporting rate rose in March to just above the upper quartile line. The number of harm incidents fell in March to below the rebased peer group average.
Apr-
12
May
-12
Jun-
12
Jul-1
2
Aug-
12
Sep-
12
0
50
100
150
200
250
300
350
400
WSH (harm PSIs) NRLS benchmark (harm PSIs) WSH (all PSIs) NRLS Lower quartile (all PSIs)NRLS Median (all PSIs) NRLS Upper quartile (all PSIs)
Nu
mb
er o
f in
cid
ents
rep
ort
ed
NRLS parameters rebased
27
Patient Safety Incidents (Severe harm or death)
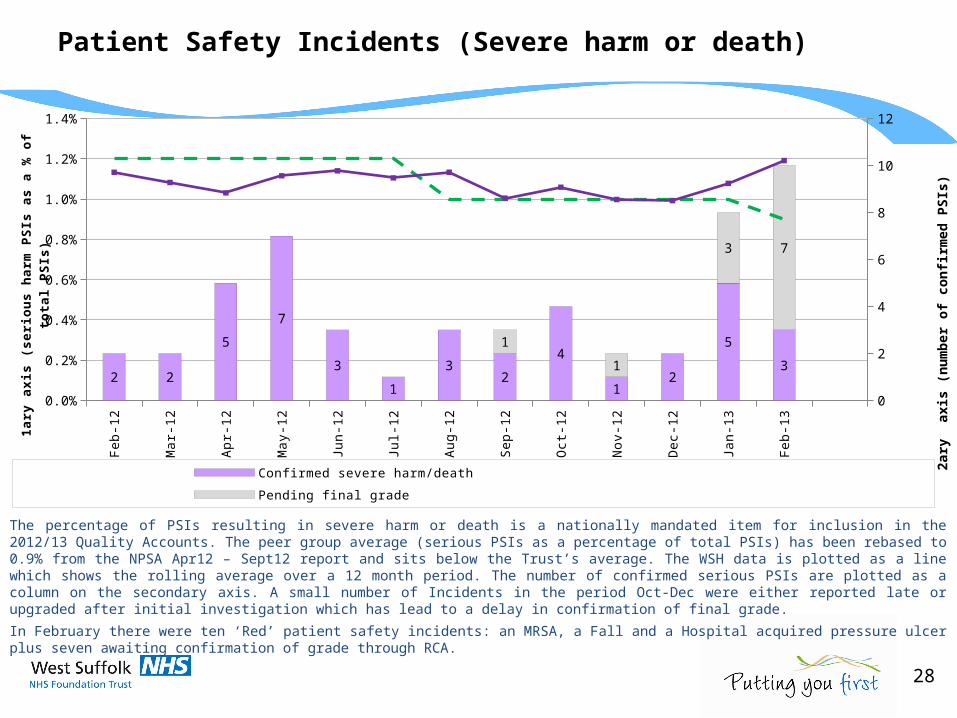
The percentage of PSIs resulting in severe harm or death is a nationally mandated item for inclusion in the 2012/13 Quality Accounts. The peer group average (serious PSIs as a percentage of total PSIs) has been rebased to 0.9% from the NPSA Apr12 – Sept12 report and sits below the Trust’s average. The WSH data is plotted as a line which shows the rolling average over a 12 month period. The number of confirmed serious PSIs are plotted as a column on the secondary axis. A small number of Incidents in the period Oct-Dec were either reported late or upgraded after initial investigation which has lead to a delay in confirmation of final grade.
In February there were ten ‘Red’ patient safety incidents: an MRSA, a Fall and a Hospital acquired pressure ulcer plus seven awaiting confirmation of grade through RCA.
Feb-
12
Mar
-12
Apr
-12
May
-12
Jun-
12
Jul-1
2
Aug
-12
Sep-
12
Oct
-12
Nov
-12
Dec
-12
Jan-
13
Feb-
13
0.0%
0.2%
0.4%
0.6%
0.8%
1.0%
1.2%
1.4%
0
2
4
6
8
10
12
2 2
5
7
3
1
32
4
12
5
3
1
1
3 7
Confirmed severe harm/death Pending final grade
(1ary axis) Benchmark NRLS Serious harm average (1.2%) (1ary axis) WSH serious harm - 12 month rolling average WSH%
1ary
axi
s (s
erio
us
har
m P
SIs
as
a %
of
tota
l P
SIs
)
2ary
axi
s (nu
mbe
r of c
onfir
med
PSI
s)
28
Local Priorities: Complaints
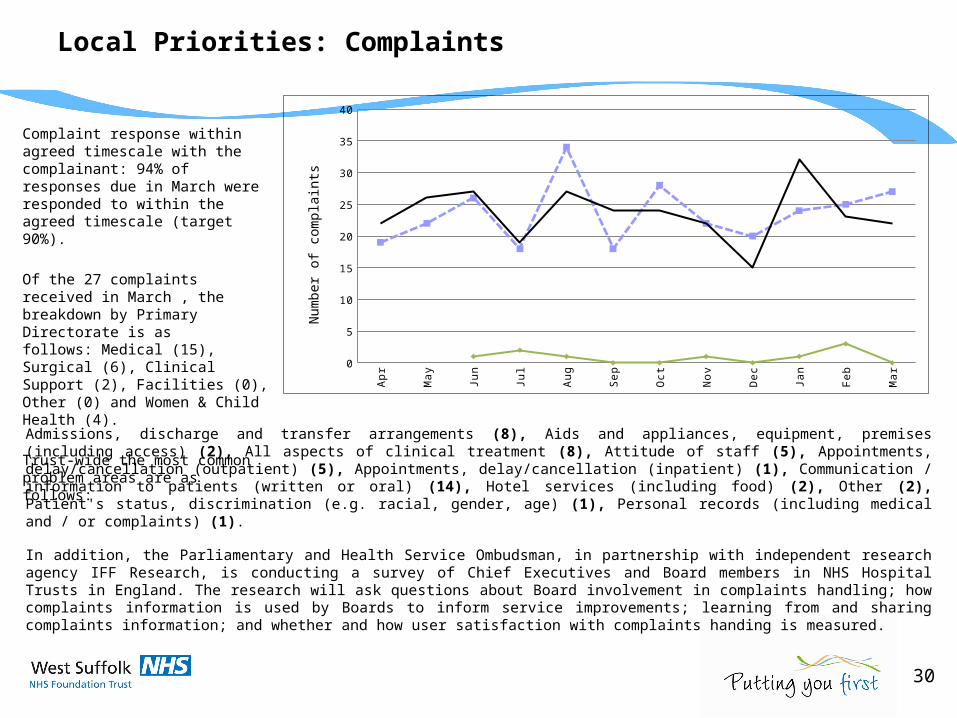
Complaint response within agreed timescale with the complainant: 94% of responses due in March were responded to within the agreed timescale (target 90%).
Of the 27 complaints received in March , the breakdown by Primary Directorate is as follows: Medical (15), Surgical (6), Clinical Support (2), Facilities (0), Other (0) and Women & Child Health (4).
Trust-wide the most common problem areas are as follows:
Apr May Jun Jul Aug Sep Oct Nov Dec Jan Feb Mar
Complaints 2012/13 19 22 26 18 34 18 28 22 20 24 25 27
Complaints 2011/12 22 26 27 19 27 24 24 22 15 32 23 22
Pain complaints NaN NaN 1 2 1 0 0 1 0 1 3 0
2.5
7.5
12.5
17.5
22.5
27.5
32.5
37.5
Num
ber
of c
ompl
aint
s
Admissions, discharge and transfer arrangements (8), Aids and appliances, equipment, premises (including access) (2), All aspects of clinical treatment (8), Attitude of staff (5), Appointments, delay/cancellation (outpatient) (5), Appointments, delay/cancellation (inpatient) (1), Communication / information to patients (written or oral) (14), Hotel services (including food) (2), Other (2), Patient's status, discrimination (e.g. racial, gender, age) (1), Personal records (including medical and / or complaints) (1).
In addition, the Parliamentary and Health Service Ombudsman, in partnership with independent research agency IFF Research, is conducting a survey of Chief Executives and Board members in NHS Hospital Trusts in England. The research will ask questions about Board involvement in complaints handling; how complaints information is used by Boards to inform service improvements; learning from and sharing complaints information; and whether and how user satisfaction with complaints handing is measured.
30
Local Priorities: PALS (Patient Advice & Liaison Service)
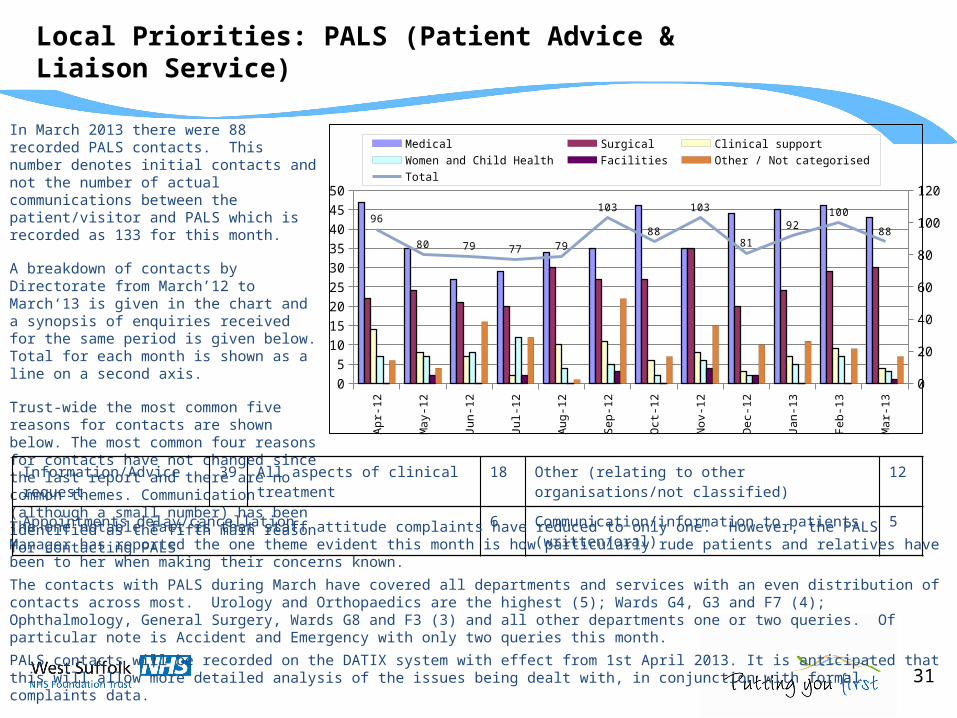
In March 2013 there were 88 recorded PALS contacts. This number denotes initial contacts and not the number of actual communications between the patient/visitor and PALS which is recorded as 133 for this month.
A breakdown of contacts by Directorate from March’12 to March‘13 is given in the chart and a synopsis of enquiries received for the same period is given below. Total for each month is shown as a line on a second axis.
Trust-wide the most common five reasons for contacts are shown below. The most common four reasons for contacts have not changed since the last report and there are no common themes. Communication (although a small number) has been identified as the fifth main reason for contacting PALS
Apr-1
2
May
-12
Jun-
12
Jul-1
2
Aug-
12
Sep-
12
Oct-1
2
Nov-
12
Dec-
12
Jan-
13
Feb-
13
Mar
-13
05
101520253035404550
0
20
40
60
80
100
120
96
80 79 77 79
103
88
103
81
92100
88
Medical Surgical Clinical support Women and Child Health
Facilities Other / Not categorised Total
Information/Advice request 39 All aspects of clinical treatment 18 Other (relating to other organisations/not classified) 12
Appointments delay/cancellation 6 Communication/information to patients (written/oral)
5
The one notable fact is that staff attitude complaints have reduced to only one. However, the PALS Manager has reported the one theme evident this month is how particularly rude patients and relatives have been to her when making their concerns known.
The contacts with PALS during March have covered all departments and services with an even distribution of contacts across most. Urology and Orthopaedics are the highest (5); Wards G4, G3 and F7 (4); Ophthalmology, General Surgery, Wards G8 and F3 (3) and all other departments one or two queries. Of particular note is Accident and Emergency with only two queries this month.
PALS contacts will be recorded on the DATIX system with effect from 1st April 2013. It is anticipated that this will allow more detailed analysis of the issues being dealt with, in conjunction with formal complaints data.
31
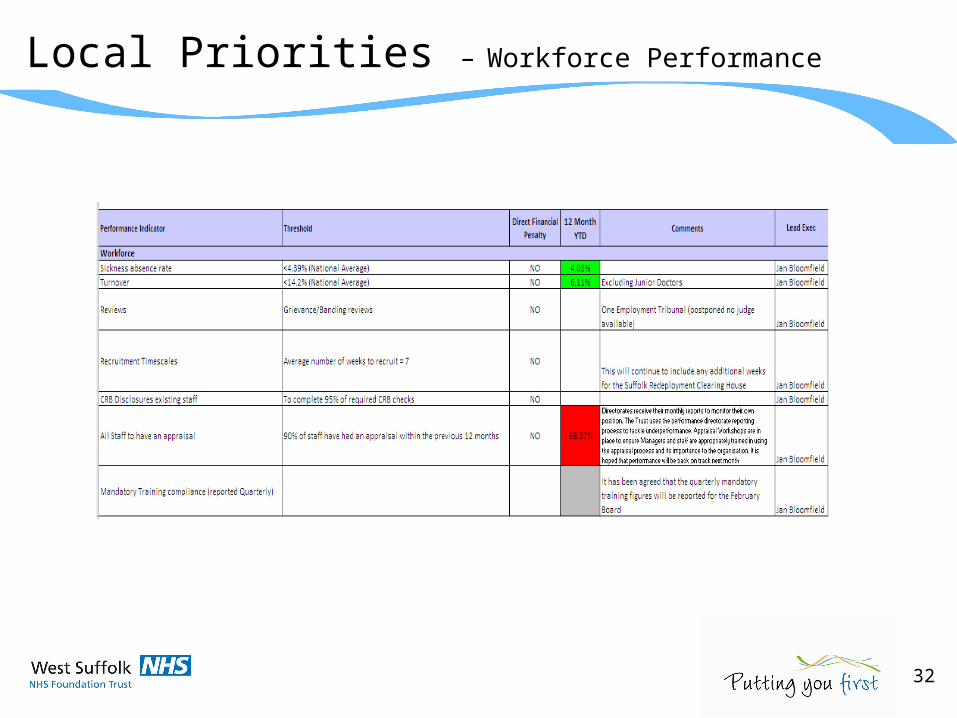
Local Priorities – Workforce Performance
32
Monitor ComplianceSummary & Exceptions report
33
The Trust has agreed an action plan to implement the recommendations of the Emergency Care Intensive Support Team (ECIST) with West Suffolk CCG and ECIST. One expected outcome of this is improved A&E 4 hour performance.
Project Delivery Board is in place, chaired by the Interim Chief Operating Officer and actions are being undertaken. The ECIST plan is appended to the Monitor Q4 report to the Board and a related business case for a Clinical Decision Unit (CDU) will also be presented to the Board in April.
C Diff is reported on page 7 of this report.
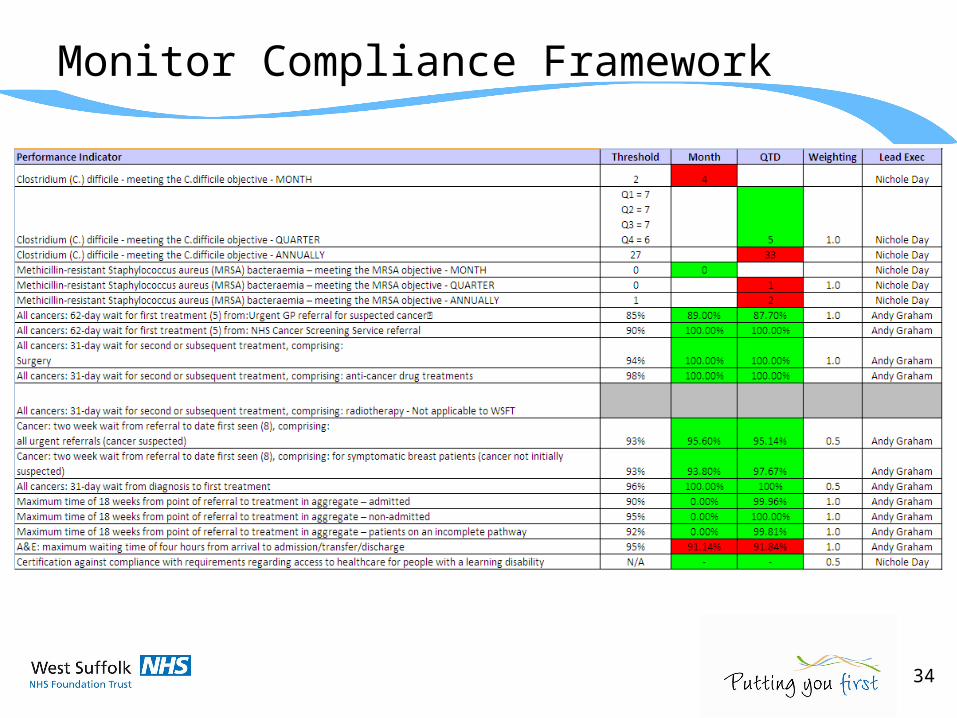
Monitor Compliance Framework
Monitor Compliance FrameworkA3 printout
Dashboard - screenprint
34
Contract PrioritiesSummary & Exceptions report
35
StrokeSeven of 11 targets were achieved.
• Pathways for 6 patients did not achieve admission to the Stroke Unit within 4 hours. Five of the six patients spent >4 hours in A&E. 17 of 23 patients were admitted to the Stroke Unit within 4 hours.
• One patient did not have a brain scan within 24 hours. This patient had a Stroke after admission to hospital. • One of seven patients did not have a brain scan within 60 minutes of arrival. This patient was not alerted as a
potential stroke patient on arrival. • It is notable that 100% of patients had access to a Carotid scan from referral. All patients missing the ‘from
onset’ target relate to delays in referral.
Cancelled Operations The number of cancelled operations continued to be above the 1% target in February. This was because of emergency bed pressures, overrunning theatre lists and operating staff sickness.

Contract Priorities Dashboard + OtherA3 printout
Comes from dashboard
36 - 39