Embed Size (px)
Citation preview

Issued by HSBC Asset Management (India) Private Limited
HSBC Equity FundAn open-ended diversified equity Scheme
Abridged Annual Report 2008 - 2009
HSBC Global Asset Management

1
Dear Investor,
We thank you for investing with HSBC Mutual Fund. We are pleased to inform you that HSBCMutual Fund has won prestigious awards* this year at various forums in India.
The awards* won by our schemes in India are
� HSBC Equity Fund has been included in the 5 star rated fund category (“Top rated mutualfunds” by Value Research online) in March, 2009.
� Five-stars indicate that a fund is in the top 10 per cent of its category in terms ofhistorical risk-adjusted returns.
� ICRA Mutual Fund Awards 2009
� HSBC MIP - Savings has been ranked a 5-Star Fund by ICRA Online indicating performanceamong the top 10% in the category of 'Open Ended Marginal Equity' for 3 yearperformance ending 31 December, 2008.
� CNBC TV18 - CRISIL Mutual Fund Awards 2008
� HSBC MIP - Savings was awarded the CNBC TV18 - CRISIL Mutual Fund of the YearAward for the year 2008 in the Monthly Income Plans - Aggressive Category.
(Past performance is no guarantee of future results. * Please refer to Ranking methodologyand disclaimer mentioned at the end of the Abridged Annual Report for the year endedMarch 31, 2009).
At the global level, the HSBC Group won several awards at Euromoney's Awards for Excellence2009. The top awards that HSBC won were the Best Global Bank and the Best Global DebtHouse. It was also honoured as the Best Debt House in 8 locations including Asia and the Bestat Risk Management in Asia. (Past performance may or may not be sustained in the future andis no guarantee of future results). We continue to be one of the leading players in emergingmarkets and remain committed to our asset management business in India.
HSBC Asset Management (India) Private Limited including the mutual fund business as well asthe PMS business (including EPFO money deployed till date) manages assets of about Rs. 26280Crores as at 30 June, 2009. The core to our winning strategy is our endeavour to deliverconsistent performance over the medium to long term for our investors in a risk controlledenvironment and aim for consistent wealth creation under varying market conditions. Throughour product range, we aim to be true to our reputation in India of being a provider ofinternational quality investment products and services.
We remain committed to our philosophy of aiming for consistent wealth creation and serviceexcellence and look forward to your continued investments in HSBC Mutual Fund.
Yours sincerely,
VikramaadityaChief Executive OfficerHSBC Asset Management (India) Private Limited

2
SPONSORHSBC Securities and Capital Markets (India) Private LimitedRegd. Office: 52/60, Mahatma Gandhi Road, Fort, Mumbai 400 001.
TRUSTEEBoard of TrusteesOffice: 314, D. N. Road, Fort, Mumbai 400 001.
ASSET MANAGEMENT COMPANYHSBC Asset Management (India) Private LimitedCorp. & Regd. Office: 314, D. N. Road, Fort, Mumbai 400 001.
CUSTODIANJP Morgan Chase BankCorp. & Regd. Office: Mafatlal Centre, 9th Floor, Nariman Point, Mumbai - 400 021.
AUDITORS TO THE SCHEMEPrice WaterhouseChartered Accountants252, Veer Savarkar Marg, Shivaji Park, Dadar (West), Mumbai - 400 028.
LEGAL ADVISORSBharucha & Partners4th Floor, Cecil Court, Mahakavi Bhushan Marg, Colaba, Mumbai - 400 039.
REGISTRAR & TRANSFER AGENTSComputer Age Management Services (P) Ltd. (CAMS)Rayala Towers, Tower I, III Floor, 158 Anna Salai, Chennai - 600 002.
BOARD OF TRUSTEESMr. N. P. Gidwani - Chairman
Dr. Rudolf ApenbrinkMr. Nasser MunjeeMr. Manu TandonMr. Mehli MistriMr. Dilip J. Thakkar
BOARD OF DIRECTORSMs. Naina Lal Kidwai - Chairman
Mr. Ayaz EbrahimMr. S. P. Mustafa**Mr. Vithal PalekarMs. Kishori J. Udeshi*Mr. Vikramaaditya - Chief Executive Officer***
* Ms. Kishori Udeshi has been appointed as a Director with effect from 14 January 2009 andMr. Jagjit Lal Pasricha has resigned as a Director with effect from 19 January 2009.
** Mr. S. P. Mustafa has been appointed as a Director with effect from 2 September 2008 andMr. Nawshir Khurody has resigned as a Director with effect from 1 September 2008
*** Mr. Vikramaaditya has been appointed as the Chief Executive Officer with effect from 16 July 2008and Mr. Sanjay Prakash has resigned as the Chief Executive Officer with effect from 16 July 2008.

3
Trustees' ReportFor the year ended March 31, 2009
The Trustees present the seventh report and the audited financial statements of the Schemes ofHSBC Mutual Fund (the "Fund"), for the year ended March 31, 2009.
1. SCHEME PERFORMANCE, FUTURE OUTLOOK AND OPERATIONS OF THE SCHEME
a) Operations and Performance of the Scheme
HSBC Equity Fund (HEF) - an open-ended diversified Equity Scheme
To generate long-term capital growth from an actively managed portfolio of equity and equity relatedsecurities. The Scheme offers investors two Options (1) Growth Option (2) Dividend Option. TheDividend Option offers Dividend Payout and Dividend Reinvestment Facilities.
The net assets of the Scheme amounted to Rs. 1092.07 crores as at March 31, 2009 as againstRs. 1052.51 crores as at March 31, 2008. 83% of the net assets were invested in equities, and 17%were invested in debt and money market instruments as at March 31, 2009.
HSBC Equity Fund's approach is to invest across a range of market capitalizations with a preferencefor medium and large companies. Income is not a primary consideration in the investment policies ofHEF.
The fund outperformed the benchmark by approximately 900 bps in FY09 by holding higher thanusual levels of cash and a defensive (low beta) portfolio.
Date of Inception : 10 December, 2002 Compounded Annualized Returns (%)
Schemes (P2P) 1 Year 3 Years 5 Years Since Inception
HSBC Equity Fund - Growth -31.92 -0.41 17.02 32.90
BSE 200 -40.98 -6.88 9.22 18.78
Past performance may or may not be sustained in future. Returns equal to or greater than 1 year arecompounded annualized. 'Since inception' returns are calculated on Rs. 10 invested at inception.Calculations are based on Growth NAVs.
b) Market Overview & Outlook
MARKET OVERVIEW
(as furnished by HSBC Asset Management (India) Private Limited)
Equity Market Overview
The financial year ended 31 March, 2009 was a highly eventful one with long standing institutionsdisappearing from the landscape in the whirlwind of the sub-prime crisis and derivative losses. Theyear can be split into three phases - the first from April 2008 till when Lehman Brothers filed forbankruptcy, which saw a blowout commodity rally (crude oil nudged close to USD 144/barrel) andthe sub-prime situation turning progressively worse. The United States (US) Government / FederalReserve bailed out major institutions thought to be critical to the functioning of the financial system.The second phase from September 2008 till January 2009 saw a spate of bankruptcies most notablyLehman Brothers which saw the appearance of an acute level of risk aversion pushing the creditmarkets into a gridlock. This phase also coincided with the fiscal / monetary stimuli by variousgovernments to take the credit crisis head on. Globally, markets stabilized around their October2008 lows and a semblance of normality started re-appearing in financial markets in this period. Thethird phase from February 2009 onwards witnessed a sharp rally as a weakening US Dollar spewedmoney into emerging markets. The sensex fell by 38% during the financial year.

4
For the financial year 2009, the popular indices viz. BSE Sensex and CNX Nifty were down 37.94%and 36.19% respectively. The BSE Midcap (54.01)% and the broader indices like BSE 200 (40.98)%and BSE 500 (42.77)% also reflected the correction across the markets. Within sectoral indices thebest performing indices were BSE FMCG (11.08)% and BSE Oil and Gas (29.58)% while the worstperforming indices were BSE Realty (79.37)%, due to the high leverage on the balance sheets, BSEMetals (58.67)%, due to slowdown in global growth and BSE Consumer Durables (58.14)% and BSECapital goods (53.84%).
In a year that saw sell-off across emerging markets, FIIs were net sellers of the tune USD 10.4 billionin the Indian equity markets while Domestic Institutional Investors (Insurance & Mutual Funds) werebuyers to the tune of USD 13.1 billion. Further, FIIs were net sellers in the derivative markets ashedge funds, and p-notes unwound positions in a rapidly deleveraging world. Thus, sentimentremained negative as few US based investment banks filed for bankruptcy in the midst of the liquidityand credit crisis and safety took precedence over growth.
Debt Market Overview
Two contrarian forces one inflationary and the other deflationary had been in play since 2007: Onthe one hand strong demand from emerging economies were leading commodities higher and fuellinginflation, while on the other the housing led credit crisis in the US was starting to exert a deflationaryforce. The first force was dominant till early July 2008 leading commodity prices to fresh peaks andinflation to multi year highs. Since then, however, the second force took hold with the result thatcommodity prices fell sharply from the top, growth and inflation numbers toppled worldwide, andcentral bankers shifted focus to achieving financial stability and protecting growth.
The financial crisis hit the domestic markets towards September 2008, leading to acute disruption inmoney markets. The Reserve Bank of India (RBI) acted proactively cutting the cash reserve ratio (CRR)by an unprecedented 400 bps between September 2008 and January 2009. Similarly, the reverserepo rate had been cut by 275 bps since October 2008 while the repo rate had been cut by 425 bpsover the same period.
Bond market yields fell in line with the unprecedented monetary easing up till the first week ofJanuary 2009. Thereon, supply pressures on bond markets rose as a result of government fiscalslippages aimed at stimulating the economy. The RBI, in line with similar measures elsewhere in theworld, started buying government securities to lessen the impact on yields from the rise in governmentborrowing. Although this helped market sentiment, it could not prevent a general rise in yieldstowards fiscal close. As a result, the 10 year benchmark sovereign yield closed the fiscal at 7% froma low of sub 5% hit in early January 2009. Money market rates stabilized after the initial mayhem ofSeptember 2008 and October 2008 and liquidity came back to interbank markets.
MARKET OUTLOOK
(as furnished by HSBC Asset Management (India) Private Limited)
Equity Market Outlook
Financial Year (FY) 2008-09 was a year marked by a strong correlation between the Indian marketand global markets with key indices ending deeply in the red on the back of the subprime crisis andderivative led losses across major financial stocks in the United States (US). Even in India, forex lossesran across corporate India though at a smaller magnitude. FY 10 has begun on a better note onaccount of various fundamental and technical factors.
GDP for FY 09 grew at 6.7% against FY 08 levels of 9%. Agriculture posted a below trend growthrate of 1.6% and industry grew by 3.9% (versus 8.1% in FY 08) with services registering a close to9.7% growth. IIP grew by a mere 2.6%. Although order books of engineering / capital goods wererunning at record high levels, there was possibility of delays in execution as funding sources for thedevelopers (equity, ECB, private equity, FCCB) had dried up. A sharp increase in subsidy on account
Trustees' ReportFor the year ended March 31, 2009 (Contd...)

5
of oil, fertilizers and food led to a cut back in discretionary spending. Inflation rose on the back of asurging crude and higher prices of agricultural commodities to top at 12.91% for the week ending 2August, 2008. A slow down in the growth rates in the US / EU and other markets finally tamed thesurge in crude. As growth rates stumbled, governments / monetary authorities the world over triggeredfiscal stimuli / monetary easing to escape recessionary forces. This was followed in India as wellwhich started monetary easing / fiscal stimuli to keep growth rates buoyant.
On the positive side, India continues to do better in relative terms and we expect GDP growth of6-6.5% for FY10. The broad themes that are driving domestic growth viz. capital expenditure,infrastructure building and domestic consumption are still intact. The key concerns at this pointstems from a ballooning fiscal deficit at the consolidated level (Centre & State) with salary revisionfor Central / State Government employees threatening a cut back in discretionary spending. Inflationis likely to remain benign for the first half of FY10 on a favourable base effect but we anticipate it togo back to trend levels of 5-5.5% for the second half of FY10 as this base effect wears off.
On a valuations perspective, the markets are currently trading at a P/E ratio of around 12 timesFY 2010 earnings. This is well below the 10-year average given the extreme risk aversion prevailing inthe markets. However, the underlying growth in the economy and corporate earnings growth (15%in the long term) makes the market attractive from a longer-term view. The short term could seeenhanced volatility arising from various factors. Increase in commodity prices continues to be a riskin the medium term as the US dollar continues to struggle with the ballooning US fiscal situation.
Debt Market Outlook
Excess supply of government bonds, as a result of fiscal slippages to arrest the downward growthmomentum, has been a reality for bond markets since January 2009. However, this is now compoundedwith some fatigue in buying longer duration as economic data is showing signs of recovery,commodities are showing signs of rally and expectations of incremental monetary easing from theRBI are beginning to unwind. However, system liquidity remains surplus and bank deposits continueto grow thereby providing resistance to bond yields from rising sharply.
Given the above factors, we believe that the market would continue to provide tactical opportunitiesalthough the fundamental bias should be for lower duration. Also, any mitigation of bond supplypressure or a new downturn in the ongoing economic recovery may provide space for opportunisticlonger duration plays. On the other hand, if the recovery cycle continues uninterrupted and commodityprices remain firm, central banks may start to worry about withdrawing the current monetary stimulusby sometime early 2010; with consequent impact on bond markets.
2. BRIEF BACKGROUND OF SPONSORS, BOARD OF TRUSTEES AND ASSETMANAGEMENT COMPANY
a) Sponsor
HSBC Mutual Fund is sponsored by HSBC Securities and Capital Markets (India) Private Limited (HSCI).The Sponsor is the Settler of the Mutual Fund Trust. The Sponsor has entrusted a sum of Rs. 1,00,000(Rupees One Lakh only) to the Trustee as the initial contribution towards the corpus of the MutualFund.
HSCI is a member of the HSBC Group, one of the largest banking and financial services organisations,in the world. Headquartered in London, HSBC operates through long-established businesses in fiveregions: Europe, Asia-Pacific, Middle East, America and Africa. Through its global network of 10,000offices in 86 countries and territories, HSBC provides a comprehensive range of financial services topersonal, commercial, corporate, institutional investment and private banking clients.
HSCI offers integrated investment banking services, securities and corporate finance & advisory. HSCIis a member of The Bombay Stock Exchange Limited and National Stock Exchange (capital and derivativemarket segments) and is also a category I merchant banker and underwriter registered with Securitiesand Exchange Board of India.
HSCI holds 100% of the paid-up equity share capital of the AMC.
Trustees' ReportFor the year ended March 31, 2009 (Contd...)

6
b) HSBC Mutual Fund
HSBC Mutual Fund ("the Mutual Fund" or "the Fund") has been constituted as a Trust in accordancewith the provisions of the Indian Trusts Act, 1882 (2 of 1882) vide a Trust Deed dated February 7,2002 with HSBC Securities and Capital Markets (India) Private Limited, as the Sponsor and the Boardof Individual Trustees. The Trustee has entered into an Investment Management Agreement datedFebruary 7, 2002 with HSBC Asset Management (India) Private Limited (the AMC) to function as theInvestment Manager for all the Schemes of the Fund. The Fund was registered with SEBI videregistration number MF/046/02/5 dated May 27, 2002.
The Trust has been formed for the purpose of pooling of capital from the public for collectiveinvestment in securities / any other property for the purpose of providing facilities for participationby persons as beneficiaries in such properties / investments and in the profits / income arising therefrom.
c) Board of Trustees (the Trustees)
The Board of Trustees are the exclusive owner of the Trust Fund and holds the same in trust for thebenefit of the unitholders. The Trustees have been discharging their duties and carrying out theirresponsibilities as provided in the SEBI (Mutual Funds) Regulations, 1996 and the Trust Deed. TheTrustees seeks to ensure that the Fund and the Schemes floated thereunder are managed by theAMC in accordance with the Trust Deed, the said Regulations, directions and guidelines issued bySEBI, the Stock Exchanges, the Association of Mutual Funds of India and other regulatory agencies.
d) Asset Management Company (the AMC)
HSBC Asset Management (India) Private Limited (the Investment Manager or the AMC) is a privatelimited company incorporated under the Companies Act, 1956 on December 12, 2001 having itsRegistered Office at 314, D. N. Road, Fort, Mumbai 400 001. HSBC Asset Management (India) PrivateLimited has been appointed as the Asset Management Company of the HSBC Mutual Fund by theTrustee vide Investment Management Agreement (IMA) dated February 7, 2002 and executed betweenthe Trustees and the AMC. SEBI approved the AMC to act as the Investment Manager of the Fundvide. its letter No. MFD/BC/163/2002 dated May 27, 2002.
The paid-up equity share capital of the AMC is Rs. 9 crores. HSBC Securities and Capital Markets(India) Private Limited holds 100% of the paid-up equity share capital of the AMC.
3. INVESTMENT OBJECTIVE OF THE SCHEMEThe investment objective of the Scheme has been provided above under the heading "SchemePerformance, Future Outlook and Operation of the Scheme" (refer Section 1).
4. SIGNIFICANT ACCOUNTING POLICIESThe accounting policies are in accordance with Securities and Exchange Board of India (Mutual Funds)Regulations, 1996.
5. UNCLAIMED DIVIDENDS & REDEMPTIONSSummary of number of Investors & corresponding amount
Unclaimed Dividends Unclaimed Redemptions
Scheme Amount No. of Amount No. of(Rs.) Investors (Rs.) Investors
HSBC Equity Fund 2,260,240.73 591 1,092,845.98 34
6. INVESTOR SERVICESDuring the year, the number of official points of acceptance of transactions increased significantly toabout 182 locations. In addition to the offices of the transfer agency, the company has InvestorService Centres in 14 locations at its own offices - namely Mumbai, New Delhi, Kolkata, Chennai,
Trustees' ReportFor the year ended March 31, 2009 (Contd...)

7
Trustees' ReportFor the year ended March 31, 2009 (Contd...)
Bangalore, Hyderabad, Pune, Ahmedabad, Indore, Chandigarh, Kochi, Coimbatore, Lucknow andVadodara. With a view to enhancing customer convenience, the Asset Management Company hasextended the facility of crediting investor bank accounts directly by way of NEFT / RTGS (for credit ofredemption and dividend proceeds). The AMC endeavours to despatch dividend proceeds within 5working days from the Record Date in all Schemes. The internal standards on redemption payoutshave been consistently met, with very few exceptions. The number of locations for the ECS AutoDebit facility for investments through Systematic Investment Plan also increased to about 74 byMarch 2009.
On the distribution front, the number of empanelled distributors increased from 7859 as on 31March, 2008 to 8632 as on 31 March, 2009. During the year, the Asset Management Companyinitiated tie-ups for online distribution of the Mutual Fund's schemes with several channel partnerstaking the total number of such tie-ups to 24 (Angel Capital & Department Market Ltd., Bajaj CapitalLimited, Bonanza Portfolio Limited, Citibank N.A., Citigroup Wealth Advisors India Private Limited,HDFC Bank Limited, Hongkong & Shanghai Banking Corporation Limited, HSBC Corporate InvestmentSolution Services, ICICI Securities Limited, India Infoline Limited, Karvy Stock Broking Limited, KotakMahindra Bank Limited, Kotak Securities Limited, Motilal Oswal Securities Limited, NJ India InvestPrivate Limited, Reliance Securities Limited, RR Investors Capital Services Private Limited, SBICAPSecurities Limited, Sharekhan Limited, SMC Global Securities Limited, Standard Chartered - STCICapital Markets Ltd., Tom Distribution Services Limited, Yes Bank Limited).
Call centre operations have been extended to cover the entire country. The Asset ManagementCompany has outsourced certain back office services including call centre services to HSBC Operationsand Processing Enterprise (India) Private Limited (HOPE).
7. STATUTORY DETAILSa) The Sponsors are not responsible or liable for any loss resulting from the operation of the Schemes
of the Fund beyond initial contribution of Rs. 1 lakh for setting up the Fund.
b) The price and redemption value of the units, and income from them, can go up as well as downwith fluctuations in the market value of its underlying investments.
c) Full / Abridged Annual Report shall be disclosed on the website at www.assetmanagement.hsbc.com/inand shall be available for inspection at the Head Office of the mutual fund. Present and prospectiveunit holder can obtain copy of the trust deed, the Full / Abridged Annual Report of the Scheme(s),the Annual Report of HSBC Asset Management (India) Private Limited and the text of the relevantScheme(s) at a price.
8. ACKNOWLEDGEMENTSThe Trustees wish to thank the Unitholders of the Schemes for their support throughout the year andalso thank the Government of India, the Securities and Exchange Board of India (SEBI), the ReserveBank of India (RBI) and the Association of Mutual Funds in India (AMFI) for the guidance provided bythem. The Trustees also appreciate the service provided by the Registrar and Transfer Agent, FundAccountant, Custodian, Bankers, Distributors and Brokers. The guidance and services provided bythe Auditors and advocates and the ebullience, sincerity and dedication of the employees of HSBCAsset Management (India) Private Limited is also appreciated.
The Trustees look forward to the continued support of everyone.
For and on behalf of the Board of Trustees of HSBC Mutual Fund
Dilip J. Thakkar
Trustee
MUMBAIJuly 6, 2009

8
To the Board of Trustees of
HSBC MUTUAL FUND
1. We have audited the Balance Sheet of HSBC Mutual Fund – HSBC Equity Fund (“The Scheme”) asat March 31, 2009, and the related Revenue Account for the year ended on that date annexedthereto and the Cash Flow Statement for the year ended on that date which we have signedunder reference to this report. These financial statements are the responsibility of the Board ofTrustees of HSBC Mutual Fund and the Management of HSBC Asset Management (India) PrivateLimited (the “Management”). Our responsibility is to express an opinion on these financialstatements based on our audit.
2. We have conducted our audit in accordance with auditing standards generally accepted in India.Those standards require that we plan and perform the audit to obtain reasonable assuranceabout whether the financial statements are free of material misstatement. An audit includesexamining, on a test basis, evidence supporting the amounts and disclosures in the financialstatements. Our procedures included confirmation of securities owned and unit capital balancesas at March 31, 2009 by correspondence with the custodian / others and registrar and transferagent respectively. An audit also includes assessing the accounting principles used and significantestimates made by the Management as well as evaluating the overall financial statementpresentation. We believe that our audit provides a reasonable basis for our opinion.
3. We have obtained all the information and explanations which to the best of our knowledge andbelief were necessary for the purpose of our audit. The Balance Sheet and the Revenue Accountreferred to above are in agreement with the books of account of the Scheme.
4. In our opinion and to the best of our information and according to the explanations given to us,
(i) The Balance Sheet, the Revenue Account together with the notes thereon give the informationrequired by the Securities and Exchange Board of India (Mutual Funds) Regulations, 1996 andamendments thereto, as applicable, and also give respectively, a true and fair view of thestate of affairs of HSBC Mutual Fund – HSBC Equity Fund as at March 31, 2009, its net deficitand its Cash Flow for the year ended on that date.
(ii) The Balance Sheet as at March 31, 2009 and the Revenue Account for the year ended on thatdate, together with the notes thereon have been prepared in all material respects in accordancewith the accounting policies and standards specified in the Ninth Schedule of the Securitiesand Exchange Board of India (Mutual Funds) Regulations, 1996 and amendments thereto asapplicable.
Partha GhoshPartnerMembership No. F / 55913
For and on behalf ofPRICE WATERHOUSEChartered Accountants
Place : MumbaiDate : July 6, 2009
Auditors' Report

9
Rs. in Lakhs
HSBC EQUITY FUND
As at As atMarch 31, 2009 March 31, 2008
LIABILITIES1 Unit Capital 39,846.26 27,768.99
2 Reserves & Surplus2.1 Unit Premium Reserves 2,119.08 (1,512.61)2.2 Unrealised Appreciation Reserve 22.03 11,687.792.3 Other Reserves 67,221.65 67,739.38
3 Loans & Borrowings – –
4 Current Liabilities & Provisions4.1 Provision for doubtful Income/Deposits – –4.2 Other Current Liabilities & Provisions 1,337.53 3,546.52
TOTAL 110,546.55 109,230.07
ASSETS1 Investments1.1. Listed Securities:1.1.1 Equity Shares 85,046.83 89,681.441.1.2 Preference Shares – –1.1.3 Equity Linked Debentures – –1.1.4 Other Debentures & Bonds – –1.1.5 Securitised Debt securities – –
1.2 Securities Awaited Listing:1.2.1 Equity Shares – –1.2.2 Preference Shares – –1.2.3 Equity Linked Debentures – –1.2.4 Other Debentures & Bonds – –1.2.5 Securitised Debt securities – –
1.3 Unlisted Securities:1.3.1 Equity Shares – –1.3.2 Preference Shares – –1.3.3 Equity Linked Debentures – –1.3.4 Other Debentures & Bonds – –1.3.5 Securitised Debt securities – –
1.4 Government Securities – –1.5 Treasury Bills – –1.6 Commercial Paper – –1.7 Certificate of Deposits – –1.8 Bill Rediscounting – –1.9 Units of Domestic Mutual Fund – –1.10 Foreign Securities – –
Total Investments 85,046.83 89,681.44
2 Deposits 6,256.03 3,356.03
3 Other Current Assets3.1 Cash & Bank Balance 214.24 112.803.2 CBLO / Reverse Repo Lending 16,548.57 12,696.103.3 Others 2,480.88 3,383.70
4 Deferred Revenue Expenditure – –(to the extent not written off)
TOTAL 110,546.55 109,230.07
Notes to Accounts - Annexure I
Abridged Balance Sheet as at March 31, 2009

10
Rs. in Lakhs
HSBC EQUITY FUND
Current PreviousYear ended Year ended
March 31, 2009 March 31, 2008
1 INCOME1.1 Dividend 1,130.00 607.111.2 Interest 1,426.94 760.991.3 Realised Gain / (Loss) on Foreign Exchange Transactions – (0.26)1.4 Realised Gains / (Losses) on Interscheme
sale of investments – –1.5 Realised Gains / (Losses) on External sale /
redemption of investments (28,846.88) 29,908.861.6 Realised Gains / (Losses) on Derivative Transactions 1,828.55 409.921.7 Other Income – –
(A) (24,461.39) 31,686.62
2 EXPENSES2.1 Management fees 697.59 1,152.012.2 Service tax on Management fees ** – –2.3 Transfer agents fees and expenses 215.56 180.062.4 Custodian fees 58.33 52.722.5 Trusteeship fees 0.45 0.362.6 Commission to Agents * – –2.7 Marketing & Distribution expenses 1,205.76 600.692.8 Audit fees 5.50 7.002.9 Other operating expenses 20.45 282.24
(B) 2,203.64 2,275.08
3 NET REALISED GAINS / (LOSSES)FOR THE YEAR / PERIOD (A - B = C) (26,665.03) 29,411.54
4 Change in Unrealised Depreciation invalue of investments (D) 16,683.17 3,782.43
5 NET GAINS / (LOSSES) FOR THEYEAR /PERIOD [E = (C - D)] (43,348.20) 25,629.11
6 Change in unrealised appreciationin the value of investments (F) – 96.57
7 NET SURPLUS / (DEFICIT) FORTHE YEAR / PERIOD (E + F = G) (43,348.20) 25,725.68
7.1 Add: Balance transfer from UnrealisedAppreciation Reserve – –
7.2 Less: Balance transfer to Unrealised Appreciation Reserve – –7.3 Add / (Less): Equalisation 31,164.97 7,197.26
8 TOTAL (12,183.23) 32,922.94
9 Dividend Appropriation9.1 Income Distributed during the year / period 0.25 23,365.399.2 Tax on income distributed during the year / period – –
10 Retained Surplus / (Deficit) carriedforward to Balance Sheet (12,183.48) 9,557.55
Notes to Accounts - Annexure I* Commission to Agents is included in Marketing & Distribution Expenses.** Service Tax on Management Fees is included in Other Operating Expenses.
Abridged Revenue Account for the year ended March 31, 2009

11
HSBC EQUITY FUND
Current PreviousYear ended Year ended
March 31, 2009 March 31, 2008
1. NAV per unit (Rs.):
Open
Regular Growth Option 88.3814 67.8614
Regular Dividend Option 27.6286 28.1217
High
Regular Growth Option 97.1612 118.1166
Regular Dividend Option 30.3743 48.9584
Low
Regular Growth Option 52.9573 64.9581
Regular Dividend Option 16.5549 26.3571
End
Regular Growth Option 60.1737 88.3814
Regular Dividend Option 18.8099 27.6286
2. Closing Assets Under Management (Rs. in Lakhs)
End 109,209 105,684
Average (AAuM)1 108,793 112,899
3. Gross income as % of AAuM2 -22.48% 28.07%
4. Expense Ratio:
a. Total Expense as % of AAuM (planwise)
Regular Growth Option 2.03% 2.02%
Regular Dividend Option 2.03% 2.01%
b. Management Fee as % of AAuM (planwise)
Regular Growth Option 0.64% 1.02%
Regular Dividend Option 0.64% 1.02%
5. Net Income as a percentage of AAuM3 -24.51% 26.05%
6. Portfolio turnover ratio4 1.10 1.59
7. Total Dividend per unit distributed duringthe year (planwise)
Retail
Regular Dividend Option – 10.00
Corporate
Regular Dividend Option – 10.00
Key Statistics for the year ended March 31, 2009

12
Key Statistics for the year ended March 31, 2009 (Contd...)
HSBC EQUITY FUND
Current PreviousYear ended Year ended
March 31, 2009 March 31, 2008
8. Returns:
a. Last One Year
Scheme
Regular Growth Option (31.9159) 30.0557
Regular Dividend Option (31.9190) 30.0813
Benchmark
BSE 200 (40.9800) 24.1334
b. Since Inception
Scheme
Regular Growth Option 32.9007 50.7427
Regular Dividend Option 32.9640 50.8293
Benchmark
BSE 200 18.7800 35.5069
1 AAuM = Average daily net assets
2 Gross income = amount against (A) in the Revenue Account i.e. Income.
3 Net income = amount against (C) in the Revenue Account i.e. NET REALISED GAINS / (LOSSES)FOR THE YEAR / PERIOD
4 Portfolio Turnover = Lower of sales or purchase divided by the Average AuM for the year / period.

13
HSBC EQUITY FUND
1 Investments:
1.1. It is confirmed that investments of the schemes are registered in the name of the Trustees forthe benefit of the scheme’s unitholders.
1.2. Open Positions of derivatives amount to Rs. (123,697,400) and is 1.13% to Net Assets as ofyear end March 31, 2009. Open Positions of derivatives amount to Rs. 295,319,693 and is2.79% to Net Assets as of year end March 31, 2008.
1.3. Investments in Associates and Group Companies:
(Rupees)
Issuer Instrument Amount Aggregate Amount AggregateType Investments Investments
by all schemes by all schemes
2009 2008
The Hongkong & Fixed deposits – 43,000,000 – 1,654,000,000Shanghai BankingCorporation Ltd.
1.4. Open positions of Securities Borrowed and / or Lent by the scheme as of the Year endedMarch 31, 2009 and March 31, 2008 is NIL.
1.5. NPAs as at years ended March 31, 2009 and March 31, 2008 are NIL.
1.6. Aggregate Unrealised Gain / Loss as at the end of the Financial year 2008-2009 and percentageto net assets.
Company Amount (Rs.) Percentage to Amount (Rs.) Percentage toName Net Assets Net Assets
2009 2008
Equity Shares
– Appreciation 419,474,916 3.8410% 1,520,481,450 14.3871%
– Depreciation 921,216,805 8.4354% 361,734,504 3.4228%
Equity Futures
– Appreciation 2,218,589 0.0203% 10,031,857 0.0949%
– Depreciation 15,363 0.0001% – –
1.7. The aggregate value of investments purchased (excluding accretion of discount ofRs. 14,024,158) and sold during the financial year 2008-2009 is Rs. 20,051,454,038 andRs. 15,984,411,730 respectively being 184.31% and 146.93% of the average daily net assets.
The aggregate value of investments purchased (excluding accretion of discount of Rs. 795,592)and sold during the financial year 2007-2008 is Rs. 16,301,508,784 and Rs. 18,801,319,483respectively being 144.39% and 166.53% of the average daily net assets.
1.8 Non-Traded securities in the portfolio as on March 31, 2009 and March 31, 2008 are Nil.
Notes to Accounts - Annexure ITo the Abridged Balance Sheet and Revenue Account for the year ended March 31, 2009

14
Notes to Accounts - Annexure I (Contd...)To the Abridged Balance Sheet and Revenue Account for the year ended March 31, 2009
2 Disclosure under Regulation 25(8) of the Securities and Exchange Board of India (Mutual Funds)Regulations, 1996 as amended.
Year - 2008-2009HSBC Securities and Capital Markets (India) Private Limited, the Sponsor was paid brokerageaggregating Rs. 1,965,799 on purchase and sale of investments. The Hongkong & ShanghaiBanking Corporation Limited, an associate entity of HSBC Asset Management (India) Private Limitedwas paid collection/bank charges amounting to Rs. 39,751, brokerage amounting toRs. 72,415,284 for procuring unit subscriptions for the Scheme and clearing member charges onderivative transactions Rs. 2,429,235. The brokerage paid was at rates similar to those offered toother brokers / distributors.
Year - 2007-2008HSBC Securities and Capital Markets (India) Private Limited, the Sponsor was paid brokerageaggregating Rs. 1,527,000 on purchase and sale of investments. The Hongkong & ShanghaiBanking Corporation Limited, an associate entity of HSBC Asset Management (India) Private Limitedwas paid collection / bank charges amounting to Rs. 251,447, brokerage amounting toRs. 40,535,389 for procuring unit subscriptions for the Scheme and clearing member charges onderivative transactions Rs. 1,457,655. The brokerage paid was at rates similar to those offered toother brokers / distributors.
Further, The Hongkong and Shanghai Banking Corporation Limited, an associate of the Sponsor,is on the panel of bankers with whom HSBC Mutual Fund places money on fixed deposits andenters into reverse repo transactions from time to time at competitive rates.
3 None of the Investors held more than 25% of the total net assets of the scheme at the yearsended March 31, 2009 and March 31, 2008.
4 Unit Capital movement during the years ended March 31, 2009 and March 31, 2008.
2008-2009
Description Opening Units Subscription Redemption Closing Units Face Value
RegularGrowth Option 47,671,381.108 54,767,475.116 19,616,252.681 82,822,603.543 828,226,035.43
RegularDividend Option 230,018,561.715 146,706,869.491 61,085,405.180 315,640,026.026 3,156,400,260.26
Description 2007-2008
Description Opening Units Subscription Redemption Closing Units Face Value
RegularGrowth Option 51,373,426.727 26,228,151.971 29,930,197.590 47,671,381.108 476,713,811.68
RegularDividend Option 209,212,039.708 149,213,645.273 128,407,123.266 230,018,561.715 2,300,185,617.15
5 Previous year figures have been re-grouped/re-arranged where necessary.
6 No contingent liabilities for the years ended March 31, 2009 and March 31, 2008.
7 Expenses other than Management Fees are inclusive of Service Tax where applicable.
8 The Annual Accounts of the Schemes prepared in accordance with the accounting policies andstandards specified in the Ninth Schedule of The Securities and Exchange Board of India (MutualFunds) Regulations, 1996 has been approved by the Board of Directors of HSBC Asset Management(India) Private Limited and The Board of Trustees of HSBC Mutual Fund at their meeting held onJuly 06, 2009. The audit report attached herewith refers to the said annual accounts. The aforesaidabridged accounts are an extract of the Annual Accounts and are prepared in accordance withSEBI Circular No. IMD/Cir 8/132968/2008 dated July 24, 2008.

15
DISCLAIMERSThe content of this report has been prepared by HSBC Asset Management (India) Private Limited(HSBC) for information purposes only and should not be construed as an offer or solicitation of anoffer for purchase of any of the funds of HSBC Mutual Fund. The information is for general informationonly and does not have regard to specific investment objectives, financial situation and the particularneeds of any specific person who may receive this information. Investments in mutual funds inherentlyinvolve risks and investors should read the relevant documents / information for details and riskfactors and consult their legal, tax and financial advisors before investing. Investors should understandthat statements made herein regarding future prospects may not be realised. Neither this documentnor the units of HSBC Mutual Fund have been registered in any jurisdiction. The distribution of thisdocument in certain jurisdictions may be restricted or totally prohibited and accordingly, personswho come into possession of this document are required to inform themselves about, and to observe,any such restrictions.
Investors may obtain Statement of Additional Information, Combined Scheme Information Documentand Common Key Information Memorandums along with application forms from the office of HSBCMutual Fund, 314, D. N. Road, Fort, Mumbai 400 001. Tel: 022-6666 8819.
Statutory Details:HSBC Mutual Fund has been set up as a trust by HSBC Securities and Capital Markets (India) PrivateLimited (liability restricted to the corpus of Rs. 1 lakh). The Sponsor/associates of the Sponsor/AssetManagement Company (AMC) are not responsible or liable for any loss or shortfall resulting from theoperation of the Schemes. The Trustees of HSBC Mutual Fund have appointed HSBC Asset Management(India) Private Limited as the Investment Manager.
Risk Factors:All investments in mutual funds and securities are subject to market risks and the Net Asset Value(NAV) of the Scheme(s) may go up or down depending on the factors and forces affecting the securitiesmarkets. There can be no assurance that the objectives of the Scheme(s) will be achieved. Pastperformance of the Sponsor, AMC, Mutual Fund or any associates of the Sponsor/AMC does notindicate the future performance of the Scheme(s) of the Mutual Fund. HSBC Equity Fund (HEF) is thenames of the Scheme and does not in any manner indicate the quality of the Scheme or its futureprospects or returns.
Terms of Issue:Units of the Scheme(s) are being offered at NAV based prices, subject to the prevailing loads. TheAMC calculates and publishes NAVs and offers for sale, redemption and switch outs, units of theScheme(s) on all Business Days, at the Applicable NAV for all Schemes (at least once a week, i.e.,every Wednesday and daily during the period of redemption in case of HSCF). HUOF, HSCF & HFTSwill not be open for ongoing subscriptions/ switch ins. HUOF & HSCF would be available for sale onan ongoing basis (after a period of 3 years from the date of allotment). Conversion of HUOF & HSCFto an open-ended scheme will be done only after the balance unamortized amount has been fullyrecovered from the Scheme. Units can be redeemed/switched out on every Business Day at NAVbased prices, subject to prevailing exit loads. In case of HSCF, units can be redeemed / switched outon a monthly basis on the stipulated date i.e. last 3 business days of every month at NAV basedprices, subject to provisions of exit load, if any and recovery of balance proportionate unamortizedNFO expenses.
Load Structure (includes SIP/STP):Entry - 2.25% for investments/switch ins* < Rs. 5 crores, otherwise Nil. For switch transactions fromHCF to HEF (excludes existing & prospective STP transactions) - Nil.
Exit - 1.25% for < Rs. 5 crores, if redeemed/switched out* within 1 year from date of investment,otherwise Nil. For switch transactions from HCF to HEF and subsequent switch transactions from HEFto any other debt or equity scheme (excludes existing & prospective STP transactions) - 2.25% for <Rs. 5 crores, if above switch investments are redeemed / switched out within 1 year from the date ofswitch, otherwise Nil.
*No load in case of switches between equity Schemes of HSBC Mutual Fund.

Consult the nearest investor service centre for details.
The entry/exit load set forth above is subject to change at the discretion of the AMC and suchchanges shall be implemented prospectively.
Mutual Fund investments are subject to market risks. Please read the Statement of AdditionalInformation and Scheme Information Document carefully before investing.
Value Research Online DisclaimerValue Research Fund Ratings: Value Research Fund Ratings are a composite measure of historical risk-adjusted returns. In the case of equity funds this rating is based on the average monthly returns forthe last 3-year and 5-year period. These ratings do not take into account any entry or exit load.
Value Research Fund Ratings are subject to change every month. Current Fund Ratings are as onMarch 31, 2009. 142 open-ended Equity: Diversified Funds were rated. The Rating is based on primarydata provided by respective funds; Value Research does not guarantee the accuracy. Ranking Entity:Value Research Online.
ICRA Online Ranking MethodologyHSBC Monthly Income - Savings Plan has been ranked as a Five Star Fund in the category of 'OpenEnded Marginal Equity' schemes for its 3 year performance till December 31, 2008.
The rank is an outcome of an objective and comparative analysis against various parameters, including:risk adjusted return, fund size, company concentration, portfolio turnover and liquidity. The rankingmethodology did not take into account entry and exit loads imposed by the Fund. There were 27schemes considered in 'Open Ended Marginal Equity' category for the ranking exercise. The rank isneither a certificate of statutory compliance nor any guarantee on the future performance of HSBCMonthly Income - Savings Plan. Ranking Source & Publisher: ICRA Online Limited.
CRISIL Ranking MethodologyThe selection for the awards is based on the CRISIL FundServices' Composite Performance Ranking(CRISIL~CPR) methodology.
The CRISIL Composite Performance Ranking (CRISIL~CPR) is a quarterly ranking of mutual fund schemesbased on two year performance (excepting for the liquid and short term debt categories where a oneyear performance horizon is considered). The methodology is based on global best practices,customized to account for Indian market nuances. Over time, the rankings have become the industrystandard with good acceptance among Investors, Fund Intermediaries, Asset Management Companies,etc. The performance criteria covers not only risk adjusted returns, which are historical, but also theportfolio constitution to make the analysis forward looking.
CRISIL DisclaimerThe overall ranking is assigned to the scheme based on its weighted average score on a range ofparameters: Superior Return Score, Concentration, Liquidity, Asset Quality - Measures the creditquality of the portfolio, Average Maturity and Asset Size. HSBC MIP - Savings was the only schemethat won the CNBC TV18 - CRISIL Mutual Fund of the Year Award in the Category - Monthly IncomePlans - Aggressive. In total 13 schemes were eligible for the award universe. Schemes present in allfour quarterly CRISIL CPRs were considered for the award. The award is based on consistency of thescheme's performance in the four quarterly CRISIL CPR rankings released during the calendar year2008. The individual CRISIL CPR parameter scores averaged for the four quarters were further multipliedby the parameter weights as per the CRISIL CPR methodology to arrive at the final scores. A detailedmethodology of the CRISIL CPR is available at www.crisil.com. Past performance is no guarantee offuture results. Rankings and Award Source: CRISIL Fund Services, CRISIL Ltd. HSBC Monthly Income -Savings Plan has been ranked as a Five Star Fund in the category of 'Open Ended Marginal Equity'schemes for its 3 year performance till December 31, 2008. The rank is an outcome of an objectiveand comparative analysis against various parameters, including: risk adjusted return, fund size,company concentration, portfolio turnover and liquidity. The ranking methodology did not take intoaccount entry and exit loads imposed by the Fund. There were 27 schemes considered in 'OpenEnded Marginal Equity' category for the ranking exercise. The rank is neither a certificate of statutorycompliance nor any guarantee on the future performance of HSBC Monthly Income - Savings Plan.Ranking Source & Publisher: ICRA Online Limited.
16

Issued by HSBC Asset Management (India) Private Limited
HSBC Global Asset Management
HSBC India Opportunities FundAn open-ended flexi-cap equity Scheme
Abridged Annual Report 2008 - 2009

1
Dear Investor,
We thank you for investing with HSBC Mutual Fund. We are pleased to inform you that HSBCMutual Fund has won prestigious awards* this year at various forums in India.
The awards* won by our schemes in India are
� HSBC Equity Fund has been included in the 5 star rated fund category (“Top rated mutualfunds” by Value Research online) in March, 2009.
� Five-stars indicate that a fund is in the top 10 per cent of its category in terms ofhistorical risk-adjusted returns.
� ICRA Mutual Fund Awards 2009
� HSBC MIP - Savings has been ranked a 5-Star Fund by ICRA Online indicating performanceamong the top 10% in the category of 'Open Ended Marginal Equity' for 3 yearperformance ending 31 December, 2008.
� CNBC TV18 - CRISIL Mutual Fund Awards 2008
� HSBC MIP - Savings was awarded the CNBC TV18 - CRISIL Mutual Fund of the YearAward for the year 2008 in the Monthly Income Plans - Aggressive Category.
(Past performance is no guarantee of future results. * Please refer to Ranking methodologyand disclaimer mentioned at the end of the Abridged Annual Report for the year endedMarch 31, 2009).
At the global level, the HSBC Group won several awards at Euromoney's Awards for Excellence2009. The top awards that HSBC won were the Best Global Bank and the Best Global DebtHouse. It was also honoured as the Best Debt House in 8 locations including Asia and the Bestat Risk Management in Asia. (Past performance may or may not be sustained in the future andis no guarantee of future results). We continue to be one of the leading players in emergingmarkets and remain committed to our asset management business in India.
HSBC Asset Management (India) Private Limited including the mutual fund business as well asthe PMS business (including EPFO money deployed till date) manages assets of about Rs. 26280Crores as at 30 June, 2009. The core to our winning strategy is our endeavour to deliverconsistent performance over the medium to long term for our investors in a risk controlledenvironment and aim for consistent wealth creation under varying market conditions. Throughour product range, we aim to be true to our reputation in India of being a provider ofinternational quality investment products and services.
We remain committed to our philosophy of aiming for consistent wealth creation and serviceexcellence and look forward to your continued investments in HSBC Mutual Fund.
Yours sincerely,
VikramaadityaChief Executive OfficerHSBC Asset Management (India) Private Limited

2
SPONSORHSBC Securities and Capital Markets (India) Private LimitedRegd. Office: 52/60, Mahatma Gandhi Road, Fort, Mumbai 400 001.
TRUSTEEBoard of TrusteesOffice: 314, D. N. Road, Fort, Mumbai 400 001.
ASSET MANAGEMENT COMPANYHSBC Asset Management (India) Private LimitedCorp. & Regd. Office: 314, D. N. Road, Fort, Mumbai 400 001.
CUSTODIANJP Morgan Chase BankCorp. & Regd. Office: Mafatlal Centre, 9th Floor, Nariman Point, Mumbai - 400 021.
AUDITORS TO THE SCHEMEPrice WaterhouseChartered Accountants252, Veer Savarkar Marg, Shivaji Park, Dadar (West), Mumbai - 400 028.
LEGAL ADVISORSBharucha & Partners4th Floor, Cecil Court, Mahakavi Bhushan Marg, Colaba, Mumbai - 400 039.
REGISTRAR & TRANSFER AGENTSComputer Age Management Services (P) Ltd. (CAMS)Rayala Towers, Tower I, III Floor, 158 Anna Salai, Chennai - 600 002.
BOARD OF TRUSTEESMr. N. P. Gidwani - Chairman
Dr. Rudolf ApenbrinkMr. Nasser MunjeeMr. Manu TandonMr. Mehli MistriMr. Dilip J. Thakkar
BOARD OF DIRECTORSMs. Naina Lal Kidwai - Chairman
Mr. Ayaz EbrahimMr. S. P. Mustafa**Mr. Vithal PalekarMs. Kishori J. Udeshi*Mr. Vikramaaditya - Chief Executive Officer***
* Ms. Kishori Udeshi has been appointed as a Director with effect from 14 January 2009 andMr. Jagjit Lal Pasricha has resigned as a Director with effect from 19 January 2009.
** Mr. S. P. Mustafa has been appointed as a Director with effect from 2 September 2008 andMr. Nawshir Khurody has resigned as a Director with effect from 1 September 2008
*** Mr. Vikramaaditya has been appointed as the Chief Executive Officer with effect from 16 July 2008and Mr. Sanjay Prakash has resigned as the Chief Executive Officer with effect from 16 July 2008.

3
Trustees' ReportFor the year ended March 31, 2009
The Trustees present the seventh report and the audited financial statements of the Schemesof HSBC Mutual Fund (the "Fund"), for the year ended March 31, 2009.
1. SCHEME PERFORMANCE, FUTURE OUTLOOK AND OPERATIONS OF THE SCHEME
a) Operations and Performance of the Scheme
HSBC India Opportunities Fund (HIOF) - an open-ended flexi-cap Equity Scheme
HIOF is a diversified equity scheme, which seeks long term capital growth through investmentsacross all market capitalisations, including small, mid and large cap stocks. The fund aims to bepredominantly invested in equity and equity related securities. However, it could move asignificant portion of its assets towards fixed income securities if the fund manager becomesnegative on equity markets.
The net assets of the Scheme amounted to Rs. 279.93 crores as at March 31, 2009 as comparedto Rs. 522.72 crores as at March 31, 2008. 92.43% of the net assets were invested in equitiesand 7.57% were invested in debt and money market instruments as at March 31, 2009.
The fund outperformed the benchmark by 600 bps in the past 1 year on higher than normalcash levels and a defensive portfolio. In the Financial Year 2009, the fund completed 5 years ofexistence which is usually a metric tracked by various fund evaluators.
Date of Inception : 24 February, 2004 Compounded Annualized Returns (%)
Schemes (P2P) 1 Year 3 Years 5 Years SinceInception
HSBC India Opportunities Fund - Growth -36.60 -5.10 15.40 14.21
BSE 500 -42.77 -7.94 9.44 9.15
Past performance may or may not be sustained in future. 'Since inception' returns are calculatedon Rs. 10 invested at inception. Calculations are based on Growth NAVs.
b) Market Overview & Outlook
MARKET OVERVIEW
(as furnished by HSBC Asset Management (India) Private Limited)
Equity Market Overview
The financial year ended 31 March, 2009 was a highly eventful one with long standing institutionsdisappearing from the landscape in the whirlwind of the sub-prime crisis and derivative losses. Theyear can be split into three phases - the first from April 2008 till when Lehman Brothers filed forbankruptcy, which saw a blowout commodity rally (crude oil nudged close to USD 144/barrel) andthe sub-prime situation turning progressively worse. The United States (US) Government / FederalReserve bailed out major institutions thought to be critical to the functioning of the financial system.The second phase from September 2008 till January 2009 saw a spate of bankruptcies most notablyLehman Brothers which saw the appearance of an acute level of risk aversion pushing the creditmarkets into a gridlock. This phase also coincided with the fiscal / monetary stimuli by variousgovernments to take the credit crisis head on. Globally, markets stabilized around their October2008 lows and a semblance of normality started re-appearing in financial markets in this period. Thethird phase from February 2009 onwards witnessed a sharp rally as a weakening US Dollar spewedmoney into emerging markets. The sensex fell by 38% during the financial year.

4
For the financial year 2009, the popular indices viz. BSE Sensex and CNX Nifty were down 37.94%and 36.19% respectively. The BSE Midcap (54.01)% and the broader indices like BSE 200 (40.98)%and BSE 500 (42.77)% also reflected the correction across the markets. Within sectoral indices thebest performing indices were BSE FMCG (11.08)% and BSE Oil and Gas (29.58)% while the worstperforming indices were BSE Realty (79.37)%, due to the high leverage on the balance sheets, BSEMetals (58.67)%, due to slowdown in global growth and BSE Consumer Durables (58.14)% and BSECapital goods (53.84%).
In a year that saw sell-off across emerging markets, FIIs were net sellers of the tune USD 10.4 billionin the Indian equity markets while Domestic Institutional Investors (Insurance & Mutual Funds) werebuyers to the tune of USD 13.1 billion. Further, FIIs were net sellers in the derivative markets ashedge funds, and p-notes unwound positions in a rapidly deleveraging world. Thus, sentimentremained negative as few US based investment banks filed for bankruptcy in the midst of the liquidityand credit crisis and safety took precedence over growth.
Debt Market Overview
Two contrarian forces one inflationary and the other deflationary had been in play since 2007: Onthe one hand strong demand from emerging economies were leading commodities higher and fuellinginflation, while on the other the housing led credit crisis in the US was starting to exert a deflationaryforce. The first force was dominant till early July 2008 leading commodity prices to fresh peaks andinflation to multi year highs. Since then, however, the second force took hold with the result thatcommodity prices fell sharply from the top, growth and inflation numbers toppled worldwide, andcentral bankers shifted focus to achieving financial stability and protecting growth.
The financial crisis hit the domestic markets towards September 2008, leading to acute disruption inmoney markets. The Reserve Bank of India (RBI) acted proactively cutting the cash reserve ratio (CRR)by an unprecedented 400 bps between September 2008 and January 2009. Similarly, the reverserepo rate had been cut by 275 bps since October 2008 while the repo rate had been cut by 425 bpsover the same period.
Bond market yields fell in line with the unprecedented monetary easing up till the first week ofJanuary 2009. Thereon, supply pressures on bond markets rose as a result of government fiscalslippages aimed at stimulating the economy. The RBI, in line with similar measures elsewhere in theworld, started buying government securities to lessen the impact on yields from the rise in governmentborrowing. Although this helped market sentiment, it could not prevent a general rise in yieldstowards fiscal close. As a result, the 10 year benchmark sovereign yield closed the fiscal at 7% froma low of sub 5% hit in early January 2009. Money market rates stabilized after the initial mayhem ofSeptember 2008 and October 2008 and liquidity came back to interbank markets.
MARKET OUTLOOK
(as furnished by HSBC Asset Management (India) Private Limited)
Equity Market Outlook
Financial Year (FY) 2008-09 was a year marked by a strong correlation between the Indian marketand global markets with key indices ending deeply in the red on the back of the subprime crisis andderivative led losses across major financial stocks in the United States (US). Even in India, forex lossesran across corporate India though at a smaller magnitude. FY 10 has begun on a better note onaccount of various fundamental and technical factors.
GDP for FY 09 grew at 6.7% against FY 08 levels of 9%. Agriculture posted a below trend growthrate of 1.6% and industry grew by 3.9% (versus 8.1% in FY 08) with services registering a close to9.7% growth. IIP grew by a mere 2.6%. Although order books of engineering / capital goods wererunning at record high levels, there was possibility of delays in execution as funding sources for thedevelopers (equity, ECB, private equity, FCCB) had dried up. A sharp increase in subsidy on account
Trustees' ReportFor the year ended March 31, 2009 (Contd...)

5
of oil, fertilizers and food led to a cut back in discretionary spending. Inflation rose on the back of asurging crude and higher prices of agricultural commodities to top at 12.91% for the week ending 2August, 2008. A slow down in the growth rates in the US / EU and other markets finally tamed thesurge in crude. As growth rates stumbled, governments / monetary authorities the world over triggeredfiscal stimuli / monetary easing to escape recessionary forces. This was followed in India as wellwhich started monetary easing / fiscal stimuli to keep growth rates buoyant.
On the positive side, India continues to do better in relative terms and we expect GDP growth of6-6.5% for FY10. The broad themes that are driving domestic growth viz. capital expenditure,infrastructure building and domestic consumption are still intact. The key concerns at this pointstems from a ballooning fiscal deficit at the consolidated level (Centre & State) with salary revisionfor Central / State Government employees threatening a cut back in discretionary spending. Inflationis likely to remain benign for the first half of FY10 on a favourable base effect but we anticipate it togo back to trend levels of 5-5.5% for the second half of FY10 as this base effect wears off.
On a valuations perspective, the markets are currently trading at a P/E ratio of around 12 timesFY 2010 earnings. This is well below the 10-year average given the extreme risk aversion prevailing inthe markets. However, the underlying growth in the economy and corporate earnings growth (15%in the long term) makes the market attractive from a longer-term view. The short term could seeenhanced volatility arising from various factors. Increase in commodity prices continues to be a riskin the medium term as the US dollar continues to struggle with the ballooning US fiscal situation.
Debt Market Outlook
Excess supply of government bonds, as a result of fiscal slippages to arrest the downward growthmomentum, has been a reality for bond markets since January 2009. However, this is now compoundedwith some fatigue in buying longer duration as economic data is showing signs of recovery,commodities are showing signs of rally and expectations of incremental monetary easing from theRBI are beginning to unwind. However, system liquidity remains surplus and bank deposits continueto grow thereby providing resistance to bond yields from rising sharply.
Given the above factors, we believe that the market would continue to provide tactical opportunitiesalthough the fundamental bias should be for lower duration. Also, any mitigation of bond supplypressure or a new downturn in the ongoing economic recovery may provide space for opportunisticlonger duration plays. On the other hand, if the recovery cycle continues uninterrupted and commodityprices remain firm, central banks may start to worry about withdrawing the current monetary stimulusby sometime early 2010; with consequent impact on bond markets.
2. BRIEF BACKGROUND OF SPONSORS, BOARD OF TRUSTEES AND ASSETMANAGEMENT COMPANY
a) Sponsor
HSBC Mutual Fund is sponsored by HSBC Securities and Capital Markets (India) Private Limited (HSCI).The Sponsor is the Settler of the Mutual Fund Trust. The Sponsor has entrusted a sum of Rs. 1,00,000(Rupees One Lakh only) to the Trustee as the initial contribution towards the corpus of the MutualFund.
HSCI is a member of the HSBC Group, one of the largest banking and financial services organisations,in the world. Headquartered in London, HSBC operates through long-established businesses in fiveregions: Europe, Asia-Pacific, Middle East, America and Africa. Through its global network of 10,000offices in 86 countries and territories, HSBC provides a comprehensive range of financial services topersonal, commercial, corporate, institutional investment and private banking clients.
HSCI offers integrated investment banking services, securities and corporate finance & advisory. HSCIis a member of The Bombay Stock Exchange Limited and National Stock Exchange (capital and derivativemarket segments) and is also a category I merchant banker and underwriter registered with Securitiesand Exchange Board of India.
HSCI holds 100% of the paid-up equity share capital of the AMC.
Trustees' ReportFor the year ended March 31, 2009 (Contd...)

6
b) HSBC Mutual Fund
HSBC Mutual Fund ("the Mutual Fund" or "the Fund") has been constituted as a Trust in accordancewith the provisions of the Indian Trusts Act, 1882 (2 of 1882) vide a Trust Deed dated February 7,2002 with HSBC Securities and Capital Markets (India) Private Limited, as the Sponsor and the Boardof Individual Trustees. The Trustee has entered into an Investment Management Agreement datedFebruary 7, 2002 with HSBC Asset Management (India) Private Limited (the AMC) to function as theInvestment Manager for all the Schemes of the Fund. The Fund was registered with SEBI videregistration number MF/046/02/5 dated May 27, 2002.
The Trust has been formed for the purpose of pooling of capital from the public for collectiveinvestment in securities / any other property for the purpose of providing facilities for participationby persons as beneficiaries in such properties / investments and in the profits / income arising therefrom.
c) Board of Trustees (the Trustees)
The Board of Trustees are the exclusive owner of the Trust Fund and holds the same in trust for thebenefit of the unitholders. The Trustees have been discharging their duties and carrying out theirresponsibilities as provided in the SEBI (Mutual Funds) Regulations, 1996 and the Trust Deed. TheTrustees seeks to ensure that the Fund and the Schemes floated thereunder are managed by theAMC in accordance with the Trust Deed, the said Regulations, directions and guidelines issued bySEBI, the Stock Exchanges, the Association of Mutual Funds of India and other regulatory agencies.
d) Asset Management Company (the AMC)
HSBC Asset Management (India) Private Limited (the Investment Manager or the AMC) is a privatelimited company incorporated under the Companies Act, 1956 on December 12, 2001 having itsRegistered Office at 314, D. N. Road, Fort, Mumbai 400 001. HSBC Asset Management (India) PrivateLimited has been appointed as the Asset Management Company of the HSBC Mutual Fund by theTrustee vide Investment Management Agreement (IMA) dated February 7, 2002 and executed betweenthe Trustees and the AMC. SEBI approved the AMC to act as the Investment Manager of the Fundvide. its letter No. MFD/BC/163/2002 dated May 27, 2002.
The paid-up equity share capital of the AMC is Rs. 9 crores. HSBC Securities and Capital Markets(India) Private Limited holds 100% of the paid-up equity share capital of the AMC.
3. INVESTMENT OBJECTIVE OF THE SCHEMEThe investment objective of the Scheme has been provided above under the heading "SchemePerformance, Future Outlook and Operation of the Scheme" (refer Section 1).
4. SIGNIFICANT ACCOUNTING POLICIESThe accounting policies are in accordance with Securities and Exchange Board of India (Mutual Funds)Regulations, 1996.
5. UNCLAIMED DIVIDENDS & REDEMPTIONSSummary of number of Investors & corresponding amount
Unclaimed Dividends Unclaimed Redemptions
Scheme Amount No. of Amount No. of(Rs.) Investors (Rs.) Investors
HSBC India Opportunities Fund 873,838.13 217 301,902.87 9
6. INVESTOR SERVICESDuring the year, the number of official points of acceptance of transactions increased significantly toabout 182 locations. In addition to the offices of the transfer agency, the company has InvestorService Centres in 14 locations at its own offices - namely Mumbai, New Delhi, Kolkata, Chennai,
Trustees' ReportFor the year ended March 31, 2009 (Contd...)

7
Bangalore, Hyderabad, Pune, Ahmedabad, Indore, Chandigarh, Kochi, Coimbatore, Lucknow andVadodara. With a view to enhancing customer convenience, the Asset Management Company hasextended the facility of crediting investor bank accounts directly by way of NEFT / RTGS (for credit ofredemption and dividend proceeds). The AMC endeavours to despatch dividend proceeds within 5working days from the Record Date in all Schemes. The internal standards on redemption payoutshave been consistently met, with very few exceptions. The number of locations for the ECS AutoDebit facility for investments through Systematic Investment Plan also increased to about 74 byMarch 2009.
On the distribution front, the number of empanelled distributors increased from 7859 as on 31March, 2008 to 8632 as on 31 March, 2009. During the year, the Asset Management Companyinitiated tie-ups for online distribution of the Mutual Fund's schemes with several channel partnerstaking the total number of such tie-ups to 24 (Angel Capital & Department Market Ltd., Bajaj CapitalLimited, Bonanza Portfolio Limited, Citibank N.A., Citigroup Wealth Advisors India Private Limited,HDFC Bank Limited, Hongkong & Shanghai Banking Corporation Limited, HSBC Corporate InvestmentSolution Services, ICICI Securities Limited, India Infoline Limited, Karvy Stock Broking Limited, KotakMahindra Bank Limited, Kotak Securities Limited, Motilal Oswal Securities Limited, NJ India InvestPrivate Limited, Reliance Securities Limited, RR Investors Capital Services Private Limited, SBICAPSecurities Limited, Sharekhan Limited, SMC Global Securities Limited, Standard Chartered - STCICapital Markets Ltd., Tom Distribution Services Limited, Yes Bank Limited).
Call centre operations have been extended to cover the entire country. The Asset ManagementCompany has outsourced certain back office services including call centre services to HSBC Operationsand Processing Enterprise (India) Private Limited (HOPE).
7. STATUTORY DETAILSa) The Sponsors are not responsible or liable for any loss resulting from the operation of the Schemes
of the Fund beyond initial contribution of Rs. 1 lakh for setting up the Fund.
b) The price and redemption value of the units, and income from them, can go up as well as downwith fluctuations in the market value of its underlying investments.
c) Full / Abridged Annual Report shall be disclosed on the website at www.assetmanagement.hsbc.com/inand shall be available for inspection at the Head Office of the mutual fund. Present and prospectiveunit holder can obtain copy of the trust deed, the Full / Abridged Annual Report of the Scheme(s),the Annual Report of HSBC Asset Management (India) Private Limited and the text of the relevantScheme(s) at a price.
8. ACKNOWLEDGEMENTSThe Trustees wish to thank the Unitholders of the Schemes for their support throughout the year andalso thank the Government of India, the Securities and Exchange Board of India (SEBI), the ReserveBank of India (RBI) and the Association of Mutual Funds in India (AMFI) for the guidance provided bythem. The Trustees also appreciate the service provided by the Registrar and Transfer Agent, FundAccountant, Custodian, Bankers, Distributors and Brokers. The guidance and services provided bythe Auditors and advocates and the ebullience, sincerity and dedication of the employees of HSBCAsset Management (India) Private Limited is also appreciated.
The Trustees look forward to the continued support of everyone.
For and on behalf of the Board of Trustees of HSBC Mutual Fund
Dilip J. Thakkar
Trustee
MUMBAIJuly 6, 2009
Trustees' ReportFor the year ended March 31, 2009 (Contd...)

8
To the Board of Trustees of
HSBC MUTUAL FUND
1. We have audited the Balance Sheet of HSBC Mutual Fund - HSBC India Opportunities Fund ("TheScheme") as at March 31, 2009, the related Revenue Account for the year ended on that dateannexed thereto, and the Cash Flow Statement for the year ended on that date which we havesigned under reference to this report. These financial statements are the responsibility of theBoard of Trustees of HSBC Mutual Fund and the Management of HSBC Asset Management (India)Private Limited (the "Management"). Our responsibility is to express an opinion on these financialstatements based on our audit.
2. We have conducted our audit in accordance with auditing standards generally accepted in India.Those standards require that we plan and perform the audit to obtain reasonable assuranceabout whether the financial statements are free of material misstatement. An audit includesexamining, on a test basis, evidence supporting the amounts and disclosures in the financialstatements. Our procedures included confirmation of securities owned and unit capital balancesas at March 31, 2009 by correspondence with the custodian/others and registrar and transferagents respectively. An audit also includes assessing the accounting principles used and significantestimates made by the Management as well as evaluating the overall financial statementpresentation. We believe that our audit provides a reasonable basis for our opinion.
3. We have obtained all the information and explanations which to the best of our knowledge andbelief were necessary for the purpose of our audit. The Balance Sheet, the Revenue Account andthe Cash Flow Statement referred to above are in agreement with the books of account of theScheme.
4. In our opinion and to the best of our information and according to the explanations given to us,
(i) The Balance Sheet, the Revenue Account and the Cash Flow Statement together with thenotes thereon give the information required by the Securities and Exchange Board of India(Mutual Funds) Regulations, 1996 and amendments thereto, as applicable, and also giverespectively, a true and fair view of the state of affairs of HSBC Mutual Fund - HSBC IndiaOpportunities Fund as at March 31, 2009, its net deficit and its cash flows for the year endedon that date.
(ii) The Balance Sheet as at March 31, 2009 and the Revenue Account for the year ended on thatdate, together with the notes thereon have been prepared in all material respects in accordancewith the accounting policies and standards specified in the Ninth Schedule of the Securitiesand Exchange Board of India (Mutual Funds) Regulations, 1996 and amendments thereto asapplicable.
Partha GhoshPartnerMembership No. F / 55913
For and on behalf ofPRICE WATERHOUSEChartered Accountants
Place : MumbaiDate : July 6, 2009
Auditors' Report

9
Rs. in Lakhs
HSBC INDIA OPPORTUNITIES FUND
As at As atMarch 31, 2009 March 31, 2008
LIABILITIES1 Unit Capital 22,075.58 26,248.742 Reserves & Surplus2.1 Unit Premium Reserves (4,967.16) (4,402.00)2.2 Unrealised Appreciation Reserve 12.12 4,824.752.3 Other Reserves 10,872.37 25,566.11
3 Loans & Borrowings – –
4 Current Liabilities & Provisions4.1 Provision for doubtful Income / Deposits – –4.2 Other Current Liabilities & Provisions 500.22 773.45
TOTAL 28,493.13 53,011.05
ASSETS1 Investments1.1. Listed Securities:1.1.1 Equity Shares 23,373.85 46,770.621.1.2 Preference Shares – –1.1.3 Equity Linked Debentures – –1.1.4 Other Debentures & Bonds – –1.1.5 Securitised Debt securities – –1.2 Securities Awaited Listing:1.2.1 Equity Shares – –1.2.2 Preference Shares – –1.2.3 Equity Linked Debentures – –1.2.4 Other Debentures & Bonds – –1.2.5 Securitised Debt securities – –1.3 Unlisted Securities:1.3.1 Equity Shares – –1.3.2 Preference Shares – –1.3.3 Equity Linked Debentures – –1.3.4 Other Debentures & Bonds – –1.3.5 Securitised Debt securities – –1.4 Government Securities – –1.5 Treasury Bills – –1.6 Commercial Paper – –1.7 Certificate of Deposits – –1.8 Bill Rediscounting – –1.9 Units of Domestic Mutual Fund – –1.10 Foreign Securities – –
Total Investments 23,373.85 46,770.62
2 Deposits 2,661.52 1,461.52
3 Other Current Assets3.1 Cash & Bank Balance 8.76 51.573.2 CBLO / Reverse Repo Lending 1,023.25 3,303.593.3 Others 1,425.75 1,423.74
4 Deferred Revenue Expenditure – –(to the extent not written off)
TOTAL 28,493.13 53,011.05
Notes to Accounts - Annexure I
Abridged Balance Sheet as at March 31, 2009

10
Rs. in Lakhs
HSBC INDIA OPPORTUNITIES FUND
Current PreviousYear ended Year ended
March 31, 2009 March 31, 2008
1 INCOME1.1 Dividend 320.06 270.561.2 Interest 367.98 299.911.3 Realised Gain / (Loss) on Foreign Exchange Transactions – –1.4 Realised Gains / (Losses) on Interscheme sale
of investments – –1.5 Realised Gains / (Losses) on External sale /
redemption of investments (11,630.40) 17,909.831.6 Realised Gains / (Losses) on Derivative Transactions 1,184.49 59.291.7 Other Income – –
(A) (9,757.87) 18,539.59
2 EXPENSES2.1 Management fees 407.54 713.212.2 Service tax on Management fees ** – –2.3 Transfer agents fees and expenses 76.41 113.372.4 Custodian fees 24.90 37.442.5 Trusteeship fees 0.16 0.362.6 Commission to Agents * – –2.7 Marketing & Distribution expenses 277.19 460.742.8 Audit fees 5.00 6.502.9 Other operating expenses 86.25 168.00
(B) 877.45 1,499.62
3 NET REALISED GAINS / (LOSSES)FOR THE YEAR / PERIOD (A -B = C) (10,635.32) 17,039.97
4 Change in Unrealised Depreciationin value of investments (D) 1,967.69 –
5 NET GAINS / (LOSSES) FOR THEYEAR / PERIOD [E = (C-D)] (12,603.01) 17,039.97
6 Change in unrealised appreciationin the value of investments (F) (4,812.63) (4,409.29)
7 NET SURPLUS / (DEFICIT) FORTHE YEAR / PERIOD (E + F = G) (17,415.64) 12,630.68
7.1 Add: Balance transfer from Unrealised Appreciation Reserve 4,812.63 4,409.297.2 Less: Balance transfer to Unrealised Appreciation Reserve – –7.3 Add / (Less): Equalisation (2,090.75) (5,422.07)7.4 Transfer from Reserve Fund – 1,252.057.5 Transfer from Unit Premium Reserve – –
8 TOTAL (14,693.76) 12,869.95
9 Dividend Appropriation9.1 Income Distributed during the year / period (0.02) 5,324.389.2 Tax on income distributed during the year / period – –
10 Retained Surplus / (Deficit) carried forwardto Balance Sheet (14,693.74) 7,545.57
Notes to Accounts - Annexure I
* Commission to Agents is included in Marketing & Distribution Expenses.** Service Tax on Management Fees is included in Other Operating Expenses.
Abridged Revenue Account For the year endedMarch 31, 2009

11
HSBC INDIA OPPORTUNITIES FUND
Current PreviousYear ended Year ended
March 31, 2009 March 31, 2008
1. NAV per unit (Rs.):
Open
Regular Growth Option 31.0700 26.7422
Regular Dividend Option 16.4584 16.2416
High
Regular Growth Option 34.4126 46.2473
Regular Dividend Option 18.2294 26.0871
Low
Regular Growth Option 17.4783 25.7935
Regular Dividend Option 9.2599 15.4065
End
Regular Growth Option 19.6995 31.0700
Regular Dividend Option 10.4365 16.4584
2. Closing Assets Under Management (Rs. in Lakhs)
End 27,993 52,238
Average (AAuM)1 38,254 68,891
3. Gross income as % of AAuM2 -25.51% 26.91%
4. Expense Ratio:
a. Total Expense as % of AAuM (planwise)
Regular Growth Option 2.29% 2.18%
Regular Dividend Option 2.29% 2.18%
b. Management Fee as % of AAuM (planwise)
Regular Growth Option 1.07% 1.04%
Regular Dividend Option 1.07% 1.04%
5. Net Income as a percentage of AAuM3 -27.80% 24.73%
6. Portfolio turnover ratio4 1.15 1.82
7. Total Dividend per unit distributed duringthe year / period (planwise)
Retail
Dividend – 2.5000
Corporate
Dividend – 2.5000
Key Statistics for the year ended March 31, 2009

12
8. Returns:
a. Last One Year
Scheme
Regular Growth Option (36.5964) 16.0872
Regular Dividend Option (36.5886) 16.0744
Benchmark
BSE 500 (42.7700) 24.2540
b. Since Inception
Scheme
Regular Growth Option 14.2144 31.8388
Regular Dividend Option 14.2237 31.8482
Benchmark
BSE 500 9.1500 27.7560
1 AAuM = Average daily net assets
2 Gross income = amount against (A) in the Revenue Account i.e. Income.
3 Net income = amount against (C) in the Revenue Account i.e. NET REALISED GAINS / (LOSSES)FOR THE YEAR / PERIOD
4 Portfolio Turnover = Lower of sales or purchase divided by the Average AuM for the year / period.
Key Statistics for the year ended March 31, 2009 (Contd...)
HSBC INDIA OPPORTUNITIES FUND
Current PreviousYear ended Year ended
March 31, 2009 March 31, 2008

13
HSBC INDIA OPPORTUNITIES FUND
1 Investments:
1.1 It is confirmed that investments of the schemes are registered in the name of the Trustees forthe benefit of the scheme’s unitholders.
1.2 Open Positions of derivatives as of March 31, 2009 is Rs. 61,203,450 and is 2.19% to thenet assets. Open Positions of derivatives as of March 31, 2008 is Rs. 124,123,705 and is2.38% to the net assets.
1.3 Investments in Associates and Group Companies(Rupees)
Issuer Instrument Amount Aggregate Amount AggregateType Investments Investments
by all schemes by all schemes
2009 2008
The Hongkong & Fixed deposits – 43,000,000 – 1,654,000,000Shanghai BankingCorporation Ltd.
1.4 Open position of Securities Borrowed and / or Lent by the scheme as of financial years ended2009 and 2008 are NIL.
1.5 The NPAs as on March 31, 2009 and March 31, 2008 are NIL.
1.6 Aggregate Unrealised Gain / Loss as at the end of the Financial years March 31, 2009 andMarch 31, 2008 are as under :
Security Amount (Rs.) Percentage to Amount (Rs.) Percentage toCategory Net Assets Net Assets
2009 2008
Equity Shares
– Appreciation 216,543,449 7.7357% 1,007,175,391 19.2807%
– Depreciation 413,312,313 14.7649% 524,910,566 10.0485%
Equity Futures
- Appreciation 2,252,115 0.0805% 2,232,978 0.0427%
- Depreciation 1,040,116 0.0372% 2,023,222 0.0387%
1.7 The aggregate value of investments purchased and sold during the financial year (excludingaccretion of discount of Rs. 2,875,943) is Rs. 4,802,419,100 and Rs. 5,302,898,939respectively being 125.54% and 138.62% of the average daily net assets.
The aggregate value of investment purchased and sold during the financial year 2007 - 2008is Rs. 9,990,491,870 and Rs. 12,789,336,320 respectively being 145.02% and 185.65% ofthe average daily net assets.
1.8 Non-Traded securities in the portfolio:Aggregate Value of Equity, Debt & Money Market Instruments and percentage to net assetsare as under
Security Amount (Rs.) Percentage to Amount (Rs.) Percentage toCategory Net Assets Net Assets
2009 2008
Equities – – 13,500,000 0.2584%
Money MarketInstruments – – – –
Notes to Accounts - Annexure ITo the Abridged Balance Sheet and Revenue Account for the year ended March 31, 2009

14
Notes to Accounts - Annexure I (Contd...)To the Abridged Balance Sheet and Revenue Account for the year ended March 31, 2009
2 Disclosure under Regulation 25(8) of the Securities and Exchange Board of India (Mutual Funds)Regulations, 1996 As Amended for the year ended March 31, 2009 is as under
During the year, HSBC Securities and Capital Markets (India) Private Limited, the Sponsor waspaid brokerage aggregating Rs. 447,580 on purchase and sale of investments. The Hongkongand Shanghai Banking Corporation Limited, an associate entity of HSBC Asset Management (India)Private Limited was paid collection / bank charges Rs. 22,424, brokerage amounting toRs. 12,053,491 for procuring unit subscriptions for the Scheme and clearing member charges onderivative transactions Rs. 1,179,175. The brokerage paid was at rates similar to those offered toother brokers / distributors.
HSBC Securities and Capital Markets (India) Private Limited, the Sponsor was paid brokerageaggregating Rs. 1,353,000 on purchase and sale of investments. The Hongkong and ShanghaiBanking Corporation Limited, an associate entity of HSBC Asset Management (India) Private Limitedwas paid collection / bank charges Rs. 115,527, brokerage amounting to Rs. 37,848,121 forprocuring unit subscriptions for the Scheme and clearing member charges on derivative transactionsRs. 1,363,292. The brokerage paid was at rates similar to those offered to other brokers /distributors.
Further, The Hongkong and Shanghai Banking Corporation Limited, an associate of the Sponsor,is on the panel of bankers with whom HSBC Mutual Fund places money on fixed deposits andenters into reverse repo transactions from time to time at competitive rates.
3 No investors held more than 25% of the Net Assets of the scheme for 2008 and 2009.
4 Unit Capital movement during the years ended March 31, 2009 and March 31, 2008.
2008-2009
Description Opening Units Subscription Redemption Closing Units Face Value
Growth 61,844,387.233 8,005,235.991 16,371,414.017 53,478,209.207 534,782,092.07
Dividend 200,642,987.346 17,255,087.456 50,620,530.822 167,277,543.980 1,672,775,440.80
2007-2008
Description Opening Units Subscription Redemption Closing Units Face Value
Growth 76,571,429.053 33,619,970.910 48,347,012.730 61,844,387.233 618,443,872.33
Dividend 273,556,057.212 72,704,190.973 145,617,260.839 200,642,987.346 2,006,429,873.46
5 Previous year figures have been re-grouped/re-arranged where appropriate.
6 No contingent liabilities for the years ended March 31, 2009 and March 31, 2008.
7 Expenses other than Management Fees are inclusive of Service Tax where applicable.
8 The Annual Accounts of the Schemes prepared in accordance with the accounting policies andstandards specified in the Ninth Schedule of The Securities and Exchange Board of India (MutualFunds) Regulations, 1996 has been approved by the Board of Directors of HSBC Asset Management(India) Private Limited and The Board of Trustees of HSBC Mutual Fund at their meeting held onJuly 06, 2009. The audit report attached herewith refers to the said annual accounts. The aforesaidabridged accounts are an extract of the Annual Accounts and are prepared in accordance withSEBI Circular No. IMD/Cir 8/132968/2008 dated July 24, 2008.

15
DISCLAIMERSThe content of this report has been prepared by HSBC Asset Management (India) Private Limited(HSBC) for information purposes only and should not be construed as an offer or solicitation of anoffer for purchase of any of the funds of HSBC Mutual Fund. The information is for general informationonly and does not have regard to specific investment objectives, financial situation and the particularneeds of any specific person who may receive this information. Investments in mutual funds inherentlyinvolve risks and investors should read the relevant documents / information for details and riskfactors and consult their legal, tax and financial advisors before investing. Investors should understandthat statements made herein regarding future prospects may not be realised. Neither this documentnor the units of HSBC Mutual Fund have been registered in any jurisdiction. The distribution of thisdocument in certain jurisdictions may be restricted or totally prohibited and accordingly, personswho come into possession of this document are required to inform themselves about, and to observe,any such restrictions.
Investors may obtain Statement of Additional Information, Combined Scheme Information Documentand Common Key Information Memorandums along with application forms from the office of HSBCMutual Fund, 314, D. N. Road, Fort, Mumbai 400 001. Tel: 022-6666 8819.
Statutory Details:HSBC Mutual Fund has been set up as a trust by HSBC Securities and Capital Markets (India) PrivateLimited (liability restricted to the corpus of Rs. 1 lakh). The Sponsor/associates of the Sponsor/AssetManagement Company (AMC) are not responsible or liable for any loss or shortfall resulting from theoperation of the Schemes. The Trustees of HSBC Mutual Fund have appointed HSBC Asset Management(India) Private Limited as the Investment Manager.
Risk Factors:All investments in mutual funds and securities are subject to market risks and the Net Asset Value(NAV) of the Scheme(s) may go up or down depending on the factors and forces affecting the securitiesmarkets. There can be no assurance that the objectives of the Scheme(s) will be achieved. Pastperformance of the Sponsor, AMC, Mutual Fund or any associates of the Sponsor/AMC does notindicate the future performance of the Scheme(s) of the Mutual Fund. HSBC India OpportunitiesFund (HIOF) is the names of the Scheme and does not in any manner indicate the quality of theScheme or its future prospects or returns.
Terms of Issue:Units of the Scheme(s) are being offered at NAV based prices, subject to the prevailing loads. TheAMC calculates and publishes NAVs and offers for sale, redemption and switch outs, units of theScheme(s) on all Business Days, at the Applicable NAV for all Schemes (at least once a week, i.e.,every Wednesday and daily during the period of redemption in case of HSCF). HUOF, HSCF & HFTSwill not be open for ongoing subscriptions/ switch ins. HUOF & HSCF would be available for sale onan ongoing basis (after a period of 3 years from the date of allotment). Conversion of HUOF & HSCFto an open-ended scheme will be done only after the balance unamortized amount has been fullyrecovered from the Scheme. Units can be redeemed/switched out on every Business Day at NAVbased prices, subject to prevailing exit loads. In case of HSCF, units can be redeemed / switched outon a monthly basis on the stipulated date i.e. last 3 business days of every month at NAV basedprices, subject to provisions of exit load, if any and recovery of balance proportionate unamortizedNFO expenses.
Load Structure (includes SIP/STP):Entry - 2.25% for investments /switch ins* < Rs. 5 crores, otherwise Nil.
Exit - 1% for < Rs. 5 crores, if redeemed/switched out* within 1 year from date of investment,otherwise Nil.
*No load in case of switches between equity Schemes of HSBC Mutual Fund.
Consult the nearest investor service centre for details.
The entry/exit load set forth above is subject to change at the discretion of the AMC and suchchanges shall be implemented prospectively.
Mutual Fund investments are subject to market risks. Please read the Statement of AdditionalInformation and Scheme Information Document carefully before investing.

16
Value Research Online DisclaimerValue Research Fund Ratings: Value Research Fund Ratings are a composite measure of historical risk-adjusted returns. In the case of equity funds this rating is based on the average monthly returns forthe last 3-year and 5-year period. These ratings do not take into account any entry or exit load.
Value Research Fund Ratings are subject to change every month. Current Fund Ratings are as onMarch 31, 2009. 142 open-ended Equity: Diversified Funds were rated. The Rating is based on primarydata provided by respective funds; Value Research does not guarantee the accuracy. Ranking Entity:Value Research Online.
ICRA Online Ranking MethodologyHSBC Monthly Income - Savings Plan has been ranked as a Five Star Fund in the category of 'OpenEnded Marginal Equity' schemes for its 3 year performance till December 31, 2008.
The rank is an outcome of an objective and comparative analysis against various parameters, including:risk adjusted return, fund size, company concentration, portfolio turnover and liquidity. The rankingmethodology did not take into account entry and exit loads imposed by the Fund. There were 27schemes considered in 'Open Ended Marginal Equity' category for the ranking exercise. The rank isneither a certificate of statutory compliance nor any guarantee on the future performance of HSBCMonthly Income - Savings Plan. Ranking Source & Publisher: ICRA Online Limited.
CRISIL Ranking MethodologyThe selection for the awards is based on the CRISIL FundServices' Composite Performance Ranking(CRISIL~CPR) methodology.
The CRISIL Composite Performance Ranking (CRISIL~CPR) is a quarterly ranking of mutual fund schemesbased on two year performance (excepting for the liquid and short term debt categories where a oneyear performance horizon is considered). The methodology is based on global best practices,customized to account for Indian market nuances. Over time, the rankings have become the industrystandard with good acceptance among Investors, Fund Intermediaries, Asset Management Companies,etc. The performance criteria covers not only risk adjusted returns, which are historical, but also theportfolio constitution to make the analysis forward looking.
CRISIL DisclaimerThe overall ranking is assigned to the scheme based on its weighted average score on a range ofparameters: Superior Return Score, Concentration, Liquidity, Asset Quality - Measures the creditquality of the portfolio, Average Maturity and Asset Size. HSBC MIP - Savings was the only schemethat won the CNBC TV18 - CRISIL Mutual Fund of the Year Award in the Category - Monthly IncomePlans - Aggressive. In total 13 schemes were eligible for the award universe. Schemes present in allfour quarterly CRISIL CPRs were considered for the award. The award is based on consistency of thescheme's performance in the four quarterly CRISIL CPR rankings released during the calendar year2008. The individual CRISIL CPR parameter scores averaged for the four quarters were further multipliedby the parameter weights as per the CRISIL CPR methodology to arrive at the final scores. A detailedmethodology of the CRISIL CPR is available at www.crisil.com. Past performance is no guarantee offuture results. Rankings and Award Source: CRISIL Fund Services, CRISIL Ltd. HSBC Monthly Income -Savings Plan has been ranked as a Five Star Fund in the category of 'Open Ended Marginal Equity'schemes for its 3 year performance till December 31, 2008. The rank is an outcome of an objectiveand comparative analysis against various parameters, including: risk adjusted return, fund size,company concentration, portfolio turnover and liquidity. The ranking methodology did not take intoaccount entry and exit loads imposed by the Fund. There were 27 schemes considered in 'OpenEnded Marginal Equity' category for the ranking exercise. The rank is neither a certificate of statutorycompliance nor any guarantee on the future performance of HSBC Monthly Income - Savings Plan.Ranking Source & Publisher: ICRA Online Limited.

Issued by HSBC Asset Management (India) Private Limited
HSBC Midcap Equity FundAn open-ended diversified equity Scheme
Abridged Annual Report 2008 - 2009
HSBC Global Asset Management

1
Dear Investor,
We thank you for investing with HSBC Mutual Fund. We are pleased to inform you that HSBCMutual Fund has won prestigious awards* this year at various forums in India.
The awards* won by our schemes in India are
� HSBC Equity Fund has been included in the 5 star rated fund category (“Top rated mutualfunds” by Value Research online) in March, 2009.
� Five-stars indicate that a fund is in the top 10 per cent of its category in terms ofhistorical risk-adjusted returns.
� ICRA Mutual Fund Awards 2009
� HSBC MIP - Savings has been ranked a 5-Star Fund by ICRA Online indicating performanceamong the top 10% in the category of 'Open Ended Marginal Equity' for 3 yearperformance ending 31 December, 2008.
� CNBC TV18 - CRISIL Mutual Fund Awards 2008
� HSBC MIP - Savings was awarded the CNBC TV18 - CRISIL Mutual Fund of the YearAward for the year 2008 in the Monthly Income Plans - Aggressive Category.
(Past performance is no guarantee of future results. * Please refer to Ranking methodologyand disclaimer mentioned at the end of the Abridged Annual Report for the year endedMarch 31, 2009).
At the global level, the HSBC Group won several awards at Euromoney's Awards for Excellence2009. The top awards that HSBC won were the Best Global Bank and the Best Global DebtHouse. It was also honoured as the Best Debt House in 8 locations including Asia and the Bestat Risk Management in Asia. (Past performance may or may not be sustained in the future andis no guarantee of future results). We continue to be one of the leading players in emergingmarkets and remain committed to our asset management business in India.
HSBC Asset Management (India) Private Limited including the mutual fund business as well asthe PMS business (including EPFO money deployed till date) manages assets of about Rs. 26280Crores as at 30 June, 2009. The core to our winning strategy is our endeavour to deliverconsistent performance over the medium to long term for our investors in a risk controlledenvironment and aim for consistent wealth creation under varying market conditions. Throughour product range, we aim to be true to our reputation in India of being a provider ofinternational quality investment products and services.
We remain committed to our philosophy of aiming for consistent wealth creation and serviceexcellence and look forward to your continued investments in HSBC Mutual Fund.
Yours sincerely,
VikramaadityaChief Executive OfficerHSBC Asset Management (India) Private Limited

2
SPONSORHSBC Securities and Capital Markets (India) Private LimitedRegd. Office: 52/60, Mahatma Gandhi Road, Fort, Mumbai 400 001.
TRUSTEEBoard of TrusteesOffice: 314, D. N. Road, Fort, Mumbai 400 001.
ASSET MANAGEMENT COMPANYHSBC Asset Management (India) Private LimitedCorp. & Regd. Office: 314, D. N. Road, Fort, Mumbai 400 001.
CUSTODIANJP Morgan Chase BankCorp. & Regd. Office: Mafatlal Centre, 9th Floor, Nariman Point, Mumbai - 400 021.
AUDITORS TO THE SCHEMEPrice WaterhouseChartered Accountants252, Veer Savarkar Marg, Shivaji Park, Dadar (West), Mumbai - 400 028.
LEGAL ADVISORSBharucha & Partners4th Floor, Cecil Court, Mahakavi Bhushan Marg, Colaba, Mumbai - 400 039.
REGISTRAR & TRANSFER AGENTSComputer Age Management Services (P) Ltd. (CAMS)Rayala Towers, Tower I, III Floor, 158 Anna Salai, Chennai - 600 002.
BOARD OF TRUSTEESMr. N. P. Gidwani - Chairman
Dr. Rudolf ApenbrinkMr. Nasser MunjeeMr. Manu TandonMr. Mehli MistriMr. Dilip J. Thakkar
BOARD OF DIRECTORSMs. Naina Lal Kidwai - Chairman
Mr. Ayaz EbrahimMr. S. P. Mustafa**Mr. Vithal PalekarMs. Kishori J. Udeshi*Mr. Vikramaaditya - Chief Executive Officer***
* Ms. Kishori Udeshi has been appointed as a Director with effect from 14 January 2009 andMr. Jagjit Lal Pasricha has resigned as a Director with effect from 19 January 2009.
** Mr. S. P. Mustafa has been appointed as a Director with effect from 2 September 2008 andMr. Nawshir Khurody has resigned as a Director with effect from 1 September 2008.
*** Mr. Vikramaaditya has been appointed as the Chief Executive Officer with effect from 16 July 2008and Mr. Sanjay Prakash has resigned as the Chief Executive Officer with effect from 16 July 2008.

3
Trustees' ReportFor the year ended March 31, 2009
The Trustees present the seventh report and the audited financial statements of the Schemesof HSBC Mutual Fund (the "Fund"), for the year ended March 31, 2009.
1. SCHEME PERFORMANCE, FUTURE OUTLOOK AND OPERATIONS OF THE SCHEME
a) Operations and Performance of the Scheme
HSBC Midcap Equity Fund (HMEF) - an open-ended diversified Equity Scheme
To generate long term capital growth from an actively managed portfolio of equity and equityrelated securities primarily being midcap stocks. However, it could move a portion of its assetstowards fixed income securities if the fund manager becomes negative on the Indian equitymarkets.
The net assets of the Scheme amounted to Rs. 93.67 crores as at March 31, 2009 as comparedto Rs. 235.43 crores as at March 31, 2008. 90.74% of the net assets were invested in equitiesand 9.26% were invested in debt and money market instruments as at March 31, 2009.
The fund outperformed its benchmark (BSE MIDCAP index) by 300 bps over the year. This wasachieved by having higher than usual cash levels and a more defensive portfolio.
Date of Inception : 19 May, 2005 Compounded Annualized Returns (%)
Schemes (P2P) 1 Year 3 Years SinceInception
HSBC Midcap Equity Fund - Growth -51.01 -18.43 0.28
BSE MID CAP -54.01 -17.92 -2.40
Past performance may or may not be sustained in future. 'Since inception' returns are calculatedon Rs. 10 invested at inception. Calculations are based on Growth NAVs.
b) Market Overview & Outlook
MARKET OVERVIEW
(as furnished by HSBC Asset Management (India) Private Limited)
Equity Market Overview
The financial year ended 31 March, 2009 was a highly eventful one with long standing institutionsdisappearing from the landscape in the whirlwind of the sub-prime crisis and derivative losses. Theyear can be split into three phases - the first from April 2008 till when Lehman Brothers filed forbankruptcy, which saw a blowout commodity rally (crude oil nudged close to USD 144/barrel) andthe sub-prime situation turning progressively worse. The United States (US) Government / FederalReserve bailed out major institutions thought to be critical to the functioning of the financial system.The second phase from September 2008 till January 2009 saw a spate of bankruptcies most notablyLehman Brothers which saw the appearance of an acute level of risk aversion pushing the creditmarkets into a gridlock. This phase also coincided with the fiscal / monetary stimuli by variousgovernments to take the credit crisis head on. Globally, markets stabilized around their October2008 lows and a semblance of normality started re-appearing in financial markets in this period. Thethird phase from February 2009 onwards witnessed a sharp rally as a weakening US Dollar spewedmoney into emerging markets. The sensex fell by 38% during the financial year.
For the financial year 2009, the popular indices viz. BSE Sensex and CNX Nifty were down 37.94%and 36.19% respectively. The BSE Midcap (54.01)% and the broader indices like BSE 200 (40.98)%and BSE 500 (42.77)% also reflected the correction across the markets. Within sectoral indices thebest performing indices were BSE FMCG (11.08)% and BSE Oil and Gas (29.58)% while the worst

4
performing indices were BSE Realty (79.37)%, due to the high leverage on the balance sheets, BSEMetals (58.67)%, due to slowdown in global growth and BSE Consumer Durables (58.14)% and BSECapital goods (53.84%).
In a year that saw sell-off across emerging markets, FIIs were net sellers of the tune USD 10.4 billionin the Indian equity markets while Domestic Institutional Investors (Insurance & Mutual Funds) werebuyers to the tune of USD 13.1 billion. Further, FIIs were net sellers in the derivative markets ashedge funds, and p-notes unwound positions in a rapidly deleveraging world. Thus, sentimentremained negative as few US based investment banks filed for bankruptcy in the midst of the liquidityand credit crisis and safety took precedence over growth.
Debt Market Overview
Two contrarian forces one inflationary and the other deflationary had been in play since 2007: Onthe one hand strong demand from emerging economies were leading commodities higher and fuellinginflation, while on the other the housing led credit crisis in the US was starting to exert a deflationaryforce. The first force was dominant till early July 2008 leading commodity prices to fresh peaks andinflation to multi year highs. Since then, however, the second force took hold with the result thatcommodity prices fell sharply from the top, growth and inflation numbers toppled worldwide, andcentral bankers shifted focus to achieving financial stability and protecting growth.
The financial crisis hit the domestic markets towards September 2008, leading to acute disruption inmoney markets. The Reserve Bank of India (RBI) acted proactively cutting the cash reserve ratio (CRR)by an unprecedented 400 bps between September 2008 and January 2009. Similarly, the reverserepo rate had been cut by 275 bps since October 2008 while the repo rate had been cut by 425 bpsover the same period.
Bond market yields fell in line with the unprecedented monetary easing up till the first week ofJanuary 2009. Thereon, supply pressures on bond markets rose as a result of government fiscalslippages aimed at stimulating the economy. The RBI, in line with similar measures elsewhere in theworld, started buying government securities to lessen the impact on yields from the rise in governmentborrowing. Although this helped market sentiment, it could not prevent a general rise in yieldstowards fiscal close. As a result, the 10 year benchmark sovereign yield closed the fiscal at 7% froma low of sub 5% hit in early January 2009. Money market rates stabilized after the initial mayhem ofSeptember 2008 and October 2008 and liquidity came back to interbank markets.
MARKET OUTLOOK
(as furnished by HSBC Asset Management (India) Private Limited)
Equity Market Outlook
Financial Year (FY) 2008-09 was a year marked by a strong correlation between the Indian marketand global markets with key indices ending deeply in the red on the back of the subprime crisis andderivative led losses across major financial stocks in the United States (US). Even in India, forex lossesran across corporate India though at a smaller magnitude. FY 10 has begun on a better note onaccount of various fundamental and technical factors.
GDP for FY 09 grew at 6.7% against FY 08 levels of 9%. Agriculture posted a below trend growthrate of 1.6% and industry grew by 3.9% (versus 8.1% in FY 08) with services registering a close to9.7% growth. IIP grew by a mere 2.6%. Although order books of engineering / capital goods wererunning at record high levels, there was possibility of delays in execution as funding sources for thedevelopers (equity, ECB, private equity, FCCB) had dried up. A sharp increase in subsidy on accountof oil, fertilizers and food led to a cut back in discretionary spending. Inflation rose on the back of asurging crude and higher prices of agricultural commodities to top at 12.91% for the week ending 2August, 2008. A slow down in the growth rates in the US / EU and other markets finally tamed thesurge in crude. As growth rates stumbled, governments / monetary authorities the world over triggeredfiscal stimuli / monetary easing to escape recessionary forces. This was followed in India as wellwhich started monetary easing / fiscal stimuli to keep growth rates buoyant.
Trustees' ReportFor the year ended March 31, 2009 (Contd...)

5
On the positive side, India continues to do better in relative terms and we expect GDP growth of6-6.5% for FY10. The broad themes that are driving domestic growth viz. capital expenditure,infrastructure building and domestic consumption are still intact. The key concerns at this pointstems from a ballooning fiscal deficit at the consolidated level (Centre & State) with salary revisionfor Central / State Government employees threatening a cut back in discretionary spending. Inflationis likely to remain benign for the first half of FY10 on a favourable base effect but we anticipate it togo back to trend levels of 5-5.5% for the second half of FY10 as this base effect wears off.
On a valuations perspective, the markets are currently trading at a P/E ratio of around 12 timesFY 2010 earnings. This is well below the 10-year average given the extreme risk aversion prevailing inthe markets. However, the underlying growth in the economy and corporate earnings growth (15%in the long term) makes the market attractive from a longer-term view. The short term could seeenhanced volatility arising from various factors. Increase in commodity prices continues to be a riskin the medium term as the US dollar continues to struggle with the ballooning US fiscal situation.
Debt Market Outlook
Excess supply of government bonds, as a result of fiscal slippages to arrest the downward growthmomentum, has been a reality for bond markets since January 2009. However, this is now compoundedwith some fatigue in buying longer duration as economic data is showing signs of recovery,commodities are showing signs of rally and expectations of incremental monetary easing from theRBI are beginning to unwind. However, system liquidity remains surplus and bank deposits continueto grow thereby providing resistance to bond yields from rising sharply.
Given the above factors, we believe that the market would continue to provide tactical opportunitiesalthough the fundamental bias should be for lower duration. Also, any mitigation of bond supplypressure or a new downturn in the ongoing economic recovery may provide space for opportunisticlonger duration plays. On the other hand, if the recovery cycle continues uninterrupted and commodityprices remain firm, central banks may start to worry about withdrawing the current monetary stimulusby sometime early 2010; with consequent impact on bond markets.
2. BRIEF BACKGROUND OF SPONSORS, BOARD OF TRUSTEES AND ASSETMANAGEMENT COMPANY
a) Sponsor
HSBC Mutual Fund is sponsored by HSBC Securities and Capital Markets (India) Private Limited (HSCI).The Sponsor is the Settler of the Mutual Fund Trust. The Sponsor has entrusted a sum of Rs. 1,00,000(Rupees One Lakh only) to the Trustee as the initial contribution towards the corpus of the MutualFund.
HSCI is a member of the HSBC Group, one of the largest banking and financial services organisations,in the world. Headquartered in London, HSBC operates through long-established businesses in fiveregions: Europe, Asia-Pacific, Middle East, America and Africa. Through its global network of 10,000offices in 86 countries and territories, HSBC provides a comprehensive range of financial services topersonal, commercial, corporate, institutional investment and private banking clients.
HSCI offers integrated investment banking services, securities and corporate finance & advisory. HSCIis a member of The Bombay Stock Exchange Limited and National Stock Exchange (capital and derivativemarket segments) and is also a category I merchant banker and underwriter registered with Securitiesand Exchange Board of India.
HSCI holds 100% of the paid-up equity share capital of the AMC.
b) HSBC Mutual Fund
HSBC Mutual Fund ("the Mutual Fund" or "the Fund") has been constituted as a Trust in accordancewith the provisions of the Indian Trusts Act, 1882 (2 of 1882) vide a Trust Deed dated February 7,2002 with HSBC Securities and Capital Markets (India) Private Limited, as the Sponsor and the Boardof Individual Trustees. The Trustee has entered into an Investment Management Agreement dated
Trustees' ReportFor the year ended March 31, 2009 (Contd...)

6
February 7, 2002 with HSBC Asset Management (India) Private Limited (the AMC) to function as theInvestment Manager for all the Schemes of the Fund. The Fund was registered with SEBI videregistration number MF/046/02/5 dated May 27, 2002.
The Trust has been formed for the purpose of pooling of capital from the public for collectiveinvestment in securities / any other property for the purpose of providing facilities for participationby persons as beneficiaries in such properties / investments and in the profits / income arising therefrom.
c) Board of Trustees (the Trustees)
The Board of Trustees are the exclusive owner of the Trust Fund and holds the same in trust for thebenefit of the unitholders. The Trustees have been discharging their duties and carrying out theirresponsibilities as provided in the SEBI (Mutual Funds) Regulations, 1996 and the Trust Deed. TheTrustees seeks to ensure that the Fund and the Schemes floated thereunder are managed by theAMC in accordance with the Trust Deed, the said Regulations, directions and guidelines issued bySEBI, the Stock Exchanges, the Association of Mutual Funds of India and other regulatory agencies.
d) Asset Management Company (the AMC)
HSBC Asset Management (India) Private Limited (the Investment Manager or the AMC) is a privatelimited company incorporated under the Companies Act, 1956 on December 12, 2001 having itsRegistered Office at 314, D. N. Road, Fort, Mumbai 400 001. HSBC Asset Management (India) PrivateLimited has been appointed as the Asset Management Company of the HSBC Mutual Fund by theTrustee vide Investment Management Agreement (IMA) dated February 7, 2002 and executed betweenthe Trustees and the AMC. SEBI approved the AMC to act as the Investment Manager of the Fundvide. its letter No. MFD/BC/163/2002 dated May 27, 2002.
The paid-up equity share capital of the AMC is Rs. 9 crores. HSBC Securities and Capital Markets(India) Private Limited holds 100% of the paid-up equity share capital of the AMC.
3. INVESTMENT OBJECTIVE OF THE SCHEMEThe investment objective of the Scheme has been provided above under the heading "SchemePerformance, Future Outlook and Operation of the Scheme" (refer Section 1).
4. SIGNIFICANT ACCOUNTING POLICIESThe accounting policies are in accordance with Securities and Exchange Board of India (Mutual Funds)Regulations, 1996.
5. UNCLAIMED DIVIDENDS & REDEMPTIONSSummary of number of Investors & corresponding amount
Unclaimed Dividends Unclaimed Redemptions
Scheme Amount No. of Amount No. of(Rs.) Investors (Rs.) Investors
HSBC Midcap Equity Fund 351,036.78 236 289,411.82 13
6. INVESTOR SERVICESDuring the year, the number of official points of acceptance of transactions increased significantly toabout 182 locations. In addition to the offices of the transfer agency, the company has InvestorService Centres in 14 locations at its own offices - namely Mumbai, New Delhi, Kolkata, Chennai,Bangalore, Hyderabad, Pune, Ahmedabad, Indore, Chandigarh, Kochi, Coimbatore, Lucknow andVadodara. With a view to enhancing customer convenience, the Asset Management Company hasextended the facility of crediting investor bank accounts directly by way of NEFT / RTGS (for credit ofredemption and dividend proceeds). The AMC endeavours to despatch dividend proceeds within 5
Trustees' ReportFor the year ended March 31, 2009 (Contd...)

7
working days from the Record Date in all Schemes. The internal standards on redemption payoutshave been consistently met, with very few exceptions. The number of locations for the ECS AutoDebit facility for investments through Systematic Investment Plan also increased to about 74 byMarch 2009.
On the distribution front, the number of empanelled distributors increased from 7859 as on 31March, 2008 to 8632 as on 31 March, 2009. During the year, the Asset Management Companyinitiated tie-ups for online distribution of the Mutual Fund's schemes with several channel partnerstaking the total number of such tie-ups to 24 (Angel Capital & Department Market Ltd., Bajaj CapitalLimited, Bonanza Portfolio Limited, Citibank N.A., Citigroup Wealth Advisors India Private Limited,HDFC Bank Limited, Hongkong & Shanghai Banking Corporation Limited, HSBC Corporate InvestmentSolution Services, ICICI Securities Limited, India Infoline Limited, Karvy Stock Broking Limited, KotakMahindra Bank Limited, Kotak Securities Limited, Motilal Oswal Securities Limited, NJ India InvestPrivate Limited, Reliance Securities Limited, RR Investors Capital Services Private Limited, SBICAPSecurities Limited, Sharekhan Limited, SMC Global Securities Limited, Standard Chartered - STCICapital Markets Ltd., Tom Distribution Services Limited, Yes Bank Limited).
Call centre operations have been extended to cover the entire country. The Asset ManagementCompany has outsourced certain back office services including call centre services to HSBC Operationsand Processing Enterprise (India) Private Limited (HOPE).
7. STATUTORY DETAILSa) The Sponsors are not responsible or liable for any loss resulting from the operation of the Schemes
of the Fund beyond initial contribution of Rs. 1 lakh for setting up the Fund.
b) The price and redemption value of the units, and income from them, can go up as well as downwith fluctuations in the market value of its underlying investments.
c) Full / Abridged Annual Report shall be disclosed on the website at www.assetmanagement.hsbc.com/inand shall be available for inspection at the Head Office of the mutual fund. Present and prospectiveunit holder can obtain copy of the trust deed, the Full / Abridged Annual Report of the Scheme(s),the Annual Report of HSBC Asset Management (India) Private Limited and the text of the relevantScheme(s) at a price.
8. ACKNOWLEDGEMENTSThe Trustees wish to thank the Unitholders of the Schemes for their support throughout the year andalso thank the Government of India, the Securities and Exchange Board of India (SEBI), the ReserveBank of India (RBI) and the Association of Mutual Funds in India (AMFI) for the guidance provided bythem. The Trustees also appreciate the service provided by the Registrar and Transfer Agent, FundAccountant, Custodian, Bankers, Distributors and Brokers. The guidance and services provided bythe Auditors and advocates and the ebullience, sincerity and dedication of the employees of HSBCAsset Management (India) Private Limited is also appreciated.
The Trustees look forward to the continued support of everyone.
For and on behalf of the Board of Trustees of HSBC Mutual Fund
Dilip J. Thakkar
Trustee
MUMBAIJuly 6, 2009
Trustees' ReportFor the year ended March 31, 2009 (Contd...)

8
To the Board of Trustees of
HSBC MUTUAL FUND
1. We have audited the Balance Sheet of HSBC Mutual Fund – HSBC Midcap Equity Fund (“TheScheme”) as at March 31, 2009, the related Revenue Account for the year ended on that dateannexed thereto, and the Cash Flow Statement for the year ended on that date which we havesigned under reference to this report. These financial statements are the responsibility of theBoard of Trustees of HSBC Mutual Fund and the Management of HSBC Asset Management (India)Private Limited (the “Management”). Our responsibility is to express an opinion on these financialstatements based on our audit.
2. We have conducted our audit in accordance with auditing standards generally accepted in India.Those standards require that we plan and perform the audit to obtain reasonable assuranceabout whether the financial statements are free of material misstatement. An audit includesexamining, on a test basis, evidence supporting the amounts and disclosures in the financialstatements. Our procedures included confirmation of securities owned and unit capital balancesas at March 31, 2009 by correspondence with the custodian / others and registrar and transferagent respectively. An audit also includes assessing the accounting principles used and significantestimates made by the Management as well as evaluating the overall financial statementpresentation. We believe that our audit provides a reasonable basis for our opinion.
3. We have obtained all the information and explanations which to the best of our knowledge andbelief were necessary for the purpose of our audit. The Balance Sheet, the Revenue Account andthe Cash Flow Statement referred to above are in agreement with the books of account of theScheme.
4. In our opinion and to the best of our information and according to the explanations given to us,
(i) The Balance Sheet, the Revenue Account and the Cash Flow Statement together with thenotes thereon give the information required by the Securities and Exchange Board of India(Mutual Funds) Regulations, 1996 and amendments thereto, as applicable, and also giverespectively, a true and fair view of the state of affairs of HSBC Mutual Fund – HSBC MidcapEquity Fund as at March 31, 2009, its net deficit and cash flows for the year ended on thatdate.
(ii) The Balance Sheet as at March 31, 2009 and the Revenue Account for the year ended on thatdate, together with the notes thereon have been prepared in all material respects in accordancewith the accounting policies and standards specified in the Ninth Schedule of the Securitiesand Exchange Board of India (Mutual Funds) Regulations, 1996 and amendments thereto asapplicable.
Partha GhoshPartnerMembership No. F / 55913
For and on behalf ofPRICE WATERHOUSEChartered Accountants
Place : MumbaiDate : July 6, 2009
Auditors' Report

9
Rs. in Lakhs
HSBC MIDCAP EQUITY FUND
As at As atMarch 31, 2009 March 31, 2008
LIABILITIES1 Unit Capital 11,837.90 14,806.45
2 Reserves & Surplus2.1 Unit Premium Reserves (4,036.60) (3,978.14)2.2 Unrealised Appreciation Reserve – –2.3 Other Reserves 1,565.75 12,731.79
3 Loans & Borrowings – –
4 Current Liabilities & Provisions4.1 Provision for doubtful Income / Deposits – –4.2 Other Current Liabilities & Provisions 155.62 297.03
TOTAL 9,522.67 23,857.13
ASSETS1 Investments1.1. Listed Securities1.1.1 Equity Shares 7,579.66 20,098.671.1.2 Preference Shares – –1.1.3 Equity Linked Debentures – –1.1.4 Other Debentures & Bonds – –1.1.5 Securitised Debt securities – –1.2 Securities Awaited Listing:1.2.1 Equity Shares – –1.2.2 Preference Shares – –1.2.3 Equity Linked Debentures – –1.2.4 Other Debentures & Bonds – –1.2.5 Securitised Debt securities – –1.3 Unlisted Securities:1.3.1 Equity Shares – –1.3.2 Preference Shares – –1.3.3 Equity Linked Debentures – –1.3.4 Other Debentures & Bonds – –1.3.5 Securitised Debt securities – –1.4 Government Securities – –1.5 Treasury Bills – –1.6 Commercial Paper – –1.7 Certificate of Deposits – –1.8 Bill Rediscounting – –1.9 Units of Domestic Mutual Fund – –1.10 Foreign Securities – –
Total Investments 7,579.66 20,098.67
2 Deposits 932.13 332.13
3 Other Current Assets3.1 Cash & Bank Balance 335.48 36.213.2 CBLO / Reverse Repo Lending 7.16 2,183.793.3 Others 624.91 1,125.16
4 Deferred Revenue Expenditure 43.33 81.17(to the extent not written off)
TOTAL 9,522.67 23,857.13
Notes to Accounts - Annexure I
Abridged Balance Sheet as at March 31, 2009

10
Rs. in Lakhs
HSBC MIDCAP EQUITY FUND
Current PreviousYear ended Year ended
March 31, 2009 March 31, 2008
1 INCOME1.1 Dividend 170.95 196.401.2 Interest 171.66 110.931.3 Realised Gain / (Loss) on Foreign Exchange Transactions – –1.4 Realised Gains / (Losses) on Interscheme sale
of investments – –1.5 Realised Gains / (Losses) on External sale /
redemption of investments (9,650.58) 8,649.691.6 Realised Gains / (Losses) on Derivative Transactions 100.94 79.061.7 Other Income – –
(A) (9,207.03) 9,036.082 EXPENSES2.1 Management fees 175.73 332.322.2 Service tax on Management fees ** – –2.3 Transfer agents fees and expenses 30.63 50.732.4 Custodian fees 9.64 12.352.5 Trusteeship fees 0.06 0.162.6 Commission to Agents * – –2.7 Marketing & Distribution expenses 100.18 197.312.8 Audit fees 3.00 3.502.9 Other operating expenses 74.80 120.932.10 Less:Expenses to be Reimbursed by the
Investment Manager (29.09) –
(B) 364.95 717.303 NET REALISED GAINS / (LOSSES)
FOR THE YEAR / PERIOD (A - B = C) (9,571.98) 8,318.78
4 Change in Unrealised Depreciationin value of investments (D) 1,030.14 1,526.38
5 NET GAINS / (LOSSES) FOR THEYEAR / PERIOD [E = (C-D)] (10,602.12) 6,792.40
6 Change in unrealised appreciationin the value of investments (F) – (2,017.94)
7 NET SURPLUS / (DEFICIT) FORTHE YEAR / PERIOD (E + F = G) (10,602.12) 4,774.46
7.1 Add: Balance transfer from Unrealised Appreciation Reserve – 2,017.947.2 Less: Balance transfer to Unrealised Appreciation Reserve – –7.3 Add / (Less): Equalisation (563.92) (2,121.83)7.4 Transfer from Reserve Fund – 2,316.527.5 Transfer from Unit Premium Reserve – –
8 TOTAL (11,166.04) 6,987.09
9 Dividend Appropriation9.1 Income Distributed during the year / period – 2,293.389.2 Tax on income distributed during the year / period – –10 Retained Surplus / (Deficit)
carried forward to Balance Sheet (11,166.04) 4,693.71
Notes to Accounts - Annexure I* Commission to Agents is included in Marketing & Distribution Expenses.** Service Tax on Management Fees is included in Other Operating Expenses.
Abridged Revenue Account for the year ended March 31, 2009
11
HSBC MIDCAP EQUITY FUND
Current PreviousYear ended Year ended
March 31, 2009 March 31, 2008
1. NAV per unit (Rs.):
Open
Regular Growth Option 20.6339 18.1767
Regular Dividend Option 13.6463 13.8251
High
Regular Growth Option 22.6231 33.0065
Regular Dividend Option 14.9616 23.1238
Low
Regular Growth Option 9.0046 17.5295
Regular Dividend Option 5.9551 12.6297
End
Regular Growth Option 10.1084 20.6339
Regular Dividend Option 6.6851 13.6463
2. Closing Assets Under Management (Rs. in Lakhs)
End 9,367 23,560
Average (AAuM)1 15,190 30,877
3. Gross income as % of AAuM2 -60.61% 29.27%
4. Expense Ratio:
a. Total Expense as % of AAuM (planwise)
Regular Growth Option 2.15% 2.32%
Regular Dividend Option 2.15% 2.32%
b. Management Fee as % of AAuM (planwise)
Regular Growth Option 1.16% 1.08%
Regular Dividend Option 1.16% 1.08%
5. Net Income as a percentage of AAuM3 -63.01% 26.94%
6. Portfolio turnover ratio4 1.72 1.74
7. Total Dividend per unit distributed during theyear / period (planwise)
Retail
Dividend – 2.2500
Corporate
Dividend – 2.2500
Key Statistics for the year ended March 31, 2009

12
8. Returns:
a. Last One Year
Scheme
Regular Growth Option (51.0107) 13.4356
Regular Dividend Option (51.0116) 13.4453
Benchmark
BSE MID CAP 19.3848
b. Since Inception (54.0100)
Scheme
Regular Growth Option 0.2791 28.7265
Regular Dividend Option 0.2102 28.6080
Benchmark
BSE MID CAP (2.4000) 26.8784
1 AAuM=Average daily net assets
2 Gross income = amount against (A) in the Revenue Account i.e. Income.
3 Net income = amount against (C) in the Revenue Account i.e. NET REALISED GAINS / (LOSSES)FOR THE YEAR / PERIOD
4 Portfolio Turnover = Lower of sales or purchase divided by the Average AuM for the year / period.
Key Statistics for the year ended March 31, 2009 (Contd...)
HSBC MIDCAP EQUITY FUND
Current PreviousYear ended Year ended
March 31, 2009 March 31, 2008

13
HSBC MIDCAP EQUITY FUND
1 Investments:
1.1 It is confirmed that investments of the schemes are registered in the name of the Trustees forthe benefit of the Scheme’s Unitholders.
1.2 Open Positions of derivatives amount to Rs. 47,250,950 and is 5.04% to Net Assets as atMarch 31, 2009. Open Positions of derivatives amount to Rs 14,080,500 and is 0.60% toNet Assets as at March 31, 2008.
1.3 Investments in Associates and Group Companies
Issuer Instrument Amount Aggregate Amount AggregateType (Rs.) Investments (Rs.) Investments
by all schemes by all schemes
2009 2008
The Hongkong & Fixed deposits – 43,000,000 – 1,654,000,000Shanghai BankingCorporation Ltd.
1.4 Open position of Securities Borrowed and / or Lent by the scheme as of financial years ended2009 and 2008 are NIL.
1.5 The NPAs as on March 31, 2009 and March 31, 2008 are NIL.
1.6 Aggregate Unrealised Gain / Loss as at the end of the Financial year March 31, 2009 andMarch 31, 2008 are as under :
Security Amount (Rs.) Percentage to Amount (Rs.) Percentage toCategory Net Assets Net Assets
2009 2008
Equity Shares
– Appreciation 33,463,640 3.5725% 231,329,430 9.8187%
– Depreciation 288,443,962 30.7935% 383,884,421 16.2938%
Equity Futures
– Appreciation 575,550 0.0614% – –
– Depreciation 1,246,651 0.1331% 82,638 0.0035%
1.7 The aggregate value of investments purchased (excluding accretion of discount ofRs. 1,777,294) and sold (including matured) during the year 2008 - 2009 is Rs. 2,819,476,499and Rs. 3,005,664,350 respectively being 185.61% and 197.87% of the average daily netassets.
The aggregate value of investments purchased and sold (including matured) during the year2007 - 2008 is Rs. 4,367,921,707 and Rs. 5,664,663,581 respectively being 141.46% and183.46% of the average daily net assets.
1.8 Non-Traded securities in the portfolio:Aggregate Value of Equity, Debt & Money Market Instruments and percentage to net assetsis as under
Security Fair Value % to Net Fair Value % to NetCategory (Rs.) Assets (Rs.) Assets
2009 2008
Equities – – 14,045,841.00 0.5962
Total – – 14,045,841.00 0.5962
Notes to Accounts - Annexure ITo the Abridged Balance Sheet and Revenue Account for the year ended March 31, 2009

14
Notes to Accounts - Annexure I (Contd...)To the Abridged Balance Sheet and Revenue Account for the year ended March 31, 2009
2 Details of Transaction with Associates under regulation 25(8). Provide details of name of associate,nature of payment and amount
Year - 2008- 2009
During the year, HSBC Securities and Capital Markets (India) Private Limited, the Sponsor waspaid brokerage aggregating Rs. 179,416 on purchase and sale of investments. The Hongkongand Shanghai Banking Corporation Limited, an associate entity of HSBC Asset Management (India)Private Limited was paid collection / bank charges amounting to Rs. 23,153 and brokerageamounting to Rs. 3,850,949 for procuring unit subscriptions for the Scheme and clearing membercharges on derivative transactions Rs. 445,071. The brokerage paid was at rates similar to thoseoffered to other brokers / distributors.
Year - 2007- 2008
HSBC Securities and Capital Markets (India) Private Limited, the Sponsor was paid brokerageaggregating Rs. 572,000 on purchase and sale of investments. The Hongkong and ShanghaiBanking Corporation Limited, an associate entity of HSBC Asset Management (India) Private Limitedwas paid collection / bank charges amounting to Rs. 117,536, brokerage amounting toRs. 13,494,905 for procuring unit subscriptions for the Scheme and clearing member charges onderivative transactions Rs. 169,121. The brokerage paid was at rates similar to those offered toother brokers / distributors.
3 None of the Investors held more than 25% of the total net assets of the scheme at the yearended March 31, 2009 and March 31, 2008.
4 Unit Capital movement during the years ended March 31, 2009 and March 31, 2008.
2008-2009
Description Opening Units Subscription Redemption Closing Units Face Value
Growth 48,009,622.007 7,377,934.625 12,935,489.572 42,452,067.060 424,520,670.60
Dividend 100,054,854.569 6,038,463.722 30,166,352.916 75,926,965.375 759,269,653.75
2007-2008
Description Opening Units Subscription Redemption Closing Units Face Value
Growth 61,632,184.130 18,290,653.520 31,913,215.640 48,009,622.010 480,096,220.07
Dividend 131,005,231.490 29,628,703.680 60,579,080.600 100,054,854.570 1,000,548,545.69
5 Previous year’s figures have been re–grouped/re-arranged where appropriate.
6 No contingent liabilities for the years ended March 31, 2009 and March 31, 2008.
7 Expenses other than Management Fees are inclusive of Service Tax where applicable.
8. The Annual Accounts of the Schemes prepared in accordance with the accounting policies andstandards specified in the Ninth Schedule of The Securities and Exchange Board of India (MutualFunds) Regulations, 1996 has been approved by the Board of Directors of HSBC Asset Management(India) Private Limited and The Board of Trustees of HSBC Mutual Fund at their meeting held onJuly 06, 2009. The audit report attached herewith refers to the said annual accounts. The aforesaidabridged accounts are an extract of the Annual Accounts and are prepared in accordance withSEBI Circular No. IMD/Cir 8/132968/2008 dated July 24, 2008.

15
DISCLAIMERSThe content of this report has been prepared by HSBC Asset Management (India) Private Limited(HSBC) for information purposes only and should not be construed as an offer or solicitation of anoffer for purchase of any of the funds of HSBC Mutual Fund. The information is for general informationonly and does not have regard to specific investment objectives, financial situation and the particularneeds of any specific person who may receive this information. Investments in mutual funds inherentlyinvolve risks and investors should read the relevant documents / information for details and riskfactors and consult their legal, tax and financial advisors before investing. Investors should understandthat statements made herein regarding future prospects may not be realised. Neither this documentnor the units of HSBC Mutual Fund have been registered in any jurisdiction. The distribution of thisdocument in certain jurisdictions may be restricted or totally prohibited and accordingly, personswho come into possession of this document are required to inform themselves about, and to observe,any such restrictions.
Investors may obtain Statement of Additional Information, Combined Scheme Information Documentand Common Key Information Memorandums along with application forms from the office of HSBCMutual Fund, 314, D. N. Road, Fort, Mumbai 400 001. Tel: 022-6666 8819.
Statutory Details:HSBC Mutual Fund has been set up as a trust by HSBC Securities and Capital Markets (India) PrivateLimited (liability restricted to the corpus of Rs. 1 lakh). The Sponsor/associates of the Sponsor/AssetManagement Company (AMC) are not responsible or liable for any loss or shortfall resulting from theoperation of the Schemes. The Trustees of HSBC Mutual Fund have appointed HSBC Asset Management(India) Private Limited as the Investment Manager.
Risk Factors:All investments in mutual funds and securities are subject to market risks and the Net Asset Value(NAV) of the Scheme(s) may go up or down depending on the factors and forces affecting the securitiesmarkets. There can be no assurance that the objectives of the Scheme(s) will be achieved. Pastperformance of the Sponsor, AMC, Mutual Fund or any associates of the Sponsor/AMC does notindicate the future performance of the Scheme(s) of the Mutual Fund. HSBC Midcap Equity Fund(HMEF) is the names of the Scheme and does not in any manner indicate the quality of the Schemeor its future prospects or returns.
Terms of Issue:Units of the Scheme(s) are being offered at NAV based prices, subject to the prevailing loads. TheAMC calculates and publishes NAVs and offers for sale, redemption and switch outs, units of theScheme(s) on all Business Days, at the Applicable NAV for all Schemes (at least once a week, i.e.,every Wednesday and daily during the period of redemption in case of HSCF). HUOF, HSCF & HFTSwill not be open for ongoing subscriptions/ switch ins. HUOF & HSCF would be available for sale onan ongoing basis (after a period of 3 years from the date of allotment). Conversion of HUOF & HSCFto an open-ended scheme will be done only after the balance unamortized amount has been fullyrecovered from the Scheme. Units can be redeemed/switched out on every Business Day at NAVbased prices, subject to prevailing exit loads. In case of HSCF, units can be redeemed / switched outon a monthly basis on the stipulated date i.e. last 3 business days of every month at NAV basedprices, subject to provisions of exit load, if any and recovery of balance proportionate unamortizedNFO expenses.
Load Structure (includes SIP/STP):Entry - 2.25% for investments /switch ins* < Rs. 5 crores, otherwise Nil.
Exit - 1% for < Rs. 5 crores, if redeemed/switched out* within 1 year from date of investment,otherwise Nil.
*No load in case of switches between equity Schemes of HSBC Mutual Fund.
Consult the nearest investor service centre for details.
The entry/exit load set forth above is subject to change at the discretion of the AMC and suchchanges shall be implemented prospectively.

16
Mutual Fund investments are subject to market risks. Please read the Statement of AdditionalInformation and Scheme Information Document carefully before investing.
Value Research Online DisclaimerValue Research Fund Ratings: Value Research Fund Ratings are a composite measure of historical risk-adjusted returns. In the case of equity funds this rating is based on the average monthly returns forthe last 3-year and 5-year period. These ratings do not take into account any entry or exit load.
Value Research Fund Ratings are subject to change every month. Current Fund Ratings are as onMarch 31, 2009. 142 open-ended Equity: Diversified Funds were rated. The Rating is based on primarydata provided by respective funds; Value Research does not guarantee the accuracy. Ranking Entity:Value Research Online.
ICRA Online Ranking MethodologyHSBC Monthly Income - Savings Plan has been ranked as a Five Star Fund in the category of 'OpenEnded Marginal Equity' schemes for its 3 year performance till December 31, 2008.
The rank is an outcome of an objective and comparative analysis against various parameters, including:risk adjusted return, fund size, company concentration, portfolio turnover and liquidity. The rankingmethodology did not take into account entry and exit loads imposed by the Fund. There were 27schemes considered in 'Open Ended Marginal Equity' category for the ranking exercise. The rank isneither a certificate of statutory compliance nor any guarantee on the future performance of HSBCMonthly Income - Savings Plan. Ranking Source & Publisher: ICRA Online Limited.
CRISIL Ranking MethodologyThe selection for the awards is based on the CRISIL FundServices' Composite Performance Ranking(CRISIL~CPR) methodology.
The CRISIL Composite Performance Ranking (CRISIL~CPR) is a quarterly ranking of mutual fund schemesbased on two year performance (excepting for the liquid and short term debt categories where a oneyear performance horizon is considered). The methodology is based on global best practices,customized to account for Indian market nuances. Over time, the rankings have become the industrystandard with good acceptance among Investors, Fund Intermediaries, Asset Management Companies,etc. The performance criteria covers not only risk adjusted returns, which are historical, but also theportfolio constitution to make the analysis forward looking.
CRISIL DisclaimerThe overall ranking is assigned to the scheme based on its weighted average score on a range ofparameters: Superior Return Score, Concentration, Liquidity, Asset Quality - Measures the creditquality of the portfolio, Average Maturity and Asset Size. HSBC MIP - Savings was the only schemethat won the CNBC TV18 - CRISIL Mutual Fund of the Year Award in the Category - Monthly IncomePlans - Aggressive. In total 13 schemes were eligible for the award universe. Schemes present in allfour quarterly CRISIL CPRs were considered for the award. The award is based on consistency of thescheme's performance in the four quarterly CRISIL CPR rankings released during the calendar year2008. The individual CRISIL CPR parameter scores averaged for the four quarters were further multipliedby the parameter weights as per the CRISIL CPR methodology to arrive at the final scores. A detailedmethodology of the CRISIL CPR is available at www.crisil.com. Past performance is no guarantee offuture results. Rankings and Award Source: CRISIL Fund Services, CRISIL Ltd. HSBC Monthly Income -Savings Plan has been ranked as a Five Star Fund in the category of 'Open Ended Marginal Equity'schemes for its 3 year performance till December 31, 2008. The rank is an outcome of an objectiveand comparative analysis against various parameters, including: risk adjusted return, fund size,company concentration, portfolio turnover and liquidity. The ranking methodology did not take intoaccount entry and exit loads imposed by the Fund. There were 27 schemes considered in 'OpenEnded Marginal Equity' category for the ranking exercise. The rank is neither a certificate of statutorycompliance nor any guarantee on the future performance of HSBC Monthly Income - Savings Plan.Ranking Source & Publisher: ICRA Online Limited.

Issued by HSBC Asset Management (India) Private Limited
HSBC Global Asset Management
HSBC Progressive Themes Fund(formerly HSBC Advantage India Fund)An open-ended flexi-theme equity Scheme
Abridged Annual Report 2008 - 2009


1
Dear Investor,
We thank you for investing with HSBC Mutual Fund. We are pleased to inform you that HSBCMutual Fund has won prestigious awards* this year at various forums in India.
The awards* won by our schemes in India are
� HSBC Equity Fund has been included in the 5 star rated fund category (“Top rated mutualfunds” by Value Research online) in March, 2009.
� Five-stars indicate that a fund is in the top 10 per cent of its category in terms ofhistorical risk-adjusted returns.
� ICRA Mutual Fund Awards 2009
� HSBC MIP - Savings has been ranked a 5-Star Fund by ICRA Online indicating performanceamong the top 10% in the category of 'Open Ended Marginal Equity' for 3 yearperformance ending 31 December, 2008.
� CNBC TV18 - CRISIL Mutual Fund Awards 2008
� HSBC MIP - Savings was awarded the CNBC TV18 - CRISIL Mutual Fund of the YearAward for the year 2008 in the Monthly Income Plans - Aggressive Category.
(Past performance is no guarantee of future results. * Please refer to Ranking methodologyand disclaimer mentioned at the end of the Abridged Annual Report for the year endedMarch 31, 2009).
At the global level, the HSBC Group won several awards at Euromoney's Awards for Excellence2009. The top awards that HSBC won were the Best Global Bank and the Best Global DebtHouse. It was also honoured as the Best Debt House in 8 locations including Asia and the Bestat Risk Management in Asia. (Past performance may or may not be sustained in the future andis no guarantee of future results). We continue to be one of the leading players in emergingmarkets and remain committed to our asset management business in India.
HSBC Asset Management (India) Private Limited including the mutual fund business as well asthe PMS business (including EPFO money deployed till date) manages assets of about Rs. 26280Crores as at 30 June, 2009. The core to our winning strategy is our endeavour to deliverconsistent performance over the medium to long term for our investors in a risk controlledenvironment and aim for consistent wealth creation under varying market conditions. Throughour product range, we aim to be true to our reputation in India of being a provider ofinternational quality investment products and services.
We remain committed to our philosophy of aiming for consistent wealth creation and serviceexcellence and look forward to your continued investments in HSBC Mutual Fund.
Yours sincerely,
VikramaadityaChief Executive OfficerHSBC Asset Management (India) Private Limited

2
SPONSORHSBC Securities and Capital Markets (India) Private LimitedRegd. Office: 52/60, Mahatma Gandhi Road, Fort, Mumbai 400 001.
TRUSTEEBoard of TrusteesOffice: 314, D. N. Road, Fort, Mumbai 400 001.
ASSET MANAGEMENT COMPANYHSBC Asset Management (India) Private LimitedCorp. & Regd. Office: 314, D. N. Road, Fort, Mumbai 400 001.
CUSTODIANJP Morgan Chase BankCorp. & Regd. Office: Mafatlal Centre, 9th Floor, Nariman Point, Mumbai - 400 021.
AUDITORS TO THE SCHEMEPrice WaterhouseChartered Accountants252, Veer Savarkar Marg, Shivaji Park, Dadar (West), Mumbai - 400 028.
LEGAL ADVISORSBharucha & Partners4th Floor, Cecil Court, Mahakavi Bhushan Marg, Colaba, Mumbai - 400 039.
REGISTRAR & TRANSFER AGENTSComputer Age Management Services (P) Ltd. (CAMS)Rayala Towers, Tower I, III Floor, 158 Anna Salai, Chennai - 600 002.
BOARD OF TRUSTEESMr. N. P. Gidwani - Chairman
Dr. Rudolf ApenbrinkMr. Nasser MunjeeMr. Manu TandonMr. Mehli MistriMr. Dilip J. Thakkar
BOARD OF DIRECTORSMs. Naina Lal Kidwai - Chairman
Mr. Ayaz EbrahimMr. S. P. Mustafa**Mr. Vithal PalekarMs. Kishori J. Udeshi*Mr. Vikramaaditya - Chief Executive Officer***
* Ms. Kishori Udeshi has been appointed as a Director with effect from 14 January 2009 andMr. Jagjit Lal Pasricha has resigned as a Director with effect from 19 January 2009.
** Mr. S. P. Mustafa has been appointed as a Director with effect from 2 September 2008 andMr. Nawshir Khurody has resigned as a Director with effect from 1 September 2008
*** Mr. Vikramaaditya has been appointed as the Chief Executive Officer with effect from 16 July 2008and Mr. Sanjay Prakash has resigned as the Chief Executive Officer with effect from 16 July 2008.

3
Trustees' ReportFor the year ended March 31, 2009
The Trustees present the seventh report and the audited financial statements of the Schemesof HSBC Mutual Fund (the "Fund"), for the year ended March 31, 2009.
1. SCHEME PERFORMANCE, FUTURE OUTLOOK AND OPERATIONS OF THE SCHEME
a) Operations and Performance of the Scheme
HSBC Advantage India Fund (HAIF)* - an open-ended flexi-theme Equity scheme w.e.f.16 June, 2009, the scheme is renamed to HSBC Progressive Themes Fund (HPTF)
The investment objective is to generate long term capital growth from an actively managed portfolioof equity and equity related securities by investing primarily in sectors, areas and themes that play animportant role in, and / or benefit from, India's progress, reform process and economic development.
The net assets of the Scheme amounted to Rs. 357.55 crores as at March 31, 2009 as compared toRs. 712.21 crores as at March 31, 2008. 88.11% of the net assets were invested in equities and11.89% were invested in debt and money market instruments as at March 31, 2009.
HAIF underperformed its benchmark by 180 bps as one of the sectors in which the Scheme invested(infrastructure sector) underperformed its benchmark.
Date of Inception : 23 February, 2006 Compounded Annualized Returns (%)
Schemes (P2P) 1 Year 3 Years Since Inception
HSBC Advantage India Fund - Growth -42.78 -9.66 -5.75
BSE 200 -40.98 -6.88 -3.64
Past performance may or may not be sustained in future. 'Since inception' returns are calculated onRs. 10 invested at inception. Calculations are based on Growth NAVs.
b) Market Overview & Outlook
MARKET OVERVIEW
(as furnished by HSBC Asset Management (India) Private Limited)
Equity Market Overview
The financial year ended 31 March, 2009 was a highly eventful one with long standing institutionsdisappearing from the landscape in the whirlwind of the sub-prime crisis and derivative losses. Theyear can be split into three phases - the first from April 2008 till when Lehman Brothers filed forbankruptcy, which saw a blowout commodity rally (crude oil nudged close to USD 144/barrel) andthe sub-prime situation turning progressively worse. The United States (US) Government / FederalReserve bailed out major institutions thought to be critical to the functioning of the financial system.The second phase from September 2008 till January 2009 saw a spate of bankruptcies most notablyLehman Brothers which saw the appearance of an acute level of risk aversion pushing the creditmarkets into a gridlock. This phase also coincided with the fiscal / monetary stimuli by variousgovernments to take the credit crisis head on. Globally, markets stabilized around their October2008 lows and a semblance of normality started re-appearing in financial markets in this period. Thethird phase from February 2009 onwards witnessed a sharp rally as a weakening US Dollar spewedmoney into emerging markets. The sensex fell by 38% during the financial year.
For the financial year 2009, the popular indices viz. BSE Sensex and CNX Nifty were down 37.94%and 36.19% respectively. The BSE Midcap (54.01)% and the broader indices like BSE 200 (40.98)%and BSE 500 (42.77)% also reflected the correction across the markets. Within sectoral indices thebest performing indices were BSE FMCG (11.08)% and BSE Oil and Gas (29.58)% while the worst

4
performing indices were BSE Realty (79.37)%, due to the high leverage on the balance sheets, BSEMetals (58.67)%, due to slowdown in global growth and BSE Consumer Durables (58.14)% and BSECapital goods (53.84%).
In a year that saw sell-off across emerging markets, FIIs were net sellers of the tune USD 10.4 billionin the Indian equity markets while Domestic Institutional Investors (Insurance & Mutual Funds) werebuyers to the tune of USD 13.1 billion. Further, FIIs were net sellers in the derivative markets ashedge funds, and p-notes unwound positions in a rapidly deleveraging world. Thus, sentimentremained negative as few US based investment banks filed for bankruptcy in the midst of the liquidityand credit crisis and safety took precedence over growth.
Debt Market Overview
Two contrarian forces one inflationary and the other deflationary had been in play since 2007: Onthe one hand strong demand from emerging economies were leading commodities higher and fuellinginflation, while on the other the housing led credit crisis in the US was starting to exert a deflationaryforce. The first force was dominant till early July 2008 leading commodity prices to fresh peaks andinflation to multi year highs. Since then, however, the second force took hold with the result thatcommodity prices fell sharply from the top, growth and inflation numbers toppled worldwide, andcentral bankers shifted focus to achieving financial stability and protecting growth.
The financial crisis hit the domestic markets towards September 2008, leading to acute disruption inmoney markets. The Reserve Bank of India (RBI) acted proactively cutting the cash reserve ratio (CRR)by an unprecedented 400 bps between September 2008 and January 2009. Similarly, the reverserepo rate had been cut by 275 bps since October 2008 while the repo rate had been cut by 425 bpsover the same period.
Bond market yields fell in line with the unprecedented monetary easing up till the first week ofJanuary 2009. Thereon, supply pressures on bond markets rose as a result of government fiscalslippages aimed at stimulating the economy. The RBI, in line with similar measures elsewhere in theworld, started buying government securities to lessen the impact on yields from the rise in governmentborrowing. Although this helped market sentiment, it could not prevent a general rise in yieldstowards fiscal close. As a result, the 10 year benchmark sovereign yield closed the fiscal at 7% froma low of sub 5% hit in early January 2009. Money market rates stabilized after the initial mayhem ofSeptember 2008 and October 2008 and liquidity came back to interbank markets.
MARKET OUTLOOK
(as furnished by HSBC Asset Management (India) Private Limited)
Equity Market Outlook
Financial Year (FY) 2008-09 was a year marked by a strong correlation between the Indian marketand global markets with key indices ending deeply in the red on the back of the subprime crisis andderivative led losses across major financial stocks in the United States (US). Even in India, forex lossesran across corporate India though at a smaller magnitude. FY 10 has begun on a better note onaccount of various fundamental and technical factors.
GDP for FY 09 grew at 6.7% against FY 08 levels of 9%. Agriculture posted a below trend growthrate of 1.6% and industry grew by 3.9% (versus 8.1% in FY 08) with services registering a close to9.7% growth. IIP grew by a mere 2.6%. Although order books of engineering / capital goods wererunning at record high levels, there was possibility of delays in execution as funding sources for thedevelopers (equity, ECB, private equity, FCCB) had dried up. A sharp increase in subsidy on accountof oil, fertilizers and food led to a cut back in discretionary spending. Inflation rose on the back of asurging crude and higher prices of agricultural commodities to top at 12.91% for the week ending 2August, 2008. A slow down in the growth rates in the US / EU and other markets finally tamed thesurge in crude. As growth rates stumbled, governments / monetary authorities the world over triggered
Trustees' ReportFor the year ended March 31, 2009 (Contd...)

5
fiscal stimuli / monetary easing to escape recessionary forces. This was followed in India as wellwhich started monetary easing / fiscal stimuli to keep growth rates buoyant.
On the positive side, India continues to do better in relative terms and we expect GDP growth of6-6.5% for FY10. The broad themes that are driving domestic growth viz. capital expenditure,infrastructure building and domestic consumption are still intact. The key concerns at this pointstems from a ballooning fiscal deficit at the consolidated level (Centre & State) with salary revisionfor Central / State Government employees threatening a cut back in discretionary spending. Inflationis likely to remain benign for the first half of FY10 on a favourable base effect but we anticipate it togo back to trend levels of 5-5.5% for the second half of FY10 as this base effect wears off.
On a valuations perspective, the markets are currently trading at a P/E ratio of around 12 timesFY 2010 earnings. This is well below the 10-year average given the extreme risk aversion prevailing inthe markets. However, the underlying growth in the economy and corporate earnings growth (15%in the long term) makes the market attractive from a longer-term view. The short term could seeenhanced volatility arising from various factors. Increase in commodity prices continues to be a riskin the medium term as the US dollar continues to struggle with the ballooning US fiscal situation.
Debt Market Outlook
Excess supply of government bonds, as a result of fiscal slippages to arrest the downward growthmomentum, has been a reality for bond markets since January 2009. However, this is now compoundedwith some fatigue in buying longer duration as economic data is showing signs of recovery,commodities are showing signs of rally and expectations of incremental monetary easing from theRBI are beginning to unwind. However, system liquidity remains surplus and bank deposits continueto grow thereby providing resistance to bond yields from rising sharply.
Given the above factors, we believe that the market would continue to provide tactical opportunitiesalthough the fundamental bias should be for lower duration. Also, any mitigation of bond supplypressure or a new downturn in the ongoing economic recovery may provide space for opportunisticlonger duration plays. On the other hand, if the recovery cycle continues uninterrupted and commodityprices remain firm, central banks may start to worry about withdrawing the current monetary stimulusby sometime early 2010; with consequent impact on bond markets.
2. BRIEF BACKGROUND OF SPONSORS, BOARD OF TRUSTEES AND ASSETMANAGEMENT COMPANY
a) Sponsor
HSBC Mutual Fund is sponsored by HSBC Securities and Capital Markets (India) Private Limited (HSCI).The Sponsor is the Settler of the Mutual Fund Trust. The Sponsor has entrusted a sum of Rs. 1,00,000(Rupees One Lakh only) to the Trustee as the initial contribution towards the corpus of the MutualFund.
HSCI is a member of the HSBC Group, one of the largest banking and financial services organisations,in the world. Headquartered in London, HSBC operates through long-established businesses in fiveregions: Europe, Asia-Pacific, Middle East, America and Africa. Through its global network of 10,000offices in 86 countries and territories, HSBC provides a comprehensive range of financial services topersonal, commercial, corporate, institutional investment and private banking clients.
HSCI offers integrated investment banking services, securities and corporate finance & advisory. HSCIis a member of The Bombay Stock Exchange Limited and National Stock Exchange (capital and derivativemarket segments) and is also a category I merchant banker and underwriter registered with Securitiesand Exchange Board of India.
HSCI holds 100% of the paid-up equity share capital of the AMC.
b) HSBC Mutual Fund
HSBC Mutual Fund ("the Mutual Fund" or "the Fund") has been constituted as a Trust in accordancewith the provisions of the Indian Trusts Act, 1882 (2 of 1882) vide a Trust Deed dated February 7,
Trustees' ReportFor the year ended March 31, 2009 (Contd...)

6
2002 with HSBC Securities and Capital Markets (India) Private Limited, as the Sponsor and the Boardof Individual Trustees. The Trustee has entered into an Investment Management Agreement datedFebruary 7, 2002 with HSBC Asset Management (India) Private Limited (the AMC) to function as theInvestment Manager for all the Schemes of the Fund. The Fund was registered with SEBI videregistration number MF/046/02/5 dated May 27, 2002.
The Trust has been formed for the purpose of pooling of capital from the public for collectiveinvestment in securities / any other property for the purpose of providing facilities for participationby persons as beneficiaries in such properties / investments and in the profits / income arising therefrom.
c) Board of Trustees (the Trustees)
The Board of Trustees are the exclusive owner of the Trust Fund and holds the same in trust for thebenefit of the unitholders. The Trustees have been discharging their duties and carrying out theirresponsibilities as provided in the SEBI (Mutual Funds) Regulations, 1996 and the Trust Deed. TheTrustees seeks to ensure that the Fund and the Schemes floated thereunder are managed by theAMC in accordance with the Trust Deed, the said Regulations, directions and guidelines issued bySEBI, the Stock Exchanges, the Association of Mutual Funds of India and other regulatory agencies.
d) Asset Management Company (the AMC)
HSBC Asset Management (India) Private Limited (the Investment Manager or the AMC) is a privatelimited company incorporated under the Companies Act, 1956 on December 12, 2001 having itsRegistered Office at 314, D. N. Road, Fort, Mumbai 400 001. HSBC Asset Management (India) PrivateLimited has been appointed as the Asset Management Company of the HSBC Mutual Fund by theTrustee vide Investment Management Agreement (IMA) dated February 7, 2002 and executed betweenthe Trustees and the AMC. SEBI approved the AMC to act as the Investment Manager of the Fundvide. its letter No. MFD/BC/163/2002 dated May 27, 2002.
The paid-up equity share capital of the AMC is Rs. 9 crores. HSBC Securities and Capital Markets(India) Private Limited holds 100% of the paid-up equity share capital of the AMC.
3. INVESTMENT OBJECTIVE OF THE SCHEMEThe investment objective of the Scheme has been provided above under the heading "SchemePerformance, Future Outlook and Operation of the Scheme" (refer Section 1).
4. SIGNIFICANT ACCOUNTING POLICIESThe accounting policies are in accordance with Securities and Exchange Board of India (Mutual Funds)Regulations, 1996.
5. UNCLAIMED DIVIDENDS & REDEMPTIONSSummary of number of Investors & corresponding amount
Unclaimed Dividends Unclaimed Redemptions
Scheme Amount No. of Amount No. of(Rs.) Investors (Rs.) Investors
HSBC Advantage India Fund 448,485.41 130 866,578.84 62
6. INVESTOR SERVICESDuring the year, the number of official points of acceptance of transactions increased significantly toabout 182 locations. In addition to the offices of the transfer agency, the company has InvestorService Centres in 14 locations at its own offices - namely Mumbai, New Delhi, Kolkata, Chennai,Bangalore, Hyderabad, Pune, Ahmedabad, Indore, Chandigarh, Kochi, Coimbatore, Lucknow andVadodara. With a view to enhancing customer convenience, the Asset Management Company hasextended the facility of crediting investor bank accounts directly by way of NEFT / RTGS (for credit of
Trustees' ReportFor the year ended March 31, 2009 (Contd...)

7
redemption and dividend proceeds). The AMC endeavours to despatch dividend proceeds within 5working days from the Record Date in all Schemes. The internal standards on redemption payoutshave been consistently met, with very few exceptions. The number of locations for the ECS AutoDebit facility for investments through Systematic Investment Plan also increased to about 74 byMarch 2009.
On the distribution front, the number of empanelled distributors increased from 7859 as on 31March, 2008 to 8632 as on 31 March, 2009. During the year, the Asset Management Companyinitiated tie-ups for online distribution of the Mutual Fund's schemes with several channel partnerstaking the total number of such tie-ups to 24 (Angel Capital & Department Market Ltd., Bajaj CapitalLimited, Bonanza Portfolio Limited, Citibank N.A., Citigroup Wealth Advisors India Private Limited,HDFC Bank Limited, Hongkong & Shanghai Banking Corporation Limited, HSBC Corporate InvestmentSolution Services, ICICI Securities Limited, India Infoline Limited, Karvy Stock Broking Limited, KotakMahindra Bank Limited, Kotak Securities Limited, Motilal Oswal Securities Limited, NJ India InvestPrivate Limited, Reliance Securities Limited, RR Investors Capital Services Private Limited, SBICAPSecurities Limited, Sharekhan Limited, SMC Global Securities Limited, Standard Chartered - STCICapital Markets Ltd., Tom Distribution Services Limited, Yes Bank Limited).
Call centre operations have been extended to cover the entire country. The Asset ManagementCompany has outsourced certain back office services including call centre services to HSBC Operationsand Processing Enterprise (India) Private Limited (HOPE).
7. STATUTORY DETAILSa) The Sponsors are not responsible or liable for any loss resulting from the operation of the Schemes
of the Fund beyond initial contribution of Rs. 1 lakh for setting up the Fund.
b) The price and redemption value of the units, and income from them, can go up as well as downwith fluctuations in the market value of its underlying investments.
c) Full / Abridged Annual Report shall be disclosed on the website at www.assetmanagement.hsbc.com/inand shall be available for inspection at the Head Office of the mutual fund. Present and prospectiveunit holder can obtain copy of the trust deed, the Full / Abridged Annual Report of the Scheme(s),the Annual Report of HSBC Asset Management (India) Private Limited and the text of the relevantScheme(s) at a price.
8. ACKNOWLEDGEMENTSThe Trustees wish to thank the Unitholders of the Schemes for their support throughout the year andalso thank the Government of India, the Securities and Exchange Board of India (SEBI), the ReserveBank of India (RBI) and the Association of Mutual Funds in India (AMFI) for the guidance provided bythem. The Trustees also appreciate the service provided by the Registrar and Transfer Agent, FundAccountant, Custodian, Bankers, Distributors and Brokers. The guidance and services provided bythe Auditors and advocates and the ebullience, sincerity and dedication of the employees of HSBCAsset Management (India) Private Limited is also appreciated.
The Trustees look forward to the continued support of everyone.
For and on behalf of the Board of Trustees of HSBC Mutual Fund
Dilip J. Thakkar
Trustee
MUMBAIJuly 6, 2009
Trustees' ReportFor the year ended March 31, 2009 (Contd...)
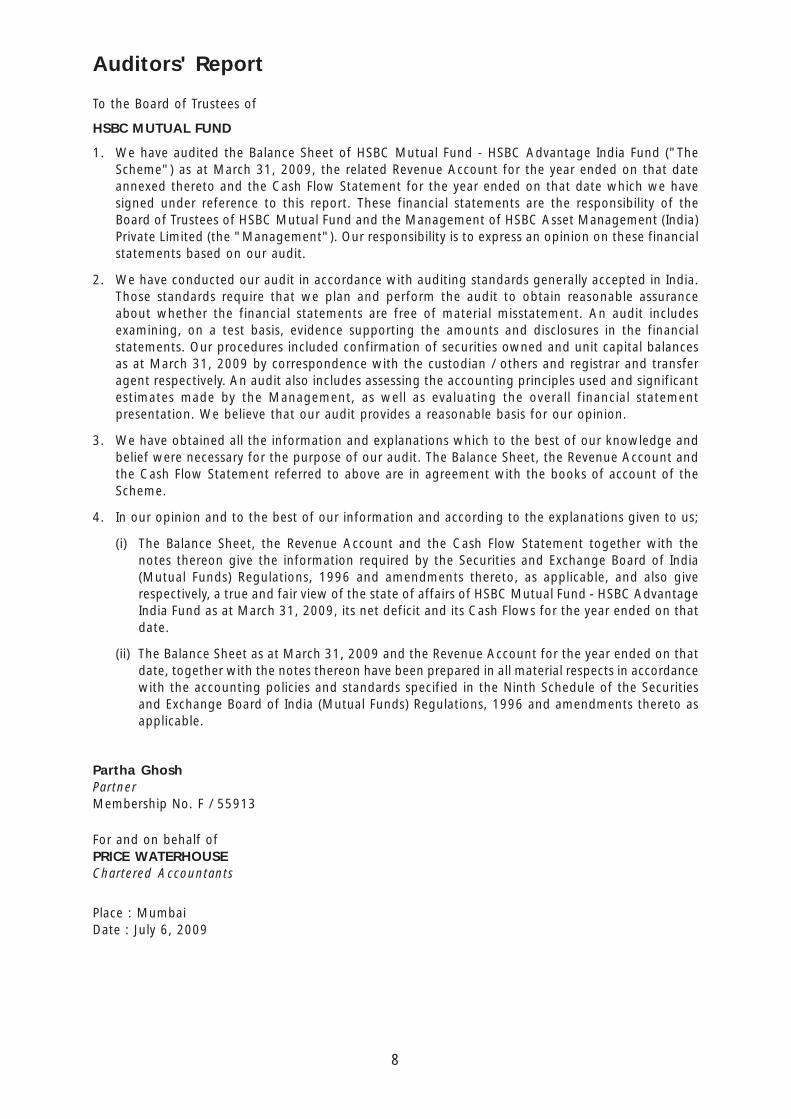
8
To the Board of Trustees of
HSBC MUTUAL FUND
1. We have audited the Balance Sheet of HSBC Mutual Fund - HSBC Advantage India Fund ("TheScheme") as at March 31, 2009, the related Revenue Account for the year ended on that dateannexed thereto and the Cash Flow Statement for the year ended on that date which we havesigned under reference to this report. These financial statements are the responsibility of theBoard of Trustees of HSBC Mutual Fund and the Management of HSBC Asset Management (India)Private Limited (the "Management"). Our responsibility is to express an opinion on these financialstatements based on our audit.
2. We have conducted our audit in accordance with auditing standards generally accepted in India.Those standards require that we plan and perform the audit to obtain reasonable assuranceabout whether the financial statements are free of material misstatement. An audit includesexamining, on a test basis, evidence supporting the amounts and disclosures in the financialstatements. Our procedures included confirmation of securities owned and unit capital balancesas at March 31, 2009 by correspondence with the custodian / others and registrar and transferagent respectively. An audit also includes assessing the accounting principles used and significantestimates made by the Management, as well as evaluating the overall financial statementpresentation. We believe that our audit provides a reasonable basis for our opinion.
3. We have obtained all the information and explanations which to the best of our knowledge andbelief were necessary for the purpose of our audit. The Balance Sheet, the Revenue Account andthe Cash Flow Statement referred to above are in agreement with the books of account of theScheme.
4. In our opinion and to the best of our information and according to the explanations given to us;
(i) The Balance Sheet, the Revenue Account and the Cash Flow Statement together with thenotes thereon give the information required by the Securities and Exchange Board of India(Mutual Funds) Regulations, 1996 and amendments thereto, as applicable, and also giverespectively, a true and fair view of the state of affairs of HSBC Mutual Fund - HSBC AdvantageIndia Fund as at March 31, 2009, its net deficit and its Cash Flows for the year ended on thatdate.
(ii) The Balance Sheet as at March 31, 2009 and the Revenue Account for the year ended on thatdate, together with the notes thereon have been prepared in all material respects in accordancewith the accounting policies and standards specified in the Ninth Schedule of the Securitiesand Exchange Board of India (Mutual Funds) Regulations, 1996 and amendments thereto asapplicable.
Partha GhoshPartnerMembership No. F / 55913
For and on behalf ofPRICE WATERHOUSEChartered Accountants
Place : MumbaiDate : July 6, 2009
Auditors' Report

9
Rs. in Lakhs
HSBC ADVANTAGE INDIA FUND
As at As atMarch 31, 2009 March 31, 2008
LIABILITIES1 Unit Capital 46,572.80 51,229.09
2 Reserves & Surplus2.1 Unit Premium Reserves (21,788.97) (21,642.33)2.2 Unrealised Appreciation Reserve 6.06 2,094.292.3 Other Reserves 10,965.28 39,549.753 Loans & Borrowings – –4 Current Liabilities & Provisions4.1 Provision for doubtful Income/Deposits – –4.2 Other Current Liabilities & Provisions 656.75 1,078.86
TOTAL 36,411.92 72,309.66
ASSETS1 Investments1.1. Listed Securities:1.1.1 Equity Shares 28,504.02 62,092.521.1.2 Preference Shares – –1.1.3 Equity Linked Debentures – –1.1.4 Other Debentures & Bonds – –1.1.5 Securitised Debt securities – –1.2 Securities Awaited Listing:1.2.1 Equity Shares – –1.2.2 Preference Shares – –1.2.3 Equity Linked Debentures – –1.2.4 Other Debentures & Bonds – –1.2.5 Securitised Debt securities – –1.3 Unlisted Securities:1.3.1 Equity Shares – –1.3.2 Preference Shares – –1.3.3 Equity Linked Debentures – –1.3.4 Other Debentures & Bonds – –1.3.5 Securitised Debt securities – –1.4 Government Securities – –1.5 Treasury Bills – –1.6 Commercial Paper – –1.7 Certificate of Deposits – –1.8 Bill Rediscounting – –1.9 Units of Domestic Mutual Fund – –1.10 Foreign Securities – –
Total Investments 28,504.02 62,092.52
2 Deposits 3,162.50 2,512.503 Other Current Assets3.1 Cash & Bank Balance 28.74 74.083.2 CBLO / Reverse Repo Lending 3,291.64 4,844.373.3 Others 1,208.12 2,422.254 Deferred Revenue Expenditure 216.90 363.94
(to the extent not written off)
TOTAL 36,411.92 72,309.66
Notes to Accounts - Annexure I
Abridged Balance Sheet as at March 31, 2009

10
Rs. in Lakhs
HSBC ADVANTAGE INDIA FUND
Current PreviousYear ended Year ended
March 31, 2009 March 31, 2008
1 INCOME1.1 Dividend 483.28 330.721.2 Interest 453.63 421.091.3 Realised Gain / (Loss) on Foreign Exchange Transactions – –1.4 Realised Gains / (Losses) on Interscheme sale of investments 0.18 –1.5 Realised Gains / (Losses) on External sale / redemption of
investments (21,835.57) 32,968.801.6 Realised Gains / (Losses) on Derivative Transactions 453.39 (874.47)1.7 Other Income – –
(A) (20,445.09) 32,846.14
2 EXPENSES2.1 Management fees 484.42 936.942.2 Service tax on Management fees ** – –2.3 Transfer agents fees and expenses 99.75 141.092.4 Custodian fees 29.06 45.172.5 Trusteeship fees 0.21 0.322.6 Commission to Agents * – –2.7 Marketing & Distribution expenses 384.25 564.362.8 Audit fees 5.50 7.502.9 Other operating expenses 253.83 744.58
(B) 1,257.02 2,439.963 NET REALISED GAINS / (LOSSES) FOR
THE YEAR / PERIOD (A - B = C) (21,702.11) 30,406.184 Change in Unrealised Depreciation in
value of investments (D) 4,115.64 –5 NET GAINS / (LOSSES) FOR THE
YEAR / PERIOD [E = (C - D)] (25,817.75) 30,406.186 Change in unrealised appreciation
in the value of investments (F) (2,088.22) (5,300.50)7 NET SURPLUS / (DEFICIT) FOR
THE YEAR / PERIOD (E + F = G) (27,905.97) 25,105.697.1 Add: Balance transfer from Unrealised
Appreciation Reserve 2,088.22 5,300.507.2 Less: Balance transfer to Unrealised Appreciation Reserve – –7.3 Add / (Less): Equalisation (84.87) (3,944.85)7.4 Transfer from Reserve Fund 17,246.54 10,305.517.5 Transfer from Unit Premium Reserve – –
8 TOTAL (8,656.08) 36,766.849 Dividend Appropriation9.1 Income Distributed during the year / period 2,681.85 4,992.659.2 Tax on income distributed during the year / period – –
10 Retained Surplus / (Deficit) carried forwardto Balance Sheet (11,337.93) 31,774.19
Notes to Accounts - Annexure I
* Commission to Agents is included in Marketing & Distribution Expenses.** Service Tax on Management Fees is included in Other Operating Expenses.
Abridged Revenue Account for the year ended March 31, 2009

11
HSBC ADVANTAGE INDIA FUND
Current PreviousYear ended Year ended
March 31, 2009 March 31, 2008
1. NAV per unit (Rs.):
Open
Regular Growth Option 14.5446 11.7355
Regular Dividend Option 13.3555 11.7355
High
Regular Growth Option 15.8630 21.5149
Regular Dividend Option 14.5658 19.7554
Low
Regular Growth Option 7.4998 11.3051
Regular Dividend Option 6.3796 11.2390
End
Regular Growth Option 8.3228 14.5446
Regular Dividend Option 7.0792 13.3555
2. Closing Assets Under Management (Rs. in Lakhs)
End 35,755 71,231
Average (AAuM)1 49,971 94,383
3. Gross income as % of AAuM2 -40.91% 34.80%
4. Expense Ratio:
a. Total Expense as % of AAuM (planwise)
Regular Growth Option 2.22% 2.58%
Regular Dividend Option 2.22% 2.59%
b. Management Fee as % of AAuM (planwise)
Regular Growth Option 0.97% 0.99%
Regular Dividend Option 0.97% 0.99%
5. Net Income as a percentage of AAuM3 -43.43% 32.22%
6. Portfolio turnover ratio4 1.34 1.95
7. Total Dividend per unit distributedduring the year / period (planwise)
Retail
Regular Dividend Option 1.00 1.00
Corporate
Regular Dividend Option 1.00 1.00
Key Statistics for the year ended March 31, 2009

12
8. Returns:
a. Last One Year
Scheme
Regular Growth Option (42.7774) 23.7720
Regular Dividend Option (42.8257) 23.7654
Benchmark
BSE 200 (40.9800) 24.1334
b. Since Inception
Scheme
Regular Growth Option (5.7477) 19.5161
Regular Dividend Option (5.7750) 19.5131
Benchmark
BSE 200 (3.6400) 21.6785
1 AAuM = Average daily net assets
2 Gross income = amount against (A) in the Revenue Account i.e. Income.
3 Net income = amount against (C) in the Revenue account i.e. NET REALISED GAINS / (LOSSES)FOR THE YEAR / PERIOD
4 Portfolio Turnover = Lower of sales or purchase divided by the Average AuM for the year / period.
Key Statistics for the year ended March 31, 2009 (Contd...)
HSBC ADVANTAGE INDIA FUND
Current PreviousYear ended Year ended
March 31, 2009 March 31, 2008

13
HSBC ADVANTAGE INDIA FUND
1 Investments
1.1. It is confirmed that investments of the schemes are registered in the name of the Trustees forthe benefit of the scheme's unitholders.
1.2. Open Positions of derivatives amount to Rs. (32,362,600) and 0.91% to Net Assets as ofyear end 31 March, 2009. Open Positions of derivatives amount to Rs. 251,501,238 and3.53% to Net Assets as of year end 31 March, 2008.
1.3. Investments in Associates and Group Companies(Rupees)
Issuer Instrument Amount Aggregate Amount AggregateType Investments Investments
by all schemes by all schemes
2009 2008
The Hongkong & Fixed deposits – 43,000,000 – 1,654,000,000Shanghai BankingCorporation Ltd.
1.4. Open positions of Securities Borrowed and / or Lent by the scheme as of the year endedMarch 31, 2009 and March 31, 2008 is NIL.
1.5. NPAs as at years ended March 31, 2009 and March 31, 2008 are NIL.
1.6. Aggregate Unrealised Gain / Loss as at the end of the Financial year 2008 -2009 andpercentage to net assets.
Company Amount (Rs.) Percentage to Amount (Rs.) Percentage toName Net Assets Net Assets
2009 2008
Equity Shares
– Appreciation 78,574,286 2.1976% 921,690,431 12.9395%
– Depreciation 490,138,560 13.7082% 716,298,314 10.0560%
Equity Futures
– Appreciation 610,412 0.0171% 5,784,568 0.0812%
– Depreciation 3,982 0.0001% 1,748,049 0.02454%
1.7. The aggregate value of investments purchased (excluding accretion of discount of Rs. 667,794)and sold (including matured) during the financial year 2008-2009 is 7,016,898,573 and7,575,919,895 respectively being 140.42% and 151.61% of the average daily net assets.
The aggregate value of investments purchased (excluding accretion of discount of Rs.149,299)and sold (including matured) during the financial year 2007-2008 is 11,379,552,125 and18,596,912,853 respectively being 120.57% and 197.04% of the average daily net assets.
1.8. Non-Traded securities in the portfolio:
Aggregate Value of Equity, Debt & Money Market Instruments and percentage to net assetsis as under
Security Fair Value % to Net Fair Value % to NetCategory (Rs.) Assets (Rs.) Assets
2009 2008
Equities – – 13,853,800.00 0.1945
Money marketInstruments – – – –
Total – – 13,853,800.00 0.1945
Notes to Accounts - Annexure ITo the Abridged Balance Sheet and Revenue Account for the year ended March 31, 2009

14
Notes to Accounts - Annexure I (Contd...)To the Abridged Balance Sheet and Revenue Account for the year ended March 31, 2009
2 Disclosure under Regulation 25(8) of the Securities and Exchange Board of India (Mutual Funds)Regulations, 1996 as amended for the year ended March 31, 2009 is as under :
Year – 2008-2009During the year, HSBC Securities and Capital Markets (India) Private Limited, the Sponsor waspaid brokerage aggregating Rs. 776,506 on purchase and sale of investments. The Hongkongand Shanghai Banking Corporation Limited, an associate entity of HSBC Asset Management (India)Private Limited was paid collection/bank charges amounting to Rs. 1,220,316, brokerageamounting to Rs. 7,349,775 for procuring unit subscriptions for the Scheme and clearing membercharges on derivative transactions Rs 2,493. The brokerage paid was at rates similar to thoseoffered to other brokers / distributors.
Year – 2007-2008During the year, HSBC Securities and Capital Markets (India) Private Limited, the Sponsor waspaid brokerage aggregating Rs. 1,682,000 on purchase and sale of investments. The Hongkongand Shanghai Banking Corporation Limited, an associate entity of HSBC Asset Management (India)Private Limited was paid collection/bank charges amounting to Rs. 110,292, brokerage amountingto Rs. 22,388,210 for procuring Unit subscriptions for the Scheme and clearing member chargeson derivative transactions Rs. 1,289,244. The brokerage paid was at rates similar to those offeredto other brokers / distributors.
3 None of the Investors held more than 25% of the total net assets of the scheme at the yearended March 31, 2009 and March 31, 2008.
4 Unit Capital movement during the years ended March 31, 2009 and March 31, 2008.
2008-2009
Description Opening Units Subscription Redemption Closing Units Face Value
RegularGrowth Option 236,466,762.306 25,953,833.730 38,438,614.170 223,981,981.866 2,239,819,818.66
RegularDividend Option 275,824,146.002 19,656,412.037 53,734,565.078 241,745,992.961 2,417,459,929.61
2007-2008
Description Opening Units Subscription Redemption Closing Units Face Value
RegularGrowth Option 404,829,118.856 67,954,006.572 236,316,363.122 236,466,762.306 2,364,667,623.06
RegularDividend Option 581,716,799.865 53,544,039.938 359,436,693.801 275,824,146.002 2,758,241,460.02
5 Previous year’s figures have been re-grouped / re-arranged where appropriate.
6 No contingent liabilities for the years ended March 31, 2009 and March 31, 2008.
7 Expenses other than Management Fees are inclusive of Service Tax where applicable.
8 The Annual Accounts of the Schemes prepared in accordance with the accounting policies andstandards specified in the Ninth Schedule of The Securities and Exchange Board of India (MutualFunds) Regulations, 1996 has been approved by the Board of Directors of HSBC Asset Management(India) Private Limited and The Board of Trustees of HSBC Mutual Fund at their meeting held onJuly 06, 2009. The audit report attached herewith refers to the said annual accounts. The aforesaidabridged accounts are an extract of the Annual Accounts and are prepared in accordance withSEBI Circular No. IMD/Cir 8/132968/2008 dated July 24, 2008.

15
DISCLAIMERSThe content of this report has been prepared by HSBC Asset Management (India) Private Limited(HSBC) for information purposes only and should not be construed as an offer or solicitation of anoffer for purchase of any of the funds of HSBC Mutual Fund. The information is for general informationonly and does not have regard to specific investment objectives, financial situation and the particularneeds of any specific person who may receive this information. Investments in mutual funds inherentlyinvolve risks and investors should read the relevant documents / information for details and riskfactors and consult their legal, tax and financial advisors before investing. Investors should understandthat statements made herein regarding future prospects may not be realised. Neither this documentnor the units of HSBC Mutual Fund have been registered in any jurisdiction. The distribution of thisdocument in certain jurisdictions may be restricted or totally prohibited and accordingly, personswho come into possession of this document are required to inform themselves about, and to observe,any such restrictions.
Investors may obtain Statement of Additional Information, Combined Scheme Information Documentand Common Key Information Memorandums along with application forms from the office of HSBCMutual Fund, 314, D. N. Road, Fort, Mumbai 400 001. Tel: 022-6666 8819.
Statutory Details:HSBC Mutual Fund has been set up as a trust by HSBC Securities and Capital Markets (India) PrivateLimited (liability restricted to the corpus of Rs. 1 lakh). The Sponsor/associates of the Sponsor/AssetManagement Company (AMC) are not responsible or liable for any loss or shortfall resulting from theoperation of the Schemes. The Trustees of HSBC Mutual Fund have appointed HSBC Asset Management(India) Private Limited as the Investment Manager.
Risk Factors:All investments in mutual funds and securities are subject to market risks and the Net Asset Value(NAV) of the Scheme(s) may go up or down depending on the factors and forces affecting the securitiesmarkets. There can be no assurance that the objectives of the Scheme(s) will be achieved. Pastperformance of the Sponsor, AMC, Mutual Fund or any associates of the Sponsor/AMC does notindicate the future performance of the Scheme(s) of the Mutual Fund. HSBC Progressive ThemesFund (HPTF) is the names of the Scheme and does not in any manner indicate the quality of theScheme or its future prospects or returns.
Terms of Issue:Units of the Scheme(s) are being offered at NAV based prices, subject to the prevailing loads. TheAMC calculates and publishes NAVs and offers for sale, redemption and switch outs, units of theScheme(s) on all Business Days, at the Applicable NAV for all Schemes (at least once a week, i.e.,every Wednesday and daily during the period of redemption in case of HSCF). HUOF, HSCF & HFTSwill not be open for ongoing subscriptions/ switch ins. HUOF & HSCF would be available for sale onan ongoing basis (after a period of 3 years from the date of allotment). Conversion of HUOF & HSCFto an open-ended scheme will be done only after the balance unamortized amount has been fullyrecovered from the Scheme. Units can be redeemed/switched out on every Business Day at NAVbased prices, subject to prevailing exit loads. In case of HSCF, units can be redeemed / switched outon a monthly basis on the stipulated date i.e. last 3 business days of every month at NAV basedprices, subject to provisions of exit load, if any and recovery of balance proportionate unamortizedNFO expenses.
Load Structure (includes SIP/STP):Entry - 2.25% for investments / switch ins* < Rs. 5 crores, otherwise Nil.
Exit - 1% for < Rs. 5 crores, if redeemed/switched out* within 1 year from date of investment,otherwise Nil.
*No load in case of switches between equity Schemes of HSBC Mutual Fund.
Consult the nearest investor service centre for details.
The entry / exit load set forth above is subject to change at the discretion of the AMC and suchchanges shall be implemented prospectively.

Mutual Fund investments are subject to market risks. Please read the Statement of AdditionalInformation and Scheme Information Document carefully before investing.
Value Research Online DisclaimerValue Research Fund Ratings: Value Research Fund Ratings are a composite measure of historical risk-adjusted returns. In the case of equity funds this rating is based on the average monthly returns forthe last 3-year and 5-year period. These ratings do not take into account any entry or exit load.
Value Research Fund Ratings are subject to change every month. Current Fund Ratings are as onMarch 31, 2009. 142 open-ended Equity: Diversified Funds were rated. The Rating is based on primarydata provided by respective funds; Value Research does not guarantee the accuracy. Ranking Entity:Value Research Online.
ICRA Online Ranking MethodologyHSBC Monthly Income - Savings Plan has been ranked as a Five Star Fund in the category of 'OpenEnded Marginal Equity' schemes for its 3 year performance till December 31, 2008.
The rank is an outcome of an objective and comparative analysis against various parameters, including:risk adjusted return, fund size, company concentration, portfolio turnover and liquidity. The rankingmethodology did not take into account entry and exit loads imposed by the Fund. There were 27schemes considered in 'Open Ended Marginal Equity' category for the ranking exercise. The rank isneither a certificate of statutory compliance nor any guarantee on the future performance of HSBCMonthly Income - Savings Plan. Ranking Source & Publisher: ICRA Online Limited.
CRISIL Ranking MethodologyThe selection for the awards is based on the CRISIL FundServices' Composite Performance Ranking(CRISIL~CPR) methodology.
The CRISIL Composite Performance Ranking (CRISIL~CPR) is a quarterly ranking of mutual fund schemesbased on two year performance (excepting for the liquid and short term debt categories where a oneyear performance horizon is considered). The methodology is based on global best practices,customized to account for Indian market nuances. Over time, the rankings have become the industrystandard with good acceptance among Investors, Fund Intermediaries, Asset Management Companies,etc. The performance criteria covers not only risk adjusted returns, which are historical, but also theportfolio constitution to make the analysis forward looking.
CRISIL DisclaimerThe overall ranking is assigned to the scheme based on its weighted average score on a range ofparameters: Superior Return Score, Concentration, Liquidity, Asset Quality - Measures the creditquality of the portfolio, Average Maturity and Asset Size. HSBC MIP - Savings was the only schemethat won the CNBC TV18 - CRISIL Mutual Fund of the Year Award in the Category - Monthly IncomePlans - Aggressive. In total 13 schemes were eligible for the award universe. Schemes present in allfour quarterly CRISIL CPRs were considered for the award. The award is based on consistency of thescheme's performance in the four quarterly CRISIL CPR rankings released during the calendar year2008. The individual CRISIL CPR parameter scores averaged for the four quarters were further multipliedby the parameter weights as per the CRISIL CPR methodology to arrive at the final scores. A detailedmethodology of the CRISIL CPR is available at www.crisil.com. Past performance is no guarantee offuture results. Rankings and Award Source: CRISIL Fund Services, CRISIL Ltd. HSBC Monthly Income -Savings Plan has been ranked as a Five Star Fund in the category of 'Open Ended Marginal Equity'schemes for its 3 year performance till December 31, 2008. The rank is an outcome of an objectiveand comparative analysis against various parameters, including: risk adjusted return, fund size,company concentration, portfolio turnover and liquidity. The ranking methodology did not take intoaccount entry and exit loads imposed by the Fund. There were 27 schemes considered in 'OpenEnded Marginal Equity' category for the ranking exercise. The rank is neither a certificate of statutorycompliance nor any guarantee on the future performance of HSBC Monthly Income - Savings Plan.Ranking Source & Publisher: ICRA Online Limited.
16

Issued by HSBC Asset Management (India) Private Limited
HSBC Global Asset Management
HSBC Tax Saver Equity FundAn open-ended Equity Linked Savings Scheme
Abridged Annual Report 2008 - 2009

1
Dear Investor,
We thank you for investing with HSBC Mutual Fund. We are pleased to inform you that HSBCMutual Fund has won prestigious awards* this year at various forums in India.
The awards* won by our schemes in India are
� HSBC Equity Fund has been included in the 5 star rated fund category (“Top rated mutualfunds” by Value Research online) in March, 2009.
� Five-stars indicate that a fund is in the top 10 per cent of its category in terms ofhistorical risk-adjusted returns.
� ICRA Mutual Fund Awards 2009
� HSBC MIP - Savings has been ranked a 5-Star Fund by ICRA Online indicating performanceamong the top 10% in the category of 'Open Ended Marginal Equity' for 3 yearperformance ending 31 December, 2008.
� CNBC TV18 - CRISIL Mutual Fund Awards 2008
� HSBC MIP - Savings was awarded the CNBC TV18 - CRISIL Mutual Fund of the YearAward for the year 2008 in the Monthly Income Plans - Aggressive Category.
(Past performance is no guarantee of future results. * Please refer to Ranking methodologyand disclaimer mentioned at the end of the Abridged Annual Report for the year endedMarch 31, 2009).
At the global level, the HSBC Group won several awards at Euromoney's Awards for Excellence2009. The top awards that HSBC won were the Best Global Bank and the Best Global DebtHouse. It was also honoured as the Best Debt House in 8 locations including Asia and the Bestat Risk Management in Asia. (Past performance may or may not be sustained in the future andis no guarantee of future results). We continue to be one of the leading players in emergingmarkets and remain committed to our asset management business in India.
HSBC Asset Management (India) Private Limited including the mutual fund business as well asthe PMS business (including EPFO money deployed till date) manages assets of about Rs. 26280Crores as at 30 June, 2009. The core to our winning strategy is our endeavour to deliverconsistent performance over the medium to long term for our investors in a risk controlledenvironment and aim for consistent wealth creation under varying market conditions. Throughour product range, we aim to be true to our reputation in India of being a provider ofinternational quality investment products and services.
We remain committed to our philosophy of aiming for consistent wealth creation and serviceexcellence and look forward to your continued investments in HSBC Mutual Fund.
Yours sincerely,
VikramaadityaChief Executive OfficerHSBC Asset Management (India) Private Limited

2
SPONSORHSBC Securities and Capital Markets (India) Private LimitedRegd. Office: 52/60, Mahatma Gandhi Road, Fort, Mumbai 400 001.
TRUSTEEBoard of TrusteesOffice: 314, D. N. Road, Fort, Mumbai 400 001.
ASSET MANAGEMENT COMPANYHSBC Asset Management (India) Private LimitedCorp. & Regd. Office: 314, D. N. Road, Fort, Mumbai 400 001.
CUSTODIANJP Morgan Chase BankCorp. & Regd. Office: Mafatlal Centre, 9th Floor, Nariman Point, Mumbai - 400 021.
AUDITORS TO THE SCHEMEPrice WaterhouseChartered Accountants252, Veer Savarkar Marg, Shivaji Park, Dadar (West), Mumbai - 400 028.
LEGAL ADVISORSBharucha & Partners4th Floor, Cecil Court, Mahakavi Bhushan Marg, Colaba, Mumbai - 400 039.
REGISTRAR & TRANSFER AGENTSComputer Age Management Services (P) Ltd. (CAMS)Rayala Towers, Tower I, III Floor, 158 Anna Salai, Chennai - 600 002.
BOARD OF TRUSTEESMr. N. P. Gidwani - Chairman
Dr. Rudolf ApenbrinkMr. Nasser MunjeeMr. Manu TandonMr. Mehli MistriMr. Dilip J. Thakkar
BOARD OF DIRECTORSMs. Naina Lal Kidwai - Chairman
Mr. Ayaz EbrahimMr. S. P. Mustafa**Mr. Vithal PalekarMs. Kishori J. Udeshi*Mr. Vikramaaditya - Chief Executive Officer***
* Ms. Kishori Udeshi has been appointed as a Director with effect from 14 January 2009 andMr. Jagjit Lal Pasricha has resigned as a Director with effect from 19 January 2009.
** Mr. S. P. Mustafa has been appointed as a Director with effect from 2 September 2008 andMr. Nawshir Khurody has resigned as a Director with effect from 1 September 2008
*** Mr. Vikramaaditya has been appointed as the Chief Executive Officer with effect from 16 July 2008and Mr. Sanjay Prakash has resigned as the Chief Executive Officer with effect from 16 July 2008.

3
Trustees' ReportFor the year ended March 31, 2009
The Trustees present the seventh report and the audited financial statements of the Schemesof HSBC Mutual Fund (the "Fund"), for the year ended March 31, 2009.
1. SCHEME PERFORMANCE, FUTURE OUTLOOK AND OPERATIONS OF THE SCHEME
a) Operations and Performance of the Scheme
HSBC Tax Saver Equity Fund (HTSF) - an open ended Equity linked Savings Scheme
HTSF seeks to provide long term capital appreciation by investing in a diversified portfolio ofequity & equity related instruments of companies across various sectors and industries, with nocapitalisation bias. The Fund may also invest in fixed income securities.
The net assets of HSBC Tax Saver Equity Fund amounted to Rs. 180.58 crores as at March 31,2009 compared to Rs. 227.83 crores as at March 31, 2008. 82.77% of the net assets wereinvested in equities and 17.23% were invested in debt and money market instruments as atMarch 31, 2009.
HTSF outperformed its benchmark by 1088 bps on the back of a defensive portfolio and higherlevels of cash than the normal.
Date of Inception : 5 January, 2007 Compounded Annualized Returns (%)
Schemes (P2P) 1 Year Since Inception
HSBC Tax Saver Equity Fund - Growth -30.10 -12.76
BSE 200 -40.98 -15.54
Past performance may or may not be sustained in future. 'Since inception' returns are calculatedon Rs. 10 invested at inception. Calculations are based on Growth NAVs.
b) Market Overview & Outlook
MARKET OVERVIEW
(as furnished by HSBC Asset Management (India) Private Limited)
Equity Market Overview
The financial year ended 31 March, 2009 was a highly eventful one with long standing institutionsdisappearing from the landscape in the whirlwind of the sub-prime crisis and derivative losses. Theyear can be split into three phases - the first from April 2008 till when Lehman Brothers filed forbankruptcy, which saw a blowout commodity rally (crude oil nudged close to USD 144/barrel) andthe sub-prime situation turning progressively worse. The United States (US) Government / FederalReserve bailed out major institutions thought to be critical to the functioning of the financial system.The second phase from September 2008 till January 2009 saw a spate of bankruptcies most notablyLehman Brothers which saw the appearance of an acute level of risk aversion pushing the creditmarkets into a gridlock. This phase also coincided with the fiscal / monetary stimuli by variousgovernments to take the credit crisis head on. Globally, markets stabilized around their October2008 lows and a semblance of normality started re-appearing in financial markets in this period. Thethird phase from February 2009 onwards witnessed a sharp rally as a weakening US Dollar spewedmoney into emerging markets. The sensex fell by 38% during the financial year.
For the financial year 2009, the popular indices viz. BSE Sensex and CNX Nifty were down 37.94%and 36.19% respectively. The BSE Midcap (54.01)% and the broader indices like BSE 200 (40.98)%

4
and BSE 500 (42.77)% also reflected the correction across the markets. Within sectoral indices thebest performing indices were BSE FMCG (11.08)% and BSE Oil and Gas (29.58)% while the worstperforming indices were BSE Realty (79.37)%, due to the high leverage on the balance sheets, BSEMetals (58.67)%, due to slowdown in global growth and BSE Consumer Durables (58.14)% and BSECapital goods (53.84%).
In a year that saw sell-off across emerging markets, FIIs were net sellers of the tune USD 10.4 billionin the Indian equity markets while Domestic Institutional Investors (Insurance & Mutual Funds) werebuyers to the tune of USD 13.1 billion. Further, FIIs were net sellers in the derivative markets ashedge funds, and p-notes unwound positions in a rapidly deleveraging world. Thus, sentimentremained negative as few US based investment banks filed for bankruptcy in the midst of the liquidityand credit crisis and safety took precedence over growth.
Debt Market Overview
Two contrarian forces one inflationary and the other deflationary had been in play since 2007: Onthe one hand strong demand from emerging economies were leading commodities higher and fuellinginflation, while on the other the housing led credit crisis in the US was starting to exert a deflationaryforce. The first force was dominant till early July 2008 leading commodity prices to fresh peaks andinflation to multi year highs. Since then, however, the second force took hold with the result thatcommodity prices fell sharply from the top, growth and inflation numbers toppled worldwide, andcentral bankers shifted focus to achieving financial stability and protecting growth.
The financial crisis hit the domestic markets towards September 2008, leading to acute disruption inmoney markets. The Reserve Bank of India (RBI) acted proactively cutting the cash reserve ratio (CRR)by an unprecedented 400 bps between September 2008 and January 2009. Similarly, the reverserepo rate had been cut by 275 bps since October 2008 while the repo rate had been cut by 425 bpsover the same period.
Bond market yields fell in line with the unprecedented monetary easing up till the first week ofJanuary 2009. Thereon, supply pressures on bond markets rose as a result of government fiscalslippages aimed at stimulating the economy. The RBI, in line with similar measures elsewhere in theworld, started buying government securities to lessen the impact on yields from the rise in governmentborrowing. Although this helped market sentiment, it could not prevent a general rise in yieldstowards fiscal close. As a result, the 10 year benchmark sovereign yield closed the fiscal at 7% froma low of sub 5% hit in early January 2009. Money market rates stabilized after the initial mayhem ofSeptember 2008 and October 2008 and liquidity came back to interbank markets.
MARKET OUTLOOK
(as furnished by HSBC Asset Management (India) Private Limited)
Equity Market Outlook
Financial Year (FY) 2008-09 was a year marked by a strong correlation between the Indian marketand global markets with key indices ending deeply in the red on the back of the subprime crisis andderivative led losses across major financial stocks in the United States (US). Even in India, forex lossesran across corporate India though at a smaller magnitude. FY 10 has begun on a better note onaccount of various fundamental and technical factors.
GDP for FY 09 grew at 6.7% against FY 08 levels of 9%. Agriculture posted a below trend growthrate of 1.6% and industry grew by 3.9% (versus 8.1% in FY 08) with services registering a close to9.7% growth. IIP grew by a mere 2.6%. Although order books of engineering / capital goods wererunning at record high levels, there was possibility of delays in execution as funding sources for thedevelopers (equity, ECB, private equity, FCCB) had dried up. A sharp increase in subsidy on accountof oil, fertilizers and food led to a cut back in discretionary spending. Inflation rose on the back of a
Trustees' ReportFor the year ended March 31, 2009 (Contd...)

5
surging crude and higher prices of agricultural commodities to top at 12.91% for the week ending 2August, 2008. A slow down in the growth rates in the US / EU and other markets finally tamed thesurge in crude. As growth rates stumbled, governments / monetary authorities the world over triggeredfiscal stimuli / monetary easing to escape recessionary forces. This was followed in India as wellwhich started monetary easing / fiscal stimuli to keep growth rates buoyant.
On the positive side, India continues to do better in relative terms and we expect GDP growth of6-6.5% for FY10. The broad themes that are driving domestic growth viz. capital expenditure,infrastructure building and domestic consumption are still intact. The key concerns at this pointstems from a ballooning fiscal deficit at the consolidated level (Centre & State) with salary revisionfor Central / State Government employees threatening a cut back in discretionary spending. Inflationis likely to remain benign for the first half of FY10 on a favourable base effect but we anticipate it togo back to trend levels of 5-5.5% for the second half of FY10 as this base effect wears off.
On a valuations perspective, the markets are currently trading at a P/E ratio of around 12 timesFY 2010 earnings. This is well below the 10-year average given the extreme risk aversion prevailing inthe markets. However, the underlying growth in the economy and corporate earnings growth (15%in the long term) makes the market attractive from a longer-term view. The short term could seeenhanced volatility arising from various factors. Increase in commodity prices continues to be a riskin the medium term as the US dollar continues to struggle with the ballooning US fiscal situation.
Debt Market Outlook
Excess supply of government bonds, as a result of fiscal slippages to arrest the downward growthmomentum, has been a reality for bond markets since January 2009. However, this is now compoundedwith some fatigue in buying longer duration as economic data is showing signs of recovery,commodities are showing signs of rally and expectations of incremental monetary easing from theRBI are beginning to unwind. However, system liquidity remains surplus and bank deposits continueto grow thereby providing resistance to bond yields from rising sharply.
Given the above factors, we believe that the market would continue to provide tactical opportunitiesalthough the fundamental bias should be for lower duration. Also, any mitigation of bond supplypressure or a new downturn in the ongoing economic recovery may provide space for opportunisticlonger duration plays. On the other hand, if the recovery cycle continues uninterrupted and commodityprices remain firm, central banks may start to worry about withdrawing the current monetary stimulusby sometime early 2010; with consequent impact on bond markets.
2. BRIEF BACKGROUND OF SPONSORS, BOARD OF TRUSTEES AND ASSETMANAGEMENT COMPANY
a) Sponsor
HSBC Mutual Fund is sponsored by HSBC Securities and Capital Markets (India) Private Limited (HSCI).The Sponsor is the Settler of the Mutual Fund Trust. The Sponsor has entrusted a sum of Rs. 1,00,000(Rupees One Lakh only) to the Trustee as the initial contribution towards the corpus of the MutualFund.
HSCI is a member of the HSBC Group, one of the largest banking and financial services organisations,in the world. Headquartered in London, HSBC operates through long-established businesses in fiveregions: Europe, Asia-Pacific, Middle East, America and Africa. Through its global network of 10,000offices in 86 countries and territories, HSBC provides a comprehensive range of financial services topersonal, commercial, corporate, institutional investment and private banking clients.
HSCI offers integrated investment banking services, securities and corporate finance & advisory. HSCIis a member of The Bombay Stock Exchange Limited and National Stock Exchange (capital and derivativemarket segments) and is also a category I merchant banker and underwriter registered with Securitiesand Exchange Board of India.
HSCI holds 100% of the paid-up equity share capital of the AMC.
Trustees' ReportFor the year ended March 31, 2009 (Contd...)

6
b) HSBC Mutual Fund
HSBC Mutual Fund ("the Mutual Fund" or "the Fund") has been constituted as a Trust in accordancewith the provisions of the Indian Trusts Act, 1882 (2 of 1882) vide a Trust Deed dated February 7,2002 with HSBC Securities and Capital Markets (India) Private Limited, as the Sponsor and the Boardof Individual Trustees. The Trustee has entered into an Investment Management Agreement datedFebruary 7, 2002 with HSBC Asset Management (India) Private Limited (the AMC) to function as theInvestment Manager for all the Schemes of the Fund. The Fund was registered with SEBI videregistration number MF/046/02/5 dated May 27, 2002.
The Trust has been formed for the purpose of pooling of capital from the public for collectiveinvestment in securities / any other property for the purpose of providing facilities for participationby persons as beneficiaries in such properties / investments and in the profits / income arising therefrom.
c) Board of Trustees (the Trustees)
The Board of Trustees are the exclusive owner of the Trust Fund and holds the same in trust for thebenefit of the unitholders. The Trustees have been discharging their duties and carrying out theirresponsibilities as provided in the SEBI (Mutual Funds) Regulations, 1996 and the Trust Deed. TheTrustees seeks to ensure that the Fund and the Schemes floated thereunder are managed by theAMC in accordance with the Trust Deed, the said Regulations, directions and guidelines issued bySEBI, the Stock Exchanges, the Association of Mutual Funds of India and other regulatory agencies.
d) Asset Management Company (the AMC)
HSBC Asset Management (India) Private Limited (the Investment Manager or the AMC) is a privatelimited company incorporated under the Companies Act, 1956 on December 12, 2001 having itsRegistered Office at 314, D. N. Road, Fort, Mumbai 400 001. HSBC Asset Management (India) PrivateLimited has been appointed as the Asset Management Company of the HSBC Mutual Fund by theTrustee vide Investment Management Agreement (IMA) dated February 7, 2002 and executed betweenthe Trustees and the AMC. SEBI approved the AMC to act as the Investment Manager of the Fundvide. its letter No. MFD/BC/163/2002 dated May 27, 2002.
The paid-up equity share capital of the AMC is Rs. 9 crores. HSBC Securities and Capital Markets(India) Private Limited holds 100% of the paid-up equity share capital of the AMC.
3. INVESTMENT OBJECTIVE OF THE SCHEMEThe investment objective of the Scheme has been provided above under the heading "SchemePerformance, Future Outlook and Operation of the Scheme" (refer Section 1).
4. SIGNIFICANT ACCOUNTING POLICIESThe accounting policies are in accordance with Securities and Exchange Board of India (Mutual Funds)Regulations, 1996.
5. UNCLAIMED DIVIDENDS & REDEMPTIONS
Nil
6. INVESTOR SERVICESDuring the year, the number of official points of acceptance of transactions increased significantly toabout 182 locations. In addition to the offices of the transfer agency, the company has InvestorService Centres in 14 locations at its own offices - namely Mumbai, New Delhi, Kolkata, Chennai,Bangalore, Hyderabad, Pune, Ahmedabad, Indore, Chandigarh, Kochi, Coimbatore, Lucknow andVadodara. With a view to enhancing customer convenience, the Asset Management Company hasextended the facility of crediting investor bank accounts directly by way of NEFT / RTGS (for credit ofredemption and dividend proceeds). The AMC endeavours to despatch dividend proceeds within 5working days from the Record Date in all Schemes. The internal standards on redemption payouts
Trustees' ReportFor the year ended March 31, 2009 (Contd...)

7
have been consistently met, with very few exceptions. The number of locations for the ECS AutoDebit facility for investments through Systematic Investment Plan also increased to about 74 byMarch 2009.
On the distribution front, the number of empanelled distributors increased from 7859 as on 31March, 2008 to 8632 as on 31 March, 2009. During the year, the Asset Management Companyinitiated tie-ups for online distribution of the Mutual Fund's schemes with several channel partnerstaking the total number of such tie-ups to 24 (Angel Capital & Department Market Ltd., Bajaj CapitalLimited, Bonanza Portfolio Limited, Citibank N.A., Citigroup Wealth Advisors India Private Limited,HDFC Bank Limited, Hongkong & Shanghai Banking Corporation Limited, HSBC Corporate InvestmentSolution Services, ICICI Securities Limited, India Infoline Limited, Karvy Stock Broking Limited, KotakMahindra Bank Limited, Kotak Securities Limited, Motilal Oswal Securities Limited, NJ India InvestPrivate Limited, Reliance Securities Limited, RR Investors Capital Services Private Limited, SBICAPSecurities Limited, Sharekhan Limited, SMC Global Securities Limited, Standard Chartered - STCICapital Markets Ltd., Tom Distribution Services Limited, Yes Bank Limited).
Call centre operations have been extended to cover the entire country. The Asset ManagementCompany has outsourced certain back office services including call centre services to HSBC Operationsand Processing Enterprise (India) Private Limited (HOPE).
7. STATUTORY DETAILSa) The Sponsors are not responsible or liable for any loss resulting from the operation of the Schemes
of the Fund beyond initial contribution of Rs. 1 lakh for setting up the Fund.
b) The price and redemption value of the units, and income from them, can go up as well as downwith fluctuations in the market value of its underlying investments.
c) Full / Abridged Annual Report shall be disclosed on the website at www.assetmanagement.hsbc.com/inand shall be available for inspection at the Head Office of the mutual fund. Present and prospectiveunit holder can obtain copy of the trust deed, the Full / Abridged Annual Report of the Scheme(s),the Annual Report of HSBC Asset Management (India) Private Limited and the text of the relevantScheme(s) at a price.
8. ACKNOWLEDGEMENTSThe Trustees wish to thank the Unitholders of the Schemes for their support throughout the year andalso thank the Government of India, the Securities and Exchange Board of India (SEBI), the ReserveBank of India (RBI) and the Association of Mutual Funds in India (AMFI) for the guidance provided bythem. The Trustees also appreciate the service provided by the Registrar and Transfer Agent, FundAccountant, Custodian, Bankers, Distributors and Brokers. The guidance and services provided bythe Auditors and advocates and the ebullience, sincerity and dedication of the employees of HSBCAsset Management (India) Private Limited is also appreciated.
The Trustees look forward to the continued support of everyone.
For and on behalf of the Board of Trustees of HSBC Mutual Fund
Dilip J. Thakkar
Trustee
MUMBAIJuly 6, 2009
Trustees' ReportFor the year ended March 31, 2009 (Contd...)

8
To the Board of Trustees of
HSBC MUTUAL FUND
1. We have audited the Balance Sheet of HSBC Mutual Fund - HSBC Tax Saver Fund ("The Scheme")as at March 31, 2009, and the related Revenue Account for the year ended on that date, both ofwhich we have signed under reference to this report. These financial statements are theresponsibility of the Board of Trustees of HSBC Mutual Fund and the Management of HSBC AssetManagement (India) Private Limited (the "Management"). Our responsibility is to express anopinion on these financial statements based on our audit.
2. We have conducted our audit in accordance with auditing standards generally accepted in India.Those standards require that we plan and perform the audit to obtain reasonable assuranceabout whether the financial statements are free of material misstatement. An audit includesexamining, on a test basis, evidence supporting the amounts and disclosures in the financialstatements. Our procedures included confirmation of securities owned and unit capital balancesas at March 31, 2009 by correspondence with the custodian / others and registrar and transferagents respectively. An audit also includes assessing the accounting principles used and significantestimates made by the Management as well as evaluating the overall financial statementpresentation. We believe that our audit provides a reasonable basis for our opinion.
3. We have obtained all the information and explanations which to the best of our knowledge andbelief were necessary for the purpose of our audit. The Balance Sheet and the Revenue Accountreferred to above are in agreement with the books of account of the Scheme.
4. In our opinion and to the best of our information and according to the explanations given to us,
(i) The Balance Sheet, the Revenue Account together with the notes thereon give the informationrequired by the Securities and Exchange Board of India (Mutual Funds) Regulations, 1996 andamendments thereto, as applicable, and also give respectively, a true and fair view of thestate of affairs of HSBC Mutual Fund - HSBC Tax Saver Fund as at March 31, 2009 and its netdeficit for the year ended on that date.
(ii) The Balance Sheet as at March 31, 2009 and the Revenue Account for the year ended on thatdate, together with the notes thereon have been prepared in all material respects in accordancewith the accounting policies and standards specified in the Ninth Schedule of the Securitiesand Exchange Board of India (Mutual Funds) Regulations, 1996 and amendments thereto asapplicable.
Partha GhoshPartnerMembership No. F / 55913
For and on behalf ofPRICE WATERHOUSEChartered Accountants
MumbaiJuly 6,2009
Auditors' Report

9
Rs. in Lakhs
HSBC TAX SAVER EQUITY FUND
As at As atMarch 31, 2009 March 31, 2008
LIABILITIES
1 Unit Capital 24,505.14 21,676.19
2 Reserves & Surplus2.1 Unit Premium Reserves 496.14 426.922.2 Unrealised Appreciation Reserve – –2.3 Other Reserves (6,942.74) 749.43
3 Loans & Borrowings – –
4 Current Liabilities & Provisions4.1 Provision for doubtful Income/Deposits – –4.2 Other Current Liabilities & Provisions 485.36 1,158.87
TOTAL 18,543.90 24,011.41
ASSETS1 Investments1.1. Listed Securities1.1.1 Equity Shares 14,385.62 19,112.471.1.2 Preference Shares – –1.1.3 Equity Linked Debentures – –1.1.4 Other Debentures & Bonds – –1.1.5 Securitised Debt securities – –1.2 Securities Awaited Listing :1.2.1 Equity Shares – –1.2.2 Preference Shares – –1.2.3 Equity Linked Debentures – –1.2.4 Other Debentures & Bonds – –1.2.5 Securitised Debt securities – –1.3 Unlisted Securities :1.3.1 Equity Shares – –1.3.2 Preference Shares – –1.3.3 Equity Linked Debentures – –1.3.4 Other Debentures & Bonds – –1.3.5 Securitised Debt securities – –1.4 Government Securities – –1.5 Treasury Bills – –1.6 Commercial Paper – –1.7 Certificate of Deposits – –1.8 Bill Rediscounting – –1.9 Units of Domestic Mutual Fund – –1.10 Foreign Securities – –
Total Investments 14,385.62 19,112.47
2 Deposits 600.00 –
3 Other Current Assets3.1 Cash & Bank Balance 38.40 125.563.2 CBLO / Reverse Repo Lending 3,113.01 3,824.803.3 Others 406.87 948.58
4 Deferred Revenue Expenditure – –(to the extent not written off)
TOTAL 18,543.90 24,011.41
Notes to Accounts - Annexure I
Abridged Balance Sheet as at March 31, 2009

10
Rs. in Lakhs
HSBC TAX SAVER EQUITY FUND
Current PreviousYear ended Year ended
March 31, 2009 March 31, 2008
1 INCOME
1.1 Dividend 222.19 92.491.2 Interest 249.35 139.271.3 Realised Gain / (Loss) on Foreign Exchange Transactions – –1.4 Realised Gains / (Losses) on Interscheme sale of
investments – –1.5 Realised Gains / (Losses) on External sale /
redemption of investments (5,922.92) 1,268.041.6 Realised Gains / (Losses) on Derivative Transactions – 106.781.7 Other Income – –
(A) (5,451.38) 1,606.58
2 EXPENSES
2.1 Management fees 178.13 238.652.2 Service tax on Management fees ** – –2.3 Transfer agents fees and expenses 38.81 54.462.4 Custodian fees 6.58 9.222.5 Trusteeship fees 0.08 0.052.6 Commission to Agents * – –2.7 Marketing & Distribution expenses 203.51 193.662.8 Audit fees 0.75 0.752.9 Other operating expenses 39.19 68.00
(B) 467.05 564.79
3 NET REALISED GAINS / (LOSSES)FOR THE YEAR / PERIOD (A –B = C) (5,918.43) 1,041.79
4 Change in Unrealised Depreciation invalue of investments (D) 1,130.87 (746.58)
5 NET GAINS / (LOSSES) FOR THEYEAR / PERIOD [E = (C – D)] (7,049.30) 1,788.37
6 Change in unrealised appreciationin the value of investments (F) – (0.61)
7 NET SURPLUS / (DEFICIT) FORTHE YEAR / PERIOD (E + F = G) (7,049.30) 1,787.76
7.1 Add: Balance transfer from UnrealisedAppreciation Reserve – 0.61
7.2 Less: Balance transfer to Unrealised AppreciationReserve – –
7.3 Add / (Less): Equalisation (642.87) 94.797.4 Transfer from Reserve Fund – –7.5 Transfer from Unit Premium Reserve – –
8 TOTAL (7,692.17) 1,883.169 Dividend Appropriation9.1 Income Distributed during the year / period – –9.2 Tax on income distributed during the year / period – –10 Retained Surplus / (Deficit) carried forward to
Balance Sheet (7,692.17) 1,883.16
Notes to Accounts - Annexure I* Commission to Agents is included in Marketing & Distribution Expenses.** Service Tax on Management Fees is included in Other Operating Expenses.
Abridged Revenue Account for the year ended March 31, 2009

11
HSBC TAX SAVER EQUITY FUND
Current PreviousYear ended Year ended
March 31, 2009 March 31, 2008
1. NAV per unit (Rs.):
Open
Regular Growth Option 10.5427 9.4103
Regular Dividend Option 10.5427 9.4103
High
Regular Growth Option 11.6264 16.2112
Regular Dividend Option 11.6264 16.2112
Low
Regular Growth Option 6.6234 9.0671
Regular Dividend Option 6.6234 9.0671
End
Regular Growth Option 7.3693 10.5427
Regular Dividend Option 7.3693 10.5427
2. Closing Assets Under Management (Rs. in Lakhs)
End 18,059 22,853
Average (AAuM)1 19,647 24,004
3. Gross income as % of AAuM2 -27.75% 6.69%
4. Expense Ratio:
a. Total Expense as % of AAuM (planwise)
Regular Growth Option 2.38% 2.35%
Regular Dividend Option 2.38% 2.35%
b. Management Fee as % of AAuM (planwise)
Regular Growth Option 0.91% 0.99%
Regular Dividend Option 0.91% 0.99%
5. Net Income as a percentage of AAuM3 -30.12% 4.34%
6. Portfolio turnover ratio4 1.69 2.03
7. Total Dividend per unit distributed duringthe year / period (planwise)
Retail
Dividend – –
Corporate
Dividend – –
Key Statistics for the year ended March 31, 2009

12
8. Returns
a. Last One Year
Scheme
Regular Growth Option (30.1014) 11.9702
Regular Dividend Option (30.1014) 11.9702
Benchmark
BSE200 (40.9800) 24.1334
b. Since Inception
Scheme
Regular Growth Option (12.7638) 4.3699
Regular Dividend Option (12.7638) 4.3699
Benchmark
BSE200 (15.5400) 12.8963
1. AAuM = Average daily net assets
2. Gross income = amount against (A) in the Revenue account i.e. Income.
3. Net income = amount against (C) in the Revenue account i.e. NET REALISED GAINS / (LOSSES)FOR THE YEAR / PERIOD
4. Portfolio Turnover = Lower of sales or purchase divided by the Average AuM for the year / period.
Key Statistics for the year ended March 31, 2009 (Contd...)
HSBC TAX SAVER EQUITY FUND
Current PreviousYear ended Year ended
March 31, 2009 March 31, 2008

13
HSBC TAX SAVER EQUITY FUND
1 Investments:
1.1. It is confirmed that investments of the schemes are registered in the name of the Trustees forthe benefit of the scheme's unitholders.
1.2. Open Positions of derivatives as of March 31, 2009 and March 31, 2008 are Nil.
1.3. Investments in Associates and Group Companies are as under :(Rupees)
Issuer Instrument Amount Aggregate Amount AggregateType Investments Investments
by all schemes by all schemes
2009 2008
The Hongkong & Fixed deposits – 43,000,000 64,000,000 1,654,000,000Shanghai BankingCorporation Ltd.
1.4. Open position of Securities Borrowed and / or Lent by the scheme as of the year ended 31March, 2009 is NIL.
1.5. NPAs as at years ended March 31, 2009 and March 31, 2008 are NIL.
1.6. Aggregate Unrealised Gain / Loss as at the end of the Financial year ended and theirpercentages to net assets are as under:
Company Amount Percentage to Amount Percentage toName (Rs.) Net Assets (Rs.) Net Assets
2009 2008
Equity Shares
– Appreciation 62,106,057 3.4392% 173,597,447 7.5964%
– Depreciation 215,491,836 11.9330% 213,895,907 9.3598%
1.7. The aggregate value of investments purchased (excluding accretion of discount ofRs. 5,489,967) and sold (including matured) during the financial year is Rs. 5,161,259,484and Rs. 4,934,062,477 respectively being 262.69% and 251.13% of the average daily netassets.
The aggregate value of investments purchased and sold (including matured) during thefinancial period is Rs. 5,074,169,543 and Rs. 4,915,754,870 respectively being 211.39%and 204.79% of the average daily net assets.
1.8. Non-Traded securities in the portfolio: Aggregate Value of Equity, Debt & Money MarketInstruments and percentage to net assets is as under
Security Fair Value % to Net Fair Value % to NetCategory (Rs.) Assets (Rs.) Assets
2009 2008
Equities – – 16,246,129.00 0.7109%
Total – – 16,246,129.00 0.7109%
Notes to Accounts - Annexure ITo the Abridged Balance Sheet and Revenue Account for the year ended March 31, 2009

14
2 Disclosure under Regulation 25(8) of the Securities and Exchange Board Of India (Mutual Funds)Regulations, 1996 as amended.
Year - 2008-2009
During the year, HSBC Securities and Capital Markets (India) Private Limited, the Sponsor waspaid brokerage aggregating Rs. 269,324 on purchase and sale of investments. The Hongkongand Shanghai Banking Corporation Limited, an associate entity of HSBC Asset Management (India)Private Limited was paid collection/bank charges amounting to Rs. 998, brokerage amounting toRs. 608,172 for procuring unit subscriptions for the Scheme and clearing member charges onderivative transactions Rs. 95,784. The brokerage paid was at rates similar to those offered toother brokers / distributors
Year - 2007-2008
HSBC Securities and Capital Markets (India) Private Limited, the Sponsor was paid brokerageaggregating Rs. 679,000 on purchase and sale of investments. The Hongkong and ShanghaiBanking Corporation Limited, an associate entity of HSBC Asset Management (India) Private Limitedwas paid collection / bank charges amounting to Rs. 8,128, brokerage amounting to Rs. 2,050,035for procuring unit subscriptions for the Scheme and clearing member charges on derivativetransactions Rs. 95,784. The brokerage paid was at rates similar to those offered to other brokers /distributors.
Further, The Hongkong and Shanghai Banking Corporation Limited, an associate of the Sponsor,is on the panel of bankers with whom HSBC Mutual Fund places money on fixed deposits andenters into reverse repo transactions from time to time at competitive rates.
3 None of the Investors held more than 25% of the total net assets of the scheme at the yearsended March 31, 2009 and March 31, 2008.
4 Unit Capital movement during the years ended March 31, 2009 and March 31, 2008.
Description 2008-2009
Opening Units Subscription Redemption Closing Units Face Value
Growth 132,777,868.108 18,336,034.648 467,247.295 150,646,655.461 1,506,466,554.61
Dividend 83,983,985.503 11,249,049.602 828,336.755 94,404,698.350 944,046,983.50
Description 2007-2008
Opening Units Subscription Redemption Closing Units Face Value
Growth 115,757,358.823 17,452,801.638 432,292.353 132,777,868.108 1,327,778,681.08
Dividend 74,861,591.180 9,528,287.384 405,893.061 83,983,985.503 839,839,855.03
5 Previous year’s figures have been re-grouped / re-arranged where appropriate.
6 No contingent liabilities for the years ended March 31, 2009 and March 31, 2008.
7 Expenses other than Management Fees are inclusive of Service Tax where applicable.
8 The Annual Accounts of the Schemes prepared in accordance with the accounting policies andstandards specified in the Ninth Schedule of The Securities and Exchange Board of India (MutualFunds) Regulations, 1996 has been approved by the Board of Directors of HSBC Asset Management(India) Private Limited and The Board of Trustees of HSBC Mutual Fund at their meeting held onJuly 06, 2009. The audit report attached herewith refers to the said annual accounts. The aforesaidabridged accounts are an extract of the Annual Accounts and are prepared in accordance withSEBI Circular No. IMD/Cir 8/132968/2008 dated July 24, 2008.
Notes to Accounts - Annexure I (Contd...)To the Abridged Balance Sheet and Revenue Account for the year ended March 31, 2009

15
DISCLAIMERSThe content of this report has been prepared by HSBC Asset Management (India) Private Limited(HSBC) for information purposes only and should not be construed as an offer or solicitation of anoffer for purchase of any of the funds of HSBC Mutual Fund. The information is for general informationonly and does not have regard to specific investment objectives, financial situation and the particularneeds of any specific person who may receive this information. Investments in mutual funds inherentlyinvolve risks and investors should read the relevant documents / information for details and riskfactors and consult their legal, tax and financial advisors before investing. Investors should understandthat statements made herein regarding future prospects may not be realised. Neither this documentnor the units of HSBC Mutual Fund have been registered in any jurisdiction. The distribution of thisdocument in certain jurisdictions may be restricted or totally prohibited and accordingly, personswho come into possession of this document are required to inform themselves about, and to observe,any such restrictions.
Investors may obtain Statement of Additional Information, Combined Scheme Information Documentand Common Key Information Memorandums along with application forms from the office of HSBCMutual Fund, 314, D. N. Road, Fort, Mumbai 400 001. Tel: 022-6666 8819.
Statutory Details:HSBC Mutual Fund has been set up as a trust by HSBC Securities and Capital Markets (India) PrivateLimited (liability restricted to the corpus of Rs. 1 lakh). The Sponsor/associates of the Sponsor/AssetManagement Company (AMC) are not responsible or liable for any loss or shortfall resulting from theoperation of the Schemes. The Trustees of HSBC Mutual Fund have appointed HSBC Asset Management(India) Private Limited as the Investment Manager.
Risk Factors:All investments in mutual funds and securities are subject to market risks and the Net Asset Value(NAV) of the Scheme(s) may go up or down depending on the factors and forces affecting the securitiesmarkets. There can be no assurance that the objectives of the Scheme(s) will be achieved. Pastperformance of the Sponsor, AMC, Mutual Fund or any associates of the Sponsor/AMC does notindicate the future performance of the Scheme(s) of the Mutual Fund. HSBC Tax Saver Equity Fund(HTSF) is the names of the Scheme and does not in any manner indicate the quality of the Scheme orits future prospects or returns.
Terms of Issue:Units of the Scheme(s) are being offered at NAV based prices, subject to the prevailing loads. TheAMC calculates and publishes NAVs and offers for sale, redemption and switch outs, units of theScheme(s) on all Business Days, at the Applicable NAV for all Schemes (at least once a week, i.e.,every Wednesday and daily during the period of redemption in case of HSCF). HUOF, HSCF & HFTSwill not be open for ongoing subscriptions/ switch ins. HUOF & HSCF would be available for sale onan ongoing basis (after a period of 3 years from the date of allotment). Conversion of HUOF & HSCFto an open-ended scheme will be done only after the balance unamortized amount has been fullyrecovered from the Scheme. Units can be redeemed/switched out on every Business Day at NAVbased prices, subject to prevailing exit loads. In case of HSCF, units can be redeemed / switched outon a monthly basis on the stipulated date i.e. last 3 business days of every month at NAV basedprices, subject to provisions of exit load, if any and recovery of balance proportionate unamortizedNFO expenses.
Load Structure (includes SIP/STP):Entry - 2.25% for investments/switch ins* < Rs. 1 crore, otherwise Nil. Exit - Nil.
*No load in case of switches between equity Schemes of HSBC Mutual Fund.
Consult the nearest investor service centre for details.
The entry/exit load set forth above is subject to change at the discretion of the AMC and suchchanges shall be implemented prospectively.
Mutual Fund investments are subject to market risks. Please read the Statement of AdditionalInformation and Scheme Information Document carefully before investing.

Value Research Online DisclaimerValue Research Fund Ratings: Value Research Fund Ratings are a composite measure of historical risk-adjusted returns. In the case of equity funds this rating is based on the average monthly returns forthe last 3-year and 5-year period. These ratings do not take into account any entry or exit load.
Value Research Fund Ratings are subject to change every month. Current Fund Ratings are as onMarch 31, 2009. 142 open-ended Equity: Diversified Funds were rated. The Rating is based on primarydata provided by respective funds; Value Research does not guarantee the accuracy. Ranking Entity:Value Research Online.
ICRA Online Ranking MethodologyHSBC Monthly Income - Savings Plan has been ranked as a Five Star Fund in the category of 'OpenEnded Marginal Equity' schemes for its 3 year performance till December 31, 2008.
The rank is an outcome of an objective and comparative analysis against various parameters, including:risk adjusted return, fund size, company concentration, portfolio turnover and liquidity. The rankingmethodology did not take into account entry and exit loads imposed by the Fund. There were 27schemes considered in 'Open Ended Marginal Equity' category for the ranking exercise. The rank isneither a certificate of statutory compliance nor any guarantee on the future performance of HSBCMonthly Income - Savings Plan. Ranking Source & Publisher: ICRA Online Limited.
CRISIL Ranking MethodologyThe selection for the awards is based on the CRISIL FundServices' Composite Performance Ranking(CRISIL~CPR) methodology.
The CRISIL Composite Performance Ranking (CRISIL~CPR) is a quarterly ranking of mutual fund schemesbased on two year performance (excepting for the liquid and short term debt categories where a oneyear performance horizon is considered). The methodology is based on global best practices,customized to account for Indian market nuances. Over time, the rankings have become the industrystandard with good acceptance among Investors, Fund Intermediaries, Asset Management Companies,etc. The performance criteria covers not only risk adjusted returns, which are historical, but also theportfolio constitution to make the analysis forward looking.
CRISIL DisclaimerThe overall ranking is assigned to the scheme based on its weighted average score on a range ofparameters: Superior Return Score, Concentration, Liquidity, Asset Quality - Measures the creditquality of the portfolio, Average Maturity and Asset Size. HSBC MIP - Savings was the only schemethat won the CNBC TV18 - CRISIL Mutual Fund of the Year Award in the Category - Monthly IncomePlans - Aggressive. In total 13 schemes were eligible for the award universe. Schemes present in allfour quarterly CRISIL CPRs were considered for the award. The award is based on consistency of thescheme's performance in the four quarterly CRISIL CPR rankings released during the calendar year2008. The individual CRISIL CPR parameter scores averaged for the four quarters were further multipliedby the parameter weights as per the CRISIL CPR methodology to arrive at the final scores. A detailedmethodology of the CRISIL CPR is available at www.crisil.com. Past performance is no guarantee offuture results. Rankings and Award Source: CRISIL Fund Services, CRISIL Ltd. HSBC Monthly Income -Savings Plan has been ranked as a Five Star Fund in the category of 'Open Ended Marginal Equity'schemes for its 3 year performance till December 31, 2008. The rank is an outcome of an objectiveand comparative analysis against various parameters, including: risk adjusted return, fund size,company concentration, portfolio turnover and liquidity. The ranking methodology did not take intoaccount entry and exit loads imposed by the Fund. There were 27 schemes considered in 'OpenEnded Marginal Equity' category for the ranking exercise. The rank is neither a certificate of statutorycompliance nor any guarantee on the future performance of HSBC Monthly Income - Savings Plan.Ranking Source & Publisher: ICRA Online Limited.
16

Issued by HSBC Asset Management (India) Private Limited
HSBC Unique Opportunities FundA close-ended equity Scheme*
Abridged Annual Report 2008 - 2009
HSBC Global Asset Management
*A three year close-ended equity Scheme with automatic conversion into open-ended equity Scheme at the end of 3 years from the date of allotment of units.

1
Dear Investor,
We thank you for investing with HSBC Mutual Fund. We are pleased to inform you that HSBCMutual Fund has won prestigious awards* this year at various forums in India.
The awards* won by our schemes in India are
� HSBC Equity Fund has been included in the 5 star rated fund category (“Top rated mutualfunds” by Value Research online) in March, 2009.
� Five-stars indicate that a fund is in the top 10 per cent of its category in terms ofhistorical risk-adjusted returns.
� ICRA Mutual Fund Awards 2009
� HSBC MIP - Savings has been ranked a 5-Star Fund by ICRA Online indicating performanceamong the top 10% in the category of 'Open Ended Marginal Equity' for 3 yearperformance ending 31 December, 2008.
� CNBC TV18 - CRISIL Mutual Fund Awards 2008
� HSBC MIP - Savings was awarded the CNBC TV18 - CRISIL Mutual Fund of the YearAward for the year 2008 in the Monthly Income Plans - Aggressive Category.
(Past performance is no guarantee of future results. * Please refer to Ranking methodologyand disclaimer mentioned at the end of the Abridged Annual Report for the year endedMarch 31, 2009).
At the global level, the HSBC Group won several awards at Euromoney's Awards for Excellence2009. The top awards that HSBC won were the Best Global Bank and the Best Global DebtHouse. It was also honoured as the Best Debt House in 8 locations including Asia and the Bestat Risk Management in Asia. (Past performance may or may not be sustained in the future andis no guarantee of future results). We continue to be one of the leading players in emergingmarkets and remain committed to our asset management business in India.
HSBC Asset Management (India) Private Limited including the mutual fund business as well asthe PMS business (including EPFO money deployed till date) manages assets of about Rs. 26280Crores as at 30 June, 2009. The core to our winning strategy is our endeavour to deliverconsistent performance over the medium to long term for our investors in a risk controlledenvironment and aim for consistent wealth creation under varying market conditions. Throughour product range, we aim to be true to our reputation in India of being a provider ofinternational quality investment products and services.
We remain committed to our philosophy of aiming for consistent wealth creation and serviceexcellence and look forward to your continued investments in HSBC Mutual Fund.
Yours sincerely,
VikramaadityaChief Executive OfficerHSBC Asset Management (India) Private Limited

2
SPONSORHSBC Securities and Capital Markets (India) Private LimitedRegd. Office: 52/60, Mahatma Gandhi Road, Fort, Mumbai 400 001.
TRUSTEEBoard of TrusteesOffice: 314, D. N. Road, Fort, Mumbai 400 001.
ASSET MANAGEMENT COMPANYHSBC Asset Management (India) Private LimitedCorp. & Regd. Office: 314, D. N. Road, Fort, Mumbai 400 001.
CUSTODIANJP Morgan Chase BankCorp. & Regd. Office: Mafatlal Centre, 9th Floor, Nariman Point, Mumbai - 400 021.
AUDITORS TO THE SCHEMEPrice WaterhouseChartered Accountants252, Veer Savarkar Marg, Shivaji Park, Dadar (West), Mumbai - 400 028.
LEGAL ADVISORSBharucha & Partners4th Floor, Cecil Court, Mahakavi Bhushan Marg, Colaba, Mumbai - 400 039.
REGISTRAR & TRANSFER AGENTSComputer Age Management Services (P) Ltd. (CAMS)Rayala Towers, Tower I, III Floor, 158 Anna Salai, Chennai - 600 002.
BOARD OF TRUSTEESMr. N. P. Gidwani - Chairman
Dr. Rudolf ApenbrinkMr. Nasser MunjeeMr. Manu TandonMr. Mehli MistriMr. Dilip J. Thakkar
BOARD OF DIRECTORSMs. Naina Lal Kidwai - Chairman
Mr. Ayaz EbrahimMr. S. P. Mustafa**Mr. Vithal PalekarMs. Kishori J. Udeshi*Mr. Vikramaaditya - Chief Executive Officer***
* Ms. Kishori Udeshi has been appointed as a Director with effect from 14 January 2009 andMr. Jagjit Lal Pasricha has resigned as a Director with effect from 19 January 2009.
** Mr. S. P. Mustafa has been appointed as a Director with effect from 2 September 2008 andMr. Nawshir Khurody has resigned as a Director with effect from 1 September 2008.
*** Mr. Vikramaaditya has been appointed as the Chief Executive Officer with effect from 16 July 2008and Mr. Sanjay Prakash has resigned as the Chief Executive Officer with effect from 16 July 2008.

3
Trustees' ReportFor the year ended March 31, 2009
The Trustees present the seventh report and the audited financial statements of the Schemesof HSBC Mutual Fund (the "Fund"), for the year ended March 31, 2009.
1. SCHEME PERFORMANCE, FUTURE OUTLOOK AND OPERATIONS OF THE SCHEME
a) Operations and Performance of the Scheme
HSBC Unique Opportunities Fund (HUOF) - a close ended equity scheme with automaticconversion into an open-ended equity scheme at the end of three years from the date ofallotment of units
HUOF seeks to provide long-term capital growth from a diversified portfolio of equity andequity related instruments. The focus would be to invest in stocks of companies facing "out-of-ordinary" conditions.
The net assets of HSBC Unique Opportunities Fund amounted to Rs. 219.50 crores as at March31, 2009 compared to Rs. 520.82 crores as at March 31, 2008. 86.20% of the net assets wereinvested in equities, 13.80% was invested in debt and money market instruments as at March31, 2009.
HUOF underperformed the index by 640 bps over the past 1 year period on account of highermidcap allocations vis-à-vis the benchmark.
Date of Inception : 21 March, 2007 Compounded Annualized Returns (%)
Schemes (P2P) 1 Year Since Inception
HSBC Unique Opportunities Fund - Growth -47.38 -24.39
BSE 200 -40.98 -13.74
Past performance may or may not be sustained in future. 'Since inception' returns are calculatedon Rs. 10 invested at inception. Calculations are based on Growth NAVs.
b) Market Overview & Outlook
MARKET OVERVIEW(as furnished by HSBC Asset Management (India) Private Limited)
Equity Market Overview
The financial year ended 31 March, 2009 was a highly eventful one with long standing institutionsdisappearing from the landscape in the whirlwind of the sub-prime crisis and derivative losses. Theyear can be split into three phases - the first from April 2008 till when Lehman Brothers filed forbankruptcy, which saw a blowout commodity rally (crude oil nudged close to USD 144/barrel) andthe sub-prime situation turning progressively worse. The United States (US) Government / FederalReserve bailed out major institutions thought to be critical to the functioning of the financial system.The second phase from September 2008 till January 2009 saw a spate of bankruptcies most notablyLehman Brothers which saw the appearance of an acute level of risk aversion pushing the creditmarkets into a gridlock. This phase also coincided with the fiscal / monetary stimuli by variousgovernments to take the credit crisis head on. Globally, markets stabilized around their October2008 lows and a semblance of normality started re-appearing in financial markets in this period. Thethird phase from February 2009 onwards witnessed a sharp rally as a weakening US Dollar spewedmoney into emerging markets. The sensex fell by 38% during the financial year.
For the financial year 2009, the popular indices viz. BSE Sensex and CNX Nifty were down 37.94%and 36.19% respectively. The BSE Midcap (54.01)% and the broader indices like BSE 200 (40.98)%

4
and BSE 500 (42.77)% also reflected the correction across the markets. Within sectoral indices thebest performing indices were BSE FMCG (11.08)% and BSE Oil and Gas (29.58)% while the worstperforming indices were BSE Realty (79.37)%, due to the high leverage on the balance sheets, BSEMetals (58.67)%, due to slowdown in global growth and BSE Consumer Durables (58.14)% and BSECapital goods (53.84%).
In a year that saw sell-off across emerging markets, FIIs were net sellers of the tune USD 10.4 billionin the Indian equity markets while Domestic Institutional Investors (Insurance & Mutual Funds) werebuyers to the tune of USD 13.1 billion. Further, FIIs were net sellers in the derivative markets ashedge funds, and p-notes unwound positions in a rapidly deleveraging world. Thus, sentimentremained negative as few US based investment banks filed for bankruptcy in the midst of the liquidityand credit crisis and safety took precedence over growth.
Debt Market Overview
Two contrarian forces one inflationary and the other deflationary had been in play since 2007: Onthe one hand strong demand from emerging economies were leading commodities higher and fuellinginflation, while on the other the housing led credit crisis in the US was starting to exert a deflationaryforce. The first force was dominant till early July 2008 leading commodity prices to fresh peaks andinflation to multi year highs. Since then, however, the second force took hold with the result thatcommodity prices fell sharply from the top, growth and inflation numbers toppled worldwide, andcentral bankers shifted focus to achieving financial stability and protecting growth.
The financial crisis hit the domestic markets towards September 2008, leading to acute disruption inmoney markets. The Reserve Bank of India (RBI) acted proactively cutting the cash reserve ratio (CRR)by an unprecedented 400 bps between September 2008 and January 2009. Similarly, the reverserepo rate had been cut by 275 bps since October 2008 while the repo rate had been cut by 425 bpsover the same period.
Bond market yields fell in line with the unprecedented monetary easing up till the first week ofJanuary 2009. Thereon, supply pressures on bond markets rose as a result of government fiscalslippages aimed at stimulating the economy. The RBI, in line with similar measures elsewhere in theworld, started buying government securities to lessen the impact on yields from the rise in governmentborrowing. Although this helped market sentiment, it could not prevent a general rise in yieldstowards fiscal close. As a result, the 10 year benchmark sovereign yield closed the fiscal at 7% froma low of sub 5% hit in early January 2009. Money market rates stabilized after the initial mayhem ofSeptember 2008 and October 2008 and liquidity came back to interbank markets.
MARKET OUTLOOK
(as furnished by HSBC Asset Management (India) Private Limited)
Equity Market Outlook
Financial Year (FY) 2008-09 was a year marked by a strong correlation between the Indian marketand global markets with key indices ending deeply in the red on the back of the subprime crisis andderivative led losses across major financial stocks in the United States (US). Even in India, forex lossesran across corporate India though at a smaller magnitude. FY 10 has begun on a better note onaccount of various fundamental and technical factors.
GDP for FY 09 grew at 6.7% against FY 08 levels of 9%. Agriculture posted a below trend growthrate of 1.6% and industry grew by 3.9% (versus 8.1% in FY 08) with services registering a close to9.7% growth. IIP grew by a mere 2.6%. Although order books of engineering / capital goods wererunning at record high levels, there was possibility of delays in execution as funding sources for thedevelopers (equity, ECB, private equity, FCCB) had dried up. A sharp increase in subsidy on accountof oil, fertilizers and food led to a cut back in discretionary spending. Inflation rose on the back of asurging crude and higher prices of agricultural commodities to top at 12.91% for the week ending 2August, 2008. A slow down in the growth rates in the US / EU and other markets finally tamed thesurge in crude. As growth rates stumbled, governments / monetary authorities the world over triggered
Trustees' ReportFor the year ended March 31, 2009 (Contd...)

5
fiscal stimuli / monetary easing to escape recessionary forces. This was followed in India as wellwhich started monetary easing / fiscal stimuli to keep growth rates buoyant.
On the positive side, India continues to do better in relative terms and we expect GDP growth of6-6.5% for FY10. The broad themes that are driving domestic growth viz. capital expenditure,infrastructure building and domestic consumption are still intact. The key concerns at this pointstems from a ballooning fiscal deficit at the consolidated level (Centre & State) with salary revisionfor Central / State Government employees threatening a cut back in discretionary spending. Inflationis likely to remain benign for the first half of FY10 on a favourable base effect but we anticipate it togo back to trend levels of 5-5.5% for the second half of FY10 as this base effect wears off.
On a valuations perspective, the markets are currently trading at a P/E ratio of around 12 timesFY 2010 earnings. This is well below the 10-year average given the extreme risk aversion prevailing inthe markets. However, the underlying growth in the economy and corporate earnings growth (15%in the long term) makes the market attractive from a longer-term view. The short term could seeenhanced volatility arising from various factors. Increase in commodity prices continues to be a riskin the medium term as the US dollar continues to struggle with the ballooning US fiscal situation.
Debt Market Outlook
Excess supply of government bonds, as a result of fiscal slippages to arrest the downward growthmomentum, has been a reality for bond markets since January 2009. However, this is now compoundedwith some fatigue in buying longer duration as economic data is showing signs of recovery,commodities are showing signs of rally and expectations of incremental monetary easing from theRBI are beginning to unwind. However, system liquidity remains surplus and bank deposits continueto grow thereby providing resistance to bond yields from rising sharply.
Given the above factors, we believe that the market would continue to provide tactical opportunitiesalthough the fundamental bias should be for lower duration. Also, any mitigation of bond supplypressure or a new downturn in the ongoing economic recovery may provide space for opportunisticlonger duration plays. On the other hand, if the recovery cycle continues uninterrupted and commodityprices remain firm, central banks may start to worry about withdrawing the current monetary stimulusby sometime early 2010; with consequent impact on bond markets.
2. BRIEF BACKGROUND OF SPONSORS, BOARD OF TRUSTEES AND ASSETMANAGEMENT COMPANY
a) Sponsor
HSBC Mutual Fund is sponsored by HSBC Securities and Capital Markets (India) Private Limited (HSCI).The Sponsor is the Settler of the Mutual Fund Trust. The Sponsor has entrusted a sum of Rs. 1,00,000(Rupees One Lakh only) to the Trustee as the initial contribution towards the corpus of the MutualFund.
HSCI is a member of the HSBC Group, one of the largest banking and financial services organisations,in the world. Headquartered in London, HSBC operates through long-established businesses in fiveregions: Europe, Asia-Pacific, Middle East, America and Africa. Through its global network of 10,000offices in 86 countries and territories, HSBC provides a comprehensive range of financial services topersonal, commercial, corporate, institutional investment and private banking clients.
HSCI offers integrated investment banking services, securities and corporate finance & advisory. HSCIis a member of The Bombay Stock Exchange Limited and National Stock Exchange (capital and derivativemarket segments) and is also a category I merchant banker and underwriter registered with Securitiesand Exchange Board of India.
HSCI holds 100% of the paid-up equity share capital of the AMC.
b) HSBC Mutual Fund
HSBC Mutual Fund ("the Mutual Fund" or "the Fund") has been constituted as a Trust in accordancewith the provisions of the Indian Trusts Act, 1882 (2 of 1882) vide a Trust Deed dated February 7,
Trustees' ReportFor the year ended March 31, 2009 (Contd...)

6
2002 with HSBC Securities and Capital Markets (India) Private Limited, as the Sponsor and the Boardof Individual Trustees. The Trustee has entered into an Investment Management Agreement datedFebruary 7, 2002 with HSBC Asset Management (India) Private Limited (the AMC) to function as theInvestment Manager for all the Schemes of the Fund. The Fund was registered with SEBI videregistration number MF/046/02/5 dated May 27, 2002.
The Trust has been formed for the purpose of pooling of capital from the public for collectiveinvestment in securities / any other property for the purpose of providing facilities for participationby persons as beneficiaries in such properties / investments and in the profits / income arising therefrom.
c) Board of Trustees (the Trustees)
The Board of Trustees are the exclusive owner of the Trust Fund and holds the same in trust for thebenefit of the unitholders. The Trustees have been discharging their duties and carrying out theirresponsibilities as provided in the SEBI (Mutual Funds) Regulations, 1996 and the Trust Deed. TheTrustees seeks to ensure that the Fund and the Schemes floated thereunder are managed by theAMC in accordance with the Trust Deed, the said Regulations, directions and guidelines issued bySEBI, the Stock Exchanges, the Association of Mutual Funds of India and other regulatory agencies.
d) Asset Management Company (the AMC)
HSBC Asset Management (India) Private Limited (the Investment Manager or the AMC) is a privatelimited company incorporated under the Companies Act, 1956 on December 12, 2001 having itsRegistered Office at 314, D. N. Road, Fort, Mumbai 400 001. HSBC Asset Management (India) PrivateLimited has been appointed as the Asset Management Company of the HSBC Mutual Fund by theTrustee vide Investment Management Agreement (IMA) dated February 7, 2002 and executed betweenthe Trustees and the AMC. SEBI approved the AMC to act as the Investment Manager of the Fundvide. its letter No. MFD/BC/163/2002 dated May 27, 2002.
The paid-up equity share capital of the AMC is Rs. 9 crores. HSBC Securities and Capital Markets(India) Private Limited holds 100% of the paid-up equity share capital of the AMC.
3. INVESTMENT OBJECTIVE OF THE SCHEMEThe investment objective of the Scheme has been provided above under the heading "SchemePerformance, Future Outlook and Operation of the Scheme" (refer Section 1).
4. SIGNIFICANT ACCOUNTING POLICIESThe accounting policies are in accordance with Securities and Exchange Board of India (Mutual Funds)Regulations, 1996.
5. UNCLAIMED DIVIDENDS & REDEMPTIONSSummary of number of Investors & corresponding amount
Unclaimed Dividends Unclaimed Redemptions
Scheme Amount No. of Amount No. of(Rs.) Investors (Rs.) Investors
HSBC Unique Opportunities Fund – – 155,410.70 2
6. INVESTOR SERVICESDuring the year, the number of official points of acceptance of transactions increased significantly toabout 182 locations. In addition to the offices of the transfer agency, the company has InvestorService Centres in 14 locations at its own offices - namely Mumbai, New Delhi, Kolkata, Chennai,Bangalore, Hyderabad, Pune, Ahmedabad, Indore, Chandigarh, Kochi, Coimbatore, Lucknow andVadodara. With a view to enhancing customer convenience, the Asset Management Company hasextended the facility of crediting investor bank accounts directly by way of NEFT / RTGS (for credit of
Trustees' ReportFor the year ended March 31, 2009 (Contd...)

7
redemption and dividend proceeds). The AMC endeavours to despatch dividend proceeds within 5working days from the Record Date in all Schemes. The internal standards on redemption payoutshave been consistently met, with very few exceptions. The number of locations for the ECS AutoDebit facility for investments through Systematic Investment Plan also increased to about 74 byMarch 2009.
On the distribution front, the number of empanelled distributors increased from 7859 as on 31March, 2008 to 8632 as on 31 March, 2009. During the year, the Asset Management Companyinitiated tie-ups for online distribution of the Mutual Fund's schemes with several channel partnerstaking the total number of such tie-ups to 24 (Angel Capital & Department Market Ltd., Bajaj CapitalLimited, Bonanza Portfolio Limited, Citibank N.A., Citigroup Wealth Advisors India Private Limited,HDFC Bank Limited, Hongkong & Shanghai Banking Corporation Limited, HSBC Corporate InvestmentSolution Services, ICICI Securities Limited, India Infoline Limited, Karvy Stock Broking Limited, KotakMahindra Bank Limited, Kotak Securities Limited, Motilal Oswal Securities Limited, NJ India InvestPrivate Limited, Reliance Securities Limited, RR Investors Capital Services Private Limited, SBICAPSecurities Limited, Sharekhan Limited, SMC Global Securities Limited, Standard Chartered - STCICapital Markets Ltd., Tom Distribution Services Limited, Yes Bank Limited).
Call centre operations have been extended to cover the entire country. The Asset ManagementCompany has outsourced certain back office services including call centre services to HSBC Operationsand Processing Enterprise (India) Private Limited (HOPE).
7. STATUTORY DETAILSa) The Sponsors are not responsible or liable for any loss resulting from the operation of the Schemes
of the Fund beyond initial contribution of Rs. 1 lakh for setting up the Fund.
b) The price and redemption value of the units, and income from them, can go up as well as downwith fluctuations in the market value of its underlying investments.
c) Full / Abridged Annual Report shall be disclosed on the website at www.assetmanagement.hsbc.com/inand shall be available for inspection at the Head Office of the mutual fund. Present and prospectiveunit holder can obtain copy of the trust deed, the Full / Abridged Annual Report of the Scheme(s),the Annual Report of HSBC Asset Management (India) Private Limited and the text of the relevantScheme(s) at a price.
8. ACKNOWLEDGEMENTSThe Trustees wish to thank the Unitholders of the Schemes for their support throughout the year andalso thank the Government of India, the Securities and Exchange Board of India (SEBI), the ReserveBank of India (RBI) and the Association of Mutual Funds in India (AMFI) for the guidance provided bythem. The Trustees also appreciate the service provided by the Registrar and Transfer Agent, FundAccountant, Custodian, Bankers, Distributors and Brokers. The guidance and services provided bythe Auditors and advocates and the ebullience, sincerity and dedication of the employees of HSBCAsset Management (India) Private Limited is also appreciated.
The Trustees look forward to the continued support of everyone.
For and on behalf of the Board of Trustees of HSBC Mutual Fund
Dilip J. Thakkar
Trustee
MUMBAIJuly 6, 2009
Trustees' ReportFor the year ended March 31, 2009 (Contd...)

8
To the Board of Trustees of
HSBC MUTUAL FUND
1. We have audited the Balance Sheet of HSBC Mutual Fund - HSBC Unique Opportunities Fund(The "Scheme") as at March 31, 2009 and, the related Revenue Account for the year ended onthat date annexed thereto, and the Cash Flow Statement for the year ended on that date whichwe have signed under reference to this report. These financial statements are the responsibilityof the Board of Trustees of HSBC Mutual Fund and the Management of HSBC Asset Management(India) Private Limited (the "Management"). Our responsibility is to express an opinion on thesefinancial statements based on our audit.
2. We have conducted our audit in accordance with auditing standards generally accepted in India.Those standards require that we plan and perform the audit to obtain reasonable assuranceabout whether the financial statements are free of material misstatement. An audit includesexamining, on a test basis, evidence supporting the amounts and disclosures in the financialstatements. Our procedures included confirmation of securities owned and unit capital balancesas at March 31, 2009 by correspondence with the custodian / others and registrar and transferagent respectively. An audit also includes assessing the accounting principles used and significantestimates made by the management, as well as evaluating the overall financial statementspresentation. We believe that our audit provides a reasonable basis for our opinion.
3. We have obtained all the information and explanations which, to the best of our knowledge andbelief, were necessary for the purposes of our audit. The Balance Sheet, the Revenue Accountand the Cash Flow Statement referred to above are in agreement with the books of account ofthe Scheme.
4. In our opinion and to the best of our information and according to the explanations given to us;
(i) The Balance Sheet, the Revenue Account and the Cash Flow Statement together with thenotes thereon give the information required by the Securities and Exchange Board of India(Mutual Funds) Regulations, 1996 and the amendments thereto, as applicable, and also giverespectively a true and fair view of the state of affairs of HSBC Mutual Fund - HSBC UniqueOpportunities Fund as at March 31, 2009, its net deficit and its cash flows for the year endedon that date.
(ii) The Balance Sheet as at March 31, 2009, and the Revenue Account for the year ended onthat date, together with the notes thereon, have been prepared in all material respects inaccordance with the accounting policies and standards specified in the Ninth Schedule of theSecurities and Exchange Board of India (Mutual Funds) Regulations, 1996 and amendmentsthereto, as applicable.
Partha GhoshPartnerMembership No. F / 55913
For and on behalf ofPRICE WATERHOUSEChartered Accountants
Place : MumbaiDate : July 6, 2009
Auditors' Report

9
Rs. in Lakhs
HSBC UNIQUE OPPORTUNITIES FUND
As at As atMarch 31, 2009 March 31, 2008
LIABILITIES1 Unit Capital 38,724.49 48,311.05
2 Reserves & Surplus2.1 Unit Premium Reserves (2,334.51) (3,847.33)2.2 Unrealised Appreciation Reserve 4.10 8.822.3 Other Reserves (14,444.07) 7,565.813 Loans & Borrowings – –4 Current Liabilities & Provisions4.1 Provision for doubtful Income/Deposits – –4.2 Other Current Liabilities & Provisions 1,065.63 507.74
TOTAL 23,015.64 52,546.09
ASSETS1 Investments1.1. Listed Securities:1.1.1 Equity Shares 17,622.29 43,246.351.1.2 Preference Shares – –1.1.3 Equity Linked Debentures – –1.1.4 Other Debentures & Bonds – –1.1.5 Securitised Debt securities – –1.2 Securities Awaited Listing:1.2.1 Equity Shares – –1.2.2 Preference Shares – –1.2.3 Equity Linked Debentures – –1.2.4 Other Debentures & Bonds – –1.2.5 Securitised Debt securities – –1.3 Unlisted Securities:1.3.1 Equity Shares – –1.3.2 Preference Shares – –1.3.3 Equity Linked Debentures – –1.3.4 Other Debentures & Bonds – –1.3.5 Securitised Debt securities – –1.4 Government Securities – –1.5 Treasury Bills – –1.6 Commercial Paper – –1.7 Certificate of Deposits – –1.8 Bill Rediscounting – –1.9 Units of Domestic Mutual Fund – –1.10 Foreign Securities – –
Total Investments 17,622.29 43,246.35
2 Deposits 1,650.00 1,800.00
3 Other Current Assets3.1 Cash & Bank Balance 4.94 75.893.2 CBLO / Reverse Repo Lending 2,124.15 4,731.003.3 Others 1,111.71 1,424.53
4 Deferred Revenue Expenditure 502.55 1,268.32(to the extent not written off)
TOTAL 23,015.64 52,546.09
Notes to Accounts - Annexure I
Abridged Balance Sheet as at March 31, 2009

10
Rs. in Lakhs
HSBC UNIQUE OPPORTUNITIES FUND
Current PreviousYear ended Year ended
March 31, 2009 March 31, 2008
1 INCOME1.1 Dividend 384.14 393.571.2 Interest 385.31 375.941.3 Realised Gain / (Loss) on Foreign Exchange Transactions – –1.4 Realised Gains / (Losses) on Interscheme sale
of investments – –1.5 Realised Gains / (Losses) on External sale /
redemption of investments (24,424.79) 14,725.741.6 Realised Gains / (Losses) on Derivative Transactions (575.58) 288.911.7 Other Income – –
(A) (24,230.92) 15,784.16
2 EXPENSES2.1 Management fees 356.27 681.822.2 Service tax on Management fees ** – –2.3 Transfer agents fees and expenses 69.82 110.242.4 Custodian fees 17.17 31.182.5 Trusteeship fees 0.15 0.162.6 Commission to Agents * – –2.7 Marketing & Distribution expenses 256.06 483.802.8 Audit fees 0.75 0.822.9 Other operating expenses 646.64 880.842.10 Expenses to be Reimbursed by the Investment Manager (6.60) (15.49)
(B) 1,340.26 2,173.37
3 NET REALISED GAINS / (LOSSES)FOR THE YEAR / PERIOD (A - B = C) (25,571.18) 13,610.79
4 Change in Unrealised Depreciationin value of investments (D) (3,561.30) 6,660.05
5 NET GAINS / (LOSSES) FOR THEYEAR / PERIOD [E = (C-D)] (22,009.88) 6,950.74
6 Change in unrealised appreciationin the value of investments (F) (4.72) (681.30)
7 NET SURPLUS / (DEFICIT) FORTHE YEAR / PERIOD (E + F = G) (22,014.60) 6,269.44
7.1 Add: Balance transfer fromUnrealised Appreciation Reserve 4.72 681.30
7.2 Less: Balance transfer to UnrealisedAppreciation Reserve – –
7.3 Add / (Less): Equalisation – –7.4 Transfer from Reserve Fund – –7.5 Transfer from Unit Premium Reserve – –
8 TOTAL (22,009.88) 6,950.749 Dividend Appropriation9.1 Income Distributed during the year / period – –9.2 Tax on income distributed during the year / period – –10 Retained Surplus / (Deficit)
carried forward to Balance Sheet (22,009.88) 6,950.74
Notes to Accounts - Annexure I* Commission to Agents is included in Marketing & Distribution Expenses.** Service Tax on Management Fees is included in Other Operating Expenses.
Abridged Revenue Account for the year ended March 31, 2009
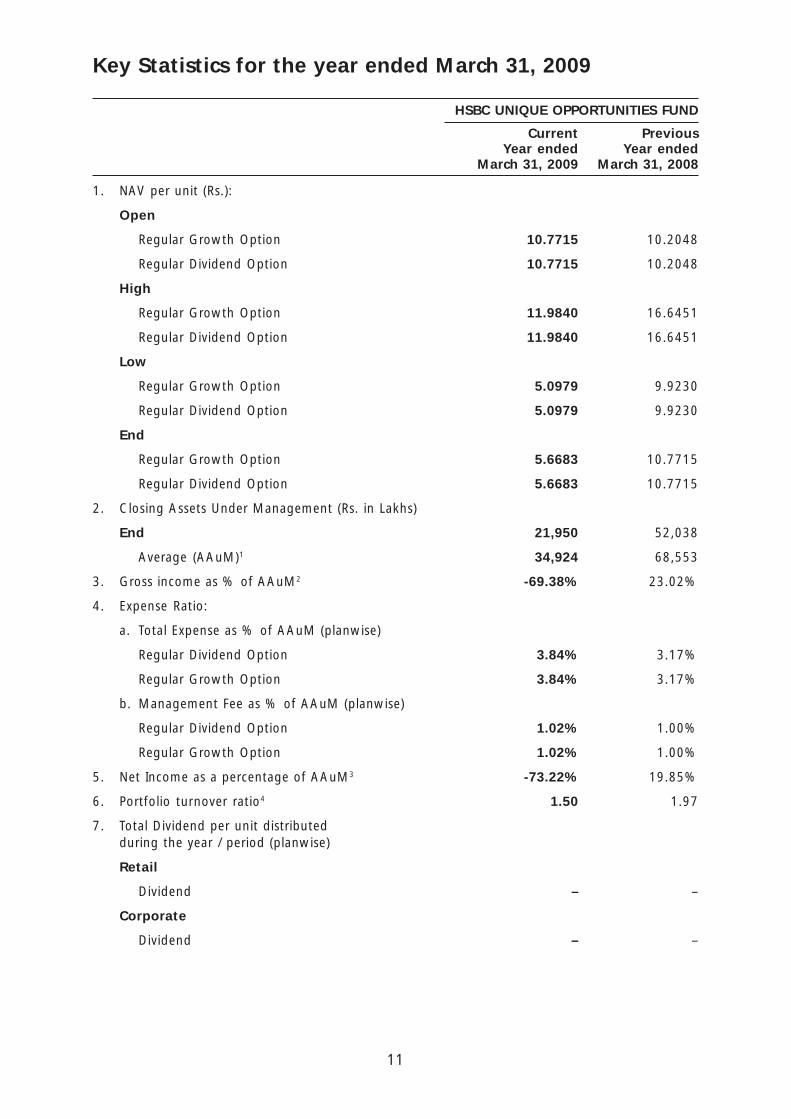
11
HSBC UNIQUE OPPORTUNITIES FUND
Current PreviousYear ended Year ended
March 31, 2009 March 31, 2008
1. NAV per unit (Rs.):
Open
Regular Growth Option 10.7715 10.2048
Regular Dividend Option 10.7715 10.2048
High
Regular Growth Option 11.9840 16.6451
Regular Dividend Option 11.9840 16.6451
Low
Regular Growth Option 5.0979 9.9230
Regular Dividend Option 5.0979 9.9230
End
Regular Growth Option 5.6683 10.7715
Regular Dividend Option 5.6683 10.7715
2. Closing Assets Under Management (Rs. in Lakhs)
End 21,950 52,038
Average (AAuM)1 34,924 68,553
3. Gross income as % of AAuM2 -69.38% 23.02%
4. Expense Ratio:
a. Total Expense as % of AAuM (planwise)
Regular Dividend Option 3.84% 3.17%
Regular Growth Option 3.84% 3.17%
b. Management Fee as % of AAuM (planwise)
Regular Dividend Option 1.02% 1.00%
Regular Growth Option 1.02% 1.00%
5. Net Income as a percentage of AAuM3 -73.22% 19.85%
6. Portfolio turnover ratio4 1.50 1.97
7. Total Dividend per unit distributedduring the year / period (planwise)
Retail
Dividend – –
Corporate
Dividend – –
Key Statistics for the year ended March 31, 2009

12
8. Returns:
a. Last One Year
Scheme
Regular Growth Option (47.3769) 5.5191
Regular Dividend Option (47.3769) 5.5191
Benchmark
BSE 200 (40.9800) 24.1334
b. Since Inception
Scheme
Regular Growth Option (24.3940) 7.4811
Regular Dividend Option (24.3940) 7.4811
Benchmark
BSE 200 (13.7400) 24.6963
1 AAuM = Average daily net assets
2 Gross income = amount against (A) in the Revenue Account i.e. Income.
3 Net income = amount against (C) in the Revenue Account i.e. NET REALISED GAINS / (LOSSES)FOR THE YEAR / PERIOD
4 Portfolio Turnover = Lower of sales or purchase divided by the Average AuM for the year / period.
Key Statistics for the year ended March 31, 2009 (Contd...)
HSBC UNIQUE OPPORTUNITIES FUND
Current PreviousYear ended Year ended
March 31, 2009 March 31, 2008

13
HSBC UNIQUE OPPORTUNITIES FUND
1 Investments:
1.1. It is confirmed that Investments of the Schemes are registered in the name of the Trusteesfor the benefits of the Schemes Unitholders.
1.2. Open Positions of derivatives amount to Rs. 10,647,000 and is 0.49% to Net Assets as atMarch 31, 2009. Open Positions of derivatives amount to Rs. 97,233,640 and is 1.87% toNet Assets as at March 31, 2008.
1.3. Investments in Associates and Group Companies(Rupees)
Issuer Instrument Amount Aggregate Amount AggregateType Investments Investments
by all schemes by all schemes
2009 2008
The Hongkong & Fixed deposits – 43,000,000 64,000,000 1,654,000,000Shanghai BankingCorporation Ltd.
1.4. Open position of Securities Borrowed and / or Lent by the scheme as of the year endedMarch 31, 2009 is NIL.
1.5. NPAs as at years ended March 31, 2009 and March 31, 2008 are NIL.
1.6. Aggregate Unrealised Gain / Loss as at the end of the Financial year ended and theirpercentages to net assets are as under:
Security Amount Percentage to Amount Percentage toCategory (Rs.) Net Assets (Rs.) Net Assets
2009 2008
Equity Shares
– Appreciation 125,878,670 5.7348% 178,066,434 3.4218%
– Depreciation 435,753,845 19.8521% 844,071,569 16.2202%
Equity Futures
– Appreciation 410,269 0.0187% 882,340 0.0170%
– Depreciation – – – –
1.7. The aggregate value of investments purchased and sold (including matured) during thefinancial period (excluding accretion of discount of Rs. 4,156,301) is Rs. 5,878,551,559 andRs. 6,358,764,847 respectively being 168.32% and 182.07% of the average daily net assets.
The aggregate value of investments purchased and sold (including matured) during thefinancial year end March 31, 2008 (excluding accretion of discount of Rs. 2,065,211) isRs. 12,708,719,308 and Rs.15,732,027,099 respectively being 185.39% and 229.49% ofthe average daily net assets.
1.8. Non-Traded securities in the portfolio:
Aggregate Value of Equity, Debt & Money Market Instruments and percentage to net assetsis as under
Security Fair Value % to Net Fair Value % to NetCategory (Rs.) Assets (Rs.) Assets
2009 2008
Equities – – 81,480,000 1.5658%
Total – – 81,480,000 1.5658%
Notes to Accounts - Annexure ITo the Abridged Balance Sheet and Revenue Account for the year ended March 31, 2009

14
Notes to Accounts - Annexure I (Contd...)To the Abridged Balance Sheet and Revenue Account for the year ended March 31, 2009
2 Disclosure under Regulation 25(8) of the Securities and Exchange Board of India (Mutual Funds)Regulations, 1996 as amended.
Year - 2008-2009During the year, HSBC Securities and Capital Markets (India) Private Limited, the Sponsor waspaid brokerage aggregating Rs. 435,189 on purchase and sale of investments. The Hongkongand Shanghai Banking Corporation Limited, an associate entity of HSBC Asset Management (India)Private Limited was paid brokerage amounting to Rs. 6,446,967 for procuring unit subscriptionsfor the Scheme and clearing member charges on derivative transactions Rs. 565,239. The brokeragepaid was at rates similar to those offered to other brokers / distributors.
Year - 2007-2008During the year, HSBC Securities and Capital Markets (India) Private Limited, the Sponsor waspaid brokerage aggregating Rs. 1,985,000 on purchase and sale of investments. The Hongkongand Shanghai Banking Corporation Limited, an associate entity of HSBC Asset Management (India)Private Limited was paid collection / bank charges amounting to Rs. 918, brokerage amountingto Rs. 55,187,005 for procuring unit subscriptions for the Scheme and clearing member chargeson derivative transactions Rs. 829,819. The brokerage paid was at rates similar to those offeredto other brokers / distributors.
Further, The Hongkong and Shanghai Banking Corporation Limited, an associate of the Sponsor,is on the panel of bankers with whom HSBC Mutual Fund places money on fixed deposits andenters into reverse repo transactions from time to time at competitive rates.
3 None of the Investors held more than 25% of the total net assets of the scheme at the yearended March 31, 2009 and March 31, 2008.
4 Unit Capital movement during the years ended March 31, 2009 and March 31, 2008.
2008-2009
Description Opening Units Subscription Redemption Closing Units Face Value
Growth 167,242,434.576 2,949,276.671 23,864,725.903 146,326,985.344 1,463,269,853.44
Dividend 315,868,063.747 5,267,633.300 80,217,828.011 240,917,869.036 2,409,178,690.36
2007-2008
Description Opening Units Subscription Redemption Closing Units Face Value
Growth 220,623,428.644 575,230.744 53,956,224.812 167,242,434.576 1,672,424,345.76
Dividend 416,532,247.579 5,852,778.315 106,516,962.147 315,868,063.747 3,158,680,637.47
5 Previous year’s figures have been re-grouped / re-arranged where appropriate.
6 No contingent liabilities for the years ended March 31, 2009 and March 31, 2008.
7 Expenses other than Management Fees are inclusive of Service Tax where applicable.
8 The Annual Accounts of the Schemes prepared in accordance with the accounting policies andstandards specified in the Ninth Schedule of The Securities and Exchange Board of India (MutualFunds) Regulations, 1996 has been approved by the Board of Directors of HSBC Asset Management(India) Private Limited and The Board of Trustees of HSBC Mutual Fund at their meeting held onJuly 06, 2009. The audit report attached herewith refers to the said annual accounts. The aforesaidabridged accounts are an extract of the Annual Accounts and are prepared in accordance withSEBI Circular No. IMD/Cir 8/132968/2008 dated July 24, 2008.

15
DISCLAIMERSThe content of this report has been prepared by HSBC Asset Management (India) Private Limited(HSBC) for information purposes only and should not be construed as an offer or solicitation of anoffer for purchase of any of the funds of HSBC Mutual Fund. The information is for general informationonly and does not have regard to specific investment objectives, financial situation and the particularneeds of any specific person who may receive this information. Investments in mutual funds inherentlyinvolve risks and investors should read the relevant documents / information for details and riskfactors and consult their legal, tax and financial advisors before investing. Investors should understandthat statements made herein regarding future prospects may not be realised. Neither this documentnor the units of HSBC Mutual Fund have been registered in any jurisdiction. The distribution of thisdocument in certain jurisdictions may be restricted or totally prohibited and accordingly, personswho come into possession of this document are required to inform themselves about, and to observe,any such restrictions.
Investors may obtain Statement of Additional Information, Combined Scheme Information Documentand Common Key Information Memorandums along with application forms from the office of HSBCMutual Fund, 314, D. N. Road, Fort, Mumbai 400 001. Tel: 022-6666 8819.
Statutory Details:HSBC Mutual Fund has been set up as a trust by HSBC Securities and Capital Markets (India) PrivateLimited (liability restricted to the corpus of Rs. 1 lakh). The Sponsor/associates of the Sponsor/AssetManagement Company (AMC) are not responsible or liable for any loss or shortfall resulting from theoperation of the Schemes. The Trustees of HSBC Mutual Fund have appointed HSBC Asset Management(India) Private Limited as the Investment Manager.
Risk Factors:All investments in mutual funds and securities are subject to market risks and the Net Asset Value(NAV) of the Scheme(s) may go up or down depending on the factors and forces affecting the securitiesmarkets. There can be no assurance that the objectives of the Scheme(s) will be achieved. Pastperformance of the Sponsor, AMC, Mutual Fund or any associates of the Sponsor/AMC does notindicate the future performance of the Scheme(s) of the Mutual Fund. HSBC Unique OpportunitiesFund (HUOF) is the names of the Scheme and does not in any manner indicate the quality of theScheme or its future prospects or returns.
Terms of Issue:Units of the Scheme(s) are being offered at NAV based prices, subject to the prevailing loads. TheAMC calculates and publishes NAVs and offers for sale, redemption and switch outs, units of theScheme(s) on all Business Days, at the Applicable NAV for all Schemes (at least once a week, i.e.,every Wednesday and daily during the period of redemption in case of HSCF). HUOF, HSCF & HFTSwill not be open for ongoing subscriptions/ switch ins. HUOF & HSCF would be available for sale onan ongoing basis (after a period of 3 years from the date of allotment). Conversion of HUOF & HSCFto an open-ended scheme will be done only after the balance unamortized amount has been fullyrecovered from the Scheme. Units can be redeemed/switched out on every Business Day at NAVbased prices, subject to prevailing exit loads. In case of HSCF, units can be redeemed / switched outon a monthly basis on the stipulated date i.e. last 3 business days of every month at NAV basedprices, subject to provisions of exit load, if any and recovery of balance proportionate unamortizedNFO expenses.
Load Structure (includes SIP/STP):During close ended period:
Exit - Nil. However the investor will have to bear the proportionate unamortized initial issue expensesfor exiting during the close ended period. SIP/SEP/STP in HUOF available after conversion to an open-ended scheme.
*No load in case of switches between equity Schemes of HSBC Mutual Fund.
Consult the nearest investor service centre for details.
The entry/exit load set forth above is subject to change at the discretion of the AMC and suchchanges shall be implemented prospectively.

16
Mutual Fund investments are subject to market risks. Please read the Statement of AdditionalInformation and Scheme Information Document carefully before investing.
Value Research Online DisclaimerValue Research Fund Ratings: Value Research Fund Ratings are a composite measure of historical risk-adjusted returns. In the case of equity funds this rating is based on the average monthly returns forthe last 3-year and 5-year period. These ratings do not take into account any entry or exit load.
Value Research Fund Ratings are subject to change every month. Current Fund Ratings are as onMarch 31, 2009. 142 open-ended Equity: Diversified Funds were rated. The Rating is based on primarydata provided by respective funds; Value Research does not guarantee the accuracy. Ranking Entity:Value Research Online.
ICRA Online Ranking MethodologyHSBC Monthly Income - Savings Plan has been ranked as a Five Star Fund in the category of 'OpenEnded Marginal Equity' schemes for its 3 year performance till December 31, 2008.
The rank is an outcome of an objective and comparative analysis against various parameters, including:risk adjusted return, fund size, company concentration, portfolio turnover and liquidity. The rankingmethodology did not take into account entry and exit loads imposed by the Fund. There were 27schemes considered in 'Open Ended Marginal Equity' category for the ranking exercise. The rank isneither a certificate of statutory compliance nor any guarantee on the future performance of HSBCMonthly Income - Savings Plan. Ranking Source & Publisher: ICRA Online Limited.
CRISIL Ranking MethodologyThe selection for the awards is based on the CRISIL FundServices' Composite Performance Ranking(CRISIL~CPR) methodology.
The CRISIL Composite Performance Ranking (CRISIL~CPR) is a quarterly ranking of mutual fund schemesbased on two year performance (excepting for the liquid and short term debt categories where a oneyear performance horizon is considered). The methodology is based on global best practices,customized to account for Indian market nuances. Over time, the rankings have become the industrystandard with good acceptance among Investors, Fund Intermediaries, Asset Management Companies,etc. The performance criteria covers not only risk adjusted returns, which are historical, but also theportfolio constitution to make the analysis forward looking.
CRISIL DisclaimerThe overall ranking is assigned to the scheme based on its weighted average score on a range ofparameters: Superior Return Score, Concentration, Liquidity, Asset Quality - Measures the creditquality of the portfolio, Average Maturity and Asset Size. HSBC MIP - Savings was the only schemethat won the CNBC TV18 - CRISIL Mutual Fund of the Year Award in the Category - Monthly IncomePlans - Aggressive. In total 13 schemes were eligible for the award universe. Schemes present in allfour quarterly CRISIL CPRs were considered for the award. The award is based on consistency of thescheme's performance in the four quarterly CRISIL CPR rankings released during the calendar year2008. The individual CRISIL CPR parameter scores averaged for the four quarters were further multipliedby the parameter weights as per the CRISIL CPR methodology to arrive at the final scores. A detailedmethodology of the CRISIL CPR is available at www.crisil.com. Past performance is no guarantee offuture results. Rankings and Award Source: CRISIL Fund Services, CRISIL Ltd. HSBC Monthly Income -Savings Plan has been ranked as a Five Star Fund in the category of 'Open Ended Marginal Equity'schemes for its 3 year performance till December 31, 2008. The rank is an outcome of an objectiveand comparative analysis against various parameters, including: risk adjusted return, fund size,company concentration, portfolio turnover and liquidity. The ranking methodology did not take intoaccount entry and exit loads imposed by the Fund. There were 27 schemes considered in 'OpenEnded Marginal Equity' category for the ranking exercise. The rank is neither a certificate of statutorycompliance nor any guarantee on the future performance of HSBC Monthly Income - Savings Plan.Ranking Source & Publisher: ICRA Online Limited.

Issued by HSBC Asset Management (India) Private Limited
HSBC Global Asset Management
HSBC Dynamic FundAn open-ended Scheme
Abridged Annual Report 2008 - 2009

1
Dear Investor,
We thank you for investing with HSBC Mutual Fund. We are pleased to inform you that HSBCMutual Fund has won prestigious awards* this year at various forums in India.
The awards* won by our schemes in India are
� HSBC Equity Fund has been included in the 5 star rated fund category (“Top rated mutualfunds” by Value Research online) in March, 2009.
� Five-stars indicate that a fund is in the top 10 per cent of its category in terms ofhistorical risk-adjusted returns.
� ICRA Mutual Fund Awards 2009
� HSBC MIP - Savings has been ranked a 5-Star Fund by ICRA Online indicating performanceamong the top 10% in the category of 'Open Ended Marginal Equity' for 3 yearperformance ending 31 December, 2008.
� CNBC TV18 - CRISIL Mutual Fund Awards 2008
� HSBC MIP - Savings was awarded the CNBC TV18 - CRISIL Mutual Fund of the YearAward for the year 2008 in the Monthly Income Plans - Aggressive Category.
(Past performance is no guarantee of future results. * Please refer to Ranking methodologyand disclaimer mentioned at the end of the Abridged Annual Report for the year endedMarch 31, 2009).
At the global level, the HSBC Group won several awards at Euromoney's Awards for Excellence2009. The top awards that HSBC won were the Best Global Bank and the Best Global DebtHouse. It was also honoured as the Best Debt House in 8 locations including Asia and the Bestat Risk Management in Asia. (Past performance may or may not be sustained in the future andis no guarantee of future results). We continue to be one of the leading players in emergingmarkets and remain committed to our asset management business in India.
HSBC Asset Management (India) Private Limited including the mutual fund business as well asthe PMS business (including EPFO money deployed till date) manages assets of about Rs. 26280Crores as at 30 June, 2009. The core to our winning strategy is our endeavour to deliverconsistent performance over the medium to long term for our investors in a risk controlledenvironment and aim for consistent wealth creation under varying market conditions. Throughour product range, we aim to be true to our reputation in India of being a provider ofinternational quality investment products and services.
We remain committed to our philosophy of aiming for consistent wealth creation and serviceexcellence and look forward to your continued investments in HSBC Mutual Fund.
Yours sincerely,
VikramaadityaChief Executive OfficerHSBC Asset Management (India) Private Limited

2
SPONSORHSBC Securities and Capital Markets (India) Private LimitedRegd. Office: 52/60, Mahatma Gandhi Road, Fort, Mumbai 400 001.
TRUSTEEBoard of TrusteesOffice: 314, D. N. Road, Fort, Mumbai 400 001.
ASSET MANAGEMENT COMPANYHSBC Asset Management (India) Private LimitedCorp. & Regd. Office: 314, D. N. Road, Fort, Mumbai 400 001.
CUSTODIANJP Morgan Chase BankCorp. & Regd. Office: Mafatlal Centre, 9th Floor, Nariman Point, Mumbai - 400 021.
AUDITORS TO THE SCHEMEPrice WaterhouseChartered Accountants252, Veer Savarkar Marg, Shivaji Park, Dadar (West), Mumbai - 400 028.
LEGAL ADVISORSBharucha & Partners4th Floor, Cecil Court, Mahakavi Bhushan Marg, Colaba, Mumbai - 400 039.
REGISTRAR & TRANSFER AGENTSComputer Age Management Services (P) Ltd. (CAMS)Rayala Towers, Tower I, III Floor, 158 Anna Salai, Chennai - 600 002.
BOARD OF TRUSTEESMr. N. P. Gidwani - Chairman
Dr. Rudolf ApenbrinkMr. Nasser MunjeeMr. Manu TandonMr. Mehli MistriMr. Dilip J. Thakkar
BOARD OF DIRECTORSMs. Naina Lal Kidwai - Chairman
Mr. Ayaz EbrahimMr. S. P. Mustafa**Mr. Vithal PalekarMs. Kishori J. Udeshi*Mr. Vikramaaditya - Chief Executive Officer***
* Ms. Kishori Udeshi has been appointed as a Director with effect from 14 January 2009 andMr. Jagjit Lal Pasricha has resigned as a Director with effect from 19 January 2009.
** Mr. S. P. Mustafa has been appointed as a Director with effect from 2 September 2008 andMr. Nawshir Khurody has resigned as a Director with effect from 1 September 2008
*** Mr. Vikramaaditya has been appointed as the Chief Executive Officer with effect from 16 July 2008and Mr. Sanjay Prakash has resigned as the Chief Executive Officer with effect from 16 July 2008.

3
Trustees' ReportFor the year ended March 31, 2009
The Trustees present the seventh report and the audited financial statements of the Schemesof HSBC Mutual Fund (the "Fund"), for the year ended March 31, 2009.
1. SCHEME PERFORMANCE, FUTURE OUTLOOK AND OPERATIONS OF THE SCHEME
a) Operations and Performance of the Scheme
HSBC Dynamic Fund (HDF) - an open-ended Scheme
HDF seeks to provide long term capital appreciation by allocating funds in equity and equityrelated instruments. It also has the flexibility to move, entirely if required, into debt instrumentsin times that the view on equity markets seems negative.
The net assets of HSBC Dynamic Fund amounted to Rs. 234.13 crores as at March 31, 2009.87.98 % of the net assets were invested in equities and 12.02% were invested in debt andmoney market instruments as at March 31, 2009.
HDF outperformed the benchmark by 625 bps over the past 1 year on its active asset allocationcalls taken during the year.
Date of Inception : 24 September, 2007 Compounded Annualized Returns (%)
Schemes (P2P) 1 Year Since Inception
HSBC Dynamic Fund - Growth -34.73 -26.18
BSE 200 -40.98 -32.50
Past performance may or may not be sustained in future. 'Since inception' returns are calculatedon Rs. 10 invested at inception. Calculations are based on Growth NAVs.
b) Market Overview & Outlook
MARKET OVERVIEW
(as furnished by HSBC Asset Management (India) Private Limited)
Equity Market Overview
The financial year ended 31 March, 2009 was a highly eventful one with long standing institutionsdisappearing from the landscape in the whirlwind of the sub-prime crisis and derivative losses. Theyear can be split into three phases - the first from April 2008 till when Lehman Brothers filed forbankruptcy, which saw a blowout commodity rally (crude oil nudged close to USD 144/barrel) andthe sub-prime situation turning progressively worse. The United States (US) Government / FederalReserve bailed out major institutions thought to be critical to the functioning of the financial system.The second phase from September 2008 till January 2009 saw a spate of bankruptcies most notablyLehman Brothers which saw the appearance of an acute level of risk aversion pushing the creditmarkets into a gridlock. This phase also coincided with the fiscal / monetary stimuli by variousgovernments to take the credit crisis head on. Globally, markets stabilized around their October2008 lows and a semblance of normality started re-appearing in financial markets in this period. Thethird phase from February 2009 onwards witnessed a sharp rally as a weakening US Dollar spewedmoney into emerging markets. The sensex fell by 38% during the financial year.
For the financial year 2009, the popular indices viz. BSE Sensex and CNX Nifty were down 37.94%and 36.19% respectively. The BSE Midcap (54.01)% and the broader indices like BSE 200 (40.98)%and BSE 500 (42.77)% also reflected the correction across the markets. Within sectoral indices thebest performing indices were BSE FMCG (11.08)% and BSE Oil and Gas (29.58)% while the worstperforming indices were BSE Realty (79.37)%, due to the high leverage on the balance sheets, BSEMetals (58.67)%, due to slowdown in global growth and BSE Consumer Durables (58.14)% and BSECapital goods (53.84%).

4
In a year that saw sell-off across emerging markets, FIIs were net sellers of the tune USD 10.4 billionin the Indian equity markets while Domestic Institutional Investors (Insurance & Mutual Funds) werebuyers to the tune of USD 13.1 billion. Further, FIIs were net sellers in the derivative markets ashedge funds, and p-notes unwound positions in a rapidly deleveraging world. Thus, sentimentremained negative as few US based investment banks filed for bankruptcy in the midst of the liquidityand credit crisis and safety took precedence over growth.
Debt Market Overview
Two contrarian forces one inflationary and the other deflationary had been in play since 2007: Onthe one hand strong demand from emerging economies were leading commodities higher and fuellinginflation, while on the other the housing led credit crisis in the US was starting to exert a deflationaryforce. The first force was dominant till early July 2008 leading commodity prices to fresh peaks andinflation to multi year highs. Since then, however, the second force took hold with the result thatcommodity prices fell sharply from the top, growth and inflation numbers toppled worldwide, andcentral bankers shifted focus to achieving financial stability and protecting growth.
The financial crisis hit the domestic markets towards September 2008, leading to acute disruption inmoney markets. The Reserve Bank of India (RBI) acted proactively cutting the cash reserve ratio (CRR)by an unprecedented 400 bps between September 2008 and January 2009. Similarly, the reverserepo rate had been cut by 275 bps since October 2008 while the repo rate had been cut by 425 bpsover the same period.
Bond market yields fell in line with the unprecedented monetary easing up till the first week ofJanuary 2009. Thereon, supply pressures on bond markets rose as a result of government fiscalslippages aimed at stimulating the economy. The RBI, in line with similar measures elsewhere in theworld, started buying government securities to lessen the impact on yields from the rise in governmentborrowing. Although this helped market sentiment, it could not prevent a general rise in yieldstowards fiscal close. As a result, the 10 year benchmark sovereign yield closed the fiscal at 7% froma low of sub 5% hit in early January 2009. Money market rates stabilized after the initial mayhem ofSeptember 2008 and October 2008 and liquidity came back to interbank markets.
MARKET OUTLOOK
(as furnished by HSBC Asset Management (India) Private Limited)
Equity Market Outlook
Financial Year (FY) 2008-09 was a year marked by a strong correlation between the Indian marketand global markets with key indices ending deeply in the red on the back of the subprime crisis andderivative led losses across major financial stocks in the United States (US). Even in India, forex lossesran across corporate India though at a smaller magnitude. FY 10 has begun on a better note onaccount of various fundamental and technical factors.
GDP for FY 09 grew at 6.7% against FY 08 levels of 9%. Agriculture posted a below trend growthrate of 1.6% and industry grew by 3.9% (versus 8.1% in FY 08) with services registering a close to9.7% growth. IIP grew by a mere 2.6%. Although order books of engineering / capital goods wererunning at record high levels, there was possibility of delays in execution as funding sources for thedevelopers (equity, ECB, private equity, FCCB) had dried up. A sharp increase in subsidy on accountof oil, fertilizers and food led to a cut back in discretionary spending. Inflation rose on the back of asurging crude and higher prices of agricultural commodities to top at 12.91% for the week ending 2August, 2008. A slow down in the growth rates in the US / EU and other markets finally tamed thesurge in crude. As growth rates stumbled, governments / monetary authorities the world over triggeredfiscal stimuli / monetary easing to escape recessionary forces. This was followed in India as wellwhich started monetary easing / fiscal stimuli to keep growth rates buoyant.
On the positive side, India continues to do better in relative terms and we expect GDP growth of6-6.5% for FY10. The broad themes that are driving domestic growth viz. capital expenditure,infrastructure building and domestic consumption are still intact. The key concerns at this point
Trustees' ReportFor the year ended March 31, 2009 (Contd...)

5
stems from a ballooning fiscal deficit at the consolidated level (Centre & State) with salary revisionfor Central / State Government employees threatening a cut back in discretionary spending. Inflationis likely to remain benign for the first half of FY10 on a favourable base effect but we anticipate it togo back to trend levels of 5-5.5% for the second half of FY10 as this base effect wears off.
On a valuations perspective, the markets are currently trading at a P/E ratio of around 12 timesFY 2010 earnings. This is well below the 10-year average given the extreme risk aversion prevailing inthe markets. However, the underlying growth in the economy and corporate earnings growth (15%in the long term) makes the market attractive from a longer-term view. The short term could seeenhanced volatility arising from various factors. Increase in commodity prices continues to be a riskin the medium term as the US dollar continues to struggle with the ballooning US fiscal situation.
Debt Market Outlook
Excess supply of government bonds, as a result of fiscal slippages to arrest the downward growthmomentum, has been a reality for bond markets since January 2009. However, this is now compoundedwith some fatigue in buying longer duration as economic data is showing signs of recovery,commodities are showing signs of rally and expectations of incremental monetary easing from theRBI are beginning to unwind. However, system liquidity remains surplus and bank deposits continueto grow thereby providing resistance to bond yields from rising sharply.
Given the above factors, we believe that the market would continue to provide tactical opportunitiesalthough the fundamental bias should be for lower duration. Also, any mitigation of bond supplypressure or a new downturn in the ongoing economic recovery may provide space for opportunisticlonger duration plays. On the other hand, if the recovery cycle continues uninterrupted and commodityprices remain firm, central banks may start to worry about withdrawing the current monetary stimulusby sometime early 2010; with consequent impact on bond markets.
2. BRIEF BACKGROUND OF SPONSORS, BOARD OF TRUSTEES AND ASSETMANAGEMENT COMPANY
a) Sponsor
HSBC Mutual Fund is sponsored by HSBC Securities and Capital Markets (India) Private Limited (HSCI).The Sponsor is the Settler of the Mutual Fund Trust. The Sponsor has entrusted a sum of Rs. 1,00,000(Rupees One Lakh only) to the Trustee as the initial contribution towards the corpus of the MutualFund.
HSCI is a member of the HSBC Group, one of the largest banking and financial services organisations,in the world. Headquartered in London, HSBC operates through long-established businesses in fiveregions: Europe, Asia-Pacific, Middle East, America and Africa. Through its global network of 10,000offices in 86 countries and territories, HSBC provides a comprehensive range of financial services topersonal, commercial, corporate, institutional investment and private banking clients.
HSCI offers integrated investment banking services, securities and corporate finance & advisory. HSCIis a member of The Bombay Stock Exchange Limited and National Stock Exchange (capital and derivativemarket segments) and is also a category I merchant banker and underwriter registered with Securitiesand Exchange Board of India.
HSCI holds 100% of the paid-up equity share capital of the AMC.
b) HSBC Mutual Fund
HSBC Mutual Fund ("the Mutual Fund" or "the Fund") has been constituted as a Trust in accordancewith the provisions of the Indian Trusts Act, 1882 (2 of 1882) vide a Trust Deed dated February 7,2002 with HSBC Securities and Capital Markets (India) Private Limited, as the Sponsor and the Boardof Individual Trustees. The Trustee has entered into an Investment Management Agreement datedFebruary 7, 2002 with HSBC Asset Management (India) Private Limited (the AMC) to function as theInvestment Manager for all the Schemes of the Fund. The Fund was registered with SEBI videregistration number MF/046/02/5 dated May 27, 2002.
Trustees' ReportFor the year ended March 31, 2009 (Contd...)

6
The Trust has been formed for the purpose of pooling of capital from the public for collectiveinvestment in securities / any other property for the purpose of providing facilities for participationby persons as beneficiaries in such properties / investments and in the profits / income arising therefrom.
c) Board of Trustees (the Trustees)
The Board of Trustees are the exclusive owner of the Trust Fund and holds the same in trust for thebenefit of the unitholders. The Trustees have been discharging their duties and carrying out theirresponsibilities as provided in the SEBI (Mutual Funds) Regulations, 1996 and the Trust Deed. TheTrustees seeks to ensure that the Fund and the Schemes floated thereunder are managed by theAMC in accordance with the Trust Deed, the said Regulations, directions and guidelines issued bySEBI, the Stock Exchanges, the Association of Mutual Funds of India and other regulatory agencies.
d) Asset Management Company (the AMC)
HSBC Asset Management (India) Private Limited (the Investment Manager or the AMC) is a privatelimited company incorporated under the Companies Act, 1956 on December 12, 2001 having itsRegistered Office at 314, D. N. Road, Fort, Mumbai 400 001. HSBC Asset Management (India) PrivateLimited has been appointed as the Asset Management Company of the HSBC Mutual Fund by theTrustee vide Investment Management Agreement (IMA) dated February 7, 2002 and executed betweenthe Trustees and the AMC. SEBI approved the AMC to act as the Investment Manager of the Fundvide. its letter No. MFD/BC/163/2002 dated May 27, 2002.
The paid-up equity share capital of the AMC is Rs. 9 crores. HSBC Securities and Capital Markets(India) Private Limited holds 100% of the paid-up equity share capital of the AMC.
3. INVESTMENT OBJECTIVE OF THE SCHEMEThe investment objective of the Scheme has been provided above under the heading "SchemePerformance, Future Outlook and Operation of the Scheme" (refer Section 1).
4. SIGNIFICANT ACCOUNTING POLICIESThe accounting policies are in accordance with Securities and Exchange Board of India (Mutual Funds)Regulations, 1996.
5. UNCLAIMED DIVIDENDS & REDEMPTIONSSummary of number of Investors & corresponding amount
Unclaimed Dividends Unclaimed Redemptions
Scheme Amount No. of Amount No. of(Rs.) Investors (Rs.) Investors
HSBC Dynamic Fund – – 127,659.32 11
6. INVESTOR SERVICESDuring the year, the number of official points of acceptance of transactions increased significantly toabout 182 locations. In addition to the offices of the transfer agency, the company has InvestorService Centres in 14 locations at its own offices - namely Mumbai, New Delhi, Kolkata, Chennai,Bangalore, Hyderabad, Pune, Ahmedabad, Indore, Chandigarh, Kochi, Coimbatore, Lucknow andVadodara. With a view to enhancing customer convenience, the Asset Management Company hasextended the facility of crediting investor bank accounts directly by way of NEFT / RTGS (for credit ofredemption and dividend proceeds). The AMC endeavours to despatch dividend proceeds within 5working days from the Record Date in all Schemes. The internal standards on redemption payoutshave been consistently met, with very few exceptions. The number of locations for the ECS AutoDebit facility for investments through Systematic Investment Plan also increased to about 74 byMarch 2009.
Trustees' ReportFor the year ended March 31, 2009 (Contd...)

7
On the distribution front, the number of empanelled distributors increased from 7859 as on 31March, 2008 to 8632 as on 31 March, 2009. During the year, the Asset Management Companyinitiated tie-ups for online distribution of the Mutual Fund's schemes with several channel partnerstaking the total number of such tie-ups to 24 (Angel Capital & Department Market Ltd., Bajaj CapitalLimited, Bonanza Portfolio Limited, Citibank N.A., Citigroup Wealth Advisors India Private Limited,HDFC Bank Limited, Hongkong & Shanghai Banking Corporation Limited, HSBC Corporate InvestmentSolution Services, ICICI Securities Limited, India Infoline Limited, Karvy Stock Broking Limited, KotakMahindra Bank Limited, Kotak Securities Limited, Motilal Oswal Securities Limited, NJ India InvestPrivate Limited, Reliance Securities Limited, RR Investors Capital Services Private Limited, SBICAPSecurities Limited, Sharekhan Limited, SMC Global Securities Limited, Standard Chartered - STCICapital Markets Ltd., Tom Distribution Services Limited, Yes Bank Limited).
Call centre operations have been extended to cover the entire country. The Asset ManagementCompany has outsourced certain back office services including call centre services to HSBC Operationsand Processing Enterprise (India) Private Limited (HOPE).
7. STATUTORY DETAILSa) The Sponsors are not responsible or liable for any loss resulting from the operation of the Schemes
of the Fund beyond initial contribution of Rs. 1 lakh for setting up the Fund.
b) The price and redemption value of the units, and income from them, can go up as well as downwith fluctuations in the market value of its underlying investments.
c) Full / Abridged Annual Report shall be disclosed on the website at www.assetmanagement.hsbc.com/inand shall be available for inspection at the Head Office of the mutual fund. Present and prospectiveunit holder can obtain copy of the trust deed, the Full / Abridged Annual Report of the Scheme(s),the Annual Report of HSBC Asset Management (India) Private Limited and the text of the relevantScheme(s) at a price.
8. ACKNOWLEDGEMENTSThe Trustees wish to thank the Unitholders of the Schemes for their support throughout the year andalso thank the Government of India, the Securities and Exchange Board of India (SEBI), the ReserveBank of India (RBI) and the Association of Mutual Funds in India (AMFI) for the guidance provided bythem. The Trustees also appreciate the service provided by the Registrar and Transfer Agent, FundAccountant, Custodian, Bankers, Distributors and Brokers. The guidance and services provided bythe Auditors and advocates and the ebullience, sincerity and dedication of the employees of HSBCAsset Management (India) Private Limited is also appreciated.
The Trustees look forward to the continued support of everyone.
For and on behalf of the Board of Trustees of HSBC Mutual Fund
Dilip J. Thakkar
Trustee
MUMBAIJuly 6, 2009
Trustees' ReportFor the year ended March 31, 2009 (Contd...)

8
To the Board of Trustees of
HSBC MUTUAL FUND
1. We have audited the Balance Sheet of HSBC Mutual Fund - HSBC Dynamic Fund ("The Scheme")as at March 31, 2009 and the related Revenue Account for year ended on that date, both ofwhich we have signed under reference to this report. These financial statements are theresponsibility of the Board of Trustees of HSBC Mutual Fund and the Management of HSBC AssetManagement (India) Private Limited (the "Management"). Our responsibility is to express anopinion on these financial statements based on our audit.
2. We have conducted our audit in accordance with auditing standards generally accepted in India.Those standards require that we plan and perform the audit to obtain reasonable assuranceabout whether the financial statements are free of material misstatement. An audit includesexamining, on a test basis, evidence supporting the amounts and disclosures in the financialstatements. Our procedures included confirmation of securities owned and unit capital balancesas at March 31, 2009 by correspondence with the custodian / others and registrar and transferagent respectively. An audit also includes assessing the accounting principles used and significantestimates made by the Management as well as evaluating the overall financial statementpresentation. We believe that our audit provides a reasonable basis for our opinion.
3. We have obtained all the information and explanations which to the best of our knowledge andbelief were necessary for the purpose of our audit. The Balance Sheet and the Revenue Accountreferred to above are in agreement with the books of account of the Scheme.
4. In our opinion and to the best of our information and according to the explanations given to us,
(i) The Balance Sheet and the Revenue Account together with the notes thereon give theinformation required by the Securities and Exchange Board of India (Mutual Funds) Regulations,1996 and amendments thereto, as applicable, and also give respectively, a true and fair viewof the state of affairs of HSBC Mutual Fund - HSBC Dynamic Fund as at March 31, 2009 andits net deficit for the year ended on that date.
`(ii) The Balance Sheet as at March 31, 2009 and the Revenue Account for the year ended March31, 2009, together with the notes thereon have been prepared in all material respects inaccordance with the accounting policies and standards specified in the Ninth Schedule of theSecurities and Exchange Board of India (Mutual Funds) Regulations, 1996 and amendmentsthereto as applicable.
(iii) The method used to value non-traded and thinly traded debt securities in accordance withthe guidelines for valuation of securities for mutual funds dated September 18, 2000 andamendments thereto, as applicable, issued by the Securities and Exchange Board of India asat March 31, 2009 as determined by HSBC Asset Management (India) Private Limited underprocedures approved by the Board of Trustees of HSBC Mutual Fund are fair and reasonable.
Partha GhoshPartnerMembership No. F / 55913
For and on behalf ofPRICE WATERHOUSEChartered Accountants
Place : MumbaiDate : July 6, 2009
Auditors' Report

9
Rs. in Lakhs
HSBC DYNAMIC FUND
As at As atMarch 31, 2009 March 31, 2008
LIABILITIES1 Unit Capital 37,112.01 41,929.34
2 Reserves & Surplus2.1 Unit Premium Reserves (437.55) (430.34)2.2 Unrealised Appreciation Reserve – –2.3 Other Reserves (13,261.07) (970.53)
3 Loans & Borrowings – –
4 Current Liabilities & Provisions4.1 Provision for doubtful Income / Deposits – –4.2 Other Current Liabilities & Provisions 524.09 2,983.47
TOTAL 23,937.48 43,511.94
ASSETS1 Investments1.1. Listed Securities:1.1.1 Equity Shares 16,557.67 28,377.001.1.2 Preference Shares – –1.1.3 Equity Linked Debentures – –1.1.4 Other Debentures & Bonds 1,580.65 5,286.111.1.5 Securitised Debt securities – –1.2 Securities Awaited Listing:1.2.1 Equity Shares – –1.2.2 Preference Shares – –1.2.3 Equity Linked Debentures – –1.2.4 Other Debentures & Bonds – –1.2.5 Securitised Debt securities – –1.3 Unlisted Securities:1.3.1 Equity Shares – –1.3.2 Preference Shares – –1.3.3 Equity Linked Debentures – –1.3.4 Other Debentures & Bonds – 2,302.191.3.5 Securitised Debt securities – –1.4 Government Securities – –1.5 Treasury Bills – –1.6 Commercial Paper – –1.7 Certificate of Deposits – 3,957.381.8 Bill Rediscounting – –1.9 Units of Domestic Mutual Fund – –1.10 Foreign Securities – –
Total Investments 18,138.32 39,922.68
2 Deposits 2,610.00 1,460.003 Other Current Assets3.1 Cash & Bank Balance 8.85 19.693.2 CBLO / Reverse Repo Lending 1,789.24 112.553.3 Others 1,391.07 1,997.004 Deferred Revenue Expenditure – –
(to the extent not written off)
TOTAL 23,937.48 43,511.93
Notes to Accounts - Annexure I
Abridged Balance Sheet as at March 31, 2009

10
Rs. in Lakhs
HSBC DYNAMIC FUND
Current PreviousYear ended Year ended
March 31, 2009 March 31, 2008
1 INCOME1.1 Dividend 336.18 32.761.2 Interest 673.29 693.851.3 Realised Gain / (Loss) on Foreign Exchange Transactions – –1.4 Realised Gains / (Losses) on Interscheme sale of investments (76.49) –1.5 Realised Gains / (Losses) on External sale / redemption of
investments (16,761.36) 3,067.311.6 Realised Gains / (Losses) on Derivative Transactions 325.07 (57.04)1.7 Other Income – –
(A) (15,503.31) 3,736.88
2 EXPENSES2.1 Management fees 338.27 293.662.2 Service tax on Management fees ** – –2.3 Transfer agents fees and expenses 62.10 32.042.4 Custodian fees 21.36 16.372.5 Trusteeship fees 0.13 0.062.6 Commission to Agents * – –2.7 Marketing & Distribution expenses 237.63 190.142.8 Audit fees 1.00 0.502.9 Other operating expenses 69.36 68.35
(B) 729.85 601.12
3 NET REALISED GAINS / (LOSSES)FOR THE YEAR / PERIOD (A - B = C) (16,233.16) 3,135.76
4 Change in Unrealised Depreciation invalue of investments (D) (3,026.54) 3,995.38
5 NET GAINS / (LOSSES) FOR THEYEAR / PERIOD [E = (C - D)] (13,206.62) (859.62)
6 Change in unrealised appreciationin the value of investments (F) – –
7 NET SURPLUS / (DEFICIT) FOR THEYEAR / PERIOD (E + F = G) (13,206.62) (859.62)
7.1 Add: Balance transfer from Unrealised Appreciation Reserve – –7.2 Less: Balance transfer to Unrealised Appreciation Reserve – –7.3 Add / (Less) : Equalisation 916.08 (110.91)7.4 Transfer from Reserve Fund – –7.5 Transfer from Unit Premium Reserve – –
8 TOTAL (12,290.54) (970.53)
9 Dividend Appropriation9.1 Income Distributed during the year / period – –9.2 Tax on income distributed during the year / period – –
10 Retained Surplus / (Deficit) carried forward toBalance Sheet (12,290.54) (970.53)
Notes to Accounts - Annexure I* Commission to Agents is included in Marketing & Distribution Expenses.** Service Tax on Management Fees is included in Other Operating Expenses.
Abridged Revenue Account for the year ended March 31, 2009

11
HSBC DYNAMIC FUND
Current PreviousYear ended Year ended
March 31, 2009 March 31, 2008
1. NAV per unit (Rs.):
Open
Regular Growth Option 9.6659 –
Regular Dividend Option 9.6659 –
High
Regular Growth Option 10.5800 13.0594
Regular Dividend Option 10.5800 13.0594
Low
Regular Growth Option 5.7717 9.3582
Regular Dividend Option 5.7717 9.3582
End
Regular Growth Option 6.3088 9.6659
Regular Dividend Option 6.3088 9.6659
2. Closing Assets Under Management (Rs. in Lakhs)
End 23,413 40,528
Average (AAuM)1 31,327 48,504
3. Gross income as % of AAuM2 -49.49% 7.70%
4. Expense Ratio:
a. Total Expense as % of AAuM (planwise)
Regular Growth Option 2.33% 0.65%
Regular Dividend Option 2.33% 0.65%
b. Management Fee as % of AAuM (planwise)
Regular Growth Option 1.08% 0.32%
Regular Dividend Option 1.08% 0.32%
5. Net Income as a percentage of AAuM3 -51.82% 6.46%
6. Portfolio turnover ratio4 1.69 1.23
7. Total Dividend per unit distributed duringthe year / period (planwise)
Retail
Regular Dividend Option – –
Corporate
Regular Dividend Option – –
Key Statistics for the year ended March 31, 2009

12
8. Returns:
a. Last One Year
Scheme
Regular Growth Option (34.7314) NA
Regular Dividend Option (34.7314) NA
Benchmark
BSE 200 (40.9800) 24.1334
b. Since Inception
Scheme
Regular Growth Option (26.1763) (3.3410)
Regular Dividend Option (26.1763) (3.3410)
Benchmark
BSE 200 (32.5000) (6.6838)
1 AAuM = Average daily net assets
2 Gross income = amount against (A) in the Revenue Account i.e. Income.
3 Net income = amount against (C) in the Revenue Account i.e. NET REALISED GAINS / (LOSSES)FOR THE YEAR / PERIOD
4 Portfolio Turnover = Lower of sales or purchase divided by the Average AuM for the year / period.
Key Statistics for the year ended March 31, 2009 (Contd...)
HSBC DYNAMIC FUND
Current PreviousYear ended Year ended
March 31, 2009 March 31, 2008

13
HSBC DYNAMIC FUND
1 Investments1.1. It is confirmed that investments of the schemes are registered in the name of the Trustees for
the benefit of the scheme's unitholders.
1.2. Open Positions of derivatives amount to Rs. (47,034,850) and is 2.01% to Net Assets for theyear end March 31, 2009. Open Positions of derivatives amount to 112,957,465 and is 2.79%to Net Assets for the year end March 31, 2008.
1.3. There were no investments made in Associates and Group Companies by the scheme for theyears ended March 31, 2009 and March 31, 2008.
1.4. Open position of Securities Borrowed and / or Lent by the scheme as of the year endedMarch 31, 2009 is NIL.
1.5. NPAs as at years ended March 31, 2009 and March 31, 2008 are NIL.
1.6. Aggregate Unrealised Gain / Loss as at the end of the Financial year 2008-2009 and percentageto net assets.
Security Amount Percentage to Amount Percentage toCategory (Rs.) Net Assets (Rs.) Net Assets
2009 2008
Equity Shares
– Appreciation 103,451,368 4.4185% 49,719,389 1.2268%
– Depreciation 198,113,243 8.4615% 447,766,262 11.0482%
NCDs and Bonds Listed / Awaiting Listing
– Appreciation 384,760 0.0164% 5,034 0.0001%
– Depreciation 1,741,121 0.0744% 1,158,154 0.0286%
NCDs and Bonds Privately Placed
– Appreciation – – – –
– Depreciation – – 6,072 0.0001%
Equity Futures
– Appreciation – – 163,025 0.0040%
– Depreciation 865,408 0.0370% 494,855 0.0122%
1.7. The aggregate value of investments purchased (excluding accretion of discount ofRs. 11,758,508) and sold during the financial year 2008-2009 is Rs. 10,072,387,041 andRs. 10,882,064,228 respectively being 321.53% and 347.37% of the average daily net assets.The aggregate value of investments purchased (excluding accretion of discount ofRs. 12,491,050) and sold during the financial year 2007-2008 is Rs. 15,940,088,363 andRs. 11,867,836,306 respectively being 506.99% and 377.47% of the average daily net assets.
1.8. Non -Traded securities in the portfolio:Aggregate Value of Equity, Debt & Money Market Instruments and percentages to net assetsare as under :
Security Fair Value Percentage to Fair Value Percentage toCategory (Rs.) Net Assets (Rs.) Net Assets
2009 2008
Equities – – 10,390,400 0.2564%
Debt Instruments 77,003,317 3.2889% 758,829,637 18.7234%
Money marketInstrument – – 395,738,471 9.7645%
Total 77,003,317 3.2889% 1,164,958,509 28.7442%
Notes to Accounts - Annexure ITo the Abridged Balance Sheet and Revenue Account for the year ended March 31, 2009

14
Notes to Accounts - Annexure I (Contd...)To the Abridged Balance Sheet and Revenue Account for the year ended March 31, 2009
2 Disclosure under Regulation 25(8) of the Securities and Exchange Board of India (Mutual Funds)Regulations, 1996 as amended :
Year - 2008-2009
HSBC Securities and Capital Markets (India) Private Limited, the Sponsor was paid brokerageaggregating Rs. 750,929 on purchase and sale of investments. The Hongkong & Shanghai BankingCorporation Limited, an associate entity of HSBC Asset Management (India) Private Limited waspaid collection/bank charges amounting to Rs 1,292, brokerage amounting to Rs. 6,097,974 forprocuring unit subscriptions for the Scheme and clearing member charges on derivative transactionsRs.1,169,977. The brokerage paid was at rates similar to those offered to other brokers /distributors.
Year - 2007-2008
HSBC Securities and Capital Markets (India) Private Limited, the Sponsor was paid brokerageaggregating Rs. 747,000 on purchase and sale of investments. The Hongkong & Shanghai BankingCorporation Limited, an associate entity of HSBC Asset Management (India) Private Limited waspaid collection/bank charges amounting to Rs 8,379, brokerage amounting to Rs. 36,171,822for procuring unit subscriptions for the Scheme and clearing member charges on derivativetransactions Rs. 742,479. The brokerage paid was at rates similar to those offered to other brokers /distributors
3 None of the Investors held more than 25% of the total net assets of the scheme at the yearended March 31, 2009 and year ended March 31, 2008.
4 Unit Capital movement during the years ended March 31, 2009 and March 31, 2008.
2008-2009
Description Opening Units Subscription Redemption Closing Units Face Value
Regular Growth Option 205,008,927.831 15,555,453.448 30,316,280.414 190,248,100.865 1,902,481,008.65
Regular Dividend Option 214,284,442.273 12,615,611.127 46,028,070.996 180,871,982.404 1,808,719,824.04
2007-2008
Description Opening Units Subscription Redemption Closing Units Face Value
Regular Growth Option – 261,782,016.976 56,773,089.145 205,008,927.831 2,050,089,278.31
Regular Dividend Option – 269,550,102.530 55,265,660.257 214,284,442.273 2,142,844,422.73
5 Previous year’s figures have been re-grouped / re-arranged where appropriate.
6 No contingent liabilities for the year ended March 31, 2009 and March 31, 2008.
7 Expenses other than Management Fees are inclusive of Service Tax where applicable.
8 The Annual Accounts of the Schemes prepared in accordance with the accounting policies andstandards specified in the Ninth Schedule of The Securities and Exchange Board of India (MutualFunds) Regulations, 1996 has been approved by the Board of Directors of HSBC Asset Management(India) Private Limited and The Board of Trustees of HSBC Mutual Fund at their meeting held onJuly 06, 2009. The audit report attached herewith refers to the said annual accounts. The aforesaidabridged accounts are an extract of the Annual Accounts and are prepared in accordance withSEBI Circular No. IMD/Cir 8/132968/2008 dated July 24, 2008.

15
DISCLAIMERSThe content of this report has been prepared by HSBC Asset Management (India) Private Limited(HSBC) for information purposes only and should not be construed as an offer or solicitation of anoffer for purchase of any of the funds of HSBC Mutual Fund. The information is for general informationonly and does not have regard to specific investment objectives, financial situation and the particularneeds of any specific person who may receive this information. Investments in mutual funds inherentlyinvolve risks and investors should read the relevant documents / information for details and riskfactors and consult their legal, tax and financial advisors before investing. Investors should understandthat statements made herein regarding future prospects may not be realised. Neither this documentnor the units of HSBC Mutual Fund have been registered in any jurisdiction. The distribution of thisdocument in certain jurisdictions may be restricted or totally prohibited and accordingly, personswho come into possession of this document are required to inform themselves about, and to observe,any such restrictions.
Investors may obtain Statement of Additional Information, Combined Scheme Information Documentand Common Key Information Memorandums along with application forms from the office of HSBCMutual Fund, 314, D. N. Road, Fort, Mumbai 400 001. Tel: 022-6666 8819.
Statutory Details:HSBC Mutual Fund has been set up as a trust by HSBC Securities and Capital Markets (India) PrivateLimited (liability restricted to the corpus of Rs. 1 lakh). The Sponsor/associates of the Sponsor/AssetManagement Company (AMC) are not responsible or liable for any loss or shortfall resulting from theoperation of the Schemes. The Trustees of HSBC Mutual Fund have appointed HSBC Asset Management(India) Private Limited as the Investment Manager.
Risk Factors:All investments in mutual funds and securities are subject to market risks and the Net Asset Value(NAV) of the Scheme(s) may go up or down depending on the factors and forces affecting the securitiesmarkets. There can be no assurance that the objectives of the Scheme(s) will be achieved. Pastperformance of the Sponsor, AMC, Mutual Fund or any associates of the Sponsor/AMC does notindicate the future performance of the Scheme(s) of the Mutual Fund. HSBC Dynamic Fund (HDF) isthe names of the Scheme and does not in any manner indicate the quality of the Scheme or its futureprospects or returns.
Terms of Issue:Units of the Scheme(s) are being offered at NAV based prices, subject to the prevailing loads. TheAMC calculates and publishes NAVs and offers for sale, redemption and switch outs, units of theScheme(s) on all Business Days, at the Applicable NAV for all Schemes (at least once a week, i.e.,every Wednesday and daily during the period of redemption in case of HSCF). HUOF, HSCF & HFTSwill not be open for ongoing subscriptions/ switch ins. HUOF & HSCF would be available for sale onan ongoing basis (after a period of 3 years from the date of allotment). Conversion of HUOF & HSCFto an open-ended scheme will be done only after the balance unamortized amount has been fullyrecovered from the Scheme. Units can be redeemed/switched out on every Business Day at NAVbased prices, subject to prevailing exit loads. In case of HSCF, units can be redeemed / switched outon a monthly basis on the stipulated date i.e. last 3 business days of every month at NAV basedprices, subject to provisions of exit load, if any and recovery of balance proportionate unamortizedNFO expenses.
Load Structure (includes SIP/STP):Entry - 2.50% for investments / switch in* below Rs. 5 crores, otherwise Nil.
Exit - 1% for investment below Rs. 5 crores, if redeemed / switched out* within 1 year from the dateof allotment/investment, otherwise Nil.
*No load in case of switches between equity Schemes of HSBC Mutual Fund.
Consult the nearest investor service centre for details.
The entry/exit load set forth above is subject to change at the discretion of the AMC and suchchanges shall be implemented prospectively.

Mutual Fund investments are subject to market risks. Please read the Statement of AdditionalInformation and Scheme Information Document carefully before investing.
Value Research Online DisclaimerValue Research Fund Ratings: Value Research Fund Ratings are a composite measure of historical risk-adjusted returns. In the case of equity funds this rating is based on the average monthly returns forthe last 3-year and 5-year period. These ratings do not take into account any entry or exit load.
Value Research Fund Ratings are subject to change every month. Current Fund Ratings are as onMarch 31, 2009. 142 open-ended Equity: Diversified Funds were rated. The Rating is based on primarydata provided by respective funds; Value Research does not guarantee the accuracy. Ranking Entity:Value Research Online.
ICRA Online Ranking MethodologyHSBC Monthly Income - Savings Plan has been ranked as a Five Star Fund in the category of 'OpenEnded Marginal Equity' schemes for its 3 year performance till December 31, 2008.
The rank is an outcome of an objective and comparative analysis against various parameters, including:risk adjusted return, fund size, company concentration, portfolio turnover and liquidity. The rankingmethodology did not take into account entry and exit loads imposed by the Fund. There were 27schemes considered in 'Open Ended Marginal Equity' category for the ranking exercise. The rank isneither a certificate of statutory compliance nor any guarantee on the future performance of HSBCMonthly Income - Savings Plan. Ranking Source & Publisher: ICRA Online Limited.
CRISIL Ranking MethodologyThe selection for the awards is based on the CRISIL FundServices' Composite Performance Ranking(CRISIL~CPR) methodology.
The CRISIL Composite Performance Ranking (CRISIL~CPR) is a quarterly ranking of mutual fund schemesbased on two year performance (excepting for the liquid and short term debt categories where a oneyear performance horizon is considered). The methodology is based on global best practices,customized to account for Indian market nuances. Over time, the rankings have become the industrystandard with good acceptance among Investors, Fund Intermediaries, Asset Management Companies,etc. The performance criteria covers not only risk adjusted returns, which are historical, but also theportfolio constitution to make the analysis forward looking.
CRISIL DisclaimerThe overall ranking is assigned to the scheme based on its weighted average score on a range ofparameters: Superior Return Score, Concentration, Liquidity, Asset Quality - Measures the creditquality of the portfolio, Average Maturity and Asset Size. HSBC MIP - Savings was the only schemethat won the CNBC TV18 - CRISIL Mutual Fund of the Year Award in the Category - Monthly IncomePlans - Aggressive. In total 13 schemes were eligible for the award universe. Schemes present in allfour quarterly CRISIL CPRs were considered for the award. The award is based on consistency of thescheme's performance in the four quarterly CRISIL CPR rankings released during the calendar year2008. The individual CRISIL CPR parameter scores averaged for the four quarters were further multipliedby the parameter weights as per the CRISIL CPR methodology to arrive at the final scores. A detailedmethodology of the CRISIL CPR is available at www.crisil.com. Past performance is no guarantee offuture results. Rankings and Award Source: CRISIL Fund Services, CRISIL Ltd. HSBC Monthly Income -Savings Plan has been ranked as a Five Star Fund in the category of 'Open Ended Marginal Equity'schemes for its 3 year performance till December 31, 2008. The rank is an outcome of an objectiveand comparative analysis against various parameters, including: risk adjusted return, fund size,company concentration, portfolio turnover and liquidity. The ranking methodology did not take intoaccount entry and exit loads imposed by the Fund. There were 27 schemes considered in 'OpenEnded Marginal Equity' category for the ranking exercise. The rank is neither a certificate of statutorycompliance nor any guarantee on the future performance of HSBC Monthly Income - Savings Plan.Ranking Source & Publisher: ICRA Online Limited.
16

Issued by HSBC Asset Management (India) Private Limited
HSBC Global Asset Management
HSBC Emerging Markets FundAn open-ended Scheme
Abridged Annual Report 2008 - 2009

1
Dear Investor,
We thank you for investing with HSBC Mutual Fund. We are pleased to inform you that HSBCMutual Fund has won prestigious awards* this year at various forums in India.
The awards* won by our schemes in India are
� HSBC Equity Fund has been included in the 5 star rated fund category (“Top rated mutualfunds” by Value Research online) in March, 2009.
� Five-stars indicate that a fund is in the top 10 per cent of its category in terms ofhistorical risk-adjusted returns.
� ICRA Mutual Fund Awards 2009
� HSBC MIP - Savings has been ranked a 5-Star Fund by ICRA Online indicating performanceamong the top 10% in the category of 'Open Ended Marginal Equity' for 3 yearperformance ending 31 December, 2008.
� CNBC TV18 - CRISIL Mutual Fund Awards 2008
� HSBC MIP - Savings was awarded the CNBC TV18 - CRISIL Mutual Fund of the YearAward for the year 2008 in the Monthly Income Plans - Aggressive Category.
(Past performance is no guarantee of future results. * Please refer to Ranking methodologyand disclaimer mentioned at the end of the Abridged Annual Report for the year endedMarch 31, 2009).
At the global level, the HSBC Group won several awards at Euromoney's Awards for Excellence2009. The top awards that HSBC won were the Best Global Bank and the Best Global DebtHouse. It was also honoured as the Best Debt House in 8 locations including Asia and the Bestat Risk Management in Asia. (Past performance may or may not be sustained in the future andis no guarantee of future results). We continue to be one of the leading players in emergingmarkets and remain committed to our asset management business in India.
HSBC Asset Management (India) Private Limited including the mutual fund business as well asthe PMS business (including EPFO money deployed till date) manages assets of about Rs. 26280Crores as at 30 June, 2009. The core to our winning strategy is our endeavour to deliverconsistent performance over the medium to long term for our investors in a risk controlledenvironment and aim for consistent wealth creation under varying market conditions. Throughour product range, we aim to be true to our reputation in India of being a provider ofinternational quality investment products and services.
We remain committed to our philosophy of aiming for consistent wealth creation and serviceexcellence and look forward to your continued investments in HSBC Mutual Fund.
Yours sincerely,
VikramaadityaChief Executive OfficerHSBC Asset Management (India) Private Limited

2
SPONSORHSBC Securities and Capital Markets (India) Private LimitedRegd. Office: 52/60, Mahatma Gandhi Road, Fort, Mumbai 400 001.
TRUSTEEBoard of TrusteesOffice: 314, D. N. Road, Fort, Mumbai 400 001.
ASSET MANAGEMENT COMPANYHSBC Asset Management (India) Private LimitedCorp. & Regd. Office: 314, D. N. Road, Fort, Mumbai 400 001.
CUSTODIANJP Morgan Chase BankCorp. & Regd. Office: Mafatlal Centre, 9th Floor, Nariman Point, Mumbai - 400 021.
AUDITORS TO THE SCHEMEPrice WaterhouseChartered Accountants252, Veer Savarkar Marg, Shivaji Park, Dadar (West), Mumbai - 400 028.
LEGAL ADVISORSBharucha & Partners4th Floor, Cecil Court, Mahakavi Bhushan Marg, Colaba, Mumbai - 400 039.
REGISTRAR & TRANSFER AGENTSComputer Age Management Services (P) Ltd. (CAMS)Rayala Towers, Tower I, III Floor, 158 Anna Salai, Chennai - 600 002.
BOARD OF TRUSTEESMr. N. P. Gidwani - Chairman
Dr. Rudolf ApenbrinkMr. Nasser MunjeeMr. Manu TandonMr. Mehli MistriMr. Dilip J. Thakkar
BOARD OF DIRECTORSMs. Naina Lal Kidwai - Chairman
Mr. Ayaz EbrahimMr. S. P. Mustafa**Mr. Vithal PalekarMs. Kishori J. Udeshi*Mr. Vikramaaditya - Chief Executive Officer***
* Ms. Kishori Udeshi has been appointed as a Director with effect from 14 January 2009 andMr. Jagjit Lal Pasricha has resigned as a Director with effect from 19 January 2009.
** Mr. S. P. Mustafa has been appointed as a Director with effect from 2 September 2008 andMr. Nawshir Khurody has resigned as a Director with effect from 1 September 2008.
*** Mr. Vikramaaditya has been appointed as the Chief Executive Officer with effect from 16 July 2008and Mr. Sanjay Prakash has resigned as the Chief Executive Officer with effect from 16 July 2008.
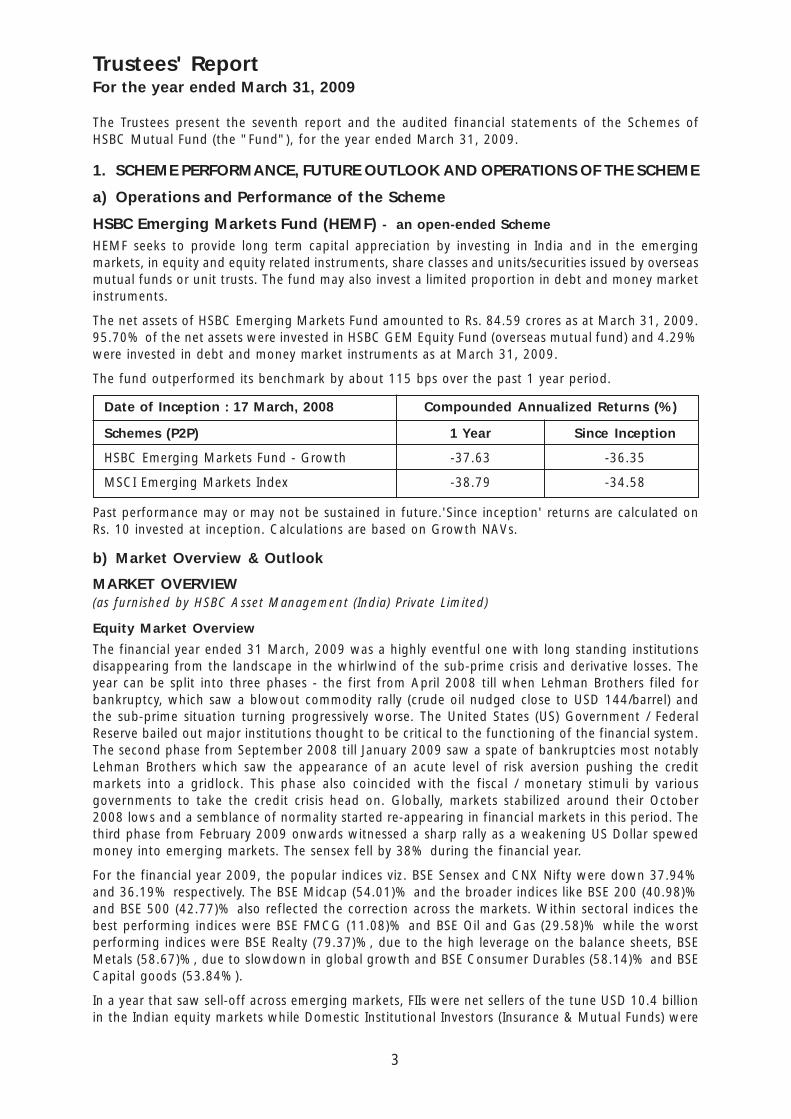
3
Trustees' ReportFor the year ended March 31, 2009
The Trustees present the seventh report and the audited financial statements of the Schemes ofHSBC Mutual Fund (the "Fund"), for the year ended March 31, 2009.
1. SCHEME PERFORMANCE, FUTURE OUTLOOK AND OPERATIONS OF THE SCHEME
a) Operations and Performance of the Scheme
HSBC Emerging Markets Fund (HEMF) - an open-ended Scheme
HEMF seeks to provide long term capital appreciation by investing in India and in the emergingmarkets, in equity and equity related instruments, share classes and units/securities issued by overseasmutual funds or unit trusts. The fund may also invest a limited proportion in debt and money marketinstruments.
The net assets of HSBC Emerging Markets Fund amounted to Rs. 84.59 crores as at March 31, 2009.95.70% of the net assets were invested in HSBC GEM Equity Fund (overseas mutual fund) and 4.29%were invested in debt and money market instruments as at March 31, 2009.
The fund outperformed its benchmark by about 115 bps over the past 1 year period.
Date of Inception : 17 March, 2008 Compounded Annualized Returns (%)
Schemes (P2P) 1 Year Since Inception
HSBC Emerging Markets Fund - Growth -37.63 -36.35
MSCI Emerging Markets Index -38.79 -34.58
Past performance may or may not be sustained in future.'Since inception' returns are calculated onRs. 10 invested at inception. Calculations are based on Growth NAVs.
b) Market Overview & Outlook
MARKET OVERVIEW(as furnished by HSBC Asset Management (India) Private Limited)
Equity Market Overview
The financial year ended 31 March, 2009 was a highly eventful one with long standing institutionsdisappearing from the landscape in the whirlwind of the sub-prime crisis and derivative losses. Theyear can be split into three phases - the first from April 2008 till when Lehman Brothers filed forbankruptcy, which saw a blowout commodity rally (crude oil nudged close to USD 144/barrel) andthe sub-prime situation turning progressively worse. The United States (US) Government / FederalReserve bailed out major institutions thought to be critical to the functioning of the financial system.The second phase from September 2008 till January 2009 saw a spate of bankruptcies most notablyLehman Brothers which saw the appearance of an acute level of risk aversion pushing the creditmarkets into a gridlock. This phase also coincided with the fiscal / monetary stimuli by variousgovernments to take the credit crisis head on. Globally, markets stabilized around their October2008 lows and a semblance of normality started re-appearing in financial markets in this period. Thethird phase from February 2009 onwards witnessed a sharp rally as a weakening US Dollar spewedmoney into emerging markets. The sensex fell by 38% during the financial year.
For the financial year 2009, the popular indices viz. BSE Sensex and CNX Nifty were down 37.94%and 36.19% respectively. The BSE Midcap (54.01)% and the broader indices like BSE 200 (40.98)%and BSE 500 (42.77)% also reflected the correction across the markets. Within sectoral indices thebest performing indices were BSE FMCG (11.08)% and BSE Oil and Gas (29.58)% while the worstperforming indices were BSE Realty (79.37)%, due to the high leverage on the balance sheets, BSEMetals (58.67)%, due to slowdown in global growth and BSE Consumer Durables (58.14)% and BSECapital goods (53.84%).
In a year that saw sell-off across emerging markets, FIIs were net sellers of the tune USD 10.4 billionin the Indian equity markets while Domestic Institutional Investors (Insurance & Mutual Funds) were

4
buyers to the tune of USD 13.1 billion. Further, FIIs were net sellers in the derivative markets ashedge funds, and p-notes unwound positions in a rapidly deleveraging world. Thus, sentimentremained negative as few US based investment banks filed for bankruptcy in the midst of the liquidityand credit crisis and safety took precedence over growth.
Debt Market Overview
Two contrarian forces one inflationary and the other deflationary had been in play since 2007: Onthe one hand strong demand from emerging economies were leading commodities higher and fuellinginflation, while on the other the housing led credit crisis in the US was starting to exert a deflationaryforce. The first force was dominant till early July 2008 leading commodity prices to fresh peaks andinflation to multi year highs. Since then, however, the second force took hold with the result thatcommodity prices fell sharply from the top, growth and inflation numbers toppled worldwide, andcentral bankers shifted focus to achieving financial stability and protecting growth.
The financial crisis hit the domestic markets towards September 2008, leading to acute disruption inmoney markets. The Reserve Bank of India (RBI) acted proactively cutting the cash reserve ratio (CRR)by an unprecedented 400 bps between September 2008 and January 2009. Similarly, the reverserepo rate had been cut by 275 bps since October 2008 while the repo rate had been cut by 425 bpsover the same period.
Bond market yields fell in line with the unprecedented monetary easing up till the first week ofJanuary 2009. Thereon, supply pressures on bond markets rose as a result of government fiscalslippages aimed at stimulating the economy. The RBI, in line with similar measures elsewhere in theworld, started buying government securities to lessen the impact on yields from the rise in governmentborrowing. Although this helped market sentiment, it could not prevent a general rise in yieldstowards fiscal close. As a result, the 10 year benchmark sovereign yield closed the fiscal at 7% froma low of sub 5% hit in early January 2009. Money market rates stabilized after the initial mayhem ofSeptember 2008 and October 2008 and liquidity came back to interbank markets.
MARKET OUTLOOK
(as furnished by HSBC Asset Management (India) Private Limited)
Equity Market Outlook
Financial Year (FY) 2008-09 was a year marked by a strong correlation between the Indian marketand global markets with key indices ending deeply in the red on the back of the subprime crisis andderivative led losses across major financial stocks in the United States (US). Even in India, forex lossesran across corporate India though at a smaller magnitude. FY 10 has begun on a better note onaccount of various fundamental and technical factors.
GDP for FY 09 grew at 6.7% against FY 08 levels of 9%. Agriculture posted a below trend growthrate of 1.6% and industry grew by 3.9% (versus 8.1% in FY 08) with services registering a close to9.7% growth. IIP grew by a mere 2.6%. Although order books of engineering / capital goods wererunning at record high levels, there was possibility of delays in execution as funding sources for thedevelopers (equity, ECB, private equity, FCCB) had dried up. A sharp increase in subsidy on accountof oil, fertilizers and food led to a cut back in discretionary spending. Inflation rose on the back of asurging crude and higher prices of agricultural commodities to top at 12.91% for the week ending 2August, 2008. A slow down in the growth rates in the US / EU and other markets finally tamed thesurge in crude. As growth rates stumbled, governments / monetary authorities the world over triggeredfiscal stimuli / monetary easing to escape recessionary forces. This was followed in India as wellwhich started monetary easing / fiscal stimuli to keep growth rates buoyant.
On the positive side, India continues to do better in relative terms and we expect GDP growth of6-6.5% for FY10. The broad themes that are driving domestic growth viz. capital expenditure,infrastructure building and domestic consumption are still intact. The key concerns at this pointstems from a ballooning fiscal deficit at the consolidated level (Centre & State) with salary revision
Trustees' ReportFor the year ended March 31, 2009 (Contd...)

5
for Central / State Government employees threatening a cut back in discretionary spending. Inflationis likely to remain benign for the first half of FY10 on a favourable base effect but we anticipate it togo back to trend levels of 5-5.5% for the second half of FY10 as this base effect wears off.
On a valuations perspective, the markets are currently trading at a P/E ratio of around 12 timesFY 2010 earnings. This is well below the 10-year average given the extreme risk aversion prevailing inthe markets. However, the underlying growth in the economy and corporate earnings growth (15%in the long term) makes the market attractive from a longer-term view. The short term could seeenhanced volatility arising from various factors. Increase in commodity prices continues to be a riskin the medium term as the US dollar continues to struggle with the ballooning US fiscal situation.
Debt Market Outlook
Excess supply of government bonds, as a result of fiscal slippages to arrest the downward growthmomentum, has been a reality for bond markets since January 2009. However, this is now compoundedwith some fatigue in buying longer duration as economic data is showing signs of recovery,commodities are showing signs of rally and expectations of incremental monetary easing from theRBI are beginning to unwind. However, system liquidity remains surplus and bank deposits continueto grow thereby providing resistance to bond yields from rising sharply.
Given the above factors, we believe that the market would continue to provide tactical opportunitiesalthough the fundamental bias should be for lower duration. Also, any mitigation of bond supplypressure or a new downturn in the ongoing economic recovery may provide space for opportunisticlonger duration plays. On the other hand, if the recovery cycle continues uninterrupted and commodityprices remain firm, central banks may start to worry about withdrawing the current monetary stimulusby sometime early 2010; with consequent impact on bond markets.
2. BRIEF BACKGROUND OF SPONSORS, BOARD OF TRUSTEES AND ASSETMANAGEMENT COMPANY
a) Sponsor
HSBC Mutual Fund is sponsored by HSBC Securities and Capital Markets (India) Private Limited (HSCI).The Sponsor is the Settler of the Mutual Fund Trust. The Sponsor has entrusted a sum of Rs. 1,00,000(Rupees One Lakh only) to the Trustee as the initial contribution towards the corpus of the MutualFund.
HSCI is a member of the HSBC Group, one of the largest banking and financial services organisations,in the world. Headquartered in London, HSBC operates through long-established businesses in fiveregions: Europe, Asia-Pacific, Middle East, America and Africa. Through its global network of 10,000offices in 86 countries and territories, HSBC provides a comprehensive range of financial services topersonal, commercial, corporate, institutional investment and private banking clients.
HSCI offers integrated investment banking services, securities and corporate finance & advisory. HSCIis a member of The Bombay Stock Exchange Limited and National Stock Exchange (capital and derivativemarket segments) and is also a category I merchant banker and underwriter registered with Securitiesand Exchange Board of India.
HSCI holds 100% of the paid-up equity share capital of the AMC.
b) HSBC Mutual Fund
HSBC Mutual Fund ("the Mutual Fund" or "the Fund") has been constituted as a Trust in accordancewith the provisions of the Indian Trusts Act, 1882 (2 of 1882) vide a Trust Deed dated February 7,2002 with HSBC Securities and Capital Markets (India) Private Limited, as the Sponsor and the Boardof Individual Trustees. The Trustee has entered into an Investment Management Agreement datedFebruary 7, 2002 with HSBC Asset Management (India) Private Limited (the AMC) to function as theInvestment Manager for all the Schemes of the Fund. The Fund was registered with SEBI videregistration number MF/046/02/5 dated May 27, 2002.
Trustees' ReportFor the year ended March 31, 2009 (Contd...)

6
The Trust has been formed for the purpose of pooling of capital from the public for collectiveinvestment in securities / any other property for the purpose of providing facilities for participationby persons as beneficiaries in such properties / investments and in the profits / income arising therefrom.
c) Board of Trustees (the Trustees)
The Board of Trustees are the exclusive owner of the Trust Fund and holds the same in trust for thebenefit of the unitholders. The Trustees have been discharging their duties and carrying out theirresponsibilities as provided in the SEBI (Mutual Funds) Regulations, 1996 and the Trust Deed. TheTrustees seeks to ensure that the Fund and the Schemes floated thereunder are managed by theAMC in accordance with the Trust Deed, the said Regulations, directions and guidelines issued bySEBI, the Stock Exchanges, the Association of Mutual Funds of India and other regulatory agencies.
d) Asset Management Company (the AMC)
HSBC Asset Management (India) Private Limited (the Investment Manager or the AMC) is a privatelimited company incorporated under the Companies Act, 1956 on December 12, 2001 having itsRegistered Office at 314, D. N. Road, Fort, Mumbai 400 001. HSBC Asset Management (India) PrivateLimited has been appointed as the Asset Management Company of the HSBC Mutual Fund by theTrustee vide Investment Management Agreement (IMA) dated February 7, 2002 and executed betweenthe Trustees and the AMC. SEBI approved the AMC to act as the Investment Manager of the Fundvide. its letter No. MFD/BC/163/2002 dated May 27, 2002.
The paid-up equity share capital of the AMC is Rs. 9 crores. HSBC Securities and Capital Markets(India) Private Limited holds 100% of the paid-up equity share capital of the AMC.
3. INVESTMENT OBJECTIVE OF THE SCHEMEThe investment objective of the Scheme has been provided above under the heading "SchemePerformance, Future Outlook and Operation of the Scheme" (refer Section 1).
4. SIGNIFICANT ACCOUNTING POLICIESThe accounting policies are in accordance with Securities and Exchange Board of India (Mutual Funds)Regulations, 1996.
5. UNCLAIMED DIVIDENDS & REDEMPTIONSNil.
6. INVESTOR SERVICESDuring the year, the number of official points of acceptance of transactions increased significantly toabout 182 locations. In addition to the offices of the transfer agency, the company has InvestorService Centres in 14 locations at its own offices - namely Mumbai, New Delhi, Kolkata, Chennai,Bangalore, Hyderabad, Pune, Ahmedabad, Indore, Chandigarh, Kochi, Coimbatore, Lucknow andVadodara. With a view to enhancing customer convenience, the Asset Management Company hasextended the facility of crediting investor bank accounts directly by way of NEFT / RTGS (for credit ofredemption and dividend proceeds). The AMC endeavours to despatch dividend proceeds within 5working days from the Record Date in all Schemes. The internal standards on redemption payoutshave been consistently met, with very few exceptions. The number of locations for the ECS AutoDebit facility for investments through Systematic Investment Plan also increased to about 74 byMarch 2009.
On the distribution front, the number of empanelled distributors increased from 7859 as on 31March, 2008 to 8632 as on 31 March, 2009. During the year, the Asset Management Companyinitiated tie-ups for online distribution of the Mutual Fund's schemes with several channel partnerstaking the total number of such tie-ups to 24 (Angel Capital & Department Market Ltd., Bajaj CapitalLimited, Bonanza Portfolio Limited, Citibank N.A., Citigroup Wealth Advisors India Private Limited,HDFC Bank Limited, Hongkong & Shanghai Banking Corporation Limited, HSBC Corporate Investment
Trustees' ReportFor the year ended March 31, 2009 (Contd...)

7
Solution Services, ICICI Securities Limited, India Infoline Limited, Karvy Stock Broking Limited, KotakMahindra Bank Limited, Kotak Securities Limited, Motilal Oswal Securities Limited, NJ India InvestPrivate Limited, Reliance Securities Limited, RR Investors Capital Services Private Limited, SBICAPSecurities Limited, Sharekhan Limited, SMC Global Securities Limited, Standard Chartered - STCICapital Markets Ltd., Tom Distribution Services Limited, Yes Bank Limited).
Call centre operations have been extended to cover the entire country. The Asset ManagementCompany has outsourced certain back office services including call centre services to HSBC Operationsand Processing Enterprise (India) Private Limited (HOPE).
7. STATUTORY DETAILSa) The Sponsors are not responsible or liable for any loss resulting from the operation of the Schemes
of the Fund beyond initial contribution of Rs. 1 lakh for setting up the Fund.
b) The price and redemption value of the units, and income from them, can go up as well as downwith fluctuations in the market value of its underlying investments.
c) Full / Abridged Annual Report shall be disclosed on the website at www.assetmanagement.hsbc.com/inand shall be available for inspection at the Head Office of the mutual fund. Present and prospectiveunit holder can obtain copy of the trust deed, the Full / Abridged Annual Report of the Scheme(s),the Annual Report of HSBC Asset Management (India) Private Limited and the text of the relevantScheme(s) at a price.
8. ACKNOWLEDGEMENTSThe Trustees wish to thank the Unitholders of the Schemes for their support throughout the year andalso thank the Government of India, the Securities and Exchange Board of India (SEBI), the ReserveBank of India (RBI) and the Association of Mutual Funds in India (AMFI) for the guidance provided bythem. The Trustees also appreciate the service provided by the Registrar and Transfer Agent, FundAccountant, Custodian, Bankers, Distributors and Brokers. The guidance and services provided bythe Auditors and advocates and the ebullience, sincerity and dedication of the employees of HSBCAsset Management (India) Private Limited is also appreciated.
The Trustees look forward to the continued support of everyone.
For and on behalf of the Board of Trustees of HSBC Mutual Fund
Dilip J. Thakkar
Trustee
MUMBAIJuly 6, 2009
Trustees' ReportFor the year ended March 31, 2009 (Contd...)

8
To the Board of Trustees of
HSBC MUTUAL FUND
1. We have audited the Balance Sheet of HSBC Mutual Fund - HSBC Emerging Markets Fund ("TheScheme") as at March 31, 2009 and the related Revenue Account for the year ended on thatdate, both of which we have signed under reference to this report. These financial statementsare the responsibility of the Board of Trustees of HSBC Mutual Fund and the Management ofHSBC Asset Management (India) Private Limited (the "Management"). Our responsibility is toexpress an opinion on these financial statements based on our audit.
2. We have conducted our audit in accordance with auditing standards generally accepted in India.Those standards require that we plan and perform the audit to obtain reasonable assuranceabout whether the financial statements are free of material misstatement. An audit includesexamining, on a test basis, evidence supporting the amounts and disclosures in the financialstatements. Our procedures included confirmation of securities owned and unit balances as atMarch 31, 2009 by correspondence with the custodian / others and registrar and transfer agentrespectively. An audit also includes assessing the accounting principles used and significantestimates made by the Management as well as evaluating the overall financial statementpresentation. We believe that our audit provides a reasonable basis for our opinion.
3. We have obtained all the information and explanations which to the best of our knowledge andbelief were necessary for the purpose of our audit. The Balance Sheet and the Revenue Accountreferred to above are in agreement with the books of account of the Scheme.
4. In our opinion and to the best of our information and according to the explanations given to us,
(i) The Balance Sheet and the Revenue Account together with the notes thereon give theinformation required by the Securities and Exchange Board of India (Mutual Funds) Regulations,1996 and amendments thereto, as applicable, and also give respectively, a true and fair viewof the state of affairs of HSBC Mutual Fund - HSBC Emerging Markets Fund as at March 31,2009 and its net deficit for the year ended on that date.
(ii) The Balance Sheet as at March 31, 2009 and the Revenue Account for the year ended on thatdate, together with the notes thereon have been prepared in all material respects in accordancewith the accounting policies and standards specified in the Ninth Schedule of the Securitiesand Exchange Board of India (Mutual Funds) Regulations, 1996 and amendments thereto asapplicable.
Partha GhoshPartnerMembership No. F / 55913
For and on behalf ofPRICE WATERHOUSEChartered Accountants
Place : MumbaiDate : July 6, 2009
Auditors' Report
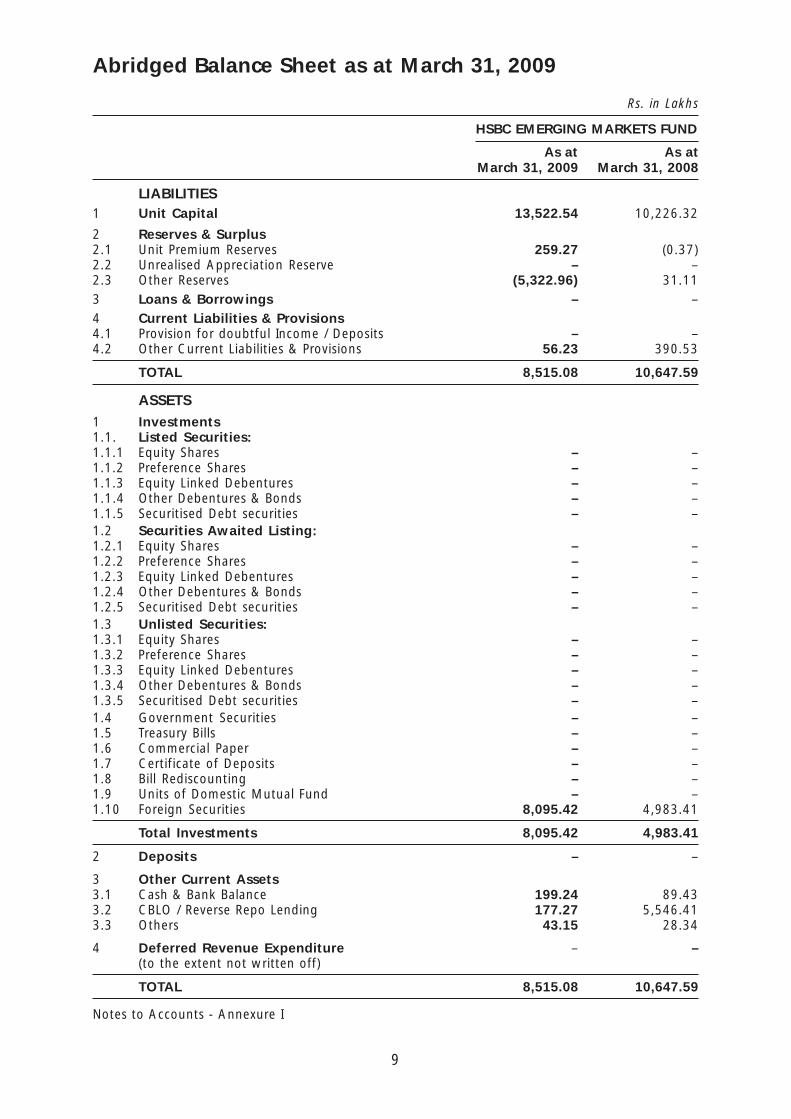
9
Rs. in Lakhs
HSBC EMERGING MARKETS FUND
As at As atMarch 31, 2009 March 31, 2008
LIABILITIES1 Unit Capital 13,522.54 10,226.32
2 Reserves & Surplus2.1 Unit Premium Reserves 259.27 (0.37)2.2 Unrealised Appreciation Reserve – –2.3 Other Reserves (5,322.96) 31.113 Loans & Borrowings – –4 Current Liabilities & Provisions4.1 Provision for doubtful Income / Deposits – –4.2 Other Current Liabilities & Provisions 56.23 390.53
TOTAL 8,515.08 10,647.59
ASSETS
1 Investments1.1. Listed Securities:1.1.1 Equity Shares – –1.1.2 Preference Shares – –1.1.3 Equity Linked Debentures – –1.1.4 Other Debentures & Bonds – –1.1.5 Securitised Debt securities – –1.2 Securities Awaited Listing:1.2.1 Equity Shares – –1.2.2 Preference Shares – –1.2.3 Equity Linked Debentures – –1.2.4 Other Debentures & Bonds – –1.2.5 Securitised Debt securities – –1.3 Unlisted Securities:1.3.1 Equity Shares – –1.3.2 Preference Shares – –1.3.3 Equity Linked Debentures – –1.3.4 Other Debentures & Bonds – –1.3.5 Securitised Debt securities – –1.4 Government Securities – –1.5 Treasury Bills – –1.6 Commercial Paper – –1.7 Certificate of Deposits – –1.8 Bill Rediscounting – –1.9 Units of Domestic Mutual Fund – –1.10 Foreign Securities 8,095.42 4,983.41
Total Investments 8,095.42 4,983.41
2 Deposits – –
3 Other Current Assets3.1 Cash & Bank Balance 199.24 89.433.2 CBLO / Reverse Repo Lending 177.27 5,546.413.3 Others 43.15 28.34
4 Deferred Revenue Expenditure – –(to the extent not written off)
TOTAL 8,515.08 10,647.59
Notes to Accounts - Annexure I
Abridged Balance Sheet as at March 31, 2009

10
Rs. in Lakhs
HSBC EMERGING MARKETS FUND
Current PreviousYear ended Year ended
March 31, 2009 March 31, 2008
1 INCOME1.1 Dividend – –1.2 Interest 57.39 59.661.3 Realised Gain / (Loss) on Foreign Exchange Transactions (0.44) 10.001.4 Realised Gains / (Losses) on Interscheme sale of investments – –1.5 Realised Gains / (Losses) on External sale / redemption
of investments (105.09) (0.60)1.6 Realised Gains / (Losses) on Derivative Transactions – –1.7 Other Income – –
(A) (48.14) 69.062 EXPENSES2.1 Management fees 5.02 0.642.2 Service tax on Management fees ** – –2.3 Transfer agents fees and expenses 15.71 0.472.4 Custodian fees 2.85 0.142.5 Trusteeship fees 0.04 0.002.6 Commission to Agents * – –2.7 Marketing & Distribution expenses 82.95 1.612.8 Audit fees 0.25 0.102.9 Other operating expenses 7.76 1.522.10 Expenses to be Reimbursed by the Investment Manager (39.35) (0.91)
(B) 75.23 3.573 NET REALISED GAINS / (LOSSES) FOR
THE YEAR / PERIOD (A - B = C) (123.37) 65.494 Change in Unrealised Depreciation in value
of investments*** (D) 4,975.85 34.72
5 NET GAINS / (LOSSES) FOR THEYEAR / PERIOD [E = (C - D)] (5,099.22) 30.77
6 Change in unrealised appreciation in thevalue of investments (F) – –
7 NET SURPLUS / (DEFICIT) FOR THEYEAR / PERIOD (E + F = G) (5,099.22) 30.77
7.1 Add: Balance transfer from Unrealised Appreciation Reserve – –7.2 Less: Balance transfer to Unrealised Appreciation Reserve – –7.3 Add / (Less): Equalisation (254.85) 0.347.4 Transfer from Reserve Fund – –7.5 Transfer from Unit Premium Reserve – –
8 TOTAL (5,354.07) 31.119 Dividend Appropriation9.1 Income Distributed during the year / period – –9.2 Tax on income distributed during the year / period – –
10 Retained Surplus / (Deficit) carried forward to Balance Sheet (5,354.07) 31.11
Notes to Accounts - Annexure I* Commission to Agents is included in Marketing & Distribution Expenses.** Service Tax on Management Fees is included in Other Operating Expenses.*** Includes Unrealised Depreciation in the value of Foreign Currency Transactions.
Abridged Revenue Account for the year endedMarch 31, 2009

11
HSBC EMERGING MARKETS FUND
Current PreviousYear ended Year ended
March 31, 2009 March 31, 2008
1. NAV per unit (Rs.):
Open
Regular Growth Option 10.0301 –
Regular Dividend Option 10.0301 –
High
Regular Growth Option 11.8114 10.0941
Regular Dividend Option 11.8114 10.0941
Low
Regular Growth Option 4.9543 10.0281
Regular Dividend Option 4.9543 10.0281
End
Regular Growth Option 6.2554 10.0301
Regular Dividend Option 6.2554 10.0301
2. Closing Assets Under Management (Rs. in Lakhs)
End 8,459 10,257
Average (AAuM)1 10,030 10,224
3. Gross income as % of AAuM2 -0.48% 0.68%
4. Expense Ratio:
a. Total Expense as % of AAuM (planwise)
Regular Growth Option 0.75% 0.00%~
Regular Dividend Option 0.75% 0.00%~
b. Management Fee as % of AAuM (planwise)
Regular Growth Option 0.05% 0.00%~
Regular Dividend Option 0.05% 0.00%~
5. Net Income as a percentage of AAuM3 -1.23% 0.64%
6. Portfolio turnover ratio4 – –
7. Total Dividend per unit distributed during theyear / period (planwise)
Retail
Regular Dividend Option – –
Corporate
Regular Dividend Option – –
Key Statistics for the year ended March 31, 2009

12
8. Returns:
a. Last One Year
Scheme
Regular Growth Option (37.6300) NA
Regular Dividend Option (37.6300) NA
Benchmark
BSE 200 – NA
MSCI Emerging Markets Index (38.7900) NA
b. Since Inception
Scheme
Regular Growth Option (36.3500) 0.3010
Regular Dividend Option (38.7900) 0.3010
Benchnmark
BSE 200 – 5.1217
MSCI Emerging Markets Index (34.5800) 5.1473
1 AAuM = Average daily net assets
2 Gross income = amount against (A) in the Revenue Account i.e. Income.
3 Net income = amount against (C) in the Revenue Account i.e. NET REALISED GAINS / (LOSSES)FOR THE YEAR / PERIOD
4 Portfolio Turnover = Lower of sales or purchase divided by the Average AuM for the year / period.
~ Less than 0.01
Key Statistics for the year ended March 31, 2009 (Contd...)
HSBC EMERGING MARKETS FUND
Current PreviousYear ended Year ended
March 31, 2009 March 31, 2008

13
HSBC EMERGING MARKETS FUND
1 Investments:
1.1. It is confirmed that investments of the schemes are registered in the name of the Trustees forthe benefit of the scheme's unitholders.
1.2. Open Positions of derivatives as a % to Net Assets as of 2008-09 and 2007-08 is NIL.
1.3. There were no investments made in Associates and Group Companies by the Scheme for theyear ended March 31, 2009 and March 31, 2008.
1.4. Open positions of Securities Borrowed and / or Lent by the scheme as of the year endedMarch 31, 2009 is NIL.
1.5. NPAs as at year ended March 31, 2009 and March 31, 2008 are NIL.
1.6. Aggregate Unrealised Gain / Loss as at the end of the Financial year ended 2008-2009 andtheir percentages to net assets are as under:
Security Amount Percentage to Amount Percentage toCategory (Rs.) Net Assets (Rs.) Net Assets
2009 2008
Units in Mutual Fund
– Appreciation – – – –
– Depreciation 500,876,360 59.2140% 3,471,943 0.3385%
1.7 The aggregate value of investments purchased (excluding accretion of discount of Rs. NIL)and sold during the financial year 2008-2009 is Rs. 870,578,912 and 51,463,615 respectivelybeing 86.76% and 5.13% of the average daily net assets.
The aggregate value of investments purchased (excluding accretion of discount of Rs. NIL)and sold during the financial year 2007-2008 is Rs. 501,812,500 and Rs. NIL respectivelybeing 360.97% and NIL of the average daily net assets.
1.8. Non-Traded securities in the portfolio as on March 31, 2009 is NIL.
2 Disclosure under Regulation 25(8) of the Securities and Exchange Board of India (Mutual Funds)Regulations, 1996 as amended for the year ended March 31, 2009 is as under:
2008-09
During the year, The Hongkong and Shanghai Banking Corporation Limited, an associate entityof HSBC Asset Management (India) Private Limited was paid collection / bank charges amountingto Rs. 3,612, brokerage amounting to Rs. 16,768,200 for procuring unit subscriptions for theScheme. The brokerage paid was at rates similar to those offered to other distributors.
2007-08
During the year, The Hongkong and Shanghai Banking Corporation Limited, an associate entityof HSBC Asset Management (India) Private Limited was paid collection / bank charges amountingto Rs.100. The brokerage paid was at rates similar to those offered to other distributors.
Further, The Hongkong and Shanghai Banking Corporation Limited, an associate of the Sponsor,is on the panel of bankers with whom HSBC Mutual Fund places money on fixed deposits andenters into reverse repo transactions from time to time at competitive rates.
3 None of the Investors held more than 25% of the total net assets of the scheme at the yearended March 31, 2009 and year ended March 31, 2008.
Notes to Accounts - Annexure ITo the Abridged Balance Sheet and Revenue Account for the year ended March 31, 2009

14
4 Unit Capital movement during the years ended March 31, 2009 and March 31, 2008.
2008-2009
Description Opening Units Subscription Redemption Closing Units Face Value
RegularGrowth Option 61,213,343.633 42,092,615.754 19,003,474.654 84,302,484.733 843,024,847.33
RegularDividend Option 41,049,858.510 22,057,963.784 12,184,920.802 50,922,901.492 509,229,014.92
2007-2008
Description Opening Units Subscription Redemption Closing Units Face Value
RegularGrowth Option – 61,445,917.078 232,573.445 61,213,343.633 612,133,436.33
RegularDividend Option – 41,088,882.900 39,024.390 41,049,858.510 410,498,585.10
Notes to Accounts - Annexure I (Contd...)To the Abridged Balance Sheet and Revenue Account for the year ended March 31, 2009
5 Previous year’s figures have been re-grouped / re-arranged where appropriate.
6 No contingent liabilities for the year ended March 31, 2009 and March 31, 2008.
7 Expenses other than Management Fees are inclusive of Service Tax where applicable.
8 The Annual Accounts of the Schemes prepared in accordance with the accounting policies andstandards specified in the Ninth Schedule of The Securities and Exchange Board of India (MutualFunds) Regulations, 1996 has been approved by the Board of Directors of HSBC Asset Management(India) Private Limited and The Board of Trustees of HSBC Mutual Fund at their meeting held onJuly 06, 2009. The audit report attached herewith refers to the said annual accounts. The aforesaidabridged accounts are an extract of the Annual Accounts and are prepared in accordance withSEBI Circular No. IMD/Cir 8/132968/2008 dated July 24, 2008.

15
DISCLAIMERSThe content of this report has been prepared by HSBC Asset Management (India) Private Limited(HSBC) for information purposes only and should not be construed as an offer or solicitation of anoffer for purchase of any of the funds of HSBC Mutual Fund. The information is for general informationonly and does not have regard to specific investment objectives, financial situation and the particularneeds of any specific person who may receive this information. Investments in mutual funds inherentlyinvolve risks and investors should read the relevant documents / information for details and riskfactors and consult their legal, tax and financial advisors before investing. Investors should understandthat statements made herein regarding future prospects may not be realised. Neither this documentnor the units of HSBC Mutual Fund have been registered in any jurisdiction. The distribution of thisdocument in certain jurisdictions may be restricted or totally prohibited and accordingly, personswho come into possession of this document are required to inform themselves about, and to observe,any such restrictions.
Investors may obtain Statement of Additional Information, Combined Scheme Information Documentand Common Key Information Memorandums along with application forms from the office of HSBCMutual Fund, 314, D. N. Road, Fort, Mumbai 400 001. Tel: 022-6666 8819.
Statutory Details:HSBC Mutual Fund has been set up as a trust by HSBC Securities and Capital Markets (India) PrivateLimited (liability restricted to the corpus of Rs. 1 lakh). The Sponsor/associates of the Sponsor/AssetManagement Company (AMC) are not responsible or liable for any loss or shortfall resulting from theoperation of the Schemes. The Trustees of HSBC Mutual Fund have appointed HSBC Asset Management(India) Private Limited as the Investment Manager.
Risk Factors:All investments in mutual funds and securities are subject to market risks and the Net Asset Value(NAV) of the Scheme(s) may go up or down depending on the factors and forces affecting the securitiesmarkets. There can be no assurance that the objectives of the Scheme(s) will be achieved. Pastperformance of the Sponsor, AMC, Mutual Fund or any associates of the Sponsor/AMC does notindicate the future performance of the Scheme(s) of the Mutual Fund. HSBC Emerging Markets Fund(HEMF) is the names of the Scheme and does not in any manner indicate the quality of the Schemeor its future prospects or returns.
Terms of Issue:Units of the Scheme(s) are being offered at NAV based prices, subject to the prevailing loads. TheAMC calculates and publishes NAVs and offers for sale, redemption and switch outs, units of theScheme(s) on all Business Days, at the Applicable NAV for all Schemes (at least once a week, i.e.,every Wednesday and daily during the period of redemption in case of HSCF). HUOF, HSCF & HFTSwill not be open for ongoing subscriptions/ switch ins. HUOF & HSCF would be available for sale onan ongoing basis (after a period of 3 years from the date of allotment). Conversion of HUOF & HSCFto an open-ended scheme will be done only after the balance unamortized amount has been fullyrecovered from the Scheme. Units can be redeemed/switched out on every Business Day at NAVbased prices, subject to prevailing exit loads. In case of HSCF, units can be redeemed / switched outon a monthly basis on the stipulated date i.e. last 3 business days of every month at NAV basedprices, subject to provisions of exit load, if any and recovery of balance proportionate unamortizedNFO expenses.
Load Structure (includes SIP/STP):Entry - 2.25% for investments / switch ins* < Rs. 5 crores, otherwise Nil.
Exit - 1% for < Rs. 5 crores, if redeemed/switched out* within 1 year from date of investment,otherwise Nil.
*No load in case of switches between equity Schemes of HSBC Mutual Fund.
Consult the nearest investor service centre for details.
The entry/exit load set forth above is subject to change at the discretion of the AMC and suchchanges shall be implemented prospectively.
16
Mutual Fund investments are subject to market risks. Please read the Statement of AdditionalInformation and Scheme Information Document carefully before investing.
Value Research Online DisclaimerValue Research Fund Ratings: Value Research Fund Ratings are a composite measure of historical risk-adjusted returns. In the case of equity funds this rating is based on the average monthly returns forthe last 3-year and 5-year period. These ratings do not take into account any entry or exit load.
Value Research Fund Ratings are subject to change every month. Current Fund Ratings are as onMarch 31, 2009. 142 open-ended Equity: Diversified Funds were rated. The Rating is based on primarydata provided by respective funds; Value Research does not guarantee the accuracy. Ranking Entity:Value Research Online.
ICRA Online Ranking MethodologyHSBC Monthly Income - Savings Plan has been ranked as a Five Star Fund in the category of 'OpenEnded Marginal Equity' schemes for its 3 year performance till December 31, 2008.
The rank is an outcome of an objective and comparative analysis against various parameters, including:risk adjusted return, fund size, company concentration, portfolio turnover and liquidity. The rankingmethodology did not take into account entry and exit loads imposed by the Fund. There were 27schemes considered in 'Open Ended Marginal Equity' category for the ranking exercise. The rank isneither a certificate of statutory compliance nor any guarantee on the future performance of HSBCMonthly Income - Savings Plan. Ranking Source & Publisher: ICRA Online Limited.
CRISIL Ranking MethodologyThe selection for the awards is based on the CRISIL FundServices' Composite Performance Ranking(CRISIL~CPR) methodology.
The CRISIL Composite Performance Ranking (CRISIL~CPR) is a quarterly ranking of mutual fund schemesbased on two year performance (excepting for the liquid and short term debt categories where a oneyear performance horizon is considered). The methodology is based on global best practices,customized to account for Indian market nuances. Over time, the rankings have become the industrystandard with good acceptance among Investors, Fund Intermediaries, Asset Management Companies,etc. The performance criteria covers not only risk adjusted returns, which are historical, but also theportfolio constitution to make the analysis forward looking.
CRISIL DisclaimerThe overall ranking is assigned to the scheme based on its weighted average score on a range ofparameters: Superior Return Score, Concentration, Liquidity, Asset Quality - Measures the creditquality of the portfolio, Average Maturity and Asset Size. HSBC MIP - Savings was the only schemethat won the CNBC TV18 - CRISIL Mutual Fund of the Year Award in the Category - Monthly IncomePlans - Aggressive. In total 13 schemes were eligible for the award universe. Schemes present in allfour quarterly CRISIL CPRs were considered for the award. The award is based on consistency of thescheme's performance in the four quarterly CRISIL CPR rankings released during the calendar year2008. The individual CRISIL CPR parameter scores averaged for the four quarters were further multipliedby the parameter weights as per the CRISIL CPR methodology to arrive at the final scores. A detailedmethodology of the CRISIL CPR is available at www.crisil.com. Past performance is no guarantee offuture results. Rankings and Award Source: CRISIL Fund Services, CRISIL Ltd. HSBC Monthly Income -Savings Plan has been ranked as a Five Star Fund in the category of 'Open Ended Marginal Equity'schemes for its 3 year performance till December 31, 2008. The rank is an outcome of an objectiveand comparative analysis against various parameters, including: risk adjusted return, fund size,company concentration, portfolio turnover and liquidity. The ranking methodology did not take intoaccount entry and exit loads imposed by the Fund. There were 27 schemes considered in 'OpenEnded Marginal Equity' category for the ranking exercise. The rank is neither a certificate of statutorycompliance nor any guarantee on the future performance of HSBC Monthly Income - Savings Plan.Ranking Source & Publisher: ICRA Online Limited.

Issued by HSBC Asset Management (India) Private Limited
HSBC Global Asset Management
HSBC Small Cap FundAn close-ended equity Scheme*
Abridged Annual Report 2008 - 2009
*A three year close-ended equity Scheme with automatic conversion into open-ended equity Scheme at the end of 3 years from the date of allotment of units.

1
Dear Investor,
We thank you for investing with HSBC Mutual Fund. We are pleased to inform you that HSBCMutual Fund has won prestigious awards* this year at various forums in India.
The awards* won by our schemes in India are
� HSBC Equity Fund has been included in the 5 star rated fund category (“Top rated mutualfunds” by Value Research online) in March, 2009.
� Five-stars indicate that a fund is in the top 10 per cent of its category in terms ofhistorical risk-adjusted returns.
� ICRA Mutual Fund Awards 2009
� HSBC MIP - Savings has been ranked a 5-Star Fund by ICRA Online indicating performanceamong the top 10% in the category of 'Open Ended Marginal Equity' for 3 yearperformance ending 31 December, 2008.
� CNBC TV18 - CRISIL Mutual Fund Awards 2008
� HSBC MIP - Savings was awarded the CNBC TV18 - CRISIL Mutual Fund of the YearAward for the year 2008 in the Monthly Income Plans - Aggressive Category.
(Past performance is no guarantee of future results. * Please refer to Ranking methodologyand disclaimer mentioned at the end of the Abridged Annual Report for the year endedMarch 31, 2009).
At the global level, the HSBC Group won several awards at Euromoney's Awards for Excellence2009. The top awards that HSBC won were the Best Global Bank and the Best Global DebtHouse. It was also honoured as the Best Debt House in 8 locations including Asia and the Bestat Risk Management in Asia. (Past performance may or may not be sustained in the future andis no guarantee of future results). We continue to be one of the leading players in emergingmarkets and remain committed to our asset management business in India.
HSBC Asset Management (India) Private Limited including the mutual fund business as well asthe PMS business (including EPFO money deployed till date) manages assets of about Rs. 26280Crores as at 30 June, 2009. The core to our winning strategy is our endeavour to deliverconsistent performance over the medium to long term for our investors in a risk controlledenvironment and aim for consistent wealth creation under varying market conditions. Throughour product range, we aim to be true to our reputation in India of being a provider ofinternational quality investment products and services.
We remain committed to our philosophy of aiming for consistent wealth creation and serviceexcellence and look forward to your continued investments in HSBC Mutual Fund.
Yours sincerely,
VikramaadityaChief Executive OfficerHSBC Asset Management (India) Private Limited

2
SPONSORHSBC Securities and Capital Markets (India) Private LimitedRegd. Office: 52/60, Mahatma Gandhi Road, Fort, Mumbai 400 001.
TRUSTEEBoard of TrusteesOffice: 314, D. N. Road, Fort, Mumbai 400 001.
ASSET MANAGEMENT COMPANYHSBC Asset Management (India) Private LimitedCorp. & Regd. Office: 314, D. N. Road, Fort, Mumbai 400 001.
CUSTODIANJP Morgan Chase BankCorp. & Regd. Office: Mafatlal Centre, 9th Floor, Nariman Point, Mumbai - 400 021.
AUDITORS TO THE SCHEMEPrice WaterhouseChartered Accountants252, Veer Savarkar Marg, Shivaji Park, Dadar (West), Mumbai - 400 028.
LEGAL ADVISORSBharucha & Partners4th Floor, Cecil Court, Mahakavi Bhushan Marg, Colaba, Mumbai - 400 039.
REGISTRAR & TRANSFER AGENTSComputer Age Management Services (P) Ltd. (CAMS)Rayala Towers, Tower I, III Floor, 158 Anna Salai, Chennai - 600 002.
BOARD OF TRUSTEESMr. N. P. Gidwani - Chairman
Dr. Rudolf ApenbrinkMr. Nasser MunjeeMr. Manu TandonMr. Mehli MistriMr. Dilip J. Thakkar
BOARD OF DIRECTORSMs. Naina Lal Kidwai - Chairman
Mr. Ayaz EbrahimMr. S. P. Mustafa**Mr. Vithal PalekarMs. Kishori J. Udeshi*Mr. Vikramaaditya - Chief Executive Officer***
* Ms. Kishori Udeshi has been appointed as a Director with effect from 14 January 2009 andMr. Jagjit Lal Pasricha has resigned as a Director with effect from 19 January 2009.
** Mr. S. P. Mustafa has been appointed as a Director with effect from 2 September 2008 andMr. Nawshir Khurody has resigned as a Director with effect from 1 September 2008.
*** Mr. Vikramaaditya has been appointed as the Chief Executive Officer with effect from 16 July 2008and Mr. Sanjay Prakash has resigned as the Chief Executive Officer with effect from 16 July 2008.

3
Trustees' ReportFor the year ended March 31, 2009
The Trustees present the seventh report and the audited financial statements of the Schemesof HSBC Mutual Fund (the "Fund"), for the year ended March 31, 2009.
1. SCHEME PERFORMANCE, FUTURE OUTLOOK AND OPERATIONS OF THE SCHEME
a) Operations and Performance of the Scheme
HSBC Small Cap Fund (HSCF) - a close ended Equity Scheme with automatic conversioninto open-ended equity scheme at the end of three years from the date of allotment of units.
HSCF seeks to provide long-term capital appreciation primarily from a diversified portfolio ofequity and equity related instruments of small cap companies.
The net assets of HSBC Small Cap Fund amounted to Rs. 35.50 crores as at March 31, 2009.90.77% of the net assets were invested in equities and 9.23% were invested in debt andmoney market instruments as at March 31, 2009.
HSCF outperformed the BSE small cap index by 640 bps over the past 1 year on running highercash levels in the early part of the year.
Date of Inception : 24 March, 2008 Compounded Annualized Returns (%)
Schemes (P2P) 1 Year Since Inception
HSBC Small Cap Fund - Growth -52.23 -50.93
BSE SMALL CAP -58.60 -52.61
Past performance may or may not be sustained in future. 'Since inception' returns are calculatedon Rs. 10 invested at inception. Calculations are based on Growth NAVs.
b) Market Overview & Outlook
MARKET OVERVIEW
(as furnished by HSBC Asset Management (India) Private Limited)
Equity Market Overview
The financial year ended 31 March, 2009 was a highly eventful one with long standing institutionsdisappearing from the landscape in the whirlwind of the sub-prime crisis and derivative losses. Theyear can be split into three phases - the first from April 2008 till when Lehman Brothers filed forbankruptcy, which saw a blowout commodity rally (crude oil nudged close to USD 144/barrel) andthe sub-prime situation turning progressively worse. The United States (US) Government / FederalReserve bailed out major institutions thought to be critical to the functioning of the financial system.The second phase from September 2008 till January 2009 saw a spate of bankruptcies most notablyLehman Brothers which saw the appearance of an acute level of risk aversion pushing the creditmarkets into a gridlock. This phase also coincided with the fiscal / monetary stimuli by variousgovernments to take the credit crisis head on. Globally, markets stabilized around their October2008 lows and a semblance of normality started re-appearing in financial markets in this period. Thethird phase from February 2009 onwards witnessed a sharp rally as a weakening US Dollar spewedmoney into emerging markets. The sensex fell by 38% during the financial year.
For the financial year 2009, the popular indices viz. BSE Sensex and CNX Nifty were down 37.94%and 36.19% respectively. The BSE Midcap (54.01)% and the broader indices like BSE 200 (40.98)%and BSE 500 (42.77)% also reflected the correction across the markets. Within sectoral indices thebest performing indices were BSE FMCG (11.08)% and BSE Oil and Gas (29.58)% while the worstperforming indices were BSE Realty (79.37)%, due to the high leverage on the balance sheets, BSEMetals (58.67)%, due to slowdown in global growth and BSE Consumer Durables (58.14)% and BSECapital goods (53.84%).

4
In a year that saw sell-off across emerging markets, FIIs were net sellers of the tune USD 10.4 billionin the Indian equity markets while Domestic Institutional Investors (Insurance & Mutual Funds) werebuyers to the tune of USD 13.1 billion. Further, FIIs were net sellers in the derivative markets ashedge funds, and p-notes unwound positions in a rapidly deleveraging world. Thus, sentimentremained negative as few US based investment banks filed for bankruptcy in the midst of the liquidityand credit crisis and safety took precedence over growth.
Debt Market Overview
Two contrarian forces one inflationary and the other deflationary had been in play since 2007: Onthe one hand strong demand from emerging economies were leading commodities higher and fuellinginflation, while on the other the housing led credit crisis in the US was starting to exert a deflationaryforce. The first force was dominant till early July 2008 leading commodity prices to fresh peaks andinflation to multi year highs. Since then, however, the second force took hold with the result thatcommodity prices fell sharply from the top, growth and inflation numbers toppled worldwide, andcentral bankers shifted focus to achieving financial stability and protecting growth.
The financial crisis hit the domestic markets towards September 2008, leading to acute disruption inmoney markets. The Reserve Bank of India (RBI) acted proactively cutting the cash reserve ratio (CRR)by an unprecedented 400 bps between September 2008 and January 2009. Similarly, the reverserepo rate had been cut by 275 bps since October 2008 while the repo rate had been cut by 425 bpsover the same period.
Bond market yields fell in line with the unprecedented monetary easing up till the first week ofJanuary 2009. Thereon, supply pressures on bond markets rose as a result of government fiscalslippages aimed at stimulating the economy. The RBI, in line with similar measures elsewhere in theworld, started buying government securities to lessen the impact on yields from the rise in governmentborrowing. Although this helped market sentiment, it could not prevent a general rise in yieldstowards fiscal close. As a result, the 10 year benchmark sovereign yield closed the fiscal at 7% froma low of sub 5% hit in early January 2009. Money market rates stabilized after the initial mayhem ofSeptember 2008 and October 2008 and liquidity came back to interbank markets.
MARKET OUTLOOK
(as furnished by HSBC Asset Management (India) Private Limited)
Equity Market Outlook
Financial Year (FY) 2008-09 was a year marked by a strong correlation between the Indian marketand global markets with key indices ending deeply in the red on the back of the subprime crisis andderivative led losses across major financial stocks in the United States (US). Even in India, forex lossesran across corporate India though at a smaller magnitude. FY 10 has begun on a better note onaccount of various fundamental and technical factors.
GDP for FY 09 grew at 6.7% against FY 08 levels of 9%. Agriculture posted a below trend growthrate of 1.6% and industry grew by 3.9% (versus 8.1% in FY 08) with services registering a close to9.7% growth. IIP grew by a mere 2.6%. Although order books of engineering / capital goods wererunning at record high levels, there was possibility of delays in execution as funding sources for thedevelopers (equity, ECB, private equity, FCCB) had dried up. A sharp increase in subsidy on accountof oil, fertilizers and food led to a cut back in discretionary spending. Inflation rose on the back of asurging crude and higher prices of agricultural commodities to top at 12.91% for the week ending 2August, 2008. A slow down in the growth rates in the US / EU and other markets finally tamed thesurge in crude. As growth rates stumbled, governments / monetary authorities the world over triggeredfiscal stimuli / monetary easing to escape recessionary forces. This was followed in India as wellwhich started monetary easing / fiscal stimuli to keep growth rates buoyant.
On the positive side, India continues to do better in relative terms and we expect GDP growth of6-6.5% for FY10. The broad themes that are driving domestic growth viz. capital expenditure,infrastructure building and domestic consumption are still intact. The key concerns at this point
Trustees' ReportFor the year ended March 31, 2009 (Contd...)

5
stems from a ballooning fiscal deficit at the consolidated level (Centre & State) with salary revisionfor Central / State Government employees threatening a cut back in discretionary spending. Inflationis likely to remain benign for the first half of FY10 on a favourable base effect but we anticipate it togo back to trend levels of 5-5.5% for the second half of FY10 as this base effect wears off.
On a valuations perspective, the markets are currently trading at a P/E ratio of around 12 timesFY 2010 earnings. This is well below the 10-year average given the extreme risk aversion prevailing inthe markets. However, the underlying growth in the economy and corporate earnings growth (15%in the long term) makes the market attractive from a longer-term view. The short term could seeenhanced volatility arising from various factors. Increase in commodity prices continues to be a riskin the medium term as the US dollar continues to struggle with the ballooning US fiscal situation.
Debt Market Outlook
Excess supply of government bonds, as a result of fiscal slippages to arrest the downward growthmomentum, has been a reality for bond markets since January 2009. However, this is now compoundedwith some fatigue in buying longer duration as economic data is showing signs of recovery,commodities are showing signs of rally and expectations of incremental monetary easing from theRBI are beginning to unwind. However, system liquidity remains surplus and bank deposits continueto grow thereby providing resistance to bond yields from rising sharply.
Given the above factors, we believe that the market would continue to provide tactical opportunitiesalthough the fundamental bias should be for lower duration. Also, any mitigation of bond supplypressure or a new downturn in the ongoing economic recovery may provide space for opportunisticlonger duration plays. On the other hand, if the recovery cycle continues uninterrupted and commodityprices remain firm, central banks may start to worry about withdrawing the current monetary stimulusby sometime early 2010; with consequent impact on bond markets.
2. BRIEF BACKGROUND OF SPONSORS, BOARD OF TRUSTEES AND ASSETMANAGEMENT COMPANY
a) Sponsor
HSBC Mutual Fund is sponsored by HSBC Securities and Capital Markets (India) Private Limited (HSCI).The Sponsor is the Settler of the Mutual Fund Trust. The Sponsor has entrusted a sum of Rs. 1,00,000(Rupees One Lakh only) to the Trustee as the initial contribution towards the corpus of the MutualFund.
HSCI is a member of the HSBC Group, one of the largest banking and financial services organisations,in the world. Headquartered in London, HSBC operates through long-established businesses in fiveregions: Europe, Asia-Pacific, Middle East, America and Africa. Through its global network of 10,000offices in 86 countries and territories, HSBC provides a comprehensive range of financial services topersonal, commercial, corporate, institutional investment and private banking clients.
HSCI offers integrated investment banking services, securities and corporate finance & advisory. HSCIis a member of The Bombay Stock Exchange Limited and National Stock Exchange (capital and derivativemarket segments) and is also a category I merchant banker and underwriter registered with Securitiesand Exchange Board of India.
HSCI holds 100% of the paid-up equity share capital of the AMC.
b) HSBC Mutual Fund
HSBC Mutual Fund ("the Mutual Fund" or "the Fund") has been constituted as a Trust in accordancewith the provisions of the Indian Trusts Act, 1882 (2 of 1882) vide a Trust Deed dated February 7,2002 with HSBC Securities and Capital Markets (India) Private Limited, as the Sponsor and the Boardof Individual Trustees. The Trustee has entered into an Investment Management Agreement datedFebruary 7, 2002 with HSBC Asset Management (India) Private Limited (the AMC) to function as theInvestment Manager for all the Schemes of the Fund. The Fund was registered with SEBI videregistration number MF/046/02/5 dated May 27, 2002.
Trustees' ReportFor the year ended March 31, 2009 (Contd...)

6
The Trust has been formed for the purpose of pooling of capital from the public for collectiveinvestment in securities / any other property for the purpose of providing facilities for participationby persons as beneficiaries in such properties / investments and in the profits / income arising therefrom.
c) Board of Trustees (the Trustees)
The Board of Trustees are the exclusive owner of the Trust Fund and holds the same in trust for thebenefit of the unitholders. The Trustees have been discharging their duties and carrying out theirresponsibilities as provided in the SEBI (Mutual Funds) Regulations, 1996 and the Trust Deed. TheTrustees seeks to ensure that the Fund and the Schemes floated thereunder are managed by theAMC in accordance with the Trust Deed, the said Regulations, directions and guidelines issued bySEBI, the Stock Exchanges, the Association of Mutual Funds of India and other regulatory agencies.
d) Asset Management Company (the AMC)
HSBC Asset Management (India) Private Limited (the Investment Manager or the AMC) is a privatelimited company incorporated under the Companies Act, 1956 on December 12, 2001 having itsRegistered Office at 314, D. N. Road, Fort, Mumbai 400 001. HSBC Asset Management (India) PrivateLimited has been appointed as the Asset Management Company of the HSBC Mutual Fund by theTrustee vide Investment Management Agreement (IMA) dated February 7, 2002 and executed betweenthe Trustees and the AMC. SEBI approved the AMC to act as the Investment Manager of the Fundvide. its letter No. MFD/BC/163/2002 dated May 27, 2002.
The paid-up equity share capital of the AMC is Rs. 9 crores. HSBC Securities and Capital Markets(India) Private Limited holds 100% of the paid-up equity share capital of the AMC.
3. INVESTMENT OBJECTIVE OF THE SCHEMEThe investment objective of the Scheme has been provided above under the heading "SchemePerformance, Future Outlook and Operation of the Scheme" (refer Section 1).
4. SIGNIFICANT ACCOUNTING POLICIESThe accounting policies are in accordance with Securities and Exchange Board of India (Mutual Funds)Regulations, 1996.
5. UNCLAIMED DIVIDENDS & REDEMPTIONSNil.
6. INVESTOR SERVICESDuring the year, the number of official points of acceptance of transactions increased significantly toabout 182 locations. In addition to the offices of the transfer agency, the company has InvestorService Centres in 14 locations at its own offices - namely Mumbai, New Delhi, Kolkata, Chennai,Bangalore, Hyderabad, Pune, Ahmedabad, Indore, Chandigarh, Kochi, Coimbatore, Lucknow andVadodara. With a view to enhancing customer convenience, the Asset Management Company hasextended the facility of crediting investor bank accounts directly by way of NEFT / RTGS (for credit ofredemption and dividend proceeds). The AMC endeavours to despatch dividend proceeds within 5working days from the Record Date in all Schemes. The internal standards on redemption payoutshave been consistently met, with very few exceptions. The number of locations for the ECS AutoDebit facility for investments through Systematic Investment Plan also increased to about 74 byMarch 2009.
On the distribution front, the number of empanelled distributors increased from 7859 as on 31March, 2008 to 8632 as on 31 March, 2009. During the year, the Asset Management Companyinitiated tie-ups for online distribution of the Mutual Fund's schemes with several channel partnerstaking the total number of such tie-ups to 24 (Angel Capital & Department Market Ltd., Bajaj CapitalLimited, Bonanza Portfolio Limited, Citibank N.A., Citigroup Wealth Advisors India Private Limited,
Trustees' ReportFor the year ended March 31, 2009 (Contd...)

7
HDFC Bank Limited, Hongkong & Shanghai Banking Corporation Limited, HSBC Corporate InvestmentSolution Services, ICICI Securities Limited, India Infoline Limited, Karvy Stock Broking Limited, KotakMahindra Bank Limited, Kotak Securities Limited, Motilal Oswal Securities Limited, NJ India InvestPrivate Limited, Reliance Securities Limited, RR Investors Capital Services Private Limited, SBICAPSecurities Limited, Sharekhan Limited, SMC Global Securities Limited, Standard Chartered - STCICapital Markets Ltd., Tom Distribution Services Limited, Yes Bank Limited).
Call centre operations have been extended to cover the entire country. The Asset ManagementCompany has outsourced certain back office services including call centre services to HSBC Operationsand Processing Enterprise (India) Private Limited (HOPE).
7. STATUTORY DETAILSa) The Sponsors are not responsible or liable for any loss resulting from the operation of the Schemes
of the Fund beyond initial contribution of Rs. 1 lakh for setting up the Fund.
b) The price and redemption value of the units, and income from them, can go up as well as downwith fluctuations in the market value of its underlying investments.
c) Full / Abridged Annual Report shall be disclosed on the website at www.assetmanagement.hsbc.com/inand shall be available for inspection at the Head Office of the mutual fund. Present and prospectiveunit holder can obtain copy of the trust deed, the Full / Abridged Annual Report of the Scheme(s),the Annual Report of HSBC Asset Management (India) Private Limited and the text of the relevantScheme(s) at a price.
8. ACKNOWLEDGEMENTSThe Trustees wish to thank the Unitholders of the Schemes for their support throughout the year andalso thank the Government of India, the Securities and Exchange Board of India (SEBI), the ReserveBank of India (RBI) and the Association of Mutual Funds in India (AMFI) for the guidance provided bythem. The Trustees also appreciate the service provided by the Registrar and Transfer Agent, FundAccountant, Custodian, Bankers, Distributors and Brokers. The guidance and services provided bythe Auditors and advocates and the ebullience, sincerity and dedication of the employees of HSBCAsset Management (India) Private Limited is also appreciated.
The Trustees look forward to the continued support of everyone.
For and on behalf of the Board of Trustees of HSBC Mutual Fund
Dilip J. Thakkar
Trustee
MUMBAIJuly 6, 2009
Trustees' ReportFor the year ended March 31, 2009 (Contd...)

8
To the Board of Trustees of
HSBC MUTUAL FUND
1. We have audited the Balance Sheet of HSBC Mutual Fund – HSBC Small Cap Fund (“The Scheme”)as at March 31, 2009, and the related Revenue Account for the year ended on that date both ofwhich we have signed under reference to this report. These financial statements are theresponsibility of the Board of Trustees of HSBC Mutual Fund and the Management of HSBC AssetManagement (India) Private Limited (the “Management”). Our responsibility is to express anopinion on these financial statements based on our audit.
2. We have conducted our audit in accordance with auditing standards generally accepted in India.Those standards require that we plan and perform the audit to obtain reasonable assuranceabout whether the financial statements are free of material misstatement. An audit includesexamining, on a test basis, evidence supporting the amounts and disclosures in the financialstatements. Our procedures included confirmation of securities owned and unit capital balancesas at March 31, 2009 by correspondence with the custodian / others and registrar and transferagent respectively. An audit also includes assessing the accounting principles used and significantestimates made by the Management as well as evaluating the overall financial statementpresentation. We believe that our audit provides a reasonable basis for our opinion.
3. We have obtained all the information and explanations which to the best of our knowledge andbelief were necessary for the purpose of our audit. The Balance Sheet and the Revenue Accountreferred to above are in agreement with the books of account of the Scheme.
4. In our opinion and to the best of our information and according to the explanations given to us,
(i) The Balance Sheet, the Revenue Account together with the notes thereon give the informationrequired by the Securities and Exchange Board of India (Mutual Funds) Regulations, 1996 andamendments thereto, as applicable, and also give respectively, a true and fair view of thestate of affairs of HSBC Mutual Fund – HSBC Small Cap Fund as at March 31, 2009 and its netdeficit for the year ended on that date.
(ii) The Balance Sheet as at March 31, 2009 and the Revenue Account for the year ended on thatdate, together with the notes thereon have been prepared in all material respects in accordancewith the accounting policies and standards specified in the Ninth Schedule of the Securitiesand Exchange Board of India (Mutual Funds) Regulations, 1996 and amendments thereto asapplicable.
Partha GhoshPartnerMembership No. F / 55913
For and on behalf ofPRICE WATERHOUSEChartered Accountants
Place : MumbaiDate : July 6, 2009
Auditors' Report

9
Rs. in Lakhs
HSBC SMALL CAP FUND
As at As atMarch 31, 2009 March 31, 2008
LIABILITIES1 Unit Capital 7,333.95 8,484.152 Reserves & Surplus2.1 Unit Premium Reserves 405.75 –2.2 Unrealised Appreciation Reserve – 78.872.3 Other Reserves (4,183.98) 34.32
3 Loans & Borrowings – –
4 Current Liabilities & Provisions4.1 Provision for doubtful Income / Deposits – –4.2 Other Current Liabilities & Provisions 179.02 769.63
TOTAL 3,734.74 9,366.97
ASSETS1 Investments1.1. Listed Securities:1.1.1 Equity Shares 2,812.09 1,575.031.1.2 Preference Shares – –1.1.3 Equity Linked Debentures – –1.1.4 Other Debentures & Bonds – –1.1.5 Securitised Debt securities – –1.2 Securities Awaited Listing:1.2.1 Equity Shares – –1.2.2 Preference Shares – –1.2.3 Equity Linked Debentures – –1.2.4 Other Debentures & Bonds – –1.2.5 Securitised Debt securities – –1.3 Unlisted Securities:1.3.1 Equity Shares – –1.3.2 Preference Shares – –1.3.3 Equity Linked Debentures – –1.3.4 Other Debentures & Bonds – –1.3.5 Securitised Debt securities – –1.4 Government Securities – –1.5 Treasury Bills – –1.6 Commercial Paper – –1.7 Certificate of Deposits – –1.8 Bill Rediscounting – –1.9 Units of Domestic Mutual Fund – –1.10 Foreign Securities – –
Total Investments 2,812.09 1,575.03
2 Deposits 410.00 –
3 Other Current Assets3.1 Cash & Bank Balance 143.48 112.093.2 CBLO / Reverse Repo Lending 9.97 7,161.013.3 Others 49.35 9.79
4 Deferred Revenue Expenditure 309.85 509.05(to the extent not written off)
TOTAL 3,734.74 9,366.97
Notes to Accounts - Annexure I
Abridged Balance Sheet as at March 31, 2009

10
Rs. in Lakhs
HSBC SMALL CAP FUND
Current PreviousYear ended Year ended
March 31, 2009 March 31, 2008
1 INCOME1.1 Dividend 95.70 –1.2 Interest 92.65 35.991.3 Realised Gain / (Loss) on Foreign Exchange Transactions – –1.4 Realised Gains / (Losses) on Interscheme
sale of investments – –1.5 Realised Gains / (Losses) on External sale /
redemption of investments (2,785.58) 9.631.6 Realised Gains / (Losses) on Derivative Transactions 6.92 –1.7 Other Income – –
(A) (2,590.31) 45.62
2 EXPENSES2.1 Management fees 71.53 8.242.2 Service tax on Management fees ** – –2.3 Transfer agents fees and expenses 10.42 0.212.4 Custodian fees 1.80 0.082.5 Trusteeship fees 0.03 –2.6 Commission to Agents * – –2.7 Marketing & Distribution expenses 45.48 1.262.8 Audit fees 0.50 0.052.9 Other operating expenses 181.96 1.46
(B) 311.72 11.30
3 NET REALISED GAINS / (LOSSES)FOR THE YEAR / PERIOD (A - B = C) (2,902.03) 34.32
4 Change in Unrealised Depreciationin value of investments (D) 1,316.27 –
5 NET GAINS / (LOSSES) FOR THEYEAR / PERIOD [E = (C-D)] (4,218.30) 34.32
6 Change in unrealised appreciationin the value of investments (F) (78.87) 78.87
7 NET SURPLUS / (DEFICIT) FORTHE YEAR / PERIOD (E + F = G) (4,297.17) 113.19
7.1 Add: Balance transfer fromUnrealised Appreciation Reserve 78.87 –
7.2 Less: Balance transfer to Unrealised Appreciation Reserve – 78.877.3 Add / (Less): Equalisation – –7.4 Transfer from Reserve Fund – –7.5 Transfer from Unit Premium Reserve – –
8 TOTAL (4,218.30) 34.32
9 Dividend Appropriation9.1 Income Distributed during the year / period – –9.2 Tax on income distributed during the year / period – –10 Retained Surplus / (Deficit)
carried forward to Balance Sheet (4,218.30) 34.32
Notes to Accounts - Annexure I* Commission to Agents is included in Marketing & Distribution Expenses.** Service Tax on Management Fees is included in Other Operating Expenses.
Abridged Revenue Account for the year ended March 31, 2009

11
HSBC SMALL CAP FUND
Current PreviousYear ended Year ended
March 31, 2009 March 31, 2008
1. NAV per unit (Rs.):
Open
Regular Growth Option 10.1334 –
Regular Dividend Option 10.1334 –
High
Regular Growth Option 10.8088 10.1334
Regular Dividend Option 10.8088 10.1334
Low
Regular Growth Option 4.3742 10.0209
Regular Dividend Option 4.3742 10.0209
End
Regular Growth Option 4.8483 10.1334
Regular Dividend Option 4.8483 10.1334
2. Closing Assets Under Management (Rs. in Lakhs)
End 3,556 8,597
Average (AAuM)1 6,119 8,520
3. Gross income as % of AAuM2 -42.33% 0.54%
4. Expense Ratio:
a. Total Expense as % of AAuM (planwise)
Regular Growth Option 2.34% 0.00%~
Regular Dividend Option 2.34% 0.00%~
b. Management Fee as % of AAuM (planwise)
Regular Growth Option 1.17% 0.00%~
Regular Dividend Option 1.17% 0.00%~
5. Net Income as a percentage of AAuM3 -47.42% 0.40%
6. Portfolio turnover ratio4 0.75 0.01
7. Total Dividend per unit distributed duringthe year / period (planwise)
Retail
Dividend – –
Corporate
Dividend – –
Key Statistics for the year ended March 31, 2009
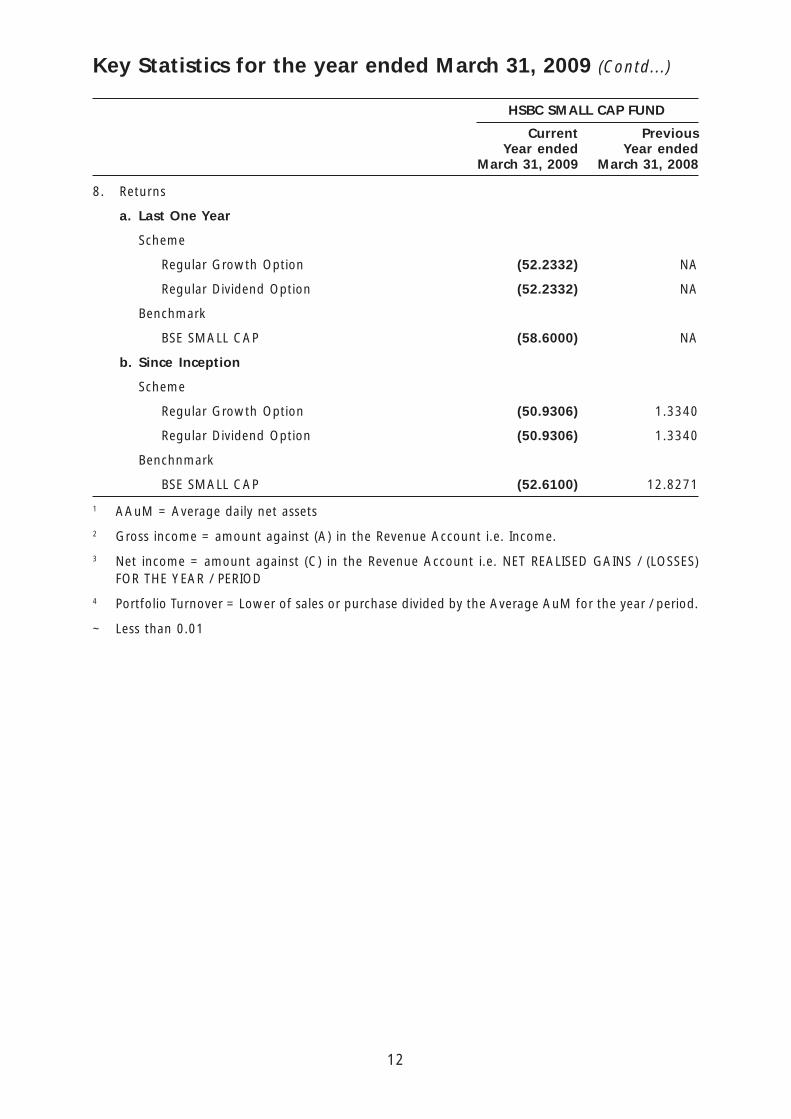
12
8. Returns
a. Last One Year
Scheme
Regular Growth Option (52.2332) NA
Regular Dividend Option (52.2332) NA
Benchmark
BSE SMALL CAP (58.6000) NA
b. Since Inception
Scheme
Regular Growth Option (50.9306) 1.3340
Regular Dividend Option (50.9306) 1.3340
Benchnmark
BSE SMALL CAP (52.6100) 12.8271
1 AAuM = Average daily net assets
2 Gross income = amount against (A) in the Revenue Account i.e. Income.
3 Net income = amount against (C) in the Revenue Account i.e. NET REALISED GAINS / (LOSSES)FOR THE YEAR / PERIOD
4 Portfolio Turnover = Lower of sales or purchase divided by the Average AuM for the year / period.
~ Less than 0.01
Key Statistics for the year ended March 31, 2009 (Contd...)
HSBC SMALL CAP FUND
Current PreviousYear ended Year ended
March 31, 2009 March 31, 2008

13
HSBC SMALL CAP FUND
1 Investments:
1.1. It is confirmed that investments of the schemes are registered in the name of the Trustees forthe benefit of the scheme’s unitholders.
1.2. Open Positions of derivatives as of March 31, 2009 and March 31, 2008 are Nil.
1.3. There were no investments made in Associates and Group Companies by the scheme for theyear ended March 31, 2009 and March 31, 2008.
1.4. Open position of Securities Borrowed and / or Lent by the scheme as of the year endedMarch 31, 2009 is NIL.
1.5. NPAs as at years ended March 31, 2009 and March 31, 2008 are NIL.
1.6. Aggregate Unrealised Gain / Loss as at the end of the Financial year and their percentages tonet assets are as under:
Security Amount Percentage to Amount Percentage toCategory (Rupees) Net Assets (Rupees) Net Assets
2009 2008
Equity Shares
– Appreciation 11,913,805 3.3506% 10,312,476 1.1995%
– Depreciation 143,541,167 40.3690% 2,425,743 0.2822%
1.7 The aggregate value of investments purchased and sold during the year is Rs. 1,000,285,806and Rs. 458,524,246 respectively being 163.46% and 74.93% of the average daily net assets.
The aggregate value of investments purchased and sold during the financial year 2007 - 2008 isRs. 157,876,645 and Rs. 9,223,471 respectively being 144.30% and 8.43% of the averagedaily net assets.
1.8. Non-Traded securities in the portfolio as at the year ended March 31, 2008 are NIL.
2 Disclosure under Regulation 25(8) of the Securities and Exchange Board of India (Mutual Funds)Regulations, 1996 as amended
Year - 2008-2009
During the year, HSBC Securities and Capital Markets (India) Private Limited, the Sponsor waspaid brokerage aggregating Rs. 64,968 on purchase and sale of investments. The Hongkong &Shanghai Banking Corporation Limited, an associate entity of HSBC Asset Management (India)Private Limited was paid collection / bank charges amounting to Rs. 2,001, brokerage amountingto Rs. 311,641 for procuring unit subscriptions for the Scheme and clearing member charges onderivative transactions Rs. 18,271. The brokerage paid was at rates similar to those offered toother brokers / distributors.
Year - 2007-2008
During the year, HSBC Securities and Capital Markets (India) Private Limited, the Sponsor waspaid brokerage aggregating Rs.10,000 on purchase and sale of Investments.
3 None of the Investors held more than 25% of the total net assets of the scheme at the yearended March 31, 2009 and March 31, 2008.
Notes to Accounts - Annexure ITo the Abridged Balance Sheet and Revenue Account for the year ended March 31, 2009

14
Notes to Accounts - Annexure I (Contd...)To the Abridged Balance Sheet and Revenue Account for the year ended March 31, 2009
4 Unit Capital movement during the years ended March 31, 2009 and March 31, 2008.
2008-2009
Description Opening Units Subscription Redemption Closing Units Face Value
Growth 48,849,646.818 53,550.878 4,823,357.301 44,079,840.395 440,798,403.95
Dividend 35,991,812.396 351,845.309 7,083,961.175 29,259,696.530 292,596,965.30
2007-2008
Description Opening Units Subscription Redemption Closing Units Face Value
Growth – 48,849,646.818 – 48,849,646.818 488,496,468.18
Dividend – 35,991,812.396 – 35,991,812.396 359,918,123.96
5 Previous year’s figures have been re-grouped / re-arranged where appropriate.
6 No contingent liabilities for the years ended March 31, 2009 and March 31, 2008.
7 Expenses other than Management Fees are inclusive of Service Tax where applicable.
8 The Annual Accounts of the Schemes prepared in accordance with the accounting policies andstandards specified in the Ninth Schedule of The Securities and Exchange Board of India (MutualFunds) Regulations, 1996 has been approved by the Board of Directors of HSBC Asset Management(India) Private Limited and The Board of Trustees of HSBC Mutual Fund at their meeting held onJuly 06, 2009. The audit report attached herewith refers to the said annual accounts. The aforesaidabridged accounts are an extract of the Annual Accounts and are prepared in accordance withSEBI Circular No. IMD/Cir 8/132968/2008 dated July 24, 2008.

15
DISCLAIMERSThe content of this report has been prepared by HSBC Asset Management (India) Private Limited(HSBC) for information purposes only and should not be construed as an offer or solicitation of anoffer for purchase of any of the funds of HSBC Mutual Fund. The information is for general informationonly and does not have regard to specific investment objectives, financial situation and the particularneeds of any specific person who may receive this information. Investments in mutual funds inherentlyinvolve risks and investors should read the relevant documents / information for details and riskfactors and consult their legal, tax and financial advisors before investing. Investors should understandthat statements made herein regarding future prospects may not be realised. Neither this documentnor the units of HSBC Mutual Fund have been registered in any jurisdiction. The distribution of thisdocument in certain jurisdictions may be restricted or totally prohibited and accordingly, personswho come into possession of this document are required to inform themselves about, and to observe,any such restrictions.
Investors may obtain Statement of Additional Information, Combined Scheme Information Documentand Common Key Information Memorandums along with application forms from the office of HSBCMutual Fund, 314, D. N. Road, Fort, Mumbai 400 001. Tel: 022-6666 8819.
Statutory Details:HSBC Mutual Fund has been set up as a trust by HSBC Securities and Capital Markets (India) PrivateLimited (liability restricted to the corpus of Rs. 1 lakh). The Sponsor/associates of the Sponsor/AssetManagement Company (AMC) are not responsible or liable for any loss or shortfall resulting from theoperation of the Schemes. The Trustees of HSBC Mutual Fund have appointed HSBC Asset Management(India) Private Limited as the Investment Manager.
Risk Factors:All investments in mutual funds and securities are subject to market risks and the Net Asset Value(NAV) of the Scheme(s) may go up or down depending on the factors and forces affecting the securitiesmarkets. There can be no assurance that the objectives of the Scheme(s) will be achieved. Pastperformance of the Sponsor, AMC, Mutual Fund or any associates of the Sponsor/AMC does notindicate the future performance of the Scheme(s) of the Mutual Fund. HSBC Small Cap Fund (HSCF)is the names of the Scheme and does not in any manner indicate the quality of the Scheme or itsfuture prospects or returns.
Terms of Issue:Units of the Scheme(s) are being offered at NAV based prices, subject to the prevailing loads. TheAMC calculates and publishes NAVs and offers for sale, redemption and switch outs, units of theScheme(s) on all Business Days, at the Applicable NAV for all Schemes (at least once a week, i.e.,every Wednesday and daily during the period of redemption in case of HSCF). HUOF, HSCF & HFTSwill not be open for ongoing subscriptions/ switch ins. HUOF & HSCF would be available for sale onan ongoing basis (after a period of 3 years from the date of allotment). Conversion of HUOF & HSCFto an open-ended scheme will be done only after the balance unamortized amount has been fullyrecovered from the Scheme. Units can be redeemed/switched out on every Business Day at NAVbased prices, subject to prevailing exit loads. In case of HSCF, units can be redeemed / switched outon a monthly basis on the stipulated date i.e. last 3 business days of every month at NAV basedprices, subject to provisions of exit load, if any and recovery of balance proportionate unamortizedNFO expenses.
Load Structure (includes SIP/STP):During close ended period:
Entry - Nil;
Exit # - If the investments are redeemed / switched out within: 1 year - 2%; 2 years - 1.5% and 3years - 1%.
# Balance proportionate unamortized NFO expenses to be recovered in case of exit within close-ended period.
Upon conversion into an open ended scheme:
Entry - For investments / switched in below Rs. 5 Crores - 2.25%, otherwise Nil;
Exit - Nil.
*No load in case of switches between equity Schemes of HSBC Mutual Fund.
Consult the nearest investor service centre for details.

16
The entry/exit load set forth above is subject to change at the discretion of the AMC and suchchanges shall be implemented prospectively.
Mutual Fund investments are subject to market risks. Please read the Statement of AdditionalInformation and Scheme Information Document carefully before investing.
Value Research Online DisclaimerValue Research Fund Ratings: Value Research Fund Ratings are a composite measure of historical risk-adjusted returns. In the case of equity funds this rating is based on the average monthly returns forthe last 3-year and 5-year period. These ratings do not take into account any entry or exit load.
Value Research Fund Ratings are subject to change every month. Current Fund Ratings are as onMarch 31, 2009. 142 open-ended Equity: Diversified Funds were rated. The Rating is based on primarydata provided by respective funds; Value Research does not guarantee the accuracy. Ranking Entity:Value Research Online.
ICRA Online Ranking MethodologyHSBC Monthly Income - Savings Plan has been ranked as a Five Star Fund in the category of 'OpenEnded Marginal Equity' schemes for its 3 year performance till December 31, 2008.
The rank is an outcome of an objective and comparative analysis against various parameters, including:risk adjusted return, fund size, company concentration, portfolio turnover and liquidity. The rankingmethodology did not take into account entry and exit loads imposed by the Fund. There were 27schemes considered in 'Open Ended Marginal Equity' category for the ranking exercise. The rank isneither a certificate of statutory compliance nor any guarantee on the future performance of HSBCMonthly Income - Savings Plan. Ranking Source & Publisher: ICRA Online Limited.
CRISIL Ranking MethodologyThe selection for the awards is based on the CRISIL FundServices' Composite Performance Ranking(CRISIL~CPR) methodology.
The CRISIL Composite Performance Ranking (CRISIL~CPR) is a quarterly ranking of mutual fund schemesbased on two year performance (excepting for the liquid and short term debt categories where a oneyear performance horizon is considered). The methodology is based on global best practices,customized to account for Indian market nuances. Over time, the rankings have become the industrystandard with good acceptance among Investors, Fund Intermediaries, Asset Management Companies,etc. The performance criteria covers not only risk adjusted returns, which are historical, but also theportfolio constitution to make the analysis forward looking.
CRISIL DisclaimerThe overall ranking is assigned to the scheme based on its weighted average score on a range ofparameters: Superior Return Score, Concentration, Liquidity, Asset Quality - Measures the creditquality of the portfolio, Average Maturity and Asset Size. HSBC MIP - Savings was the only schemethat won the CNBC TV18 - CRISIL Mutual Fund of the Year Award in the Category - Monthly IncomePlans - Aggressive. In total 13 schemes were eligible for the award universe. Schemes present in allfour quarterly CRISIL CPRs were considered for the award. The award is based on consistency of thescheme's performance in the four quarterly CRISIL CPR rankings released during the calendar year2008. The individual CRISIL CPR parameter scores averaged for the four quarters were further multipliedby the parameter weights as per the CRISIL CPR methodology to arrive at the final scores. A detailedmethodology of the CRISIL CPR is available at www.crisil.com. Past performance is no guarantee offuture results. Rankings and Award Source: CRISIL Fund Services, CRISIL Ltd. HSBC Monthly Income -Savings Plan has been ranked as a Five Star Fund in the category of 'Open Ended Marginal Equity'schemes for its 3 year performance till December 31, 2008. The rank is an outcome of an objectiveand comparative analysis against various parameters, including: risk adjusted return, fund size,company concentration, portfolio turnover and liquidity. The ranking methodology did not take intoaccount entry and exit loads imposed by the Fund. There were 27 schemes considered in 'OpenEnded Marginal Equity' category for the ranking exercise. The rank is neither a certificate of statutorycompliance nor any guarantee on the future performance of HSBC Monthly Income - Savings Plan.Ranking Source & Publisher: ICRA Online Limited.

Issued by HSBC Asset Management (India) Private Limited
HSBC MIP*
Abridged Annual Report 2008 - 2009
HSBC Global Asset Management
* An open-ended fund. Monthly income is not assured and is subject to the availability of distributable surplus.

1
Dear Investor,
We thank you for investing with HSBC Mutual Fund. We are pleased to inform you that HSBCMutual Fund has won prestigious awards* this year at various forums in India.
The awards* won by our schemes in India are
� HSBC Equity Fund has been included in the 5 star rated fund category (“Top rated mutualfunds” by Value Research online) in March, 2009.
� Five-stars indicate that a fund is in the top 10 per cent of its category in terms ofhistorical risk-adjusted returns.
� ICRA Mutual Fund Awards 2009
� HSBC MIP - Savings has been ranked a 5-Star Fund by ICRA Online indicating performanceamong the top 10% in the category of 'Open Ended Marginal Equity' for 3 yearperformance ending 31 December, 2008.
� CNBC TV18 - CRISIL Mutual Fund Awards 2008
� HSBC MIP - Savings was awarded the CNBC TV18 - CRISIL Mutual Fund of the YearAward for the year 2008 in the Monthly Income Plans - Aggressive Category.
(Past performance is no guarantee of future results. * Please refer to Ranking methodologyand disclaimer mentioned at the end of the Abridged Annual Report for the year endedMarch 31, 2009).
At the global level, the HSBC Group won several awards at Euromoney's Awards for Excellence2009. The top awards that HSBC won were the Best Global Bank and the Best Global DebtHouse. It was also honoured as the Best Debt House in 8 locations including Asia and the Bestat Risk Management in Asia. (Past performance may or may not be sustained in the future andis no guarantee of future results). We continue to be one of the leading players in emergingmarkets and remain committed to our asset management business in India.
HSBC Asset Management (India) Private Limited including the mutual fund business as well asthe PMS business (including EPFO money deployed till date) manages assets of about Rs. 26280Crores as at 30 June, 2009. The core to our winning strategy is our endeavour to deliverconsistent performance over the medium to long term for our investors in a risk controlledenvironment and aim for consistent wealth creation under varying market conditions. Throughour product range, we aim to be true to our reputation in India of being a provider ofinternational quality investment products and services.
We remain committed to our philosophy of aiming for consistent wealth creation and serviceexcellence and look forward to your continued investments in HSBC Mutual Fund.
Yours sincerely,
VikramaadityaChief Executive OfficerHSBC Asset Management (India) Private Limited

2
SPONSORHSBC Securities and Capital Markets (India) Private LimitedRegd. Office: 52/60, Mahatma Gandhi Road, Fort, Mumbai 400 001.
TRUSTEEBoard of TrusteesOffice: 314, D. N. Road, Fort, Mumbai 400 001.
ASSET MANAGEMENT COMPANYHSBC Asset Management (India) Private LimitedCorp. & Regd. Office: 314, D. N. Road, Fort, Mumbai 400 001.
CUSTODIANJP Morgan Chase BankCorp. & Regd. Office: Mafatlal Centre, 9th Floor, Nariman Point, Mumbai - 400 021.
AUDITORS TO THE SCHEMEPrice WaterhouseChartered Accountants252, Veer Savarkar Marg, Shivaji Park, Dadar (West), Mumbai - 400 028.
LEGAL ADVISORSBharucha & Partners4th Floor, Cecil Court, Mahakavi Bhushan Marg, Colaba, Mumbai - 400 039.
REGISTRAR & TRANSFER AGENTSComputer Age Management Services (P) Ltd. (CAMS)Rayala Towers, Tower I, III Floor, 158 Anna Salai, Chennai - 600 002.
BOARD OF TRUSTEESMr. N. P. Gidwani - Chairman
Dr. Rudolf ApenbrinkMr. Nasser MunjeeMr. Manu TandonMr. Mehli MistriMr. Dilip J. Thakkar
BOARD OF DIRECTORSMs. Naina Lal Kidwai - Chairman
Mr. Ayaz EbrahimMr. S. P. Mustafa**Mr. Vithal PalekarMs. Kishori J. Udeshi*Mr. Vikramaaditya - Chief Executive Officer***
* Ms. Kishori Udeshi has been appointed as a Director with effect from 14 January 2009 andMr. Jagjit Lal Pasricha has resigned as a Director with effect from 19 January 2009.
** Mr. S. P. Mustafa has been appointed as a Director with effect from 2 September 2008 andMr. Nawshir Khurody has resigned as a Director with effect from 1 September 2008
*** Mr. Vikramaaditya has been appointed as the Chief Executive Officer with effect from 16 July 2008and Mr. Sanjay Prakash has resigned as the Chief Executive Officer with effect from 16 July 2008.

3
Trustees' ReportFor the year ended March 31, 2009
The Trustees present the seventh report and the audited financial statements of the Schemes ofHSBC Mutual Fund (the "Fund"), for the year ended March 31, 2009.
1. SCHEME PERFORMANCE, FUTURE OUTLOOK AND OPERATIONS OF THE SCHEME
a) Operations and Performance of the Scheme
HSBC MIP (HMIP) - an open-ended Fund(Monthly income is not assured and is subject to availability of distributable surplus.)
HMIP an open-ended Fund seeks to generate reasonable returns through investments in Debt andMoney Market Instruments. The secondary objective of the scheme is to invest in equity and equityrelated instruments to seek capital appreciation. The Fund offers two Plans: Regular Plan and SavingsPlan. The Regular Plan can have up to 15 per cent of the corpus invested in equities while the SavingsPlan can have up to 25 per cent invested in equities.
The net assets of HMIP Regular Plan (HMIP - R) amounted to Rs. 57.26 crores as at March 31, 2009as compared to Rs. 63.75 crores as at March 31, 2008. 97.10% in debt and money market instruments& 2.90% of the net assets were invested in equities as at March 31, 2009.
The net assets of HMIP Savings Plan (HMIP - S) amounted to Rs. 103.38 crores as at March 31, 2009as compared to Rs. 137.78 crores as at March 31, 2008. 94.75% in debt and money market instruments& 5.25% of the net assets were invested in equities as at March 31, 2009.
The performance of HMIP - R and HMIP - S is benchmarked against CRISIL MIP Blended Index. Therefore,HMIP - R, having lower equity allocation has outperformed its benchmark index over the said periodwhilst HMIP - S, with the higher equity portion has underperformed the index.
Date of Inception : 24 February, 2004 Compounded Annualized Returns (%)
Schemes (P2P) 1 Year 3 Years Since Inception
HSBC MIP - Regular Plan - Growth 2.88 7.29 7.09
CRISIL MIP Blended Index 0.19 5.52 6.02
Past performance may or may not be sustained in future. 'Since inception' returns are calculated onRs. 10 invested at inception. Calculations are based on Growth NAVs.
HMIP - Savings Plan
Date of Inception : 24 February, 2004 Compounded Annualized Returns (%)
Schemes (P2P) 1 Year 3 Years Since Inception
HSBC MIP - Savings Plan - Growth -0.24 7.21 8.32
CRISIL MIP Blended Index 0.19 5.52 6.02
Past performance may or may not be sustained in future. 'Since inception' returns are calculated onRs. 10 invested at inception. Calculations are based on Growth NAVs.
b) Market Overview & Outlook
MARKET OVERVIEW(as furnished by HSBC Asset Management (India) Private Limited)
Equity Market Overview
The financial year ended 31 March, 2009 was a highly eventful one with long standing institutionsdisappearing from the landscape in the whirlwind of the sub-prime crisis and derivative losses. Theyear can be split into three phases - the first from April 2008 till when Lehman Brothers filed forbankruptcy, which saw a blowout commodity rally (crude oil nudged close to USD 144/barrel) andthe sub-prime situation turning progressively worse. The United States (US) Government / FederalReserve bailed out major institutions thought to be critical to the functioning of the financial system.The second phase from September 2008 till January 2009 saw a spate of bankruptcies most notably

4
Lehman Brothers which saw the appearance of an acute level of risk aversion pushing the creditmarkets into a gridlock. This phase also coincided with the fiscal / monetary stimuli by variousgovernments to take the credit crisis head on. Globally, markets stabilized around their October2008 lows and a semblance of normality started re-appearing in financial markets in this period. Thethird phase from February 2009 onwards witnessed a sharp rally as a weakening US Dollar spewedmoney into emerging markets. The sensex fell by 38% during the financial year.
For the financial year 2009, the popular indices viz. BSE Sensex and CNX Nifty were down 37.94%and 36.19% respectively. The BSE Midcap (54.01)% and the broader indices like BSE 200 (40.98)%and BSE 500 (42.77)% also reflected the correction across the markets. Within sectoral indices thebest performing indices were BSE FMCG (11.08)% and BSE Oil and Gas (29.58)% while the worstperforming indices were BSE Realty (79.37)%, due to the high leverage on the balance sheets, BSEMetals (58.67)%, due to slowdown in global growth and BSE Consumer Durables (58.14)% and BSECapital goods (53.84%).
In a year that saw sell-off across emerging markets, FIIs were net sellers of the tune USD 10.4 billionin the Indian equity markets while Domestic Institutional Investors (Insurance & Mutual Funds) werebuyers to the tune of USD 13.1 billion. Further, FIIs were net sellers in the derivative markets ashedge funds, and p-notes unwound positions in a rapidly deleveraging world. Thus, sentimentremained negative as few US based investment banks filed for bankruptcy in the midst of the liquidityand credit crisis and safety took precedence over growth.
Debt Market Overview
Two contrarian forces one inflationary and the other deflationary had been in play since 2007: Onthe one hand strong demand from emerging economies were leading commodities higher and fuellinginflation, while on the other the housing led credit crisis in the US was starting to exert a deflationaryforce. The first force was dominant till early July 2008 leading commodity prices to fresh peaks andinflation to multi year highs. Since then, however, the second force took hold with the result thatcommodity prices fell sharply from the top, growth and inflation numbers toppled worldwide, andcentral bankers shifted focus to achieving financial stability and protecting growth.
The financial crisis hit the domestic markets towards September 2008, leading to acute disruption inmoney markets. The Reserve Bank of India (RBI) acted proactively cutting the cash reserve ratio (CRR)by an unprecedented 400 bps between September 2008 and January 2009. Similarly, the reverserepo rate had been cut by 275 bps since October 2008 while the repo rate had been cut by 425 bpsover the same period.
Bond market yields fell in line with the unprecedented monetary easing up till the first week ofJanuary 2009. Thereon, supply pressures on bond markets rose as a result of government fiscalslippages aimed at stimulating the economy. The RBI, in line with similar measures elsewhere in theworld, started buying government securities to lessen the impact on yields from the rise in governmentborrowing. Although this helped market sentiment, it could not prevent a general rise in yieldstowards fiscal close. As a result, the 10 year benchmark sovereign yield closed the fiscal at 7% froma low of sub 5% hit in early January 2009. Money market rates stabilized after the initial mayhem ofSeptember 2008 and October 2008 and liquidity came back to interbank markets.
MARKET OUTLOOK(as furnished by HSBC Asset Management (India) Private Limited)
Equity Market Outlook
Financial Year (FY) 2008-09 was a year marked by a strong correlation between the Indian marketand global markets with key indices ending deeply in the red on the back of the subprime crisis andderivative led losses across major financial stocks in the United States (US). Even in India, forex lossesran across corporate India though at a smaller magnitude. FY 10 has begun on a better note onaccount of various fundamental and technical factors.
GDP for FY 09 grew at 6.7% against FY 08 levels of 9%. Agriculture posted a below trend growthrate of 1.6% and industry grew by 3.9% (versus 8.1% in FY 08) with services registering a close to9.7% growth. IIP grew by a mere 2.6%. Although order books of engineering / capital goods were
Trustees' ReportFor the year ended March 31, 2009 (Contd...)

5
running at record high levels, there was possibility of delays in execution as funding sources for thedevelopers (equity, ECB, private equity, FCCB) had dried up. A sharp increase in subsidy on accountof oil, fertilizers and food led to a cut back in discretionary spending. Inflation rose on the back of asurging crude and higher prices of agricultural commodities to top at 12.91% for the week ending 2August, 2008. A slow down in the growth rates in the US / EU and other markets finally tamed thesurge in crude. As growth rates stumbled, governments / monetary authorities the world over triggeredfiscal stimuli / monetary easing to escape recessionary forces. This was followed in India as wellwhich started monetary easing / fiscal stimuli to keep growth rates buoyant.
On the positive side, India continues to do better in relative terms and we expect GDP growth of6-6.5% for FY10. The broad themes that are driving domestic growth viz. capital expenditure,infrastructure building and domestic consumption are still intact. The key concerns at this pointstems from a ballooning fiscal deficit at the consolidated level (Centre & State) with salary revisionfor Central / State Government employees threatening a cut back in discretionary spending. Inflationis likely to remain benign for the first half of FY10 on a favourable base effect but we anticipate it togo back to trend levels of 5-5.5% for the second half of FY10 as this base effect wears off.
On a valuations perspective, the markets are currently trading at a P/E ratio of around 12 timesFY 2010 earnings. This is well below the 10-year average given the extreme risk aversion prevailing inthe markets. However, the underlying growth in the economy and corporate earnings growth (15%in the long term) makes the market attractive from a longer-term view. The short term could seeenhanced volatility arising from various factors. Increase in commodity prices continues to be a riskin the medium term as the US dollar continues to struggle with the ballooning US fiscal situation.
Debt Market Outlook
Excess supply of government bonds, as a result of fiscal slippages to arrest the downward growthmomentum, has been a reality for bond markets since January 2009. However, this is now compoundedwith some fatigue in buying longer duration as economic data is showing signs of recovery,commodities are showing signs of rally and expectations of incremental monetary easing from theRBI are beginning to unwind. However, system liquidity remains surplus and bank deposits continueto grow thereby providing resistance to bond yields from rising sharply.
Given the above factors, we believe that the market would continue to provide tactical opportunitiesalthough the fundamental bias should be for lower duration. Also, any mitigation of bond supplypressure or a new downturn in the ongoing economic recovery may provide space for opportunisticlonger duration plays. On the other hand, if the recovery cycle continues uninterrupted and commodityprices remain firm, central banks may start to worry about withdrawing the current monetary stimulusby sometime early 2010; with consequent impact on bond markets.
2. BRIEF BACKGROUND OF SPONSORS, BOARD OF TRUSTEES AND ASSETMANAGEMENT COMPANY
a) Sponsor
HSBC Mutual Fund is sponsored by HSBC Securities and Capital Markets (India) Private Limited (HSCI).The Sponsor is the Settler of the Mutual Fund Trust. The Sponsor has entrusted a sum of Rs. 1,00,000(Rupees One Lakh only) to the Trustee as the initial contribution towards the corpus of the MutualFund.
HSCI is a member of the HSBC Group, one of the largest banking and financial services organisations,in the world. Headquartered in London, HSBC operates through long-established businesses in fiveregions: Europe, Asia-Pacific, Middle East, America and Africa. Through its global network of 10,000offices in 86 countries and territories, HSBC provides a comprehensive range of financial services topersonal, commercial, corporate, institutional investment and private banking clients.
HSCI offers integrated investment banking services, securities and corporate finance & advisory. HSCIis a member of The Bombay Stock Exchange Limited and National Stock Exchange (capital and derivativemarket segments) and is also a category I merchant banker and underwriter registered with Securities
Trustees' ReportFor the year ended March 31, 2009 (Contd...)

6
and Exchange Board of India.
HSCI holds 100% of the paid-up equity share capital of the AMC.
b) HSBC Mutual Fund
HSBC Mutual Fund ("the Mutual Fund" or "the Fund") has been constituted as a Trust in accordancewith the provisions of the Indian Trusts Act, 1882 (2 of 1882) vide a Trust Deed dated February 7,2002 with HSBC Securities and Capital Markets (India) Private Limited, as the Sponsor and the Boardof Individual Trustees. The Trustee has entered into an Investment Management Agreement datedFebruary 7, 2002 with HSBC Asset Management (India) Private Limited (the AMC) to function as theInvestment Manager for all the Schemes of the Fund. The Fund was registered with SEBI videregistration number MF/046/02/5 dated May 27, 2002.
The Trust has been formed for the purpose of pooling of capital from the public for collectiveinvestment in securities / any other property for the purpose of providing facilities for participationby persons as beneficiaries in such properties / investments and in the profits / income arising therefrom.
c) Board of Trustees (the Trustees)
The Board of Trustees are the exclusive owner of the Trust Fund and holds the same in trust for thebenefit of the unitholders. The Trustees have been discharging their duties and carrying out theirresponsibilities as provided in the SEBI (Mutual Funds) Regulations, 1996 and the Trust Deed. TheTrustees seeks to ensure that the Fund and the Schemes floated thereunder are managed by theAMC in accordance with the Trust Deed, the said Regulations, directions and guidelines issued bySEBI, the Stock Exchanges, the Association of Mutual Funds of India and other regulatory agencies.
d) Asset Management Company (the AMC)
HSBC Asset Management (India) Private Limited (the Investment Manager or the AMC) is a privatelimited company incorporated under the Companies Act, 1956 on December 12, 2001 having itsRegistered Office at 314, D. N. Road, Fort, Mumbai 400 001. HSBC Asset Management (India) PrivateLimited has been appointed as the Asset Management Company of the HSBC Mutual Fund by theTrustee vide Investment Management Agreement (IMA) dated February 7, 2002 and executed betweenthe Trustees and the AMC. SEBI approved the AMC to act as the Investment Manager of the Fundvide. its letter No. MFD/BC/163/2002 dated May 27, 2002.
The paid-up equity share capital of the AMC is Rs. 9 crores. HSBC Securities and Capital Markets(India) Private Limited holds 100% of the paid-up equity share capital of the AMC.
3. INVESTMENT OBJECTIVE OF THE SCHEMEThe investment objective of the Scheme has been provided above under the heading "SchemePerformance, Future Outlook and Operation of the Scheme" (refer Section 1).
4. SIGNIFICANT ACCOUNTING POLICIESThe accounting policies are in accordance with Securities and Exchange Board of India (Mutual Funds)Regulations, 1996.
5. UNCLAIMED DIVIDENDS & REDEMPTIONSSummary of number of Investors & corresponding amount
Unclaimed Dividends Unclaimed Redemptions
Scheme Amount No. of Amount No. of(Rs.) Investors (Rs.) Investors
HSBC MIP - Regular 130,680.61 184 44,426.67 2
HSBC MIP - Savings 276,049.24 250 – –
Trustees' ReportFor the year ended March 31, 2009 (Contd...)

7
6. INVESTOR SERVICESDuring the year, the number of official points of acceptance of transactions increased significantly toabout 182 locations. In addition to the offices of the transfer agency, the company has InvestorService Centres in 14 locations at its own offices - namely Mumbai, New Delhi, Kolkata, Chennai,Bangalore, Hyderabad, Pune, Ahmedabad, Indore, Chandigarh, Kochi, Coimbatore, Lucknow andVadodara. With a view to enhancing customer convenience, the Asset Management Company hasextended the facility of crediting investor bank accounts directly by way of NEFT / RTGS (for credit ofredemption and dividend proceeds). The AMC endeavours to despatch dividend proceeds within 5working days from the Record Date in all Schemes. The internal standards on redemption payoutshave been consistently met, with very few exceptions. The number of locations for the ECS AutoDebit facility for investments through Systematic Investment Plan also increased to about 74 byMarch 2009.
On the distribution front, the number of empanelled distributors increased from 7859 as on 31March, 2008 to 8632 as on 31 March, 2009. During the year, the Asset Management Companyinitiated tie-ups for online distribution of the Mutual Fund's schemes with several channel partnerstaking the total number of such tie-ups to 24 (Angel Capital & Department Market Ltd., Bajaj CapitalLimited, Bonanza Portfolio Limited, Citibank N.A., Citigroup Wealth Advisors India Private Limited,HDFC Bank Limited, Hongkong & Shanghai Banking Corporation Limited, HSBC Corporate InvestmentSolution Services, ICICI Securities Limited, India Infoline Limited, Karvy Stock Broking Limited, KotakMahindra Bank Limited, Kotak Securities Limited, Motilal Oswal Securities Limited, NJ India InvestPrivate Limited, Reliance Securities Limited, RR Investors Capital Services Private Limited, SBICAPSecurities Limited, Sharekhan Limited, SMC Global Securities Limited, Standard Chartered - STCICapital Markets Ltd., Tom Distribution Services Limited, Yes Bank Limited).
Call centre operations have been extended to cover the entire country. The Asset ManagementCompany has outsourced certain back office services including call centre services to HSBC Operationsand Processing Enterprise (India) Private Limited (HOPE).
7. STATUTORY DETAILSa) The Sponsors are not responsible or liable for any loss resulting from the operation of the Schemes
of the Fund beyond initial contribution of Rs. 1 lakh for setting up the Fund.
b) The price and redemption value of the units, and income from them, can go up as well as downwith fluctuations in the market value of its underlying investments.
c) Full / Abridged Annual Report shall be disclosed on the website at www.assetmanagement.hsbc.com/inand shall be available for inspection at the Head Office of the mutual fund. Present and prospectiveunit holder can obtain copy of the trust deed, the Full / Abridged Annual Report of the Scheme(s),the Annual Report of HSBC Asset Management (India) Private Limited and the text of the relevantScheme(s) at a price.
8. ACKNOWLEDGEMENTSThe Trustees wish to thank the Unitholders of the Schemes for their support throughout the year andalso thank the Government of India, the Securities and Exchange Board of India (SEBI), the ReserveBank of India (RBI) and the Association of Mutual Funds in India (AMFI) for the guidance provided bythem. The Trustees also appreciate the service provided by the Registrar and Transfer Agent, FundAccountant, Custodian, Bankers, Distributors and Brokers. The guidance and services provided bythe Auditors and advocates and the ebullience, sincerity and dedication of the employees of HSBCAsset Management (India) Private Limited is also appreciated.
The Trustees look forward to the continued support of everyone.
For and on behalf of the Board of Trustees of HSBC Mutual Fund
Dilip J. Thakkar
Trustee
MUMBAIJuly 6, 2009
Trustees' ReportFor the year ended March 31, 2009 (Contd...)

8
To the Board of Trustees of
HSBC MUTUAL FUND
1. We have audited the Balance Sheet of HSBC Mutual Fund - HSBC MIP ("The Scheme") as atMarch 31, 2009 and the related Revenue Account for the year ended on that date, both of whichwe have signed under reference to this report. These financial statements are the responsibilityof the Board of Trustees of HSBC Mutual Fund and the Management of HSBC Asset Management(India) Private Limited (the "Management"). Our responsibility is to express an opinion on thesefinancial statements based on our audit.
2. We have conducted our audit in accordance with auditing standards generally accepted in India.Those standards require that we plan and perform the audit to obtain reasonable assuranceabout whether the financial statements are free of material misstatement. An audit includesexamining, on a test basis, evidence supporting the amounts and disclosures in the financialstatements. Our procedures included confirmation of securities owned and unit capital balancesas at March 31, 2009 by correspondence with the custodian / others and registrar and transferagent respectively. An audit also includes assessing the accounting principles used and significantestimates made by the Management as well as evaluating the overall financial statementpresentation. We believe that our audit provides a reasonable basis for our opinion.
3. We have obtained all the information and explanations which to the best of our knowledge andbelief were necessary for the purpose of our audit. The Balance Sheet and the Revenue Accountreferred to above are in agreement with the books of account of the Scheme.
4. In our opinion and to the best of our information and according to the explanations given to us,
(i) The Balance Sheet and the Revenue Account together with the notes thereon give theinformation required by the Securities and Exchange Board of India (Mutual Funds) Regulations,1996 and amendments thereto, as applicable, and also give respectively, a true and fair viewof the state of affairs of HSBC Mutual Fund - HSBC MIP as at March 31, 2009 and its netsurplus / (deficit) for the year ended on that date.
(ii) The Balance Sheet as at March 31, 2009 and the Revenue Account for the year ended on thatdate, together with the notes thereon have been prepared in all material respects in accordancewith the accounting policies and standards specified in the Ninth Schedule of the Securitiesand Exchange Board of India (Mutual Funds) Regulations, 1996 and amendments thereto asapplicable.
(iii) The methods used to value:
(a) non-traded debt securities in accordance with the guidelines for valuation of securitiesfor mutual funds dated September 18, 2000 and amendments thereto, as applicable,issued by the Securities and Exchange Board of India and;
(b) privately placed securities in good faith
as at March 31, 2009 as determined in good faith by HSBC Asset Management (India)Private Limited under procedures approved by the Board of Trustees of HSBC MutualFund are fair and reasonable.
Partha GhoshPartnerMembership No. F / 55913
For and on behalf ofPRICE WATERHOUSEChartered Accountants
Place : MumbaiDate : July 6, 2009
Auditors' Report

9
Rs. in Lakhs
HSBC MIP - REGULAR PLAN
As at As atMarch 31, 2009 March 31, 2008
LIABILITIES1 Unit Capital 4,658.77 5,446.99
2 Reserves & Surplus2.1 Unit Premium Reserves (21.68) 21.132.2 Unrealised Appreciation Reserve 110.72 13.242.3 Other Reserves 978.05 870.89
3 Loans & Borrowings – –
4 Current Liabilities & Provisions4.1 Provision for doubtful Income / Deposits – –4.2 Other Current Liabilities & Provisions 64.31 142.05
TOTAL 5,790.17 6,494.30
ASSETS1 Investments1.1. Listed Securities:1.1.1 Equity Shares 166.02 472.321.1.2 Preference Shares – –1.1.3 Equity Linked Debentures – –1.1.4 Other Debentures & Bonds 2,905.16 –1.1.5 Securitised Debt securities – –1.2 Securities Awaited Listing:1.2.1 Equity Shares – –1.2.2 Preference Shares – –1.2.3 Equity Linked Debentures – –1.2.4 Other Debentures & Bonds – 3,123.551.2.5 Securitised Debt securities – –1.3 Unlisted Securities:1.3.1 Equity Shares – –1.3.2 Preference Shares – –1.3.3 Equity Linked Debentures – –1.3.4 Other Debentures & Bonds – 600.991.3.5 Securitised Debt securities 1,670.96 1,681.62
1.4 Government Securities 452.37 –1.5 Treasury Bills – –1.6 Commercial Paper – 299.601.7 Certificate of Deposits – –1.8 Bill Rediscounting – –1.9 Units of Domestic Mutual Fund – –1.10 Foreign Securities – –
Total Investments 5,194.51 6,178.08
2 Deposits 182.04 52.04
3 Other Current Assets3.1 Cash & Bank Balance 9.50 38.883.2 CBLO / Reverse Repo Lending 219.29 35.183.3 Others 184.83 190.12
4 Deferred Revenue Expenditure – –(to the extent not written off)
TOTAL 5,790.17 6,494.30
Notes to Accounts - Annexure I
Abridged Balance Sheet as at March 31, 2009

10
Rs. in Lakhs
HSBC MIP - SAVINGS PLAN
As at As atMarch 31, 2009 March 31, 2008
LIABILITIES1 Unit Capital 8,545.07 10,964.95
2 Reserves & Surplus2.1 Unit Premium Reserves 193.25 295.162.2 Unrealised Appreciation Reserve 256.53 0.582.3 Other Reserves 1,343.32 2,529.86
3 Loans & Borrowings – –
4 Current Liabilities & Provisions4.1 Provision for doubtful Income/Deposits – –4.2 Other Current Liabilities & Provisions 127.52 152.48
TOTAL 10,465.69 13,943.03
ASSETS1 Investments1.1. Listed Securities:1.1.1 Equity Shares 542.58 1,467.361.1.2 Preference Shares – –1.1.3 Equity Linked Debentures – –1.1.4 Other Debentures & Bonds 4,494.42 5,647.481.1.5 Securitised Debt securities – –
1.2 Securities Awaited Listing:1.2.1 Equity Shares – –1.2.2 Preference Shares – –1.2.3 Equity Linked Debentures – –1.2.4 Other Debentures & Bonds 497.82 –1.2.5 Securitised Debt securities – –
1.3 Unlisted Securities:1.3.1 Equity Shares – –1.3.2 Preference Shares – –1.3.3 Equity Linked Debentures – –1.3.4 Other Debentures & Bonds – 3,218.581.3.5 Securitised Debt securities 2,076.63 1,972.60
1.4 Government Securities 1,168.78 –1.5 Treasury Bills – –1.6 Commercial Paper – 798.941.7 Certificate of Deposits – –1.8 Bill Rediscounting – –1.9 Units of Domestic Mutual Fund – –1.10 Foreign Securities – –
Total Investments 8,780.23 13,104.96
2 Deposits 252.04 52.04
3 Other Current Assets3.1 Cash & Bank Balance 9.52 103.873.2 CBLO / Reverse Repo Lending 1,074.57 106.233.3 Others 349.33 575.93
4 Deferred Revenue Expenditure – –(to the extent not written off)
TOTAL 10,465.69 13,943.03
Notes to Accounts - Annexure I
Abridged Balance Sheet as at March 31, 2009

11
Rs. in Lakhs
HSBC MIP - REGULAR PLAN
Current PreviousYear ended Year ended
March 31, 2009 March 31, 2008
1 INCOME1.1 Dividend 6.96 2.101.2 Interest 569.57 360.051.3 Realised Gain / (Loss) on Foreign Exchange Transactions – –1.4 Realised Gains / (Losses) on Interscheme sale
of investments (7.54) (0.62)1.5 Realised Gains / (Losses) on External sale /
redemption of investments (310.48) 232.401.6 Realised Gains / (Losses) on Derivative Transactions (20.53) 9.931.7 Other Income – –
(A) 237.98 603.862 EXPENSES2.1 Management fees 64.60 63.422.2 Service tax on Management fees ** – –2.3 Transfer agents fees and expenses 5.23 3.492.4 Custodian fees 1.51 1.202.5 Trusteeship fees 0.03 0.032.6 Commission to Agents * – –2.7 Marketing & Distribution expenses 63.63 46.572.8 Audit fees 0.50 0.502.9 Other operating expenses 2.87 (15.69)
(B) 138.37 99.523 NET REALISED GAINS / (LOSSES)
FOR THE YEAR / PERIOD (A - B = C) 99.61 504.344 Change in Unrealised Depreciation
in value of investments (D) 34.90 (55.64)
5 NET GAINS / (LOSSES) FOR THEYEAR / PERIOD [E = (C - D)] 64.71 559.98
6 Change in unrealised appreciationin the value of investments (F) 97.48 (34.50)
7 NET SURPLUS / (DEFICIT) FORTHE YEAR / PERIOD (E + F = G) 162.19 525.48
7.1 Add: Balance transfer fromUnrealised Appreciation Reserve – 34.50
7.2 Less: Balance transfer to UnrealisedAppreciation Reserve 97.48 –
7.3 Add / (Less): Equalisation 167.47 104.167.4 Transfer from Reserve Fund 229.48 54.377.5 Transfer from Unit Premium Reserve – –
8 TOTAL 461.66 718.519 Dividend Appropriation9.1 Income Distributed during the year / period 108.03 190.209.2 Tax on income distributed during the year / period 16.98 29.27
10 Retained Surplus / (Deficit)carried forward to Balance Sheet 336.65 499.04
Notes to Accounts - Annexure I
* Commission to Agents is included in Marketing & Distribution Expenses.**Service Tax on Management Fees is included in Other Operating Expenses.
Abridged Revenue Account for the year ended March 31, 2009

12
Rs. in Lakhs
HSBC MIP - SAVINGS PLAN
Current PreviousYear ended Year ended
March 31, 2009 March 31, 2008
1 INCOME1.1 Dividend 23.83 5.711.2 Interest 1,042.31 583.841.3 Realised Gain / (Loss) on Foreign Exchange Transactions – –1.4 Realised Gains / (Losses) on Interscheme sale
of investments (11.03) 21.381.5 Realised Gains / (Losses) on External
sale / redemption of investments (1,076.36) 346.591.6 Realised Gains / (Losses) on Derivative Transactions (71.24) 25.671.7 Other Income – –
(A) (92.49) 983.192 EXPENSES2.1 Management fees 143.55 107.372.2 Service tax on Management fees ** – –2.3 Transfer agents fees and expenses 10.27 5.862.4 Custodian fees 3.29 2.222.5 Trusteeship fees 0.05 0.042.6 Commission to Agents * – –2.7 Marketing & Distribution expenses 108.89 106.072.8 Audit fees 0.50 0.502.9 Other operating expenses 3.82 (51.00)
(B) 270.37 171.063 NET REALISED GAINS / (LOSSES)
FOR THE YEAR / PERIOD (A - B = C) (362.86) 812.134 Change in Unrealised Depreciation
in value of investments (D) 46.67 (27.14)
5 NET GAINS / (LOSSES) FORTHE YEAR / PERIOD [E = (C - D)] (409.53) 839.27
6 Change in unrealised appreciationin the value of investments (F) 255.95 (74.47)
7 NET SURPLUS / (DEFICIT) FORTHE YEAR / PERIOD (E + F = G) (153.58) 764.80
7.1 Add: Balance transfer from UnrealisedAppreciation Reserve – 74.47
7.2 Less: Balance transfer to UnrealisedAppreciation Reserve 255.95 –
7.3 Add / (Less): Equalisation (430.86) 1,173.117.4 Transfer from Reserve Fund 560.42 158.177.5 Transfer from Unit Premium Reserve – –
8 TOTAL (279.97) 2,170.559 Dividend Appropriation9.1 Income Distributed during the year / period 301.18 396.549.2 Tax on income distributed during the year / period 44.98 61.83
10 Retained Surplus / (Deficit)carried forward to Balance Sheet (626.13) 1,712.18
Notes to Accounts - Annexure I
* Commission to Agents is included in Marketing & Distribution Expenses.**Service Tax on Management Fees is included in Other Operating Expenses.
Abridged Revenue Account for the year ended March 31, 2009

13
HSBC MIP - REGULAR PLAN
Current PreviousYear ended Year ended
March 31, 2009 March 31, 2008
1. NAV per unit (Rs.):
Open
Regular Growth Option 13.7856 12.2670
Regular Dividend Option – 10.4294
Regular Monthly Dividend Option 10.7999 10.3891
Regular Quarterly Dividend Option 10.9470 –
High
Regular Growth Option 14.4007 14.2855
Regular Dividend Option
Regular Monthly Dividend Option 10.9894 11.3866
Regular Quarterly Dividend Option 11.1518 11.5004
Low
Regular Growth Option 13.1115 12.2162
Regular Dividend Option
Regular Monthly Dividend Option 10.0428 10.3461
Regular Quarterly Dividend Option 10.1535 10.3862
End
Regular Growth Option 14.1825 13.7856
Regular Dividend Option –
Regular Monthly Dividend Option 10.7325 10.7999
Regular Quarterly Dividend Option 10.8919 10.9470
2. Closing Assets Under Management (Rs. in Lakhs)
End 5,726 6,352
Average (AAuM)1 6,671 5,109
3. Gross income as % of AAuM2 3.57% 11.82%
4. Expense Ratio:
a. Total Expense as % of AAuM (planwise)
Regular Dividend Option – –
Regular Growth Option 2.07% 1.95%
Regular Monthly Dividend Option 2.07% 1.95%
Regular Quarterly Dividend Option 2.07% 1.95%
b. Management Fee as % of AAuM (planwise)
Regular Dividend Option – –
Regular Growth Option 0.97% 1.24%
Regular Monthly Dividend Option 0.97% 1.24%
Regular Quarterly Dividend Option 0.97% 1.24%
Key Statistics for the year ended March 31, 2009

14
5. Net Income as a percentage of AAuM3 1.49% 9.87%
6. Portfolio turnover ratio4 0.21 0.44
7. Total Dividend per unit distributed during theyear / period (planwise)
Retail
Regular Dividend Option – –
Regular Monthly Dividend Option 0.3241 0.7446
Regular Quarterly Dividend Option 0.3153 0.6570
Corporate
Regular Dividend Option – –
Regular Monthly Dividend Option 0.3017 0.6930
Regular Quarterly Dividend Option 0.2935 0.6115
8. Returns:
a. Last One Year
Scheme
Regular Dividend Option N/A N/A
Regular Growth Option 2.8791 3.0223
Regular Monthly Dividend Option 2.4357 2.1523
Regular Quarterly Dividend Option 2.4554 2.2448
Benchmark
Crisil MIP Blended Index 0.1900 11.1819
b. Since Inception
Scheme
Regular Dividend Option – N/A
Regular Growth Option 7.0896 7.0360
Regular Monthly Dividend Option 6.3775 6.2706
Regular Quarterly Dividend Option 6.4209 6.3255
Benchnmark
Crisil MIP Blended Index 6.0200 7.4938
1 AAuM = Average daily net assets
2 Gross income = amount against (A) in the Revenue Account i.e. Income.
3 Net income = amount against (C) in the Revenue Account i.e. NET REALISED GAINS / (LOSSES)FOR THE YEAR / PERIOD
4 Portfolio Turnover = Lower of sales or purchase divided by the Average AuM for the year / period.
Key Statistics for the year ended March 31, 2009 (Contd...)
HSBC MIP - REGULAR PLAN
Current PreviousYear ended Year ended
March 31, 2009 March 31, 2008

15
HSBC MIP - SAVINGS PLAN
Current PreviousYear ended Year ended
March 31, 2009 March 31, 2008
1. NAV per unit (Rs.):
Open
Regular Growth Option 15.0714 13.1167
Regular Dividend Option 11.2228 10.6431
Regular Monthly Dividend Option – –
Regular Quarterly Dividend Option 11.2540 10.7482
High
Regular Growth Option 15.6254 15.9888
Regular Dividend Option – 12.2598
Regular Monthly Dividend Option 11.4078 12.1357
Regular Quarterly Dividend Option 11.5104 –
Low
Regular Growth Option 13.9333 13.0229
Regular Dividend Option – 10.6714
Regular Monthly Dividend Option 10.0953 10.5670
Regular Quarterly Dividend Option 10.0478 –
End
Regular Growth Option 15.0356 15.0714
Regular Dividend Option – 11.2228
Regular Monthly Dividend Option 10.7242 –
Regular Quarterly Dividend Option 10.7209 11.2540
2. Closing Assets Under Management (Rs. in Lakhs)
End 10,338 13,791
Average (AAuM)1 13,157 8,794
3. Gross income as % of AAuM2 -0.70% 11.18%
4. Expense Ratio:
a. Total Expense as % of AAuM (planwise)
Regular Dividend Option – –
Regular Growth Option 2.05% 1.94%
Regular Monthly Dividend Option 2.05% 1.95%
Regular Quarterly Dividend Option 2.05% 1.95%
b. Management Fee as % of AAuM (planwise)
Regular Dividend Option – –
Regular Growth Option 1.09% 1.22%
Regular Monthly Dividend Option 1.09% 1.22%
Regular Quarterly Dividend Option 1.09% 1.22%
Key Statistics for the year ended March 31, 2009
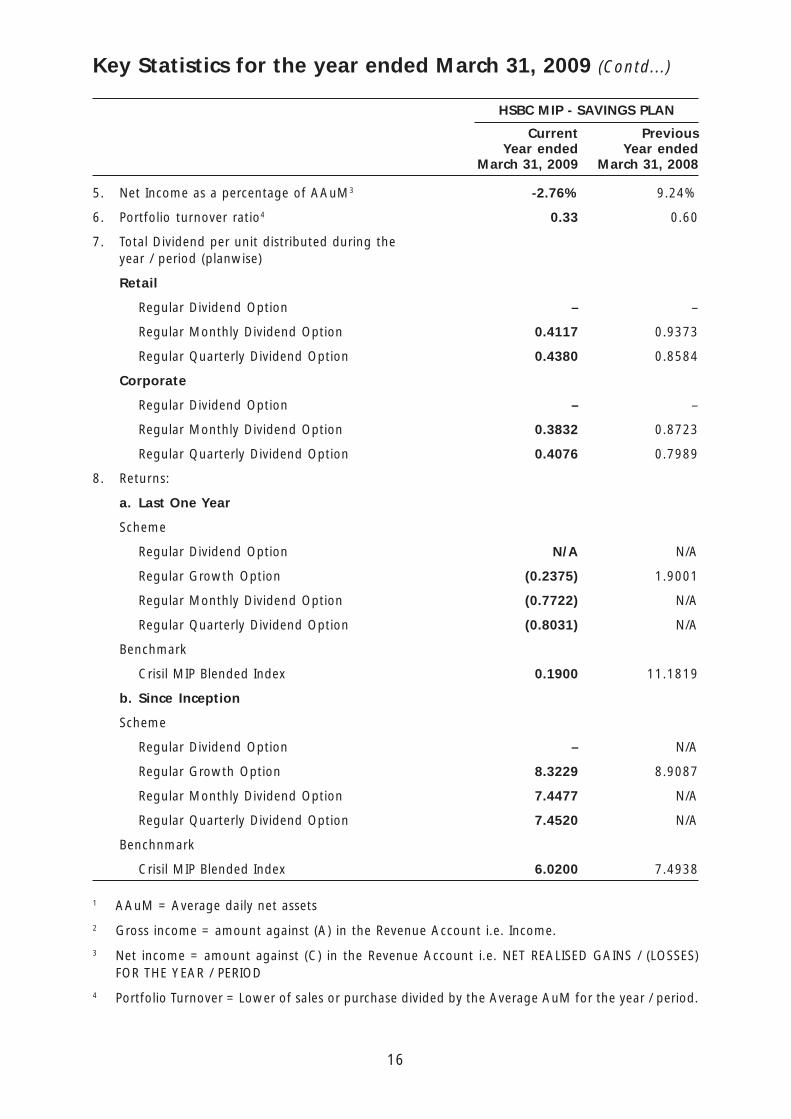
16
Key Statistics for the year ended March 31, 2009 (Contd...)
HSBC MIP - SAVINGS PLAN
Current PreviousYear ended Year ended
March 31, 2009 March 31, 2008
5. Net Income as a percentage of AAuM3 -2.76% 9.24%
6. Portfolio turnover ratio4 0.33 0.60
7. Total Dividend per unit distributed during theyear / period (planwise)
Retail
Regular Dividend Option – –
Regular Monthly Dividend Option 0.4117 0.9373
Regular Quarterly Dividend Option 0.4380 0.8584
Corporate
Regular Dividend Option – –
Regular Monthly Dividend Option 0.3832 0.8723
Regular Quarterly Dividend Option 0.4076 0.7989
8. Returns:
a. Last One Year
Scheme
Regular Dividend Option N/A N/A
Regular Growth Option (0.2375) 1.9001
Regular Monthly Dividend Option (0.7722) N/A
Regular Quarterly Dividend Option (0.8031) N/A
Benchmark
Crisil MIP Blended Index 0.1900 11.1819
b. Since Inception
Scheme
Regular Dividend Option – N/A
Regular Growth Option 8.3229 8.9087
Regular Monthly Dividend Option 7.4477 N/A
Regular Quarterly Dividend Option 7.4520 N/A
Benchnmark
Crisil MIP Blended Index 6.0200 7.4938
1 AAuM = Average daily net assets
2 Gross income = amount against (A) in the Revenue Account i.e. Income.
3 Net income = amount against (C) in the Revenue Account i.e. NET REALISED GAINS / (LOSSES)FOR THE YEAR / PERIOD
4 Portfolio Turnover = Lower of sales or purchase divided by the Average AuM for the year / period.

17
Notes to Accounts - Annexure ITo the Abridged Balance Sheet and Revenue Account for the year ended March 31, 2009
HSBC MIP - REGULAR / SAVINGS PLAN
1 Investments:
1.1 It is confirmed that investments of the schemes are registered in the name of the Trustees forthe benefit of the scheme’s unitholders.
1.2 Open Positions of derivatives in MIP Regular Plan as at March 31, 2009 is 2,412,200 isRs. 0.42% to net assets. Open Positions of derivatives in MIP Regular Plan as at March 31,2008 is NIL.
Open Positions of derivatives in MIP Savings Plan as at March 31, 2009 is Rs. 6,935,075 andis 0.67% to net assets. Open Positions of derivatives in MIP Savings Plan as at March 31,2008 is Rs. 8,044,910 and is 1.57% to net assets.
1.3 Investments in Associates and Group Companies(Rupees)
Amount Amount
Issuer Instrument MIP - MIP - Aggregate MIP - MIP - AggregateType Regular Savings Investments Regular Savings Investments
Plan Plan by all schemes Plan Plan by all schemes
2009 2008
The Hongkong & Fixed – – 43,000,000 5,000,000 5,000,000 1,654,000,000Shanghai Banking DepositsCorporation Ltd.
1.4 Open positions of Securities Borrowed and / or Lent by the MIP Regular Plan as of financialyears ended 2009 and 2008 are NIL.
Open positions of Securities Borrowed and / or Lent by the MIP Savings Plan as of financialyears ended 2009 and 2008 are NIL.
1.5 The NPAs for MIP Regular Plan as on March 31, 2009 and March 31, 2008 are NIL.
The NPAs for MIP Savings Plan as on March 31, 2009 and March 31, 2008 are NIL.
1.6 Aggregate Unrealised Gain / Loss as at the end of the Financial years 2008 and 2009 andtheir percentage to net assets are as under :
HSBC MIP - REGULAR PLAN
Security Amount Percentage to Amount Percentage toCategory (Rs.) Net Assets (Rs.) Net Assets
March 31, 2009 March 31, 2008
Equity Shares
– Appreciation 930,850 0.1626% 4,506,995 0.7095%
– Depreciation 2,615,775 0.4568% 3,244,311 0.5107%
NCDs and Bonds Listed / Awaitin Listing
– Appreciation 12,106,129 2.11429% 150,202 0.0236%
– Depreciation 2,573,566 0.44946% 1,565,730 0.2465%
NCDs and Bonds Privately Placed
– Appreciation – – 61,162 0.0096%
– Depreciation – – – 0.0000%

18
HSBC MIP - REGULAR PLAN
Security Amount Percentage to Amount Percentage toCategory (Rs.) Net Assets (Rs.) Net Assets
March 31, 2009 March 31, 2008
Notes to Accounts - Annexure I (Contd...)To the Abridged Balance Sheet and Revenue Account for the year ended March 31, 2009
Asset Backed Securities
– Appreciation 1,988,647 0.3473% 79,793 0.0126%
– Depreciation 449,713 0.0785% 426,309 0.0671%
Government of India Securities
– Appreciation – – – –
– Depreciation 3,575,402 0.6244% – –
Equity Futures
– Appreciation 779 0.0001% – 0.0000%
– Depreciation – – 8,157 0.0013%
HSBC MIP - SAVINGS PLAN
Security Amount Percentage to Amount Percentage toCategory (Rs.) Net Assets (Rs.) Net Assets
March 31, 2009 March 31, 2008
Equity Shares
– Appreciation 2,465,476 0.2385% 10,924,860 0.7922%
– Depreciation 9,075,936 0.8779% 14,011,198 1.0160%
NCDs and Bonds Listed / Awaiting Listing
– Appreciation 24,617,261 2.3812% 350,472 0.0254%
– Depreciation 419,690 0.0406% 4,597,149 0.3334%
NCDs and Bonds Privately Placed
– Appreciation – – 203,500 0.0148%
– Depreciation 486,698 0.0471% 145,687 0.0106%
Asset Backed Securities
– Appreciation 2,586,070 0.2501% 104,705 0.0076%
– Depreciation 1,131,139 0.1094% 581,357 0.0422%
Government of India Securities
– Appreciation – – – –
– Depreciation 5,394,921 0.5218% – –
Equity Futures
– Appreciation – – – –
– Depreciation 1,043 0.0001% 16,313 0.0012%

19
1.7 The aggregate value of investment purchased and sold for MIP Regular Plan and MIP SavingsPlan is as under :
Aggregate Purchases
Plan March 31, 2009 March 31, 2008
Rupees Percentage of Rupees Percentage ofAverage Daily Average Daily
Net Assets Net Assets
MIP - Regular Plan 1,264,636,217 189.56% 1,191,206,753 233.17%
MIP - Savings Plan 3,297,754,997 250.65% 2,536,083,471 288.39%
Aggregate Sales
Plan March 31, 2009 March 31, 2008
Rupees Percentage of Rupees Percentage ofAverage Daily Average Daily
Net Assets Net Assets
MIP Regular Plan 1,360,346,341 203.91% 1,059,761,754 207.44%
MIP Savings Plan 3,671,926,696 279.09% 1,871,265,642 212.79%
1.8 Non-Traded securities in the portfolio:
Aggregate Value of Equity, Debt & Money Market Instruments and percentage to net assetsis as under :
HSBC MIP - REGULAR PLAN
Security Amount Percentage to Amount Percentage toCategory (Rs.) Net Assets (Rs.) Net Assets
2009 2008
Equities – – 525,584 0.0827%
Debt Instruments 439,709,739 76.7936% 540,616,310 85.1062%
Money Market Instruments – – 29,960,090 4.7165%
Total 439,709,739 76.7936% 571,101,984 89.9054%
HSBC MIP - SAVINGS PLAN
Security Amount Percentage to Amount Percentage toCategory (Rs.) Net Assets (Rs.) Net Assets
2009 2008
Equities – – 1,626,705 0.1180%
Debt Instruments 670,139,321 64.8129% 1,083,866,266 78.5948%
Money Market Instruments – 0.0000% 79,893,574 5.7934%
Total 670,139,321 64.8129% 1,165,386,545 84.5062%
Notes to Accounts - Annexure I (Contd...)To the Abridged Balance Sheet and Revenue Account for the year ended March 31, 2009

20
Notes to Accounts - Annexure I (Contd...)To the Abridged Balance Sheet and Revenue Account for the year ended March 31, 2009
2 Disclosure under Regulation 25(8) of the Securities and Exchange Board of India (Mutual Funds)Regulations, 1996 as amended for the year ended March 31, 2009 is as under:
Year 2008-2009
During the year, HSBC Securities and Capital Markets (India) Private Limited, the Sponsor, waspaid brokerage amounting to Rs. 25,017 and Rs. 68,515 on purchase and sale of investments forthe Regular Plan and Savings Plan respectively. The Hongkong and Shanghai Banking CorporationLimited, an associate entity of HSBC Asset Management (India) Private Limited was paid Collection/Bank charges amounting to Rs. 169,266 and Rs. 170,403 for the Regular Plan and Savings Planrespectively, brokerage amounting to Rs. 559,017, Rs. 1,141,499 for procuring unit subscriptionsfor the Regular Plan and Savings Plan respectively and clearing member charges on derivativetransactions amounting to Rs. 33,705 and Rs. 95,235 for the Regular Plan and Savings Planrespectively. The brokerage paid was at rates similar to those offered to other distributors. Further,The Hongkong and Shanghai Banking Corporation Limited, an associate of the Sponsor, is on thepanel of bankers with whom HSBC Mutual Fund places money on fixed deposits and enters intoreverse repo transactions from time to time at competitive rates.
Year 2007-2008
HSBC Securities and Capital Markets (India) Private Limited, the Sponsor, was paid brokerageamounting to Rs. 16,000 and Rs. 49,000 on purchase and sale of investments for the RegularPlan and Savings Plan respectively. The Hongkong and Shanghai Banking Corporation Limited, anassociate entity of HSBC Asset Management (India) Private Limited was paid Collection / Bankcharges amounting to Rs. 339,405 and Rs. 344,193 for the Regular Plan and Savings Planrespectively, brokerage amounting to Rs. 1,191,572, Rs. 1,535,390 for procuring unit subscriptionsfor the Regular Plan and Savings Plan respectively and clearing member charges on derivativetransactions amounting to Rs. 4,171 and Rs. 12,880 for the Regular Plan and Savings Planrespectively. The brokerage paid was at rates similar to those offered to other distributors.
3 None of the Investors held more than 25% of the total net assets of the schemes at the yearsended March 31, 2009 and March 31, 2008.
4 Unit Capital movement during the years ended March 31, 2009 and March 31, 2008.
MIP - REGULAR PLAN
2008-2009
Description Opening Units Subscription Redemption Closing Units Face Value
Growth 14,987,074.518 11,250,934.216 5,894,961.816 20,343,046.918 203,430,469.18
Monthly Dividend 24,470,779.653 10,911,102.092 24,202,489.358 11,179,392.387 111,793,923.87
Quarterly Dividend 15,012,077.635 6,136,651.026 6,083,452.244 15,065,276.417 150,652,764.17
2007-2008
Description Opening Units Subscription Redemption Closing Units Face Value
Growth 14,079,033.718 11,193,851.516 10,285,810.716 14,987,074.518 149,870,745.18
Monthly Dividend 8,874,297.567 24,508,156.452 8,911,674.366 24,470,779.653 244,707,796.53
Quarterly Dividend 20,091,385.421 8,722,305.676 13,801,613.462 15,012,077.635 150,120,776.35

2121
MIP - SAVINGS PLAN
2008-2009
Description Opening Units Subscription Redemption Closing Units Face Value
Growth 38,287,542.486 17,735,574.480 28,759,773.921 27,263,343.045 272,633,430.45
Monthly Dividend 35,289,980.846 9,705,703.652 22,659,816.956 22,335,867.542 223,358,675.42
Quarterly Dividend 36,071,998.339 14,430,684.202 14,651,144.910 35,851,537.631 358,515,376.31
2007-2008
Description Opening Units Subscription Redemption Closing Units Face Value
Growth 22,958,570.389 39,017,077.635 23,688,105.538 38,287,542.486 382,875,424.86
Monthly Dividend 13,879,041.121 35,703,329.090 14,292,389.365 35,289,980.846 352,899,808.46
Quarterly Dividend 18,003,040.120 30,066,768.544 11,997,810.325 36,071,998.339 360,719,983.39
Notes to Accounts - Annexure I (Contd...)To the Abridged Balance Sheet and Revenue Account for the year ended March 31, 2009
5 Prior year amounts have been re-grouped and reclassified, wherever applicable, to confirm tocurrent year’s presentation.
6 No contingent liabilities for MIP Regular and MIP Savings funds for the years ended March 31,2009 and March 31, 2008.
7 Expenses other than Management Fees are inclusive of Service Tax where applicable.
8. The Annual Accounts of the Schemes prepared in accordance with the accounting policies andstandards specified in the Ninth Schedule of The Securities and Exchange Board of India (MutualFunds) Regulations, 1996 has been approved by the Board of Directors of HSBC Asset Management(India) Private Limited and The Board of Trustees of HSBC Mutual Fund at their meeting held onJuly 06, 2009. The audit report attached herewith refers to the said annual accounts. The aforesaidabridged accounts are an extract of the Annual Accounts and are prepared in accordance withSEBI Circular No. IMD/Cir 8/132968/2008 dated July 24, 2008.

22
DISCLAIMERS
The content of this report has been prepared by HSBC Asset Management (India) Private Limited(HSBC) for information purposes only and should not be construed as an offer or solicitation ofan offer for purchase of any of the funds of HSBC Mutual Fund. The information is for generalinformation only and does not have regard to specific investment objectives, financial situationand the particular needs of any specific person who may receive this information. Investmentsin mutual funds inherently involve risks and investors should read the relevant documents /information for details and risk factors and consult their legal, tax and financial advisors beforeinvesting. Investors should understand that statements made herein regarding future prospectsmay not be realised. Neither this document nor the units of HSBC Mutual Fund have beenregistered in any jurisdiction. The distribution of this document in certain jurisdictions may berestricted or totally prohibited and accordingly, persons who come into possession of thisdocument are required to inform themselves about, and to observe, any such restrictions.
Investors may obtain Statement of Additional Information, Combined Scheme InformationDocument and Common Key Information Memorandums along with application forms fromthe office of HSBC Mutual Fund, 314, D. N. Road, Fort, Mumbai 400 001. Tel: 022-6666 8819.
Statutory Details:HSBC Mutual Fund has been set up as a trust by HSBC Securities and Capital Markets (India)Private Limited (liability restricted to the corpus of Rs. 1 lakh). The Sponsor/associates of theSponsor/Asset Management Company (AMC) are not responsible or liable for any loss or shortfallresulting from the operation of the Schemes. The Trustees of HSBC Mutual Fund have appointedHSBC Asset Management (India) Private Limited as the Investment Manager.
Risk Factors:All investments in mutual funds and securities are subject to market risks and the Net AssetValue (NAV) of the Scheme(s) may go up or down depending on the factors and forces affectingthe securities markets. There can be no assurance that the objectives of the Scheme(s) will beachieved. Past performance of the Sponsor, AMC, Mutual Fund or any associates of the Sponsor/AMC does not indicate the future performance of the Scheme(s) of the Mutual Fund. HSBCMIP (HMIP) is the names of the Scheme and does not in any manner indicate the quality of theScheme or its future prospects or returns.
Terms of Issue:Units of the Scheme(s) are being offered at NAV based prices, subject to the prevailing loads.The AMC calculates and publishes NAVs and offers for sale, redemption and switch outs, unitsof the Scheme(s) on all Business Days, at the Applicable NAV for all Schemes (at least once aweek, i.e., every Wednesday and daily during the period of redemption in case of HSCF).HUOF, HSCF & HFTS will not be open for ongoing subscriptions/ switch ins. HUOF & HSCFwould be available for sale on an ongoing basis (after a period of 3 years from the date ofallotment). Conversion of HUOF & HSCF to an open-ended scheme will be done only after thebalance unamortized amount has been fully recovered from the Scheme. Units can be redeemed/switched out on every Business Day at NAV based prices, subject to prevailing exit loads. Incase of HSCF, units can be redeemed / switched out on a monthly basis on the stipulated datei.e. last 3 business days of every month at NAV based prices, subject to provisions of exit load,if any and recovery of balance proportionate unamortized NFO expenses.
Load Structure (includes SIP/STP):
HMIP-R :Entry - Nil.Exit - 1% - if redeemed/switched out within 1 year from date of investment.
HMIP-S :
Entry - Nil.
Exit - 1.5% - if redeemed/switched out within 1 year from date of investment.Consult the nearest investor service centre for details.
The entry/exit load set forth above is subject to change at the discretion of the AMC and suchchanges shall be implemented prospectively.

23
Mutual Fund investments are subject to market risks. Please read the Statement of AdditionalInformation and Scheme Information Document carefully before investing.
Value Research Online DisclaimerValue Research Fund Ratings: Value Research Fund Ratings are a composite measure of historical risk-adjusted returns. In the case of equity funds this rating is based on the average monthly returns forthe last 3-year and 5-year period. These ratings do not take into account any entry or exit load.
Value Research Fund Ratings are subject to change every month. Current Fund Ratings are as onMarch 31, 2009. 142 open-ended Equity: Diversified Funds were rated. The Rating is based on primarydata provided by respective funds; Value Research does not guarantee the accuracy. Ranking Entity:Value Research Online.
ICRA Online Ranking MethodologyHSBC Monthly Income - Savings Plan has been ranked as a Five Star Fund in the category of 'OpenEnded Marginal Equity' schemes for its 3 year performance till December 31, 2008.
The rank is an outcome of an objective and comparative analysis against various parameters, including:risk adjusted return, fund size, company concentration, portfolio turnover and liquidity. The rankingmethodology did not take into account entry and exit loads imposed by the Fund. There were 27schemes considered in 'Open Ended Marginal Equity' category for the ranking exercise. The rank isneither a certificate of statutory compliance nor any guarantee on the future performance of HSBCMonthly Income - Savings Plan. Ranking Source & Publisher: ICRA Online Limited.
CRISIL Ranking MethodologyThe selection for the awards is based on the CRISIL FundServices' Composite Performance Ranking(CRISIL~CPR) methodology.
The CRISIL Composite Performance Ranking (CRISIL~CPR) is a quarterly ranking of mutual fund schemesbased on two year performance (excepting for the liquid and short term debt categories where a oneyear performance horizon is considered). The methodology is based on global best practices,customized to account for Indian market nuances. Over time, the rankings have become the industrystandard with good acceptance among Investors, Fund Intermediaries, Asset Management Companies,etc. The performance criteria covers not only risk adjusted returns, which are historical, but also theportfolio constitution to make the analysis forward looking.
CRISIL DisclaimerThe overall ranking is assigned to the scheme based on its weighted average score on a range ofparameters: Superior Return Score, Concentration, Liquidity, Asset Quality - Measures the creditquality of the portfolio, Average Maturity and Asset Size. HSBC MIP - Savings was the only schemethat won the CNBC TV18 - CRISIL Mutual Fund of the Year Award in the Category - Monthly IncomePlans - Aggressive. In total 13 schemes were eligible for the award universe. Schemes present in allfour quarterly CRISIL CPRs were considered for the award. The award is based on consistency of thescheme's performance in the four quarterly CRISIL CPR rankings released during the calendar year2008. The individual CRISIL CPR parameter scores averaged for the four quarters were further multipliedby the parameter weights as per the CRISIL CPR methodology to arrive at the final scores. A detailedmethodology of the CRISIL CPR is available at www.crisil.com. Past performance is no guarantee offuture results. Rankings and Award Source: CRISIL Fund Services, CRISIL Ltd. HSBC Monthly Income -Savings Plan has been ranked as a Five Star Fund in the category of 'Open Ended Marginal Equity'schemes for its 3 year performance till December 31, 2008. The rank is an outcome of an objectiveand comparative analysis against various parameters, including: risk adjusted return, fund size,company concentration, portfolio turnover and liquidity. The ranking methodology did not take intoaccount entry and exit loads imposed by the Fund. There were 27 schemes considered in 'OpenEnded Marginal Equity' category for the ranking exercise. The rank is neither a certificate of statutorycompliance nor any guarantee on the future performance of HSBC Monthly Income - Savings Plan.Ranking Source & Publisher: ICRA Online Limited.

This page is intentionally left blank.

Issued by HSBC Asset Management (India) Private Limited
HSBC Global Asset Management
HSBC Gilt FundAn open-ended gilt Scheme
Abridged Annual Report 2008 - 2009

1
Dear Investor,
We thank you for investing with HSBC Mutual Fund. We are pleased to inform you that HSBCMutual Fund has won prestigious awards* this year at various forums in India.
The awards* won by our schemes in India are
� HSBC Equity Fund has been included in the 5 star rated fund category (“Top rated mutualfunds” by Value Research online) in March, 2009.
� Five-stars indicate that a fund is in the top 10 per cent of its category in terms ofhistorical risk-adjusted returns.
� ICRA Mutual Fund Awards 2009
� HSBC MIP - Savings has been ranked a 5-Star Fund by ICRA Online indicating performanceamong the top 10% in the category of 'Open Ended Marginal Equity' for 3 yearperformance ending 31 December, 2008.
� CNBC TV18 - CRISIL Mutual Fund Awards 2008
� HSBC MIP - Savings was awarded the CNBC TV18 - CRISIL Mutual Fund of the YearAward for the year 2008 in the Monthly Income Plans - Aggressive Category.
(Past performance is no guarantee of future results. * Please refer to Ranking methodologyand disclaimer mentioned at the end of the Abridged Annual Report for the year endedMarch 31, 2009).
At the global level, the HSBC Group won several awards at Euromoney's Awards for Excellence2009. The top awards that HSBC won were the Best Global Bank and the Best Global DebtHouse. It was also honoured as the Best Debt House in 8 locations including Asia and the Bestat Risk Management in Asia. (Past performance may or may not be sustained in the future andis no guarantee of future results). We continue to be one of the leading players in emergingmarkets and remain committed to our asset management business in India.
HSBC Asset Management (India) Private Limited including the mutual fund business as well asthe PMS business (including EPFO money deployed till date) manages assets of about Rs. 26280Crores as at 30 June, 2009. The core to our winning strategy is our endeavour to deliverconsistent performance over the medium to long term for our investors in a risk controlledenvironment and aim for consistent wealth creation under varying market conditions. Throughour product range, we aim to be true to our reputation in India of being a provider ofinternational quality investment products and services.
We remain committed to our philosophy of aiming for consistent wealth creation and serviceexcellence and look forward to your continued investments in HSBC Mutual Fund.
Yours sincerely,
VikramaadityaChief Executive OfficerHSBC Asset Management (India) Private Limited

2
SPONSORHSBC Securities and Capital Markets (India) Private LimitedRegd. Office: 52/60, Mahatma Gandhi Road, Fort, Mumbai 400 001.
TRUSTEEBoard of TrusteesOffice: 314, D. N. Road, Fort, Mumbai 400 001.
ASSET MANAGEMENT COMPANYHSBC Asset Management (India) Private LimitedCorp. & Regd. Office: 314, D. N. Road, Fort, Mumbai 400 001.
CUSTODIANJP Morgan Chase BankCorp. & Regd. Office: Mafatlal Centre, 9th Floor, Nariman Point, Mumbai - 400 021.
AUDITORS TO THE SCHEMEPrice WaterhouseChartered Accountants252, Veer Savarkar Marg, Shivaji Park, Dadar (West), Mumbai - 400 028.
LEGAL ADVISORSBharucha & Partners4th Floor, Cecil Court, Mahakavi Bhushan Marg, Colaba, Mumbai - 400 039.
REGISTRAR & TRANSFER AGENTSComputer Age Management Services (P) Ltd. (CAMS)Rayala Towers, Tower I, III Floor, 158 Anna Salai, Chennai - 600 002.
BOARD OF TRUSTEESMr. N. P. Gidwani - Chairman
Dr. Rudolf ApenbrinkMr. Nasser MunjeeMr. Manu TandonMr. Mehli MistriMr. Dilip J. Thakkar
BOARD OF DIRECTORSMs. Naina Lal Kidwai - Chairman
Mr. Ayaz EbrahimMr. S. P. Mustafa**Mr. Vithal PalekarMs. Kishori J. Udeshi*Mr. Vikramaaditya - Chief Executive Officer***
* Ms. Kishori Udeshi has been appointed as a Director with effect from 14 January 2009 andMr. Jagjit Lal Pasricha has resigned as a Director with effect from 19 January 2009.
** Mr. S. P. Mustafa has been appointed as a Director with effect from 2 September 2008 andMr. Nawshir Khurody has resigned as a Director with effect from 1 September 2008.
*** Mr. Vikramaaditya has been appointed as the Chief Executive Officer with effect from 16 July 2008and Mr. Sanjay Prakash has resigned as the Chief Executive Officer with effect from 16 July 2008.

3
Trustees' ReportFor the year ended March 31, 2009
The Trustees present the seventh report and the audited financial statements of the Schemes ofHSBC Mutual Fund (the "Fund"), for the year ended March 31, 2009.
1. SCHEME PERFORMANCE, FUTURE OUTLOOK AND OPERATIONS OF THE SCHEME
a) Operations and Performance of the Scheme
HSBC Gilt Fund (HGF) - an open-ended Gilt Scheme
HGF seeks to generate reasonable returns through investments in Government Securities (G-Secs) ofvarious maturities. The AMC's view of interest rate trends and the nature of the plans will be reflectedin the maturities of securities in which the Plans are invested.
The net assets of HSBC Gilt Fund amounted to Rs. 17.96 crores as at March 31, 2009 as compared toRs. 0.98 crores as at March 31, 2008. 76.47% of the net assets were invested in government securities,26.56% of the net assets were invested in reverse repos and (3.03)% were invested in net currentassets as at March 31, 2009.
HGF underperformed the benchmark as low assets under management for an extended period hadconstrained ability to actively manage the fund.
Date of Inception : 5 December, 2003 Compounded Annualized Returns (%)
Schemes (P2P) 1 Year 3 Years 5 Years Since Inception
HSBC Gilt Fund - Growth -7.67 0.30 1.29 1.41
I Sec Composite Index 12.83 9.16 6.26 6.38
Past performance may or may not be sustained in future. 'Since inception' returns are calculated onRs. 10 invested at inception. Calculations are based on Growth NAVs.
b) Market Overview & Outlook
MARKET OVERVIEW(as furnished by HSBC Asset Management (India) Private Limited)
Equity Market Overview
The financial year ended 31 March, 2009 was a highly eventful one with long standing institutionsdisappearing from the landscape in the whirlwind of the sub-prime crisis and derivative losses. Theyear can be split into three phases - the first from April 2008 till when Lehman Brothers filed forbankruptcy, which saw a blowout commodity rally (crude oil nudged close to USD 144/barrel) andthe sub-prime situation turning progressively worse. The United States (US) Government / FederalReserve bailed out major institutions thought to be critical to the functioning of the financial system.The second phase from September 2008 till January 2009 saw a spate of bankruptcies most notablyLehman Brothers which saw the appearance of an acute level of risk aversion pushing the creditmarkets into a gridlock. This phase also coincided with the fiscal / monetary stimuli by variousgovernments to take the credit crisis head on. Globally, markets stabilized around their October2008 lows and a semblance of normality started re-appearing in financial markets in this period. Thethird phase from February 2009 onwards witnessed a sharp rally as a weakening US Dollar spewedmoney into emerging markets. The sensex fell by 38% during the financial year.
For the financial year 2009, the popular indices viz. BSE Sensex and CNX Nifty were down 37.94%and 36.19% respectively. The BSE Midcap (54.01)% and the broader indices like BSE 200 (40.98)%and BSE 500 (42.77)% also reflected the correction across the markets. Within sectoral indices thebest performing indices were BSE FMCG (11.08)% and BSE Oil and Gas (29.58)% while the worstperforming indices were BSE Realty (79.37)%, due to the high leverage on the balance sheets, BSEMetals (58.67)%, due to slowdown in global growth and BSE Consumer Durables (58.14)% and BSECapital goods (53.84%).

4
Trustees' ReportFor the year ended March 31, 2009 (Contd...)
In a year that saw sell-off across emerging markets, FIIs were net sellers of the tune USD 10.4 billionin the Indian equity markets while Domestic Institutional Investors (Insurance & Mutual Funds) werebuyers to the tune of USD 13.1 billion. Further, FIIs were net sellers in the derivative markets ashedge funds, and p-notes unwound positions in a rapidly deleveraging world. Thus, sentimentremained negative as few US based investment banks filed for bankruptcy in the midst of the liquidityand credit crisis and safety took precedence over growth.
Debt Market Overview
Two contrarian forces one inflationary and the other deflationary had been in play since 2007: Onthe one hand strong demand from emerging economies were leading commodities higher and fuellinginflation, while on the other the housing led credit crisis in the US was starting to exert a deflationaryforce. The first force was dominant till early July 2008 leading commodity prices to fresh peaks andinflation to multi year highs. Since then, however, the second force took hold with the result thatcommodity prices fell sharply from the top, growth and inflation numbers toppled worldwide, andcentral bankers shifted focus to achieving financial stability and protecting growth.
The financial crisis hit the domestic markets towards September 2008, leading to acute disruption inmoney markets. The Reserve Bank of India (RBI) acted proactively cutting the cash reserve ratio (CRR)by an unprecedented 400 bps between September 2008 and January 2009. Similarly, the reverserepo rate had been cut by 275 bps since October 2008 while the repo rate had been cut by 425 bpsover the same period.
Bond market yields fell in line with the unprecedented monetary easing up till the first week ofJanuary 2009. Thereon, supply pressures on bond markets rose as a result of government fiscalslippages aimed at stimulating the economy. The RBI, in line with similar measures elsewhere in theworld, started buying government securities to lessen the impact on yields from the rise in governmentborrowing. Although this helped market sentiment, it could not prevent a general rise in yieldstowards fiscal close. As a result, the 10 year benchmark sovereign yield closed the fiscal at 7% froma low of sub 5% hit in early January 2009. Money market rates stabilized after the initial mayhem ofSeptember 2008 and October 2008 and liquidity came back to interbank markets.
MARKET OUTLOOK(as furnished by HSBC Asset Management (India) Private Limited)
Equity Market Outlook
Financial Year (FY) 2008-09 was a year marked by a strong correlation between the Indian marketand global markets with key indices ending deeply in the red on the back of the subprime crisis andderivative led losses across major financial stocks in the United States (US). Even in India, forex lossesran across corporate India though at a smaller magnitude. FY 10 has begun on a better note onaccount of various fundamental and technical factors.
GDP for FY 09 grew at 6.7% against FY 08 levels of 9%. Agriculture posted a below trend growthrate of 1.6% and industry grew by 3.9% (versus 8.1% in FY 08) with services registering a close to9.7% growth. IIP grew by a mere 2.6%. Although order books of engineering / capital goods wererunning at record high levels, there was possibility of delays in execution as funding sources for thedevelopers (equity, ECB, private equity, FCCB) had dried up. A sharp increase in subsidy on accountof oil, fertilizers and food led to a cut back in discretionary spending. Inflation rose on the back of asurging crude and higher prices of agricultural commodities to top at 12.91% for the week ending 2August, 2008. A slow down in the growth rates in the US / EU and other markets finally tamed thesurge in crude. As growth rates stumbled, governments / monetary authorities the world over triggeredfiscal stimuli / monetary easing to escape recessionary forces. This was followed in India as wellwhich started monetary easing / fiscal stimuli to keep growth rates buoyant.
On the positive side, India continues to do better in relative terms and we expect GDP growth of6-6.5% for FY10. The broad themes that are driving domestic growth viz. capital expenditure,infrastructure building and domestic consumption are still intact. The key concerns at this point

5
Trustees' ReportFor the year ended March 31, 2009 (Contd...)
stems from a ballooning fiscal deficit at the consolidated level (Centre & State) with salary revisionfor Central / State Government employees threatening a cut back in discretionary spending. Inflationis likely to remain benign for the first half of FY10 on a favourable base effect but we anticipate it togo back to trend levels of 5-5.5% for the second half of FY10 as this base effect wears off.
On a valuations perspective, the markets are currently trading at a P/E ratio of around 12 timesFY 2010 earnings. This is well below the 10-year average given the extreme risk aversion prevailing inthe markets. However, the underlying growth in the economy and corporate earnings growth (15%in the long term) makes the market attractive from a longer-term view. The short term could seeenhanced volatility arising from various factors. Increase in commodity prices continues to be a riskin the medium term as the US dollar continues to struggle with the ballooning US fiscal situation.
Debt Market Outlook
Excess supply of government bonds, as a result of fiscal slippages to arrest the downward growthmomentum, has been a reality for bond markets since January 2009. However, this is now compoundedwith some fatigue in buying longer duration as economic data is showing signs of recovery,commodities are showing signs of rally and expectations of incremental monetary easing from theRBI are beginning to unwind. However, system liquidity remains surplus and bank deposits continueto grow thereby providing resistance to bond yields from rising sharply.
Given the above factors, we believe that the market would continue to provide tactical opportunitiesalthough the fundamental bias should be for lower duration. Also, any mitigation of bond supplypressure or a new downturn in the ongoing economic recovery may provide space for opportunisticlonger duration plays. On the other hand, if the recovery cycle continues uninterrupted and commodityprices remain firm, central banks may start to worry about withdrawing the current monetary stimulusby sometime early 2010; with consequent impact on bond markets.
2. BRIEF BACKGROUND OF SPONSORS, BOARD OF TRUSTEES AND ASSETMANAGEMENT COMPANY
a) Sponsor
HSBC Mutual Fund is sponsored by HSBC Securities and Capital Markets (India) Private Limited (HSCI).The Sponsor is the Settler of the Mutual Fund Trust. The Sponsor has entrusted a sum of Rs. 1,00,000(Rupees One Lakh only) to the Trustee as the initial contribution towards the corpus of the MutualFund.
HSCI is a member of the HSBC Group, one of the largest banking and financial services organisations,in the world. Headquartered in London, HSBC operates through long-established businesses in fiveregions: Europe, Asia-Pacific, Middle East, America and Africa. Through its global network of 10,000offices in 86 countries and territories, HSBC provides a comprehensive range of financial services topersonal, commercial, corporate, institutional investment and private banking clients.
HSCI offers integrated investment banking services, securities and corporate finance & advisory. HSCIis a member of The Bombay Stock Exchange Limited and National Stock Exchange (capital and derivativemarket segments) and is also a category I merchant banker and underwriter registered with Securitiesand Exchange Board of India.
HSCI holds 100% of the paid-up equity share capital of the AMC.
b) HSBC Mutual Fund
HSBC Mutual Fund ("the Mutual Fund" or "the Fund") has been constituted as a Trust in accordancewith the provisions of the Indian Trusts Act, 1882 (2 of 1882) vide a Trust Deed dated February 7,2002 with HSBC Securities and Capital Markets (India) Private Limited, as the Sponsor and the Boardof Individual Trustees. The Trustee has entered into an Investment Management Agreement datedFebruary 7, 2002 with HSBC Asset Management (India) Private Limited (the AMC) to function as theInvestment Manager for all the Schemes of the Fund. The Fund was registered with SEBI videregistration number MF/046/02/5 dated May 27, 2002.

6
Trustees' ReportFor the year ended March 31, 2009 (Contd...)
The Trust has been formed for the purpose of pooling of capital from the public for collectiveinvestment in securities / any other property for the purpose of providing facilities for participationby persons as beneficiaries in such properties / investments and in the profits / income arising therefrom.
c) Board of Trustees (the Trustees)
The Board of Trustees are the exclusive owner of the Trust Fund and holds the same in trust for thebenefit of the unitholders. The Trustees have been discharging their duties and carrying out theirresponsibilities as provided in the SEBI (Mutual Funds) Regulations, 1996 and the Trust Deed. TheTrustees seeks to ensure that the Fund and the Schemes floated thereunder are managed by theAMC in accordance with the Trust Deed, the said Regulations, directions and guidelines issued bySEBI, the Stock Exchanges, the Association of Mutual Funds of India and other regulatory agencies.
d) Asset Management Company (the AMC)
HSBC Asset Management (India) Private Limited (the Investment Manager or the AMC) is a privatelimited company incorporated under the Companies Act, 1956 on December 12, 2001 having itsRegistered Office at 314, D. N. Road, Fort, Mumbai 400 001. HSBC Asset Management (India) PrivateLimited has been appointed as the Asset Management Company of the HSBC Mutual Fund by theTrustee vide Investment Management Agreement (IMA) dated February 7, 2002 and executed betweenthe Trustees and the AMC. SEBI approved the AMC to act as the Investment Manager of the Fundvide. its letter No. MFD/BC/163/2002 dated May 27, 2002.
The paid-up equity share capital of the AMC is Rs. 9 crores. HSBC Securities and Capital Markets(India) Private Limited holds 100% of the paid-up equity share capital of the AMC.
3. INVESTMENT OBJECTIVE OF THE SCHEMEThe investment objective of the Scheme has been provided above under the heading "SchemePerformance, Future Outlook and Operation of the Scheme" (refer Section 1).
4. SIGNIFICANT ACCOUNTING POLICIESThe accounting policies are in accordance with Securities and Exchange Board of India (Mutual Funds)Regulations, 1996.
5. UNCLAIMED DIVIDENDS & REDEMPTIONSNil.
6. INVESTOR SERVICESDuring the year, the number of official points of acceptance of transactions increased significantly toabout 182 locations. In addition to the offices of the transfer agency, the company has InvestorService Centres in 14 locations at its own offices - namely Mumbai, New Delhi, Kolkata, Chennai,Bangalore, Hyderabad, Pune, Ahmedabad, Indore, Chandigarh, Kochi, Coimbatore, Lucknow andVadodara. With a view to enhancing customer convenience, the Asset Management Company hasextended the facility of crediting investor bank accounts directly by way of NEFT / RTGS (for credit ofredemption and dividend proceeds). The AMC endeavours to despatch dividend proceeds within 5working days from the Record Date in all Schemes. The internal standards on redemption payoutshave been consistently met, with very few exceptions. The number of locations for the ECS AutoDebit facility for investments through Systematic Investment Plan also increased to about 74 byMarch 2009.
On the distribution front, the number of empanelled distributors increased from 7859 as on 31March, 2008 to 8632 as on 31 March, 2009. During the year, the Asset Management Companyinitiated tie-ups for online distribution of the Mutual Fund's schemes with several channel partnerstaking the total number of such tie-ups to 24 (Angel Capital & Department Market Ltd., Bajaj CapitalLimited, Bonanza Portfolio Limited, Citibank N.A., Citigroup Wealth Advisors India Private Limited,
7
Trustees' ReportFor the year ended March 31, 2009 (Contd...)
HDFC Bank Limited, Hongkong & Shanghai Banking Corporation Limited, HSBC Corporate InvestmentSolution Services, ICICI Securities Limited, India Infoline Limited, Karvy Stock Broking Limited, KotakMahindra Bank Limited, Kotak Securities Limited, Motilal Oswal Securities Limited, NJ India InvestPrivate Limited, Reliance Securities Limited, RR Investors Capital Services Private Limited, SBICAPSecurities Limited, Sharekhan Limited, SMC Global Securities Limited, Standard Chartered - STCICapital Markets Ltd., Tom Distribution Services Limited, Yes Bank Limited).
Call centre operations have been extended to cover the entire country. The Asset ManagementCompany has outsourced certain back office services including call centre services to HSBC Operationsand Processing Enterprise (India) Private Limited (HOPE).
7. STATUTORY DETAILSa) The Sponsors are not responsible or liable for any loss resulting from the operation of the Schemes
of the Fund beyond initial contribution of Rs. 1 lakh for setting up the Fund.
b) The price and redemption value of the units, and income from them, can go up as well as downwith fluctuations in the market value of its underlying investments.
c) Full / Abridged Annual Report shall be disclosed on the website at www.assetmanagement.hsbc.com/inand shall be available for inspection at the Head Office of the mutual fund. Present and prospectiveunit holder can obtain copy of the trust deed, the Full / Abridged Annual Report of the Scheme(s),the Annual Report of HSBC Asset Management (India) Private Limited and the text of the relevantScheme(s) at a price.
8. ACKNOWLEDGEMENTSThe Trustees wish to thank the Unitholders of the Schemes for their support throughout the year andalso thank the Government of India, the Securities and Exchange Board of India (SEBI), the ReserveBank of India (RBI) and the Association of Mutual Funds in India (AMFI) for the guidance provided bythem. The Trustees also appreciate the service provided by the Registrar and Transfer Agent, FundAccountant, Custodian, Bankers, Distributors and Brokers. The guidance and services provided bythe Auditors and advocates and the ebullience, sincerity and dedication of the employees of HSBCAsset Management (India) Private Limited is also appreciated.
The Trustees look forward to the continued support of everyone.
For and on behalf of the Board of Trustees of HSBC Mutual Fund
Dilip J. Thakkar
Trustee
MUMBAIJuly 6, 2009

8
To the Board of Trustees of
HSBC MUTUAL FUND
1. We have audited the Balance Sheet of HSBC Mutual Fund - HSBC Gilt Fund (Formerly HSBC GiltFund - Short Term Plan) ("The Scheme") as at March 31, 2009, the related Revenue Account forthe year ended on that date annexed thereto and the Cash Flow Statement for the year ended onthat date which we have signed under reference to this report. These financial statements are theresponsibility of the Board of Trustees of HSBC Mutual Fund and the Management of HSBC AssetManagement (India) Private Limited (the "Management"). Our responsibility is to express anopinion on these financial statements based on our audit.
2. We have conducted our audit in accordance with auditing standards generally accepted in India.Those standards require that we plan and perform the audit to obtain reasonable assuranceabout whether the financial statements are free of material misstatement. An audit includesexamining, on a test basis, evidence supporting the amounts and disclosures in the financialstatements. Our procedures included confirmation of securities owned and unit capital balancesas at March 31, 2009 by correspondence with the custodian/others and registrar and transferagent respectively. An audit also includes assessing the accounting principles used and significantestimates made by the Management as well as evaluating the overall financial statementpresentation. We believe that our audit provides a reasonable basis for our opinion.
3. We have obtained all the information and explanations which to the best of our knowledge andbelief were necessary for the purpose of our audit. The Balance Sheet, the Revenue Account andthe Cash Flow Statement referred to above are in agreement with the books of account of theScheme.
4. In our opinion and to the best of our information and according to the explanations given to us,
(i) The Balance Sheet, the Revenue Account and the Cash Flow Statement together with thenotes thereon give the information required by the Securities and Exchange Board of India(Mutual Funds) Regulations, 1996 and amendments thereto, as applicable, and also giverespectively, a true and fair view of the state of affairs of HSBC Mutual Fund - HSBC Gilt Fundas at March 31, 2009, its net deficit and its cash flows for the year on that date.
(ii) The Balance Sheet as at March 31, 2009 and the Revenue Account for the year ended on thatdate, together with the notes thereon have been prepared in all material respects in accordancewith the accounting policies and standards specified in the Ninth Schedule of the Securitiesand Exchange Board of India (Mutual Funds) Regulations, 1996 and amendments thereto asapplicable.
Partha GhoshPartnerMembership No. F / 55913
For and on behalf ofPRICE WATERHOUSEChartered Accountants
Place : MumbaiDate: July 22, 2009
Auditors' Report

9
Rs. in Lakhs
HSBC GILT FUND
As at As atMarch 31, 2009 March 31, 2008
LIABILITIES1 Unit Capital 1,952.68 87.492 Reserves & Surplus2.1 Unit Premium Reserves 22.24 3.332.2 Unrealised Appreciation Reserve – –2.3 Other Reserves (179.28) 7.103 Loans & Borrowings – –4 Current Liabilities & Provisions4.1 Provision for doubtful Income / Deposits – –4.2 Other Current Liabilities & Provisions 15.88 0.41
TOTAL 1,811.52 98.33
ASSETS1 Investments1.1. Listed Securities:1.1.1 Equity Shares – –1.1.2 Preference Shares – –1.1.3 Equity Linked Debentures – –1.1.4 Other Debentures & Bonds – –1.1.5 Securitised Debt securities – –1.2 Securities Awaited Listing:1.2.1 Equity Shares – –1.2.2 Preference Shares – –1.2.3 Equity Linked Debentures – –1.2.4 Other Debentures & Bonds – –1.2.5 Securitised Debt securities – –1.3 Unlisted Securities:1.3.1 Equity Shares – –1.3.2 Preference Shares – –1.3.3 Equity Linked Debentures – –1.3.4 Other Debentures & Bonds – –1.3.5 Securitised Debt securities – –1.4 Government Securities 1,269.30 –1.5 Treasury Bills – –1.6 Commercial Paper – –1.7 Certificate of Deposits – –1.8 Bill Rediscounting – –1.9 Units of Domestic Mutual Fund – –1.10 Foreign Securities – –
Total Investments 1,269.30 –
2 Deposits – –3 Other Current Assets3.1 Cash & Bank Balance 2.30 6.583.2 CBLO / Reverse Repo Lending 476.92 91.733.3 Others 63.00 0.024 Deferred Revenue Expenditure – –
(to the extent not written off)
TOTAL 1,811.52 98.33
Note: Name of HSBC Gilt Fund Short Term Plan changed to HSBC Gilt FundNotes to Accounts - Annexure I
Abridged Balance Sheet as at March 31, 2009

10
Rs. in Lakhs
HSBC GILT FUND
Current PreviousYear ended Year ended
March 31, 2009 March 31, 2008
1 INCOME1.1 Dividend – –1.2 Interest 458.99 4.301.3 Realised Gain / (Loss) on Foreign Exchange Transactions – –1.4 Realised Gains / (Losses) on Interscheme sale of
investments – –1.5 Realised Gains / (Losses) on External sale / redemption
of investments (580.67) (0.03)1.6 Realised Gains / (Losses) on Derivative Transactions – –1.7 Other Income – –
(A) (121.68) 4.27
2 EXPENSES2.1 Management fees 22.83 0.482.2 Service tax on Management fees ** – –2.3 Transfer agents fees and expenses 6.07 0.062.4 Custodian fees 0.57 0.012.5 Trusteeship fees 0.03 0.002.6 Commission to Agents * – –2.7 Marketing & Distribution expenses 24.85 0.222.8 Audit fees 0.05 0.052.9 Other operating expenses 0.55 0.04
(B) 54.95 0.86
3 NET REALISED GAINS / (LOSSES)FOR THE YEAR / PERIOD (A - B = C) (176.63) 3.41
4 Change in Unrealised Depreciationin value of investments (D) 48.48 –
5 NET GAINS / (LOSSES)FOR THE YEAR / PERIOD [E = (C-D)] (225.11) 3.41
6 Change in unrealised appreciationin the value of investments (F) – –
7 NET SURPLUS / (DEFICIT)FOR THE YEAR / PERIOD (E + F = G) (225.11) 3.41
7.1 Add: Balance transfer fromUnrealised Appreciation Reserve – –
7.2 Less: Balance transfer to UnrealisedAppreciation Reserve – –
7.3 Add / (Less): Equalisation 354.28 (5.65)7.4 Transfer from Reserve Fund 0.02 0.047.5 Transfer from Unit Premium Reserve – –
8 TOTAL 129.19 (2.20)9 Dividend Appropriation9.1 Income Distributed during the year / period 267.69 1.199.2 Tax on income distributed during the year / period 47.85 0.1710 Retained Surplus / (Deficit)
carried forward to Balance Sheet (186.35) (3.56)
Notes to Accounts - Annexure I* Commission to Agents is included in Marketing & Distribution Expenses.** Service Tax on Management Fees is included in Other Operating Expenses.
Abridged Revenue Account for the year ended March 31, 2009

11
HSBC GILT FUND
Current PreviousYear ended Year ended
March 31, 2009 March 31, 2008
1. NAV per unit (Rs.):
Open
Regular Growth Option 11.6677 11.2006
Monthly Dividend Option 10.7428 10.7353
Weekly Dividend Option – –
High
Regular Growth Option 12.2999 11.6677
Monthly Dividend Option 10.8465 10.7833
Weekly Dividend Option 10.1128 –
Low
Regular Growth Option 10.6929 11.2128
Monthly Dividend Option 9.4294 10.7262
Weekly Dividend Option 8.7753 –
End
Regular Growth Option 10.7725 11.6677
Monthly Dividend Option 9.4995 10.7428
Weekly Dividend Option 8.8405 –
2. Closing Assets Under Management (Rs. in Lakhs)
End 1,796 98
Average (AAuM)1 7,314 86
3. Gross income as % of AAuM2 -1.66% 4.96%
4. Expense Ratio:
a. Total Expense as % of AAuM (planwise)
Regular Growth Option 0.75% 1.00%
Monthly Dividend Option 0.75% 1.00%
Weekly Dividend Option 0.75% –
b. Management Fee as % of AAuM (planwise)
Regular Growth Option 0.31% 0.43%
Monthly Dividend Option 0.31% 0.43%
Weekly Dividend Option 0.31% –
5. Net Income as a percentage of AAuM3 -2.41% 3.96%
6. Portfolio turnover ratio4 – –
Key Statistics for the year ended March 31, 2009

12
Key Statistics for the year ended March 31, 2009 (Contd...)
HSBC GILT FUND
Current PreviousYear ended Year ended
March 31, 2009 March 31, 2008
7. Total Dividend per unit distributed during the year /period (planwise)
Retail
Monthly Dividend Option 0.4071 0.3781
Weekly Dividend Option 0.1046
Corporate
Monthly Dividend Option 0.1278 –
Weekly Dividend Option 0.0974
8. Returns:
a. Last One Year
Scheme
Monthly Dividend Option (8.1709) 4.5067
Regular Growth Option (7.6725) 5.1322
Weekly Dividend Option – –
Benchmark
I-Sec Composite Index 12.8300 8.9610
b. Since Inception
Scheme
Monthly Dividend Option 1.1110 3.4899
Regular Growth Option 1.4077 3.7645
Weekly Dividend Option (22.6382) –
Benchnmark
I-Sec Composite Index 6.3800 5.8100
1 AAuM = Average daily net assets
2 Gross income = amount against (A) in the Revenue Account i.e. Income.
3 Net income = amount against (C) in the Revenue Account i.e. NET REALISED GAINS / (LOSSES)FOR THE YEAR / PERIOD
4 Portfolio Turnover = Lower of sales or purchase divided by the Average AuM for the year / period.

13
Notes to Accounts - Annexure ITo the Abridged Balance Sheet and Revenue Account for the year ended March 31, 2009
HSBC GILT FUND
1 Investments:
1.1. It is confirmed that investments of the schemes are registered in the name of the Trustees forthe benefit of the scheme’s unitholders.
1.2. Open Positions of derivatives as of March 31, 2009 is NIL. Open Positions of derivatives as ofMarch 31, 2008 end is NIL.
1.3. There were no investments made in Associates and Group Companies by the scheme for theyears ended March 31, 2009 and March 31, 2008.
1.4. Open positions of Securities Borrowed and / or Lent by the scheme as of the years endedMarch 31, 2009 and March 31, 2008 are NIL.
1.5. NPAs as at years ended March 31, 2009 and March 31, 2008 are NIL.
1.6. Aggregate Unrealised Gain / Loss as at the end of the Financial year ended and theirpercentages to net assets are as under:
Security Amount Percentage to Amount Percentage toCategory (Rs.) Net Assets (Rs.) Net Assets
2009 2008
Government of India Securities
– Appreciation – – – –
– Depreciation 4,848,166 2.7000 – –
1.7 The aggregate value of investments securities purchased (excluding accretion of discount ofRs. NIL) and sold during the financial year 2008-2009 is Rs. 1,184,011,556 andRs. 994,165,715 respectively being 161.74% and 135.80% of the average daily net assets.
The aggregate value of investments securities purchased (excluding accretion of discount ofRs. NIL) and sold during the financial year 2007-2008 is Rs. NIL and Rs. NIL respectively beingNIL and NIL of the average daily net assets.
1.8. Non-Traded securities in the portfolios as at March 31, 2009 and March 31, 2008 are NIL.
2 Disclosure Under Regulation 25(8) of the Securities and Exchange Board of India (Mutual Funds)Regulations, 1996 as amended are as under:
Year - 2008-2009
During the year, The Hongkong and Shanghai Banking Corporation Limited, an associate entityof HSBC Asset Management (India) Private Limited was paid collection / bank charges amountingto Rs. 23 and brokerage amounting to Rs. 131,578 for procuring unit subscriptions. The brokeragepaid was at rates similar to those offered to other distributors. Further, The Hongkong and ShanghaiBanking Corporation Limited, an associate of the Sponsor, is on the panel of bankers with whomHSBC Mutual Fund places money on fixed deposits and enters into reverse repo transactionsfrom time to time at competitive rates.
Year - 2007-2008
During the year, The Hongkong and Shanghai Banking Corporation Limited, an associate entityof HSBC Asset Management (India) Private Limited was paid collection / bank charges amountingto Rs. 23 and brokerage amounting to Rs. 1,641 for procuring Unit subscriptions. The brokeragepaid was at rates similar to those offered to other distributors. Further, The Hongkong and ShanghaiBanking Corporation Limited, an associate of the Sponsor, is on the panel of bankers with whomHSBC Mutual Fund places money on fixed deposits and enters into reverse repo transactionsfrom time-to-time at competitive rates.

14
Notes to Accounts - Annexure I (Contd...)To the Abridged Balance Sheet and Revenue Account for the year ended March 31, 2009
Further, The Hongkong and Shanghai Banking Corporation Limited, an associate of the Sponsor,is on the panel of bankers with whom HSBC Mutual Fund places money on fixed deposits andenters into reverse repo transactions from time to time at competitive rates.
3 Large Holdings in the Scheme (i.e. in excess of 25% of the net assets).
Name of No. of % Holding No. of % HoldingScheme holders holders
2009 2008
HSBC Gilt Fund 1 31.12 1 25.36
4 Unit Capital movement during the year ended March 31, 2009 and March 31, 2008:
2008-2009
Description Opening Units Subscription Redemption Closing Units Face Value
Regular Growth Option 425,297.259 30,587,968.620 28,458,728.518 2,554,537.361 25,545,373.61
Monthly Dividend Option 449,571.839 133,376,429.531 130,788,604.267 3,037,397.103 30,373,971.03
Weekly Dividend Option – 455,468,300.800 441,533,430.082 13,934,870.718 139,348,707.18
2007-2008
Description Opening Units Subscription Redemption Closing Units Face Value
Regular Growth Option 885,581.249 729,657.626 1,189,941.616 425,297.259 4,252,972.59
Monthly Dividend Option 39,815.723 791,815.674 382,059.558 449,571.839 4,495,718.39
5 Previous year’s figures have been re-grouped / re-arranged where appropriate.
6 No contingent liabilities for the year ended March 31, 2009 and March 31, 2008.
7 Expenses other than Management Fees are Inclusive of Service Tax where applicable.
8 The Annual Accounts of the Schemes prepared in accordance with the accounting policies andstandards specified in the Ninth Schedule of The Securities and Exchange Board of India (MutualFunds) Regulations, 1996 has been approved by the Board of Directors of HSBC Asset Management(India) Private Limited and The Board of Trustees of HSBC Mutual Fund at their meeting held onJuly 22, 2009. The audit report attached herewith refers to the said annual accounts. The aforesaidabridged accounts are an extract of the Annual Accounts and are prepared in accordance withSEBI Circular No. IMD/Cir 8/132968/2008 dated July 24, 2008.

15
DISCLAIMERSThe content of this report has been prepared by HSBC Asset Management (India) Private Limited(HSBC) for information purposes only and should not be construed as an offer or solicitation of anoffer for purchase of any of the funds of HSBC Mutual Fund. The information is for general informationonly and does not have regard to specific investment objectives, financial situation and the particularneeds of any specific person who may receive this information. Investments in mutual funds inherentlyinvolve risks and investors should read the relevant documents / information for details and riskfactors and consult their legal, tax and financial advisors before investing. Investors should understandthat statements made herein regarding future prospects may not be realised. Neither this documentnor the units of HSBC Mutual Fund have been registered in any jurisdiction. The distribution of thisdocument in certain jurisdictions may be restricted or totally prohibited and accordingly, personswho come into possession of this document are required to inform themselves about, and to observe,any such restrictions.
Investors may obtain Statement of Additional Information, Combined Scheme Information Documentand Common Key Information Memorandums along with application forms from the office of HSBCMutual Fund, 314, D. N. Road, Fort, Mumbai 400 001. Tel: 022-6666 8819.
Statutory Details:HSBC Mutual Fund has been set up as a trust by HSBC Securities and Capital Markets (India) PrivateLimited (liability restricted to the corpus of Rs. 1 lakh). The Sponsor / associates of the Sponsor/AssetManagement Company (AMC) are not responsible or liable for any loss or shortfall resulting from theoperation of the Schemes. The Trustees of HSBC Mutual Fund have appointed HSBC Asset Management(India) Private Limited as the Investment Manager.
Risk Factors:All investments in mutual funds and securities are subject to market risks and the Net Asset Value(NAV) of the Scheme(s) may go up or down depending on the factors and forces affecting the securitiesmarkets. There can be no assurance that the objectives of the Scheme(s) will be achieved. Pastperformance of the Sponsor, AMC, Mutual Fund or any associates of the Sponsor/AMC does notindicate the future performance of the Scheme(s) of the Mutual Fund. HSBC Gilt Fund (HGF) is thenames of the Scheme and does not in any manner indicate the quality of the Scheme or its futureprospects or returns.
Terms of Issue:Units of the Scheme(s) are being offered at NAV based prices, subject to the prevailing loads. TheAMC calculates and publishes NAVs and offers for sale, redemption and switch outs, units of theScheme(s) on all Business Days, at the Applicable NAV for all Schemes (at least once a week, i.e.,every Wednesday and daily during the period of redemption in case of HSCF). HUOF, HSCF & HFTSwill not be open for ongoing subscriptions / switch ins. HUOF & HSCF would be available for sale onan ongoing basis (after a period of 3 years from the date of allotment). Conversion of HUOF & HSCFto an open-ended scheme will be done only after the balance unamortized amount has been fullyrecovered from the Scheme. Units can be redeemed / switched out on every Business Day at NAVbased prices, subject to prevailing exit loads. In case of HSCF, units can be redeemed / switched outon a monthly basis on the stipulated date i.e. last 3 business days of every month at NAV basedprices, subject to provisions of exit load, if any and recovery of balance proportionate unamortizedNFO expenses.
Load Structure (includes SIP/STP):Entry - Nil.
Exit - 0.5%, if redeemed / switched out within 6 months from the date of investment.
Consult the nearest investor service centre for details.
The entry/exit load set forth above is subject to change at the discretion of the AMC and suchchanges shall be implemented prospectively.
Mutual Fund investments are subject to market risks. Please read the Statement of AdditionalInformation and Scheme Information Document carefully before investing.

16
Value Research Online DisclaimerValue Research Fund Ratings: Value Research Fund Ratings are a composite measure of historical risk-adjusted returns. In the case of equity funds this rating is based on the average monthly returns forthe last 3-year and 5-year period. These ratings do not take into account any entry or exit load.
Value Research Fund Ratings are subject to change every month. Current Fund Ratings are as onMarch 31, 2009. 142 open-ended Equity: Diversified Funds were rated. The Rating is based on primarydata provided by respective funds; Value Research does not guarantee the accuracy. Ranking Entity:Value Research Online.
ICRA Online Ranking MethodologyHSBC Monthly Income - Savings Plan has been ranked as a Five Star Fund in the category of 'OpenEnded Marginal Equity' schemes for its 3 year performance till December 31, 2008.
The rank is an outcome of an objective and comparative analysis against various parameters, including:risk adjusted return, fund size, company concentration, portfolio turnover and liquidity. The rankingmethodology did not take into account entry and exit loads imposed by the Fund. There were 27schemes considered in 'Open Ended Marginal Equity' category for the ranking exercise. The rank isneither a certificate of statutory compliance nor any guarantee on the future performance of HSBCMonthly Income - Savings Plan. Ranking Source & Publisher: ICRA Online Limited.
CRISIL Ranking MethodologyThe selection for the awards is based on the CRISIL FundServices' Composite Performance Ranking(CRISIL~CPR) methodology.
The CRISIL Composite Performance Ranking (CRISIL~CPR) is a quarterly ranking of mutual fund schemesbased on two year performance (excepting for the liquid and short term debt categories where a oneyear performance horizon is considered). The methodology is based on global best practices,customized to account for Indian market nuances. Over time, the rankings have become the industrystandard with good acceptance among Investors, Fund Intermediaries, Asset Management Companies,etc. The performance criteria covers not only risk adjusted returns, which are historical, but also theportfolio constitution to make the analysis forward looking.
CRISIL DisclaimerThe overall ranking is assigned to the scheme based on its weighted average score on a range ofparameters: Superior Return Score, Concentration, Liquidity, Asset Quality - Measures the creditquality of the portfolio, Average Maturity and Asset Size. HSBC MIP - Savings was the only schemethat won the CNBC TV18 - CRISIL Mutual Fund of the Year Award in the Category - Monthly IncomePlans - Aggressive. In total 13 schemes were eligible for the award universe. Schemes present in allfour quarterly CRISIL CPRs were considered for the award. The award is based on consistency of thescheme's performance in the four quarterly CRISIL CPR rankings released during the calendar year2008. The individual CRISIL CPR parameter scores averaged for the four quarters were further multipliedby the parameter weights as per the CRISIL CPR methodology to arrive at the final scores. A detailedmethodology of the CRISIL CPR is available at www.crisil.com. Past performance is no guarantee offuture results. Rankings and Award Source: CRISIL Fund Services, CRISIL Ltd. HSBC Monthly Income -Savings Plan has been ranked as a Five Star Fund in the category of 'Open Ended Marginal Equity'schemes for its 3 year performance till December 31, 2008. The rank is an outcome of an objectiveand comparative analysis against various parameters, including: risk adjusted return, fund size,company concentration, portfolio turnover and liquidity. The ranking methodology did not take intoaccount entry and exit loads imposed by the Fund. There were 27 schemes considered in 'OpenEnded Marginal Equity' category for the ranking exercise. The rank is neither a certificate of statutorycompliance nor any guarantee on the future performance of HSBC Monthly Income - Savings Plan.Ranking Source & Publisher: ICRA Online Limited.

Issued by HSBC Asset Management (India) Private Limited
HSBC Global Asset Management
HSBC Income FundAn open-ended income Scheme
Abridged Annual Report 2008 - 2009
1
Dear Investor,
We thank you for investing with HSBC Mutual Fund. We are pleased to inform you that HSBCMutual Fund has won prestigious awards* this year at various forums in India.
The awards* won by our schemes in India are
� HSBC Equity Fund has been included in the 5 star rated fund category (“Top rated mutualfunds” by Value Research online) in March, 2009.
� Five-stars indicate that a fund is in the top 10 per cent of its category in terms ofhistorical risk-adjusted returns.
� ICRA Mutual Fund Awards 2009
� HSBC MIP - Savings has been ranked a 5-Star Fund by ICRA Online indicating performanceamong the top 10% in the category of 'Open Ended Marginal Equity' for 3 yearperformance ending 31 December, 2008.
� CNBC TV18 - CRISIL Mutual Fund Awards 2008
� HSBC MIP - Savings was awarded the CNBC TV18 - CRISIL Mutual Fund of the YearAward for the year 2008 in the Monthly Income Plans - Aggressive Category.
(Past performance is no guarantee of future results. * Please refer to Ranking methodologyand disclaimer mentioned at the end of the Abridged Annual Report for the year endedMarch 31, 2009).
At the global level, the HSBC Group won several awards at Euromoney's Awards for Excellence2009. The top awards that HSBC won were the Best Global Bank and the Best Global DebtHouse. It was also honoured as the Best Debt House in 8 locations including Asia and the Bestat Risk Management in Asia. (Past performance may or may not be sustained in the future andis no guarantee of future results). We continue to be one of the leading players in emergingmarkets and remain committed to our asset management business in India.
HSBC Asset Management (India) Private Limited including the mutual fund business as well asthe PMS business (including EPFO money deployed till date) manages assets of about Rs. 26280Crores as at 30 June, 2009. The core to our winning strategy is our endeavour to deliverconsistent performance over the medium to long term for our investors in a risk controlledenvironment and aim for consistent wealth creation under varying market conditions. Throughour product range, we aim to be true to our reputation in India of being a provider ofinternational quality investment products and services.
We remain committed to our philosophy of aiming for consistent wealth creation and serviceexcellence and look forward to your continued investments in HSBC Mutual Fund.
Yours sincerely,
VikramaadityaChief Executive OfficerHSBC Asset Management (India) Private Limited

2
SPONSORHSBC Securities and Capital Markets (India) Private LimitedRegd. Office: 52/60, Mahatma Gandhi Road, Fort, Mumbai 400 001.
TRUSTEEBoard of TrusteesOffice: 314, D. N. Road, Fort, Mumbai 400 001.
ASSET MANAGEMENT COMPANYHSBC Asset Management (India) Private LimitedCorp. & Regd. Office: 314, D. N. Road, Fort, Mumbai 400 001.
CUSTODIANJP Morgan Chase BankCorp. & Regd. Office: Mafatlal Centre, 9th Floor, Nariman Point, Mumbai - 400 021.
AUDITORS TO THE SCHEMEPrice WaterhouseChartered Accountants252, Veer Savarkar Marg, Shivaji Park, Dadar (West), Mumbai - 400 028.
LEGAL ADVISORSBharucha & Partners4th Floor, Cecil Court, Mahakavi Bhushan Marg, Colaba, Mumbai - 400 039.
REGISTRAR & TRANSFER AGENTSComputer Age Management Services (P) Ltd. (CAMS)Rayala Towers, Tower I, III Floor, 158 Anna Salai, Chennai - 600 002.
BOARD OF TRUSTEESMr. N. P. Gidwani - Chairman
Dr. Rudolf ApenbrinkMr. Nasser MunjeeMr. Manu TandonMr. Mehli MistriMr. Dilip J. Thakkar
BOARD OF DIRECTORSMs. Naina Lal Kidwai - Chairman
Mr. Ayaz EbrahimMr. S. P. Mustafa**Mr. Vithal PalekarMs. Kishori J. Udeshi*Mr. Vikramaaditya - Chief Executive Officer***
* Ms. Kishori Udeshi has been appointed as a Director with effect from 14 January 2009 andMr. Jagjit Lal Pasricha has resigned as a Director with effect from 19 January 2009.
** Mr. S. P. Mustafa has been appointed as a Director with effect from 2 September 2008 andMr. Nawshir Khurody has resigned as a Director with effect from 1 September 2008
*** Mr. Vikramaaditya has been appointed as the Chief Executive Officer with effect from 16 July 2008and Mr. Sanjay Prakash has resigned as the Chief Executive Officer with effect from 16 July 2008.

3
Trustees' ReportFor the year ended March 31, 2009
The Trustees present the seventh report and the audited financial statements of the Schemes ofHSBC Mutual Fund (the "Fund"), for the year ended March 31, 2009.
1. SCHEME PERFORMANCE, FUTURE OUTLOOK AND OPERATIONS OF THE SCHEME
a) Operations and Performance of the Scheme
HSBC Income Fund (HIF) - an open-ended Income Scheme
HIF, launched in December 2002, seeks to generate reasonable income for the investor by investingin bonds, debentures, short-term instruments like commercial papers, repos, etc. The Scheme hastwo Plans - the Investment Plan and the Short Term Plan.
The investment objective of HIF is to generate reasonable income through a diversified portfolio offixed income securities. The AMC's view of interest rate trends and the nature of the Plans will bereflected in the type and maturities of securities in which the Short Term and Investment Plans areinvested.
The net assets of HSBC Income Fund - Investment Plan (HIF - IP) amounted to Rs. 114.90 crores as atMarch 31, 2009 as compared to Rs. 35.98 crores as at March 31, 2008. 93.52% in debt and moneymarket instruments, 3.01% of the net assets were invested in reverse repos / CBLO and 3.47% in netcurrent assets as at March 31, 2009.
The net assets of HSBC Income Fund - Short Term Plan (HIF - STP) amounted to Rs. 151.55 crores asat March 31, 2009 as compared to Rs. 12.07 crores as at March 31, 2008. Some 95.26% in debt andmoney market instruments, 1.08% of the net assets were invested in reverse repos and 3.66% in netcurrent assets as at March 31, 2009.
HIF-IP has outperformed the benchmark through relatively active management of duration.
HIF - IP
Date of Inception : 10 December, 2002 Compounded Annualized Returns (%)
Schemes (P2P) 1 Year 3 Years 5 Years Since Inception
HSBC Income Fund - IP - Regular - Growth 9.05 7.93 5.66 6.46
CRISIL Composite Bond Fund Index 7.23 6.38 4.50 5.22
Past performance may or may not be sustained in future. 'Since inception' returns are calculated onRs. 10 invested at inception. Calculations are based on Growth NAVs.
HIF-STP has marginally underperformed the benchmark as low assets under management for anextended period had constrained ability to actively manage the fund.
HIF - STP
Date of Inception : 10 December, 2002 Compounded Annualized Returns (%)
Schemes (P2P) 1 Year 2 Years 5 Years Since Inception
HSBC Income Fund - STP - Regular - Growth 9.45 8.01 6.61 6.49
CRISIL Short-Term Bond Fund Index 9.67 8.05 6.18 6.00
Past performance may or may not be sustained in future. 'Since inception' returns are calculated onRs. 10 invested at inception. Calculations are based on Growth NAVs.
b) Market Overview & Outlook
MARKET OVERVIEW(as furnished by HSBC Asset Management (India) Private Limited)
Equity Market Overview
The financial year ended 31 March, 2009 was a highly eventful one with long standing institutionsdisappearing from the landscape in the whirlwind of the sub-prime crisis and derivative losses. The

4
year can be split into three phases - the first from April 2008 till when Lehman Brothers filed forbankruptcy, which saw a blowout commodity rally (crude oil nudged close to USD 144/barrel) andthe sub-prime situation turning progressively worse. The United States (US) Government / FederalReserve bailed out major institutions thought to be critical to the functioning of the financial system.The second phase from September 2008 till January 2009 saw a spate of bankruptcies most notablyLehman Brothers which saw the appearance of an acute level of risk aversion pushing the creditmarkets into a gridlock. This phase also coincided with the fiscal / monetary stimuli by variousgovernments to take the credit crisis head on. Globally, markets stabilized around their October2008 lows and a semblance of normality started re-appearing in financial markets in this period. Thethird phase from February 2009 onwards witnessed a sharp rally as a weakening US Dollar spewedmoney into emerging markets. The sensex fell by 38% during the financial year.
For the financial year 2009, the popular indices viz. BSE Sensex and CNX Nifty were down 37.94%and 36.19% respectively. The BSE Midcap (54.01)% and the broader indices like BSE 200 (40.98)%and BSE 500 (42.77)% also reflected the correction across the markets. Within sectoral indices thebest performing indices were BSE FMCG (11.08)% and BSE Oil and Gas (29.58)% while the worstperforming indices were BSE Realty (79.37)%, due to the high leverage on the balance sheets, BSEMetals (58.67)%, due to slowdown in global growth and BSE Consumer Durables (58.14)% and BSECapital goods (53.84%).
In a year that saw sell-off across emerging markets, FIIs were net sellers of the tune USD 10.4 billionin the Indian equity markets while Domestic Institutional Investors (Insurance & Mutual Funds) werebuyers to the tune of USD 13.1 billion. Further, FIIs were net sellers in the derivative markets ashedge funds, and p-notes unwound positions in a rapidly deleveraging world. Thus, sentimentremained negative as few US based investment banks filed for bankruptcy in the midst of the liquidityand credit crisis and safety took precedence over growth.
Debt Market Overview
Two contrarian forces one inflationary and the other deflationary had been in play since 2007: Onthe one hand strong demand from emerging economies were leading commodities higher and fuellinginflation, while on the other the housing led credit crisis in the US was starting to exert a deflationaryforce. The first force was dominant till early July 2008 leading commodity prices to fresh peaks andinflation to multi year highs. Since then, however, the second force took hold with the result thatcommodity prices fell sharply from the top, growth and inflation numbers toppled worldwide, andcentral bankers shifted focus to achieving financial stability and protecting growth.
The financial crisis hit the domestic markets towards September 2008, leading to acute disruption inmoney markets. The Reserve Bank of India (RBI) acted proactively cutting the cash reserve ratio (CRR)by an unprecedented 400 bps between September 2008 and January 2009. Similarly, the reverserepo rate had been cut by 275 bps since October 2008 while the repo rate had been cut by 425 bpsover the same period.
Bond market yields fell in line with the unprecedented monetary easing up till the first week ofJanuary 2009. Thereon, supply pressures on bond markets rose as a result of government fiscalslippages aimed at stimulating the economy. The RBI, in line with similar measures elsewhere in theworld, started buying government securities to lessen the impact on yields from the rise in governmentborrowing. Although this helped market sentiment, it could not prevent a general rise in yieldstowards fiscal close. As a result, the 10 year benchmark sovereign yield closed the fiscal at 7% froma low of sub 5% hit in early January 2009. Money market rates stabilized after the initial mayhem ofSeptember 2008 and October 2008 and liquidity came back to interbank markets.
MARKET OUTLOOK(as furnished by HSBC Asset Management (India) Private Limited)
Equity Market Outlook
Financial Year (FY) 2008-09 was a year marked by a strong correlation between the Indian marketand global markets with key indices ending deeply in the red on the back of the subprime crisis andderivative led losses across major financial stocks in the United States (US). Even in India, forex losses
Trustees' ReportFor the year ended March 31, 2009 (Contd...)

5
ran across corporate India though at a smaller magnitude. FY 10 has begun on a better note onaccount of various fundamental and technical factors.
GDP for FY 09 grew at 6.7% against FY 08 levels of 9%. Agriculture posted a below trend growthrate of 1.6% and industry grew by 3.9% (versus 8.1% in FY 08) with services registering a close to9.7% growth. IIP grew by a mere 2.6%. Although order books of engineering / capital goods wererunning at record high levels, there was possibility of delays in execution as funding sources for thedevelopers (equity, ECB, private equity, FCCB) had dried up. A sharp increase in subsidy on accountof oil, fertilizers and food led to a cut back in discretionary spending. Inflation rose on the back of asurging crude and higher prices of agricultural commodities to top at 12.91% for the week ending 2August, 2008. A slow down in the growth rates in the US / EU and other markets finally tamed thesurge in crude. As growth rates stumbled, governments / monetary authorities the world over triggeredfiscal stimuli / monetary easing to escape recessionary forces. This was followed in India as wellwhich started monetary easing / fiscal stimuli to keep growth rates buoyant.
On the positive side, India continues to do better in relative terms and we expect GDP growth of6-6.5% for FY10. The broad themes that are driving domestic growth viz. capital expenditure,infrastructure building and domestic consumption are still intact. The key concerns at this pointstems from a ballooning fiscal deficit at the consolidated level (Centre & State) with salary revisionfor Central / State Government employees threatening a cut back in discretionary spending. Inflationis likely to remain benign for the first half of FY10 on a favourable base effect but we anticipate it togo back to trend levels of 5-5.5% for the second half of FY10 as this base effect wears off.
On a valuations perspective, the markets are currently trading at a P/E ratio of around 12 timesFY 2010 earnings. This is well below the 10-year average given the extreme risk aversion prevailing inthe markets. However, the underlying growth in the economy and corporate earnings growth (15%in the long term) makes the market attractive from a longer-term view. The short term could seeenhanced volatility arising from various factors. Increase in commodity prices continues to be a riskin the medium term as the US dollar continues to struggle with the ballooning US fiscal situation.
Debt Market Outlook
Excess supply of government bonds, as a result of fiscal slippages to arrest the downward growthmomentum, has been a reality for bond markets since January 2009. However, this is now compoundedwith some fatigue in buying longer duration as economic data is showing signs of recovery,commodities are showing signs of rally and expectations of incremental monetary easing from theRBI are beginning to unwind. However, system liquidity remains surplus and bank deposits continueto grow thereby providing resistance to bond yields from rising sharply.
Given the above factors, we believe that the market would continue to provide tactical opportunitiesalthough the fundamental bias should be for lower duration. Also, any mitigation of bond supplypressure or a new downturn in the ongoing economic recovery may provide space for opportunisticlonger duration plays. On the other hand, if the recovery cycle continues uninterrupted and commodityprices remain firm, central banks may start to worry about withdrawing the current monetary stimulusby sometime early 2010; with consequent impact on bond markets.
2. BRIEF BACKGROUND OF SPONSORS, BOARD OF TRUSTEES AND ASSETMANAGEMENT COMPANY
a) Sponsor
HSBC Mutual Fund is sponsored by HSBC Securities and Capital Markets (India) Private Limited (HSCI).The Sponsor is the Settler of the Mutual Fund Trust. The Sponsor has entrusted a sum of Rs. 1,00,000(Rupees One Lakh only) to the Trustee as the initial contribution towards the corpus of the MutualFund.
HSCI is a member of the HSBC Group, one of the largest banking and financial services organisations,in the world. Headquartered in London, HSBC operates through long-established businesses in fiveregions: Europe, Asia-Pacific, Middle East, America and Africa. Through its global network of 10,000offices in 86 countries and territories, HSBC provides a comprehensive range of financial services topersonal, commercial, corporate, institutional investment and private banking clients.
Trustees' ReportFor the year ended March 31, 2009 (Contd...)

6
HSCI offers integrated investment banking services, securities and corporate finance & advisory. HSCIis a member of The Bombay Stock Exchange Limited and National Stock Exchange (capital and derivativemarket segments) and is also a category I merchant banker and underwriter registered with Securitiesand Exchange Board of India.
HSCI holds 100% of the paid-up equity share capital of the AMC.
b) HSBC Mutual Fund
HSBC Mutual Fund ("the Mutual Fund" or "the Fund") has been constituted as a Trust in accordancewith the provisions of the Indian Trusts Act, 1882 (2 of 1882) vide a Trust Deed dated February 7,2002 with HSBC Securities and Capital Markets (India) Private Limited, as the Sponsor and the Boardof Individual Trustees. The Trustee has entered into an Investment Management Agreement datedFebruary 7, 2002 with HSBC Asset Management (India) Private Limited (the AMC) to function as theInvestment Manager for all the Schemes of the Fund. The Fund was registered with SEBI videregistration number MF/046/02/5 dated May 27, 2002.
The Trust has been formed for the purpose of pooling of capital from the public for collectiveinvestment in securities / any other property for the purpose of providing facilities for participationby persons as beneficiaries in such properties / investments and in the profits / income arising therefrom.
c) Board of Trustees (the Trustees)
The Board of Trustees are the exclusive owner of the Trust Fund and holds the same in trust for thebenefit of the unitholders. The Trustees have been discharging their duties and carrying out theirresponsibilities as provided in the SEBI (Mutual Funds) Regulations, 1996 and the Trust Deed. TheTrustees seeks to ensure that the Fund and the Schemes floated thereunder are managed by theAMC in accordance with the Trust Deed, the said Regulations, directions and guidelines issued bySEBI, the Stock Exchanges, the Association of Mutual Funds of India and other regulatory agencies.
d) Asset Management Company (the AMC)
HSBC Asset Management (India) Private Limited (the Investment Manager or the AMC) is a privatelimited company incorporated under the Companies Act, 1956 on December 12, 2001 having itsRegistered Office at 314, D. N. Road, Fort, Mumbai 400 001. HSBC Asset Management (India) PrivateLimited has been appointed as the Asset Management Company of the HSBC Mutual Fund by theTrustee vide Investment Management Agreement (IMA) dated February 7, 2002 and executed betweenthe Trustees and the AMC. SEBI approved the AMC to act as the Investment Manager of the Fundvide. its letter No. MFD/BC/163/2002 dated May 27, 2002.
The paid-up equity share capital of the AMC is Rs. 9 crores. HSBC Securities and Capital Markets(India) Private Limited holds 100% of the paid-up equity share capital of the AMC.
3. INVESTMENT OBJECTIVE OF THE SCHEMEThe investment objective of the Scheme has been provided above under the heading "SchemePerformance, Future Outlook and Operation of the Scheme" (refer Section 1).
4. SIGNIFICANT ACCOUNTING POLICIESThe accounting policies are in accordance with Securities and Exchange Board of India (Mutual Funds)Regulations, 1996.
5. UNCLAIMED DIVIDENDS & REDEMPTIONSSummary of number of Investors & corresponding amount
Unclaimed Dividends Unclaimed Redemptions
Scheme Amount No. of Amount No. of(Rs.) Investors (Rs.) Investors
HSBC Income Fund - Investment Plan 184,938.85 384 239,309.89 17
HSBC Income Fund - Short Term Plan 52,508.34 18 – –
Trustees' ReportFor the year ended March 31, 2009 (Contd...)

7
6. INVESTOR SERVICESDuring the year, the number of official points of acceptance of transactions increased significantly toabout 182 locations. In addition to the offices of the transfer agency, the company has InvestorService Centres in 14 locations at its own offices - namely Mumbai, New Delhi, Kolkata, Chennai,Bangalore, Hyderabad, Pune, Ahmedabad, Indore, Chandigarh, Kochi, Coimbatore, Lucknow andVadodara. With a view to enhancing customer convenience, the Asset Management Company hasextended the facility of crediting investor bank accounts directly by way of NEFT / RTGS (for credit ofredemption and dividend proceeds). The AMC endeavours to despatch dividend proceeds within 5working days from the Record Date in all Schemes. The internal standards on redemption payoutshave been consistently met, with very few exceptions. The number of locations for the ECS AutoDebit facility for investments through Systematic Investment Plan also increased to about 74 byMarch 2009.
On the distribution front, the number of empanelled distributors increased from 7859 as on 31March, 2008 to 8632 as on 31 March, 2009. During the year, the Asset Management Companyinitiated tie-ups for online distribution of the Mutual Fund's schemes with several channel partnerstaking the total number of such tie-ups to 24 (Angel Capital & Department Market Ltd., Bajaj CapitalLimited, Bonanza Portfolio Limited, Citibank N.A., Citigroup Wealth Advisors India Private Limited,HDFC Bank Limited, Hongkong & Shanghai Banking Corporation Limited, HSBC Corporate InvestmentSolution Services, ICICI Securities Limited, India Infoline Limited, Karvy Stock Broking Limited, KotakMahindra Bank Limited, Kotak Securities Limited, Motilal Oswal Securities Limited, NJ India InvestPrivate Limited, Reliance Securities Limited, RR Investors Capital Services Private Limited, SBICAPSecurities Limited, Sharekhan Limited, SMC Global Securities Limited, Standard Chartered - STCICapital Markets Ltd., Tom Distribution Services Limited, Yes Bank Limited).
Call centre operations have been extended to cover the entire country. The Asset ManagementCompany has outsourced certain back office services including call centre services to HSBC Operationsand Processing Enterprise (India) Private Limited (HOPE).
7. STATUTORY DETAILSa) The Sponsors are not responsible or liable for any loss resulting from the operation of the Schemes
of the Fund beyond initial contribution of Rs. 1 lakh for setting up the Fund.
b) The price and redemption value of the units, and income from them, can go up as well as downwith fluctuations in the market value of its underlying investments.
c) Full / Abridged Annual Report shall be disclosed on the website at www.assetmanagement.hsbc.com/inand shall be available for inspection at the Head Office of the mutual fund. Present and prospectiveunit holder can obtain copy of the trust deed, the Full / Abridged Annual Report of the Scheme(s),the Annual Report of HSBC Asset Management (India) Private Limited and the text of the relevantScheme(s) at a price.
8. ACKNOWLEDGEMENTSThe Trustees wish to thank the Unitholders of the Schemes for their support throughout the year andalso thank the Government of India, the Securities and Exchange Board of India (SEBI), the ReserveBank of India (RBI) and the Association of Mutual Funds in India (AMFI) for the guidance provided bythem. The Trustees also appreciate the service provided by the Registrar and Transfer Agent, FundAccountant, Custodian, Bankers, Distributors and Brokers. The guidance and services provided bythe Auditors and advocates and the ebullience, sincerity and dedication of the employees of HSBCAsset Management (India) Private Limited is also appreciated.
The Trustees look forward to the continued support of everyone.
For and on behalf of the Board of Trustees of HSBC Mutual Fund
Dilip J. Thakkar
Trustee
MUMBAIJuly 6, 2009

8
To the Board of Trustees of
HSBC MUTUAL FUND
1. We have audited the Balance Sheet of HSBC Mutual Fund – HSBC Income Fund (“The Scheme”)as at March 31, 2009 and the related Revenue Account for the year ended on that date, both ofwhich we have signed under reference to this report. These financial statements are theresponsibility of the Board of Trustees of HSBC Mutual Fund and the Management of HSBC AssetManagement (India) Private Limited (the “Management”). Our responsibility is to express anopinion on these financial statements based on our audit.
2. We have conducted our audit in accordance with auditing standards generally accepted in India.Those standards require that we plan and perform the audit to obtain reasonable assuranceabout whether the financial statements are free of material misstatement. An audit includesexamining, on a test basis, evidence supporting the amounts and disclosures in the financialstatements. Our procedures included confirmation of securities owned and unit capital balancesas at March 31, 2009 by correspondence with the custodian / others and registrar and transferagent respectively. An audit also includes assessing the accounting principles used and significantestimates made by the Management as well as evaluating the overall financial statementpresentation. We believe that our audit provides a reasonable basis for our opinion.
3. We have obtained all the information and explanations which to the best of our knowledge andbelief were necessary for the purpose of our audit. The Balance Sheet and the Revenue Accountreferred to above are in agreement with the books of account of the Scheme.
4. In our opinion and to the best of our information and according to the explanations given to us,
(i) The Balance Sheet and the Revenue Account together with the notes thereon give theinformation required by the Securities and Exchange Board of India (Mutual Funds) Regulations,1996 and amendments thereto, as applicable, and also give respectively, a true and fair viewof the state of affairs of HSBC Mutual Fund – HSBC Income Fund as at March 31, 2009 and itsnet surplus for the year ended on that date.
(ii) The Balance Sheet as at March 31, 2009 and the Revenue Account for the year ended on thatdate, together with the notes thereon have been prepared in all material respects in accordancewith the accounting policies and standards specified in the Ninth Schedule of the Securitiesand Exchange Board of India (Mutual Funds) Regulations, 1996 and amendments thereto asapplicable.
(iii) The methods used to value:
(a) non-traded debt securities in accordance with the guidelines for valuation of securitiesfor mutual funds dated September 18, 2000 and amendments thereto, as applicable,issued by the Securities and Exchange Board of India and:
(b) privately placed securities in good faith
as at March 31, 2009 as determined in good faith by HSBC Asset Management (India)Private Limited under procedures approved by the Board of Trustees of HSBC Mutual Fundare fair and reasonable.
Partha GhoshPartnerMembership No. F / 55913
For and on behalf ofPRICE WATERHOUSEChartered Accountants
Place : MumbaiDate: July 6, 2009
Auditors' Report

9
Rs. in Lakhs
HSBC INCOME FUND - INVESTMENT PLAN
As at As atMarch 31, 2009 March 31, 2008
LIABILITIES
1 Unit Capital 9,489.00 2,737.722 Reserves & Surplus2.1 Unit Premium Reserves (99.56) (188.22)2.2 Unrealised Appreciation Reserve 29.07 3.442.3 Other Reserves 2,071.49 1,034.603 Loans & Borrowings – –4 Current Liabilities & Provisions4.1 Provision for doubtful Income/Deposits – –4.2 Other Current Liabilities & Provisions 191.18 23.40
TOTAL 11,681.18 3,610.94
ASSETS
1 Investments1.1. Listed Securities:1.1.1 Equity Shares – –1.1.2 Preference Shares – –1.1.3 Equity Linked Debentures – –1.1.4 Other Debentures & Bonds 6,139.30 1,548.851.1.5 Securitised Debt securities – –1.2 Securities Awaited Listing:1.2.1 Equity Shares – –1.2.2 Preference Shares – –1.2.3 Equity Linked Debentures – –1.2.4 Other Debentures & Bonds – –1.2.5 Securitised Debt securities – –1.3 Unlisted Securities:1.3.1 Equity Shares – –1.3.2 Preference Shares – –1.3.3 Equity Linked Debentures – –1.3.4 Other Debentures & Bonds – –1.3.5 Securitised Debt securities 72.67 257.461.4 Government Securities 4,533.40 0.341.5 Treasury Bills – –1.6 Commercial Paper – –1.7 Certificate of Deposits – –1.8 Bill Rediscounting – –1.9 Units of Domestic Mutual Fund – –1.10 Foreign Securities – –
Total Investments 10,745.37 1,806.65
2 Deposits 2.05 2.05
3 Other Current Assets3.1 Cash & Bank Balance 44.80 41.403.2 CBLO / Reverse Repo Lending 346.07 1,696.123.3 Others 542.89 64.71
4 Deferred Revenue Expenditure – –(to the extent not written off)
TOTAL 11,681.18 3,610.94
Notes to Accounts - Annexure I
Abridged Balance Sheet as at March 31, 2009

10
Rs. in Lakhs
HSBC INCOME FUND - SHORT TERM PLAN
As at As atMarch 31, 2009 March 31, 2008
LIABILITIES
1 Unit Capital 13,700.32 980.532 Reserves & Surplus2.1 Unit Premium Reserves 450.99 (115.80)2.2 Unrealised Appreciation Reserve 49.38 0.522.3 Other Reserves 953.81 341.213 Loans & Borrowings – –4 Current Liabilities & Provisions4.1 Provision for doubtful Income/Deposits – –4.2 Other Current Liabilities & Provisions 53.97 2.96
TOTAL 15,208.47 1,209.42
ASSETS
1 Investments1.1. Listed Securities:1.1.1 Equity Shares – –1.1.2 Preference Shares – –1.1.3 Equity Linked Debentures – –1.1.4 Other Debentures & Bonds 8,415.76 260.841.1.5 Securitised Debt securities – –1.2 Securities Awaited Listing:1.2.1 Equity Shares – –1.2.2 Preference Shares – –1.2.3 Equity Linked Debentures – –1.2.4 Other Debentures & Bonds – –1.2.5 Securitised Debt securities – –1.3 Unlisted Securities:1.3.1 Equity Shares – –1.3.2 Preference Shares – –1.3.3 Equity Linked Debentures – –1.3.4 Other Debentures & Bonds – 208.381.3.5 Securitised Debt securities – –1.4 Government Securities – –1.5 Treasury Bills – –1.6 Commercial Paper – 29.481.7 Certificate of Deposits 6,021.53 49.401.8 Bill Rediscounting – –1.9 Units of Domestic Mutual Fund – –1.10 Foreign Securities – –
Total Investments 14,437.29 548.10
2 Deposits 4.04 4.04
3 Other Current Assets3.1 Cash & Bank Balance 93.64 16.313.2 CBLO / Reverse Repo Lending 162.99 631.913.3 Others 510.51 9.07
4 Deferred Revenue Expenditure – –(to the extent not written off)
TOTAL 15,208.47 1,209.42
Notes to Accounts - Annexure I
Abridged Balance Sheet as at March 31, 2009 (Contd...)

11
Rs. in Lakhs
HSBC INCOME FUND - INVESTMENT PLAN
Current PreviousYear ended Year ended
March 31, 2009 March 31, 2008
1 INCOME1.1 Dividend – –1.2 Interest 338.85 199.111.3 Realised Gain / (Loss) on Foreign Exchange Transactions – –1.4 Realised Gains / (Losses) on Interscheme
sale of investments (33.67) 6.001.5 Realised Gains / (Losses) on External
sale / redemption of investments (61.70) 15.881.6 Realised Gains / (Losses) on Derivative Transactions – –1.7 Other Income – –
(A) 243.48 220.99
2 EXPENSES2.1 Management fees 18.38 20.892.2 Service tax on Management fees ** – –2.3 Transfer agents fees and expenses 3.42 1.702.4 Custodian fees 0.50 0.442.5 Trusteeship fees 0.02 0.012.6 Commission to Agents * – –2.7 Marketing & Distribution expenses 101.43 10.172.8 Audit fees 0.50 0.502.9 Other operating expenses 1.82 1.832.10 Expenses to be Reimbursed by the Investment Manager (58.80) –
(B) 67.27 35.543 NET REALISED GAINS / (LOSSES)
FOR THE YEAR / PERIOD (A - B = C) 176.21 185.454 Change in Unrealised Depreciation
in value of investments (D) 151.13 (50.42)5 NET GAINS / (LOSSES) FOR THE
YEAR / PERIOD [E = (C-D)] 25.08 235.876 Change in unrealised appreciation
in the value of investments (F) 25.63 3.447 NET SURPLUS / (DEFICIT) FOR THE
YEAR / PERIOD (E + F = G) 50.71 239.317.1 Add: Balance transfer from
Unrealised Appreciation Reserve – –7.2 Less: Balance transfer to
Unrealised Appreciation Reserve 25.63 3.447.3 Add / (Less): Equalisation 1,131.11 262.607.4 Transfer from Reserve Fund 17.79 28.007.5 Transfer from Unit Premium Reserve – –
8 TOTAL 1,173.98 526.479 Dividend Appropriation9.1 Income Distributed during the year / period 103.73 37.379.2 Tax on income distributed during the year / period 15.56 5.3310 Retained Surplus / (Deficit)
carried forward to Balance Sheet 1,054.69 483.77
Notes to Accounts - Annexure I* Commission to Agents is included in Marketing & Distribution Expenses.** Service Tax on Management Fees is included in Other Operating Expenses.
Abridged Revenue Account for the year ended March 31, 2009

12
Rs. in Lakhs
HSBC INCOME FUND - SHORT TERM PLAN
Current PreviousYear ended Year ended
March 31, 2009 March 31, 2008
1 INCOME1.1 Dividend – –1.2 Interest 459.89 157.481.3 Realised Gain / (Loss) on Foreign Exchange Transactions – –1.4 Realised Gains / (Losses) on Interscheme
sale of investments 2.75 (39.52)1.5 Realised Gains / (Losses) on External
sale / redemption of investments 29.04 (4.90)1.6 Realised Gains / (Losses) on Derivative Transactions – –1.7 Other Income – –
(A) 491.68 113.062 EXPENSES2.1 Management fees 17.48 8.532.2 Service tax on Management fees ** – –2.3 Transfer agents fees and expenses 3.08 0.712.4 Custodian fees 0.96 0.362.5 Trusteeship fees 0.02 0.002.6 Commission to Agents * – –2.7 Marketing & Distribution expenses 38.47 5.762.8 Audit fees 0.50 0.502.9 Other operating expenses 0.41 0.502.10 Expenses to be Reimbursed by the Investment Manager (14.41) –
(B) 46.51 16.36
3 NET REALISED GAINS / (LOSSES)FOR THE YEAR / PERIOD (A - B = C) 445.17 96.70
4 Change in Unrealised Depreciationin value of investments (D) – (66.33)
5 NET GAINS / (LOSSES)FOR THE YEAR / PERIOD [E = (C-D)] 445.17 163.03
6 Change in unrealised appreciationin the value of investments (F) 48.86 0.52
7 NET SURPLUS / (DEFICIT)FOR THE YEAR / PERIOD (E + F = G) 494.03 163.55
7.1 Add: Balance transfer fromUnrealised Appreciation Reserve – –
7.2 Less : Balance transfer to Unrealised Appreciation Reserve 48.86 0.527.3 Add / (Less): Equalisation 573.65 (73.56)7.4 Transfer from Reserve Fund 48.63 88.687.5 Transfer from Unit Premium Reserve – –
8 TOTAL 1,067.45 178.159 Dividend Appropriation9.1 Income Distributed during the year / period 343.83 23.819.2 Tax on income distributed during the year / period 62.39 4.6910 Retained Surplus / (Deficit)
carried forward to Balance Sheet 661.23 149.65
Notes to Accounts - Annexure I
* Commission to Agents is included in Marketing & Distribution Expenses.** Service Tax on Management Fees is included in Other Operating Expenses.
Abridged Revenue Account for the year endedMarch 31, 2009 (Contd...)

13
HSBC INCOME FUND - INVESTMENT PLAN
Current PreviousYear ended Year ended
March 31, 2009 March 31, 2008
1. NAV per unit (Rs.):
Open
Regular Growth Option 13.6093 12.3363
Regular Dividend Option 10.7078 10.3002
Regular Option - Weekly Dividend
Institutional Growth Option 14.1338 12.7098
Institutional Dividend Option – –
Institutional Option - Weekly Dividend – –
Institutional Plus Option - Growth – –
Institutional Plus Option - Weekly – –
Institutional Plus Option - Monthly Dividend – –
High
Regular Growth Option 16.0096 13.6093
Regular Dividend Option 12.1899 10.8844
Regular Weekly Dividend Option – –
Institutional Growth Option 14.3056 14.1338
Institutional Dividend Option 11.6290 –
Institutional Weekly Dividend Option – –
Institutional Plus Option - Growth – –
Institutional Plus Option - Weekly – –
Institutional Plus Option - Monthly Dividend – –
Low
Regular Growth Option 13.6093 12.3022
Regular Dividend Option 10.5024 10.2717
Regular Weekly Dividend Option – –
Institutional Growth Option 9.4438 12.6755
Institutional Dividend Option 9.9124 –
Institutional Weekly Dividend Option – –
Institutional Plus Option - Growth – –
Institutional Plus Option - Weekly – –
Institutional Plus Option - Monthly Dividend – –
End
Regular Growth Option 14.8409 13.6093
Regular Dividend Option 11.1795 10.7078
Regular Weekly Dividend Option – –
Institutional Growth Option 9.5776 14.1338
Institutional Dividend Option 10.6682 –
Institutional Weekly Dividend Option – –
Institutional Plus Option - Growth – –
Institutional Plus Option - Weekly – –
Institutional Plus Option - Monthly Dividend – –
Key Statistics for the year ended March 31, 2009

14
Key Statistics for the year ended March 31, 2009 (Contd...)
HSBC INCOME FUND - INVESTMENT PLAN
Current PreviousYear ended Year ended
March 31, 2009 March 31, 2008
2. Closing Assets Under Management (Rs. in Lakhs)
End 11,490 3,588
Average (AAuM)1 4,163 2,601
3. Gross income as % of AAuM2 5.85% 8.50%
4. Expense Ratio:
a. Total Expense as % of AAuM (planwise)
Regular Growth Option 1.69% 1.50%
Regular Dividend Option 1.69% 1.50%
Regular Weekly Dividend Option – –
Institutional Growth Option 1.06% 0.70%
Institutional Dividend Option 1.06% –
Institutional Weekly Dividend Option – –
Institutional Plus Option - Growth – –
Institutional Plus Option - Weekly – –
Institutional Plus Option - Monthly Dividend – –
b. Management Fee as % of AAuM (planwise)
Regular Growth Option 0.44% 0.69%
Regular Dividend Option 0.44% 0.70%
Regular Weekly Dividend Option – –
Institutional Growth Option 0.44% –
Institutional Dividend Option 0.44% 0.23%
Institutional Weekly Dividend Option – –
Institutional Plus Option - Growth –
Institutional Plus Option - Weekly –
Institutional Plus Option - Monthly Dividend –
5. Net Income as a percentage of AAuM3 4.23% 7.13%
6. Portfolio turnover ratio4 – –
7. Total Dividend per unit distributed duringthe year / period (planwise)
Retail
Regular Dividend Option 0.4204 0.5518
Regular Weekly Dividend Option – –
Institutional Dividend Option 0.2102 –
Institutional Weekly Dividend Option – –
Institutional Plus Option - Weekly – –
Institutional Plus Option - Monthly Dividend – –
Corporate
Regular Dividend Option 0.3914 0.5136
Regular Weekly Dividend Option – –
Institutional Dividend Option 0.1957 –
Institutional Weekly Dividend Option – –

15
Institutional Plus Option - Weekly – –
Institutional Plus Option - Monthly Dividend – –
8. Returns:
a. Last One Year
Scheme
Regular Growth Option (32.2362) 5.9215
Regular Dividend Option N/A 5.1778
Regular Weekly Dividend Option N/A N/A
Institutional Growth Option 9.0497 6.7689
Institutional Dividend Option 8.4667 N/A
Institutional Weekly Dividend Option N/A N/A
Institutional Plus Option - Growth N/A N/A
Institutional Plus Option - Weekly N/A N/A
Institutional Plus Option - Monthly Dividend N/A N/A
Benchmark
CRISIL Composite Bond Fund Index (Investment Plan) 7.1600 8.2512
b. Since Inception
Scheme
Regular Growth Option (0.6817) 5.6282
Regular Dividend Option 10.1659 5.0763
Regular Weekly Dividend Option N/A N/A
Institutional Growth Option 6.4571 4.7517
Institutional Dividend Option 5.8927 (1.4250)
Institutional Weekly Dividend Option N/A N/A
Institutional Plus Option - Growth N/A N/A
Institutional Plus Weekly Dividend Option N/A N/A
Institutional Plus Option - Monthly Dividend N/A N/A
Benchnmark
CRISIL Composite Bond Fund Index (Investment Plan) 5.2200 4.7715
1 AAuM = Average daily net assets
2 Gross income = amount against (A) in the Revenue Account i.e. Income.
3 Net income = amount against (C) in the Revenue Account i.e. NET REALISED GAINS / (LOSSES)FOR THE YEAR / PERIOD
4 Portfolio Turnover = Lower of sales or purchase divided by the Average AuM for the year / period.
Key Statistics for the year ended March 31, 2009 (Contd...)
HSBC INCOME FUND - INVESTMENT PLAN
Current PreviousYear ended Year ended
March 31, 2009 March 31, 2008
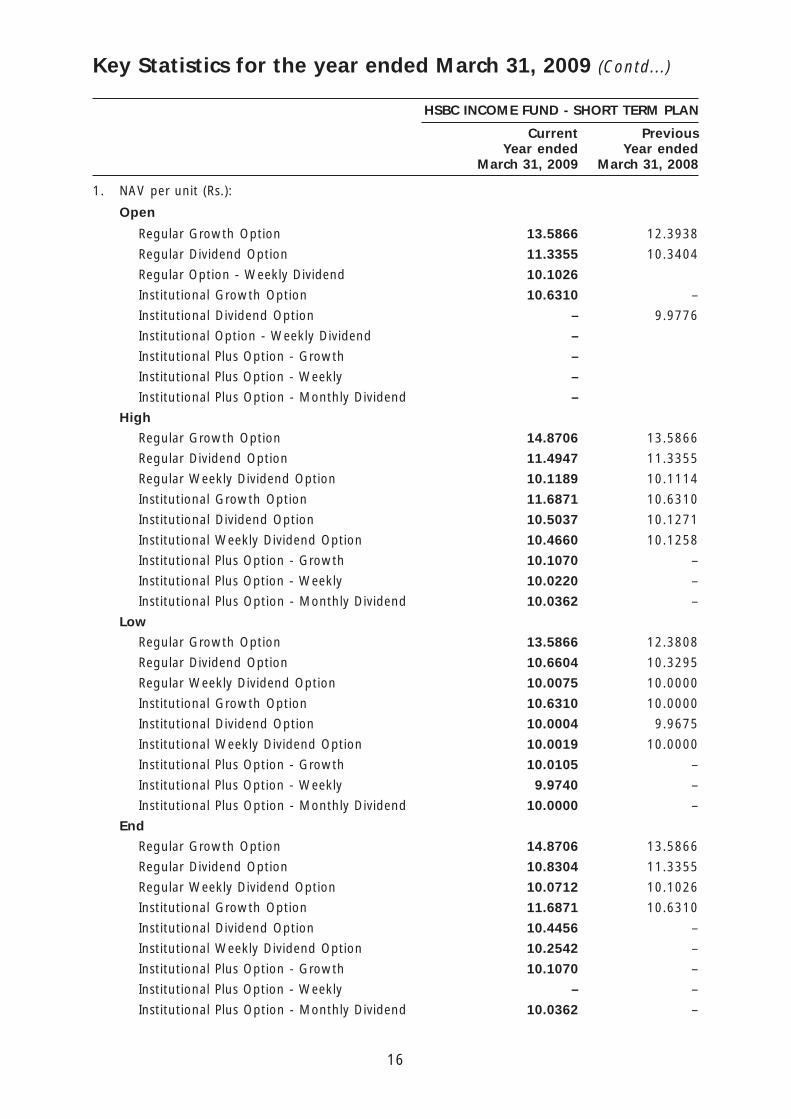
16
HSBC INCOME FUND - SHORT TERM PLAN
Current PreviousYear ended Year ended
March 31, 2009 March 31, 2008
1. NAV per unit (Rs.):
Open
Regular Growth Option 13.5866 12.3938
Regular Dividend Option 11.3355 10.3404
Regular Option - Weekly Dividend 10.1026
Institutional Growth Option 10.6310 –
Institutional Dividend Option – 9.9776
Institutional Option - Weekly Dividend –
Institutional Plus Option - Growth –
Institutional Plus Option - Weekly –
Institutional Plus Option - Monthly Dividend –
High
Regular Growth Option 14.8706 13.5866
Regular Dividend Option 11.4947 11.3355
Regular Weekly Dividend Option 10.1189 10.1114
Institutional Growth Option 11.6871 10.6310
Institutional Dividend Option 10.5037 10.1271
Institutional Weekly Dividend Option 10.4660 10.1258
Institutional Plus Option - Growth 10.1070 –
Institutional Plus Option - Weekly 10.0220 –
Institutional Plus Option - Monthly Dividend 10.0362 –
Low
Regular Growth Option 13.5866 12.3808
Regular Dividend Option 10.6604 10.3295
Regular Weekly Dividend Option 10.0075 10.0000
Institutional Growth Option 10.6310 10.0000
Institutional Dividend Option 10.0004 9.9675
Institutional Weekly Dividend Option 10.0019 10.0000
Institutional Plus Option - Growth 10.0105 –
Institutional Plus Option - Weekly 9.9740 –
Institutional Plus Option - Monthly Dividend 10.0000 –
End
Regular Growth Option 14.8706 13.5866
Regular Dividend Option 10.8304 11.3355
Regular Weekly Dividend Option 10.0712 10.1026
Institutional Growth Option 11.6871 10.6310
Institutional Dividend Option 10.4456 –
Institutional Weekly Dividend Option 10.2542 –
Institutional Plus Option - Growth 10.1070 –
Institutional Plus Option - Weekly – –
Institutional Plus Option - Monthly Dividend 10.0362 –
Key Statistics for the year ended March 31, 2009 (Contd...)

17
Key Statistics for the year ended March 31, 2009 (Contd...)
HSBC INCOME FUND - SHORT TERM PLAN
Current PreviousYear ended Year ended
March 31, 2009 March 31, 2008
2. Closing Assets Under Management (Rs. in Lakhs)
End 13,614 1,206
Average (AAuM)1 5,472 1,756
3. Gross income as % of AAuM2 8.99% 6.44%
4. Expense Ratio:
a. Total Expense as % of AAuM (planwise)
Regular Growth Option 1.10% 1.00%
Regular Dividend Option 1.10% 1.00%
Regular Weekly Dividend Option 1.10% 0.76%
Institutional Growth Option 0.60% 0.46%
Institutional Dividend Option 0.60% 0.39%
Institutional Weekly Dividend Option 0.60% 0.36%
Institutional Plus Option - Growth 0.55% –
Institutional Plus Option - Weekly 0.55% –
Institutional Plus Option - Monthly Dividend 0.55% –
b. Management Fee as % of AAuM (planwise)
Regular Growth Option 0.32% 0.49%
Regular Dividend Option 0.32% 0.49%
Regular Weekly Dividend Option 0.32% 0.36%
Institutional Growth Option 0.32% 0.21%
Institutional Dividend Option 0.32% 0.04%
Institutional Weekly Dividend Option 0.32% 0.19%
Institutional Plus Option - Growth 0.32% –
Institutional Plus Option - Weekly 0.32% –
Institutional Plus Option - Monthly Dividend 0.32% –
5. Net Income as a percentage of AAuM3 8.14% 5.51%
6. Portfolio turnover ratio4 –
7. Total Dividend per unit distributed during theyear / period (planwise)
Retail
Regular Dividend Option 1.3100 –
Regular Weekly Dividend Option 0.8238 0.3756
Institutional Dividend Option 0.4346 0.5109
Institutional Weekly Dividend Option 0.5068 0.4159
Institutional Plus Option - Weekly 0.0122 –
Institutional Plus Option - Monthly Dividend – –
Corporate
Regular Dividend Option 1.2193 –
Regular Weekly Dividend Option 0.7667 0.4400

18
Key Statistics for the year ended March 31, 2009 (Contd...)
HSBC INCOME FUND - SHORT TERM PLAN
Current PreviousYear ended Year ended
March 31, 2009 March 31, 2008
Institutional Dividend Option 0.2541 0.1973
Institutional Weekly Dividend Option 0.4717 0.1875
Institutional Plus Option - Weekly 0.2418 –
Institutional Plus Option - Monthly Dividend – –
8. Returns:
a. Last One Year
Scheme
Regular Growth Option 9.4505 8.7150
Regular Dividend Option 7.6472 7.6116
Regular Weekly Dividend Option 8.0181 7.4586
Institutional Growth Option 9.9342 9.1509
Institutional Dividend Option N/A 4.4802
Institutional Weekly Dividend Option N/A 4.6938
Institutional Plus Option - Growth N/A N/A
Institutional Plus Option - Weekly N/A N/A
Institutional Plus Option - Monthly Dividend N/A N/A
Benchmark
CRISIL Short-Term Bond Fund Index (Short Term Plan) 6.8500 8.8376
b. Since Inception
Scheme
Regular Growth Option 6.4908 6.1507
Regular Dividend Option 5.8644 5.5721
Regular Weekly Dividend Option 6.1596 1.6163
Institutional Growth Option 1.9108 0.8636
Institutional Dividend Option 3.8703 3.1320
Institutional Weekly Dividend Option 5.4338 1.4288
Institutional Plus Option - Growth 9.5256 N/A
Institutional Plus Weekly Dividend Option 3.0998 7.9685
Institutional Plus Option - Monthly Dividend 26.4260 N/A
Benchnmark
CRISIL Short-Term Bond Fund Index (Short Term Plan) 6.0000 5.3235
1 AAuM = Average daily net assets2 Gross income = amount against (A) in the Revenue Account i.e. Income.3 Net income = amount against (C) in the Revenue Account i.e. NET REALISED GAINS / (LOSSES)
FOR THE YEAR / PERIOD4 Portfolio Turnover = Lower of sales or purchase divided by the Average AuM for the year / period.

19
Notes to Accounts - Annexure ITo the Abridged Balance Sheet and Revenue Account for the year ended March 31, 2009
HSBC INCOME FUND
1 Investments:
1.1. It is confirmed that investments of the schemes are registered in the name of the Trustees forthe benefit of the scheme’s unitholders.
1.2. Open Positions of derivatives for Income Fund Investment Plan are Nil as at March 31, 2009and as at March 31, 2008.Open Positions of derivatives for Income Fund Short Term Plan are Nil as at March 31, 2009and as at March 31, 2008.
1.3. There were no investments made in Associates and Group Companies by the schemes forthe year ended March 31, 2009 and March 31, 2008.
1.4. Open position of Securities Borrowed and / or Lent by the schemes as of the years endedMarch 31, 2009 and March 31, 2008 are NIL.
1.5. NPAs for the schemes for the years ended March 31, 2009 and March 31, 2008 are NIL.1.6. Aggregate Unrealised Gain / Loss as at the end of the Financial years 2008 and 2009 and
their percentages to net assets are as under :
HSBC INCOME FUND - SHORT TERM PLANSecurity Amount Percentage to Amount Percentage toCategory (Rs.) Net Assets (Rs.) Net Assets
March 31, 2009 March 31, 2008
NCDs and Bonds Listed / Awaiting Listing
– Appreciation 5,080,372 0.3732% 58,671 0.0486%
– Depreciation 142,285 0.0105% 40,026 0.0332%
NCDs and Bonds Privately Placed
– Appreciation – – 49,012 0.0406%
– Depreciation – – 15,866 0.0132%
Asset Backed Securities
– Appreciation – – – –
– Depreciation – – – –
Government of India Securities
– Appreciation – – – –
– Depreciation – – – –
HSBC INCOME FUND - INVESTMENT PLAN
Security Amount Percentage to Amount Percentage toCategory (Rs.) Net Assets (Rs.) Net Assets
March 31, 2009 March 31, 2008
NCDs and Bonds Listed / Awaiting Listing– Appreciation 6,317,746 0.5498% 899,178 0.2506%– Depreciation 3,411,111 0.2969% 555,197 0.1548%NCDs and Bonds Privately Placed– Appreciation – – – –– Depreciation – – – –Asset Backed Securities– Appreciation – – – –– Depreciation 781,228 0.0680% 1,507,492 0.4202%Government of India Securities– Appreciation – – – –– Depreciation 15,845,249 1.3790% 5,749 0.0016%

20
Notes to Accounts - Annexure I (Contd...)To the Abridged Balance Sheet and Revenue Account for the year ended March 31, 2009
1.7. The aggregate value of investments purchased (excluding accretion of discount ofRs. 26,773,795 and Rs. 1,815,499 for Short Term Plan and Investment Plan respectively) andsold (including matured) during the year 2008 - 2009 are :
2009
Plan Aggregate Purchases Aggregate Sales
Amount Percentage of Amount Percentage of(Rs.) Average Daily (Rs.) Average Daily
Net Assets Net Assets
Short Term Plan 3,827,871,811 710.63% 2,473,791,637 459.25%
Investment Plan 3,159,143,552 762.83% 2,244,998,154 542.10%
The aggregate value of investments purchased (excluding accretion of discount ofRs. 9,353,629 and Rs. 4,231,436 for Short Term Plan and Investment Plan respectively) andsold (including matured) during the year 2007 - 2008 are :
2008
Plan Aggregate Purchases Aggregate Sales
Amount Percentage of Amount Percentage of(Rs.) Average Daily (Rs.) Average Daily
Net Assets Net Assets
Short Term Plan 347,984,169 197.83% 493,516,278 280.57%
Investment Plan 670,393,784 257.71% 747,303,187 287.28%
1.8. Non-Traded securities in the portfolio:Aggregate Value of Equity, Debt & Money Market Instruments and percentage to netassets are as under:
SHORT TERM PLAN
Security Fair Value Percentage to Fair Value PercentageCategory (Rs.) Net Assets (Rs.) to Net Assets
2009 2008
Equities – – – –
Debt Instruments 536,108,823 39.3795% 46,921,823 38.8923%
Money market Instruments 602,153,291 44.2308% 7,887,818.00 6.5380%
Total 1,138,262,113.57 45.4304% 54,809,641.00 45.4304%
INVESTMENT PLAN
Security Fair Value Percentage to Fair Value PercentageCategory (Rs.) Net Assets (Rs.) to Net Assets
2009 2008
Equities – – – –
Debt Instruments 189,014,345 16.4503% 180,630,930 50.3496%
Money market Instruments – – – –
Total 189,014,345.00 16.4503% 180,630,929.98 50.3496%

21
Notes to Accounts - Annexure I (Contd...)To the Abridged Balance Sheet and Revenue Account for the year ended March 31, 2009
2 Disclosure under Regulation 25(8) of the Securities and Exchange Board of India (Mutual Funds)Regulations, 1996 as amended.
Year - 2008-2009
During the year, The Hongkong and Shanghai Banking Corporation Limited, an associate entityof HSBC Asset Management (India) Private Limited was paid collection / bank charges amountingto Rs. 3,854 for the Short Term Plan and Rs. 41,395 for the Investment Plan and brokerageamounting to Rs. 1,678,765 for the Short Term Plan and Rs. 5,263,325 for the Investment Planfor procuring unit subscriptions for the Scheme. The brokerage paid was at rates similar to thoseoffered to other distributors. Further, The Hongkong and Shanghai Banking Corporation Limited,an associate of the Sponsor, is on the panel of bankers with whom HSBC Mutual Fund placesmoney on fixed deposits and enters into reverse repo transactions from time to time at competitiverates.
Year - 2007-2008
During the year, The Hongkong and Shanghai Banking Corporation Limited, an associate entityof HSBC Asset Management (India) Private Limited was paid collection / bank charges amountingto Rs. 3,937 for the Short Term Plan and Rs. 102,302 for the Investment Plan and brokerageamounting to Rs. 251,473 for the Short Term Plan and Rs. 582,379 for the Investment Plan forprocuring unit subscriptions for the Scheme. The brokerage paid was at rates similar to thoseoffered to other distributors. Further, The Hongkong and Shanghai Banking Corporation Limited,an associate of the Sponsor, is on the panel of bankers with whom HSBC Mutual Fund placesmoney on fixed deposits and enters into reverse repo transactions from time to time at competitiverates.
HSBC Mutual Fund also enters into transactions in Government securities at market rateswith HSBC Primary Dealership (India) Private Limited, a subsidiary of the Sponsor.
3 None of the Investors held more than 25% of the total net assets of Income Short Term andIncome Investment Plans as at the years ended on March 31, 2009 and March 31, 2008.
4 Unit Capital movement during the years ended March 31, 2008 and March 31, 2009.
SHORT TERM PLAN
2008-2009
Description Opening Units Subscription Redemption Closing Units Face Value
Regular Dividend 4,147,785.788 63,563,188.891 14,553,568.167 53,157,406.512 531,574,065.12
Regular Growth 4,652,173.505 19,603,247.004 8,805,010.670 15,450,409.839 154,504,098.39
RegularWeekly Dividend 505,339.613 17,883,545.155 3,921,588.369 14,467,296.399 144,672,963.99
Institutional Dividend – 17,532,762.612 12,695,749.262 4,837,013.350 48,370,133.50
Institutional Growth 500,000.000 11,411,840.508 3,065,854.006 8,845,986.502 88,459,865.02
InstitutionalWeekly Dividend – 83,021,402.762 58,026,286.944 24,995,115.818 249,951,158.18
Institutional Plus Option - Growth – 14,250,000.000 – 14,250,000.000 142,500,000.00
Institutional Plus Option - Weekly Dividend – 75,804,702.056 75,804,702.056 – –
Institutional Plus Option - Monthly Dividend – 1,000,000.000 – 1,000,000.000 10,000,000.00

22
SHORT TERM PLAN
2007-2008
Description Opening Units Subscription Redemption Closing Units Face Value
Regular Dividend 6,518,516.669 2,955,738.745 5,326,469.626 4,147,785.788 41,477,857.88
Regular Growth 8,266,687.991 5,179,513.274 8,794,027.760 4,652,173.505 46,521,735.05
Regular Weekly Dividend – 2,476,990.544 1,971,650.931 505,339.613 5,053,396.13
Institutional Dividend 3,113,370.838 1,091,517.166 4,204,888.004 – –
Institutional Growth – 12,500,000.000 12,000,000.000 500,000.000 5,000,000.00
InstitutionalWeekly Dividend – 4,553,581.232 4,553,581.232 – –
INVESTMENT PLAN
2008-2009
Description Opening Units Subscription Redemption Closing Units Face Value
Regular Dividend 6,441,356.823 59,571,503.172 7,362,875.506 58,649,984.489 586,499,844.89
Regular Growth 11,671,564.647 24,482,272.058 10,446,523.628 25,707,313.077 257,073,130.77
Regular Weekly Dividend – – –
Institutional Dividend – 19,998,982.155 9,985,565.984 10,013,416.171 100,134,161.71
Institutional Growth 9,264,262.136 1,019,254.435 9,764,262.136 519,254.435 5,192,544.35
InstitutionalWeekly Dividend – – – – –
INVESTMENT PLAN
2007-2008
Description Opening Units Subscription Redemption Closing Units Face Value
Regular Dividend 6,497,549.082 3,115,840.309 3,172,032.568 6,441,356.823 64,413,568.23
Regular Growth 13,759,710.196 7,542,811.349 9,630,956.898 11,671,564.647 116,715,646.47
Regular
Weekly Dividend – – – – –
Institutional Dividend – – – – –
Institutional Growth 1,785,969.425 7,478,292.711 – 9,264,262.136 92,642,621.36
InstitutionalWeekly Dividend – – – – –
Notes to Accounts - Annexure I (Contd...)To the Abridged Balance Sheet and Revenue Account for the year ended March 31, 2009
5 Previous year’s figures have been re-grouped / re-arranged where appropriate.
6 No contingent liabilities for Income Investment and Income Short Term funds for the years endedMarch 31, 2009 and March 31, 2008.
7 Expenses other than Management Fees are inclusive of Service Tax where applicable.
8. The Annual Accounts of the Schemes prepared in accordance with the accounting policies andstandards specified in the Ninth Schedule of The Securities and Exchange Board of India (MutualFunds) Regulations, 1996 has been approved by the Board of Directors of HSBC Asset Management(India) Private Limited and The Board of Trustees of HSBC Mutual Fund at their meeting held onJuly 06, 2009. The audit report attached herewith refers to the said annual accounts. The aforesaidabridged accounts are an extract of the Annual Accounts and are prepared in accordance withSEBI Circular No. IMD/Cir 8/132968/2008 dated July 24, 2008.

23
DISCLAIMERSThe content of this report has been prepared by HSBC Asset Management (India) Private Limited(HSBC) for information purposes only and should not be construed as an offer or solicitation of anoffer for purchase of any of the funds of HSBC Mutual Fund. The information is for general informationonly and does not have regard to specific investment objectives, financial situation and the particularneeds of any specific person who may receive this information. Investments in mutual funds inherentlyinvolve risks and investors should read the relevant documents / information for details and riskfactors and consult their legal, tax and financial advisors before investing. Investors should understandthat statements made herein regarding future prospects may not be realised. Neither this documentnor the units of HSBC Mutual Fund have been registered in any jurisdiction. The distribution of thisdocument in certain jurisdictions may be restricted or totally prohibited and accordingly, personswho come into possession of this document are required to inform themselves about, and to observe,any such restrictions.
Investors may obtain Statement of Additional Information, Combined Scheme Information Documentand Common Key Information Memorandums along with application forms from the office of HSBCMutual Fund, 314, D. N. Road, Fort, Mumbai 400 001. Tel: 022-6666 8819.
Statutory Details:HSBC Mutual Fund has been set up as a trust by HSBC Securities and Capital Markets (India) PrivateLimited (liability restricted to the corpus of Rs. 1 lakh). The Sponsor/associates of the Sponsor/AssetManagement Company (AMC) are not responsible or liable for any loss or shortfall resulting from theoperation of the Schemes. The Trustees of HSBC Mutual Fund have appointed HSBC Asset Management(India) Private Limited as the Investment Manager.
Risk Factors:All investments in mutual funds and securities are subject to market risks and the Net Asset Value(NAV) of the Scheme(s) may go up or down depending on the factors and forces affecting the securitiesmarkets. There can be no assurance that the objectives of the Scheme(s) will be achieved. Pastperformance of the Sponsor, AMC, Mutual Fund or any associates of the Sponsor/AMC does notindicate the future performance of the Scheme(s) of the Mutual Fund. HSBC Income Fund (HIF) is thenames of the Scheme and does not in any manner indicate the quality of the Scheme or its futureprospects or returns.
Terms of Issue:Units of the Scheme(s) are being offered at NAV based prices, subject to the prevailing loads. TheAMC calculates and publishes NAVs and offers for sale, redemption and switch outs, units of theScheme(s) on all Business Days, at the Applicable NAV for all Schemes (at least once a week, i.e.,every Wednesday and daily during the period of redemption in case of HSCF). HUOF, HSCF & HFTSwill not be open for ongoing subscriptions/ switch ins. HUOF & HSCF would be available for sale onan ongoing basis (after a period of 3 years from the date of allotment). Conversion of HUOF & HSCFto an open-ended scheme will be done only after the balance unamortized amount has been fullyrecovered from the Scheme. Units can be redeemed/switched out on every Business Day at NAVbased prices, subject to prevailing exit loads. In case of HSCF, units can be redeemed / switched outon a monthly basis on the stipulated date i.e. last 3 business days of every month at NAV basedprices, subject to provisions of exit load, if any and recovery of balance proportionate unamortizedNFO expenses.
Load Structure (includes SIP/STP):HIF-IP:Entry - Nil.
Exit - Regular & Institutional Options: 1%, if redeemed / switched out within 1 year from date ofinvestments.
HIF-ST:Entry - Nil.
Exit - 0.5% for investments in Regular Option, if redeemed/ switched out within 6 months from thedate of investment.
Consult the nearest investor service centre for details.
The entry/exit load set forth above is subject to change at the discretion of the AMC and suchchanges shall be implemented prospectively.

Mutual Fund investments are subject to market risks. Please read the Statement of AdditionalInformation and Scheme Information Document carefully before investing.
Value Research Online DisclaimerValue Research Fund Ratings: Value Research Fund Ratings are a composite measure of historical risk-adjusted returns. In the case of equity funds this rating is based on the average monthly returns forthe last 3-year and 5-year period. These ratings do not take into account any entry or exit load.
Value Research Fund Ratings are subject to change every month. Current Fund Ratings are as onMarch 31, 2009. 142 open-ended Equity: Diversified Funds were rated. The Rating is based on primarydata provided by respective funds; Value Research does not guarantee the accuracy. Ranking Entity:Value Research Online.
ICRA Online Ranking MethodologyHSBC Monthly Income - Savings Plan has been ranked as a Five Star Fund in the category of 'OpenEnded Marginal Equity' schemes for its 3 year performance till December 31, 2008.
The rank is an outcome of an objective and comparative analysis against various parameters, including:risk adjusted return, fund size, company concentration, portfolio turnover and liquidity. The rankingmethodology did not take into account entry and exit loads imposed by the Fund. There were 27schemes considered in 'Open Ended Marginal Equity' category for the ranking exercise. The rank isneither a certificate of statutory compliance nor any guarantee on the future performance of HSBCMonthly Income - Savings Plan. Ranking Source & Publisher: ICRA Online Limited.
CRISIL Ranking MethodologyThe selection for the awards is based on the CRISIL FundServices' Composite Performance Ranking(CRISIL~CPR) methodology.
The CRISIL Composite Performance Ranking (CRISIL~CPR) is a quarterly ranking of mutual fund schemesbased on two year performance (excepting for the liquid and short term debt categories where a oneyear performance horizon is considered). The methodology is based on global best practices,customized to account for Indian market nuances. Over time, the rankings have become the industrystandard with good acceptance among Investors, Fund Intermediaries, Asset Management Companies,etc. The performance criteria covers not only risk adjusted returns, which are historical, but also theportfolio constitution to make the analysis forward looking.
CRISIL DisclaimerThe overall ranking is assigned to the scheme based on its weighted average score on a range ofparameters: Superior Return Score, Concentration, Liquidity, Asset Quality - Measures the creditquality of the portfolio, Average Maturity and Asset Size. HSBC MIP - Savings was the only schemethat won the CNBC TV18 - CRISIL Mutual Fund of the Year Award in the Category - Monthly IncomePlans - Aggressive. In total 13 schemes were eligible for the award universe. Schemes present in allfour quarterly CRISIL CPRs were considered for the award. The award is based on consistency of thescheme's performance in the four quarterly CRISIL CPR rankings released during the calendar year2008. The individual CRISIL CPR parameter scores averaged for the four quarters were further multipliedby the parameter weights as per the CRISIL CPR methodology to arrive at the final scores. A detailedmethodology of the CRISIL CPR is available at www.crisil.com. Past performance is no guarantee offuture results. Rankings and Award Source: CRISIL Fund Services, CRISIL Ltd. HSBC Monthly Income -Savings Plan has been ranked as a Five Star Fund in the category of 'Open Ended Marginal Equity'schemes for its 3 year performance till December 31, 2008. The rank is an outcome of an objectiveand comparative analysis against various parameters, including: risk adjusted return, fund size,company concentration, portfolio turnover and liquidity. The ranking methodology did not take intoaccount entry and exit loads imposed by the Fund. There were 27 schemes considered in 'OpenEnded Marginal Equity' category for the ranking exercise. The rank is neither a certificate of statutorycompliance nor any guarantee on the future performance of HSBC Monthly Income - Savings Plan.Ranking Source & Publisher: ICRA Online Limited.
24

Issued by HSBC Asset Management (India) Private Limited
HSBC Global Asset Management
HSBC Floating Rate FundAn open-ended income Scheme
Abridged Annual Report 2008 - 2009

1
Dear Investor,
We thank you for investing with HSBC Mutual Fund. We are pleased to inform you that HSBCMutual Fund has won prestigious awards* this year at various forums in India.
The awards* won by our schemes in India are
� HSBC Equity Fund has been included in the 5 star rated fund category (“Top rated mutualfunds” by Value Research online) in March, 2009.
� Five-stars indicate that a fund is in the top 10 per cent of its category in terms ofhistorical risk-adjusted returns.
� ICRA Mutual Fund Awards 2009
� HSBC MIP - Savings has been ranked a 5-Star Fund by ICRA Online indicating performanceamong the top 10% in the category of 'Open Ended Marginal Equity' for 3 yearperformance ending 31 December, 2008.
� CNBC TV18 - CRISIL Mutual Fund Awards 2008
� HSBC MIP - Savings was awarded the CNBC TV18 - CRISIL Mutual Fund of the YearAward for the year 2008 in the Monthly Income Plans - Aggressive Category.
(Past performance is no guarantee of future results. * Please refer to Ranking methodologyand disclaimer mentioned at the end of the Abridged Annual Report for the year endedMarch 31, 2009).
At the global level, the HSBC Group won several awards at Euromoney's Awards for Excellence2009. The top awards that HSBC won were the Best Global Bank and the Best Global DebtHouse. It was also honoured as the Best Debt House in 8 locations including Asia and the Bestat Risk Management in Asia. (Past performance may or may not be sustained in the future andis no guarantee of future results). We continue to be one of the leading players in emergingmarkets and remain committed to our asset management business in India.
HSBC Asset Management (India) Private Limited including the mutual fund business as well asthe PMS business (including EPFO money deployed till date) manages assets of about Rs. 26280Crores as at 30 June, 2009. The core to our winning strategy is our endeavour to deliverconsistent performance over the medium to long term for our investors in a risk controlledenvironment and aim for consistent wealth creation under varying market conditions. Throughour product range, we aim to be true to our reputation in India of being a provider ofinternational quality investment products and services.
We remain committed to our philosophy of aiming for consistent wealth creation and serviceexcellence and look forward to your continued investments in HSBC Mutual Fund.
Yours sincerely,
VikramaadityaChief Executive OfficerHSBC Asset Management (India) Private Limited
2
SPONSORHSBC Securities and Capital Markets (India) Private LimitedRegd. Office: 52/60, Mahatma Gandhi Road, Fort, Mumbai 400 001.
TRUSTEEBoard of TrusteesOffice: 314, D. N. Road, Fort, Mumbai 400 001.
ASSET MANAGEMENT COMPANYHSBC Asset Management (India) Private LimitedCorp. & Regd. Office: 314, D. N. Road, Fort, Mumbai 400 001.
CUSTODIANJP Morgan Chase BankCorp. & Regd. Office: Mafatlal Centre, 9th Floor, Nariman Point, Mumbai - 400 021.
AUDITORS TO THE SCHEMEPrice WaterhouseChartered Accountants252, Veer Savarkar Marg, Shivaji Park, Dadar (West), Mumbai - 400 028.
LEGAL ADVISORSBharucha & Partners4th Floor, Cecil Court, Mahakavi Bhushan Marg, Colaba, Mumbai - 400 039.
REGISTRAR & TRANSFER AGENTSComputer Age Management Services (P) Ltd. (CAMS)Rayala Towers, Tower I, III Floor, 158 Anna Salai, Chennai - 600 002.
BOARD OF TRUSTEESMr. N. P. Gidwani - Chairman
Dr. Rudolf ApenbrinkMr. Nasser MunjeeMr. Manu TandonMr. Mehli MistriMr. Dilip J. Thakkar
BOARD OF DIRECTORSMs. Naina Lal Kidwai - Chairman
Mr. Ayaz EbrahimMr. S. P. Mustafa**Mr. Vithal PalekarMs. Kishori J. Udeshi*Mr. Vikramaaditya - Chief Executive Officer***
* Ms. Kishori Udeshi has been appointed as a Director with effect from 14 January 2009 andMr. Jagjit Lal Pasricha has resigned as a Director with effect from 19 January 2009.
** Mr. S. P. Mustafa has been appointed as a Director with effect from 2 September 2008 andMr. Nawshir Khurody has resigned as a Director with effect from 1 September 2008.
*** Mr. Vikramaaditya has been appointed as the Chief Executive Officer with effect from 16 July 2008and Mr. Sanjay Prakash has resigned as the Chief Executive Officer with effect from 16 July 2008.

3
Trustees' ReportFor the year ended March 31, 2009
The Trustees present the seventh report and the audited financial statements of the Schemes ofHSBC Mutual Fund (the "Fund"), for the year ended March 31, 2009.
1. SCHEME PERFORMANCE, FUTURE OUTLOOK AND OPERATIONS OF THE SCHEME
a) Operations and Performance of the Scheme
HSBC Floating Rate Fund (HFRF) - an open-ended Income Scheme
HFRF, launched in November 2004, is an open ended Income Scheme that seeks to generate reasonablereturn with commensurate risk from a portfolio comprised of floating rate debt instruments andfixed rate debt instruments swapped for floating rate returns. The Scheme may also invest in fixedrate money market and debt instruments. There can be no assurance that the Scheme objective canbe realised. The Scheme has two Plans - Long Term Plan and Short Term Plan.
The net assets of HSBC Floating Rate Fund - Long Term Plan (HFRF - LTP) amounted to Rs. 454.44crores as at March 31, 2009 as compared to Rs. 69.37 crores as at March 31, 2008. 103.86% in debtand money market instruments, 3.34% of the net assets were invested in reverse repos and (7.21)%in net current assets as at March 31, 2009.
The net assets of HSBC Floating Rate Fund - Short Term Plan (HFRF - STP) amounted to Rs. 87.85crores as at March 31, 2009 as compared to Rs. 139.39 crores as at March 31, 2008. 99.32% of thenet assets were invested in reverse repos and 0.68% in net current assets as at March 31, 2009.
HFRF-LTP has marginally underperformed the benchmark as focus on portfolio quality has impactedportfolio yield to some extent.
HFRF - LTP
Date of Inception : 16 November, 2004 Compounded Annualized Returns (%)
Schemes (P2P) 1 Year 3 Years Since Inception
HSBC FRF - LTP - Regular Plan - Growth 8.68 8.09 7.21
CRISIL Liquid Fund Index 8.78 7.56 6.70
Past performance may or may not be sustained in future. 'Since inception' returns are calculated onRs. 10 invested at inception. Calculations are based on Growth NAVs.
HFRF-STP has underperformed the benchmark as incremental investments over the last few monthshave been made very conservatively in line with the general risk environment.
HFRF - STP
Date of Inception : 16 November, 2004 Compounded Annualized Returns (%)
Schemes (P2P) 1 Year 3 Years Since Inception
HSBC FRF - STP - Regular Plan - Growth 7.60 7.53 6.86
CRISIL Liquid Fund Index 8.80 7.56 6.70
Past performance may or may not be sustained in future. 'Since inception' returns are calculated onRs. 10 invested at inception. Calculations are based on Growth NAVs.
b) Market Overview & Outlook
MARKET OVERVIEW(as furnished by HSBC Asset Management (India) Private Limited)
Equity Market Overview
The financial year ended 31 March, 2009 was a highly eventful one with long standing institutionsdisappearing from the landscape in the whirlwind of the sub-prime crisis and derivative losses. Theyear can be split into three phases - the first from April 2008 till when Lehman Brothers filed for
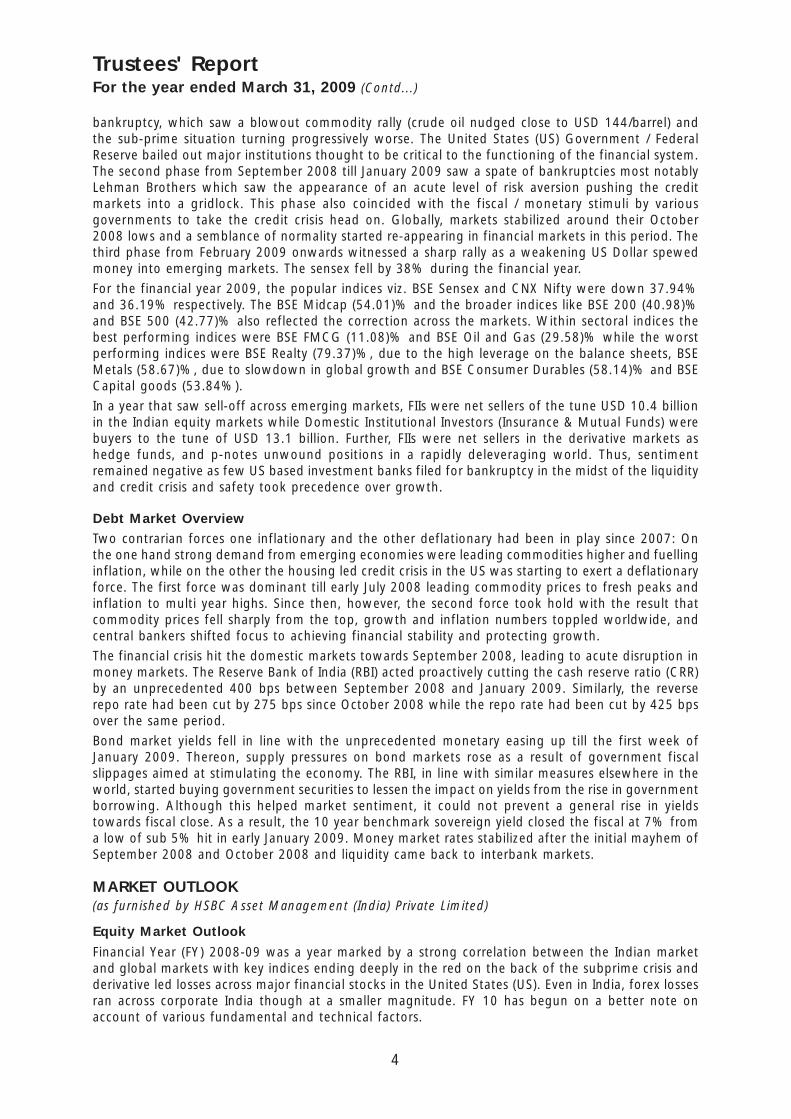
4
bankruptcy, which saw a blowout commodity rally (crude oil nudged close to USD 144/barrel) andthe sub-prime situation turning progressively worse. The United States (US) Government / FederalReserve bailed out major institutions thought to be critical to the functioning of the financial system.The second phase from September 2008 till January 2009 saw a spate of bankruptcies most notablyLehman Brothers which saw the appearance of an acute level of risk aversion pushing the creditmarkets into a gridlock. This phase also coincided with the fiscal / monetary stimuli by variousgovernments to take the credit crisis head on. Globally, markets stabilized around their October2008 lows and a semblance of normality started re-appearing in financial markets in this period. Thethird phase from February 2009 onwards witnessed a sharp rally as a weakening US Dollar spewedmoney into emerging markets. The sensex fell by 38% during the financial year.
For the financial year 2009, the popular indices viz. BSE Sensex and CNX Nifty were down 37.94%and 36.19% respectively. The BSE Midcap (54.01)% and the broader indices like BSE 200 (40.98)%and BSE 500 (42.77)% also reflected the correction across the markets. Within sectoral indices thebest performing indices were BSE FMCG (11.08)% and BSE Oil and Gas (29.58)% while the worstperforming indices were BSE Realty (79.37)%, due to the high leverage on the balance sheets, BSEMetals (58.67)%, due to slowdown in global growth and BSE Consumer Durables (58.14)% and BSECapital goods (53.84%).
In a year that saw sell-off across emerging markets, FIIs were net sellers of the tune USD 10.4 billionin the Indian equity markets while Domestic Institutional Investors (Insurance & Mutual Funds) werebuyers to the tune of USD 13.1 billion. Further, FIIs were net sellers in the derivative markets ashedge funds, and p-notes unwound positions in a rapidly deleveraging world. Thus, sentimentremained negative as few US based investment banks filed for bankruptcy in the midst of the liquidityand credit crisis and safety took precedence over growth.
Debt Market Overview
Two contrarian forces one inflationary and the other deflationary had been in play since 2007: Onthe one hand strong demand from emerging economies were leading commodities higher and fuellinginflation, while on the other the housing led credit crisis in the US was starting to exert a deflationaryforce. The first force was dominant till early July 2008 leading commodity prices to fresh peaks andinflation to multi year highs. Since then, however, the second force took hold with the result thatcommodity prices fell sharply from the top, growth and inflation numbers toppled worldwide, andcentral bankers shifted focus to achieving financial stability and protecting growth.
The financial crisis hit the domestic markets towards September 2008, leading to acute disruption inmoney markets. The Reserve Bank of India (RBI) acted proactively cutting the cash reserve ratio (CRR)by an unprecedented 400 bps between September 2008 and January 2009. Similarly, the reverserepo rate had been cut by 275 bps since October 2008 while the repo rate had been cut by 425 bpsover the same period.
Bond market yields fell in line with the unprecedented monetary easing up till the first week ofJanuary 2009. Thereon, supply pressures on bond markets rose as a result of government fiscalslippages aimed at stimulating the economy. The RBI, in line with similar measures elsewhere in theworld, started buying government securities to lessen the impact on yields from the rise in governmentborrowing. Although this helped market sentiment, it could not prevent a general rise in yieldstowards fiscal close. As a result, the 10 year benchmark sovereign yield closed the fiscal at 7% froma low of sub 5% hit in early January 2009. Money market rates stabilized after the initial mayhem ofSeptember 2008 and October 2008 and liquidity came back to interbank markets.
MARKET OUTLOOK(as furnished by HSBC Asset Management (India) Private Limited)
Equity Market Outlook
Financial Year (FY) 2008-09 was a year marked by a strong correlation between the Indian marketand global markets with key indices ending deeply in the red on the back of the subprime crisis andderivative led losses across major financial stocks in the United States (US). Even in India, forex lossesran across corporate India though at a smaller magnitude. FY 10 has begun on a better note onaccount of various fundamental and technical factors.
Trustees' ReportFor the year ended March 31, 2009 (Contd...)

5
GDP for FY 09 grew at 6.7% against FY 08 levels of 9%. Agriculture posted a below trend growthrate of 1.6% and industry grew by 3.9% (versus 8.1% in FY 08) with services registering a close to9.7% growth. IIP grew by a mere 2.6%. Although order books of engineering / capital goods wererunning at record high levels, there was possibility of delays in execution as funding sources for thedevelopers (equity, ECB, private equity, FCCB) had dried up. A sharp increase in subsidy on accountof oil, fertilizers and food led to a cut back in discretionary spending. Inflation rose on the back of asurging crude and higher prices of agricultural commodities to top at 12.91% for the week ending 2August, 2008. A slow down in the growth rates in the US / EU and other markets finally tamed thesurge in crude. As growth rates stumbled, governments / monetary authorities the world over triggeredfiscal stimuli / monetary easing to escape recessionary forces. This was followed in India as wellwhich started monetary easing / fiscal stimuli to keep growth rates buoyant.
On the positive side, India continues to do better in relative terms and we expect GDP growth of6-6.5% for FY10. The broad themes that are driving domestic growth viz. capital expenditure,infrastructure building and domestic consumption are still intact. The key concerns at this pointstems from a ballooning fiscal deficit at the consolidated level (Centre & State) with salary revisionfor Central / State Government employees threatening a cut back in discretionary spending. Inflationis likely to remain benign for the first half of FY10 on a favourable base effect but we anticipate it togo back to trend levels of 5-5.5% for the second half of FY10 as this base effect wears off.
On a valuations perspective, the markets are currently trading at a P/E ratio of around 12 timesFY 2010 earnings. This is well below the 10-year average given the extreme risk aversion prevailing inthe markets. However, the underlying growth in the economy and corporate earnings growth (15%in the long term) makes the market attractive from a longer-term view. The short term could seeenhanced volatility arising from various factors. Increase in commodity prices continues to be a riskin the medium term as the US dollar continues to struggle with the ballooning US fiscal situation.
Debt Market Outlook
Excess supply of government bonds, as a result of fiscal slippages to arrest the downward growthmomentum, has been a reality for bond markets since January 2009. However, this is now compoundedwith some fatigue in buying longer duration as economic data is showing signs of recovery,commodities are showing signs of rally and expectations of incremental monetary easing from theRBI are beginning to unwind. However, system liquidity remains surplus and bank deposits continueto grow thereby providing resistance to bond yields from rising sharply.
Given the above factors, we believe that the market would continue to provide tactical opportunitiesalthough the fundamental bias should be for lower duration. Also, any mitigation of bond supplypressure or a new downturn in the ongoing economic recovery may provide space for opportunisticlonger duration plays. On the other hand, if the recovery cycle continues uninterrupted and commodityprices remain firm, central banks may start to worry about withdrawing the current monetary stimulusby sometime early 2010; with consequent impact on bond markets.
2. BRIEF BACKGROUND OF SPONSORS, BOARD OF TRUSTEES AND ASSETMANAGEMENT COMPANY
a) Sponsor
HSBC Mutual Fund is sponsored by HSBC Securities and Capital Markets (India) Private Limited (HSCI).The Sponsor is the Settler of the Mutual Fund Trust. The Sponsor has entrusted a sum of Rs. 1,00,000(Rupees One Lakh only) to the Trustee as the initial contribution towards the corpus of the MutualFund.
HSCI is a member of the HSBC Group, one of the largest banking and financial services organisations,in the world. Headquartered in London, HSBC operates through long-established businesses in fiveregions: Europe, Asia-Pacific, Middle East, America and Africa. Through its global network of 10,000offices in 86 countries and territories, HSBC provides a comprehensive range of financial services topersonal, commercial, corporate, institutional investment and private banking clients.
HSCI offers integrated investment banking services, securities and corporate finance & advisory. HSCIis a member of The Bombay Stock Exchange Limited and National Stock Exchange (capital and derivative
Trustees' ReportFor the year ended March 31, 2009 (Contd...)

6
market segments) and is also a category I merchant banker and underwriter registered with Securitiesand Exchange Board of India.
HSCI holds 100% of the paid-up equity share capital of the AMC.
b) HSBC Mutual Fund
HSBC Mutual Fund ("the Mutual Fund" or "the Fund") has been constituted as a Trust in accordancewith the provisions of the Indian Trusts Act, 1882 (2 of 1882) vide a Trust Deed dated February 7,2002 with HSBC Securities and Capital Markets (India) Private Limited, as the Sponsor and the Boardof Individual Trustees. The Trustee has entered into an Investment Management Agreement datedFebruary 7, 2002 with HSBC Asset Management (India) Private Limited (the AMC) to function as theInvestment Manager for all the Schemes of the Fund. The Fund was registered with SEBI videregistration number MF/046/02/5 dated May 27, 2002.
The Trust has been formed for the purpose of pooling of capital from the public for collectiveinvestment in securities / any other property for the purpose of providing facilities for participationby persons as beneficiaries in such properties / investments and in the profits / income arising therefrom.
c) Board of Trustees (the Trustees)
The Board of Trustees are the exclusive owner of the Trust Fund and holds the same in trust for thebenefit of the unitholders. The Trustees have been discharging their duties and carrying out theirresponsibilities as provided in the SEBI (Mutual Funds) Regulations, 1996 and the Trust Deed. TheTrustees seeks to ensure that the Fund and the Schemes floated thereunder are managed by theAMC in accordance with the Trust Deed, the said Regulations, directions and guidelines issued bySEBI, the Stock Exchanges, the Association of Mutual Funds of India and other regulatory agencies.
d) Asset Management Company (the AMC)
HSBC Asset Management (India) Private Limited (the Investment Manager or the AMC) is a privatelimited company incorporated under the Companies Act, 1956 on December 12, 2001 having itsRegistered Office at 314, D. N. Road, Fort, Mumbai 400 001. HSBC Asset Management (India) PrivateLimited has been appointed as the Asset Management Company of the HSBC Mutual Fund by theTrustee vide Investment Management Agreement (IMA) dated February 7, 2002 and executed betweenthe Trustees and the AMC. SEBI approved the AMC to act as the Investment Manager of the Fundvide. its letter No. MFD/BC/163/2002 dated May 27, 2002.
The paid-up equity share capital of the AMC is Rs. 9 crores. HSBC Securities and Capital Markets(India) Private Limited holds 100% of the paid-up equity share capital of the AMC.
3. INVESTMENT OBJECTIVE OF THE SCHEMEThe investment objective of the Scheme has been provided above under the heading "SchemePerformance, Future Outlook and Operation of the Scheme" (refer Section 1).
4. SIGNIFICANT ACCOUNTING POLICIESThe accounting policies are in accordance with Securities and Exchange Board of India (Mutual Funds)Regulations, 1996.
5. UNCLAIMED DIVIDENDS & REDEMPTIONSNil.
6. INVESTOR SERVICESDuring the year, the number of official points of acceptance of transactions increased significantly toabout 182 locations. In addition to the offices of the transfer agency, the company has InvestorService Centres in 14 locations at its own offices - namely Mumbai, New Delhi, Kolkata, Chennai,Bangalore, Hyderabad, Pune, Ahmedabad, Indore, Chandigarh, Kochi, Coimbatore, Lucknow and
Trustees' ReportFor the year ended March 31, 2009 (Contd...)

7
Vadodara. With a view to enhancing customer convenience, the Asset Management Company hasextended the facility of crediting investor bank accounts directly by way of NEFT / RTGS (for credit ofredemption and dividend proceeds). The AMC endeavours to despatch dividend proceeds within 5working days from the Record Date in all Schemes. The internal standards on redemption payoutshave been consistently met, with very few exceptions. The number of locations for the ECS AutoDebit facility for investments through Systematic Investment Plan also increased to about 74 byMarch 2009.
On the distribution front, the number of empanelled distributors increased from 7859 as on 31March, 2008 to 8632 as on 31 March, 2009. During the year, the Asset Management Companyinitiated tie-ups for online distribution of the Mutual Fund's schemes with several channel partnerstaking the total number of such tie-ups to 24 (Angel Capital & Department Market Ltd., Bajaj CapitalLimited, Bonanza Portfolio Limited, Citibank N.A., Citigroup Wealth Advisors India Private Limited,HDFC Bank Limited, Hongkong & Shanghai Banking Corporation Limited, HSBC Corporate InvestmentSolution Services, ICICI Securities Limited, India Infoline Limited, Karvy Stock Broking Limited, KotakMahindra Bank Limited, Kotak Securities Limited, Motilal Oswal Securities Limited, NJ India InvestPrivate Limited, Reliance Securities Limited, RR Investors Capital Services Private Limited, SBICAPSecurities Limited, Sharekhan Limited, SMC Global Securities Limited, Standard Chartered - STCICapital Markets Ltd., Tom Distribution Services Limited, Yes Bank Limited).
Call centre operations have been extended to cover the entire country. The Asset ManagementCompany has outsourced certain back office services including call centre services to HSBC Operationsand Processing Enterprise (India) Private Limited (HOPE).
7. STATUTORY DETAILSa) The Sponsors are not responsible or liable for any loss resulting from the operation of the Schemes
of the Fund beyond initial contribution of Rs. 1 lakh for setting up the Fund.
b) The price and redemption value of the units, and income from them, can go up as well as downwith fluctuations in the market value of its underlying investments.
c) Full / Abridged Annual Report shall be disclosed on the website at www.assetmanagement.hsbc.com/inand shall be available for inspection at the Head Office of the mutual fund. Present and prospectiveunit holder can obtain copy of the trust deed, the Full / Abridged Annual Report of the Scheme(s),the Annual Report of HSBC Asset Management (India) Private Limited and the text of the relevantScheme(s) at a price.
8. ACKNOWLEDGEMENTSThe Trustees wish to thank the Unitholders of the Schemes for their support throughout the year andalso thank the Government of India, the Securities and Exchange Board of India (SEBI), the ReserveBank of India (RBI) and the Association of Mutual Funds in India (AMFI) for the guidance provided bythem. The Trustees also appreciate the service provided by the Registrar and Transfer Agent, FundAccountant, Custodian, Bankers, Distributors and Brokers. The guidance and services provided bythe Auditors and advocates and the ebullience, sincerity and dedication of the employees of HSBCAsset Management (India) Private Limited is also appreciated.
The Trustees look forward to the continued support of everyone.
For and on behalf of the Board of Trustees of HSBC Mutual Fund
Dilip J. Thakkar
Trustee
MUMBAIJuly 6, 2009
Trustees' ReportFor the year ended March 31, 2009 (Contd...)

8
To the Board of Trustees of
HSBC MUTUAL FUND
1. We have audited the Balance Sheet of HSBC Mutual Fund - HSBC Floating Rate Fund ("TheScheme") as at March 31, 2009, the related Revenue Account for the year ended on that dateannexed thereto and the Cash Flow Statement as applicable for the year ended on that datewhich we have signed under reference to this report. These financial statements are theresponsibility of the Board of Trustees of HSBC Mutual Fund and the Management of HSBC AssetManagement (India) Private Limited (the "Management"). Our responsibility is to express anopinion on these financial statements based on our audit.
2. We have conducted our audit in accordance with auditing standards generally accepted in India.Those standards require that we plan and perform the audit to obtain reasonable assuranceabout whether the financial statements are free of material misstatement. An audit includesexamining, on a test basis, evidence supporting the amounts and disclosures in the financialstatements. Our procedures included confirmation of securities owned and unit capital balancesas at March 31, 2009 by correspondence with the custodian/others and registrar and transferagent respectively. An audit also includes assessing the accounting principles used and significantestimates made by the Management as well as evaluating the overall financial statementpresentation. We believe that our audit provides a reasonable basis for our opinion.
3. We have obtained all the information and explanations which to the best of our knowledge andbelief were necessary for the purpose of our audit. The Balance Sheet, the Revenue Account andthe Cash Flow Statement as applicable referred to above are in agreement with the books ofaccount of the Scheme.
4. In our opinion and to the best of our information and according to the explanations given to us,
(i) The Balance Sheet, the Revenue Account and the Cash Flow Statement as applicable togetherwith the notes thereon give the information required by the Securities and Exchange Boardof India (Mutual Funds) Regulations, 1996 and amendments thereto, as applicable, and alsogive respectively, a true and fair view of the state of affairs of HSBC Mutual Fund - HSBCFloating Rate Fund as at March 31, 2009, its net surplus and its cash flows as applicable forthe year ended on that date.
(ii) The Balance Sheet as at March 31, 2009 and the Revenue Account for the year ended on thatdate, together with the notes thereon have been prepared in all material respects in accordancewith the accounting policies and standards specified in the Ninth Schedule of the Securitiesand Exchange Board of India (Mutual Funds) Regulations, 1996 and amendments thereto asapplicable.
(iii) The method used to value:
(a) non traded debt securities in accordance with the guidelines for valuation of securitiesfor mutual funds dated September 18, 2000 and amendments thereto, as applicable,issued by the Securities and Exchange Board of India and
(b) privately placed debt securities in good faith as at March 31, 2009 as determined byHSBC Asset Management (India) Private Limited under procedures approved by the Boardof Trustees of HSBC Mutual Fund are fair and reasonable.
Partha GhoshPartnerMembership No. F / 55913
For and on behalf ofPRICE WATERHOUSEChartered Accountants
Place : MumbaiDate : July 22, 2009
Auditors' Report

9
Rs. in Lakhs
HSBC FLOATING RATE FUND - LONG TERM PLAN
As at As atMarch 31, 2009 March 31, 2008
LIABILITIES1 Unit Capital 39,160.20 6,200.83
2 Reserves & Surplus2.1 Unit Premium Reserves 2,722.86 98.222.2 Unrealised Appreciation Reserve 29.05 –2.3 Other Reserves 3,532.21 645.10
3 Loans & Borrowings – –
4 Current Liabilities & Provisions4.1 Provision for doubtful Income/Deposits – –4.2 Other Current Liabilities & Provisions 3,395.36 16.37
TOTAL 48,839.68 6,960.52
ASSETS1 Investments1.1. Listed Securities:1.1.1 Equity Shares – –1.1.2 Preference Shares – –1.1.3 Equity Linked Debentures – –1.1.4 Other Debentures & Bonds 532.86 –1.1.5 Securitised Debt securities – –1.2 Securities Awaited Listing:1.2.1 Equity Shares – –1.2.2 Preference Shares – –1.2.3 Equity Linked Debentures – –1.2.4 Other Debentures & Bonds – –1.2.5 Securitised Debt securities – –1.3 Unlisted Securities:1.3.1 Equity Shares – –1.3.2 Preference Shares – –1.3.3 Equity Linked Debentures – –1.3.4 Other Debentures & Bonds 348.16 –1.3.5 Securitised Debt securities 1,331.57 1,497.97
1.4 Government Securities – –1.5 Treasury Bills – –1.6 Commercial Paper 44,790.02 2,041.941.7 Certificate of Deposits 196.45 3,237.971.8 Bill Rediscounting – –1.9 Units of Domestic Mutual Fund – –1.10 Foreign Securities – –
Total Investments 47,199.06 6,777.88
2 Deposits 25.10 25.10
3 Other Current Assets3.1 Cash & Bank Balance 5.86 15.473.2 CBLO/ Reverse Repo Lending 1,520.03 129.013.3 Others 89.63 13.06
4 Deferred Revenue Expenditure – –(to the extent not written off)
TOTAL 48,839.68 6,960.52
Notes to Accounts - Annexure I
Abridged Balance Sheet as at March 31, 2009

10
Rs. in Lakhs
HSBC FLOATING RATE FUND - SHORT TERM PLAN
As at As atMarch 31, 2009 March 31, 2008
LIABILITIES1 Unit Capital 8,405.84 13,599.32
2 Reserves & Surplus2.1 Unit Premium Reserves (53.05) 3.462.2 Unrealised Appreciation Reserve – –2.3 Other Reserves 431.74 391.03
3 Loans & Borrowings – –
4 Current Liabilities & Provisions4.1 Provision for doubtful Income/Deposits – –4.2 Other Current Liabilities & Provisions 44.82 36.36
TOTAL 8,829.35 14,030.17
ASSETS1 Investments1.1. Listed Securities:1.1.1 Equity Shares – –1.1.2 Preference Shares – –1.1.3 Equity Linked Debentures – –1.1.4 Other Debentures & Bonds – 3,006.521.1.5 Securitised Debt securities – –1.2 Securities Awaited Listing:1.2.1 Equity Shares – –1.2.2 Preference Shares – –1.2.3 Equity Linked Debentures – –1.2.4 Other Debentures & Bonds – –1.2.5 Securitised Debt securities – –1.3 Unlisted Securities:1.3.1 Equity Shares – –1.3.2 Preference Shares – –1.3.3 Equity Linked Debentures – –1.3.4 Other Debentures & Bonds – –1.3.5 Securitised Debt securities – 999.75
1.4 Government Securities – –1.5 Treasury Bills – –1.6 Commercial Paper – 4,764.451.7 Certificate of Deposits – 4,858.351.8 Bill Rediscounting – –1.9 Units of Domestic Mutual Fund – –1.10 Foreign Securities – –
Total Investments – 13,629.07
2 Deposits 50.17 50.17
3 Other Current Assets3.1 Cash & Bank Balance 53.47 58.623.2 CBLO/ Reverse Repo Lending 8,724.47 93.903.3 Others 1.24 198.41
4 Deferred Revenue Expenditure – –(to the extent not written off)
TOTAL 8,829.35 14,030.17
Notes to Accounts - Annexure I
Abridged Balance Sheet as at March 31, 2009 (Contd...)

11
Rs. in Lakhs
HSBC FLOATING RATE FUND - LONG TERM PLAN
Current PreviousYear ended Year ended
March 31, 2009 March 31, 2008
1 INCOME1.1 Dividend – –1.2 Interest 2,223.76 955.601.3 Realised Gain / (Loss) on Foreign Exchange Transactions – –1.4 Realised Gains / (Losses) on Interscheme sale of
investments 5.89 2.251.5 Realised Gains / (Losses) on External sale / redemption
of investments 155.87 24.051.6 Realised Gains / (Losses) on Derivative Transactions – –1.7 Other Income (0.74) –
(A) 2,384.78 981.902 EXPENSES2.1 Management fees 80.66 34.172.2 Service tax on Management fees ** – –2.3 Transfer agents fees and expenses 16.92 5.282.4 Custodian fees 4.55 2.312.5 Trusteeship fees 0.11 0.022.6 Commission to Agents * – –2.7 Marketing & Distribution expenses 54.98 28.782.8 Audit fees 0.25 0.252.9 Other operating expenses 2.07 0.832.10 Expenses to be Reimbursed by the Investment Manager (10.63) (4.55)
(B) 148.91 67.093 NET REALISED GAINS / (LOSSES)
FOR THE YEAR / PERIOD (A - B = C) 2,235.87 914.814 Change in Unrealised Depreciation
in value of investments (D) 6.42 0.215 NET GAINS / (LOSSES)
FOR THE YEAR / PERIOD [E = (C-D)] 2,229.45 914.606 Change in unrealised appreciation
in the value of investments (F) 29.05 (5.48)7 NET SURPLUS / (DEFICIT)
FOR THE YEAR / PERIOD (E + F = G) 2,258.50 909.12
7.1 Add: Balance transfer from Unrealised Appreciation Reserve – 5.487.2 Less: Balance transfer to Unrealised Appreciation Reserve 29.05 –7.3 Add / (Less): Equalisation 2,450.75 (89.41)7.4 Transfer from Reserve Fund 23.13 31.977.5 Transfer from Unit Premium Reserve – –
8 TOTAL 4,703.33 857.169 Dividend Appropriation9.1 Income Distributed during the year / period 1,493.42 405.429.2 Tax on income distributed during the year / period 299.67 78.1910 Retained Surplus / (Deficit)
carried forward to Balance Sheet 2,910.24 373.55
Notes to Accounts - Annexure I* Commission to Agents is included in Marketing & Distribution Expenses.** Service Tax on Management Fees is included in Other Operating Expenses.
Abridged Revenue Account for the year ended March 31, 2009

12
Abridged Revenue Account for the year endedMarch 31, 2009 (Contd...)
Rs. in Lakhs
HSBC FLOATING RATE FUND - SHORT TERM PLAN
Current PreviousYear ended Year ended
March 31, 2009 March 31, 2008
1 INCOME1.1 Dividend – –1.2 Interest 1,091.08 2,139.341.3 Realised Gain / (Loss) on Foreign Exchange Transactions – –1.4 Realised Gains / (Losses) on Interscheme sale of
investments 12.08 5.061.5 Realised Gains / (Losses) on External sale / redemption
of investments 0.24 30.501.6 Realised Gains / (Losses) on Derivative Transactions – –1.7 Other Income (0.01) –
(A) 1,103.39 2,174.902 EXPENSES2.1 Management fees 42.45 76.352.2 Service tax on Management fees ** – –2.3 Transfer agents fees and expenses 6.20 10.342.4 Custodian fees 1.53 3.492.5 Trusteeship fees 0.06 0.062.6 Commission to Agents * – –2.7 Marketing & Distribution expenses 26.30 40.812.8 Audit fees 1.50 2.002.9 Other operating expenses 1.68 3.142.10 Expenses to be Reimbursed by the Investment Manager – –
(B) 79.72 136.193 NET REALISED GAINS / (LOSSES)
FOR THE YEAR / PERIOD (A - B = C) 1,023.67 2,038.714 Change in Unrealised Depreciation
in value of investments (D) – (0.78)5 NET GAINS / (LOSSES)
FOR THE YEAR / PERIOD [E = (C-D)] 1,023.67 2,039.496 Change in unrealised appreciation
in the value of investments (F) – (10.00)7 NET SURPLUS / (DEFICIT)
FOR THE YEAR / PERIOD (E + F = G) 1,023.67 2,029.49
7.1 Add: Balance transfer from Unrealised Appreciation Reserve – 10.007.2 Less: Balance transfer to Unrealised Appreciation Reserve – –7.3 Add / (Less): Equalisation (225.10) (549.20)7.4 Transfer from Reserve Fund 48.71 54.007.5 Transfer from Unit Premium Reserve – –
8 TOTAL 847.28 1,544.299 Dividend Appropriation9.1 Income Distributed during the year / period 590.58 1,236.969.2 Tax on income distributed during the year / period 167.28 350.3710 Retained Surplus / (Deficit)
carried forward to Balance Sheet 89.42 (43.04)
Notes to Accounts - Annexure I* Commission to Agents is included in Marketing & Distribution Expenses.** Service Tax on Management Fees is included in Other Operating Expenses.
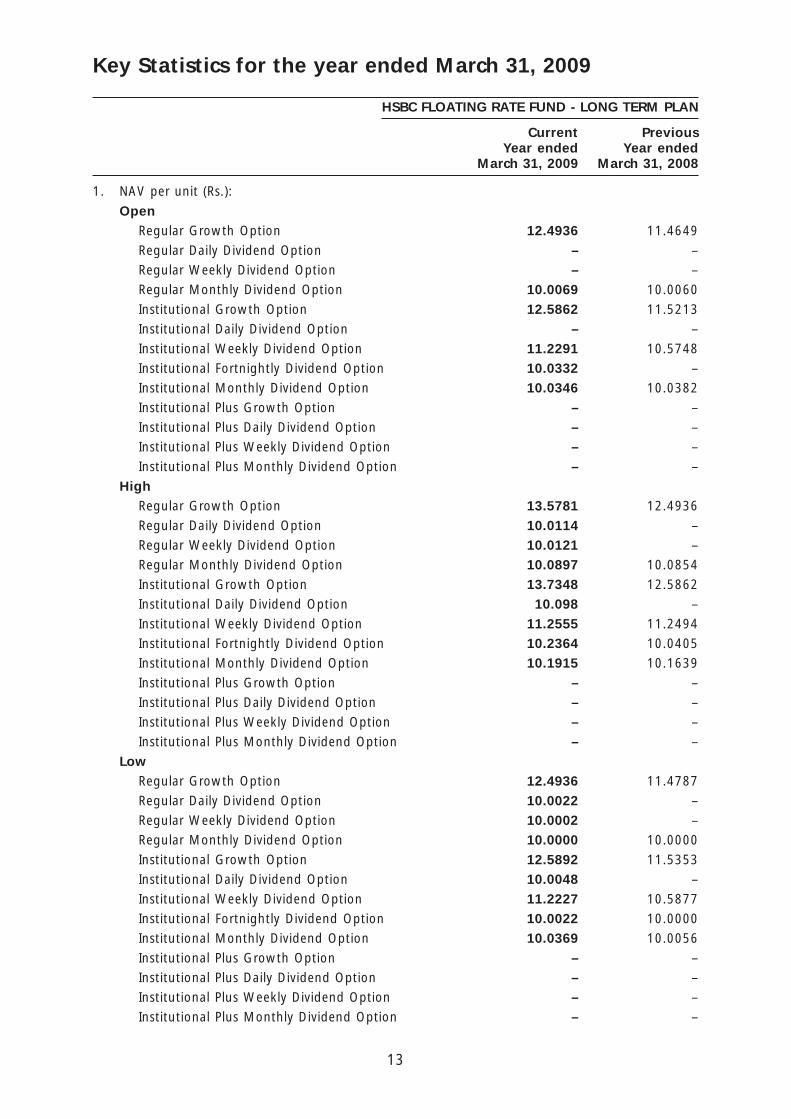
13
HSBC FLOATING RATE FUND - LONG TERM PLAN
Current PreviousYear ended Year ended
March 31, 2009 March 31, 2008
1. NAV per unit (Rs.):
OpenRegular Growth Option 12.4936 11.4649
Regular Daily Dividend Option – –
Regular Weekly Dividend Option – –
Regular Monthly Dividend Option 10.0069 10.0060
Institutional Growth Option 12.5862 11.5213
Institutional Daily Dividend Option – –
Institutional Weekly Dividend Option 11.2291 10.5748
Institutional Fortnightly Dividend Option 10.0332 –
Institutional Monthly Dividend Option 10.0346 10.0382
Institutional Plus Growth Option – –
Institutional Plus Daily Dividend Option – –
Institutional Plus Weekly Dividend Option – –
Institutional Plus Monthly Dividend Option – –
HighRegular Growth Option 13.5781 12.4936
Regular Daily Dividend Option 10.0114 –
Regular Weekly Dividend Option 10.0121 –
Regular Monthly Dividend Option 10.0897 10.0854
Institutional Growth Option 13.7348 12.5862
Institutional Daily Dividend Option 10.098 –
Institutional Weekly Dividend Option 11.2555 11.2494
Institutional Fortnightly Dividend Option 10.2364 10.0405
Institutional Monthly Dividend Option 10.1915 10.1639
Institutional Plus Growth Option – –
Institutional Plus Daily Dividend Option – –
Institutional Plus Weekly Dividend Option – –
Institutional Plus Monthly Dividend Option – –
LowRegular Growth Option 12.4936 11.4787
Regular Daily Dividend Option 10.0022 –
Regular Weekly Dividend Option 10.0002 –
Regular Monthly Dividend Option 10.0000 10.0000
Institutional Growth Option 12.5892 11.5353
Institutional Daily Dividend Option 10.0048 –
Institutional Weekly Dividend Option 11.2227 10.5877
Institutional Fortnightly Dividend Option 10.0022 10.0000
Institutional Monthly Dividend Option 10.0369 10.0056
Institutional Plus Growth Option – –
Institutional Plus Daily Dividend Option – –
Institutional Plus Weekly Dividend Option – –
Institutional Plus Monthly Dividend Option – –
Key Statistics for the year ended March 31, 2009

14
End
Regular Growth Option 13.5781 12.4936
Regular Daily Dividend Option 10.0114 –
Regular Weekly Dividend Option 10.0066 –
Regular Monthly Dividend Option 10.0064 10.0069
Institutional Growth Option 13.7348 12.5862
Institutional Daily Dividend Option 10.0980 –
Institutional Weekly Dividend Option 11.2348 11.2291
Institutional Fortnightly Dividend Option 10.2245 10.0332
Institutional Monthly Dividend Option 10.0614 10.0346
Institutional Plus Growth Option – –
Institutional Plus Daily Dividend Option – –
Institutional Plus Weekly Dividend Option – –
Institutional Plus Monthly Dividend Option – –
2. Closing Assets Under Management (Rs. in Lakhs)
End 45,444 6,944
Average (AAuM)1 27,867 10,609
3. Gross income as % of AAuM2 8.56% 9.26%
4. Expense Ratio:
a. Total Expense as % of AAuM (planwise)
Regular Growth Option 0.93% 0.80%
Regular Daily Dividend Option 0.93% –
Regular Weekly Dividend Option 0.93% –
Regular Monthly Dividend Option 0.93% 0.80%
Institutional Growth Option 0.45% 0.55%
Institutional Daily Dividend Option 0.45% –
Institutional Weekly Dividend Option 0.45% 0.55%
Institutional Fortnightly Dividend Option 0.45% 0.26%
Institutional Monthly Dividend Option 0.45% 0.55%
Institutional Plus Growth Option – –
Institutional Plus Daily Dividend Option – –
Institutional Plus Weekly Dividend Option – –
Institutional Plus Monthly Dividend Option – –
b. Management Fee as % of AAuM (planwise)
Regular Growth Option 0.26% 0.37%
Regular Daily Dividend Option 0.26% –
Regular Weekly Dividend Option 0.26% –
Key Statistics for the year ended March 31, 2009 (Contd...)
HSBC FLOATING RATE FUND - LONG TERM PLAN
Current PreviousYear ended Year ended
March 31, 2009 March 31, 2008

15
Regular Monthly Dividend Option 0.26% 0.37%
Institutional Growth Option 0.23% 0.32%
Institutional Daily Dividend Option 0.23% –
Institutional Weekly Dividend Option 0.23% 0.32%
Institutional Fortnightly Dividend Option 0.23% 0.12%
Institutional Monthly Dividend Option 0.23% 0.27%
Institutional Plus Growth Option 0.23% –
Institutional Plus Daily Dividend Option 0.23% –
Institutional Plus Weekly Dividend Option 0.23% –
Institutional Plus Monthly Dividend Option 0.23% –
5. Net Income as a percentage of AAuM3 8.02% 8.62%
6. Portfolio turnover ratio4 – –
7. Total Dividend per unit distributed during the year /period (planwise)
Retail
Regular Daily Dividend Option 0.3790 –
Regular Weekly Dividend Option 0.0380 –
Regular Monthly Dividend Option 0.7322 0.7545
Institutional Daily Dividend Option 0.3012 –
Institutional Weekly Dividend Option 0.8547 0.2798
Institutional Fortnightly Dividend Option 0.5315 0.1990
Institutional Monthly Dividend Option 0.7499 0.3656
Institutional Plus Daily Dividend Option – –
Institutional Plus Weekly Dividend Option – –
Institutional Plus Monthly Dividend Option – –
Corporate
Regular Daily Dividend Option 0.3530 –
Regular Weekly Dividend Option 0.0354 –
Regular Monthly Dividend Option 0.6815 0.7023
Institutional Daily Dividend Option 0.3188 –
Institutional Weekly Dividend Option 0.7955 0.2604
Institutional Fortnightly Dividend Option 0.5601 0.3102
Institutional Monthly Dividend Option 0.6979 0.7280
Institutional Plus Daily Dividend Option – –
Institutional Plus Weekly Dividend Option – –
Institutional Plus Monthly Dividend Option – –
HSBC FLOATING RATE FUND - LONG TERM PLAN
Current PreviousYear ended Year ended
March 31, 2009 March 31, 2008
Key Statistics for the year ended March 31, 2009 (Contd...)
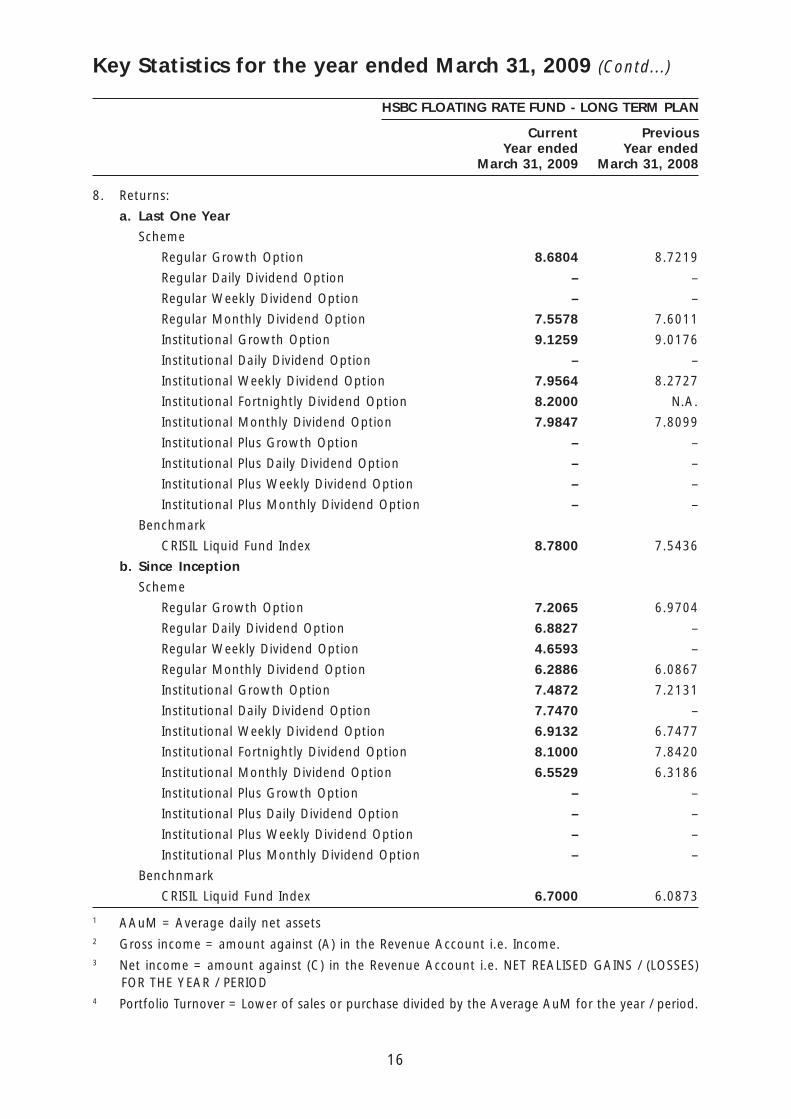
16
8. Returns:
a. Last One Year
Scheme
Regular Growth Option 8.6804 8.7219
Regular Daily Dividend Option – –
Regular Weekly Dividend Option – –
Regular Monthly Dividend Option 7.5578 7.6011
Institutional Growth Option 9.1259 9.0176
Institutional Daily Dividend Option – –
Institutional Weekly Dividend Option 7.9564 8.2727
Institutional Fortnightly Dividend Option 8.2000 N.A.
Institutional Monthly Dividend Option 7.9847 7.8099
Institutional Plus Growth Option – –
Institutional Plus Daily Dividend Option – –
Institutional Plus Weekly Dividend Option – –
Institutional Plus Monthly Dividend Option – –
Benchmark
CRISIL Liquid Fund Index 8.7800 7.5436
b. Since Inception
Scheme
Regular Growth Option 7.2065 6.9704
Regular Daily Dividend Option 6.8827 –
Regular Weekly Dividend Option 4.6593 –
Regular Monthly Dividend Option 6.2886 6.0867
Institutional Growth Option 7.4872 7.2131
Institutional Daily Dividend Option 7.7470 –
Institutional Weekly Dividend Option 6.9132 6.7477
Institutional Fortnightly Dividend Option 8.1000 7.8420
Institutional Monthly Dividend Option 6.5529 6.3186
Institutional Plus Growth Option – –
Institutional Plus Daily Dividend Option – –
Institutional Plus Weekly Dividend Option – –
Institutional Plus Monthly Dividend Option – –
Benchnmark
CRISIL Liquid Fund Index 6.7000 6.0873
1 AAuM = Average daily net assets2 Gross income = amount against (A) in the Revenue Account i.e. Income.3 Net income = amount against (C) in the Revenue Account i.e. NET REALISED GAINS / (LOSSES)
FOR THE YEAR / PERIOD4 Portfolio Turnover = Lower of sales or purchase divided by the Average AuM for the year / period.
Key Statistics for the year ended March 31, 2009 (Contd...)
HSBC FLOATING RATE FUND - LONG TERM PLAN
Current PreviousYear ended Year ended
March 31, 2009 March 31, 2008

17
HSBC FLOATING RATE FUND - SHORT TERM PLAN
Current PreviousYear ended Year ended
March 31, 2009 March 31, 2008
1. NAV per unit (Rs.):
OpenRegular Growth Option 12.4236 11.4818
Regular Daily Dividend Option 10.0000 10.0000
Regular Weekly Dividend Option 10.0079 10.0064
Regular Monthly Dividend Option – –
Institutional Growth Option 12.5158 11.5382
Institutional Daily Dividend Option 10.0368 10.0159
Institutional Weekly Dividend Option 10.0562 10.0356
Institutional Fortnightly Dividend Option – –
Institutional Monthly Dividend Option 10.0658 10.0276
Institutional Plus Growth Option 10.6182 –
Institutional Plus Daily Dividend Option 10.0262 10.0262
Institutional Plus Weekly Dividend Option 10.0098 –
Institutional Plus Monthly Dividend Option – –
HighRegular Growth Option 13.3675 12.4236
Regular Daily Dividend Option 10.0000 10.0048
Regular Weekly Dividend Option 10.0330 10.0229
Regular Monthly Dividend Option – –
Institutional Growth Option 13.5003 12.5158
Institutional Daily Dividend Option 10.0623 10.0368
Institutional Weekly Dividend Option 10.5050 10.0701
Institutional Fortnightly Dividend Option – –
Institutional Monthly Dividend Option 10.1958 10.1383
Institutional Plus Growth Option 11.4592 10.6182
Institutional Plus Daily Dividend Option 10.0262 10.0310
Institutional Plus Weekly Dividend Option 10.0500 10.0227
Institutional Plus Monthly Dividend Option – –
LowRegular Growth Option 12.4236 11.4818
Regular Daily Dividend Option 9.9996 9.9998
Regular Weekly Dividend Option 10.0002 10.0008
Regular Monthly Dividend Option – –
Institutional Growth Option 12.5158 11.5382
Institutional Daily Dividend Option 10.0368 10.0131
Institutional Weekly Dividend Option 10.0508 10.0295
Institutional Fortnightly Dividend Option – –
Institutional Monthly Dividend Option 10.0607 10.0193
Institutional Plus Growth Option 10.6182 10.0000
Institutional Plus Daily Dividend Option 9.9998 10.0261
Institutional Plus Weekly Dividend Option 10.0042 10.0000
Institutional Plus Monthly Dividend Option – –
Key Statistics for the year ended March 31, 2009 (Contd...)

18
Key Statistics for the year ended March 31, 2009 (Contd...)
End
Regular Growth Option 13.3675 12.4236
Regular Daily Dividend Option 10.0000 10.0000
Regular Weekly Dividend Option 10.0205 10.0079
Regular Monthly Dividend Option – –
Institutional Growth Option 13.5003 12.5158
Institutional Daily Dividend Option 10.0623 10.0368
Institutional Weekly Dividend Option 10.4999 10.0562
Institutional Fortnightly Dividend Option – –
Institutional Monthly Dividend Option 10.1350 10.0658
Institutional Plus Growth Option 11.4592 10.6182
Institutional Plus Daily Dividend Option – 10.0262
Institutional Plus Weekly Dividend Option 10.0373 10.0098
Institutional Plus Monthly Dividend Option – –
2. Closing Assets Under Management (Rs. in Lakhs)
End 8,785 13,994
Average (AAuM)1 13,315 25,332
3. Gross income as % of AAuM2 8.29% 8.59%
4. Expense Ratio:
a. Total Expense as % of AAuM (plan wise)
Regular Growth Option 0.70% 0.70%
Regular Daily Dividend Option 0.70% 0.70%
Regular Weekly Dividend Option 0.70% 0.70%
Regular Monthly Dividend Option – –
Institutional Growth Option 0.45% 0.45%
Institutional Daily Dividend Option 0.45% 0.45%
Institutional Weekly Dividend Option 0.45% 0.45%
Institutional Fortnightly Dividend Option – –
Institutional Monthly Dividend Option 0.41% 0.45%
Institutional Plus Growth Option 0.41% 0.50%
Institutional Plus Daily Dividend Option – 0.40%
Institutional Plus Weekly Dividend Option 0.41% 0.08%
Institutional Plus Monthly Dividend Option – –
b. Management Fee as % of AAuM (plan wise)
Regular Growth Option 0.33% 0.32%
Regular Daily Dividend Option 0.33% 0.32%
Regular Weekly Dividend Option 0.33% 0.32%
HSBC FLOATING RATE FUND - SHORT TERM PLAN
Current PreviousYear ended Year ended
March 31, 2009 March 31, 2008

19
Key Statistics for the year ended March 31, 2009 (Contd...)
Regular Monthly Dividend Option 0.33% –
Institutional Growth Option 0.33% 0.18%
Institutional Daily Dividend Option 0.33% 0.18%
Institutional Weekly Dividend Option 0.33% 0.19%
Institutional Fortnightly Dividend Option 0.33% –
Institutional Monthly Dividend Option 0.33% 0.14%
Institutional Plus Growth Option 0.27% 0.14%
Institutional Plus Daily Dividend Option 0.27% 0.21%
Institutional Plus Weekly Dividend Option 0.27% 0.06%
Institutional Plus Monthly Dividend Option 0.27% –
5. Net Income as a percentage of AAuM3 7.69% 8.05%
6. Portfolio turnover ratio4 – –
7. Total Dividend per unit distributed during the year /period (planwise)
Retail
Regular Daily Dividend Option 0.5707 0.6143
Regular Weekly Dividend Option 0.5616 0.6136
Regular Monthly Dividend Option – –
Institutional Daily Dividend Option 0.5738 0.6186
Institutional Weekly Dividend Option 0.2585 0.6206
Institutional Fortnightly Dividend Option – –
Institutional Monthly Dividend Option 0.5431 0.6089
Institutional Plus Daily Dividend Option 0.4615 0.6394
Institutional Plus Weekly Dividend Option 0.5740 0.1189
Institutional Plus Monthly Dividend Option – –
Corporate
Regular Daily Dividend Option 0.2440 0.3061
Regular Weekly Dividend Option 0.2368 0.3052
Regular Monthly Dividend Option – –
Institutional Daily Dividend Option 0.2553 0.3167
Institutional Weekly Dividend Option 0.0775 0.3075
Institutional Fortnightly Dividend Option – –
Institutional Monthly Dividend Option 0.2080 0.2883
Institutional Plus Daily Dividend Option 0.1222 0.3169
Institutional Plus Weekly Dividend Option 0.2484 –
Institutional Plus Monthly Dividend Option – –
HSBC FLOATING RATE FUND - SHORT TERM PLAN
Current PreviousYear ended Year ended
March 31, 2009 March 31, 2008

20
Key Statistics for the year ended March 31, 2009 (Contd...)
8. Returns:
a. Last One Year
Scheme
Regular Growth Option 7.60 8.32
Regular Daily Dividend Option 5.89 6.42
Regular Weekly Dividend Option 5.96 6.44
Regular Monthly Dividend Option – –
Institutional Growth Option 7.87 8.59
Institutional Daily Dividend Option 6.12 6.72
Institutional Weekly Dividend Option 7.15 6.94
Institutional Fortnightly Dividend Option – –
Institutional Monthly Dividend Option 6.24 6.70
Institutional Plus Growth Option 7.92 8.64
Institutional Plus Daily Dividend Option 4.59 6.65
Institutional Plus Weekly Dividend Option 6.24 –
Institutional Plus Monthly Dividend Option –
Benchmark
CRISIL Liquid Fund Index 8.8000 7.5025
b. Since Inception
Scheme
Regular Growth Option 6.8630 8.3161
Regular Daily Dividend Option 5.5818 6.4225
Regular Weekly Dividend Option 5.7512 6.4351
Regular Monthly Dividend Option – –
Institutional Growth Option 7.0725 8.5856
Institutional Daily Dividend Option 5.8327 6.7193
Institutional Weekly Dividend Option 6.0690 6.9353
Institutional Fortnightly Dividend Option – –
Institutional Monthly Dividend Option 5.9019 6.7046
Institutional Plus Growth Option 4.1350 8.6408
Institutional Plus Daily Dividend Option 5.7469 6.6512
Institutional Plus Weekly Dividend Option 5.2948 –
Institutional Plus Monthly Dividend Option – –
Benchnmark
CRISIL Liquid Fund Index 6.7000 6.0832
1 AAuM = Average daily net assets2 Gross income = amount against (A) in the Revenue Account i.e. Income.3 Net income = amount against (C) in the Revenue Account i.e. NET REALISED GAINS / (LOSSES)
FOR THE YEAR / PERIOD4 Portfolio Turnover = Lower of sales or purchase divided by the Average AuM for the year / period.
HSBC FLOATING RATE FUND - SHORT TERM PLAN
Current PreviousYear ended Year ended
March 31, 2009 March 31, 2008

21
Notes to Accounts - Annexure ITo the Abridged Balance Sheet and Revenue Account for the year ended March 31, 2009
HSBC FLOATING RATE FUND
1 Investments:
1.1 It is confirmed that investments of the schemes are registered in the name of the Trustees forthe benefit of the scheme’s unitholders.
1.2 Open Positions of derivatives for Floating Rate Long Term and Floating Rate Short Term Fundsas of March 31, 2009 are NIL. Open Positions of derivatives for Floating Rate Long Term andFloating Rate Short Term Funds as of March 31, 2008 end are NIL.
1.3 There were no investments made in Associates and Group Companies by the schemes for theyears ended March 31, 2009 and March 31, 2008.
1.4 Open positions of Securities Borrowed and / or Lent by the schemes as of the year endedMarch 31, 2009 and March 31, 2008 are NIL.
1.5 NPAs as at years ended March 31, 2009 and March 31, 2008 are NIL.
1.6 Aggregate Unrealised Gain / Loss as at the end of the Financial year 2008 -2009 andpercentage to net assets.
FLOATING RATE - LONG TERM FUND PLAN
Company Amount Percentage to Amount Percentage toName (Rs.) Net Assets (Rs.) Net Assets
2009 2008
NCDs and Bonds Listed / Awaiting Listing
– Appreciation – – – –
– Depreciation 663,800 0.0146% – –
NCDs and Bonds Privately Placed
– Appreciation 837,077 0.0184% – –
– Depreciation – – – –
Asset Backed Securities
– Appreciation 2,068,284 0.0455% – –
– Depreciation – – 21,310 0.0031%
Aggregate Unrealised Gain / Loss at the end of the Financial year ended March 31, 2009 andMarch 31, 2008 for Floating Rate Short Term is Nil.
1.7 The aggregate value of investments purchased and sold (including matured) during the year(excluding accretion of discount of Rs. 135,102,262 and Rs. 81,656,313 for Long Term andShort Term Plan respectively)
Year 2008-2009
Plan Aggregate Purchases Aggregate Sales
Amount Percentage of Amount Percentage of(Rs.) Average Daily (Rs.) Average Daily
Net Assets Net Assets
Long Term Plan 27,141,086,721 794.97% 23,252,509,827 681.08%
Short Term Plan 2,241,718,740 167.79% 3,687,513,072 276.00%
The aggregate value of investments purchased and sold (including matured) during the year(excluding accretion of discount of Rs. 75,902,327 and Rs. 132,020,767 for Long Term andShort Term Plan respectively)

22
Notes to Accounts - Annexure I (Contd...)To the Abridged Balance Sheet and Revenue Account for the year ended March 31, 2009
Year 2007-2008
Plan Aggregate Purchases Aggregate Sales
Amount Percentage of Amount Percentage of(Rs.) Average Daily (Rs.) Average Daily
Net Assets Net Assets
Long Term Plan 5,581,725,904 803.80% 5,573,059,791 802.55%
Short Term Plan 19,300,258,529 1379.20% 20,447,395,247 1461.17%
1.8 Non -Traded securities in the portfolio: Aggregate Value of Equity, Debt & Money MarketInstruments and their percentages to Net assets are as under :
FLOATING RATE - LONG TERM FLOATING RATE - SHORT TERM
2008-2009
Security Category Fair Value Percentage to Fair Value Percentage(Rs.) Net Assets (Rs.) to Net Assets
Debt Instruments 167,973,620 3.70% – –
Money market Instruments 4,498,647,018 98.99% – –
TOTAL 4,666,620,638 102.69% – –
FLOATING RATE - LONG TERM FLOATING RATE - SHORT TERM
2007-2008
Security Category Fair Value Percentage to Fair Value Percentage(Rs.) Net Assets (Rs.) to Net Assets
Debt Instruments 149,797,118 21.57% 400,626,579 28.63%
Money market Instruments 527,991,778 76.03% 962,279,951 68.76%
TOTAL 677,788,896 97.61% 1,362,906,530 97.39%
2 Disclosure under Regulation 25(8) of the Securities and Exchange Board of India (Mutual Funds)Regulations, 1996 as amended for the year ended March 31, 2009 is as under:
Year - 2008-2009
During the year, The Hongkong and Shanghai Banking Corporation Limited, an associate entityof HSBC Asset Management (India) Private Limited was paid collection / bank charges amountingto Rs. 12 and Rs. 1,385 and brokerage amounting to Rs. 955,380 and Rs. 1,557,875 for procuringunit subscriptions for the Long Term and Short Term Plan respectively. The brokerage paid was atrates similar to those offered to other distributors. Further, The Hongkong and Shanghai BankingCorporation Limited, an associate of the Sponsor, is on the panel of bankers with whom HSBCMutual Fund places money on fixed deposits and enters into reverse repo transactions from timeto time at competitive rates.
Year - 2007-2008
During the year, The Hongkong and Shanghai Banking Corporation Limited, an associate entityof HSBC Asset Management (India) Private Limited was paid collection / bank charges amountingto Rs. 2,028 and Rs. 5,324 and brokerage amounting to Rs. 906,455 and Rs. 2,395,738 forprocuring unit subscriptions for the Long Term and Short Term Plan respectively. The brokeragepaid was at rates similar to those offered to other distributors. Further, The Hongkong and ShanghaiBanking Corporation Limited, an associate of the Sponsor, is on the panel of bankers with whomHSBC Mutual Fund places money on fixed deposits and enters into reverse repo transactionsfrom time to time at competitive rates.

23
Notes to Accounts - Annexure I (Contd...)To the Abridged Balance Sheet and Revenue Account for the year ended March 31, 2009
3 None of the Investors held more than 25% of the total net assets of the scheme at the yearsended March 31, 2009 and March 31, 2008.
4 Unit Capital movement during the years ended March 31, 2009 and March 31, 2008.
FLOATING RATE FUND - LONG TERM PLAN
2008-2009
Description Opening Units Subscription Redemption Closing Units Face Value
Regular Growth 7,471,705.625 14,683,385.964 14,793,738.552 7,361,353.037 73,613,530.37
Daily Dividend – 13,574,854.752 8,855,844.960 4,719,009.792 47,190,097.92
Weekly Dividend – 5,879,912.477 10,018.835 5,869,893.642 58,698,936.42
Monthly Dividend 16,372,183.719 45,848,558.548 19,084,089.426 43,136,652.841 431,366,528.41
Institutional Growth 16,920,635.005 459,657,983.206 388,046,287.083 88,532,331.128 885,323,311.28
InstitutionalDaily Dividend – 1,113,238,427.0881,100,776,620.756 12,461,806.332 124,618,063.32
InstitutionalFortnightly Dividend 881,553.972 110,709,121.493 111,045,341.565 545,333.900 5,453,339.00
InstitutionalWeekly Dividend 9,287,147.224 682,636,484.183 474,057,663.435 217,865,967.972 2,178,659,679.72
InstitutionalMonthly Dividend 11,075,077.247 95,585,424.100 95,550,854.951 11,109,646.396 111,096,463.96
FLOATING RATE FUND - SHORT TERM PLAN
2008-2009
Description Opening Units Subscription Redemption Closing Units Face Value
Regular Growth 11,316,444.277 20,562,687.385 23,911,661.581 7,967,470.081 79,674,700.81
Regular Dividend 46,612,712.234 57,564,452.273 78,327,185.292 25,849,979.215 258,499,792.15
Regular Weekly Dividend 21,330,117.806 45,296,245.444 39,725,862.476 26,900,500.774 269,005,007.74
Institutional Growth 2,558,819.389 22,931,458.891 25,393,222.835 97,055.445 970,554.45
InstitutionalDaily Dividend 3,829,950.745 31,051,944.545 27,986,919.437 6,894,975.853 68,949,758.53
InstitutionalWeekly Dividend 10,011,518.785 3,733,494.717 10,304,018.067 3,440,995.435 34,409,954.35
InstitutionalMonthly Dividend 4,094,365.416 1,730,610.437 1,485,479.800 4,339,496.053 43,394,960.53
Institutional Plus Growth 6,400,346.993 117,717,572.514 119,130,587.323 4,987,332.184 49,873,321.84
Institutional PlusDaily Dividend 11,918,438.460 474,478,092.435 486,396,530.895 – –
Institutional PlusWeekly Dividend 17,920,513.941 531,043.585 14,871,010.335 3,580,547.191 35,805,471.91

24
FLOATING RATE FUND - LONG TERM PLAN
2007-2008
Description Opening Units Subscription Redemption Closing Units Face Value
Regular Growth 11,979,972.490 12,020,274.704 16,528,541.569 7,471,705.625 74,717,056.25
Monthly Dividend 27,261,128.013 39,417,479.522 50,306,423.816 16,372,183.719 163,721,837.19
Institutional Growth 3,394,759.592 247,759,497.924 234,233,622.511 16,920,635.005 169,206,350.05
InstitutionalFortnightly Dividend – 7,611,709.241 6,730,155.269 881,553.972 8,815,539.72
InstitutionalWeekly Dividend 581,195.178 100,271,536.552 91,565,584.506 9,287,147.224 92,871,472.24
InstitutionalMonthly Dividend 14,924,217.043 72,380,231.381 76,229,371.177 11,075,077.247 110,750,772.47
FLOATING RATE FUND - SHORT TERM PLAN
2007-2008
Description Opening Units Subscription Redemption Closing Units Face Value
Regular Growth 18,121,480.837 50,607,672.222 57,412,708.782 11,316,444.277 113,164,442.77
Regular Dividend 88,762,485.117 120,715,115.136 162,864,888.019 46,612,712.234 466,127,122.34
Regular Weekly Dividend 32,060,317.353 36,527,073.905 47,257,273.452 21,330,117.806 213,301,178.06
Institutional Growth 10,001,190.034 96,529,489.848 103,971,860.493 2,558,819.389 25,588,193.89
InstitutionalDaily Dividend 18,599,814.007 185,522,608.972 200,292,472.234 3,829,950.745 38,299,507.45
InstitutionalWeekly Dividend 17,912,858.481 6,657,131.204 14,558,470.900 10,011,518.785 100,115,187.85
InstitutionalMonthly Dividend 12,533,989.575 27,498,847.415 35,938,471.574 4,094,365.416 40,943,654.16
Institutional Plus Growth – 1,133,178,905.779 1,126,778,558.786 6,400,346.993 64,003,469.93
Institutional PlusDaily Dividend 37,681,513.207 1,940,209,333.258 1,965,972,408.005 11,918,438.460 119,184,384.60
Institutional PlusWeekly Dividend – 27,926,417.823 10,005,903.882 17,920,513.941 179,205,139.41
InstitutionalMonthly Dividend – – – – –
Notes to Accounts - Annexure I (Contd...)To the Abridged Balance Sheet and Revenue Account for the year ended March 31, 2009
5 Prior year amounts have been re-grouped and reclassified, wherever applicable, to confirm tocurrent year’s presentation.
6 No contingent liabilities for Floating Rate Long Term and Floating Rate Short Term funds for theyears ended March 31, 2009 and March 31, 2008.
7 Expenses other than Management Fees are Inclusive of Service Tax where applicable.8 The Annual Accounts of the Schemes prepared in accordance with the accounting policies and
standards specified in the Ninth Schedule of The Securities and Exchange Board of India (MutualFunds) Regulations, 1996 has been approved by the Board of Directors of HSBC Asset Management(India) Private Limited and The Board of Trustees of HSBC Mutual Fund at their meeting held onJuly 22, 2009. The audit report attached herewith refers to the said annual accounts. The aforesaidabridged accounts are an extract of the Annual Accounts and are prepared in accordance withSEBI Circular No. IMD/Cir 8/132968/2008 dated July 24, 2008.

25
DISCLAIMERSThe content of this report has been prepared by HSBC Asset Management (India) Private Limited(HSBC) for information purposes only and should not be construed as an offer or solicitation of anoffer for purchase of any of the funds of HSBC Mutual Fund. The information is for general informationonly and does not have regard to specific investment objectives, financial situation and the particularneeds of any specific person who may receive this information. Investments in mutual funds inherentlyinvolve risks and investors should read the relevant documents / information for details and riskfactors and consult their legal, tax and financial advisors before investing. Investors should understandthat statements made herein regarding future prospects may not be realised. Neither this documentnor the units of HSBC Mutual Fund have been registered in any jurisdiction. The distribution of thisdocument in certain jurisdictions may be restricted or totally prohibited and accordingly, personswho come into possession of this document are required to inform themselves about, and to observe,any such restrictions.
Investors may obtain Statement of Additional Information, Combined Scheme Information Documentand Common Key Information Memorandums along with application forms from the office of HSBCMutual Fund, 314, D. N. Road, Fort, Mumbai 400 001. Tel: 022-6666 8819.
Statutory Details:HSBC Mutual Fund has been set up as a trust by HSBC Securities and Capital Markets (India) PrivateLimited (liability restricted to the corpus of Rs. 1 lakh). The Sponsor / associates of the Sponsor/AssetManagement Company (AMC) are not responsible or liable for any loss or shortfall resulting from theoperation of the Schemes. The Trustees of HSBC Mutual Fund have appointed HSBC Asset Management(India) Private Limited as the Investment Manager.
Risk Factors:All investments in mutual funds and securities are subject to market risks and the Net Asset Value(NAV) of the Scheme(s) may go up or down depending on the factors and forces affecting the securitiesmarkets. There can be no assurance that the objectives of the Scheme(s) will be achieved. Pastperformance of the Sponsor, AMC, Mutual Fund or any associates of the Sponsor/AMC does notindicate the future performance of the Scheme(s) of the Mutual Fund. HSBC Floating Rate Fund(HFRF) is the names of the Scheme and does not in any manner indicate the quality of the Scheme orits future prospects or returns.
Terms of Issue:Units of the Scheme(s) are being offered at NAV based prices, subject to the prevailing loads. TheAMC calculates and publishes NAVs and offers for sale, redemption and switch outs, units of theScheme(s) on all Business Days, at the Applicable NAV for all Schemes (at least once a week, i.e.,every Wednesday and daily during the period of redemption in case of HSCF). HUOF, HSCF & HFTSwill not be open for ongoing subscriptions / switch ins. HUOF & HSCF would be available for sale onan ongoing basis (after a period of 3 years from the date of allotment). Conversion of HUOF & HSCFto an open-ended scheme will be done only after the balance unamortized amount has been fullyrecovered from the Scheme. Units can be redeemed / switched out on every Business Day at NAVbased prices, subject to prevailing exit loads. In case of HSCF, units can be redeemed / switched outon a monthly basis on the stipulated date i.e. last 3 business days of every month at NAV basedprices, subject to provisions of exit load, if any and recovery of balance proportionate unamortizedNFO expenses.
Load Structure (includes SIP/STP):HFRF-LT :
Entry - Nil.
Exit - 0.25% for investments / switch-in Regular Option, if redeemed / switched out within 3 monthsfrom date of Investment. Daily dividend sub-option under Regular and Institutional Option - Nil
HFRF-ST :
Entry & Exit - Nil.
Consult the nearest investor service centre for details.

26
The entry/exit load set forth above is subject to change at the discretion of the AMC and suchchanges shall be implemented prospectively.
Mutual Fund investments are subject to market risks. Please read the Statement of AdditionalInformation and Scheme Information Document carefully before investing.
Value Research Online DisclaimerValue Research Fund Ratings: Value Research Fund Ratings are a composite measure of historical risk-adjusted returns. In the case of equity funds this rating is based on the average monthly returns forthe last 3-year and 5-year period. These ratings do not take into account any entry or exit load.
Value Research Fund Ratings are subject to change every month. Current Fund Ratings are as onMarch 31, 2009. 142 open-ended Equity: Diversified Funds were rated. The Rating is based on primarydata provided by respective funds; Value Research does not guarantee the accuracy. Ranking Entity:Value Research Online.
ICRA Online Ranking MethodologyHSBC Monthly Income - Savings Plan has been ranked as a Five Star Fund in the category of 'OpenEnded Marginal Equity' schemes for its 3 year performance till December 31, 2008.
The rank is an outcome of an objective and comparative analysis against various parameters, including:risk adjusted return, fund size, company concentration, portfolio turnover and liquidity. The rankingmethodology did not take into account entry and exit loads imposed by the Fund. There were 27schemes considered in 'Open Ended Marginal Equity' category for the ranking exercise. The rank isneither a certificate of statutory compliance nor any guarantee on the future performance of HSBCMonthly Income - Savings Plan. Ranking Source & Publisher: ICRA Online Limited.
CRISIL Ranking MethodologyThe selection for the awards is based on the CRISIL FundServices' Composite Performance Ranking(CRISIL~CPR) methodology.
The CRISIL Composite Performance Ranking (CRISIL~CPR) is a quarterly ranking of mutual fund schemesbased on two year performance (excepting for the liquid and short term debt categories where a oneyear performance horizon is considered). The methodology is based on global best practices,customized to account for Indian market nuances. Over time, the rankings have become the industrystandard with good acceptance among Investors, Fund Intermediaries, Asset Management Companies,etc. The performance criteria covers not only risk adjusted returns, which are historical, but also theportfolio constitution to make the analysis forward looking.
CRISIL DisclaimerThe overall ranking is assigned to the scheme based on its weighted average score on a range ofparameters: Superior Return Score, Concentration, Liquidity, Asset Quality - Measures the creditquality of the portfolio, Average Maturity and Asset Size. HSBC MIP - Savings was the only schemethat won the CNBC TV18 - CRISIL Mutual Fund of the Year Award in the Category - Monthly IncomePlans - Aggressive. In total 13 schemes were eligible for the award universe. Schemes present in allfour quarterly CRISIL CPRs were considered for the award. The award is based on consistency of thescheme's performance in the four quarterly CRISIL CPR rankings released during the calendar year2008. The individual CRISIL CPR parameter scores averaged for the four quarters were further multipliedby the parameter weights as per the CRISIL CPR methodology to arrive at the final scores. A detailedmethodology of the CRISIL CPR is available at www.crisil.com. Past performance is no guarantee offuture results. Rankings and Award Source: CRISIL Fund Services, CRISIL Ltd. HSBC Monthly Income -Savings Plan has been ranked as a Five Star Fund in the category of 'Open Ended Marginal Equity'schemes for its 3 year performance till December 31, 2008. The rank is an outcome of an objectiveand comparative analysis against various parameters, including: risk adjusted return, fund size,company concentration, portfolio turnover and liquidity. The ranking methodology did not take intoaccount entry and exit loads imposed by the Fund. There were 27 schemes considered in 'OpenEnded Marginal Equity' category for the ranking exercise. The rank is neither a certificate of statutorycompliance nor any guarantee on the future performance of HSBC Monthly Income - Savings Plan.Ranking Source & Publisher: ICRA Online Limited.

27
This page is intentionally left blank.

This page is intentionally left blank.

Issued by HSBC Asset Management (India) Private Limited
HSBC Global Asset Management
HSBC Cash FundAn open-ended liquid Scheme
Abridged Annual Report 2008 - 2009

1
Dear Investor,
We thank you for investing with HSBC Mutual Fund. We are pleased to inform you that HSBCMutual Fund has won prestigious awards* this year at various forums in India.
The awards* won by our schemes in India are
� HSBC Equity Fund has been included in the 5 star rated fund category (“Top rated mutualfunds” by Value Research online) in March, 2009.
� Five-stars indicate that a fund is in the top 10 per cent of its category in terms ofhistorical risk-adjusted returns.
� ICRA Mutual Fund Awards 2009
� HSBC MIP - Savings has been ranked a 5-Star Fund by ICRA Online indicating performanceamong the top 10% in the category of 'Open Ended Marginal Equity' for 3 yearperformance ending 31 December, 2008.
� CNBC TV18 - CRISIL Mutual Fund Awards 2008
� HSBC MIP - Savings was awarded the CNBC TV18 - CRISIL Mutual Fund of the YearAward for the year 2008 in the Monthly Income Plans - Aggressive Category.
(Past performance is no guarantee of future results. * Please refer to Ranking methodologyand disclaimer mentioned at the end of the Abridged Annual Report for the year endedMarch 31, 2009).
At the global level, the HSBC Group won several awards at Euromoney's Awards for Excellence2009. The top awards that HSBC won were the Best Global Bank and the Best Global DebtHouse. It was also honoured as the Best Debt House in 8 locations including Asia and the Bestat Risk Management in Asia. (Past performance may or may not be sustained in the future andis no guarantee of future results). We continue to be one of the leading players in emergingmarkets and remain committed to our asset management business in India.
HSBC Asset Management (India) Private Limited including the mutual fund business as well asthe PMS business (including EPFO money deployed till date) manages assets of about Rs. 26280Crores as at 30 June, 2009. The core to our winning strategy is our endeavour to deliverconsistent performance over the medium to long term for our investors in a risk controlledenvironment and aim for consistent wealth creation under varying market conditions. Throughour product range, we aim to be true to our reputation in India of being a provider ofinternational quality investment products and services.
We remain committed to our philosophy of aiming for consistent wealth creation and serviceexcellence and look forward to your continued investments in HSBC Mutual Fund.
Yours sincerely,
VikramaadityaChief Executive OfficerHSBC Asset Management (India) Private Limited

2
SPONSORHSBC Securities and Capital Markets (India) Private LimitedRegd. Office: 52/60, Mahatma Gandhi Road, Fort, Mumbai 400 001.
TRUSTEEBoard of TrusteesOffice: 314, D. N. Road, Fort, Mumbai 400 001.
ASSET MANAGEMENT COMPANYHSBC Asset Management (India) Private LimitedCorp. & Regd. Office: 314, D. N. Road, Fort, Mumbai 400 001.
CUSTODIANJP Morgan Chase BankCorp. & Regd. Office: Mafatlal Centre, 9th Floor, Nariman Point, Mumbai - 400 021.
AUDITORS TO THE SCHEMEPrice WaterhouseChartered Accountants252, Veer Savarkar Marg, Shivaji Park, Dadar (West), Mumbai - 400 028.
LEGAL ADVISORSBharucha & Partners4th Floor, Cecil Court, Mahakavi Bhushan Marg, Colaba, Mumbai - 400 039.
REGISTRAR & TRANSFER AGENTSComputer Age Management Services (P) Ltd. (CAMS)Rayala Towers, Tower I, III Floor, 158 Anna Salai, Chennai - 600 002.
BOARD OF TRUSTEESMr. N. P. Gidwani - Chairman
Dr. Rudolf ApenbrinkMr. Nasser MunjeeMr. Manu TandonMr. Mehli MistriMr. Dilip J. Thakkar
BOARD OF DIRECTORSMs. Naina Lal Kidwai - Chairman
Mr. Ayaz EbrahimMr. S. P. Mustafa**Mr. Vithal PalekarMs. Kishori J. Udeshi*Mr. Vikramaaditya - Chief Executive Officer***
* Ms. Kishori Udeshi has been appointed as a Director with effect from 14 January 2009 andMr. Jagjit Lal Pasricha has resigned as a Director with effect from 19 January 2009.
** Mr. S. P. Mustafa has been appointed as a Director with effect from 2 September 2008 andMr. Nawshir Khurody has resigned as a Director with effect from 1 September 2008.
*** Mr. Vikramaaditya has been appointed as the Chief Executive Officer with effect from 16 July 2008and Mr. Sanjay Prakash has resigned as the Chief Executive Officer with effect from 16 July 2008.

3
Trustees' ReportFor the year ended March 31, 2009
The Trustees present the seventh report and the audited financial statements of the Schemes ofHSBC Mutual Fund (the "Fund"), for the year ended March 31, 2009.
1. SCHEME PERFORMANCE, FUTURE OUTLOOK AND OPERATIONS OF THE SCHEME
a) Operations and Performance of the Scheme
HSBC Cash Fund (HCF) - an open-ended Liquid Scheme
HCF is a liquid scheme, aims to provide reasonable returns, commensurate with low risk while providinga high level of liquidity, through a portfolio of money market and debt securities. However, there canbe no assurance that the scheme objective can be realised.
The net assets of HSBC Cash Fund amounted to Rs. 492.65 crores as at March 31, 2009 as comparedto Rs. 1332.08 crores as at March 31, 2008. 10.15% were invested in debt and money marketinstruments, 86.19% of the net assets were invested in reverse repos and 3.66% in net currentassets as at March 31, 2009.
HCF has underperformed the benchmark as incremental investments over the last few months havebeen made very conservatively in line with the general risk environment.
Date of Inception : 4 December, 2002 Compounded Annualized Returns (%)
Schemes (P2P) 1 Year 3 Years 5 Years Since Inception
HSBC Cash Fund - Regular - Growth 7.24 7.29 6.38 6.14
CRISIL Liquid Fund Index 8.80 7.56 6.33 5.94
Past performance may or may not be sustained in future. 'Since inception' returns are calculated onRs. 10 invested at inception. Calculations are based on Growth NAVs.
b) Market Overview & Outlook
MARKET OVERVIEW(as furnished by HSBC Asset Management (India) Private Limited)
Equity Market Overview
The financial year ended 31 March, 2009 was a highly eventful one with long standing institutionsdisappearing from the landscape in the whirlwind of the sub-prime crisis and derivative losses. Theyear can be split into three phases - the first from April 2008 till when Lehman Brothers filed forbankruptcy, which saw a blowout commodity rally (crude oil nudged close to USD 144/barrel) andthe sub-prime situation turning progressively worse. The United States (US) Government / FederalReserve bailed out major institutions thought to be critical to the functioning of the financial system.The second phase from September 2008 till January 2009 saw a spate of bankruptcies most notablyLehman Brothers which saw the appearance of an acute level of risk aversion pushing the creditmarkets into a gridlock. This phase also coincided with the fiscal / monetary stimuli by variousgovernments to take the credit crisis head on. Globally, markets stabilized around their October2008 lows and a semblance of normality started re-appearing in financial markets in this period. Thethird phase from February 2009 onwards witnessed a sharp rally as a weakening US Dollar spewedmoney into emerging markets. The sensex fell by 38% during the financial year.
For the financial year 2009, the popular indices viz. BSE Sensex and CNX Nifty were down 37.94%and 36.19% respectively. The BSE Midcap (54.01)% and the broader indices like BSE 200 (40.98)%and BSE 500 (42.77)% also reflected the correction across the markets. Within sectoral indices thebest performing indices were BSE FMCG (11.08)% and BSE Oil and Gas (29.58)% while the worstperforming indices were BSE Realty (79.37)%, due to the high leverage on the balance sheets, BSEMetals (58.67)%, due to slowdown in global growth and BSE Consumer Durables (58.14)% and BSECapital goods (53.84%).

4
In a year that saw sell-off across emerging markets, FIIs were net sellers of the tune USD 10.4 billionin the Indian equity markets while Domestic Institutional Investors (Insurance & Mutual Funds) werebuyers to the tune of USD 13.1 billion. Further, FIIs were net sellers in the derivative markets ashedge funds, and p-notes unwound positions in a rapidly deleveraging world. Thus, sentimentremained negative as few US based investment banks filed for bankruptcy in the midst of the liquidityand credit crisis and safety took precedence over growth.
Debt Market Overview
Two contrarian forces one inflationary and the other deflationary had been in play since 2007: Onthe one hand strong demand from emerging economies were leading commodities higher and fuellinginflation, while on the other the housing led credit crisis in the US was starting to exert a deflationaryforce. The first force was dominant till early July 2008 leading commodity prices to fresh peaks andinflation to multi year highs. Since then, however, the second force took hold with the result thatcommodity prices fell sharply from the top, growth and inflation numbers toppled worldwide, andcentral bankers shifted focus to achieving financial stability and protecting growth.
The financial crisis hit the domestic markets towards September 2008, leading to acute disruption inmoney markets. The Reserve Bank of India (RBI) acted proactively cutting the cash reserve ratio (CRR)by an unprecedented 400 bps between September 2008 and January 2009. Similarly, the reverserepo rate had been cut by 275 bps since October 2008 while the repo rate had been cut by 425 bpsover the same period.
Bond market yields fell in line with the unprecedented monetary easing up till the first week ofJanuary 2009. Thereon, supply pressures on bond markets rose as a result of government fiscalslippages aimed at stimulating the economy. The RBI, in line with similar measures elsewhere in theworld, started buying government securities to lessen the impact on yields from the rise in governmentborrowing. Although this helped market sentiment, it could not prevent a general rise in yieldstowards fiscal close. As a result, the 10 year benchmark sovereign yield closed the fiscal at 7% froma low of sub 5% hit in early January 2009. Money market rates stabilized after the initial mayhem ofSeptember 2008 and October 2008 and liquidity came back to interbank markets.
MARKET OUTLOOK(as furnished by HSBC Asset Management (India) Private Limited)
Equity Market Outlook
Financial Year (FY) 2008-09 was a year marked by a strong correlation between the Indian marketand global markets with key indices ending deeply in the red on the back of the subprime crisis andderivative led losses across major financial stocks in the United States (US). Even in India, forex lossesran across corporate India though at a smaller magnitude. FY 10 has begun on a better note onaccount of various fundamental and technical factors.
GDP for FY 09 grew at 6.7% against FY 08 levels of 9%. Agriculture posted a below trend growthrate of 1.6% and industry grew by 3.9% (versus 8.1% in FY 08) with services registering a close to9.7% growth. IIP grew by a mere 2.6%. Although order books of engineering / capital goods wererunning at record high levels, there was possibility of delays in execution as funding sources for thedevelopers (equity, ECB, private equity, FCCB) had dried up. A sharp increase in subsidy on accountof oil, fertilizers and food led to a cut back in discretionary spending. Inflation rose on the back of asurging crude and higher prices of agricultural commodities to top at 12.91% for the week ending 2August, 2008. A slow down in the growth rates in the US / EU and other markets finally tamed thesurge in crude. As growth rates stumbled, governments / monetary authorities the world over triggeredfiscal stimuli / monetary easing to escape recessionary forces. This was followed in India as wellwhich started monetary easing / fiscal stimuli to keep growth rates buoyant.
On the positive side, India continues to do better in relative terms and we expect GDP growth of6-6.5% for FY10. The broad themes that are driving domestic growth viz. capital expenditure,infrastructure building and domestic consumption are still intact. The key concerns at this point
Trustees' ReportFor the year ended March 31, 2009 (Contd...)

5
stems from a ballooning fiscal deficit at the consolidated level (Centre & State) with salary revisionfor Central / State Government employees threatening a cut back in discretionary spending. Inflationis likely to remain benign for the first half of FY10 on a favourable base effect but we anticipate it togo back to trend levels of 5-5.5% for the second half of FY10 as this base effect wears off.
On a valuations perspective, the markets are currently trading at a P/E ratio of around 12 timesFY 2010 earnings. This is well below the 10-year average given the extreme risk aversion prevailing inthe markets. However, the underlying growth in the economy and corporate earnings growth (15%in the long term) makes the market attractive from a longer-term view. The short term could seeenhanced volatility arising from various factors. Increase in commodity prices continues to be a riskin the medium term as the US dollar continues to struggle with the ballooning US fiscal situation.
Debt Market Outlook
Excess supply of government bonds, as a result of fiscal slippages to arrest the downward growthmomentum, has been a reality for bond markets since January 2009. However, this is now compoundedwith some fatigue in buying longer duration as economic data is showing signs of recovery,commodities are showing signs of rally and expectations of incremental monetary easing from theRBI are beginning to unwind. However, system liquidity remains surplus and bank deposits continueto grow thereby providing resistance to bond yields from rising sharply.
Given the above factors, we believe that the market would continue to provide tactical opportunitiesalthough the fundamental bias should be for lower duration. Also, any mitigation of bond supplypressure or a new downturn in the ongoing economic recovery may provide space for opportunisticlonger duration plays. On the other hand, if the recovery cycle continues uninterrupted and commodityprices remain firm, central banks may start to worry about withdrawing the current monetary stimulusby sometime early 2010; with consequent impact on bond markets.
2. BRIEF BACKGROUND OF SPONSORS, BOARD OF TRUSTEES AND ASSETMANAGEMENT COMPANY
a) Sponsor
HSBC Mutual Fund is sponsored by HSBC Securities and Capital Markets (India) Private Limited (HSCI).The Sponsor is the Settler of the Mutual Fund Trust. The Sponsor has entrusted a sum of Rs. 1,00,000(Rupees One Lakh only) to the Trustee as the initial contribution towards the corpus of the MutualFund.
HSCI is a member of the HSBC Group, one of the largest banking and financial services organisations,in the world. Headquartered in London, HSBC operates through long-established businesses in fiveregions: Europe, Asia-Pacific, Middle East, America and Africa. Through its global network of 10,000offices in 86 countries and territories, HSBC provides a comprehensive range of financial services topersonal, commercial, corporate, institutional investment and private banking clients.
HSCI offers integrated investment banking services, securities and corporate finance & advisory. HSCIis a member of The Bombay Stock Exchange Limited and National Stock Exchange (capital and derivativemarket segments) and is also a category I merchant banker and underwriter registered with Securitiesand Exchange Board of India.
HSCI holds 100% of the paid-up equity share capital of the AMC.
b) HSBC Mutual Fund
HSBC Mutual Fund ("the Mutual Fund" or "the Fund") has been constituted as a Trust in accordancewith the provisions of the Indian Trusts Act, 1882 (2 of 1882) vide a Trust Deed dated February 7,2002 with HSBC Securities and Capital Markets (India) Private Limited, as the Sponsor and the Boardof Individual Trustees. The Trustee has entered into an Investment Management Agreement datedFebruary 7, 2002 with HSBC Asset Management (India) Private Limited (the AMC) to function as theInvestment Manager for all the Schemes of the Fund. The Fund was registered with SEBI videregistration number MF/046/02/5 dated May 27, 2002.
Trustees' ReportFor the year ended March 31, 2009 (Contd...)

6
The Trust has been formed for the purpose of pooling of capital from the public for collectiveinvestment in securities / any other property for the purpose of providing facilities for participationby persons as beneficiaries in such properties / investments and in the profits / income arising therefrom.
c) Board of Trustees (the Trustees)
The Board of Trustees are the exclusive owner of the Trust Fund and holds the same in trust for thebenefit of the unitholders. The Trustees have been discharging their duties and carrying out theirresponsibilities as provided in the SEBI (Mutual Funds) Regulations, 1996 and the Trust Deed. TheTrustees seeks to ensure that the Fund and the Schemes floated thereunder are managed by theAMC in accordance with the Trust Deed, the said Regulations, directions and guidelines issued bySEBI, the Stock Exchanges, the Association of Mutual Funds of India and other regulatory agencies.
d) Asset Management Company (the AMC)
HSBC Asset Management (India) Private Limited (the Investment Manager or the AMC) is a privatelimited company incorporated under the Companies Act, 1956 on December 12, 2001 having itsRegistered Office at 314, D. N. Road, Fort, Mumbai 400 001. HSBC Asset Management (India) PrivateLimited has been appointed as the Asset Management Company of the HSBC Mutual Fund by theTrustee vide Investment Management Agreement (IMA) dated February 7, 2002 and executed betweenthe Trustees and the AMC. SEBI approved the AMC to act as the Investment Manager of the Fundvide. its letter No. MFD/BC/163/2002 dated May 27, 2002.
The paid-up equity share capital of the AMC is Rs. 9 crores. HSBC Securities and Capital Markets(India) Private Limited holds 100% of the paid-up equity share capital of the AMC.
3. INVESTMENT OBJECTIVE OF THE SCHEMEThe investment objective of the Scheme has been provided above under the heading "SchemePerformance, Future Outlook and Operation of the Scheme" (refer Section 1).
4. SIGNIFICANT ACCOUNTING POLICIESThe accounting policies are in accordance with Securities and Exchange Board of India (Mutual Funds)Regulations, 1996.
5. UNCLAIMED DIVIDENDS & REDEMPTIONSNil.
6. INVESTOR SERVICESDuring the year, the number of official points of acceptance of transactions increased significantly toabout 182 locations. In addition to the offices of the transfer agency, the company has InvestorService Centres in 14 locations at its own offices - namely Mumbai, New Delhi, Kolkata, Chennai,Bangalore, Hyderabad, Pune, Ahmedabad, Indore, Chandigarh, Kochi, Coimbatore, Lucknow andVadodara. With a view to enhancing customer convenience, the Asset Management Company hasextended the facility of crediting investor bank accounts directly by way of NEFT / RTGS (for credit ofredemption and dividend proceeds). The AMC endeavours to despatch dividend proceeds within 5working days from the Record Date in all Schemes. The internal standards on redemption payoutshave been consistently met, with very few exceptions. The number of locations for the ECS AutoDebit facility for investments through Systematic Investment Plan also increased to about 74 byMarch 2009.
On the distribution front, the number of empanelled distributors increased from 7859 as on 31March, 2008 to 8632 as on 31 March, 2009. During the year, the Asset Management Companyinitiated tie-ups for online distribution of the Mutual Fund's schemes with several channel partnerstaking the total number of such tie-ups to 24 (Angel Capital & Department Market Ltd., Bajaj CapitalLimited, Bonanza Portfolio Limited, Citibank N.A., Citigroup Wealth Advisors India Private Limited,
Trustees' ReportFor the year ended March 31, 2009 (Contd...)

7
HDFC Bank Limited, Hongkong & Shanghai Banking Corporation Limited, HSBC Corporate InvestmentSolution Services, ICICI Securities Limited, India Infoline Limited, Karvy Stock Broking Limited, KotakMahindra Bank Limited, Kotak Securities Limited, Motilal Oswal Securities Limited, NJ India InvestPrivate Limited, Reliance Securities Limited, RR Investors Capital Services Private Limited, SBICAPSecurities Limited, Sharekhan Limited, SMC Global Securities Limited, Standard Chartered - STCICapital Markets Ltd., Tom Distribution Services Limited, Yes Bank Limited).
Call centre operations have been extended to cover the entire country. The Asset ManagementCompany has outsourced certain back office services including call centre services to HSBC Operationsand Processing Enterprise (India) Private Limited (HOPE).
7. STATUTORY DETAILSa) The Sponsors are not responsible or liable for any loss resulting from the operation of the Schemes
of the Fund beyond initial contribution of Rs. 1 lakh for setting up the Fund.
b) The price and redemption value of the units, and income from them, can go up as well as downwith fluctuations in the market value of its underlying investments.
c) Full / Abridged Annual Report shall be disclosed on the website at www.assetmanagement.hsbc.com/inand shall be available for inspection at the Head Office of the mutual fund. Present and prospectiveunit holder can obtain copy of the trust deed, the Full / Abridged Annual Report of the Scheme(s),the Annual Report of HSBC Asset Management (India) Private Limited and the text of the relevantScheme(s) at a price.
8. ACKNOWLEDGEMENTSThe Trustees wish to thank the Unitholders of the Schemes for their support throughout the year andalso thank the Government of India, the Securities and Exchange Board of India (SEBI), the ReserveBank of India (RBI) and the Association of Mutual Funds in India (AMFI) for the guidance provided bythem. The Trustees also appreciate the service provided by the Registrar and Transfer Agent, FundAccountant, Custodian, Bankers, Distributors and Brokers. The guidance and services provided bythe Auditors and advocates and the ebullience, sincerity and dedication of the employees of HSBCAsset Management (India) Private Limited is also appreciated.
The Trustees look forward to the continued support of everyone.
For and on behalf of the Board of Trustees of HSBC Mutual Fund
Dilip J. Thakkar
Trustee
MUMBAIJuly 6, 2009
Trustees' ReportFor the year ended March 31, 2009 (Contd...)

8
To the Board of Trustees of
HSBC MUTUAL FUND
1. We have audited the Balance Sheet of HSBC Mutual Fund – HSBC Cash Fund (The “Scheme”) asat March 31, 2009, the related Revenue Account for the year ended on that date annexed theretoand the Cash Flow Statement for the year ended on that date which we have signed underreference to this report. These financial statements are the responsibility of the Board of Trusteesof HSBC Mutual Fund and the Management of HSBC Asset Management (India) Private Limited(the “Management”). Our responsibility is to express an opinion on these financial statementsbased on our audit.
2. We have conducted our audit in accordance with auditing standards generally accepted in India.Those standards require that we plan and perform the audit to obtain reasonable assuranceabout whether the financial statements are free of material misstatement. An audit includesexamining, on a test basis, evidence supporting the amounts and disclosures in the financialstatements. Our procedures included confirmation of securities owned and unit capital balancesas at March 31, 2009 by correspondence with the custodian / others and registrar and transferagent respectively. An audit also includes assessing the accounting principles used and significantestimates made by the Management as well as evaluating the overall financial statementspresentation. We believe that our audit provides a reasonable basis for our opinion.
3. We have obtained all the information and explanations which to the best of our knowledge andbelief were necessary for the purposes of our audit. The Balance Sheet, the Revenue Account andthe Cash Flow Statement referred to above are in agreement with the books of account of theScheme.
4. In our opinion and to the best of our information and according to the explanations given to us;
(i) The Balance Sheet, the Revenue Account and the Cash Flow Statement together with thenotes thereon give the information required by the Securities and Exchange Board of India(Mutual Funds) Regulations, 1996 and the amendments thereto, as applicable, and also giverespectively a true and fair view of the state of affairs of HSBC Mutual Fund – HSBC CashFund as at March 31, 2009, its net surplus and its cash flows for the year ended on that date.
(ii) The Balance Sheet as at March 31, 2009, and the Revenue Account for the year ended onthat date, together with the notes thereon, have been prepared in all material respects inaccordance with the accounting policies and standards specified in the Ninth Schedule of theSecurities and Exchange Board of India (Mutual Funds) Regulations, 1996 and amendmentsthereto, as applicable.
(iii) The method used to value:
(a) non-traded debt securities in accordance with the guidelines for valuation of securitiesfor mutual funds dated September 18, 2000 and amendments thereto, as applicable,issued by the Securities and Exchange Board of India and
(b) privately placed securities in good faith
as at March 31, 2009 as determined by HSBC Asset Management (India) Private Limitedunder procedures approved by the Board of Trustees of HSBC Mutual Fund are fair andreasonable.
Partha GhoshPartnerMembership No. F / 55913
For and on behalf ofPRICE WATERHOUSEChartered Accountants
Place : MumbaiDate: July 6, 2009
Auditors' Report

9
Rs. in Lakhs
HSBC CASH FUND
As at As atMarch 31, 2009 March 31, 2008
LIABILITIES
1 Unit Capital 46,008.96 122,681.55
2 Reserves & Surplus2.1 Unit Premium Reserves 88.81 20.882.2 Unrealised Appreciation Reserve – –2.3 Other Reserves 3,166.94 8,200.73
3 Loans & Borrowings – –
4 Current Liabilities & Provisions4.1 Provision for doubtful Income / Deposits – –4.2 Other Current Liabilities & Provisions 1,288.99 2,373.69
TOTAL 50,553.70 133,276.85
ASSETS
1 Investments1.1. Listed Securities:1.1.1 Equity Shares – –1.1.2 Preference Shares – –1.1.3 Equity Linked Debentures – –1.1.4 Other Debentures & Bonds 1,483.33 21,005.481.1.5 Securitised Debt securities – –1.2 Securities Awaited Listing:1.2.1 Equity Shares – –1.2.2 Preference Shares – –1.2.3 Equity Linked Debentures – –1.2.4 Other Debentures & Bonds – –1.2.5 Securitised Debt securities – –1.3 Unlisted Securities:1.3.1 Equity Shares – –1.3.2 Preference Shares – –1.3.3 Equity Linked Debentures – –1.3.4 Other Debentures & Bonds 1,061.95 –1.3.5 Securitised Debt securities – 6,598.491.4 Government Securities – –1.5 Treasury Bills – –1.6 Commercial Paper 2,259.19 17,932.601.7 Certificate of Deposits 193.28 84,918.021.8 Bill Rediscounting – –1.9 Units of Domestic Mutual Fund – –1.10 Foreign Securities – –
Total Investments 4,997.75 130,454.59
2 Deposits 2,826.38 305.38
3 Other Current Assets3.1 Cash & Bank Balance 167.73 1,499.273.2 CBLO / Reverse Repo Lending 42,462.32 496.753.3 Others 99.52 520.86
4 Deferred Revenue Expenditure – –(to the extent not written off)
TOTAL 50,553.70 133,276.85
Notes to Accounts - Annexure I
Abridged Balance Sheet as at March 31, 2009

10
Rs. in Lakhs
HSBC CASH FUND
Current PreviousYear ended Year ended
March 31, 2009 March 31, 2008
1 INCOME1.1 Dividend – –1.2 Interest 12,212.11 18,735.941.3 Realised Gain / (Loss) on Foreign Exchange Transactions – –1.4 Realised Gains / (Losses) on Interscheme
sale of investments 43.68 2.141.5 Realised Gains / (Losses) on External sale /
redemption of investments 64.51 403.631.6 Realised Gains / (Losses) on Derivative Transactions – –1.7 Other Income 0.39 10.31
(A) 12,320.69 19,152.02
2 EXPENSES2.1 Management fees 360.50 565.172.2 Service tax on Management fees ** – –2.3 Transfer agents fees and expenses 73.27 97.892.4 Custodian fees 16.85 27.152.5 Trusteeship fees 0.63 0.552.6 Commission to Agents * – –2.7 Marketing & Distribution expenses 139.02 229.372.8 Audit fees 3.00 4.002.9 Other operating expenses 12.49 18.192.10 Expenses to be Reimbursed by the Investment Manager – (5.26)
(B) 605.76 937.07
3 NET REALISED GAINS / (LOSSES)FOR THE YEAR / PERIOD (A - B = C) 11,714.93 18,214.95
4 Change in Unrealised Depreciationin value of investments (D) (0.07) (7.10)
5 NET GAINS / (LOSSES)FOR THE YEAR / PERIOD [E = (C - D)] 11,715.00 18,222.05
6 Change in unrealised appreciationin the value of investments (F) – –
7 NET SURPLUS / (DEFICIT)FOR THE YEAR / PERIOD (E + F = G) 11,715.00 18,222.05
7.1 Add: Balance transfer fromUnrealised Appreciation Reserve – –
7.2 Less: Balance transfer to Unrealised Appreciation Reserve – –7.3 Add / (Less): Equalisation (9,632.76) (13,013.73)7.4 Transfer from Reserve Fund 623.75 441.347.5 Transfer from Unit Premium Reserve – 5.45
8 TOTAL 2,705.99 5,655.11
9 Dividend Appropriation9.1 Income Distributed during the year / period 5,545.32 7,807.499.2 Tax on income distributed during the year / period 1,570.71 2,211.4510 Retained Surplus / (Deficit)
carried forward to Balance Sheet (4,410.04) (4,363.83)
Notes to Accounts - Annexure I* Commission to Agents is included in Marketing & Distribution Expenses.** Service Tax on Management Fees is included in Other Operating Expenses.
Abridged Revenue Account for the year ended March 31, 2009
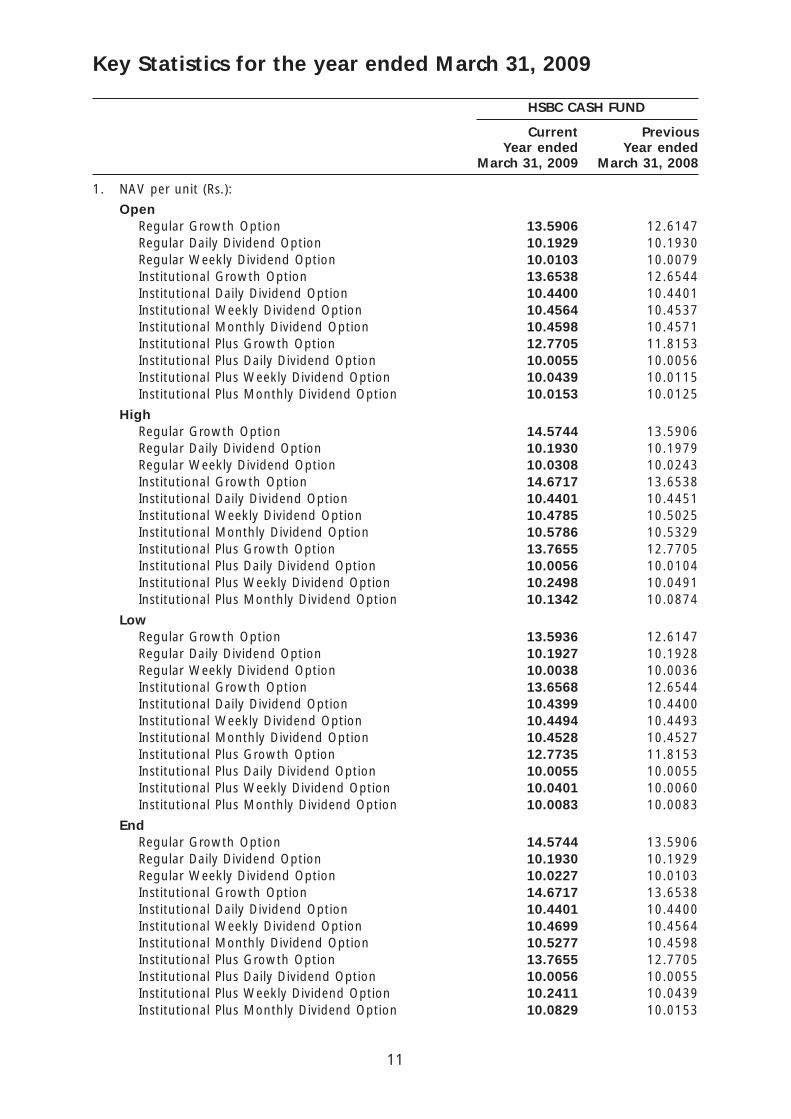
11
HSBC CASH FUND
Current PreviousYear ended Year ended
March 31, 2009 March 31, 2008
1. NAV per unit (Rs.):
OpenRegular Growth Option 13.5906 12.6147Regular Daily Dividend Option 10.1929 10.1930Regular Weekly Dividend Option 10.0103 10.0079Institutional Growth Option 13.6538 12.6544Institutional Daily Dividend Option 10.4400 10.4401Institutional Weekly Dividend Option 10.4564 10.4537Institutional Monthly Dividend Option 10.4598 10.4571Institutional Plus Growth Option 12.7705 11.8153Institutional Plus Daily Dividend Option 10.0055 10.0056Institutional Plus Weekly Dividend Option 10.0439 10.0115Institutional Plus Monthly Dividend Option 10.0153 10.0125
HighRegular Growth Option 14.5744 13.5906Regular Daily Dividend Option 10.1930 10.1979Regular Weekly Dividend Option 10.0308 10.0243Institutional Growth Option 14.6717 13.6538Institutional Daily Dividend Option 10.4401 10.4451Institutional Weekly Dividend Option 10.4785 10.5025Institutional Monthly Dividend Option 10.5786 10.5329Institutional Plus Growth Option 13.7655 12.7705Institutional Plus Daily Dividend Option 10.0056 10.0104Institutional Plus Weekly Dividend Option 10.2498 10.0491Institutional Plus Monthly Dividend Option 10.1342 10.0874
LowRegular Growth Option 13.5936 12.6147Regular Daily Dividend Option 10.1927 10.1928Regular Weekly Dividend Option 10.0038 10.0036Institutional Growth Option 13.6568 12.6544Institutional Daily Dividend Option 10.4399 10.4400Institutional Weekly Dividend Option 10.4494 10.4493Institutional Monthly Dividend Option 10.4528 10.4527Institutional Plus Growth Option 12.7735 11.8153Institutional Plus Daily Dividend Option 10.0055 10.0055Institutional Plus Weekly Dividend Option 10.0401 10.0060Institutional Plus Monthly Dividend Option 10.0083 10.0083
EndRegular Growth Option 14.5744 13.5906Regular Daily Dividend Option 10.1930 10.1929Regular Weekly Dividend Option 10.0227 10.0103Institutional Growth Option 14.6717 13.6538Institutional Daily Dividend Option 10.4401 10.4400Institutional Weekly Dividend Option 10.4699 10.4564Institutional Monthly Dividend Option 10.5277 10.4598Institutional Plus Growth Option 13.7655 12.7705Institutional Plus Daily Dividend Option 10.0056 10.0055Institutional Plus Weekly Dividend Option 10.2411 10.0439Institutional Plus Monthly Dividend Option 10.0829 10.0153
Key Statistics for the year ended March 31, 2009

12
Key Statistics for the year ended March 31, 2009 (Contd...)
HSBC CASH FUND
Current PreviousYear ended Year ended
March 31, 2009 March 31, 2008
2. Closing Assets Under Management (Rs. in Lakhs)
End 49,265 130,903Average (AAuM)1 151,680 240,581
3. Gross income as % of AAuM2 8.12% 7.96%
4. Expense Ratio:a. Total Expense as % of AAuM (planwise)
Regular Growth Option 0.79% 0.65%Regular Daily Dividend Option 0.79% 0.65%Regular Weekly Dividend Option 0.79% 0.65%Institutional Growth Option 0.57% 0.50%Institutional Daily Dividend Option 0.57% 0.50%Institutional Weekly Dividend Option 0.57% 0.50%Institutional Monthly Dividend Option 0.57% 0.50%Institutional Plus Growth Option 0.30% 0.36%Institutional Plus Daily Dividend Option 0.30% 0.32%Institutional Plus Weekly Dividend Option 0.30% 0.32%Institutional Plus Monthly Dividend Option 0.30% 0.35%
b. Management Fee as % of AAuM (planwise)Regular Growth Option 0.24% 0.33%Regular Daily Dividend Option 0.24% 0.31%Regular Weekly Dividend Option 0.24% 0.31%Institutional Growth Option 0.24% 0.25%Institutional Daily Dividend Option 0.24% 0.26%Institutional Weekly Dividend Option 0.24% 0.27%Institutional Monthly Dividend Option 0.24% 0.26%Institutional Plus Growth Option 0.24% 0.25%Institutional Plus Daily Dividend Option 0.24% 0.20%Institutional Plus Weekly Dividend Option 0.24% 0.20%
Institutional Plus Monthly Dividend Option 0.24% 0.11%
5. Net Income as a percentage of AAuM3 7.72% 7.57%
6. Portfolio turnover ratio4 – –
7. Total Dividend per unit distributed duringthe year / period (planwise)
RetailRegular Daily Dividend Option 0.5551 0.5920Regular Weekly Dividend Option 0.5358 0.5794Institutional Daily Dividend Option 0.5849 0.6186Institutional Weekly Dividend Option 0.5756 0.6174Institutional Monthly Dividend Option 0.5358 0.3173Institutional Plus Daily Dividend Option 0.5850 0.6063Institutional Plus Weekly Dividend Option 0.4406 0.5823Institutional Plus Monthly Dividend Option 0.5357 0.6062
CorporateRegular Daily Dividend Option 0.2311 0.2874Regular Weekly Dividend Option 0.2198 0.2823Institutional Daily Dividend Option 0.2468 0.3005Institutional Weekly Dividend Option 0.2394 0.3009

13
Institutional Monthly Dividend Option 0.1986 –Institutional Plus Daily Dividend Option 0.2517 0.2927Institutional Plus Weekly Dividend Option 0.2357 0.2770Institutional Plus Monthly Dividend Option 0.2035 0.2937
8. Returns:a. Last One Year
SchemeRegular Growth Option 7.2380 7.9994Regular Daily Dividend Option 5.6171 6.1804Regular Weekly Dividend Option 5.6919 6.1991Institutional Growth Option 7.4543 8.3673Institutional Daily Dividend Option 5.7669 6.4627Institutional Weekly Dividend Option 5.8624 6.7392Institutional Monthly Dividend Option 5.9163 6.4838Institutional Plus Growth Option 7.7897 8.1618Institutional Plus Daily Dividend Option 6.0444 6.2851Institutional Plus Weekly Dividend Option 6.5529 6.3229Institutional Plus Monthly Dividend Option 6.1813 6.3237
BenchmarkCRISIL Liquid Fund Index 8.8000 7.5025
b. Since Inception
SchemeRegular Growth Option 6.1353 6.0688Regular Daily Dividend Option 5.1402 5.1307Regular Weekly Dividend Option 5.6109 5.6736Institutional Growth Option 6.3352 6.7564Institutional Daily Dividend Option 5.2741 5.6497Institutional Weekly Dividend Option 5.3117 5.7173Institutional Monthly Dividend Option 5.2443 5.4712Institutional Plus Growth Option 6.8362 6.2523Institutional Plus Daily Dividend Option 5.6578 5.2560Institutional Plus Weekly Dividend Option 5.7793 5.2865Institutional Plus Monthly Dividend Option 5.5281 5.1992
BenchnmarkCRISIL Liquid Fund Index 5.9400 5.4112
1 AAuM = Average daily net assets
2 Gross income = amount against (A) in the Revenue Account i.e. Income.
3 Net income = amount against (C) in the Revenue Account i.e. NET REALISED GAINS / (LOSSES)FOR THE YEAR / PERIOD
4 Portfolio Turnover = Lower of sales or purchase divided by the Average AuM for the year / period.
HSBC CASH FUND
Current PreviousYear ended Year ended
March 31, 2009 March 31, 2008
Key Statistics for the year ended March 31, 2009 (Contd...)

14
Notes to Accounts - Annexure ITo the Abridged Balance Sheet and Revenue Account for the year ended March 31, 2009
HSBC CASH FUND
1 Investments:
1.1 It is confirmed that investments of the schemes are registered in the name of the Trustees forthe benefit of the scheme’s unitholders.
1.2 Open Positions of derivatives as of March 31, 2009 is NIL. Open Positions of derivatives as ofMarch 31, 2008 end is NIL.
1.3 Investments in Associates and Group Companies:(Rupees)
Issuer Instrument Amount Aggregate Amount AggregateType Investments Investments
by all schemes by all schemes
2009 2008
The Hongkong & Fixed Deposits – 43,000,000 – 1,654,000,000Shanghai BankingCorporation Ltd.
1.4 Open position of Securities Borrowed and / or Lent by the scheme as of financial years ended2009 and 2008 are NIL.
1.5 The NPAs as on March 31, 2009 and March 31, 2008 are NIL.
1.6 Aggregate Unrealised Gain / Loss as at the end of the Financial year March 31, 2009 andMarch 31, 2008 are as under :
Security Amount Percentage to Amount Percentage toCategory (Rs.) Net Assets (Rs.) Net Assets
2009 2008
NCDs and Bonds Listed / Awaiting Listing
– Appreciation – – – –
– Depreciation – – 7,220 0.000055%
1.7 The aggregate value of investment purchased (excluding accretion of discount ofRs.765,499,693) and sold (including matured) during the financial year 2008-2009 areRs. 113,034,775,451 and Rs. 126,356,785,527 respectively being 745.22% and 833.05%of the average daily net assets.
The aggregate value of investment purchased (excluding accretion of discount ofRs. 1,075,298,398) and sold (including matured) during the financial year 2007-2008 areRs. 139,051,689,509 and Rs. 144,543,000,959 respectively being 577.98% and 600.81% ofthe average daily net assets.
1.8 Non-Traded securities in the portfolio:
Aggregate Value of Equity, Debt & Money Market Instruments and percentage to net assets isas under :
Security Amount Percentage to Amount Percentage toCategory (Rs.) Net Assets (Rs.) Net Assets
2009 2008
Debt Instruments 254,528,096.23 5.17% 2,760,396,808.40 21.09%
Money marketInstruments 245,246,153.84 4.98% 10,285,062,302.56 78.57%
Total 499,774,250.07 10.14% 13,045,459,110.96 99.66%

15
Notes to Accounts - Annexure I (Contd...)To the Abridged Balance Sheet and Revenue Account for the year ended March 31, 2009
2 Disclosure Under Regulation 25(8) of the Securities and Exchange Board of India (Mutual Funds)Regulations, 1996 as amended.
Year – 2008-2009During the year, The Hongkong and Shanghai Banking Corporation Limited, an associate entityof HSBC Asset Management (India) Private Limited was paid collection / bank charges Rs. 56,595and brokerage amounting to Rs. 5,558,917 for procuring unit subscriptions for the Scheme. Thebrokerage paid was at rates similar to those offered to other distributors. Further The Hongkongand Shanghai Banking Corporation Limited, an associate of the Sponsor, is on the panel of bankerswith whom HSBC Mutual Fund places money on fixed deposits and enters into reverse repotransactions from time to time at competitive rates.
Year – 2007-2008During the year, The Hongkong and Shanghai Banking Corporation Limited, an associate entityof HSBC Asset Management (India) Private Limited was paid collection / bank charges Rs. 68,500and brokerage amounting to Rs. 8,336,258 for procuring unit subscriptions for the Scheme. Thebrokerage paid was at rates similar to those offered to other distributors. Further The Hongkongand Shanghai Banking Corporation Limited, an associate of the Sponsor, is on the panel of bankerswith whom HSBC Mutual Fund places money on fixed deposits and enters into reverse repotransactions from time to time at competitive rates.
Further The Hongkong and Shanghai Banking Corporation Limited, an associate of the Sponsor,is on the panel of bankers with whom HSBC Mutual Fund places money on fixed deposits andenters into reverse repo transactions from time to time at competitive rates.
HSBC Mutual Fund also enters into transactions in Government securities at market rates withHSBC Primary Dealership (India) Private Limited, a subsidiary of the Sponsor.
3 None of the Investors held more than 25% of the total net assets of the scheme at the yearsended March 31, 2009 and March 31, 2008.
4 Unit Capital movement during the years ended March 31, 2009 and March 31, 2008.
2008-2009
Description Opening Units Subscription Redemption Closing Units Face Value
Regular Growth Option 23,543,346.007 69,745,617.114 73,836,436.585 19,452,526.536 194,525,265.36
RegularDaily Dividend Option 168,782,960.991 308,519,010.875 359,348,975.507 117,952,996.359 1,179,529,963.59
RegularWeekly Dividend Option 31,459,108.549 64,387,773.406 78,662,673.352 17,184,208.603 171,842,086.03
Institutional Growth Option 17,227,982.504 322,060,275.008 337,661,509.846 1,626,747.666 16,267,476.66
InstitutionalDaily Dividend Option 139,058,165.422 845,679,347.939 931,958,155.679 52,779,357.682 527,793,576.82
InstitutionalWeekly Dividend Option 7,110,328.509 35,907,080.000 32,087,174.714 10,930,233.795 109,302,337.95
InstitutionalMonthly Dividend Option 2,187,696.477 5,871,186.049 7,504,101.237 554,781.289 5,547,812.89
Institutional PlusGrowth Option 206,514,921.534 14,440,717,782.241 14,602,240,798.502 44,991,905.273 449,919,052.73
Institutional PlusDaily Dividend Option 608,832,365.711 46,426,054,733.863 46,872,651,710.100 162,235,389.474 1,622,353,894.74
Institutional PlusWeekly Dividend Option 18,231,462.834 1,132,765,270.417 1,124,658,888.814 26,337,844.437 263,378,444.37
Institutional PlusMonthly Dividend Option 3,867,165.460 7,243,189.171 5,066,712.347 6,043,642.284 60,436,422.84

16
2007-2008
Description Opening Units Subscription Redemption Closing Units Face Value
Regular Growth Option 93,905,375.744 287,012,802.208 357,374,831.945 23,543,346.007 235,433,460.07
RegularDaily Dividend Option 272,379,297.214 547,286,256.767 650,882,592.990 168,782,960.991 1,687,829,609.91
RegularWeekly Dividend Option 46,016,435.448 85,297,602.522 99,854,929.421 31,459,108.549 314,591,085.49
InstitutionalGrowth Option 18,410,774.007 501,624,863.237 502,807,654.740 17,227,982.504 172,279,825.04
InstitutionalDaily Dividend Option 82,863,983.736 1,500,844,212.345 1,444,650,030.659 139,058,165.422 1,390,581,654.22
InstitutionalWeekly Dividend Option 22,430,764.491 30,117,188.538 45,437,624.520 7,110,328.509 71,103,285.09
InstitutionalMonthly Dividend Option 2,778,784.776 840,050.367 1,431,138.666 2,187,696.477 21,876,964.77
Institutional PlusGrowth Option 495,519,802.283 27,231,308,138.029 27,520,313,018.778 206,514,921.534 2,065,149,215.34
Institutional PlusDaily Dividend Option 630,269,970.184 39,896,483,195.877 39,917,920,800.350 608,832,365.711 6,088,323,657.11
Institutional PlusWeekly Dividend Option 82,607,798.519 2,121,520,517.495 2,185,896,853.180 18,231,462.834 182,314,628.34
Institutional PlusMonthly Dividend Option 3,639,965.758 10,373,758.344 10,146,558.642 3,867,165.460 38,671,654.60
Notes to Accounts - Annexure I (Contd...)To the Abridged Balance Sheet and Revenue Account for the year ended March 31, 2009
5 Previous year’s figures have been re-grouped / re-arranged where appropriate.
6 No contingent liabilities for the years ended March 31, 2009 and March 31, 2008.
7 Expenses other than Management Fees are inclusive of Service Tax where applicable.
8. The Annual Accounts of the Schemes prepared in accordance with the accounting policies andstandards specified in the Ninth Schedule of The Securities and Exchange Board of India (MutualFunds) Regulations, 1996 has been approved by the Board of Directors of HSBC Asset Management(India) Private Limited and The Board of Trustees of HSBC Mutual Fund at their meeting held onJuly 06, 2009. The audit report attached herewith refers to the said annual accounts. The aforesaidabridged accounts are an extract of the Annual Accounts and are prepared in accordance withSEBI Circular No. IMD/Cir 8/132968/2008 dated July 24, 2008.
17
DISCLAIMERS
The content of this report has been prepared by HSBC Asset Management (India) Private Limited(HSBC) for information purposes only and should not be construed as an offer or solicitation ofan offer for purchase of any of the funds of HSBC Mutual Fund. The information is for generalinformation only and does not have regard to specific investment objectives, financial situationand the particular needs of any specific person who may receive this information. Investmentsin mutual funds inherently involve risks and investors should read the relevant documents /information for details and risk factors and consult their legal, tax and financial advisors beforeinvesting. Investors should understand that statements made herein regarding future prospectsmay not be realised. Neither this document nor the units of HSBC Mutual Fund have beenregistered in any jurisdiction. The distribution of this document in certain jurisdictions may berestricted or totally prohibited and accordingly, persons who come into possession of thisdocument are required to inform themselves about, and to observe, any such restrictions.
Investors may obtain Statement of Additional Information, Combined Scheme InformationDocument and Common Key Information Memorandums along with application forms fromthe office of HSBC Mutual Fund, 314, D. N. Road, Fort, Mumbai 400 001. Tel: 022-6666 8819.
Statutory Details:HSBC Mutual Fund has been set up as a trust by HSBC Securities and Capital Markets (India)Private Limited (liability restricted to the corpus of Rs. 1 lakh). The Sponsor/associates of theSponsor/Asset Management Company (AMC) are not responsible or liable for any loss or shortfallresulting from the operation of the Schemes. The Trustees of HSBC Mutual Fund have appointedHSBC Asset Management (India) Private Limited as the Investment Manager.
Risk Factors:All investments in mutual funds and securities are subject to market risks and the Net AssetValue (NAV) of the Scheme(s) may go up or down depending on the factors and forces affectingthe securities markets. There can be no assurance that the objectives of the Scheme(s) will beachieved. Past performance of the Sponsor, AMC, Mutual Fund or any associates of the Sponsor/AMC does not indicate the future performance of the Scheme(s) of the Mutual Fund. HSBCCash Fund (HCF) is the names of the Scheme and does not in any manner indicate the qualityof the Scheme or its future prospects or returns.
Terms of Issue:Units of the Scheme(s) are being offered at NAV based prices, subject to the prevailing loads.The AMC calculates and publishes NAVs and offers for sale, redemption and switch outs, unitsof the Scheme(s) on all Business Days, at the Applicable NAV for all Schemes (at least once aweek, i.e., every Wednesday and daily during the period of redemption in case of HSCF).HUOF, HSCF & HFTS will not be open for ongoing subscriptions/ switch ins. HUOF & HSCFwould be available for sale on an ongoing basis (after a period of 3 years from the date ofallotment). Conversion of HUOF & HSCF to an open-ended scheme will be done only after thebalance unamortized amount has been fully recovered from the Scheme. Units can be redeemed/switched out on every Business Day at NAV based prices, subject to prevailing exit loads. Incase of HSCF, units can be redeemed / switched out on a monthly basis on the stipulated datei.e. last 3 business days of every month at NAV based prices, subject to provisions of exit load,if any and recovery of balance proportionate unamortized NFO expenses.
Load Structure (includes SIP/STP):Entry / Exit load: Nil.
Consult the nearest investor service centre for details.
The entry/exit load set forth above is subject to change at the discretion of the AMC and suchchanges shall be implemented prospectively.
Mutual Fund investments are subject to market risks. Please read the Statement of AdditionalInformation and Scheme Information Document carefully before investing.

18
Value Research Online DisclaimerValue Research Fund Ratings: Value Research Fund Ratings are a composite measure of historical risk-adjusted returns. In the case of equity funds this rating is based on the average monthly returns forthe last 3-year and 5-year period. These ratings do not take into account any entry or exit load.
Value Research Fund Ratings are subject to change every month. Current Fund Ratings are as onMarch 31, 2009. 142 open-ended Equity: Diversified Funds were rated. The Rating is based on primarydata provided by respective funds; Value Research does not guarantee the accuracy. Ranking Entity:Value Research Online.
ICRA Online Ranking MethodologyHSBC Monthly Income - Savings Plan has been ranked as a Five Star Fund in the category of 'OpenEnded Marginal Equity' schemes for its 3 year performance till December 31, 2008.
The rank is an outcome of an objective and comparative analysis against various parameters, including:risk adjusted return, fund size, company concentration, portfolio turnover and liquidity. The rankingmethodology did not take into account entry and exit loads imposed by the Fund. There were 27schemes considered in 'Open Ended Marginal Equity' category for the ranking exercise. The rank isneither a certificate of statutory compliance nor any guarantee on the future performance of HSBCMonthly Income - Savings Plan. Ranking Source & Publisher: ICRA Online Limited.
CRISIL Ranking MethodologyThe selection for the awards is based on the CRISIL FundServices' Composite Performance Ranking(CRISIL~CPR) methodology.
The CRISIL Composite Performance Ranking (CRISIL~CPR) is a quarterly ranking of mutual fund schemesbased on two year performance (excepting for the liquid and short term debt categories where a oneyear performance horizon is considered). The methodology is based on global best practices,customized to account for Indian market nuances. Over time, the rankings have become the industrystandard with good acceptance among Investors, Fund Intermediaries, Asset Management Companies,etc. The performance criteria covers not only risk adjusted returns, which are historical, but also theportfolio constitution to make the analysis forward looking.
CRISIL DisclaimerThe overall ranking is assigned to the scheme based on its weighted average score on a range ofparameters: Superior Return Score, Concentration, Liquidity, Asset Quality - Measures the creditquality of the portfolio, Average Maturity and Asset Size. HSBC MIP - Savings was the only schemethat won the CNBC TV18 - CRISIL Mutual Fund of the Year Award in the Category - Monthly IncomePlans - Aggressive. In total 13 schemes were eligible for the award universe. Schemes present in allfour quarterly CRISIL CPRs were considered for the award. The award is based on consistency of thescheme's performance in the four quarterly CRISIL CPR rankings released during the calendar year2008. The individual CRISIL CPR parameter scores averaged for the four quarters were further multipliedby the parameter weights as per the CRISIL CPR methodology to arrive at the final scores. A detailedmethodology of the CRISIL CPR is available at www.crisil.com. Past performance is no guarantee offuture results. Rankings and Award Source: CRISIL Fund Services, CRISIL Ltd. HSBC Monthly Income -Savings Plan has been ranked as a Five Star Fund in the category of 'Open Ended Marginal Equity'schemes for its 3 year performance till December 31, 2008. The rank is an outcome of an objectiveand comparative analysis against various parameters, including: risk adjusted return, fund size,company concentration, portfolio turnover and liquidity. The ranking methodology did not take intoaccount entry and exit loads imposed by the Fund. There were 27 schemes considered in 'OpenEnded Marginal Equity' category for the ranking exercise. The rank is neither a certificate of statutorycompliance nor any guarantee on the future performance of HSBC Monthly Income - Savings Plan.Ranking Source & Publisher: ICRA Online Limited.

19
This page is intentionally left blank.

Issued by HSBC Asset Management (India) Private Limited
HSBC Global Asset Management
HSBC Ultra Short Term Bond FundAn open-ended debt Scheme
Abridged Annual Report 2008 - 2009

1
Dear Investor,
We thank you for investing with HSBC Mutual Fund. We are pleased to inform you that HSBCMutual Fund has won prestigious awards* this year at various forums in India.
The awards* won by our schemes in India are
� HSBC Equity Fund has been included in the 5 star rated fund category (“Top rated mutualfunds” by Value Research online) in March, 2009.
� Five-stars indicate that a fund is in the top 10 per cent of its category in terms ofhistorical risk-adjusted returns.
� ICRA Mutual Fund Awards 2009
� HSBC MIP - Savings has been ranked a 5-Star Fund by ICRA Online indicating performanceamong the top 10% in the category of 'Open Ended Marginal Equity' for 3 yearperformance ending 31 December, 2008.
� CNBC TV18 - CRISIL Mutual Fund Awards 2008
� HSBC MIP - Savings was awarded the CNBC TV18 - CRISIL Mutual Fund of the YearAward for the year 2008 in the Monthly Income Plans - Aggressive Category.
(Past performance is no guarantee of future results. * Please refer to Ranking methodologyand disclaimer mentioned at the end of the Abridged Annual Report for the year endedMarch 31, 2009).
At the global level, the HSBC Group won several awards at Euromoney's Awards for Excellence2009. The top awards that HSBC won were the Best Global Bank and the Best Global DebtHouse. It was also honoured as the Best Debt House in 8 locations including Asia and the Bestat Risk Management in Asia. (Past performance may or may not be sustained in the future andis no guarantee of future results). We continue to be one of the leading players in emergingmarkets and remain committed to our asset management business in India.
HSBC Asset Management (India) Private Limited including the mutual fund business as well asthe PMS business (including EPFO money deployed till date) manages assets of about Rs. 26280Crores as at 30 June, 2009. The core to our winning strategy is our endeavour to deliverconsistent performance over the medium to long term for our investors in a risk controlledenvironment and aim for consistent wealth creation under varying market conditions. Throughour product range, we aim to be true to our reputation in India of being a provider ofinternational quality investment products and services.
We remain committed to our philosophy of aiming for consistent wealth creation and serviceexcellence and look forward to your continued investments in HSBC Mutual Fund.
Yours sincerely,
VikramaadityaChief Executive OfficerHSBC Asset Management (India) Private Limited

2
SPONSORHSBC Securities and Capital Markets (India) Private LimitedRegd. Office: 52/60, Mahatma Gandhi Road, Fort, Mumbai 400 001.
TRUSTEEBoard of TrusteesOffice: 314, D. N. Road, Fort, Mumbai 400 001.
ASSET MANAGEMENT COMPANYHSBC Asset Management (India) Private LimitedCorp. & Regd. Office: 314, D. N. Road, Fort, Mumbai 400 001.
CUSTODIANJP Morgan Chase BankCorp. & Regd. Office: Mafatlal Centre, 9th Floor, Nariman Point, Mumbai - 400 021.
AUDITORS TO THE SCHEMEPrice WaterhouseChartered Accountants252, Veer Savarkar Marg, Shivaji Park, Dadar (West), Mumbai - 400 028.
LEGAL ADVISORSBharucha & Partners4th Floor, Cecil Court, Mahakavi Bhushan Marg, Colaba, Mumbai - 400 039.
REGISTRAR & TRANSFER AGENTSComputer Age Management Services (P) Ltd. (CAMS)Rayala Towers, Tower I, III Floor, 158 Anna Salai, Chennai - 600 002.
BOARD OF TRUSTEESMr. N. P. Gidwani - Chairman
Dr. Rudolf ApenbrinkMr. Nasser MunjeeMr. Manu TandonMr. Mehli MistriMr. Dilip J. Thakkar
BOARD OF DIRECTORSMs. Naina Lal Kidwai - Chairman
Mr. Ayaz EbrahimMr. S. P. Mustafa**Mr. Vithal PalekarMs. Kishori J. Udeshi*Mr. Vikramaaditya - Chief Executive Officer***
* Ms. Kishori Udeshi has been appointed as a Director with effect from 14 January 2009 andMr. Jagjit Lal Pasricha has resigned as a Director with effect from 19 January 2009.
** Mr. S. P. Mustafa has been appointed as a Director with effect from 2 September 2008 andMr. Nawshir Khurody has resigned as a Director with effect from 1 September 2008.
*** Mr. Vikramaaditya has been appointed as the Chief Executive Officer with effect from 16 July 2008and Mr. Sanjay Prakash has resigned as the Chief Executive Officer with effect from 16 July 2008.
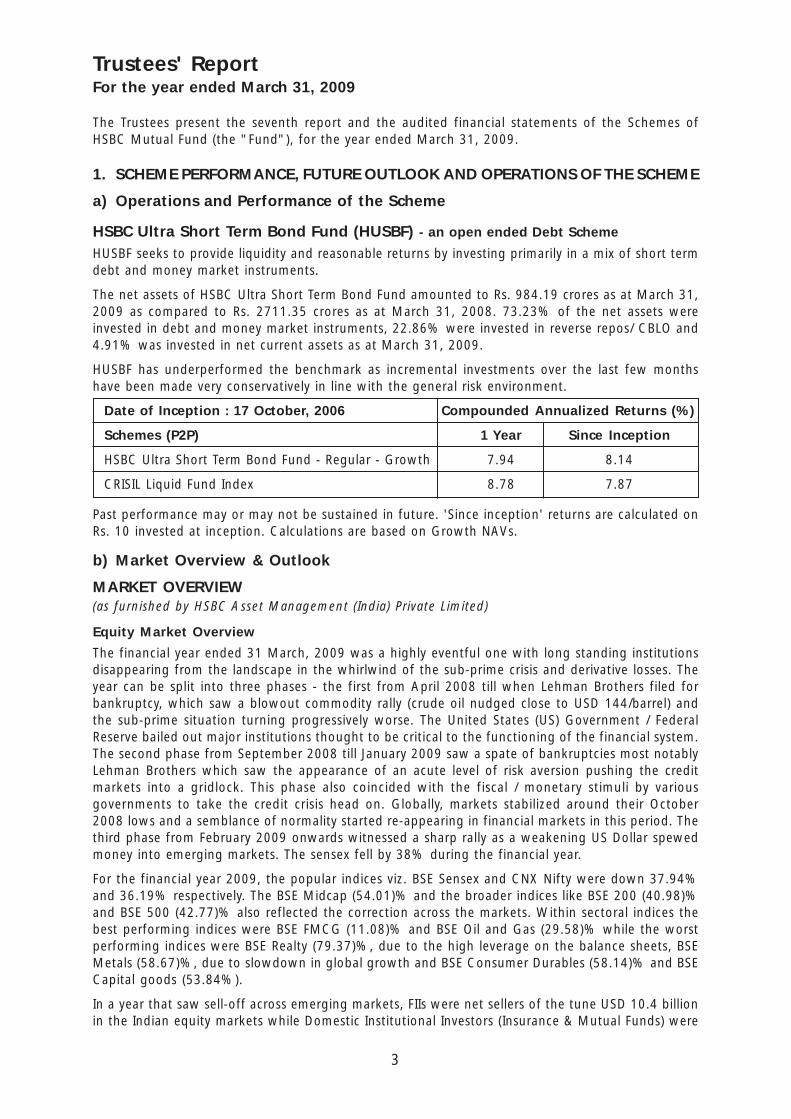
3
Trustees' ReportFor the year ended March 31, 2009
The Trustees present the seventh report and the audited financial statements of the Schemes ofHSBC Mutual Fund (the "Fund"), for the year ended March 31, 2009.
1. SCHEME PERFORMANCE, FUTURE OUTLOOK AND OPERATIONS OF THE SCHEME
a) Operations and Performance of the Scheme
HSBC Ultra Short Term Bond Fund (HUSBF) - an open ended Debt Scheme
HUSBF seeks to provide liquidity and reasonable returns by investing primarily in a mix of short termdebt and money market instruments.
The net assets of HSBC Ultra Short Term Bond Fund amounted to Rs. 984.19 crores as at March 31,2009 as compared to Rs. 2711.35 crores as at March 31, 2008. 73.23% of the net assets wereinvested in debt and money market instruments, 22.86% were invested in reverse repos/ CBLO and4.91% was invested in net current assets as at March 31, 2009.
HUSBF has underperformed the benchmark as incremental investments over the last few monthshave been made very conservatively in line with the general risk environment.
Date of Inception : 17 October, 2006 Compounded Annualized Returns (%)
Schemes (P2P) 1 Year Since Inception
HSBC Ultra Short Term Bond Fund - Regular - Growth 7.94 8.14
CRISIL Liquid Fund Index 8.78 7.87
Past performance may or may not be sustained in future. 'Since inception' returns are calculated onRs. 10 invested at inception. Calculations are based on Growth NAVs.
b) Market Overview & Outlook
MARKET OVERVIEW(as furnished by HSBC Asset Management (India) Private Limited)
Equity Market Overview
The financial year ended 31 March, 2009 was a highly eventful one with long standing institutionsdisappearing from the landscape in the whirlwind of the sub-prime crisis and derivative losses. Theyear can be split into three phases - the first from April 2008 till when Lehman Brothers filed forbankruptcy, which saw a blowout commodity rally (crude oil nudged close to USD 144/barrel) andthe sub-prime situation turning progressively worse. The United States (US) Government / FederalReserve bailed out major institutions thought to be critical to the functioning of the financial system.The second phase from September 2008 till January 2009 saw a spate of bankruptcies most notablyLehman Brothers which saw the appearance of an acute level of risk aversion pushing the creditmarkets into a gridlock. This phase also coincided with the fiscal / monetary stimuli by variousgovernments to take the credit crisis head on. Globally, markets stabilized around their October2008 lows and a semblance of normality started re-appearing in financial markets in this period. Thethird phase from February 2009 onwards witnessed a sharp rally as a weakening US Dollar spewedmoney into emerging markets. The sensex fell by 38% during the financial year.
For the financial year 2009, the popular indices viz. BSE Sensex and CNX Nifty were down 37.94%and 36.19% respectively. The BSE Midcap (54.01)% and the broader indices like BSE 200 (40.98)%and BSE 500 (42.77)% also reflected the correction across the markets. Within sectoral indices thebest performing indices were BSE FMCG (11.08)% and BSE Oil and Gas (29.58)% while the worstperforming indices were BSE Realty (79.37)%, due to the high leverage on the balance sheets, BSEMetals (58.67)%, due to slowdown in global growth and BSE Consumer Durables (58.14)% and BSECapital goods (53.84%).
In a year that saw sell-off across emerging markets, FIIs were net sellers of the tune USD 10.4 billionin the Indian equity markets while Domestic Institutional Investors (Insurance & Mutual Funds) were
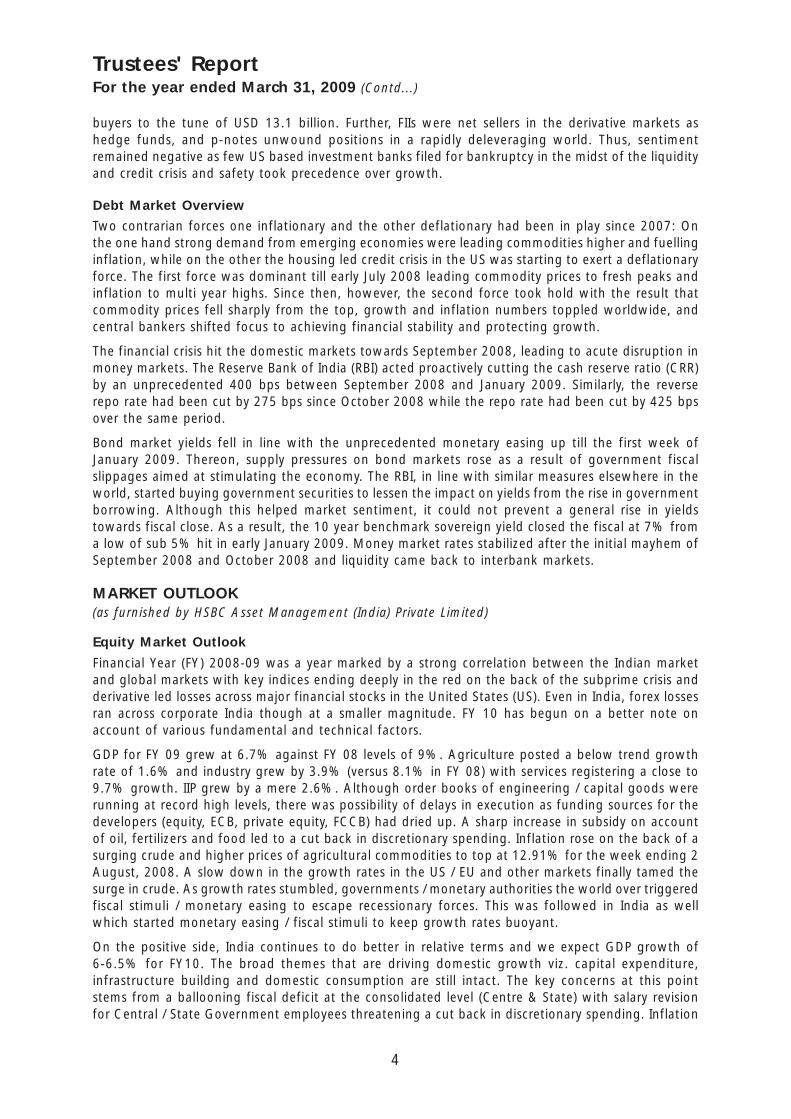
4
buyers to the tune of USD 13.1 billion. Further, FIIs were net sellers in the derivative markets ashedge funds, and p-notes unwound positions in a rapidly deleveraging world. Thus, sentimentremained negative as few US based investment banks filed for bankruptcy in the midst of the liquidityand credit crisis and safety took precedence over growth.
Debt Market Overview
Two contrarian forces one inflationary and the other deflationary had been in play since 2007: Onthe one hand strong demand from emerging economies were leading commodities higher and fuellinginflation, while on the other the housing led credit crisis in the US was starting to exert a deflationaryforce. The first force was dominant till early July 2008 leading commodity prices to fresh peaks andinflation to multi year highs. Since then, however, the second force took hold with the result thatcommodity prices fell sharply from the top, growth and inflation numbers toppled worldwide, andcentral bankers shifted focus to achieving financial stability and protecting growth.
The financial crisis hit the domestic markets towards September 2008, leading to acute disruption inmoney markets. The Reserve Bank of India (RBI) acted proactively cutting the cash reserve ratio (CRR)by an unprecedented 400 bps between September 2008 and January 2009. Similarly, the reverserepo rate had been cut by 275 bps since October 2008 while the repo rate had been cut by 425 bpsover the same period.
Bond market yields fell in line with the unprecedented monetary easing up till the first week ofJanuary 2009. Thereon, supply pressures on bond markets rose as a result of government fiscalslippages aimed at stimulating the economy. The RBI, in line with similar measures elsewhere in theworld, started buying government securities to lessen the impact on yields from the rise in governmentborrowing. Although this helped market sentiment, it could not prevent a general rise in yieldstowards fiscal close. As a result, the 10 year benchmark sovereign yield closed the fiscal at 7% froma low of sub 5% hit in early January 2009. Money market rates stabilized after the initial mayhem ofSeptember 2008 and October 2008 and liquidity came back to interbank markets.
MARKET OUTLOOK(as furnished by HSBC Asset Management (India) Private Limited)
Equity Market Outlook
Financial Year (FY) 2008-09 was a year marked by a strong correlation between the Indian marketand global markets with key indices ending deeply in the red on the back of the subprime crisis andderivative led losses across major financial stocks in the United States (US). Even in India, forex lossesran across corporate India though at a smaller magnitude. FY 10 has begun on a better note onaccount of various fundamental and technical factors.
GDP for FY 09 grew at 6.7% against FY 08 levels of 9%. Agriculture posted a below trend growthrate of 1.6% and industry grew by 3.9% (versus 8.1% in FY 08) with services registering a close to9.7% growth. IIP grew by a mere 2.6%. Although order books of engineering / capital goods wererunning at record high levels, there was possibility of delays in execution as funding sources for thedevelopers (equity, ECB, private equity, FCCB) had dried up. A sharp increase in subsidy on accountof oil, fertilizers and food led to a cut back in discretionary spending. Inflation rose on the back of asurging crude and higher prices of agricultural commodities to top at 12.91% for the week ending 2August, 2008. A slow down in the growth rates in the US / EU and other markets finally tamed thesurge in crude. As growth rates stumbled, governments / monetary authorities the world over triggeredfiscal stimuli / monetary easing to escape recessionary forces. This was followed in India as wellwhich started monetary easing / fiscal stimuli to keep growth rates buoyant.
On the positive side, India continues to do better in relative terms and we expect GDP growth of6-6.5% for FY10. The broad themes that are driving domestic growth viz. capital expenditure,infrastructure building and domestic consumption are still intact. The key concerns at this pointstems from a ballooning fiscal deficit at the consolidated level (Centre & State) with salary revisionfor Central / State Government employees threatening a cut back in discretionary spending. Inflation
Trustees' ReportFor the year ended March 31, 2009 (Contd...)
5
is likely to remain benign for the first half of FY10 on a favourable base effect but we anticipate it togo back to trend levels of 5-5.5% for the second half of FY10 as this base effect wears off.
On a valuations perspective, the markets are currently trading at a P/E ratio of around 12 timesFY 2010 earnings. This is well below the 10-year average given the extreme risk aversion prevailing inthe markets. However, the underlying growth in the economy and corporate earnings growth (15%in the long term) makes the market attractive from a longer-term view. The short term could seeenhanced volatility arising from various factors. Increase in commodity prices continues to be a riskin the medium term as the US dollar continues to struggle with the ballooning US fiscal situation.
Debt Market Outlook
Excess supply of government bonds, as a result of fiscal slippages to arrest the downward growthmomentum, has been a reality for bond markets since January 2009. However, this is now compoundedwith some fatigue in buying longer duration as economic data is showing signs of recovery,commodities are showing signs of rally and expectations of incremental monetary easing from theRBI are beginning to unwind. However, system liquidity remains surplus and bank deposits continueto grow thereby providing resistance to bond yields from rising sharply.
Given the above factors, we believe that the market would continue to provide tactical opportunitiesalthough the fundamental bias should be for lower duration. Also, any mitigation of bond supplypressure or a new downturn in the ongoing economic recovery may provide space for opportunisticlonger duration plays. On the other hand, if the recovery cycle continues uninterrupted and commodityprices remain firm, central banks may start to worry about withdrawing the current monetary stimulusby sometime early 2010; with consequent impact on bond markets.
2. BRIEF BACKGROUND OF SPONSORS, BOARD OF TRUSTEES AND ASSETMANAGEMENT COMPANY
a) Sponsor
HSBC Mutual Fund is sponsored by HSBC Securities and Capital Markets (India) Private Limited (HSCI).The Sponsor is the Settler of the Mutual Fund Trust. The Sponsor has entrusted a sum of Rs. 1,00,000(Rupees One Lakh only) to the Trustee as the initial contribution towards the corpus of the MutualFund.
HSCI is a member of the HSBC Group, one of the largest banking and financial services organisations,in the world. Headquartered in London, HSBC operates through long-established businesses in fiveregions: Europe, Asia-Pacific, Middle East, America and Africa. Through its global network of 10,000offices in 86 countries and territories, HSBC provides a comprehensive range of financial services topersonal, commercial, corporate, institutional investment and private banking clients.
HSCI offers integrated investment banking services, securities and corporate finance & advisory. HSCIis a member of The Bombay Stock Exchange Limited and National Stock Exchange (capital and derivativemarket segments) and is also a category I merchant banker and underwriter registered with Securitiesand Exchange Board of India.
HSCI holds 100% of the paid-up equity share capital of the AMC.
b) HSBC Mutual Fund
HSBC Mutual Fund ("the Mutual Fund" or "the Fund") has been constituted as a Trust in accordancewith the provisions of the Indian Trusts Act, 1882 (2 of 1882) vide a Trust Deed dated February 7,2002 with HSBC Securities and Capital Markets (India) Private Limited, as the Sponsor and the Boardof Individual Trustees. The Trustee has entered into an Investment Management Agreement datedFebruary 7, 2002 with HSBC Asset Management (India) Private Limited (the AMC) to function as theInvestment Manager for all the Schemes of the Fund. The Fund was registered with SEBI videregistration number MF/046/02/5 dated May 27, 2002.
Trustees' ReportFor the year ended March 31, 2009 (Contd...)

6
The Trust has been formed for the purpose of pooling of capital from the public for collectiveinvestment in securities / any other property for the purpose of providing facilities for participationby persons as beneficiaries in such properties / investments and in the profits / income arising therefrom.
c) Board of Trustees (the Trustees)
The Board of Trustees are the exclusive owner of the Trust Fund and holds the same in trust for thebenefit of the unitholders. The Trustees have been discharging their duties and carrying out theirresponsibilities as provided in the SEBI (Mutual Funds) Regulations, 1996 and the Trust Deed. TheTrustees seeks to ensure that the Fund and the Schemes floated thereunder are managed by theAMC in accordance with the Trust Deed, the said Regulations, directions and guidelines issued bySEBI, the Stock Exchanges, the Association of Mutual Funds of India and other regulatory agencies.
d) Asset Management Company (the AMC)
HSBC Asset Management (India) Private Limited (the Investment Manager or the AMC) is a privatelimited company incorporated under the Companies Act, 1956 on December 12, 2001 having itsRegistered Office at 314, D. N. Road, Fort, Mumbai 400 001. HSBC Asset Management (India) PrivateLimited has been appointed as the Asset Management Company of the HSBC Mutual Fund by theTrustee vide Investment Management Agreement (IMA) dated February 7, 2002 and executed betweenthe Trustees and the AMC. SEBI approved the AMC to act as the Investment Manager of the Fundvide. its letter No. MFD/BC/163/2002 dated May 27, 2002.
The paid-up equity share capital of the AMC is Rs. 9 crores. HSBC Securities and Capital Markets(India) Private Limited holds 100% of the paid-up equity share capital of the AMC.
3. INVESTMENT OBJECTIVE OF THE SCHEMEThe investment objective of the Scheme has been provided above under the heading "SchemePerformance, Future Outlook and Operation of the Scheme" (refer Section 1).
4. SIGNIFICANT ACCOUNTING POLICIESThe accounting policies are in accordance with Securities and Exchange Board of India (Mutual Funds)Regulations, 1996.
5. UNCLAIMED DIVIDENDS & REDEMPTIONSNil.
6. INVESTOR SERVICESDuring the year, the number of official points of acceptance of transactions increased significantly toabout 182 locations. In addition to the offices of the transfer agency, the company has InvestorService Centres in 14 locations at its own offices - namely Mumbai, New Delhi, Kolkata, Chennai,Bangalore, Hyderabad, Pune, Ahmedabad, Indore, Chandigarh, Kochi, Coimbatore, Lucknow andVadodara. With a view to enhancing customer convenience, the Asset Management Company hasextended the facility of crediting investor bank accounts directly by way of NEFT / RTGS (for credit ofredemption and dividend proceeds). The AMC endeavours to despatch dividend proceeds within 5working days from the Record Date in all Schemes. The internal standards on redemption payoutshave been consistently met, with very few exceptions. The number of locations for the ECS AutoDebit facility for investments through Systematic Investment Plan also increased to about 74 byMarch 2009.
On the distribution front, the number of empanelled distributors increased from 7859 as on 31March, 2008 to 8632 as on 31 March, 2009. During the year, the Asset Management Companyinitiated tie-ups for online distribution of the Mutual Fund's schemes with several channel partnerstaking the total number of such tie-ups to 24 (Angel Capital & Department Market Ltd., Bajaj CapitalLimited, Bonanza Portfolio Limited, Citibank N.A., Citigroup Wealth Advisors India Private Limited,
Trustees' ReportFor the year ended March 31, 2009 (Contd...)

7
HDFC Bank Limited, Hongkong & Shanghai Banking Corporation Limited, HSBC Corporate InvestmentSolution Services, ICICI Securities Limited, India Infoline Limited, Karvy Stock Broking Limited, KotakMahindra Bank Limited, Kotak Securities Limited, Motilal Oswal Securities Limited, NJ India InvestPrivate Limited, Reliance Securities Limited, RR Investors Capital Services Private Limited, SBICAPSecurities Limited, Sharekhan Limited, SMC Global Securities Limited, Standard Chartered - STCICapital Markets Ltd., Tom Distribution Services Limited, Yes Bank Limited).
Call centre operations have been extended to cover the entire country. The Asset ManagementCompany has outsourced certain back office services including call centre services to HSBC Operationsand Processing Enterprise (India) Private Limited (HOPE).
7. STATUTORY DETAILSa) The Sponsors are not responsible or liable for any loss resulting from the operation of the Schemes
of the Fund beyond initial contribution of Rs. 1 lakh for setting up the Fund.
b) The price and redemption value of the units, and income from them, can go up as well as downwith fluctuations in the market value of its underlying investments.
c) Full / Abridged Annual Report shall be disclosed on the website at www.assetmanagement.hsbc.com/inand shall be available for inspection at the Head Office of the mutual fund. Present and prospectiveunit holder can obtain copy of the trust deed, the Full / Abridged Annual Report of the Scheme(s),the Annual Report of HSBC Asset Management (India) Private Limited and the text of the relevantScheme(s) at a price.
8. ACKNOWLEDGEMENTSThe Trustees wish to thank the Unitholders of the Schemes for their support throughout the year andalso thank the Government of India, the Securities and Exchange Board of India (SEBI), the ReserveBank of India (RBI) and the Association of Mutual Funds in India (AMFI) for the guidance provided bythem. The Trustees also appreciate the service provided by the Registrar and Transfer Agent, FundAccountant, Custodian, Bankers, Distributors and Brokers. The guidance and services provided bythe Auditors and advocates and the ebullience, sincerity and dedication of the employees of HSBCAsset Management (India) Private Limited is also appreciated.
The Trustees look forward to the continued support of everyone.
For and on behalf of the Board of Trustees of HSBC Mutual Fund
Dilip J. Thakkar
Trustee
MUMBAIJuly 6, 2009
Trustees' ReportFor the year ended March 31, 2009 (Contd...)

8
To the Board of Trustees of
HSBC MUTUAL FUND
1. We have audited the Balance Sheet of HSBC Mutual Fund – HSBC Ultra Short Term Bond Fund(Formerly HSBC Liquid Plus Fund) (The “Scheme”) as at March 31, 2009, the related RevenueAccount for the year ended on that date annexed thereto, and the Cash Flow Statement for theyear ended on that date which we have signed under reference to this report. These financialstatements are the responsibility of the Board of Trustees of HSBC Mutual Fund and theManagement of HSBC Investment Management (India) Private Limited (the “Management”). Ourresponsibility is to express an opinion on these financial statements based on our audit.
2. We have conducted our audit in accordance with auditing standards generally accepted in India.Those standards require that we plan and perform the audit to obtain reasonable assuranceabout whether the financial statements are free of material misstatement. An audit includesexamining, on a test basis, evidence supporting the amounts and disclosures in the financialstatements. Our procedures included confirmation of securities owned and unit capital balancesas at March 31, 2009 by correspondence with the custodian / others and registrar and transferagent respectively. An audit also includes assessing the accounting principles used and significantestimates made by the Management as well as evaluating the overall financial statementspresentation. We believe that our audit provides a reasonable basis for our opinion.
3. We have obtained all the information and explanations which to the best of our knowledge andbelief were necessary for the purposes of our audit. The Balance Sheet, the Revenue Account andthe Cash Flow Statement referred to above are in agreement with the books of account of theScheme.
4. In our opinion and to the best of our information and according to the explanations given to us;
(i) The Balance Sheet, the Revenue Account and the Cash Flow Statement together with thenotes thereon give the information required by the Securities and Exchange Board of India(Mutual Funds) Regulations, 1996 and the amendments thereto, as applicable, and also giverespectively a true and fair view of the state of affairs of HSBC Mutual Fund – HSBC UltraShort Term Bond Fund as at March 31, 2009, its net surplus and its Cash Flows for the yearended on that date.
(ii) The Balance Sheet as at March 31, 2009, and the Revenue Account for the year ended onthat date, together with the notes thereon, have been prepared in all material respects inaccordance with the accounting policies and standards specified in the Ninth Schedule of theSecurities and Exchange Board of India (Mutual Funds) Regulations, 1996 and amendmentsthereto, as applicable.
(iii) The method used to value:
(a) non-traded debt securities in accordance with the guidelines for valuation of securitiesfor mutual funds dated September 18, 2000 and amendments thereto, as applicable,issued by the Securities and Exchange Board of India and
(b) privately placed securities in good faith
as at March 31, 2009 as determined by HSBC Asset Management (India) Private Limitedunder procedures approved by the Board of Trustees of HSBC Mutual Fund are fair andreasonable.
Partha GhoshPartnerMembership No. F / 55913
For and on behalf ofPRICE WATERHOUSEChartered Accountants
Place : MumbaiDate : July 6, 2009
Auditors' Report

9
Rs. in Lakhs
HSBC ULTRA SHORT TERM BOND FUND
As at As atMarch 31, 2009 March 31, 2008
LIABILITIES1 Unit Capital 94,848.26 269,863.872 Reserves & Surplus2.1 Unit Premium Reserves (118.93) 0.202.2 Unrealised Appreciation Reserve 49.94 16.442.3 Other Reserves 3,640.11 4,396.983 Loans & Borrowings – –
4 Current Liabilities & Provisions4.1 Provision for doubtful Income / Deposits – –4.2 Other Current Liabilities & Provisions 795.82 2,250.24
TOTAL 99,215.20 276,527.73
ASSETS1 Investments1.1. Listed Securities:1.1.1 Equity Shares – –1.1.2 Preference Shares – –1.1.3 Equity Linked Debentures – –1.1.4 Other Debentures & Bonds 34,136.32 40,549.661.1.5 Securitised Debt securities – –1.2 Securities Awaited Listing:1.2.1 Equity Shares – –1.2.2 Preference Shares – –1.2.3 Equity Linked Debentures – –1.2.4 Other Debentures & Bonds – –1.2.5 Securitised Debt securities – –1.3 Unlisted Securities:1.3.1 Equity Shares – –1.3.2 Preference Shares – –1.3.3 Equity Linked Debentures – –1.3.4 Other Debentures & Bonds 18,308.88 19,702.921.3.5 Securitised Debt securities 18,081.13 43,230.751.4 Government Securities – –1.5 Treasury Bills – –1.6 Commercial Paper – 9,024.291.7 Certificate of Deposits 1,588.05 156,514.301.8 Bill Rediscounting – –1.9 Units of Domestic Mutual Fund – –1.10 Foreign Securities – –
Total Investments 72,114.38 269,021.92
2 Deposits 1,010.00 10.00
3 Other Current Assets3.1 Cash & Bank Balance 458.59 219.563.2 CBLO / Reverse Repo Lending 22,483.92 555.273.3 Others 3,148.31 6,720.984 Deferred Revenue Expenditure – –
(to the extent not written off)
TOTAL 99,215.20 276,527.73
Notes to Accounts - Annexure INote: Name of HSBC Liquid Plus Fund changed to HSBC Ultra Short Term Bond Fund.
Abridged Balance Sheet as at March 31, 2009

10
Rs. in Lakhs
HSBC ULTRA SHORT TERM BOND FUND
Current PreviousYear ended Year ended
March 31, 2009 March 31, 2008
1 INCOME1.1 Dividend – –1.2 Interest 26,997.42 42,340.331.3 Realised Gain / (Loss) on Foreign Exchange Transactions – –1.4 Realised Gains / (Losses) on Interscheme sale
of investments (14.86) 1,958.941.5 Realised Gains / (Losses) on External sale /
redemption of investments (158.79) (577.14)1.6 Realised Gains / (Losses) on Derivative Transactions – –1.7 Other Income 2.58 5.78
(A) 26,826.35 43,727.91
2 EXPENSES2.1 Management fees 885.11 1,292.512.2 Service tax on Management fees ** – –2.3 Transfer agents fees and expenses 147.67 223.912.4 Custodian fees 35.62 66.942.5 Trusteeship fees 1.29 1.182.6 Commission to Agents * – –2.7 Marketing & Distribution expenses 329.31 462.792.8 Audit fees 1.50 2.002.9 Other operating expenses 26.03 (4.16)
(B) 1,426.53 2,045.17
3 NET REALISED GAINS / (LOSSES)FOR THE YEAR / PERIOD (A - B = C) 25,399.82 41,682.74
4 Change in Unrealised Depreciationin value of investments (D) – (1.98)
5 NET GAINS / (LOSSES) FOR THEYEAR / PERIOD [E = (C - D)] 25,399.82 41,684.72
6 Change in unrealised appreciationin the value of investments (F) 33.51 5.40
7 NET SURPLUS / (DEFICIT) FORTHE YEAR / PERIOD (E + F = G) 25,433.33 41,690.12
7.1 Add: Balance transfer fromUnrealised Appreciation Reserve – –
7.2 Less: Balance transfer to UnrealisedAppreciation Reserve 33.51 5.40
7.3 Add / (Less): Equalisation (6,306.61) (5,918.60)7.4 Transfer from Reserve Fund 289.22 15.557.5 Transfer from Unit Premium Reserve 0.73 –
8 TOTAL 19,383.16 35,781.67
9 Dividend Appropriation9.1 Income Distributed during the year / period 16,632.14 26,806.089.2 Tax on income distributed during the year / period 3,218.67 5,609.11
10 Retained Surplus / (Deficit)carried forward to Balance Sheet (467.65) 3,366.48
Notes to Accounts - Annexure I* Commission to Agents is included in Marketing & Distribution Expenses.**Service Tax on Management Fees is included in Other Operating Expenses.
Abridged Revenue Account for the year ended March 31, 2009

11
HSBC ULTRA SHORT TERM BOND FUND
Current PreviousYear ended Year ended
March 31, 2009 March 31, 2008
1. NAV per unit (Rs.):
Open
Regular Growth Option 11.2274 10.3635
Regular Daily Dividend Option 10.0122 10.0122
Regular Weekly Dividend Option 10.0340 10.0308
Institutional Growth Option 11.2519 10.3707
Institutional Daily Dividend Option 10.0125 10.0125
Institutional Weekly Dividend Option 10.0348 10.0314
Institutional Monthly Dividend Option 10.0834 10.0800
Institutional Plus Growth Option 11.2737 10.3754
Institutional Plus Daily Dividend Option 10.0126 10.0126
Institutional Plus Weekly Dividend Option 10.0353 10.0318
Institutional Plus Monthly Dividend Option 10.2678 10.0801
High
Regular Growth Option 12.1193 11.2274
Regular Daily Dividend Option 10.0146 10.0122
Regular Weekly Dividend Option 10.0511 10.0487
Institutional Growth Option 12.1702 11.2519
Institutional Daily Dividend Option 10.0150 10.0125
Institutional Weekly Dividend Option 10.0527 10.0497
Institutional Monthly Dividend Option 10.2068 10.1587
Institutional Plus Growth Option 12.2294 11.2737
Institutional Plus Daily Dividend Option 10.0506 10.0126
Institutional Plus Weekly Dividend Option 10.0543 10.0507
Institutional Plus Monthly Dividend Option 10.3995 10.3279
Low
Regular Growth Option 11.2274 10.3716
Regular Daily Dividend Option 10.0122 10.0122
Regular Weekly Dividend Option 10.0269 10.0269
Institutional Growth Option 11.2519 10.3788
Institutional Daily Dividend Option 10.0125 10.0125
Institutional Weekly Dividend Option 10.0275 10.0275
Institutional Monthly Dividend Option 10.0761 10.0761
Institutional Plus Growth Option 11.2737 10.3837
Institutional Plus Daily Dividend Option 10.0126 10.0126
Key Statistics for the year ended March 31, 2009
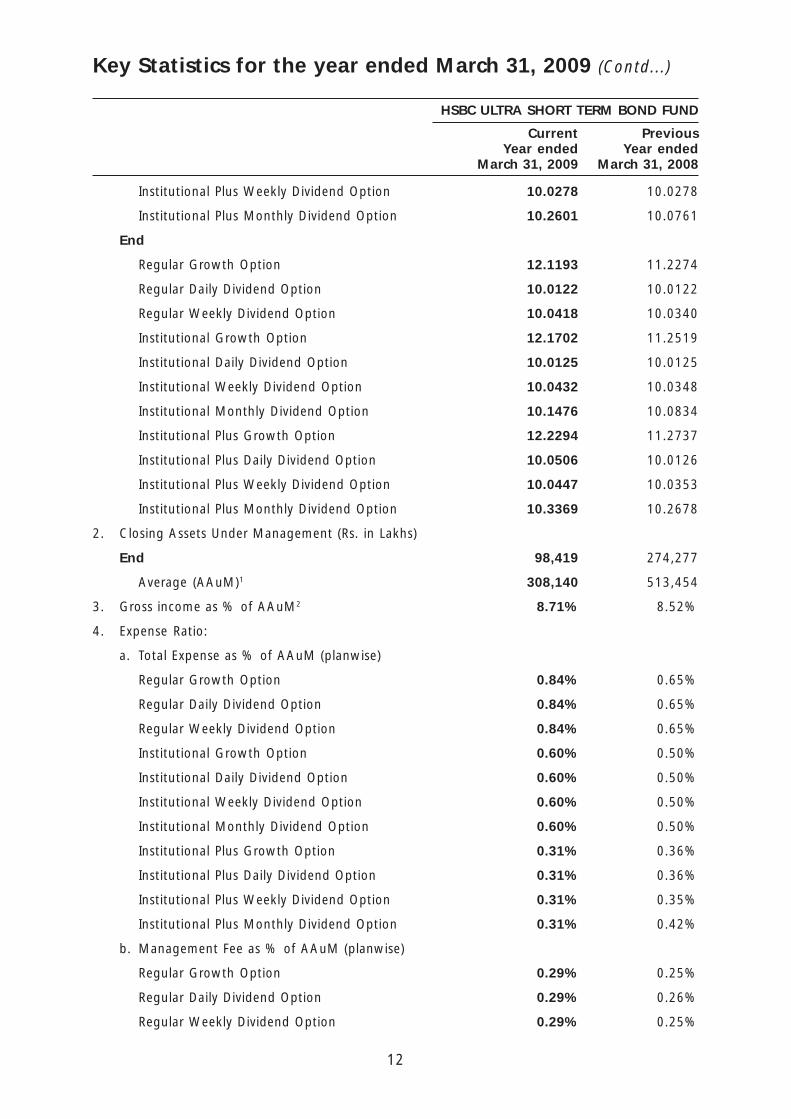
12
Institutional Plus Weekly Dividend Option 10.0278 10.0278
Institutional Plus Monthly Dividend Option 10.2601 10.0761
End
Regular Growth Option 12.1193 11.2274
Regular Daily Dividend Option 10.0122 10.0122
Regular Weekly Dividend Option 10.0418 10.0340
Institutional Growth Option 12.1702 11.2519
Institutional Daily Dividend Option 10.0125 10.0125
Institutional Weekly Dividend Option 10.0432 10.0348
Institutional Monthly Dividend Option 10.1476 10.0834
Institutional Plus Growth Option 12.2294 11.2737
Institutional Plus Daily Dividend Option 10.0506 10.0126
Institutional Plus Weekly Dividend Option 10.0447 10.0353
Institutional Plus Monthly Dividend Option 10.3369 10.2678
2. Closing Assets Under Management (Rs. in Lakhs)
End 98,419 274,277
Average (AAuM)1 308,140 513,454
3. Gross income as % of AAuM2 8.71% 8.52%
4. Expense Ratio:
a. Total Expense as % of AAuM (planwise)
Regular Growth Option 0.84% 0.65%
Regular Daily Dividend Option 0.84% 0.65%
Regular Weekly Dividend Option 0.84% 0.65%
Institutional Growth Option 0.60% 0.50%
Institutional Daily Dividend Option 0.60% 0.50%
Institutional Weekly Dividend Option 0.60% 0.50%
Institutional Monthly Dividend Option 0.60% 0.50%
Institutional Plus Growth Option 0.31% 0.36%
Institutional Plus Daily Dividend Option 0.31% 0.36%
Institutional Plus Weekly Dividend Option 0.31% 0.35%
Institutional Plus Monthly Dividend Option 0.31% 0.42%
b. Management Fee as % of AAuM (planwise)
Regular Growth Option 0.29% 0.25%
Regular Daily Dividend Option 0.29% 0.26%
Regular Weekly Dividend Option 0.29% 0.25%
Key Statistics for the year ended March 31, 2009 (Contd...)
HSBC ULTRA SHORT TERM BOND FUND
Current PreviousYear ended Year ended
March 31, 2009 March 31, 2008

13
Institutional Growth Option 0.29% 0.26%
Institutional Daily Dividend Option 0.29% 0.25%
Institutional Weekly Dividend Option 0.29% 0.25%
Institutional Monthly Dividend Option 0.29% 0.26%
Institutional Plus Growth Option 0.29% 0.26%
Institutional Plus Daily Dividend Option 0.29% 0.25%
Institutional Plus Weekly Dividend Option 0.29% 0.24%
Institutional Plus Monthly Dividend Option 0.29% 0.25%
5. Net Income as a percentage of AAuM3 8.24% 8.12%
6. Portfolio turnover ratio4 – –
7. Total Dividend per unit distributed during theyear / period (planwise)
Retail
Regular Daily Dividend Option 0.6706 0.7022
Regular Weekly Dividend Option 0.6653 0.7009
Institutional Daily Dividend Option 0.6883 0.7154
Institutional Weekly Dividend Option 0.6824 0.7140
Institutional Monthly Dividend Option 0.6401 0.7195
Institutional Plus Daily Dividend Option 0.6814 0.7284
Institutional Plus Weekly Dividend Option 0.7073 0.6480
Institutional Plus Monthly Dividend Option 0.2864 –
Corporate
Regular Daily Dividend Option 0.6261 0.6536
Regular Weekly Dividend Option 0.6192 0.6523
Institutional Daily Dividend Option 0.6406 0.6659
Institutional Weekly Dividend Option 0.6351 0.6646
Institutional Monthly Dividend Option 0.5958 0.5547
Institutional Plus Daily Dividend Option 0.6342 0.6798
Institutional Plus Weekly Dividend Option 0.6583 0.6766
Institutional Plus Monthly Dividend Option 0.6284 0.4741
8. Returns:
a. Last One Year
Scheme
Regular Growth Option 7.9440 8.2986
Regular Daily Dividend Option 6.9114 7.2326
HSBC ULTRA SHORT TERM BOND FUND
Current PreviousYear ended Year ended
March 31, 2009 March 31, 2008
Key Statistics for the year ended March 31, 2009 (Contd...)

14
Regular Weekly Dividend Option 6.9379 7.2447
Institutional Growth Option 8.1613 8.4609
Institutional Daily Dividend Option 7.0995 7.3731
Institutional Weekly Dividend Option 7.1210 7.3785
Institutional Monthly Dividend Option 7.1928 7.3717
Institutional Plus Growth Option 8.4773 8.6496
Institutional Plus Daily Dividend Option 7.3756 7.5379
Institutional Plus Weekly Dividend Option 7.3996 7.5471
Institutional Plus Monthly Dividend Option 7.4691 7.7823
Benchmark
Crisil Liquid Fund Index 8.7800 7.5436
b. Since Inception
Scheme
Regular Growth Option 8.1449 8.3213
Regular Daily Dividend Option 7.1021 7.2637
Regular Weekly Dividend Option 7.0702 7.2120
Institutional Growth Option 8.3297 8.4838
Institutional Daily Dividend Option 7.2623 7.4047
Institutional Weekly Dividend Option 7.2491 7.3779
Institutional Monthly Dividend Option 7.1516 7.2021
Institutional Plus Growth Option 8.5440 8.6363
Institutional Plus Daily Dividend Option 7.4493 7.5376
Institutional Plus Weekly Dividend Option 7.4159 7.4839
Institutional Plus Monthly Dividend Option 7.6249 7.7278
Benchnmark
Crisil Liquid Fund Index 7.8700 7.2372
1 AAuM = Average daily net assets
2 Gross income = amount against (A) in the Revenue Account i.e. Income.
3 Net income = amount against (C) in the Revenue Account i.e. NET REALISED GAINS / (LOSSES)FOR THE YEAR / PERIOD
4 Portfolio Turnover = Lower of sales or purchase divided by the Average AuM for the year / period.
Key Statistics for the year ended March 31, 2009 (Contd...)
HSBC ULTRA SHORT TERM BOND FUND
Current PreviousYear ended Year ended
March 31, 2009 March 31, 2008

15
HSBC ULTRA SHORT TERM BOND FUND
1 Investments:
1.1. It is confirmed that investments of the schemes are registered in the name of the Trustees forthe benefit of the scheme’s unitholders.
1.2. Open Positions of derivatives as of March 31, 2009 is NIL. Open Positions of derivatives as ofMarch 31, 2008 is NIL.
1.3. Investments in Associates and Group Companies:(Rupees)
Issuer Instrument Amount Aggregate Amount AggregateType Investments Investments
by all schemes by all schemes
2009 2008
The Hongkong & Fixed deposits – 43,000,000 1,400,000,000 1,654,000,000Shanghai BankingCorporation Ltd.
1.4. Open position of Securities Borrowed and / or Lent by the scheme as of financial years ended2009 and 2008 are NIL.
1.5. The NPAs as on March 31, 2009 and March 31, 2008 are NIL.
1.6. Aggregate Unrealised Gain / Loss as at the end of the Financial year March 31, 2009 andMarch 31, 2008 are as under :
Company Amount (Rs.) Percentage to Amount (Rs.) Percentage toName Net Assets Net Assets
2009 2008
NCDs and Bonds Listed / Awaiting Listing
– Appreciation 552,846 0.0056% 1,080,798 0.0039%
– Depreciation 7 0.0000% 4,794 0.0000%
NCDs and Bonds Privately Placed
– Appreciation – – 100,670 0.0004%
– Depreciation – – – –
Asset Backed Securities
– Appreciation 4,506,181 0.0458% 510,068 0.0019%
– Depreciation 64,584 0.0007% 42,997 0.0002%
1.7.The aggregate value of investment purchased (excluding accretion of discount ofRs. 1,434,575,544) and sold ( including matured) during the f inancial year areRs. 215,473,358,101, Rs. 236,584,673,590 respectively being 699.27% and 767.78% ofthe average daily net assets.
The aggregate value of investment purchased (excluding accretion of discount ofRs. 2,137,574,092) and sold (including matured) during the financial year 2007- 2008 isRs. 413,124,120,584 and Rs. 399,128,294,615 respectively being 804.60% (annualized)and 777.34% (annualized) of the average daily net assets.
Notes to Accounts - Annexure ITo the Abridged Balance Sheet and Revenue Account for the year ended March 31, 2009

16
1.8. Non-Traded securities in the portfolio:
Aggregate Value of Equity, Debt & Money Market Instruments and their percentages to Netassets are as under :
Security Fair Value % to Net Fair Value % to NetCategory (Rs.) Assets (Rs.) Assets
2009 2008
Equities 0.00 – – –
Debt Instruments 7,052,632,706.25 71.6590 10,348,333,690.48 37.7294
Money marketInstruments 158,805,410.75 1.6136 16,553,858,826.87 60.3544
Total 7,211,438,117.00 73.2725 26,902,192,517.35 98.0839
2 Disclosure under Regulation 25(8) of the Securities and Exchange Board of India (Mutual Funds)Regulations, 1996 as amended.
Year - 2008-2009
During the year, The Hongkong & Shanghai Banking Corporation Limited, an associate entity ofHSBC Asset Management (India) Private Limited was paid collection / bank charges amounting toRs. 3,131 and brokerage amounting to Rs. 12,864,725 for procuring unit subscriptions for theScheme. The brokerage paid was at rates similar to those offered to other distributors. Further,The Hongkong and Shanghai Banking Corporation Limited, an associate of the Sponsor, is on thepanel of bankers with whom HSBC Mutual Fund places money on fixed deposits and enters intoreverse repo transactions from time to time at competitive rates.
Year - 2007-2008
The Hongkong & Shanghai Banking Corporation Limited, an associate entity of HSBC AssetManagement (India) Private Limited was paid collection / bank charges amounting to Rs. 17,006and brokerage amounting to Rs. 12,231,290 for procuring unit subscriptions for the Scheme.The brokerage paid was at rates similar to those offered to other distributors. Further, TheHongkong and Shanghai Banking Corporation Limited, an associate of the Sponsor, is on thepanel of bankers with whom HSBC Mutual Fund places money on fixed deposits and enters intoreverse repo transactions from time to time at competitive rates.
3 None of the Investors held more than 25% of the total net assets of the scheme at the yearended March 31, 2008 and March 31, 2009.
4 Unit Capital movement during the years ended March 31, 2008 and March 31, 2009.
2008-2009
Description Opening Units Subscription Redemption Closing Units Face Value
Regular Growth 12,947,562.502 99,469,516.553 81,715,304.934 30,701,774.121 307,017,741.21
RegularDaily Dividend 342,608,641.233 1,185,144,871.026 1,202,031,125.986 325,722,386.273 3,257,223,862.73
RegularWeekly Dividend 80,326,610.335 315,343,532.080 311,093,834.653 84,576,307.762 845,763,077.62
InstitutionalGrowth 43,024,316.645 130,534,514.385 154,547,003.100 19,011,827.930 190,118,279.30
InstitutionalDaily Dividend 351,092,342.074 1,242,088,327.212 1,443,958,412.264 149,222,257.022 1,492,222,570.22
InstitutionalWeekly Dividend 74,699,504.743 195,730,174.224 231,212,964.261 39,216,714.706 392,167,147.06
Notes to Accounts - Annexure I (Contd...)To the Abridged Balance Sheet and Revenue Account for the year ended March 31, 2009

17
InstitutionalMonthly Dividend 15,102,418.972 44,563,488.833 47,271,028.038 12,394,879.767 123,948,797.67
Institutional PlusGrowth 258,473,165.696 3,733,880,271.611 3,890,907,629.989 101,445,807.318 1,014,458,073.18
Institutional PlusDaily Dividend 1,273,900,193.819 7,653,158,455.898 8,789,205,449.593 137,853,200.124 1,378,532,001.24
Institutional PlusWeekly Dividend 235,516,908.995 1,262,013,895.241 1,458,058,925.723 39,471,878.513 394,718,785.13
Institutional PlusMonthly Dividend 10,947,069.442 22,715,164.623 24,796,650.038 8,865,584.027 88,655,840.27
2007-2008
Description Opening Units Subscription Redemption Closing Units Face Value
Regular Growth 5,927,781.325 86,489,909.687 79,470,128.510 12,947,562.502 129,475,625.02
RegularDaily Dividend 37,247,357.112 1,408,115,205.692 1,102,753,921.571 342,608,641.233 3,426,086,412.33
RegularWeekly Dividend 16,675,214.106 365,305,235.663 301,653,839.434 80,326,610.335 803,266,103.35
InstitutionalGrowth 15,985,502.362 440,129,975.164 413,091,160.881 43,024,316.645 430,243,166.45
InstitutionalDaily Dividend 138,749,206.903 1,835,958,637.371 1,623,615,502.200 351,092,342.074 3,510,923,420.74
InstitutionalWeekly Dividend 20,302,411.727 304,061,380.731 249,664,287.715 74,699,504.743 746,995,047.43
InstitutionalMonthly Dividend 1,007,076.666 96,161,411.208 82,066,068.902 15,102,418.972 151,024,189.72
Institutional PlusGrowth 216,607,412.104 9,244,567,352.676 9,202,701,599.084 258,473,165.696 2,584,731,656.96
Institutional PlusDaily Dividend 725,903,370.527 16,754,879,843.763 16,206,883,020.471 1,273,900,193.819 12,739,001,938.19
Institutional PlusWeekly Dividend 53,087,240.496 1,723,497,346.835 1,541,067,678.336 235,516,908.995 2,355,169,089.95
Institutional PlusMonthly Dividend 9,245,809.572 133,899,827.537 132,198,567.667 10,947,069.442 109,470,694.42
Notes to Accounts - Annexure I (Contd...)To the Abridged Balance Sheet and Revenue Account for the year ended March 31, 2009
2008-2009
Description Opening Units Subscription Redemption Closing Units Face Value
5 Prior year amounts have been re-grouped and reclassified, wherever applicable, to confirm tocurrent year’s presentation.
6 No contingent liabilities for the year ended March 31, 2009 and March 31, 2008.
7 Expenses other than Management Fees are inclusive of Service Tax where applicable.
8. The Annual Accounts of the Schemes prepared in accordance with the accounting policies andstandards specified in the Ninth Schedule of The Securities and Exchange Board of India (MutualFunds) Regulations, 1996 has been approved by the Board of Directors of HSBC Asset Management(India) Private Limited and The Board of Trustees of HSBC Mutual Fund at their meeting held onJuly 06, 2009. The audit report attached herewith refers to the said annual accounts. The aforesaidabridged accounts are an extract of the Annual Accounts and are prepared in accordance withSEBI Circular No. IMD/Cir 8/132968/2008 dated July 24, 2008.

18
DISCLAIMERSThe content of this report has been prepared by HSBC Asset Management (India) Private Limited(HSBC) for information purposes only and should not be construed as an offer or solicitation of anoffer for purchase of any of the funds of HSBC Mutual Fund. The information is for general informationonly and does not have regard to specific investment objectives, financial situation and the particularneeds of any specific person who may receive this information. Investments in mutual funds inherentlyinvolve risks and investors should read the relevant documents / information for details and riskfactors and consult their legal, tax and financial advisors before investing. Investors should understandthat statements made herein regarding future prospects may not be realised. Neither this documentnor the units of HSBC Mutual Fund have been registered in any jurisdiction. The distribution of thisdocument in certain jurisdictions may be restricted or totally prohibited and accordingly, personswho come into possession of this document are required to inform themselves about, and to observe,any such restrictions.
Investors may obtain Statement of Additional Information, Combined Scheme Information Documentand Common Key Information Memorandums along with application forms from the office of HSBCMutual Fund, 314, D. N. Road, Fort, Mumbai 400 001. Tel: 022-6666 8819.
Statutory Details:HSBC Mutual Fund has been set up as a trust by HSBC Securities and Capital Markets (India) PrivateLimited (liability restricted to the corpus of Rs. 1 lakh). The Sponsor / associates of the Sponsor/AssetManagement Company (AMC) are not responsible or liable for any loss or shortfall resulting from theoperation of the Schemes. The Trustees of HSBC Mutual Fund have appointed HSBC Asset Management(India) Private Limited as the Investment Manager.
Risk Factors:All investments in mutual funds and securities are subject to market risks and the Net Asset Value(NAV) of the Scheme(s) may go up or down depending on the factors and forces affecting the securitiesmarkets. There can be no assurance that the objectives of the Scheme(s) will be achieved. Pastperformance of the Sponsor, AMC, Mutual Fund or any associates of the Sponsor/AMC does notindicate the future performance of the Scheme(s) of the Mutual Fund. HSBC Ultra Short Term BondFund (HUSBF) is the names of the Scheme and does not in any manner indicate the quality of theScheme or its future prospects or returns.
Terms of Issue:Units of the Scheme(s) are being offered at NAV based prices, subject to the prevailing loads. TheAMC calculates and publishes NAVs and offers for sale, redemption and switch outs, units of theScheme(s) on all Business Days, at the Applicable NAV for all Schemes (at least once a week, i.e.,every Wednesday and daily during the period of redemption in case of HSCF). HUOF, HSCF & HFTSwill not be open for ongoing subscriptions / switch ins. HUOF & HSCF would be available for sale onan ongoing basis (after a period of 3 years from the date of allotment). Conversion of HUOF & HSCFto an open-ended scheme will be done only after the balance unamortized amount has been fullyrecovered from the Scheme. Units can be redeemed / switched out on every Business Day at NAVbased prices, subject to prevailing exit loads. In case of HSCF, units can be redeemed / switched outon a monthly basis on the stipulated date i.e. last 3 business days of every month at NAV basedprices, subject to provisions of exit load, if any and recovery of balance proportionate unamortizedNFO expenses.
Load Structure (includes SIP/STP):Entry and Exit - Nil.
Consult the nearest investor service centre for details.
The entry/exit load set forth above is subject to change at the discretion of the AMC and suchchanges shall be implemented prospectively.
Mutual Fund investments are subject to market risks. Please read the Statement of AdditionalInformation and Scheme Information Document carefully before investing.

19
Value Research Online DisclaimerValue Research Fund Ratings: Value Research Fund Ratings are a composite measure of historical risk-adjusted returns. In the case of equity funds this rating is based on the average monthly returns forthe last 3-year and 5-year period. These ratings do not take into account any entry or exit load.
Value Research Fund Ratings are subject to change every month. Current Fund Ratings are as onMarch 31, 2009. 142 open-ended Equity: Diversified Funds were rated. The Rating is based on primarydata provided by respective funds; Value Research does not guarantee the accuracy. Ranking Entity:Value Research Online.
ICRA Online Ranking MethodologyHSBC Monthly Income - Savings Plan has been ranked as a Five Star Fund in the category of 'OpenEnded Marginal Equity' schemes for its 3 year performance till December 31, 2008.
The rank is an outcome of an objective and comparative analysis against various parameters, including:risk adjusted return, fund size, company concentration, portfolio turnover and liquidity. The rankingmethodology did not take into account entry and exit loads imposed by the Fund. There were 27schemes considered in 'Open Ended Marginal Equity' category for the ranking exercise. The rank isneither a certificate of statutory compliance nor any guarantee on the future performance of HSBCMonthly Income - Savings Plan. Ranking Source & Publisher: ICRA Online Limited.
CRISIL Ranking MethodologyThe selection for the awards is based on the CRISIL FundServices' Composite Performance Ranking(CRISIL~CPR) methodology.
The CRISIL Composite Performance Ranking (CRISIL~CPR) is a quarterly ranking of mutual fund schemesbased on two year performance (excepting for the liquid and short term debt categories where a oneyear performance horizon is considered). The methodology is based on global best practices,customized to account for Indian market nuances. Over time, the rankings have become the industrystandard with good acceptance among Investors, Fund Intermediaries, Asset Management Companies,etc. The performance criteria covers not only risk adjusted returns, which are historical, but also theportfolio constitution to make the analysis forward looking.
CRISIL DisclaimerThe overall ranking is assigned to the scheme based on its weighted average score on a range ofparameters: Superior Return Score, Concentration, Liquidity, Asset Quality - Measures the creditquality of the portfolio, Average Maturity and Asset Size. HSBC MIP - Savings was the only schemethat won the CNBC TV18 - CRISIL Mutual Fund of the Year Award in the Category - Monthly IncomePlans - Aggressive. In total 13 schemes were eligible for the award universe. Schemes present in allfour quarterly CRISIL CPRs were considered for the award. The award is based on consistency of thescheme's performance in the four quarterly CRISIL CPR rankings released during the calendar year2008. The individual CRISIL CPR parameter scores averaged for the four quarters were further multipliedby the parameter weights as per the CRISIL CPR methodology to arrive at the final scores. A detailedmethodology of the CRISIL CPR is available at www.crisil.com. Past performance is no guarantee offuture results. Rankings and Award Source: CRISIL Fund Services, CRISIL Ltd. HSBC Monthly Income -Savings Plan has been ranked as a Five Star Fund in the category of 'Open Ended Marginal Equity'schemes for its 3 year performance till December 31, 2008. The rank is an outcome of an objectiveand comparative analysis against various parameters, including: risk adjusted return, fund size,company concentration, portfolio turnover and liquidity. The ranking methodology did not take intoaccount entry and exit loads imposed by the Fund. There were 27 schemes considered in 'OpenEnded Marginal Equity' category for the ranking exercise. The rank is neither a certificate of statutorycompliance nor any guarantee on the future performance of HSBC Monthly Income - Savings Plan.Ranking Source & Publisher: ICRA Online Limited.

This page is intentionally left blank.

Issued by HSBC Asset Management (India) Private Limited
HSBC Global Asset Management
HSBC Flexi Debt FundAn open-ended debt Scheme
Abridged Annual Report 2008 - 2009

1
Dear Investor,
We thank you for investing with HSBC Mutual Fund. We are pleased to inform you that HSBCMutual Fund has won prestigious awards* this year at various forums in India.
The awards* won by our schemes in India are
� HSBC Equity Fund has been included in the 5 star rated fund category (“Top rated mutualfunds” by Value Research online) in March, 2009.
� Five-stars indicate that a fund is in the top 10 per cent of its category in terms ofhistorical risk-adjusted returns.
� ICRA Mutual Fund Awards 2009
� HSBC MIP - Savings has been ranked a 5-Star Fund by ICRA Online indicating performanceamong the top 10% in the category of 'Open Ended Marginal Equity' for 3 yearperformance ending 31 December, 2008.
� CNBC TV18 - CRISIL Mutual Fund Awards 2008
� HSBC MIP - Savings was awarded the CNBC TV18 - CRISIL Mutual Fund of the YearAward for the year 2008 in the Monthly Income Plans - Aggressive Category.
(Past performance is no guarantee of future results. * Please refer to Ranking methodologyand disclaimer mentioned at the end of the Abridged Annual Report for the year endedMarch 31, 2009).
At the global level, the HSBC Group won several awards at Euromoney's Awards for Excellence2009. The top awards that HSBC won were the Best Global Bank and the Best Global DebtHouse. It was also honoured as the Best Debt House in 8 locations including Asia and the Bestat Risk Management in Asia. (Past performance may or may not be sustained in the future andis no guarantee of future results). We continue to be one of the leading players in emergingmarkets and remain committed to our asset management business in India.
HSBC Asset Management (India) Private Limited including the mutual fund business as well asthe PMS business (including EPFO money deployed till date) manages assets of about Rs. 26280Crores as at 30 June, 2009. The core to our winning strategy is our endeavour to deliverconsistent performance over the medium to long term for our investors in a risk controlledenvironment and aim for consistent wealth creation under varying market conditions. Throughour product range, we aim to be true to our reputation in India of being a provider ofinternational quality investment products and services.
We remain committed to our philosophy of aiming for consistent wealth creation and serviceexcellence and look forward to your continued investments in HSBC Mutual Fund.
Yours sincerely,
VikramaadityaChief Executive OfficerHSBC Asset Management (India) Private Limited

2
SPONSORHSBC Securities and Capital Markets (India) Private LimitedRegd. Office: 52/60, Mahatma Gandhi Road, Fort, Mumbai 400 001.
TRUSTEEBoard of TrusteesOffice: 314, D. N. Road, Fort, Mumbai 400 001.
ASSET MANAGEMENT COMPANYHSBC Asset Management (India) Private LimitedCorp. & Regd. Office: 314, D. N. Road, Fort, Mumbai 400 001.
CUSTODIANJP Morgan Chase BankCorp. & Regd. Office: Mafatlal Centre, 9th Floor, Nariman Point, Mumbai - 400 021.
AUDITORS TO THE SCHEMEPrice WaterhouseChartered Accountants252, Veer Savarkar Marg, Shivaji Park, Dadar (West), Mumbai - 400 028.
LEGAL ADVISORSBharucha & Partners4th Floor, Cecil Court, Mahakavi Bhushan Marg, Colaba, Mumbai - 400 039.
REGISTRAR & TRANSFER AGENTSComputer Age Management Services (P) Ltd. (CAMS)Rayala Towers, Tower I, III Floor, 158 Anna Salai, Chennai - 600 002.
BOARD OF TRUSTEESMr. N. P. Gidwani - Chairman
Dr. Rudolf ApenbrinkMr. Nasser MunjeeMr. Manu TandonMr. Mehli MistriMr. Dilip J. Thakkar
BOARD OF DIRECTORSMs. Naina Lal Kidwai - Chairman
Mr. Ayaz EbrahimMr. S. P. Mustafa**Mr. Vithal PalekarMs. Kishori J. Udeshi*Mr. Vikramaaditya - Chief Executive Officer***
* Ms. Kishori Udeshi has been appointed as a Director with effect from 14 January 2009 andMr. Jagjit Lal Pasricha has resigned as a Director with effect from 19 January 2009.
** Mr. S. P. Mustafa has been appointed as a Director with effect from 2 September 2008 andMr. Nawshir Khurody has resigned as a Director with effect from 1 September 2008
*** Mr. Vikramaaditya has been appointed as the Chief Executive Officer with effect from 16 July 2008and Mr. Sanjay Prakash has resigned as the Chief Executive Officer with effect from 16 July 2008.

3
Trustees' ReportFor the year ended March 31, 2009
The Trustees present the seventh report and the audited financial statements of the Schemes ofHSBC Mutual Fund (the "Fund"), for the year ended March 31, 2009.
1. SCHEME PERFORMANCE, FUTURE OUTLOOK AND OPERATIONS OF THE SCHEME
a) Operations and Performance of the Scheme
HSBC Flexi Debt Fund (HFDF) - an open ended Debt Scheme
HFDF seeks to deliver returns in the form of interest income and capital gains, along with highliquidity, commensurate with the current view on the markets and the interest rate cycle, throughactive investment in debt and money market instruments.
The net assets of HSBC Flexi Debt Fund amounted to Rs. 316.84 crores as at March 31, 2009 ascompared to Rs. 234.69 crores as at March 31, 2008. 92.24% of the net assets were invested in debtand money market instruments, 3.06% were invested in net current assets and 4.70% was investedin reverse repos as at March 31, 2009.
HFDF has outperformed the benchmark through relatively active management of duration.
Date of Inception : 5 October, 2007 Compounded Annualized Returns (%)
Schemes (P2P) 1 Year Since Inception
HSBC Flexi Debt Fund - Growth 11.84 10.86
CRISIL Composite Bond Fund Index 7.23 7.18
Past performance may or may not be sustained in future. 'Since inception' returns are calculated onRs. 10 invested at inception. Calculations are based on Growth NAVs.
b) Market Overview & Outlook
MARKET OVERVIEW(as furnished by HSBC Asset Management (India) Private Limited)
Equity Market Overview
The financial year ended 31 March, 2009 was a highly eventful one with long standing institutionsdisappearing from the landscape in the whirlwind of the sub-prime crisis and derivative losses. Theyear can be split into three phases - the first from April 2008 till when Lehman Brothers filed forbankruptcy, which saw a blowout commodity rally (crude oil nudged close to USD 144/barrel) andthe sub-prime situation turning progressively worse. The United States (US) Government / FederalReserve bailed out major institutions thought to be critical to the functioning of the financial system.The second phase from September 2008 till January 2009 saw a spate of bankruptcies most notablyLehman Brothers which saw the appearance of an acute level of risk aversion pushing the creditmarkets into a gridlock. This phase also coincided with the fiscal / monetary stimuli by variousgovernments to take the credit crisis head on. Globally, markets stabilized around their October2008 lows and a semblance of normality started re-appearing in financial markets in this period. Thethird phase from February 2009 onwards witnessed a sharp rally as a weakening US Dollar spewedmoney into emerging markets. The sensex fell by 38% during the financial year.
For the financial year 2009, the popular indices viz. BSE Sensex and CNX Nifty were down 37.94%and 36.19% respectively. The BSE Midcap (54.01)% and the broader indices like BSE 200 (40.98)%and BSE 500 (42.77)% also reflected the correction across the markets. Within sectoral indices thebest performing indices were BSE FMCG (11.08)% and BSE Oil and Gas (29.58)% while the worstperforming indices were BSE Realty (79.37)%, due to the high leverage on the balance sheets, BSEMetals (58.67)%, due to slowdown in global growth and BSE Consumer Durables (58.14)% and BSECapital goods (53.84%).

4
In a year that saw sell-off across emerging markets, FIIs were net sellers of the tune USD 10.4 billionin the Indian equity markets while Domestic Institutional Investors (Insurance & Mutual Funds) werebuyers to the tune of USD 13.1 billion. Further, FIIs were net sellers in the derivative markets ashedge funds, and p-notes unwound positions in a rapidly deleveraging world. Thus, sentimentremained negative as few US based investment banks filed for bankruptcy in the midst of the liquidityand credit crisis and safety took precedence over growth.
Debt Market Overview
Two contrarian forces one inflationary and the other deflationary had been in play since 2007: Onthe one hand strong demand from emerging economies were leading commodities higher and fuellinginflation, while on the other the housing led credit crisis in the US was starting to exert a deflationaryforce. The first force was dominant till early July 2008 leading commodity prices to fresh peaks andinflation to multi year highs. Since then, however, the second force took hold with the result thatcommodity prices fell sharply from the top, growth and inflation numbers toppled worldwide, andcentral bankers shifted focus to achieving financial stability and protecting growth.
The financial crisis hit the domestic markets towards September 2008, leading to acute disruption inmoney markets. The Reserve Bank of India (RBI) acted proactively cutting the cash reserve ratio (CRR)by an unprecedented 400 bps between September 2008 and January 2009. Similarly, the reverserepo rate had been cut by 275 bps since October 2008 while the repo rate had been cut by 425 bpsover the same period.
Bond market yields fell in line with the unprecedented monetary easing up till the first week ofJanuary 2009. Thereon, supply pressures on bond markets rose as a result of government fiscalslippages aimed at stimulating the economy. The RBI, in line with similar measures elsewhere in theworld, started buying government securities to lessen the impact on yields from the rise in governmentborrowing. Although this helped market sentiment, it could not prevent a general rise in yieldstowards fiscal close. As a result, the 10 year benchmark sovereign yield closed the fiscal at 7% froma low of sub 5% hit in early January 2009. Money market rates stabilized after the initial mayhem ofSeptember 2008 and October 2008 and liquidity came back to interbank markets.
MARKET OUTLOOK(as furnished by HSBC Asset Management (India) Private Limited)
Equity Market Outlook
Financial Year (FY) 2008-09 was a year marked by a strong correlation between the Indian marketand global markets with key indices ending deeply in the red on the back of the subprime crisis andderivative led losses across major financial stocks in the United States (US). Even in India, forex lossesran across corporate India though at a smaller magnitude. FY 10 has begun on a better note onaccount of various fundamental and technical factors.
GDP for FY 09 grew at 6.7% against FY 08 levels of 9%. Agriculture posted a below trend growthrate of 1.6% and industry grew by 3.9% (versus 8.1% in FY 08) with services registering a close to9.7% growth. IIP grew by a mere 2.6%. Although order books of engineering / capital goods wererunning at record high levels, there was possibility of delays in execution as funding sources for thedevelopers (equity, ECB, private equity, FCCB) had dried up. A sharp increase in subsidy on accountof oil, fertilizers and food led to a cut back in discretionary spending. Inflation rose on the back of asurging crude and higher prices of agricultural commodities to top at 12.91% for the week ending 2August, 2008. A slow down in the growth rates in the US / EU and other markets finally tamed thesurge in crude. As growth rates stumbled, governments / monetary authorities the world over triggeredfiscal stimuli / monetary easing to escape recessionary forces. This was followed in India as wellwhich started monetary easing / fiscal stimuli to keep growth rates buoyant.
On the positive side, India continues to do better in relative terms and we expect GDP growth of 6-6.5% for FY10. The broad themes that are driving domestic growth viz. capital expenditure,infrastructure building and domestic consumption are still intact. The key concerns at this point
Trustees' ReportFor the year ended March 31, 2009 (Contd...)

5
stems from a ballooning fiscal deficit at the consolidated level (Centre & State) with salary revisionfor Central / State Government employees threatening a cut back in discretionary spending. Inflationis likely to remain benign for the first half of FY10 on a favourable base effect but we anticipate it togo back to trend levels of 5-5.5% for the second half of FY10 as this base effect wears off.
On a valuations perspective, the markets are currently trading at a P/E ratio of around 12 times FY2010 earnings. This is well below the 10-year average given the extreme risk aversion prevailing inthe markets. However, the underlying growth in the economy and corporate earnings growth (15%in the long term) makes the market attractive from a longer-term view. The short term could seeenhanced volatility arising from various factors. Increase in commodity prices continues to be a riskin the medium term as the US dollar continues to struggle with the ballooning US fiscal situation.
Debt Market Outlook
Excess supply of government bonds, as a result of fiscal slippages to arrest the downward growthmomentum, has been a reality for bond markets since January 2009. However, this is now compoundedwith some fatigue in buying longer duration as economic data is showing signs of recovery,commodities are showing signs of rally and expectations of incremental monetary easing from theRBI are beginning to unwind. However, system liquidity remains surplus and bank deposits continueto grow thereby providing resistance to bond yields from rising sharply.
Given the above factors, we believe that the market would continue to provide tactical opportunitiesalthough the fundamental bias should be for lower duration. Also, any mitigation of bond supplypressure or a new downturn in the ongoing economic recovery may provide space for opportunisticlonger duration plays. On the other hand, if the recovery cycle continues uninterrupted and commodityprices remain firm, central banks may start to worry about withdrawing the current monetary stimulusby sometime early 2010; with consequent impact on bond markets.
2. BRIEF BACKGROUND OF SPONSORS, BOARD OF TRUSTEES AND ASSETMANAGEMENT COMPANY
a) Sponsor
HSBC Mutual Fund is sponsored by HSBC Securities and Capital Markets (India) Private Limited (HSCI).The Sponsor is the Settler of the Mutual Fund Trust. The Sponsor has entrusted a sum of Rs. 1,00,000(Rupees One Lakh only) to the Trustee as the initial contribution towards the corpus of the MutualFund.
HSCI is a member of the HSBC Group, one of the largest banking and financial services organisations,in the world. Headquartered in London, HSBC operates through long-established businesses in fiveregions: Europe, Asia-Pacific, Middle East, America and Africa. Through its global network of 10,000offices in 86 countries and territories, HSBC provides a comprehensive range of financial services topersonal, commercial, corporate, institutional investment and private banking clients.
HSCI offers integrated investment banking services, securities and corporate finance & advisory. HSCIis a member of The Bombay Stock Exchange Limited and National Stock Exchange (capital and derivativemarket segments) and is also a category I merchant banker and underwriter registered with Securitiesand Exchange Board of India.
HSCI holds 100% of the paid-up equity share capital of the AMC.
b) HSBC Mutual Fund
HSBC Mutual Fund ("the Mutual Fund" or "the Fund") has been constituted as a Trust in accordancewith the provisions of the Indian Trusts Act, 1882 (2 of 1882) vide a Trust Deed dated February 7,2002 with HSBC Securities and Capital Markets (India) Private Limited, as the Sponsor and the Boardof Individual Trustees. The Trustee has entered into an Investment Management Agreement datedFebruary 7, 2002 with HSBC Asset Management (India) Private Limited (the AMC) to function as theInvestment Manager for all the Schemes of the Fund. The Fund was registered with SEBI videregistration number MF/046/02/5 dated May 27, 2002.
Trustees' ReportFor the year ended March 31, 2009 (Contd...)

6
The Trust has been formed for the purpose of pooling of capital from the public for collectiveinvestment in securities / any other property for the purpose of providing facilities for participationby persons as beneficiaries in such properties / investments and in the profits / income arising therefrom.
c) Board of Trustees (the Trustees)
The Board of Trustees are the exclusive owner of the Trust Fund and holds the same in trust for thebenefit of the unitholders. The Trustees have been discharging their duties and carrying out theirresponsibilities as provided in the SEBI (Mutual Funds) Regulations, 1996 and the Trust Deed. TheTrustees seeks to ensure that the Fund and the Schemes floated thereunder are managed by theAMC in accordance with the Trust Deed, the said Regulations, directions and guidelines issued bySEBI, the Stock Exchanges, the Association of Mutual Funds of India and other regulatory agencies.
d) Asset Management Company (the AMC)
HSBC Asset Management (India) Private Limited (the Investment Manager or the AMC) is a privatelimited company incorporated under the Companies Act, 1956 on December 12, 2001 having itsRegistered Office at 314, D. N. Road, Fort, Mumbai 400 001. HSBC Asset Management (India) PrivateLimited has been appointed as the Asset Management Company of the HSBC Mutual Fund by theTrustee vide Investment Management Agreement (IMA) dated February 7, 2002 and executed betweenthe Trustees and the AMC. SEBI approved the AMC to act as the Investment Manager of the Fundvide. its letter No. MFD/BC/163/2002 dated May 27, 2002.
The paid-up equity share capital of the AMC is Rs. 9 crores. HSBC Securities and Capital Markets(India) Private Limited holds 100% of the paid-up equity share capital of the AMC.
3. INVESTMENT OBJECTIVE OF THE SCHEMEThe investment objective of the Scheme has been provided above under the heading "SchemePerformance, Future Outlook and Operation of the Scheme" (refer Section 1).
4. SIGNIFICANT ACCOUNTING POLICIESThe accounting policies are in accordance with Securities and Exchange Board of India (Mutual Funds)Regulations, 1996.
5. UNCLAIMED DIVIDENDS & REDEMPTIONSNil.
6. INVESTOR SERVICESDuring the year, the number of official points of acceptance of transactions increased significantly toabout 182 locations. In addition to the offices of the transfer agency, the company has InvestorService Centres in 14 locations at its own offices - namely Mumbai, New Delhi, Kolkata, Chennai,Bangalore, Hyderabad, Pune, Ahmedabad, Indore, Chandigarh, Kochi, Coimbatore, Lucknow andVadodara. With a view to enhancing customer convenience, the Asset Management Company hasextended the facility of crediting investor bank accounts directly by way of NEFT / RTGS (for credit ofredemption and dividend proceeds). The AMC endeavours to despatch dividend proceeds within 5working days from the Record Date in all Schemes. The internal standards on redemption payoutshave been consistently met, with very few exceptions. The number of locations for the ECS AutoDebit facility for investments through Systematic Investment Plan also increased to about 74 byMarch 2009.
On the distribution front, the number of empanelled distributors increased from 7859 as on 31March, 2008 to 8632 as on 31 March, 2009. During the year, the Asset Management Companyinitiated tie-ups for online distribution of the Mutual Fund's schemes with several channel partnerstaking the total number of such tie-ups to 24 (Angel Capital & Department Market Ltd., Bajaj CapitalLimited, Bonanza Portfolio Limited, Citibank N.A., Citigroup Wealth Advisors India Private Limited,HDFC Bank Limited, Hongkong & Shanghai Banking Corporation Limited, HSBC Corporate Investment
Trustees' ReportFor the year ended March 31, 2009 (Contd...)

7
Solution Services, ICICI Securities Limited, India Infoline Limited, Karvy Stock Broking Limited, KotakMahindra Bank Limited, Kotak Securities Limited, Motilal Oswal Securities Limited, NJ India InvestPrivate Limited, Reliance Securities Limited, RR Investors Capital Services Private Limited, SBICAPSecurities Limited, Sharekhan Limited, SMC Global Securities Limited, Standard Chartered - STCICapital Markets Ltd., Tom Distribution Services Limited, Yes Bank Limited).
Call centre operations have been extended to cover the entire country. The Asset ManagementCompany has outsourced certain back office services including call centre services to HSBC Operationsand Processing Enterprise (India) Private Limited (HOPE).
7. STATUTORY DETAILSa) The Sponsors are not responsible or liable for any loss resulting from the operation of the Schemes
of the Fund beyond initial contribution of Rs. 1 lakh for setting up the Fund.
b) The price and redemption value of the units, and income from them, can go up as well as downwith fluctuations in the market value of its underlying investments.
c) Full / Abridged Annual Report shall be disclosed on the website at www.assetmanagement.hsbc.com/inand shall be available for inspection at the Head Office of the mutual fund. Present and prospectiveunit holder can obtain copy of the trust deed, the Full / Abridged Annual Report of the Scheme(s),the Annual Report of HSBC Asset Management (India) Private Limited and the text of the relevantScheme(s) at a price.
8. ACKNOWLEDGEMENTSThe Trustees wish to thank the Unitholders of the Schemes for their support throughout the year andalso thank the Government of India, the Securities and Exchange Board of India (SEBI), the ReserveBank of India (RBI) and the Association of Mutual Funds in India (AMFI) for the guidance provided bythem. The Trustees also appreciate the service provided by the Registrar and Transfer Agent, FundAccountant, Custodian, Bankers, Distributors and Brokers. The guidance and services provided bythe Auditors and advocates and the ebullience, sincerity and dedication of the employees of HSBCAsset Management (India) Private Limited is also appreciated.
The Trustees look forward to the continued support of everyone.
For and on behalf of the Board of Trustees of HSBC Mutual Fund
Dilip J. Thakkar
Trustee
MUMBAIJuly 6, 2009
Trustees' ReportFor the year ended March 31, 2009 (Contd...)

8
To the Board of Trustees of
HSBC MUTUAL FUND
1. We have audited the Balance Sheet of HSBC Mutual Fund – HSBC Flexi Debt Fund (“The Scheme”)as at March 31, 2009 and the related Revenue Account for the year ended on that date, both ofwhich we have signed under reference to this report. These financial statements are theresponsibility of the Board of Trustees of HSBC Mutual Fund and the Management of HSBC AssetManagement (India) Private Limited (the “Management”). Our responsibility is to express anopinion on these financial statements based on our audit.
2. We have conducted our audit in accordance with auditing standards generally accepted in India.Those standards require that we plan and perform the audit to obtain reasonable assuranceabout whether the financial statements are free of material misstatement. An audit includesexamining, on a test basis, evidence supporting the amounts and disclosures in the financialstatements. Our procedures included confirmation of securities owned and unit capital balancesas at March 31, 2009 by correspondence with the custodian / others and registrar and transferagent respectively. An audit also includes assessing the accounting principles used and significantestimates made by the Management as well as evaluating the overall financial statementpresentation. We believe that our audit provides a reasonable basis for our opinion.
3. We have obtained all the information and explanations which to the best of our knowledge andbelief were necessary for the purpose of our audit. The Balance Sheet and the Revenue Accountreferred to above are in agreement with the books of account of the Scheme.
4. In our opinion and to the best of our information and according to the explanations given to us,
(i) The Balance Sheet and the Revenue Account together with the notes thereon give theinformation required by the Securities and Exchange Board of India (Mutual Funds) Regulations,1996 and amendments thereto, as applicable, and also give respectively, a true and fair viewof the state of affairs of HSBC Mutual Fund – HSBC Flexi Debt Fund as at March 31, 2009 andits net surplus for the year ended March 31, 2009.
(ii) The Balance Sheet as at March 31, 2009 and the Revenue Account for the year ended March31, 2009, together with the notes thereon have been prepared in all material respects inaccordance with the accounting policies and standards specified in the Ninth Schedule of theSecurities and Exchange Board of India (Mutual Funds) Regulations, 1996 and amendmentsthereto as applicable.
(iii)The method used to value:
(a) non-traded debt securities in accordance with the guidelines for valuation of securitiesfor mutual funds dated September 18, 2000 and amendments thereto, as applicable,issued by the Securities and Exchange Board of India and
(b) privately placed securities and government securities in good faith as at March 31, 2009as determined by HSBC Asset Management (India) Private Limited under proceduresapproved by the Board of Trustees of HSBC Mutual Fund are fair and reasonable.
Partha GhoshPartnerMembership No. F / 55913
For and on behalf ofPRICE WATERHOUSEChartered Accountants
Place : MumbaiDate: July 6, 2009
Auditors' Report

9
Rs. in Lakhs
HSBC FLEXI DEBT FUND
As at As atMarch 31, 2009 March 31, 2008
LIABILITIES1 Unit Capital 29,868.43 23,179.59
2 Reserves & Surplus2.1 Unit Premium Reserves 1,014.82 10.032.2 Unrealised Appreciation Reserve 141.50 12.682.3 Other Reserves 659.15 330.21
3 Loans & Borrowings – –
4 Current Liabilities & Provisions4.1 Provision for doubtful Income / Deposits – –4.2 Other Current Liabilities & Provisions 428.67 29.60
TOTAL 32,112.57 23,562.11
ASSETS1 Investments
1.1 Listed Securities:1.1.1 Equity Shares – –1.1.2 Preference Shares – –1.1.3 Equity Linked Debentures – –1.1.4 Other Debentures & Bonds 17,391.36 10,719.921.1.5 Securitised Debt securities – –1.2 Securities Awaited Listing:1.2.1 Equity Shares – –1.2.2 Preference Shares – –1.2.3 Equity Linked Debentures – –1.2.4 Other Debentures & Bonds – –1.2.5 Securitised Debt securities – –1.3 Unlisted Securities:1.3.1 Equity Shares – –1.3.2 Preference Shares – –1.3.3 Equity Linked Debentures – –1.3.4 Other Debentures & Bonds 206.94 3,162.031.3.5 Securitised Debt securities – –1.4 Government Securities 11,625.91 –1.5 Treasury Bills – –1.6 Commercial Paper – –1.7 Certificate of Deposits – 5,034.911.8 Bill Rediscounting – –1.9 Units of Domestic Mutual Fund – –1.10 Foreign Securities – –
Total Investments 29,224.21 18,916.86
2 Deposits – –
3 Other Current Assets3.1 Cash & Bank Balance 8.00 106.173.2 CBLO / Reverse Repo Lending 1,488.59 4,172.423.3 Others 1,391.77 366.66
4 Deferred Revenue Expenditure – –(to the extent not written off)
TOTAL 32,112.57 23,562.11
Notes to Accounts – Annexure I
Abridged Balance Sheet as at March 31, 2009

10
Rs. in Lakhs
HSBC FLEXI DEBT FUND
Current PreviousYear ended Year ended
March 31, 2009 March 31, 2008
1 INCOME1.1 Dividend – –1.2 Interest 1,378.18 882.671.3 Realised Gain / (Loss) on Foreign Exchange Transactions – –1.4 Realised Gains / (Losses) on Interscheme
sale of investments (28.31) 16.631.5 Realised Gains / (Losses) on External
sale / redemption of investments (242.09) 108.721.6 Realised Gains / (Losses) on Derivative Transactions – –1.7 Other Income – –
(A) 1,107.78 1,008.02
2 EXPENSES2.1 Management fees 103.23 59.612.2 Service tax on Management fees ** – –2.3 Transfer agents fees and expenses 9.58 4.472.4 Custodian fees 2.14 2.022.5 Trusteeship fees 0.07 0.032.6 Commission to Agents* – –2.7 Marketing & Distribution expenses 140.36 16.992.8 Audit fees 1.00 1.002.9 Other operating expenses 1.61 1.04
(B) 257.99 85.16
3 NET REALISED GAINS / (LOSSES)FOR THE YEAR / PERIOD (A - B = C) 849.79 922.86
4 Change in Unrealised Depreciationin value of investments (D) 301.81 89.65
5 NET GAINS / (LOSSES)FOR THE YEAR / PERIOD [E = (C - D)] 547.98 833.21
6 Change in unrealised appreciationin the value of investments (F) 128.82 (12.68)
7 NET SURPLUS / (DEFICIT)FOR THE YEAR / PERIOD (E + F = G) 676.80 820.53
7.1 Add: Balance transfer fromUnrealised Appreciation Reserve – 12.68
7.2 Less: Balance transfer to UnrealisedAppreciation Reserve 128.82 –
7.3 Add / (Less): Equalisation 821.97 220.327.4 Transfer from Reserve Fund 108.28 –7.5 Transfer from Unit Premium Reserve 6.62 2.23
8 TOTAL 1,484.85 1,055.76
9 Dividend Appropriation9.1 Income Distributed during the year / period 876.79 596.389.2 Tax on income distributed during the year / period 170.83 129.1710 Retained Surplus / (Deficit)
carried forward to Balance Sheet 437.23 330.21
Notes to Accounts - Annexure I
* Commission to Agents is included in Marketing & Distribution Expenses.** Service Tax on Management Fees is included in Other Operating Expenses.
Abridged Revenue Account for the year endedMarch 31, 2009

11
HSBC FLEXI DEBT FUND
Current PreviousYear ended Year ended
March 31, 2009 March 31, 2008
1. NAV per unit (Rs.):
Open
Regular Growth Option 10.4155 –
Regular Fortnightly Dividend Option 10.0315 –
Regular Monthly Dividend Option 10.0065 –
Regular Quarterly Dividend Option – –
Regular Half Yearly Dividend Sub Option – –
Institutional Growth Option 10.4333 –
Institutional Fortnightly Dividend Option 10.0302 –
Institutional Monthly Dividend Option 10.0706 –
Institutional Quarterly Dividend Sub Option – –
Institutional Half Yearly Dividend Sub Option – –
High
Regular Growth Option 12.6161 10.4515
Regular Fortnightly Dividend Option 11.2275 10.1839
Regular Monthly Dividend Option 11.1826 10.2267
Regular Quarterly Dividend Option 11.7939 –
Regular Half Yearly Dividend Sub Option 10.6149 –
Institutional Growth Option 12.6714 10.4626
Institutional Fortnightly Dividend Option 10.7002 10.1803
Institutional Monthly Dividend Option 11.4083 10.2491
Institutional Quarterly Dividend Sub Option 11.6816 –
Institutional Half Yearly Dividend Sub Option 10.1428 –
Low
Regular Growth Option 10.4134 10.0023
Regular Fortnightly Dividend Option 9.9126 9.9750
Regular Monthly Dividend Option 9.9361 9.9513
Regular Quarterly Dividend Option 9.9886 –
Regular Half Yearly Dividend Sub Option 9.6569 –
Institutional Growth Option 10.4315 10.0023
Institutional Fortnightly Dividend Option 9.6087 9.9729
Institutional Monthly Dividend Option 10.0689 10.0023
Institutional Quarterly Dividend Sub Option 9.8912 –
Institutional Half Yearly Dividend Sub Option 9.9835 –
Key Statistics for the year ended March 31, 2009

12
Key Statistics for the year ended March 31, 2009 (Contd...)
HSBC FLEXI DEBT FUND
Current PreviousYear ended Year ended
March 31, 2009 March 31, 2008
End
Regular Growth Option 11.6483 10.4155
Regular Fortnightly Dividend Option 10.3662 10.0315
Regular Monthly Dividend Option 10.2553 10.0065
Regular Quarterly Dividend Option 10.7885 –
Regular Half Yearly Dividend Sub Option 9.8005 –
Institutional Growth Option 11.7088 10.4333
Institutional Fortnightly Dividend Option 9.7535 10.0302
Institutional Monthly Dividend Option 10.5214 10.0706
Institutional Quarterly Dividend Sub Option 10.6734 –
Institutional Half Yearly Dividend Sub Option – –
2. Closing Assets Under Management (Rs. in Lakhs)
End 31,684 23,533
Average (AAuM)1 16,822 21,797
3. Gross income as % of AAuM2 6.59% 4.62%
4. Expense Ratio:
a. Total Expense as % of AAuM (planwise)
Regular Growth Option 1.77% 1.19%
Regular Fortnightly Dividend Option 1.77% 1.09%
Regular Monthly Dividend Option 1.77% 1.18%
Regular Quarterly Dividend Option 1.77% –
Regular Half Yearly Dividend Sub Option 1.77% –
Institutional Growth Option 0.72% 0.87%
Institutional Fortnightly Dividend Option 0.72% 0.78%
Institutional Monthly Dividend Option 0.72% 0.69%
Institutional Quarterly Dividend Sub Option 0.72% –
Institutional Half Yearly Dividend Sub Option 0.72% –
b. Management Fee as % of AAuM (planwise)
Regular Growth Option 0.61% 0.47%
Regular Fortnightly Dividend Option 0.61% 0.44%
Regular Monthly Dividend Option 0.61% 0.49%
Regular Quarterly Dividend Option 0.61% –
Regular Half Yearly Dividend Sub Option 0.61% –
Institutional Growth Option 0.61% 0.42%
Institutional Fortnightly Dividend Option 0.61% 0.48%

13
Institutional Monthly Dividend Option 0.61% 0.51%
Institutional Quarterly Dividend Sub Option 0.61% –
Institutional Half Yearly Dividend Sub Option 0.61%
5. Net Income as a percentage of AAuM3 5.05% 4.23%
6. Portfolio turnover ratio4 – –
7. Total Dividend per unit distributed during theyear / period (planwise)
Retail
Regular Fortnightly Dividend Option 0.7083 0.2945
Regular Monthly Dividend Option 0.8004 0.3538
Regular Quarterly Dividend Option 0.3217 –
Regular Half Yearly Dividend Sub Option – –
Institutional Fortnightly Dividend Option 1.2836 0.3277
Institutional Monthly Dividend Option 0.6767 0.3131
Institutional Quarterly Dividend Sub Option 0.3392 –
Institutional Half Yearly Dividend Sub Option – –
Corporate
Regular Fortnightly Dividend Option 0.5265 0.1980
Regular Monthly Dividend Option 0.7451 0.1512
Regular Quarterly Dividend Option 0.1794 –
Regular Half Yearly Dividend Sub Option – –
Institutional Fortnightly Dividend Option 1.1947 0.3050
Institutional Monthly Dividend Option 0.6299 0.2914
Institutional Quarterly Dividend Sub Option 0.1957 –
Institutional Half Yearly Dividend Sub Option – –
8. Returns:
a. Last One Year
Scheme
Regular Growth Option 11.8362 –
Regular Fortnightly Dividend Option 10.7470 –
Regular Monthly Dividend Option 10.6170 –
Regular Quarterly Dividend Option – –
Regular Half Yearly Dividend Sub Option – –
Institutional Growth Option 12.2253 –
Institutional Fortnightly Dividend Option 10.2613 –
Key Statistics for the year ended March 31, 2009 (Contd...)
HSBC FLEXI DEBT FUND
Current PreviousYear ended Year ended
March 31, 2009 March 31, 2008

14
Institutional Monthly Dividend Option 11.2484 –
Institutional Quarterly Dividend Sub Option – –
Institutional Half Yearly Dividend Sub Option – –
Benchmark
CRISIL Composite Bond Fund Index 7.2400 NA
b. Since Inception
Scheme
Regular Growth 10.8635 6.3844
Regular Fortnightly Dividend Option 9.5093 5.1050
Regular Monthly Dividend Option 9.6786 5.5682
Regular Quarterly Dividend Option 11.4951 1.0314
Regular Half Yearly Dividend Sub Option (6.9350) –
Institutional growth 11.2524 6.7556
Institutional Fortnightly Dividend Option 9.4175 5.6074
Institutional Monthly Dividend Option 10.2706 6.1894
Institutional Quarterly Dividend Sub Option 17.8091 –
Institutional Half Yearly Dividend Sub Option 74.4600 –
Benchmark
CRISIL Composite Bond Fund Index 7.1800 3.2966
1 AAuM = Average daily net assets
2 Gross income = amount against (A) in the Revenue Account i.e. Income.
3 Net income = amount against (C) in the Revenue Account i.e. NET REALISED GAINS / (LOSSES)FOR THE YEAR / PERIOD
4 Portfolio Turnover = Lower of sales or purchase divided by the Average AuM for the year / period.
Key Statistics for the year ended March 31, 2009 (Contd...)
HSBC FLEXI DEBT FUND
Current PreviousYear ended Year ended
March 31, 2009 March 31, 2008

15
Notes to Accounts - Annexure ITo the Abridged Balance Sheet and Revenue Account for the year ended March 31, 2009
HSBC FLEXI DEBT FUND
1 Investments:
1.1. It is confirmed that investments of the schemes are registered in the name of the Trustees forthe benefit of the scheme’s unitholders.
1.2. Open Positions of derivatives as a % to Net Assets as of year end March 31, 2009 is Nil. OpenPositions of derivatives as a % to Net Assets as of year end March 31, 2008 is NIL.
1.3. There were no investments made in Associates and Group Companies by the scheme for theyear ended March 31, 2009 and March 31, 2008.
1.4. Open positions of Securities Borrowed and / or Lent by the scheme as of the year endedMarch 31, 2009 and March 31, 2008 are NIL.
1.5. NPAs as at year ended March 31, 2009 and March 31, 2008 are NIL.
1.6. Aggregate Unrealised Gain / Loss as at the end of the Financial year 2008-09 and percentagesto net assets.
Security Amount Percentage to Amount Percentage toCategory (Rs.) Net Assets (Rs.) Net Assets
2009 2008
NCDs and Bonds Listed / Awaiting Listing
– Appreciation 19,512,641 0.6159% 762,733 0.0324%
– Depreciation 5,741,501 0.1812% 9,728,003 0.4134%
NCDs and Bonds Privately Placed
– Appreciation 403,039 0.0127% 1,268,169 0.0539%
– Depreciation 24,486 0.0008% – –
Government of India Securities
– Appreciation – – – –
– Depreciation 39,145,803 1.2355% – –
1.7 The aggregate value of investments securities purchased (excluding accretion of discount ofRs. 7,919,570) and sold during the financial year 2008-2009 is Rs. 15,365,196,103 andRs. 14,298,039,929 respectively being 869.38% (annualized) and 809.00% (annualized) ofthe average daily net assets.
The aggregate value of investment securities purchased (excluding accretion of discount ofRs. 22,031,909) and sold during the financial year 2007-2008 is Rs. 11,754,249,088 andRs. 9,889,432,954 respectively being 1,074.04% (annualized) and 903.64% (annualized) ofthe average daily net assets.
1.8. Non-Traded securities in the portfolio:Aggregate Value of Equity, Debt & Money Market Instruments and percentage to net assetsis as under
Security Fair Value % to Fair Value % toCategory (Rs.) Net Asset (Rs.) Net Asset
2009 2008
Equities – – – –
Debt Instruments 1,057,584,130.72 33.3792% 1,388,194,461.16 58.9905%
Money market Instruments – – 503,491,058.79 21.3956%
Total 1,057,584,130.72 33.3792% 1,891,685,519.95 80.3861%

16
Notes to Accounts - Annexure I (Contd...)To the Abridged Balance Sheet and Revenue Account for the year ended March 31, 2009
2 Disclosure under Regulation 25(8) of the Securities and Exchange Board of India (Mutual Funds)Regulations, 1996 as amended, for the year ended March 31, 2009.
Year - 2008-2009
During the year, The Hongkong and Shanghai Banking Corporation Limited, an associate entityof HSBC Asset Management (India) Private Limited was paid brokerage amounting to Rs. 3,796,113for procuring unit subscriptions for the Scheme. The brokerage paid was at rates similar to thoseoffered to other distributors.
Further, The Hongkong and Shanghai Banking Corporation Limited, an associate of the Sponsor,is on the panel of bankers with whom HSBC Mutual Fund places money on fixed deposits andenters into reverse repo transactions from time to time at competitive rates.
Year - 2007-2008During the year, The Hongkong and Shanghai Banking Corporation Limited, an associate entityof HSBC Asset Management (India) Private Limited was paid brokerage amounting to Rs. 180,163for procuring unit subscriptions for the Scheme. The brokerage paid was at rates similar to thoseoffered to other distributors.
Further, The Hongkong and Shanghai Banking Corporation Limited, an associate of the Sponsor,is on the panel of bankers with whom HSBC Mutual Fund places money on fixed deposits andenters into reverse repo transactions from time to time at competitive rates.
3 None of the Investors held more than 25% of the total net assets of the scheme at the yearended March 31, 2009 and year ended March 31, 2008.
4 Unit Capital movement during the years ended March 31, 2009 and March 31, 2008.
2008-2009
Description Opening Units Subscription Redemption Closing Units Face Value
Regular Growth 635,935.451 12,591,260.792 1,907,121.630 11,320,074.613 113,200,746.13
RegularMonthly Dividend 6,654,260.050 23,117,440.320 7,393,808.329 22,377,892.041 223,778,920.41
RegularFortnightly Dividend 3,972,727.223 3,894,517.663 5,015,364.981 2,851,879.905 28,518,799.05
RegularQuarterly Dividend Option – 7,180,810.305 533,270.909 6,647,539.396 66,475,393.96
RegularHalf Yearly Dividend Option – 197,382.137 – 197,382.137 1,973,821.37
Institutional Growth 69,174,404.939 146,234,661.989 137,929,506.220 77,479,560.708 774,795,607.08
InstitutionalMonthly Dividend 7,868,437.619 116,478,386.310 62,652,647.039 61,694,176.890 616,941,768.90
InstitutionalFortnightly Dividend 143,490,168.848 229,828,000.535 273,495,753.352 99,822,416.031 998,224,160.31
InstitutionalQuarterly Dividend Option – 21,443,255.956 5,149,854.761 16,293,401.195 162,934,011.95
InstitutionalHalf Yearly Dividend Option – 2,819,475.063 2,819,475.063 – 0.00

17
2007-2008
Description Subscription Redemption Closing Units Face Value
Regular - Growth 1,328,163.631 692,228.180 635,935.451 6,359,354.51
Regular - Monthly Dividend 12,380,985.966 5,726,725.916 6,654,260.050 66,542,600.50
Regular - Fortnightly Dividend 4,413,249.168 440,521.945 3,972,727.223 39,727,272.23
Institutional - Growth 102,014,215.087 32,839,810.148 69,174,404.939 691,744,049.39
Institutional - Monthly Dividend 83,732,950.689 75,864,513.070 7,868,437.619 78,684,376.19
Institutional - Fortnightly Dividend 257,103,696.336 113,613,527.488 143,490,168.848 1,434,901,688.48
Notes to Accounts - Annexure I (Contd...)To the Abridged Balance Sheet and Revenue Account for the year ended March 31, 2009
5 Previous year’s figures have been re-grouped / re-arranged where appropriate.
6 No contingent liabilities for the years ended March 31, 2009 and March 31, 2008.
7 Expenses other than Management Fees are inclusive of Service Tax where applicable.
8. The Annual Accounts of the Schemes prepared in accordance with the accounting policies andstandards specified in the Ninth Schedule of The Securities and Exchange Board of India (MutualFunds) Regulations, 1996 has been approved by the Board of Directors of HSBC Asset Management(India) Private Limited and The Board of Trustees of HSBC Mutual Fund at their meeting held onJuly 06, 2009. The audit report attached herewith refers to the said annual accounts. The aforesaidabridged accounts are an extract of the Annual Accounts and are prepared in accordance withSEBI Circular No. IMD/Cir 8/132968/2008 dated July 24, 2008.

18
DISCLAIMERS
The content of this report has been prepared by HSBC Asset Management (India) Private Limited(HSBC) for information purposes only and should not be construed as an offer or solicitation ofan offer for purchase of any of the funds of HSBC Mutual Fund. The information is for generalinformation only and does not have regard to specific investment objectives, financial situationand the particular needs of any specific person who may receive this information. Investmentsin mutual funds inherently involve risks and investors should read the relevant documents /information for details and risk factors and consult their legal, tax and financial advisors beforeinvesting. Investors should understand that statements made herein regarding future prospectsmay not be realised. Neither this document nor the units of HSBC Mutual Fund have beenregistered in any jurisdiction. The distribution of this document in certain jurisdictions may berestricted or totally prohibited and accordingly, persons who come into possession of thisdocument are required to inform themselves about, and to observe, any such restrictions.
Investors may obtain Statement of Additional Information, Combined Scheme InformationDocument and Common Key Information Memorandums along with application forms fromthe office of HSBC Mutual Fund, 314, D. N. Road, Fort, Mumbai 400 001. Tel: 022-6666 8819.
Statutory Details:HSBC Mutual Fund has been set up as a trust by HSBC Securities and Capital Markets (India)Private Limited (liability restricted to the corpus of Rs. 1 lakh). The Sponsor/associates of theSponsor/Asset Management Company (AMC) are not responsible or liable for any loss or shortfallresulting from the operation of the Schemes. The Trustees of HSBC Mutual Fund have appointedHSBC Asset Management (India) Private Limited as the Investment Manager.
Risk Factors:All investments in mutual funds and securities are subject to market risks and the Net AssetValue (NAV) of the Scheme(s) may go up or down depending on the factors and forces affectingthe securities markets. There can be no assurance that the objectives of the Scheme(s) will beachieved. Past performance of the Sponsor, AMC, Mutual Fund or any associates of the Sponsor/AMC does not indicate the future performance of the Scheme(s) of the Mutual Fund. HSBCFlexi Debt Fund (HFDF) is the names of the Scheme and does not in any manner indicate thequality of the Scheme or its future prospects or returns.
Terms of Issue:Units of the Scheme(s) are being offered at NAV based prices, subject to the prevailing loads.The AMC calculates and publishes NAVs and offers for sale, redemption and switch outs, unitsof the Scheme(s) on all Business Days, at the Applicable NAV for all Schemes (at least once aweek, i.e., every Wednesday and daily during the period of redemption in case of HSCF).HUOF, HSCF & HFTS will not be open for ongoing subscriptions/ switch ins. HUOF & HSCFwould be available for sale on an ongoing basis (after a period of 3 years from the date ofallotment). Conversion of HUOF & HSCF to an open-ended scheme will be done only after thebalance unamortized amount has been fully recovered from the Scheme. Units can be redeemed/switched out on every Business Day at NAV based prices, subject to prevailing exit loads. Incase of HSCF, units can be redeemed / switched out on a monthly basis on the stipulated datei.e. last 3 business days of every month at NAV based prices, subject to provisions of exit load,if any and recovery of balance proportionate unamortized NFO expenses.
Load Structure (includes SIP/STP):Entry - Nil.Exit - 0.75% in Regular Option, if redeemed / switched out within 6 months from the date ofinvestment and 0.25% in Regular Option, investments redeemed / switched out from greaterthan 6 months to 1 year.
Consult the nearest investor service centre for details.
The entry/exit load set forth above is subject to change at the discretion of the AMC and suchchanges shall be implemented prospectively.
Mutual Fund investments are subject to market risks. Please read the Statement of AdditionalInformation and Scheme Information Document carefully before investing.

19
Value Research Online DisclaimerValue Research Fund Ratings: Value Research Fund Ratings are a composite measure of historical risk-adjusted returns. In the case of equity funds this rating is based on the average monthly returns forthe last 3-year and 5-year period. These ratings do not take into account any entry or exit load.
Value Research Fund Ratings are subject to change every month. Current Fund Ratings are as onMarch 31, 2009. 142 open-ended Equity: Diversified Funds were rated. The Rating is based on primarydata provided by respective funds; Value Research does not guarantee the accuracy. Ranking Entity:Value Research Online.
ICRA Online Ranking MethodologyHSBC Monthly Income - Savings Plan has been ranked as a Five Star Fund in the category of 'OpenEnded Marginal Equity' schemes for its 3 year performance till December 31, 2008.
The rank is an outcome of an objective and comparative analysis against various parameters, including:risk adjusted return, fund size, company concentration, portfolio turnover and liquidity. The rankingmethodology did not take into account entry and exit loads imposed by the Fund. There were 27schemes considered in 'Open Ended Marginal Equity' category for the ranking exercise. The rank isneither a certificate of statutory compliance nor any guarantee on the future performance of HSBCMonthly Income - Savings Plan. Ranking Source & Publisher: ICRA Online Limited.
CRISIL Ranking MethodologyThe selection for the awards is based on the CRISIL FundServices' Composite Performance Ranking(CRISIL~CPR) methodology.
The CRISIL Composite Performance Ranking (CRISIL~CPR) is a quarterly ranking of mutual fund schemesbased on two year performance (excepting for the liquid and short term debt categories where a oneyear performance horizon is considered). The methodology is based on global best practices,customized to account for Indian market nuances. Over time, the rankings have become the industrystandard with good acceptance among Investors, Fund Intermediaries, Asset Management Companies,etc. The performance criteria covers not only risk adjusted returns, which are historical, but also theportfolio constitution to make the analysis forward looking.
CRISIL DisclaimerThe overall ranking is assigned to the scheme based on its weighted average score on a range ofparameters: Superior Return Score, Concentration, Liquidity, Asset Quality - Measures the creditquality of the portfolio, Average Maturity and Asset Size. HSBC MIP - Savings was the only schemethat won the CNBC TV18 - CRISIL Mutual Fund of the Year Award in the Category - Monthly IncomePlans - Aggressive. In total 13 schemes were eligible for the award universe. Schemes present in allfour quarterly CRISIL CPRs were considered for the award. The award is based on consistency of thescheme's performance in the four quarterly CRISIL CPR rankings released during the calendar year2008. The individual CRISIL CPR parameter scores averaged for the four quarters were further multipliedby the parameter weights as per the CRISIL CPR methodology to arrive at the final scores. A detailedmethodology of the CRISIL CPR is available at www.crisil.com. Past performance is no guarantee offuture results. Rankings and Award Source: CRISIL Fund Services, CRISIL Ltd. HSBC Monthly Income -Savings Plan has been ranked as a Five Star Fund in the category of 'Open Ended Marginal Equity'schemes for its 3 year performance till December 31, 2008. The rank is an outcome of an objectiveand comparative analysis against various parameters, including: risk adjusted return, fund size,company concentration, portfolio turnover and liquidity. The ranking methodology did not take intoaccount entry and exit loads imposed by the Fund. There were 27 schemes considered in 'OpenEnded Marginal Equity' category for the ranking exercise. The rank is neither a certificate of statutorycompliance nor any guarantee on the future performance of HSBC Monthly Income - Savings Plan.Ranking Source & Publisher: ICRA Online Limited.

This page is intentionally left blank.

Issued by HSBC Asset Management (India) Private Limited
HSBC Global Asset Management
HSBC Fixed Term SeriesA close-ended income Scheme
Abridged Annual Report 2008 - 2009

1
Dear Investor,
We thank you for investing with HSBC Mutual Fund. We are pleased to inform you that HSBCMutual Fund has won prestigious awards* this year at various forums in India.
The awards* won by our schemes in India are
� HSBC Equity Fund has been included in the 5 star rated fund category (“Top rated mutualfunds” by Value Research online) in March, 2009.
� Five-stars indicate that a fund is in the top 10 per cent of its category in terms ofhistorical risk-adjusted returns.
� ICRA Mutual Fund Awards 2009
� HSBC MIP - Savings has been ranked a 5-Star Fund by ICRA Online indicating performanceamong the top 10% in the category of 'Open Ended Marginal Equity' for 3 yearperformance ending 31 December, 2008.
� CNBC TV18 - CRISIL Mutual Fund Awards 2008
� HSBC MIP - Savings was awarded the CNBC TV18 - CRISIL Mutual Fund of the YearAward for the year 2008 in the Monthly Income Plans - Aggressive Category.
(Past performance is no guarantee of future results. * Please refer to Ranking methodologyand disclaimer mentioned at the end of the Abridged Annual Report for the year endedMarch 31, 2009).
At the global level, the HSBC Group won several awards at Euromoney's Awards for Excellence2009. The top awards that HSBC won were the Best Global Bank and the Best Global DebtHouse. It was also honoured as the Best Debt House in 8 locations including Asia and the Bestat Risk Management in Asia. (Past performance may or may not be sustained in the future andis no guarantee of future results). We continue to be one of the leading players in emergingmarkets and remain committed to our asset management business in India.
HSBC Asset Management (India) Private Limited including the mutual fund business as well asthe PMS business (including EPFO money deployed till date) manages assets of about Rs. 26280Crores as at 30 June, 2009. The core to our winning strategy is our endeavour to deliverconsistent performance over the medium to long term for our investors in a risk controlledenvironment and aim for consistent wealth creation under varying market conditions. Throughour product range, we aim to be true to our reputation in India of being a provider ofinternational quality investment products and services.
We remain committed to our philosophy of aiming for consistent wealth creation and serviceexcellence and look forward to your continued investments in HSBC Mutual Fund.
Yours sincerely,
VikramaadityaChief Executive OfficerHSBC Asset Management (India) Private Limited

2
SPONSORHSBC Securities and Capital Markets (India) Private LimitedRegd. Office: 52/60, Mahatma Gandhi Road, Fort, Mumbai 400 001.
TRUSTEEBoard of TrusteesOffice: 314, D. N. Road, Fort, Mumbai 400 001.
ASSET MANAGEMENT COMPANYHSBC Asset Management (India) Private LimitedCorp. & Regd. Office: 314, D. N. Road, Fort, Mumbai 400 001.
CUSTODIANJP Morgan Chase BankCorp. & Regd. Office: Mafatlal Centre, 9th Floor, Nariman Point, Mumbai - 400 021.
AUDITORS TO THE SCHEMEPrice WaterhouseChartered Accountants252, Veer Savarkar Marg, Shivaji Park, Dadar (West), Mumbai - 400 028.
LEGAL ADVISORSBharucha & Partners4th Floor, Cecil Court, Mahakavi Bhushan Marg, Colaba, Mumbai - 400 039.
REGISTRAR & TRANSFER AGENTSComputer Age Management Services (P) Ltd. (CAMS)Rayala Towers, Tower I, III Floor, 158 Anna Salai, Chennai - 600 002.
BOARD OF TRUSTEESMr. N. P. Gidwani - Chairman
Dr. Rudolf ApenbrinkMr. Nasser MunjeeMr. Manu TandonMr. Mehli MistriMr. Dilip J. Thakkar
BOARD OF DIRECTORSMs. Naina Lal Kidwai - Chairman
Mr. Ayaz EbrahimMr. S. P. Mustafa**Mr. Vithal PalekarMs. Kishori J. Udeshi*Mr. Vikramaaditya - Chief Executive Officer***
* Ms. Kishori Udeshi has been appointed as a Director with effect from 14 January 2009 andMr. Jagjit Lal Pasricha has resigned as a Director with effect from 19 January 2009.
** Mr. S. P. Mustafa has been appointed as a Director with effect from 2 September 2008 andMr. Nawshir Khurody has resigned as a Director with effect from 1 September 2008.
*** Mr. Vikramaaditya has been appointed as the Chief Executive Officer with effect from 16 July 2008and Mr. Sanjay Prakash has resigned as the Chief Executive Officer with effect from 16 July 2008.

3
Trustees' ReportFor the year ended March 31, 2009
The Trustees present the seventh report and the audited financial statements of the Schemes ofHSBC Mutual Fund (the "Fund"), for the year ended March 31, 2009.
1. SCHEME PERFORMANCE, FUTURE OUTLOOK AND OPERATIONS OF THE SCHEME
a) Operations and Performance of the Scheme
HSBC Fixed Term Series (HFTS) – a close-ended Income Scheme
HFTS seeks generation of reasonable returns by investing in a portfolio of fixed income instrumentsnormally maturing in line with the time profile of the respective plan(s). The Plans which were launchedduring the year, HSBC Fixed Term Series 50, HSBC Fixed Term Series 51, HSBC Fixed Term Series 52,HSBC Fixed Term Series 53, HSBC Fixed Term Series 54, HSBC Fixed Term Series 55, HSBC Fixed TermSeries 56, HSBC Fixed Term Series 57, HSBC Fixed Term Series 58, HSBC Fixed Term Series 59, HSBCFixed Term Series 60, HSBC Fixed Term Series 61, HSBC Fixed Term Series 62, HSBC Fixed Term Series63, HSBC Fixed Term Series 66 and HSBC Fixed Term Series 68. The Plans which matured during theyear are HSBC Fixed Term Series 21, HSBC Fixed Term Series 22, HSBC Fixed Term Series 23, HSBCFixed Term Series 24, HSBC Fixed Term Series 25, HSBC Fixed Term Series 27, HSBC Fixed Term Series28, HSBC Fixed Term Series 32, HSBC Fixed Term Series 33, HSBC Fixed Term Series 35, HSBC FixedTerm Series 36, HSBC Fixed Term Series 37, HSBC Fixed Term Series 47, HSBC Fixed Term Series 48,HSBC Fixed Term Series 51, HSBC Fixed Term Series 55, HSBC Fixed Term Series 58, HSBC Fixed TermSeries 60 and HSBC Fixed Term Series 68.
The fixed term plans as on 31 March, 2009 are as follows:
Scheme Name Date of Launch Tenure Date of Net Assets as on(NFO Open date) Maturity 31 March, 2009
(in Rs. Crores)
HSBC Fixed Term Series 30 03-May–2007 3 years 10-June-2010 87.12
HSBC Fixed Term Series 41 28-November-2007 16 months 20-April-2009 36.08
HSBC Fixed Term Series 42 29-January-2008 16 months 08-June-2009 685.099
HSBC Fixed Term Series 44 04-March-2008 13 months 19-April-2009 99.52
HSBC Fixed Term Series 45 18-March-2008 370 days 02-April-2009 19.98
HSBC Fixed Term Series 46 24-March-2008 370 days 02-April-2009 248.71
HSBC Fixed Term Series 49 28-March-2008 370 days 02-April-2009 361.50
HSBC Fixed Term Series 50 17-April-2008 370 days 04-May-2009 478.01
HSBC Fixed Term Series 52 24-April-2008 1 year 07-May-2009 221.15
HSBC Fixed Term Series 53 23-May-2008 370 days 03-June-2009 138.62
HSBC Fixed Term Series 54 27-May-2008 370 days 17-June-2009 174.72
HSBC Fixed Term Series 56 25-July-2008 370 days 12-Aug-2009 121.40
HSBC Fixed Term Series 57 13-August-2008 370 days 27-Aug-2009 59.005
HSBC Fixed Term Series 59 07-July-2008 1 year 16-July-2009 339.37
HSBC Fixed Term Series 61 17-July-2008 1 year 30-July-2009 91.53
HSBC Fixed Term Series 62 22-Aug-2008 1 year 27-Aug-2009 442.16
HSBC Fixed Term Series 63 04-Sep-2008 1 year 10-Sep-2009 95.03
HSBC Fixed Term Series 66 18-September-2008 18 months 01-April-2010 65.80
Past performance may or may not be sustained in future.

4
b) Market Overview & Outlook
MARKET OVERVIEW(as furnished by HSBC Asset Management (India) Private Limited)
Equity Market Overview
The financial year ended 31 March, 2009 was a highly eventful one with long standing institutionsdisappearing from the landscape in the whirlwind of the sub-prime crisis and derivative losses. Theyear can be split into three phases - the first from April 2008 till when Lehman Brothers filed forbankruptcy, which saw a blowout commodity rally (crude oil nudged close to USD 144/barrel) andthe sub-prime situation turning progressively worse. The United States (US) Government / FederalReserve bailed out major institutions thought to be critical to the functioning of the financial system.The second phase from September 2008 till January 2009 saw a spate of bankruptcies most notablyLehman Brothers which saw the appearance of an acute level of risk aversion pushing the creditmarkets into a gridlock. This phase also coincided with the fiscal / monetary stimuli by variousgovernments to take the credit crisis head on. Globally, markets stabilized around their October2008 lows and a semblance of normality started re-appearing in financial markets in this period. Thethird phase from February 2009 onwards witnessed a sharp rally as a weakening US Dollar spewedmoney into emerging markets. The sensex fell by 38% during the financial year.
For the financial year 2009, the popular indices viz. BSE Sensex and CNX Nifty were down 37.94%and 36.19% respectively. The BSE Midcap (54.01)% and the broader indices like BSE 200 (40.98)%and BSE 500 (42.77)% also reflected the correction across the markets. Within sectoral indices thebest performing indices were BSE FMCG (11.08)% and BSE Oil and Gas (29.58)% while the worstperforming indices were BSE Realty (79.37)%, due to the high leverage on the balance sheets, BSEMetals (58.67)%, due to slowdown in global growth and BSE Consumer Durables (58.14)% and BSECapital goods (53.84%).
In a year that saw sell-off across emerging markets, FIIs were net sellers of the tune USD 10.4 billionin the Indian equity markets while Domestic Institutional Investors (Insurance & Mutual Funds) werebuyers to the tune of USD 13.1 billion. Further, FIIs were net sellers in the derivative markets ashedge funds, and p-notes unwound positions in a rapidly deleveraging world. Thus, sentimentremained negative as few US based investment banks filed for bankruptcy in the midst of the liquidityand credit crisis and safety took precedence over growth.
Debt Market Overview
Two contrarian forces one inflationary and the other deflationary had been in play since 2007: Onthe one hand strong demand from emerging economies were leading commodities higher and fuellinginflation, while on the other the housing led credit crisis in the US was starting to exert a deflationaryforce. The first force was dominant till early July 2008 leading commodity prices to fresh peaks andinflation to multi year highs. Since then, however, the second force took hold with the result thatcommodity prices fell sharply from the top, growth and inflation numbers toppled worldwide, andcentral bankers shifted focus to achieving financial stability and protecting growth.
The financial crisis hit the domestic markets towards September 2008, leading to acute disruption inmoney markets. The Reserve Bank of India (RBI) acted proactively cutting the cash reserve ratio (CRR)by an unprecedented 400 bps between September 2008 and January 2009. Similarly, the reverserepo rate had been cut by 275 bps since October 2008 while the repo rate had been cut by 425 bpsover the same period.
Bond market yields fell in line with the unprecedented monetary easing up till the first week ofJanuary 2009. Thereon, supply pressures on bond markets rose as a result of government fiscalslippages aimed at stimulating the economy. The RBI, in line with similar measures elsewhere in theworld, started buying government securities to lessen the impact on yields from the rise in governmentborrowing. Although this helped market sentiment, it could not prevent a general rise in yieldstowards fiscal close. As a result, the 10 year benchmark sovereign yield closed the fiscal at 7% froma low of sub 5% hit in early January 2009. Money market rates stabilized after the initial mayhem ofSeptember 2008 and October 2008 and liquidity came back to interbank markets.
Trustees' ReportFor the year ended March 31, 2009 (Contd.)

5
MARKET OUTLOOK(as furnished by HSBC Asset Management (India) Private Limited)
Equity Market Outlook
Financial Year (FY) 2008-09 was a year marked by a strong correlation between the Indian marketand global markets with key indices ending deeply in the red on the back of the subprime crisis andderivative led losses across major financial stocks in the United States (US). Even in India, forex lossesran across corporate India though at a smaller magnitude. FY 10 has begun on a better note onaccount of various fundamental and technical factors.
GDP for FY 09 grew at 6.7% against FY 08 levels of 9%. Agriculture posted a below trend growthrate of 1.6% and industry grew by 3.9% (versus 8.1% in FY 08) with services registering a close to9.7% growth. IIP grew by a mere 2.6%. Although order books of engineering / capital goods wererunning at record high levels, there was possibility of delays in execution as funding sources for thedevelopers (equity, ECB, private equity, FCCB) had dried up. A sharp increase in subsidy on accountof oil, fertilizers and food led to a cut back in discretionary spending. Inflation rose on the back of asurging crude and higher prices of agricultural commodities to top at 12.91% for the week ending 2August, 2008. A slow down in the growth rates in the US / EU and other markets finally tamed thesurge in crude. As growth rates stumbled, governments / monetary authorities the world over triggeredfiscal stimuli / monetary easing to escape recessionary forces. This was followed in India as wellwhich started monetary easing / fiscal stimuli to keep growth rates buoyant.
On the positive side, India continues to do better in relative terms and we expect GDP growth of6-6.5% for FY10. The broad themes that are driving domestic growth viz. capital expenditure,infrastructure building and domestic consumption are still intact. The key concerns at this pointstems from a ballooning fiscal deficit at the consolidated level (Centre & State) with salary revisionfor Central / State Government employees threatening a cut back in discretionary spending. Inflationis likely to remain benign for the first half of FY10 on a favourable base effect but we anticipate it togo back to trend levels of 5-5.5% for the second half of FY10 as this base effect wears off.
On a valuations perspective, the markets are currently trading at a P/E ratio of around 12 timesFY 2010 earnings. This is well below the 10-year average given the extreme risk aversion prevailing inthe markets. However, the underlying growth in the economy and corporate earnings growth (15%in the long term) makes the market attractive from a longer-term view. The short term could seeenhanced volatility arising from various factors. Increase in commodity prices continues to be a riskin the medium term as the US dollar continues to struggle with the ballooning US fiscal situation.
Debt Market Outlook
Excess supply of government bonds, as a result of fiscal slippages to arrest the downward growthmomentum, has been a reality for bond markets since January 2009. However, this is now compoundedwith some fatigue in buying longer duration as economic data is showing signs of recovery,commodities are showing signs of rally and expectations of incremental monetary easing from theRBI are beginning to unwind. However, system liquidity remains surplus and bank deposits continueto grow thereby providing resistance to bond yields from rising sharply.
Given the above factors, we believe that the market would continue to provide tactical opportunitiesalthough the fundamental bias should be for lower duration. Also, any mitigation of bond supplypressure or a new downturn in the ongoing economic recovery may provide space for opportunisticlonger duration plays. On the other hand, if the recovery cycle continues uninterrupted and commodityprices remain firm, central banks may start to worry about withdrawing the current monetary stimulusby sometime early 2010; with consequent impact on bond markets.
2. BRIEF BACKGROUND OF SPONSORS, BOARD OF TRUSTEES AND ASSETMANAGEMENT COMPANY
a) Sponsor
HSBC Mutual Fund is sponsored by HSBC Securities and Capital Markets (India) Private Limited (HSCI).The Sponsor is the Settler of the Mutual Fund Trust. The Sponsor has entrusted a sum of Rs. 1,00,000
Trustees' ReportFor the year ended March 31, 2009 (Contd.)

6
(Rupees One Lakh only) to the Trustee as the initial contribution towards the corpus of the MutualFund.
HSCI is a member of the HSBC Group, one of the largest banking and financial services organisations,in the world. Headquartered in London, HSBC operates through long-established businesses in fiveregions: Europe, Asia-Pacific, Middle East, America and Africa. Through its global network of 10,000offices in 86 countries and territories, HSBC provides a comprehensive range of financial services topersonal, commercial, corporate, institutional investment and private banking clients.
HSCI offers integrated investment banking services, securities and corporate finance & advisory. HSCIis a member of The Bombay Stock Exchange Limited and National Stock Exchange (capital and derivativemarket segments) and is also a category I merchant banker and underwriter registered with Securitiesand Exchange Board of India.
HSCI holds 100% of the paid-up equity share capital of the AMC.
b) HSBC Mutual Fund
HSBC Mutual Fund ("the Mutual Fund" or "the Fund") has been constituted as a Trust in accordancewith the provisions of the Indian Trusts Act, 1882 (2 of 1882) vide a Trust Deed dated February 7,2002 with HSBC Securities and Capital Markets (India) Private Limited, as the Sponsor and the Boardof Individual Trustees. The Trustee has entered into an Investment Management Agreement datedFebruary 7, 2002 with HSBC Asset Management (India) Private Limited (the AMC) to function as theInvestment Manager for all the Schemes of the Fund. The Fund was registered with SEBI videregistration number MF/046/02/5 dated May 27, 2002.
The Trust has been formed for the purpose of pooling of capital from the public for collectiveinvestment in securities / any other property for the purpose of providing facilities for participationby persons as beneficiaries in such properties / investments and in the profits / income arising therefrom.
c) Board of Trustees (the Trustees)
The Board of Trustees are the exclusive owner of the Trust Fund and holds the same in trust for thebenefit of the unitholders. The Trustees have been discharging their duties and carrying out theirresponsibilities as provided in the SEBI (Mutual Funds) Regulations, 1996 and the Trust Deed. TheTrustees seeks to ensure that the Fund and the Schemes floated thereunder are managed by theAMC in accordance with the Trust Deed, the said Regulations, directions and guidelines issued bySEBI, the Stock Exchanges, the Association of Mutual Funds of India and other regulatory agencies.
d) Asset Management Company (the AMC)
HSBC Asset Management (India) Private Limited (the Investment Manager or the AMC) is a privatelimited company incorporated under the Companies Act, 1956 on December 12, 2001 having itsRegistered Office at 314, D. N. Road, Fort, Mumbai 400 001. HSBC Asset Management (India) PrivateLimited has been appointed as the Asset Management Company of the HSBC Mutual Fund by theTrustee vide Investment Management Agreement (IMA) dated February 7, 2002 and executed betweenthe Trustees and the AMC. SEBI approved the AMC to act as the Investment Manager of the Fundvide. its letter No. MFD/BC/163/2002 dated May 27, 2002.
The paid-up equity share capital of the AMC is Rs. 9 crores. HSBC Securities and Capital Markets(India) Private Limited holds 100% of the paid-up equity share capital of the AMC.
3. INVESTMENT OBJECTIVE OF THE SCHEMEThe investment objective of the Scheme has been provided above under the heading "SchemePerformance, Future Outlook and Operation of the Scheme" (refer Section 1).
4. SIGNIFICANT ACCOUNTING POLICIESThe accounting policies are in accordance with Securities and Exchange Board of India (Mutual Funds)Regulations, 1996.
5. UNCLAIMED DIVIDENDS & REDEMPTIONSNil
Trustees' ReportFor the year ended March 31, 2009 (Contd.)

7
6. INVESTOR SERVICESDuring the year, the number of official points of acceptance of transactions increased significantly toabout 182 locations. In addition to the offices of the transfer agency, the company has InvestorService Centres in 14 locations at its own offices - namely Mumbai, New Delhi, Kolkata, Chennai,Bangalore, Hyderabad, Pune, Ahmedabad, Indore, Chandigarh, Kochi, Coimbatore, Lucknow andVadodara. With a view to enhancing customer convenience, the Asset Management Company hasextended the facility of crediting investor bank accounts directly by way of NEFT / RTGS (for credit ofredemption and dividend proceeds). The AMC endeavours to despatch dividend proceeds within 5working days from the Record Date in all Schemes. The internal standards on redemption payoutshave been consistently met, with very few exceptions. The number of locations for the ECS AutoDebit facility for investments through Systematic Investment Plan also increased to about 74 byMarch 2009.
On the distribution front, the number of empanelled distributors increased from 7859 as on 31March, 2008 to 8632 as on 31 March, 2009. During the year, the Asset Management Companyinitiated tie-ups for online distribution of the Mutual Fund's schemes with several channel partnerstaking the total number of such tie-ups to 24 (Angel Capital & Department Market Ltd., Bajaj CapitalLimited, Bonanza Portfolio Limited, Citibank N.A., Citigroup Wealth Advisors India Private Limited,HDFC Bank Limited, Hongkong & Shanghai Banking Corporation Limited, HSBC Corporate InvestmentSolution Services, ICICI Securities Limited, India Infoline Limited, Karvy Stock Broking Limited, KotakMahindra Bank Limited, Kotak Securities Limited, Motilal Oswal Securities Limited, NJ India InvestPrivate Limited, Reliance Securities Limited, RR Investors Capital Services Private Limited, SBICAPSecurities Limited, Sharekhan Limited, SMC Global Securities Limited, Standard Chartered - STCICapital Markets Ltd., Tom Distribution Services Limited, Yes Bank Limited).
Call centre operations have been extended to cover the entire country. The Asset ManagementCompany has outsourced certain back office services including call centre services to HSBC Operationsand Processing Enterprise (India) Private Limited (HOPE).
7. STATUTORY DETAILSa) The Sponsors are not responsible or liable for any loss resulting from the operation of the Schemes
of the Fund beyond initial contribution of Rs. 1 lakh for setting up the Fund.
b) The price and redemption value of the units, and income from them, can go up as well as downwith fluctuations in the market value of its underlying investments.
c) Full / Abridged Annual Report shall be disclosed on the website at www.assetmanagement.hsbc.com/inand shall be available for inspection at the Head Office of the mutual fund. Present and prospectiveunit holder can obtain copy of the trust deed, the Full / Abridged Annual Report of the Scheme(s),the Annual Report of HSBC Asset Management (India) Private Limited and the text of the relevantScheme(s) at a price.
8. ACKNOWLEDGEMENTSThe Trustees wish to thank the Unitholders of the Schemes for their support throughout the year andalso thank the Government of India, the Securities and Exchange Board of India (SEBI), the ReserveBank of India (RBI) and the Association of Mutual Funds in India (AMFI) for the guidance provided bythem. The Trustees also appreciate the service provided by the Registrar and Transfer Agent, FundAccountant, Custodian, Bankers, Distributors and Brokers. The guidance and services provided bythe Auditors and advocates and the ebullience, sincerity and dedication of the employees of HSBCAsset Management (India) Private Limited is also appreciated.
The Trustees look forward to the continued support of everyone.
For and on behalf of the Board of Trustees of HSBC Mutual Fund
Dilip J. Thakkar
Trustee
MUMBAIJuly 6, 2009
Trustees' ReportFor the year ended March 31, 2009 (Contd.)

8
Auditors' Report
To the Board of Trustees of
HSBC MUTUAL FUND
1. We have audited the Balance Sheet of HSBC Mutual Fund - HSBC Fixed Term Series 30 ("TheScheme") as at March 31, 2009 and the related Revenue Account for the year ended on thatdate, both of which we have signed under reference to this report. These financial statementsare the responsibility of the Board of Trustees of HSBC Mutual Fund and the Management ofHSBC Asset Management (India) Private Limited (the "Management"). Our responsibility is toexpress an opinion on these financial statements based on our audit.
2. We have conducted our audit in accordance with auditing standards generally accepted in India.Those standards require that we plan and perform the audit to obtain reasonable assuranceabout whether the financial statements are free of material misstatement. An audit includesexamining, on a test basis, evidence supporting the amounts and disclosures in the financialstatements. Our procedures included confirmation of securities owned and unit capital balancesas at March 31, 2009 by correspondence with the custodian / others and registrar and transferagent respectively. An audit also includes assessing the accounting principles used and significantestimates made by the Management as well as evaluating the overall financial statementpresentation. We believe that our audit provides a reasonable basis for our opinion.
3. We have obtained all the information and explanations which to the best of our knowledge andbelief were necessary for the purpose of our audit. The Balance Sheet and the Revenue Accountreferred to above are in agreement with the books of account of the Scheme.
4. In our opinion and to the best of our information and according to the explanations given to us,
(i) The Balance Sheet and the Revenue Account together with the notes thereon give theinformation required by the Securities and Exchange Board of India (Mutual Funds) Regulations,1996 and amendments thereto, as applicable, and also give respectively, a true and fair viewof the state of affairs of HSBC Mutual Fund - HSBC Fixed Term Series 30 as at March 31, 2009and its net surplus for the year ended on that date.
(ii) The Balance Sheet as at March 31, 2009 and the Revenue Account for the year ended on thatdate, together with the notes thereon have been prepared in all material respects in accordancewith the accounting policies and standards specified in the Ninth Schedule of the Securitiesand Exchange Board of India (Mutual Funds) Regulations, 1996 and amendments thereto asapplicable.
(iii) The method used to value:
i. non-traded debt securities in accordance with the guidelines for valuation of securitiesfor mutual funds dated September 18, 2000 and amendments thereto, as applicable,issued by the Securities and Exchange Board of India and
ii. privately placed securities in good faith
as at March 31, 2009 as determined by HSBC Asset Management (India) Private Limitedunder procedures approved by the Board of Trustees of HSBC Mutual Fund are fair andreasonable.
Partha GhoshPartnerMembership No. F / 55913
For and on behalf ofPRICE WATERHOUSEChartered Accountants
Place : MumbaiDate : July 6, 2009

9
To the Board of Trustees of
HSBC MUTUAL FUND
1. We have audited the Balance Sheet of HSBC Mutual Fund - HSBC Fixed Term Series 41 ("TheScheme") as at March 31, 2009 and the related Revenue Account for the year ended on thatdate, both of which we have signed under reference to this report. These financial statementsare the responsibility of the Board of Trustees of HSBC Mutual Fund and the Management ofHSBC Asset Management (India) Private Limited (the "Management"). Our responsibility is toexpress an opinion on these financial statements based on our audit.
2. We have conducted our audit in accordance with auditing standards generally accepted in India.Those standards require that we plan and perform the audit to obtain reasonable assuranceabout whether the financial statements are free of material misstatement. An audit includesexamining, on a test basis, evidence supporting the amounts and disclosures in the financialstatements. Our procedures included confirmation of securities owned and unit capital balancesas at March 31, 2009 by correspondence with the custodian / others and registrar and transferagent respectively. An audit also includes assessing the accounting principles used and significantestimates made by the Management as well as evaluating the overall financial statementpresentation. We believe that our audit provides a reasonable basis for our opinion.
3. We have obtained all the information and explanations which to the best of our knowledge andbelief were necessary for the purpose of our audit. The Balance Sheet and the Revenue Accountreferred to above are in agreement with the books of account of the Scheme.
4. In our opinion and to the best of our information and according to the explanations given to us,
(i) The Balance Sheet and the Revenue Account together with the notes thereon give theinformation required by the Securities and Exchange Board of India (Mutual Funds) Regulations,1996 and amendments thereto, as applicable, and also give respectively, a true and fair viewof the state of affairs of HSBC Mutual Fund - HSBC Fixed Term Series 41 as at March 31, 2009and its net surplus for the year ended on that date.
(ii) The Balance Sheet as at March 31, 2009 and the Revenue Account for the year ended on thatdate, together with the notes thereon have been prepared in all material respects in accordancewith the accounting policies and standards specified in the Ninth Schedule of the Securitiesand Exchange Board of India (Mutual Funds) Regulations, 1996 and amendments thereto asapplicable.
(iii) The method used to value:
i. non-traded debt securities in accordance with the guidelines for valuation of securitiesfor mutual funds dated September 18, 2000 and amendments thereto, as applicable,issued by the Securities and Exchange Board of India and
ii. Privately placed securities in good faith
as at March 31, 2009 as determined by HSBC Asset Management (India) Private Limitedunder procedures approved by the Board of Trustees of HSBC Mutual Fund are fair andreasonable.
Auditors' Report
Partha GhoshPartnerMembership No. F / 55913
For and on behalf ofPRICE WATERHOUSEChartered Accountants
Place : MumbaiDate : July 6, 2009

10
Auditors' Report
To the Board of Trustees of
HSBC MUTUAL FUND
1. We have audited the Balance Sheet of HSBC Mutual Fund - HSBC Fixed Term Series 42 ("TheScheme") as at March 31, 2009 and the related Revenue Account for the year ended on thatdate, both of which we have signed under reference to this report. These financial statementsare the responsibility of the Board of Trustees of HSBC Mutual Fund and the Management ofHSBC Asset Management (India) Private Limited (the "Management"). Our responsibility is toexpress an opinion on these financial statements based on our audit.
2. We have conducted our audit in accordance with auditing standards generally accepted in India.Those standards require that we plan and perform the audit to obtain reasonable assuranceabout whether the financial statements are free of material misstatement. An audit includesexamining, on a test basis, evidence supporting the amounts and disclosures in the financialstatements. Our procedures included confirmation of securities owned and unit capital balancesas at March 31, 2009 by correspondence with the custodian / others and registrar and transferagent respectively. An audit also includes assessing the accounting principles used and significantestimates made by the Management as well as evaluating the overall financial statementpresentation. We believe that our audit provides a reasonable basis for our opinion.
3. We have obtained all the information and explanations which to the best of our knowledge andbelief were necessary for the purpose of our audit. The Balance Sheet and the Revenue Accountreferred to above are in agreement with the books of account of the Scheme.
4. In our opinion and to the best of our information and according to the explanations given to us,
(i) The Balance Sheet and the Revenue Account together with the notes thereon give theinformation required by the Securities and Exchange Board of India (Mutual Funds) Regulations,1996 and amendments thereto, as applicable, and also give respectively, a true and fair viewof the state of affairs of HSBC Mutual Fund - HSBC Fixed Term Series 42 as at March 31, 2009and its net surplus for the year ended on that date.
(ii) The Balance Sheet as at March 31, 2009 and the Revenue Account for the year ended on thatdate, together with the notes thereon have been prepared in all material respects in accordancewith the accounting policies and standards specified in the Ninth Schedule of the Securitiesand Exchange Board of India (Mutual Funds) Regulations, 1996 and amendments thereto asapplicable.
(iii) The method used to value:
i. non-traded debt securities in accordance with the guidelines for valuation of securities formutual funds dated September 18, 2000 and amendments thereto, as applicable, issued bythe Securities and Exchange Board of India and
ii. Privately placed securities in good faith
as at March 31, 2009 as determined by HSBC Asset Management (India) Private Limitedunder procedures approved by the Board of Trustees of HSBC Mutual Fund are fair andreasonable.
Partha GhoshPartnerMembership No. F / 55913
For and on behalf ofPRICE WATERHOUSEChartered Accountants
Place : MumbaiDate : July 6, 2009

11
Auditors' Report
To the Board of Trustees of
HSBC MUTUAL FUND
1. We have audited the Balance Sheet of HSBC Mutual Fund - HSBC Fixed Term Series 44 ("TheScheme") as at March 31, 2009 and the related Revenue Account for the year ended on thatdate, both of which we have signed under reference to this report. These financial statementsare the responsibility of the Board of Trustees of HSBC Mutual Fund and the Management ofHSBC Asset Management (India) Private Limited (the "Management"). Our responsibility is toexpress an opinion on these financial statements based on our audit.
2. We have conducted our audit in accordance with auditing standards generally accepted in India.Those standards require that we plan and perform the audit to obtain reasonable assuranceabout whether the financial statements are free of material misstatement. An audit includesexamining, on a test basis, evidence supporting the amounts and disclosures in the financialstatements. Our procedures included confirmation of securities owned and unit capital balancesas at March 31, 2009 by correspondence with the custodian / others and registrar and transferagent respectively. An audit also includes assessing the accounting principles used and significantestimates made by the Management as well as evaluating the overall financial statementpresentation. We believe that our audit provides a reasonable basis for our opinion.
3. We have obtained all the information and explanations which to the best of our knowledge andbelief were necessary for the purpose of our audit. The Balance Sheet and the Revenue Accountreferred to above are in agreement with the books of account of the Scheme.
4. In our opinion and to the best of our information and according to the explanations given to us,
(i) The Balance Sheet and the Revenue Account together with the notes thereon give theinformation required by the Securities and Exchange Board of India (Mutual Funds) Regulations,1996 and amendments thereto, as applicable, and also give respectively, a true and fair viewof the state of affairs of HSBC Mutual Fund - HSBC Fixed Term Series 44 as at March 31, 2009and its net surplus for the year ended on that date.
(ii) The Balance Sheet as at March 31, 2009 and the Revenue Account for the year ended on thatdate, together with the notes thereon have been prepared in all material respects in accordancewith the accounting policies and standards specified in the Ninth Schedule of the Securitiesand Exchange Board of India (Mutual Funds) Regulations, 1996 and amendments thereto asapplicable.
(iii) The method used to value non-traded debt securities in accordance with the guidelines forvaluation of securities for mutual funds dated September 18, 2000 and amendments thereto,as applicable, issued by the Securities and Exchange Board of India as at March 31, 2009 asdetermined by HSBC Asset Management (India) Private Limited under procedures approvedby the Board of Trustees of HSBC Mutual Fund are fair and reasonable.
Partha GhoshPartnerMembership No. F / 55913
For and on behalf ofPRICE WATERHOUSEChartered Accountants
Place : MumbaiDate : July 6, 2009

12
Auditors' Report
To the Board of Trustees of
HSBC MUTUAL FUND
1. We have audited the Balance Sheet of HSBC Mutual Fund - HSBC Fixed Term Series 45 ("TheScheme") as at March 31, 2009 and the related Revenue Account for the year ended on thatdate, both of which we have signed under reference to this report. These financial statementsare the responsibility of the Board of Trustees of HSBC Mutual Fund and the Management ofHSBC Asset Management (India) Private Limited (the "Management"). Our responsibility is toexpress an opinion on these financial statements based on our audit.
2. We have conducted our audit in accordance with auditing standards generally accepted in India.Those standards require that we plan and perform the audit to obtain reasonable assuranceabout whether the financial statements are free of material misstatement. An audit includesexamining, on a test basis, evidence supporting the amounts and disclosures in the financialstatements. Our procedures included confirmation of securities owned and unit capital balancesas at March 31, 2009 by correspondence with the custodian / others and registrar and transferagent respectively. An audit also includes assessing the accounting principles used and significantestimates made by the Management as well as evaluating the overall financial statementpresentation. We believe that our audit provides a reasonable basis for our opinion.
3. We have obtained all the information and explanations which to the best of our knowledge andbelief were necessary for the purpose of our audit. The Balance Sheet and the Revenue Accountreferred to above are in agreement with the books of account of the Scheme.
4. In our opinion and to the best of our information and according to the explanations given to us,
(i) The Balance Sheet and the Revenue Account together with the notes thereon give theinformation required by the Securities and Exchange Board of India (Mutual Funds) Regulations,1996 and amendments thereto, as applicable, and also give respectively, a true and fair viewof the state of affairs of HSBC Mutual Fund - HSBC Fixed Term Series 45 as at March 31, 2009and its net surplus for the year ended on that date.
(ii) The Balance Sheet as at March 31, 2009 and the Revenue Account for the year ended on thatdate, together with the notes thereon have been prepared in all material respects in accordancewith the accounting policies and standards specified in the Ninth Schedule of the Securitiesand Exchange Board of India (Mutual Funds) Regulations, 1996 and amendments thereto asapplicable.
Partha GhoshPartnerMembership No. F / 55913
For and on behalf ofPRICE WATERHOUSEChartered Accountants
Place : MumbaiDate : July 6, 2009

13
Auditors' Report
To the Board of Trustees of
HSBC MUTUAL FUND
1. We have audited the Balance Sheet of HSBC Mutual Fund - HSBC Fixed Term Series 46 ("TheScheme") as at March 31, 2009, the related Revenue Account for the year ended on that dateannexed thereto and the Cash Flow Statement for the year ended on that date which we havesigned under reference to this report. These financial statements are the responsibility of theBoard of Trustees of HSBC Mutual Fund and the Management of HSBC Asset Management (India)Private Limited (the "Management"). Our responsibility is to express an opinion on these financialstatements based on our audit.
2. We have conducted our audit in accordance with auditing standards generally accepted in India.Those standards require that we plan and perform the audit to obtain reasonable assuranceabout whether the financial statements are free of material misstatement. An audit includesexamining, on a test basis, evidence supporting the amounts and disclosures in the financialstatements. Our procedures included confirmation of securities owned and unit capital balancesas at March 31, 2009 by correspondence with the custodian/others and registrar and transferagent respectively. An audit also includes assessing the accounting principles used and significantestimates made by the Management as well as evaluating the overall financial statementpresentation. We believe that our audit provides a reasonable basis for our opinion.
3. We have obtained all the information and explanations which to the best of our knowledge andbelief were necessary for the purpose of our audit. The Balance Sheet, the Revenue Account andthe Cash Flow Statement referred to above are in agreement with the books of account of theScheme.
4. In our opinion and to the best of our information and according to the explanations given to us,
(i) The Balance Sheet, the Revenue Account and the Cash Flow Statement together with thenotes thereon give the information required by the Securities and Exchange Board of India(Mutual Funds) Regulations, 1996 and amendments thereto, as applicable, and also giverespectively, a true and fair view of the state of affairs of HSBC Mutual Fund - HSBC FixedTerm Series 46 as at March 31, 2009, its net surplus and its cash flows for the year ended onthat date.
(ii) The Balance Sheet as at March 31, 2009 and the Revenue Account for the year ended on thatdate, together with the notes thereon have been prepared in all material respects in accordancewith the accounting policies and standards specified in the Ninth Schedule of the Securitiesand Exchange Board of India (Mutual Funds) Regulations, 1996 and amendments thereto asapplicable.
(iii) The method used to value non traded debt securities in accordance with the guidelines forvaluation of securities for mutual funds dated September 18, 2000 and amendments thereto,as applicable, issued by the Securities and Exchange Board of India as at March 31, 2009 asdetermined by HSBC Asset Management (India) Private Limited under procedures approvedby the Board of Trustees of HSBC Mutual Fund are fair and reasonable..
Partha GhoshPartnerMembership No. F / 55913
For and on behalf ofPRICE WATERHOUSEChartered Accountants
Place : MumbaiDate : July 22, 2009

14
Auditors' Report
To the Board of Trustees of
HSBC MUTUAL FUND
1. We have audited the Balance Sheet of HSBC Mutual Fund - HSBC Fixed Term Series 49 ("TheScheme") as at March 31, 2009 and the related Revenue Account for the year ended on thatdate, both of which we have signed under reference to this report. These financial statementsare the responsibility of the Board of Trustees of HSBC Mutual Fund and the Management ofHSBC Asset Management (India) Private Limited (the "Management"). Our responsibility is toexpress an opinion on these financial statements based on our audit.
2. We have conducted our audit in accordance with auditing standards generally accepted in India.Those standards require that we plan and perform the audit to obtain reasonable assuranceabout whether the financial statements are free of material misstatement. An audit includesexamining, on a test basis, evidence supporting the amounts and disclosures in the financialstatements. Our procedures included confirmation of securities owned and unit capital balancesas at March 31, 2009 by correspondence with the custodian / others and registrar and transferagent respectively. An audit also includes assessing the accounting principles used and significantestimates made by the Management as well as evaluating the overall financial statementpresentation. We believe that our audit provides a reasonable basis for our opinion.
3. We have obtained all the information and explanations which to the best of our knowledge andbelief were necessary for the purpose of our audit. The Balance Sheet and the Revenue Accountreferred to above are in agreement with the books of account of the Scheme.
4. In our opinion and to the best of our information and according to the explanations given to us,
(i) The Balance Sheet and the Revenue Account together with the notes thereon give theinformation required by the Securities and Exchange Board of India (Mutual Funds) Regulations,1996 and amendments thereto, as applicable, and also give respectively, a true and fair viewof the state of affairs of HSBC Mutual Fund - HSBC Fixed Term Series 49 as at March 31, 2009and its net surplus for the year ended on that date.
(ii) The Balance Sheet as at March 31, 2009 and the Revenue Account for the year ended on thatdate, together with the notes thereon have been prepared in all material respects in accordancewith the accounting policies and standards specified in the Ninth Schedule of the Securitiesand Exchange Board of India (Mutual Funds) Regulations, 1996 and amendments thereto asapplicable.
(iii) The method used to value non-traded debt securities in accordance with the guidelines forvaluation of securities for mutual funds dated September 18, 2000 and amendments thereto,as applicable, issued by the Securities and Exchange Board of India as at March 31, 2009 asdetermined by HSBC Asset Management (India) Private Limited under procedures approvedby the Board of Trustees of HSBC Mutual Fund are fair and reasonable.
Partha GhoshPartnerMembership No. F / 55913
For and on behalf ofPRICE WATERHOUSEChartered Accountants
Place : MumbaiDate : July 6, 2009

15
Auditors' Report
To the Board of Trustees of
HSBC MUTUAL FUND
1. We have audited the Balance Sheet of HSBC Mutual Fund - HSBC Fixed Term Series 50 ("TheScheme") as at March 31, 2009 and the related Revenue Account for the period April 17, 2008to March 31, 2009, both of which we have signed under reference to this report. These financialstatements are the responsibility of the Board of Trustees of HSBC Mutual Fund and theManagement of HSBC Asset Management (India) Private Limited (the "Management"). Ourresponsibility is to express an opinion on these financial statements based on our audit.
2. We have conducted our audit in accordance with auditing standards generally accepted in India.Those standards require that we plan and perform the audit to obtain reasonable assuranceabout whether the financial statements are free of material misstatement. An audit includesexamining, on a test basis, evidence supporting the amounts and disclosures in the financialstatements. Our procedures included confirmation of securities owned and unit capital balancesas at March 31, 2009 by correspondence with the custodian / others and registrar and transferagent respectively. An audit also includes assessing the accounting principles used and significantestimates made by the Management as well as evaluating the overall financial statementpresentation. We believe that our audit provides a reasonable basis for our opinion.
3. We have obtained all the information and explanations which to the best of our knowledge andbelief were necessary for the purpose of our audit. The Balance Sheet and the Revenue Accountreferred to above are in agreement with the books of account of the Scheme.
4. In our opinion and to the best of our information and according to the explanations given to us,
(i) The Balance Sheet and the Revenue Account together with the notes thereon give theinformation required by the Securities and Exchange Board of India (Mutual Funds) Regulations,1996 and amendments thereto, as applicable, and also give respectively, a true and fair viewof the state of affairs of HSBC Mutual Fund - HSBC Fixed Term Series 50 as at March 31, 2009and its net deficit for the period April 17, 2008 to March 31, 2009.
(ii) The Balance Sheet as at March 31, 2009 and the Revenue Account for the period April 17,2008 to March 31, 2009, together with the notes thereon have been prepared in all materialrespects in accordance with the accounting policies and standards specified in the NinthSchedule of the Securities and Exchange Board of India (Mutual Funds) Regulations, 1996and amendments thereto as applicable.
(iii) The method used to value:
i. non-traded debt securities in accordance with the guidelines for valuation of securitiesfor mutual funds dated September 18, 2000 and amendments thereto, as applicable,issued by the Securities and Exchange Board of India and
ii. Privately placed securities in good faithas at March 31, 2009 as determined by HSBC Asset Management (India) Private Limitedunder procedures approved by the Board of Trustees of HSBC Mutual Fund are fair andreasonable.
Partha GhoshPartnerMembership No. F / 55913
For and on behalf ofPRICE WATERHOUSEChartered Accountants
Place : MumbaiDate : July 6, 2009
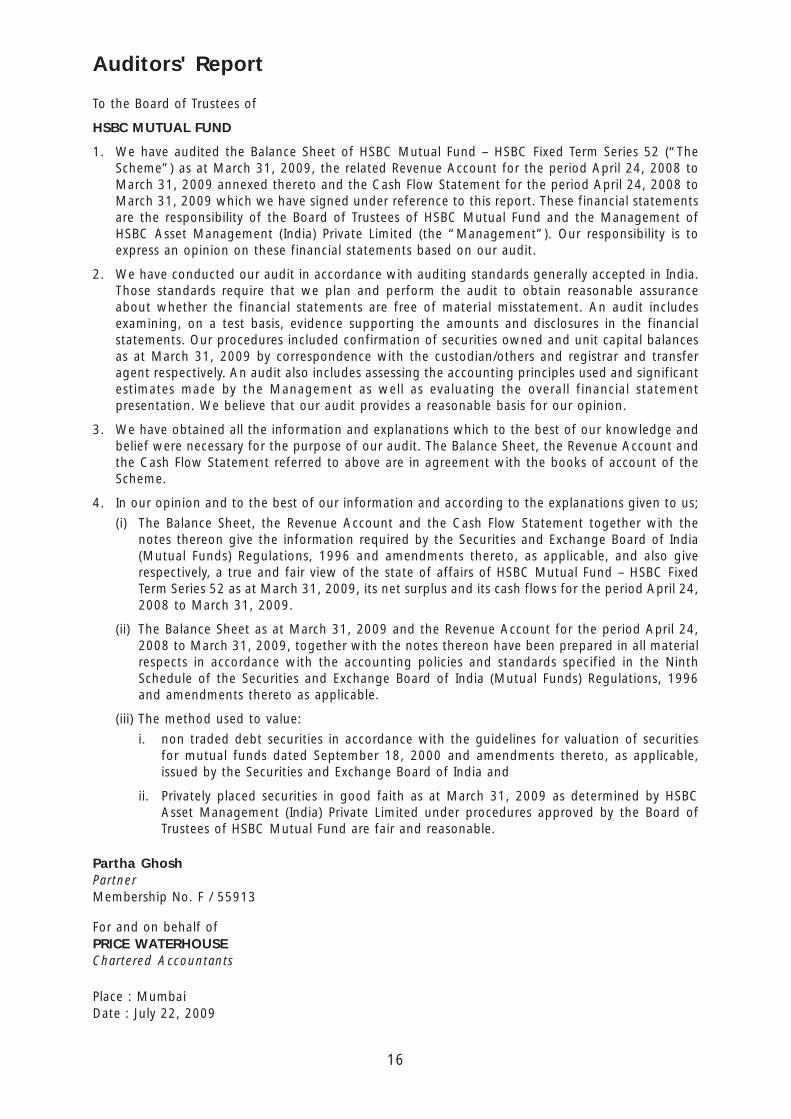
16
Auditors' Report
To the Board of Trustees of
HSBC MUTUAL FUND
1. We have audited the Balance Sheet of HSBC Mutual Fund – HSBC Fixed Term Series 52 (“TheScheme”) as at March 31, 2009, the related Revenue Account for the period April 24, 2008 toMarch 31, 2009 annexed thereto and the Cash Flow Statement for the period April 24, 2008 toMarch 31, 2009 which we have signed under reference to this report. These financial statementsare the responsibility of the Board of Trustees of HSBC Mutual Fund and the Management ofHSBC Asset Management (India) Private Limited (the “Management”). Our responsibility is toexpress an opinion on these financial statements based on our audit.
2. We have conducted our audit in accordance with auditing standards generally accepted in India.Those standards require that we plan and perform the audit to obtain reasonable assuranceabout whether the financial statements are free of material misstatement. An audit includesexamining, on a test basis, evidence supporting the amounts and disclosures in the financialstatements. Our procedures included confirmation of securities owned and unit capital balancesas at March 31, 2009 by correspondence with the custodian/others and registrar and transferagent respectively. An audit also includes assessing the accounting principles used and significantestimates made by the Management as well as evaluating the overall financial statementpresentation. We believe that our audit provides a reasonable basis for our opinion.
3. We have obtained all the information and explanations which to the best of our knowledge andbelief were necessary for the purpose of our audit. The Balance Sheet, the Revenue Account andthe Cash Flow Statement referred to above are in agreement with the books of account of theScheme.
4. In our opinion and to the best of our information and according to the explanations given to us;
(i) The Balance Sheet, the Revenue Account and the Cash Flow Statement together with thenotes thereon give the information required by the Securities and Exchange Board of India(Mutual Funds) Regulations, 1996 and amendments thereto, as applicable, and also giverespectively, a true and fair view of the state of affairs of HSBC Mutual Fund – HSBC FixedTerm Series 52 as at March 31, 2009, its net surplus and its cash flows for the period April 24,2008 to March 31, 2009.
(ii) The Balance Sheet as at March 31, 2009 and the Revenue Account for the period April 24,2008 to March 31, 2009, together with the notes thereon have been prepared in all materialrespects in accordance with the accounting policies and standards specified in the NinthSchedule of the Securities and Exchange Board of India (Mutual Funds) Regulations, 1996and amendments thereto as applicable.
(iii) The method used to value:
i. non traded debt securities in accordance with the guidelines for valuation of securitiesfor mutual funds dated September 18, 2000 and amendments thereto, as applicable,issued by the Securities and Exchange Board of India and
ii. Privately placed securities in good faith as at March 31, 2009 as determined by HSBCAsset Management (India) Private Limited under procedures approved by the Board ofTrustees of HSBC Mutual Fund are fair and reasonable.
Partha GhoshPartnerMembership No. F / 55913
For and on behalf ofPRICE WATERHOUSEChartered Accountants
Place : MumbaiDate : July 22, 2009

17
Auditors' Report
To the Board of Trustees of
HSBC MUTUAL FUND
1. We have audited the Balance Sheet of HSBC Mutual Fund – HSBC Fixed Term Series 53 (“TheScheme”) as at March 31, 2009, the related Revenue Account for the period May 23, 2008 toMarch 31, 2009 annexed thereto and the Cash Flow Statement for the period May 23, 2008 toMarch 31, 2009 which we have signed under reference to this report. These financial statementsare the responsibility of the Board of Trustees of HSBC Mutual Fund and the Management ofHSBC Asset Management (India) Private Limited (the “Management”). Our responsibility is toexpress an opinion on these financial statements based on our audit.
2. We have conducted our audit in accordance with auditing standards generally accepted in India.Those standards require that we plan and perform the audit to obtain reasonable assuranceabout whether the financial statements are free of material misstatement. An audit includesexamining, on a test basis, evidence supporting the amounts and disclosures in the financialstatements. Our procedures included confirmation of securities owned and unit capital balancesas at March 31, 2009 by correspondence with the custodian/others and registrar and transferagent respectively. An audit also includes assessing the accounting principles used and significantestimates made by the Management as well as evaluating the overall financial statementpresentation. We believe that our audit provides a reasonable basis for our opinion.
3. We have obtained all the information and explanations which to the best of our knowledge andbelief were necessary for the purpose of our audit. The Balance Sheet, the Revenue Account andthe Cash Flow Statement referred to above are in agreement with the books of account of theScheme.
4. In our opinion and to the best of our information and according to the explanations given to us,
(i) The Balance Sheet, the Revenue Account and the Cash Flow Statement together with thenotes thereon give the information required by the Securities and Exchange Board of India(Mutual Funds) Regulations, 1996 and amendments thereto, as applicable, and also giverespectively, a true and fair view of the state of affairs of HSBC Mutual Fund – HSBC FixedTerm Series 53 as at March 31, 2009 its net surplus and its cash flows for the period May 23,2008 to March 31, 2009.
(ii) The Balance Sheet as at March 31, 2009 and the Revenue Account for the period May 23,2008 to March 31, 2009, together with the notes thereon have been prepared in all materialrespects in accordance with the accounting policies and standards specified in the NinthSchedule of the Securities and Exchange Board of India (Mutual Funds) Regulations, 1996and amendments thereto as applicable.
(iii) The method used to value:
i. non traded debt securities in accordance with the guidelines for valuation of securitiesfor mutual funds dated September 18, 2000 and amendments thereto, as applicable,issued by the Securities and Exchange Board of India and
ii. Privately placed securities in good faith as at March 31, 2009 as determined by HSBCAsset Management (India) Private Limited under procedures approved by the Board ofTrustees of HSBC Mutual Fund are fair and reasonable.
Partha GhoshPartnerMembership No. F / 55913
For and on behalf ofPRICE WATERHOUSEChartered Accountants
Place : MumbaiDate : July 22, 2009

18
Auditors' Report
To the Board of Trustees of
HSBC MUTUAL FUND
1. We have audited the Balance Sheet of HSBC Mutual Fund – HSBC Fixed Term Series 54 (“TheScheme”) as at March 31, 2009, the related Revenue Account for the period May 27, 2008 toMarch 31, 2009 annexed thereto and the Cash Flow Statement for the period May 27, 2008 toMarch 31, 2009 which we have signed under reference to this report. These financial statementsare the responsibility of the Board of Trustees of HSBC Mutual Fund and the Management ofHSBC Asset Management (India) Private Limited (the “Management”). Our responsibility is toexpress an opinion on these financial statements based on our audit.
2. We have conducted our audit in accordance with auditing standards generally accepted in India.Those standards require that we plan and perform the audit to obtain reasonable assuranceabout whether the financial statements are free of material misstatement. An audit includesexamining, on a test basis, evidence supporting the amounts and disclosures in the financialstatements. Our procedures included confirmation of securities owned and unit capital balancesas at March 31, 2009 by correspondence with the custodian/others and registrar and transferagent respectively. An audit also includes assessing the accounting principles used and significantestimates made by the Management as well as evaluating the overall financial statementpresentation. We believe that our audit provides a reasonable basis for our opinion.
3. We have obtained all the information and explanations which to the best of our knowledge andbelief were necessary for the purpose of our audit. The Balance Sheet, the Revenue Account andthe Cash Flow Statement referred to above are in agreement with the books of account of theScheme.
4. In our opinion and to the best of our information and according to the explanations given to us,
(i) The Balance Sheet the Revenue Account together and the Cash Flow Statement with thenotes thereon give the information required by the Securities and Exchange Board of India(Mutual Funds) Regulations, 1996 and amendments thereto, as applicable, and also giverespectively, a true and fair view of the state of affairs of HSBC Mutual Fund – HSBC FixedTerm Series 54 as at March 31, 2009, its net surplus and its cash flows for the period May 27,2008 to March 31, 2009.
(ii) The Balance Sheet as at March 31, 2009 and the Revenue Account for the period May 27,2008 to March 31, 2009, together with the notes thereon have been prepared in all materialrespects in accordance with the accounting policies and standards specified in the NinthSchedule of the Securities and Exchange Board of India (Mutual Funds) Regulations, 1996and amendments thereto as applicable.
(iii) The method used to value:
i. non traded debt securities in accordance with the guidelines for valuation of securitiesfor mutual funds dated September 18, 2000 and amendments thereto, as applicable,issued by the Securities and Exchange Board of India and
ii. Privately placed securities in good faith as at March 31, 2009 as determined by HSBCAsset Management (India) Private Limited under procedures approved by the Board ofTrustees of HSBC Mutual Fund are fair and reasonable.
Partha GhoshPartnerMembership No. F / 55913
For and on behalf ofPRICE WATERHOUSEChartered Accountants
Place : MumbaiDate : July 22, 2009

19
Auditors' Report
To the Board of Trustees of
HSBC MUTUAL FUND
1. We have audited the Balance Sheet of HSBC Mutual Fund – HSBC Fixed Term Series 56 (“TheScheme”) as at March 31, 2009, the related Revenue Account for the period July 25, 2008 toMarch 31, 2009 annexed thereto and the Cash Flow Statement for the period July 25, 2008 toMarch 31, 2009 which we have signed under reference to this report. These financial statementsare the responsibility of the Board of Trustees of HSBC Mutual Fund and the Management ofHSBC Asset Management (India) Private Limited (the “Management”). Our responsibility is toexpress an opinion on these financial statements based on our audit.
2. We have conducted our audit in accordance with auditing standards generally accepted in India.Those standards require that we plan and perform the audit to obtain reasonable assuranceabout whether the financial statements are free of material misstatement. An audit includesexamining, on a test basis, evidence supporting the amounts and disclosures in the financialstatements. Our procedures included confirmation of securities owned and unit capital balancesas at March 31, 2009 by correspondence with the custodian/others and registrar and transferagent respectively. An audit also includes assessing the accounting principles used and significantestimates made by the Management as well as evaluating the overall financial statementpresentation. We believe that our audit provides a reasonable basis for our opinion.
3. We have obtained all the information and explanations which to the best of our knowledge andbelief were necessary for the purpose of our audit. The Balance Sheet, the Revenue Account andthe Cash Flow Statement referred to above are in agreement with the books of account of theScheme.
4. In our opinion and to the best of our information and according to the explanations given to us,
(i) The Balance Sheet, the Revenue Account and the Cash Flow Statement together with thenotes thereon give the information required by the Securities and Exchange Board of India(Mutual Funds) Regulations, 1996 and amendments thereto, as applicable, and also giverespectively, a true and fair view of the state of affairs of HSBC Mutual Fund – HSBC FixedTerm Series 56 as at March 31, 2009, its net surplus and its cash flows for the period July 25,2008 to March 31, 2009.
(ii) The Balance Sheet as at March 31, 2009 and the Revenue Account for the period July 25,2008 to March 31, 2009, together with the notes thereon have been prepared in all materialrespects in accordance with the accounting policies and standards specified in the NinthSchedule of the Securities and Exchange Board of India (Mutual Funds) Regulations, 1996and amendments thereto as applicable.
(iii) The method used to value:
i. non traded debt securities in accordance with the guidelines for valuation of securitiesfor mutual funds dated September 18, 2000 and amendments thereto, as applicable,issued by the Securities and Exchange Board of India and
ii. Privately placed securities in good faith as at March 31, 2009 as determined by HSBCAsset Management (India) Private Limited under procedures approved by the Board ofTrustees of HSBC Mutual Fund are fair and reasonable.
Partha GhoshPartnerMembership No. F / 55913
For and on behalf ofPRICE WATERHOUSEChartered Accountants
Place : MumbaiDate : July 22, 2009

20
Auditors' Report
To the Board of Trustees of
HSBC MUTUAL FUND
1. We have audited the Balance Sheet of HSBC Mutual Fund – HSBC Fixed Term Series 57 (“TheScheme”) as at March 31, 2009 and the related Revenue Account for the period August 13,2008 to March 31, 2009, both of which we have signed under reference to this report. Thesefinancial statements are the responsibility of the Board of Trustees of HSBC Mutual Fund and theManagement of HSBC Asset Management (India) Private Limited (the “Management”). Ourresponsibility is to express an opinion on these financial statements based on our audit.
2. We have conducted our audit in accordance with auditing standards generally accepted in India.Those standards require that we plan and perform the audit to obtain reasonable assuranceabout whether the financial statements are free of material misstatement. An audit includesexamining, on a test basis, evidence supporting the amounts and disclosures in the financialstatements. Our procedures included confirmation of securities owned and unit capital balancesas at March 31, 2009 by correspondence with the custodian / others and registrar and transferagent respectively. An audit also includes assessing the accounting principles used and significantestimates made by the Management as well as evaluating the overall financial statementpresentation. We believe that our audit provides a reasonable basis for our opinion.
3. We have obtained all the information and explanations which to the best of our knowledge andbelief were necessary for the purpose of our audit. The Balance Sheet and the Revenue Accountreferred to above are in agreement with the books of account of the Scheme.
4. In our opinion and to the best of our information and according to the explanations given to us,
i. The Balance Sheet and the Revenue Account together with the notes thereon give theinformation required by the Securities and Exchange Board of India (Mutual Funds) Regulations,1996 and amendments thereto, as applicable, and also give respectively, a true and fair viewof the state of affairs of HSBC Mutual Fund – HSBC Fixed Term Series 57 as at March 31,2009 and its net surplus for the period August 13, 2008 to March 31, 2009.
ii. The Balance Sheet as at March 31, 2009 and the Revenue Account for the period August 13,2008 to March 31, 2009, together with the notes thereon have been prepared in all materialrespects in accordance with the accounting policies and standards specified in the NinthSchedule of the Securities and Exchange Board of India (Mutual Funds) Regulations, 1996and amendments thereto as applicable.
iii. The method used to value non-traded debt securities in accordance with the guidelines forvaluation of securities for mutual funds dated September 18, 2000 and amendments thereto,as applicable, issued by the Securities and Exchange Board of India as at March 31, 2009 asdetermined by HSBC Asset Management (India) Private Limited under procedures approvedby the Board of Trustees of HSBC Mutual Fund are fair and reasonable.
Partha GhoshPartnerMembership No. F / 55913
For and on behalf ofPRICE WATERHOUSEChartered Accountants
Place : MumbaiDate : July 6, 2009
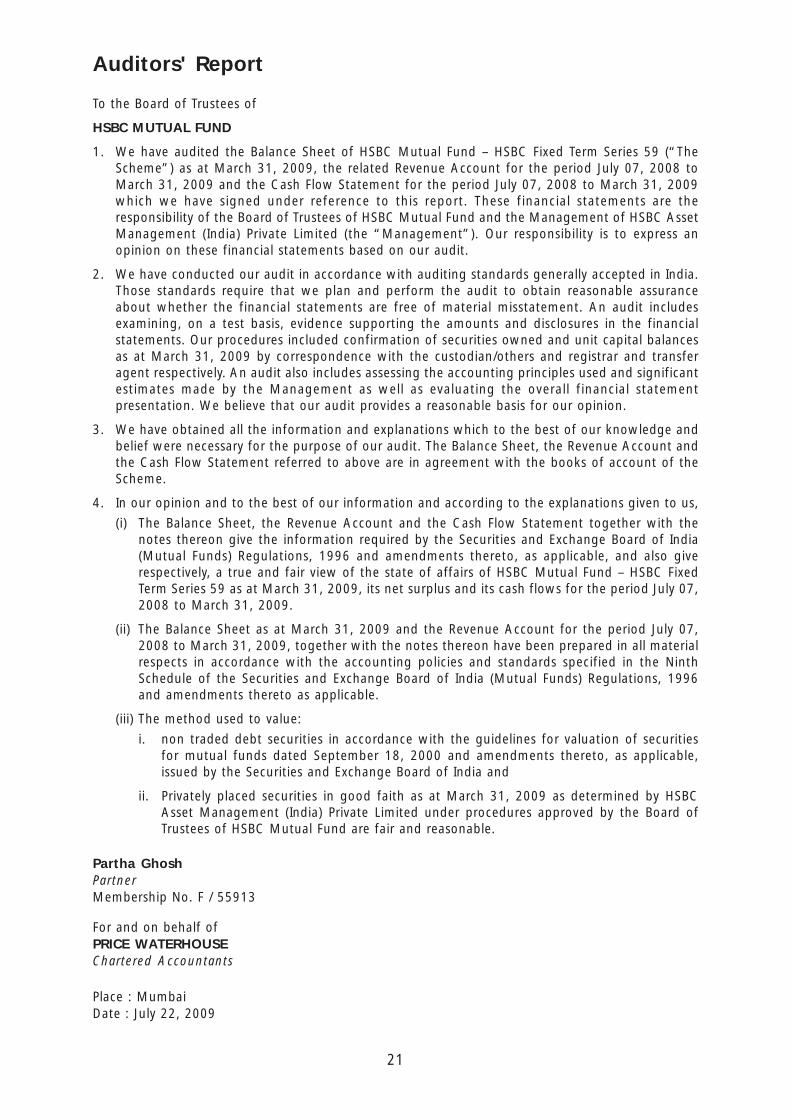
21
Auditors' Report
To the Board of Trustees of
HSBC MUTUAL FUND
1. We have audited the Balance Sheet of HSBC Mutual Fund – HSBC Fixed Term Series 59 (“TheScheme”) as at March 31, 2009, the related Revenue Account for the period July 07, 2008 toMarch 31, 2009 and the Cash Flow Statement for the period July 07, 2008 to March 31, 2009which we have signed under reference to this report. These financial statements are theresponsibility of the Board of Trustees of HSBC Mutual Fund and the Management of HSBC AssetManagement (India) Private Limited (the “Management”). Our responsibility is to express anopinion on these financial statements based on our audit.
2. We have conducted our audit in accordance with auditing standards generally accepted in India.Those standards require that we plan and perform the audit to obtain reasonable assuranceabout whether the financial statements are free of material misstatement. An audit includesexamining, on a test basis, evidence supporting the amounts and disclosures in the financialstatements. Our procedures included confirmation of securities owned and unit capital balancesas at March 31, 2009 by correspondence with the custodian/others and registrar and transferagent respectively. An audit also includes assessing the accounting principles used and significantestimates made by the Management as well as evaluating the overall financial statementpresentation. We believe that our audit provides a reasonable basis for our opinion.
3. We have obtained all the information and explanations which to the best of our knowledge andbelief were necessary for the purpose of our audit. The Balance Sheet, the Revenue Account andthe Cash Flow Statement referred to above are in agreement with the books of account of theScheme.
4. In our opinion and to the best of our information and according to the explanations given to us,
(i) The Balance Sheet, the Revenue Account and the Cash Flow Statement together with thenotes thereon give the information required by the Securities and Exchange Board of India(Mutual Funds) Regulations, 1996 and amendments thereto, as applicable, and also giverespectively, a true and fair view of the state of affairs of HSBC Mutual Fund – HSBC FixedTerm Series 59 as at March 31, 2009, its net surplus and its cash flows for the period July 07,2008 to March 31, 2009.
(ii) The Balance Sheet as at March 31, 2009 and the Revenue Account for the period July 07,2008 to March 31, 2009, together with the notes thereon have been prepared in all materialrespects in accordance with the accounting policies and standards specified in the NinthSchedule of the Securities and Exchange Board of India (Mutual Funds) Regulations, 1996and amendments thereto as applicable.
(iii) The method used to value:
i. non traded debt securities in accordance with the guidelines for valuation of securitiesfor mutual funds dated September 18, 2000 and amendments thereto, as applicable,issued by the Securities and Exchange Board of India and
ii. Privately placed securities in good faith as at March 31, 2009 as determined by HSBCAsset Management (India) Private Limited under procedures approved by the Board ofTrustees of HSBC Mutual Fund are fair and reasonable.
Partha GhoshPartnerMembership No. F / 55913
For and on behalf ofPRICE WATERHOUSEChartered Accountants
Place : MumbaiDate : July 22, 2009

22
Auditors' Report
To the Board of Trustees of
HSBC MUTUAL FUND
1. We have audited the Balance Sheet of HSBC Mutual Fund – HSBC Fixed Term Series 61 (“TheScheme”) as at March 31, 2009 and the related Revenue Account for the period July 17, 2008 toMarch 31, 2009, both of which we have signed under reference to this report. These financialstatements are the responsibility of the Board of Trustees of HSBC Mutual Fund and theManagement of HSBC Asset Management (India) Private Limited (the “Management”). Ourresponsibility is to express an opinion on these financial statements based on our audit.
2. We have conducted our audit in accordance with auditing standards generally accepted in India.Those standards require that we plan and perform the audit to obtain reasonable assuranceabout whether the financial statements are free of material misstatement. An audit includesexamining, on a test basis, evidence supporting the amounts and disclosures in the financialstatements. Our procedures included confirmation of securities owned and unit capital balancesas at March 31, 2009 by correspondence with the custodian / others and registrar and transferagent respectively. An audit also includes assessing the accounting principles used and significantestimates made by the Management as well as evaluating the overall financial statementpresentation. We believe that our audit provides a reasonable basis for our opinion.
3. We have obtained all the information and explanations which to the best of our knowledge andbelief were necessary for the purpose of our audit. The Balance Sheet and the Revenue Accountreferred to above are in agreement with the books of account of the Scheme.
4. In our opinion and to the best of our information and according to the explanations given to us,
(i) The Balance Sheet and the Revenue Account together with the notes thereon give theinformation required by the Securities and Exchange Board of India (Mutual Funds) Regulations,1996 and amendments thereto, as applicable, and also give respectively, a true and fair viewof the state of affairs of HSBC Mutual Fund – HSBC Fixed Term Series 61 as at March 31,2009 and its net surplus for the period July 17, 2008 to March 31, 2009.
(ii) The Balance Sheet as at March 31, 2009 and the Revenue Account for the period July 17,2008 to March 31, 2009, together with the notes thereon have been prepared in all materialrespects in accordance with the accounting policies and standards specified in the NinthSchedule of the Securities and Exchange Board of India (Mutual Funds) Regulations, 1996and amendments thereto as applicable.
(iii) The method used to value:
i. non-traded debt securities in accordance with the guidelines for valuation of securitiesfor mutual funds dated September 18, 2000 and amendments thereto, as applicable,issued by the Securities and Exchange Board of India and
ii. Privately placed securities in good faith
as at March 31, 2009 as determined by HSBC Asset Management (India) Private Limitedunder procedures approved by the Board of Trustees of HSBC Mutual Fund are fair andreasonable.
Partha GhoshPartnerMembership No. F / 55913
For and on behalf ofPRICE WATERHOUSEChartered Accountants
Place : MumbaiDate : July 6, 2009

23
Auditors' Report
To the Board of Trustees of
HSBC MUTUAL FUND
1. We have audited the Balance Sheet of HSBC Mutual Fund – HSBC Fixed Term Series 62 (“TheScheme”) as at March 31, 2009 and the related Revenue Account for the period August 22,2008 to March 31, 2009, both of which we have signed under reference to this report. Thesefinancial statements are the responsibility of the Board of Trustees of HSBC Mutual Fund and theManagement of HSBC Asset Management (India) Private Limited (the “Management”). Ourresponsibility is to express an opinion on these financial statements based on our audit.
2. We have conducted our audit in accordance with auditing standards generally accepted in India.Those standards require that we plan and perform the audit to obtain reasonable assuranceabout whether the financial statements are free of material misstatement. An audit includesexamining, on a test basis, evidence supporting the amounts and disclosures in the financialstatements. Our procedures included confirmation of securities owned and unit capital balancesas at March 31, 2009 by correspondence with the custodian / others and registrar and transferagent respectively. An audit also includes assessing the accounting principles used and significantestimates made by the Management as well as evaluating the overall financial statementpresentation. We believe that our audit provides a reasonable basis for our opinion.
3. We have obtained all the information and explanations which to the best of our knowledge andbelief were necessary for the purpose of our audit. The Balance Sheet and the Revenue Accountreferred to above are in agreement with the books of account of the Scheme.
4. In our opinion and to the best of our information and according to the explanations given to us,
(i) The Balance Sheet and the Revenue Account together with the notes thereon give theinformation required by the Securities and Exchange Board of India (Mutual Funds) Regulations,1996 and amendments thereto, as applicable, and also give respectively, a true and fair viewof the state of affairs of HSBC Mutual Fund – HSBC Fixed Term Series 62 as at March 31,2009 and its net surplus for the period August 22, 2008 to March 31, 2009.
(ii) The Balance Sheet as at March 31, 2009 and the Revenue Account for the period August 22,2008 to March 31, 2009, together with the notes thereon have been prepared in all materialrespects in accordance with the accounting policies and standards specified in the NinthSchedule of the Securities and Exchange Board of India (Mutual Funds) Regulations, 1996and amendments thereto as applicable.
(iii) The method used to value:
i. non-traded debt securities in accordance with the guidelines for valuation of securitiesfor mutual funds dated September 18, 2000 and amendments thereto, as applicable,issued by the Securities and Exchange Board of India and
ii. Privately placed securities in good faith
as at March 31, 2009 as determined by HSBC Asset Management (India) Private Limitedunder procedures approved by the Board of Trustees of HSBC Mutual Fund are fair andreasonable
Partha GhoshPartnerMembership No. F / 55913
For and on behalf ofPRICE WATERHOUSEChartered Accountants
Place : MumbaiDate : July 6, 2009

24
Auditors' Report
To the Board of Trustees of
HSBC MUTUAL FUND
1. We have audited the Balance Sheet of HSBC Mutual Fund – HSBC Fixed Term Series 63 (“TheScheme”) as at March 31, 2009 and the related Revenue Account for the period September 04,2008 to March 31, 2009, both of which we have signed under reference to this report. Thesefinancial statements are the responsibility of the Board of Trustees of HSBC Mutual Fund and theManagement of HSBC Asset Management (India) Private Limited (the “Management”). Ourresponsibility is to express an opinion on these financial statements based on our audit.
2. We have conducted our audit in accordance with auditing standards generally accepted in India.Those standards require that we plan and perform the audit to obtain reasonable assuranceabout whether the financial statements are free of material misstatement. An audit includesexamining, on a test basis, evidence supporting the amounts and disclosures in the financialstatements. Our procedures included confirmation of securities owned and unit capital balancesas at March 31, 2009 by correspondence with the custodian / others and registrar and transferagent respectively. An audit also includes assessing the accounting principles used and significantestimates made by the Management as well as evaluating the overall financial statementpresentation. We believe that our audit provides a reasonable basis for our opinion.
3. We have obtained all the information and explanations which to the best of our knowledge andbelief were necessary for the purpose of our audit. The Balance Sheet and the Revenue Accountreferred to above are in agreement with the books of account of the Scheme.
4. In our opinion and to the best of our information and according to the explanations given to us,
(i) The Balance Sheet and the Revenue Account together with the notes thereon give theinformation required by the Securities and Exchange Board of India (Mutual Funds) Regulations,1996 and amendments thereto, as applicable, and also give respectively, a true and fair viewof the state of affairs of HSBC Mutual Fund – HSBC Fixed Term Series 63 as at March 31,2009 and its net surplus for the period September 04, 2008 to March 31, 2009.
(ii) The Balance Sheet as at March 31, 2009 and the Revenue Account for the period September04, 2008 to March 31, 2009, together with the notes thereon have been prepared in allmaterial respects in accordance with the accounting policies and standards specified in theNinth Schedule of the Securities and Exchange Board of India (Mutual Funds) Regulations,1996 and amendments thereto as applicable.
(iii) The method used to value:
i. non-traded debt securities in accordance with the guidelines for valuation of securitiesfor mutual funds dated September 18, 2000 and amendments thereto, as applicable,issued by the Securities and Exchange Board of India and
ii. Privately placed securities in good faith
as at March 31, 2009 as determined by HSBC Asset Management (India) Private Limitedunder procedures approved by the Board of Trustees of HSBC Mutual Fund are fair andreasonable.
Partha GhoshPartnerMembership No. F / 55913
For and on behalf ofPRICE WATERHOUSEChartered Accountants
Place : MumbaiDate : July 6, 2009

25
Auditors' Report
To the Board of Trustees of
HSBC MUTUAL FUND
1. We have audited the Balance Sheet of HSBC Mutual Fund – Fixed Term Series 66 (“The Scheme”)as at March 31, 2009 and the related Revenue Account for the period September 18, 2008 toMarch 31, 2009, both of which we have signed under reference to this report. These financialstatements are the responsibility of the Board of Trustees of HSBC Mutual Fund and theManagement of HSBC Asset Management (India) Private Limited (the “Management”). Ourresponsibility is to express an opinion on these financial statements based on our audit.
2. We have conducted our audit in accordance with auditing standards generally accepted in India.Those standards require that we plan and perform the audit to obtain reasonable assuranceabout whether the financial statements are free of material misstatement. An audit includesexamining, on a test basis, evidence supporting the amounts and disclosures in the financialstatements. Our procedures included confirmation of securities owned and unit capital balancesas at March 31, 2009 by correspondence with the custodian / others and registrar and transferagent respectively. An audit also includes assessing the accounting principles used and significantestimates made by the Management as well as evaluating the overall financial statementpresentation. We believe that our audit provides a reasonable basis for our opinion.
3. We have obtained all the information and explanations which to the best of our knowledge andbelief were necessary for the purpose of our audit. The Balance Sheet and the Revenue Accountreferred to above are in agreement with the books of account of the Scheme.
4. In our opinion and to the best of our information and according to the explanations given to us,
(i) The Balance Sheet and the Revenue Account together with the notes thereon give theinformation required by the Securities and Exchange Board of India (Mutual Funds) Regulations,1996 and amendments thereto, as applicable, and also give respectively, a true and fair viewof the state of affairs of HSBC Mutual Fund – Fixed Term Series 66 as at March 31, 2009 andits net surplus for the period September 18, 2008 to March 31, 2009.
(ii) The Balance Sheet as at March 31, 2009 and the Revenue Account for the period September18, 2008 to March 31, 2009, together with the notes thereon have been prepared in allmaterial respects in accordance with the accounting policies and standards specified in theNinth Schedule of the Securities and Exchange Board of India (Mutual Funds) Regulations,1996 and amendments thereto as applicable.
(iii) The method used to value:
i. non-traded debt securities in accordance with the guidelines for valuation of securitiesfor mutual funds dated September 18, 2000 and amendments thereto, as applicable,issued by the Securities and Exchange Board of India and
ii. Privately placed securities in good faith
as at March 31, 2009 as determined by HSBC Asset Management (India) Private Limitedunder procedures approved by the Board of Trustees of HSBC Mutual Fund are fair andreasonable.
Partha GhoshPartnerMembership No. F / 55913
For and on behalf ofPRICE WATERHOUSEChartered Accountants
Place : MumbaiDate : July 6, 2009
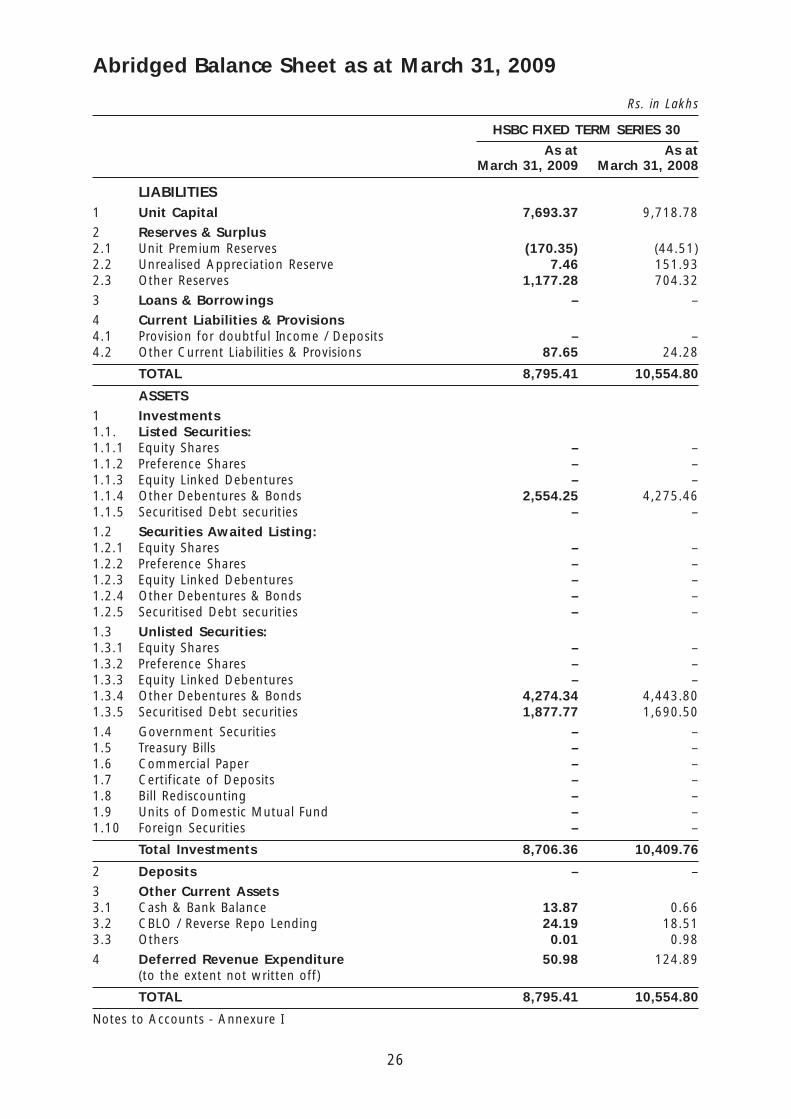
26
Rs. in Lakhs
HSBC FIXED TERM SERIES 30
As at As atMarch 31, 2009 March 31, 2008
LIABILITIES1 Unit Capital 7,693.37 9,718.78
2 Reserves & Surplus2.1 Unit Premium Reserves (170.35) (44.51)2.2 Unrealised Appreciation Reserve 7.46 151.932.3 Other Reserves 1,177.28 704.32
3 Loans & Borrowings – –
4 Current Liabilities & Provisions4.1 Provision for doubtful Income / Deposits – –4.2 Other Current Liabilities & Provisions 87.65 24.28
TOTAL 8,795.41 10,554.80
ASSETS
1 Investments1.1. Listed Securities:1.1.1 Equity Shares – –1.1.2 Preference Shares – –1.1.3 Equity Linked Debentures – –1.1.4 Other Debentures & Bonds 2,554.25 4,275.461.1.5 Securitised Debt securities – –
1.2 Securities Awaited Listing:1.2.1 Equity Shares – –1.2.2 Preference Shares – –1.2.3 Equity Linked Debentures – –1.2.4 Other Debentures & Bonds – –1.2.5 Securitised Debt securities – –
1.3 Unlisted Securities:1.3.1 Equity Shares – –1.3.2 Preference Shares – –1.3.3 Equity Linked Debentures – –1.3.4 Other Debentures & Bonds 4,274.34 4,443.801.3.5 Securitised Debt securities 1,877.77 1,690.50
1.4 Government Securities – –1.5 Treasury Bills – –1.6 Commercial Paper – –1.7 Certificate of Deposits – –1.8 Bill Rediscounting – –1.9 Units of Domestic Mutual Fund – –1.10 Foreign Securities – –
Total Investments 8,706.36 10,409.76
2 Deposits – –
3 Other Current Assets3.1 Cash & Bank Balance 13.87 0.663.2 CBLO / Reverse Repo Lending 24.19 18.513.3 Others 0.01 0.98
4 Deferred Revenue Expenditure 50.98 124.89(to the extent not written off)
TOTAL 8,795.41 10,554.80
Notes to Accounts - Annexure I
Abridged Balance Sheet as at March 31, 2009

27
Abridged Balance Sheet as at March 31, 2009
Rs. in Lakhs
HSBC FIXED TERM SERIES 41
As at As atMarch 31, 2009 March 31, 2008
LIABILITIES1 Unit Capital 3,241.65 5,734.70
2 Reserves & Surplus2.1 Unit Premium Reserves (191.28) –2.2 Unrealised Appreciation Reserve – 3.312.3 Other Reserves 557.90 145.66
3 Loans & Borrowings – –
4 Current Liabilities & Provisions4.1 Provision for doubtful Income/Deposits – –4.2 Other Current Liabilities & Provisions 56.67 1.63
TOTAL 3,664.94 5,885.30
ASSETS
1 Investments1.1. Listed Securities:1.1.1 Equity Shares – –1.1.2 Preference Shares – –1.1.3 Equity Linked Debentures – –1.1.4 Other Debentures & Bonds 99.70 –1.1.5 Securitised Debt securities – –
1.2 Securities Awaited Listing:1.2.1 Equity Shares – –1.2.2 Preference Shares – –1.2.3 Equity Linked Debentures – –1.2.4 Other Debentures & Bonds – –1.2.5 Securitised Debt securities – –
1.3 Unlisted Securities:1.3.1 Equity Shares – –1.3.2 Preference Shares – –1.3.3 Equity Linked Debentures – –1.3.4 Other Debentures & Bonds 265.32 2,203.311.3.5 Securitised Debt securities 1,641.94 1,703.01
1.4 Government Securities – –1.5 Treasury Bills – –1.6 Commercial Paper – 1,634.761.7 Certificate of Deposits 1,048.86 9.871.8 Bill Rediscounting – –1.9 Units of Domestic Mutual Fund – –1.10 Foreign Securities – –
Total Investments 3,055.82 5,550.95
2 Deposits – –
3 Other Current Assets3.1 Cash & Bank Balance 1.15 4.193.2 CBLO / Reverse Repo Lending 512.90 267.383.3 Others 94.94 57.16
4 Deferred Revenue Expenditure 0.13 5.62(to the extent not written off)
TOTAL 3,664.94 5,885.30
Notes to Accounts - Annexure I

28
Abridged Balance Sheet as at March 31, 2009
Rs. in Lakhs
HSBC FIXED TERM SERIES 42
As at As atMarch 31, 2009 March 31, 2008
LIABILITIES1 Unit Capital 62,498.89 62,498.89
2 Reserves & Surplus2.1 Unit Premium Reserves – –2.2 Unrealised Appreciation Reserve – –2.3 Other Reserves 6,010.99 579.39
3 Loans & Borrowings – –
4 Current Liabilities & Provisions4.1 Provision for doubtful Income/Deposits – –4.2 Other Current Liabilities & Provisions 19.39 10.25
TOTAL 68,529.27 63,088.53
ASSETS
1 Investments1.1. Listed Securities:1.1.1 Equity Shares – –1.1.2 Preference Shares – –1.1.3 Equity Linked Debentures – –1.1.4 Other Debentures & Bonds 22,824.12 11,936.001.1.5 Securitised Debt securities – –
1.2 Securities Awaited Listing:1.2.1 Equity Shares – –1.2.2 Preference Shares – –1.2.3 Equity Linked Debentures – –1.2.4 Other Debentures & Bonds – –1.2.5 Securitised Debt securities – –
1.3 Unlisted Securities:1.3.1 Equity Shares – –1.3.2 Preference Shares – –1.3.3 Equity Linked Debentures – –1.3.4 Other Debentures & Bonds 20,365.45 30,056.851.3.5 Securitised Debt securities 14,073.36 20,641.00
1.4 Government Securities – –1.5 Treasury Bills – –1.6 Commercial Paper – –1.7 Certificate of Deposits 10,197.87 –1.8 Bill Rediscounting – –1.9 Units of Domestic Mutual Fund – –1.10 Foreign Securities – –
Total Investments 67,460.80 62,633.85
2 Deposits – –
3 Other Current Assets3.1 Cash & Bank Balance 0.50 0.693.2 CBLO / Reverse Repo Lending 211.05 44.423.3 Others 849.05 359.46
4 Deferred Revenue Expenditure 7.87 50.11(to the extent not written off)
TOTAL 68,529.27 63,088.53
Notes to Accounts - Annexure I
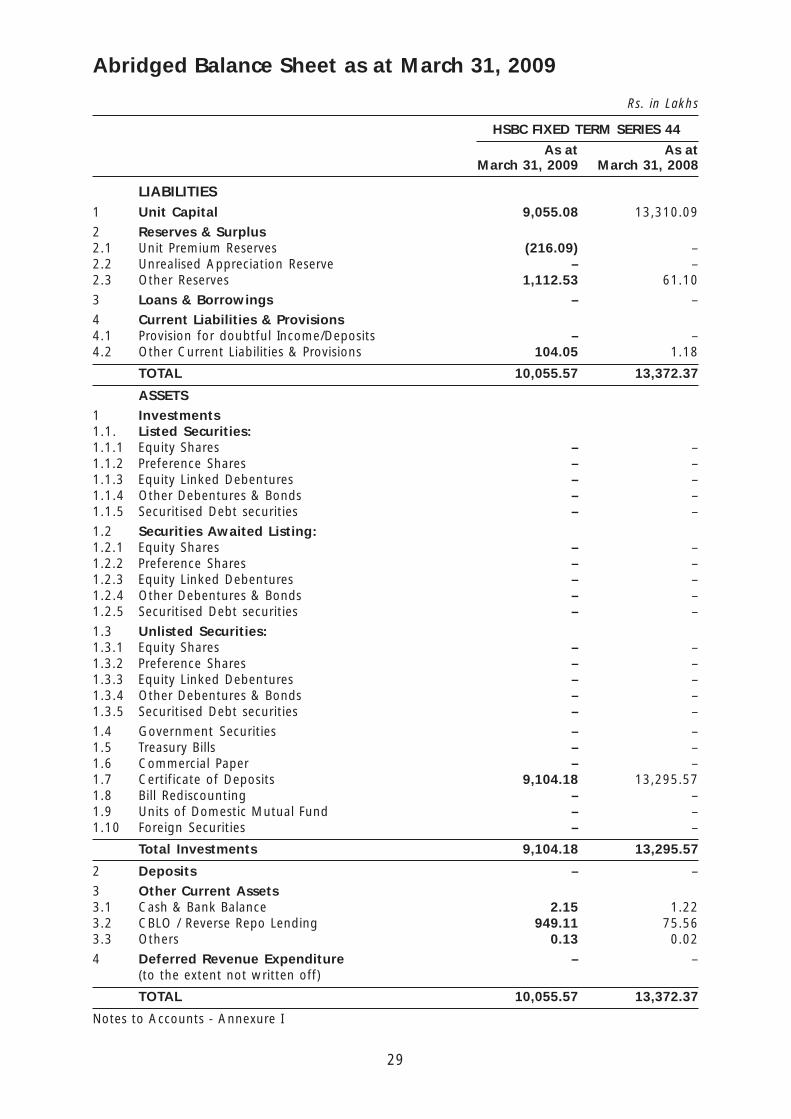
29
Abridged Balance Sheet as at March 31, 2009
Rs. in Lakhs
HSBC FIXED TERM SERIES 44
As at As atMarch 31, 2009 March 31, 2008
LIABILITIES1 Unit Capital 9,055.08 13,310.09
2 Reserves & Surplus2.1 Unit Premium Reserves (216.09) –2.2 Unrealised Appreciation Reserve – –2.3 Other Reserves 1,112.53 61.10
3 Loans & Borrowings – –
4 Current Liabilities & Provisions4.1 Provision for doubtful Income/Deposits – –4.2 Other Current Liabilities & Provisions 104.05 1.18
TOTAL 10,055.57 13,372.37
ASSETS
1 Investments1.1. Listed Securities:1.1.1 Equity Shares – –1.1.2 Preference Shares – –1.1.3 Equity Linked Debentures – –1.1.4 Other Debentures & Bonds – –1.1.5 Securitised Debt securities – –
1.2 Securities Awaited Listing:1.2.1 Equity Shares – –1.2.2 Preference Shares – –1.2.3 Equity Linked Debentures – –1.2.4 Other Debentures & Bonds – –1.2.5 Securitised Debt securities – –
1.3 Unlisted Securities:1.3.1 Equity Shares – –1.3.2 Preference Shares – –1.3.3 Equity Linked Debentures – –1.3.4 Other Debentures & Bonds – –1.3.5 Securitised Debt securities – –
1.4 Government Securities – –1.5 Treasury Bills – –1.6 Commercial Paper – –1.7 Certificate of Deposits 9,104.18 13,295.571.8 Bill Rediscounting – –1.9 Units of Domestic Mutual Fund – –1.10 Foreign Securities – –
Total Investments 9,104.18 13,295.57
2 Deposits – –
3 Other Current Assets3.1 Cash & Bank Balance 2.15 1.223.2 CBLO / Reverse Repo Lending 949.11 75.563.3 Others 0.13 0.02
4 Deferred Revenue Expenditure – –(to the extent not written off)
TOTAL 10,055.57 13,372.37
Notes to Accounts - Annexure I

30
Abridged Balance Sheet as at March 31, 2009
Rs. in Lakhs
HSBC FIXED TERM SERIES 45
As at As atMarch 31, 2009 March 31, 2008
LIABILITIES1 Unit Capital 1,839.26 2,818.49
2 Reserves & Surplus2.1 Unit Premium Reserves (54.11) –2.2 Unrealised Appreciation Reserve – –2.3 Other Reserves 212.39 8.20
3 Loans & Borrowings – –
4 Current Liabilities & Provisions4.1 Provision for doubtful Income/Deposits – –4.2 Other Current Liabilities & Provisions 23.78 0.28
TOTAL 2,021.32 2,826.97
ASSETS
1 Investments1.1. Listed Securities:1.1.1 Equity Shares – –1.1.2 Preference Shares – –1.1.3 Equity Linked Debentures – –1.1.4 Other Debentures & Bonds – –1.1.5 Securitised Debt securities – –
1.2 Securities Awaited Listing:1.2.1 Equity Shares – –1.2.2 Preference Shares – –1.2.3 Equity Linked Debentures – –1.2.4 Other Debentures & Bonds – –1.2.5 Securitised Debt securities – –
1.3 Unlisted Securities:1.3.1 Equity Shares – –1.3.2 Preference Shares – –1.3.3 Equity Linked Debentures – –1.3.4 Other Debentures & Bonds – –1.3.5 Securitised Debt securities – –
1.4 Government Securities – –1.5 Treasury Bills – –1.6 Commercial Paper – –1.7 Certificate of Deposits – 1,829.431.8 Bill Rediscounting – –1.9 Units of Domestic Mutual Fund – –1.10 Foreign Securities – –
Total Investments – 1,829.43
2 Deposits – –
3 Other Current Assets3.1 Cash & Bank Balance 4.55 34.343.2 CBLO / Reverse Repo Lending 2,016.52 962.913.3 Others 0.25 0.29
4 Deferred Revenue Expenditure – –(to the extent not written off)
TOTAL 2,021.32 2,826.97
Notes to Accounts - Annexure I

31
Abridged Balance Sheet as at March 31, 2009
Rs. in Lakhs
HSBC FIXED TERM SERIES 46
As at As atMarch 31, 2009 March 31, 2008
LIABILITIES1 Unit Capital 22,804.54 25,675.47
2 Reserves & Surplus2.1 Unit Premium Reserves (131.98) –2.2 Unrealised Appreciation Reserve – 1.212.3 Other Reserves 2,198.86 25.56
3 Loans & Borrowings – –
4 Current Liabilities & Provisions4.1 Provision for doubtful Income/Deposits – –4.2 Other Current Liabilities & Provisions 92.69 1.18
TOTAL 24,964.11 25,703.42
ASSETS
1 Investments1.1. Listed Securities:1.1.1 Equity Shares – –1.1.2 Preference Shares – –1.1.3 Equity Linked Debentures – –1.1.4 Other Debentures & Bonds – –1.1.5 Securitised Debt securities – –
1.2 Securities Awaited Listing:1.2.1 Equity Shares – –1.2.2 Preference Shares – –1.2.3 Equity Linked Debentures – –1.2.4 Other Debentures & Bonds – –1.2.5 Securitised Debt securities – –
1.3 Unlisted Securities:1.3.1 Equity Shares – –1.3.2 Preference Shares – –1.3.3 Equity Linked Debentures – –1.3.4 Other Debentures & Bonds – 8,001.211.3.5 Securitised Debt securities – –
1.4 Government Securities – –1.5 Treasury Bills – –1.6 Commercial Paper – –1.7 Certificate of Deposits 3,519.51 16,544.241.8 Bill Rediscounting – –1.9 Units of Domestic Mutual Fund – –1.10 Foreign Securities – –
Total Investments 3,519.51 24,545.45
2 Deposits – –
3 Other Current Assets3.1 Cash & Bank Balance 48.21 388.523.2 CBLO / Reverse Repo Lending 21,393.70 760.203.3 Others 2.69 9.25
4 Deferred Revenue Expenditure – –(to the extent not written off)
TOTAL 24,964.11 25,703.42
Notes to Accounts - Annexure I

32
Abridged Balance Sheet as at March 31, 2009
Rs. in Lakhs
HSBC FIXED TERM SERIES 49
As at As atMarch 31, 2009 March 31, 2008
LIABILITIES1 Unit Capital 33,015.39 33,018.39
2 Reserves & Surplus2.1 Unit Premium Reserves (0.15) –2.2 Unrealised Appreciation Reserve – 1.262.3 Other Reserves 3,134.54 31.79
3 Loans & Borrowings – –
4 Current Liabilities & Provisions4.1 Provision for doubtful Income/Deposits – –4.2 Other Current Liabilities & Provisions 13.87 0.98
TOTAL 36,163.65 33,052.42
ASSETS
1 Investments1.1. Listed Securities:1.1.1 Equity Shares – –1.1.2 Preference Shares – –1.1.3 Equity Linked Debentures – –1.1.4 Other Debentures & Bonds – –1.1.5 Securitised Debt securities – –
1.2 Securities Awaited Listing:1.2.1 Equity Shares – –1.2.2 Preference Shares – –1.2.3 Equity Linked Debentures – –1.2.4 Other Debentures & Bonds – –1.2.5 Securitised Debt securities – –
1.3 Unlisted Securities:1.3.1 Equity Shares – –1.3.2 Preference Shares – –1.3.3 Equity Linked Debentures – –1.3.4 Other Debentures & Bonds – 4,501.261.3.5 Securitised Debt securities – –
1.4 Government Securities – –1.5 Treasury Bills – –1.6 Commercial Paper – 5,010.531.7 Certificate of Deposits 4,999.18 23,336.171.8 Bill Rediscounting – –1.9 Units of Domestic Mutual Fund – –1.10 Foreign Securities – –
Total Investments 4,999.18 32,847.96
2 Deposits – –
3 Other Current Assets3.1 Cash & Bank Balance 59.92 49.243.2 CBLO / Reverse Repo Lending 26,594.39 45.053.3 Others 4,510.16 110.17
4 Deferred Revenue Expenditure – –(to the extent not written off)
TOTAL 36,163.65 33,052.42
Notes to Accounts - Annexure I

33
Abridged Balance Sheet as at March 31, 2009
Rs. in Lakhs
HSBC FIXED HSBC FIXEDTERM SERIES 50 TERM SERIES 52
As at As atMarch 31, 2009 March 31, 2009
LIABILITIES1 Unit Capital 44,124.81 20,554.992 Reserves & Surplus2.1 Unit Premium Reserves – (98.20)2.2 Unrealised Appreciation Reserve – –2.3 Other Reserves 3,676.61 1,657.903 Loans & Borrowings – –4 Current Liabilities & Provisions4.1 Provision for doubtful Income/Deposits – –4.2 Other Current Liabilities & Provisions 17.42 178.27
TOTAL 47,818.84 22,292.96
ASSETS1 Investments1.1. Listed Securities:1.1.1 Equity Shares – –1.1.2 Preference Shares – –1.1.3 Equity Linked Debentures – –1.1.4 Other Debentures & Bonds 9,359.30 4,335.581.1.5 Securitised Debt securities – –1.2 Securities Awaited Listing:1.2.1 Equity Shares – –1.2.2 Preference Shares – –1.2.3 Equity Linked Debentures – –1.2.4 Other Debentures & Bonds – 2,460.141.2.5 Securitised Debt securities – –1.3 Unlisted Securities:1.3.1 Equity Shares – –1.3.2 Preference Shares – –1.3.3 Equity Linked Debentures – –1.3.4 Other Debentures & Bonds – –1.3.5 Securitised Debt securities 4,761.62 14,409.011.4 Government Securities – –1.5 Treasury Bills – –1.6 Commercial Paper 4,466.47 –1.7 Certificate of Deposits 28,597.85 –1.8 Bill Rediscounting – –1.9 Units of Domestic Mutual Fund – –1.10 Foreign Securities – –
Total Investments 47,185.24 21,204.73
2 Deposits – –3 Other Current Assets3.1 Cash & Bank Balance 0.47 0.923.2 CBLO / Reverse Repo Lending 187.89 394.863.3 Others 445.24 692.454 Deferred Revenue Expenditure – –
(to the extent not written off)
TOTAL 47,818.84 22,292.96
Notes to Accounts - Annexure I

34
Abridged Balance Sheet as at March 31, 2009
Rs. in Lakhs
HSBC FIXED HSBC FIXEDTERM SERIES 53 TERM SERIES 54
As at As atMarch 31, 2009 March 31, 2009
LIABILITIES1 Unit Capital 12,951.62 16,446.562 Reserves & Surplus2.1 Unit Premium Reserves (210.24) (134.96)2.2 Unrealised Appreciation Reserve – –2.3 Other Reserves 1,120.89 1,160.823 Loans & Borrowings – –4 Current Liabilities & Provisions4.1 Provision for doubtful Income/Deposits – –4.2 Other Current Liabilities & Provisions 213.39 199.68
TOTAL 14,075.68 17,672.10
ASSETS1 Investments1.1. Listed Securities:1.1.1 Equity Shares – –1.1.2 Preference Shares – –1.1.3 Equity Linked Debentures – –1.1.4 Other Debentures & Bonds 1,981.06 3,950.461.1.5 Securitised Debt securities – –1.2 Securities Awaited Listing:1.2.1 Equity Shares – –1.2.2 Preference Shares – –1.2.3 Equity Linked Debentures – –1.2.4 Other Debentures & Bonds – 3,767.421.2.5 Securitised Debt securities – –1.3 Unlisted Securities:1.3.1 Equity Shares – –1.3.2 Preference Shares – –1.3.3 Equity Linked Debentures – –1.3.4 Other Debentures & Bonds – –1.3.5 Securitised Debt securities 10,611.34 8,541.041.4 Government Securities – –1.5 Treasury Bills – –1.6 Commercial Paper – –1.7 Certificate of Deposits 59.93 –1.8 Bill Rediscounting – –1.9 Units of Domestic Mutual Fund – –1.10 Foreign Securities – –
Total Investments 12,652.33 16,258.92
2 Deposits – –3 Other Current Assets3.1 Cash & Bank Balance 1.61 0.923.2 CBLO / Reverse Repo Lending 709.62 408.523.3 Others 712.12 1,003.744 Deferred Revenue Expenditure – –
(to the extent not written off)
TOTAL 14,075.68 17,672.10
Notes to Accounts - Annexure I

35
Abridged Balance Sheet as at March 31, 2009
Rs. in Lakhs
HSBC FIXED HSBC FIXEDTERM SERIES 56 TERM SERIES 57
As at As atMarch 31, 2009 March 31, 2009
LIABILITIES1 Unit Capital 11,438.03 5,547.362 Reserves & Surplus2.1 Unit Premium Reserves (20.69) (1.24)2.2 Unrealised Appreciation Reserve 28.55 –2.3 Other Reserves 694.17 354.393 Loans & Borrowings – –4 Current Liabilities & Provisions4.1 Provision for doubtful Income/Deposits – –4.2 Other Current Liabilities & Provisions 67.77 8.25
TOTAL 12,207.83 5,908.76
ASSETS1 Investments1.1. Listed Securities:1.1.1 Equity Shares – –1.1.2 Preference Shares – –1.1.3 Equity Linked Debentures – –1.1.4 Other Debentures & Bonds 4,071.54 –1.1.5 Securitised Debt securities – –1.2 Securities Awaited Listing:1.2.1 Equity Shares – –1.2.2 Preference Shares – –1.2.3 Equity Linked Debentures – –1.2.4 Other Debentures & Bonds 1,987.09 –1.2.5 Securitised Debt securities – –1.3 Unlisted Securities:1.3.1 Equity Shares – –1.3.2 Preference Shares – –1.3.3 Equity Linked Debentures – –1.3.4 Other Debentures & Bonds – –1.3.5 Securitised Debt securities 5,048.32 –1.4 Government Securities – –1.5 Treasury Bills – –1.6 Commercial Paper – –1.7 Certificate of Deposits 287.25 5,874.731.8 Bill Rediscounting – –1.9 Units of Domestic Mutual Fund – –1.10 Foreign Securities – –
Total Investments 11,394.20 5,874.73
2 Deposits – –3 Other Current Assets3.1 Cash & Bank Balance 0.83 0.443.2 CBLO / Reverse Repo Lending 369.06 33.593.3 Others 443.74 (0.00)~4 Deferred Revenue Expenditure – –
(to the extent not written off)
TOTAL 12,207.83 5,908.76
Notes to Accounts - Annexure I

36
Abridged Balance Sheet as at March 31, 2009
Rs. in Lakhs
HSBC FIXED HSBC FIXEDTERM SERIES 59 TERM SERIES 61
As at As atMarch 31, 2009 March 31, 2009
LIABILITIES1 Unit Capital 31,617.82 8,550.132 Reserves & Surplus2.1 Unit Premium Reserves (38.39) (35.16)2.2 Unrealised Appreciation Reserve – 17.442.3 Other Reserves 2,357.08 620.103 Loans & Borrowings – –4 Current Liabilities & Provisions4.1 Provision for doubtful Income/Deposits – –4.2 Other Current Liabilities & Provisions 104.08 76.32
TOTAL 34,040.59 9,228.83
ASSETS1 Investments1.1. Listed Securities:1.1.1 Equity Shares – –1.1.2 Preference Shares – –1.1.3 Equity Linked Debentures – –1.1.4 Other Debentures & Bonds 16,273.62 3,631.301.1.5 Securitised Debt securities – –1.2 Securities Awaited Listing:1.2.1 Equity Shares – –1.2.2 Preference Shares – –1.2.3 Equity Linked Debentures – –1.2.4 Other Debentures & Bonds 5,869.03 2,335.431.2.5 Securitised Debt securities – –1.3 Unlisted Securities:1.3.1 Equity Shares – –1.3.2 Preference Shares – –1.3.3 Equity Linked Debentures – –1.3.4 Other Debentures & Bonds – –1.3.5 Securitised Debt securities 9,922.99 2,430.881.4 Government Securities – –1.5 Treasury Bills – –1.6 Commercial Paper – –1.7 Certificate of Deposits – –1.8 Bill Rediscounting – –1.9 Units of Domestic Mutual Fund – –1.10 Foreign Securities – –
Total Investments 32,065.64 8,397.61
2 Deposits – –3 Other Current Assets3.1 Cash & Bank Balance 0.99 0.893.2 CBLO / Reverse Repo Lending 165.08 389.623.3 Others 1,808.88 440.714 Deferred Revenue Expenditure – –
(to the extent not written off)
TOTAL 34,040.59 9,228.83
Notes to Accounts - Annexure I
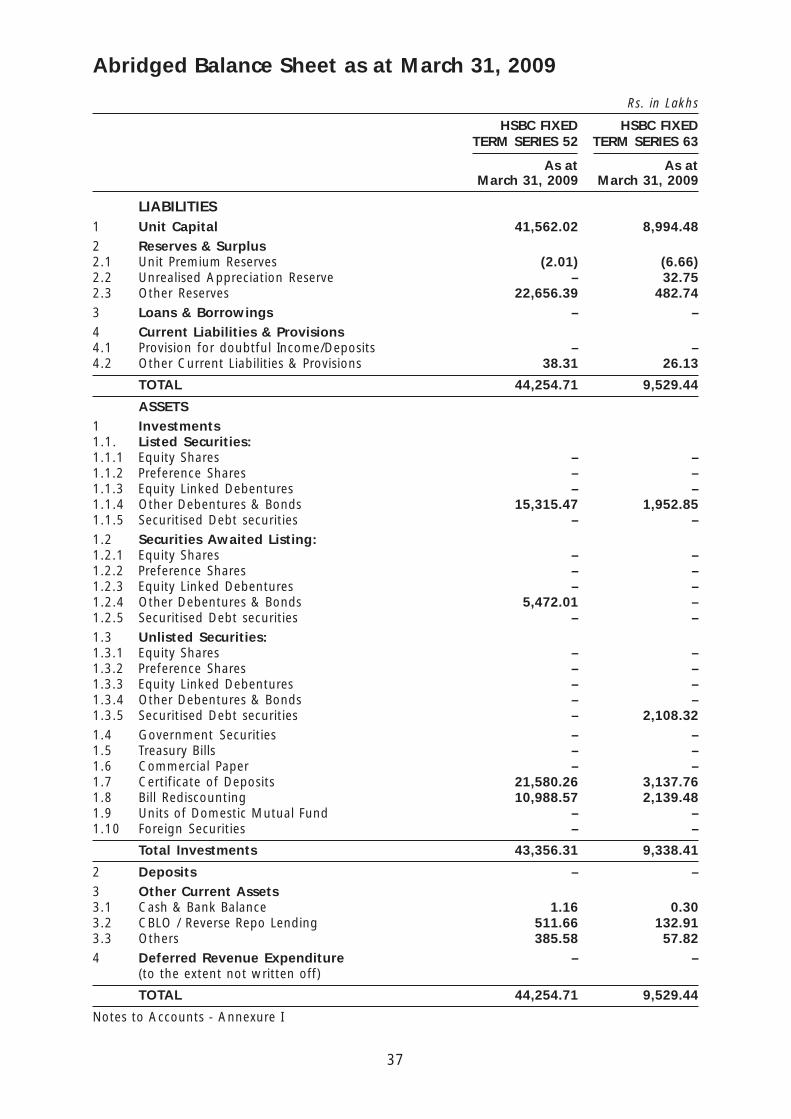
37
Abridged Balance Sheet as at March 31, 2009
Rs. in Lakhs
HSBC FIXED HSBC FIXEDTERM SERIES 52 TERM SERIES 63
As at As atMarch 31, 2009 March 31, 2009
LIABILITIES1 Unit Capital 41,562.02 8,994.482 Reserves & Surplus2.1 Unit Premium Reserves (2.01) (6.66)2.2 Unrealised Appreciation Reserve – 32.752.3 Other Reserves 22,656.39 482.743 Loans & Borrowings – –4 Current Liabilities & Provisions4.1 Provision for doubtful Income/Deposits – –4.2 Other Current Liabilities & Provisions 38.31 26.13
TOTAL 44,254.71 9,529.44
ASSETS1 Investments1.1. Listed Securities:1.1.1 Equity Shares – –1.1.2 Preference Shares – –1.1.3 Equity Linked Debentures – –1.1.4 Other Debentures & Bonds 15,315.47 1,952.851.1.5 Securitised Debt securities – –1.2 Securities Awaited Listing:1.2.1 Equity Shares – –1.2.2 Preference Shares – –1.2.3 Equity Linked Debentures – –1.2.4 Other Debentures & Bonds 5,472.01 –1.2.5 Securitised Debt securities – –1.3 Unlisted Securities:1.3.1 Equity Shares – –1.3.2 Preference Shares – –1.3.3 Equity Linked Debentures – –1.3.4 Other Debentures & Bonds – –1.3.5 Securitised Debt securities – 2,108.321.4 Government Securities – –1.5 Treasury Bills – –1.6 Commercial Paper – –1.7 Certificate of Deposits 21,580.26 3,137.761.8 Bill Rediscounting 10,988.57 2,139.481.9 Units of Domestic Mutual Fund – –1.10 Foreign Securities – –
Total Investments 43,356.31 9,338.41
2 Deposits – –3 Other Current Assets3.1 Cash & Bank Balance 1.16 0.303.2 CBLO / Reverse Repo Lending 511.66 132.913.3 Others 385.58 57.824 Deferred Revenue Expenditure – –
(to the extent not written off)
TOTAL 44,254.71 9,529.44
Notes to Accounts - Annexure I

38
Abridged Balance Sheet as at March 31, 2009
Rs. in Lakhs
HSBC FIXED TERM SERIES 66
As atMarch 31, 2009
LIABILITIES1 Unit Capital 6,259.572 Reserves & Surplus2.1 Unit Premium Reserves (2.76)2.2 Unrealised Appreciation Reserve 40.372.3 Other Reserves 282.363 Loans & Borrowings –4 Current Liabilities & Provisions4.1 Provision for doubtful Income/Deposits –4.2 Other Current Liabilities & Provisions 11.71
TOTAL 6,591.25
ASSETS1 Investments1.1. Listed Securities:1.1.1 Equity Shares –1.1.2 Preference Shares –1.1.3 Equity Linked Debentures –1.1.4 Other Debentures & Bonds 2,027.081.1.5 Securitised Debt securities –1.2 Securities Awaited Listing:1.2.1 Equity Shares –1.2.2 Preference Shares –1.2.3 Equity Linked Debentures –1.2.4 Other Debentures & Bonds –1.2.5 Securitised Debt securities –1.3 Unlisted Securities:1.3.1 Equity Shares –1.3.2 Preference Shares –1.3.3 Equity Linked Debentures –1.3.4 Other Debentures & Bonds –1.3.5 Securitised Debt securities 1,107.281.4 Government Securities –1.5 Treasury Bills –1.6 Commercial Paper –1.7 Certificate of Deposits 1,968.221.8 Bill Rediscounting 1,180.651.9 Units of Domestic Mutual Fund –1.10 Foreign Securities –
Total Investments 6,283.23
2 Deposits –3 Other Current Assets3.1 Cash & Bank Balance 0.573.2 CBLO / Reverse Repo Lending 243.933.3 Others 63.524 Deferred Revenue Expenditure –
(to the extent not written off)
TOTAL 6,591.25
Notes to Accounts - Annexure I

39
Rs. in Lakhs
HSBC FIXED TERM SERIES 30
Current PreviousYear ended Year ended
March 31, 2009 March 31, 2008
1 INCOME1.1 Dividend – –1.2 Interest 1,010.80 878.511.3 Realised Gain / (Loss) on Foreign Exchange Transactions – –1.4 Realised Gains / (Losses) on Interscheme sale of investments (19.08) (22.91)1.5 Realised Gains / (Losses) on External
sale / redemption of investments (71.36) 45.721.6 Realised Gains / (Losses) on Derivative Transactions – –1.7 Other Income *** – –
(A) 920.36 901.322 EXPENSES2.1 Management fees 45.73 39.782.2 Service tax on Management fees ** – –2.3 Transfer agents fees and expenses 1.97 1.542.4 Custodian fees 1.18 0.902.5 Trusteeship fees 0.04 0.062.6 Commission to Agents * – –2.7 Marketing & Distribution expenses 10.01 12.292.8 Audit fees 0.10 0.062.9 Other operating expenses 54.53 49.442.10 Less: Expenses to be Reimbursed by the
Investment Manager – (0.92)
(B) 113.56 103.163 NET REALISED GAINS / (LOSSES)
FOR THE YEAR / PERIOD (A - B = C) 806.80 798.164 Change in Unrealised Depreciation
in value of investments (D) 166.66 –5 NET GAINS / (LOSSES) FOR THE
YEAR / PERIOD [E = (C - D)] 640.14 798.166 Change in Unrealised Appreciation
in the value of investments (F) (144.48) 151.937 NET SURPLUS / (DEFICIT) FOR THE
YEAR / PERIOD (E + F = G) 495.66 950.097.1 Add: Balance transfer from Unrealised
Appreciation Reserve 144.48 –7.2 Less: Balance transfer to Unrealised
Appreciation Reserve – 151.937.3 Add / (Less): Equalisation – –7.4 Transfer from Reserve Fund 56.05 –7.5 Transfer from Unit Premium Reserve – –
8 TOTAL 696.19 798.169 Dividend Appropriation9.1 Income Distributed during the year / period 145.93 81.919.2 Tax on income distributed during the year / period 21.25 11.9310 Retained Surplus / (Deficit)
carried forward to Balance Sheet 529.01 704.32
Notes to Accounts - Annexure I
* Commission to Agents is included in Marketing & Distribution Expenses.** Management Fees is inclusive of Service Tax.*** Refer note - 8
Abridged Revenue Account for the year ended March 31, 2009

40
Rs. in Lakhs
HSBC FIXED TERM SERIES 41
Current PreviousYear ended Year ended
March 31, 2009 March 31, 2008
1 INCOME1.1 Dividend – –1.2 Interest 474.82 152.291.3 Realised Gain / (Loss) on Foreign Exchange Transactions – –1.4 Realised Gains / (Losses) on Interscheme sale of
investments (1.22) –1.5 Realised Gains / (Losses) on External
sale / redemption of investments (27.33) 0.541.6 Realised Gains / (Losses) on Derivative Transactions – –1.7 Other Income *** – –
(A) 446.27 152.832 EXPENSES2.1 Management fees 4.83 1.632.2 Service tax on Management fees ** – –2.3 Transfer agents fees and expenses 1.00 0.262.4 Custodian fees 0.59 0.152.5 Trusteeship fees 0.02 0.052.6 Commission to Agents * – –2.7 Marketing & Distribution expenses 0.02 –2.8 Audit fees 0.05 0.062.9 Other operating expenses 4.84 1.56
(B) 11.35 3.713 NET REALISED GAINS / (LOSSES)
FOR THE YEAR / PERIOD (A - B = C) 434.92 149.124 Change in Unrealised Depreciation
in value of investments (D) (3.25) 3.465 NET GAINS / (LOSSES) FOR THE
YEAR / PERIOD [E = (C - D)] 438.17 145.666 Change in Unrealised Appreciation
in the value of investments (F) (3.31) 3.317 NET SURPLUS / (DEFICIT) FOR THE
YEAR / PERIOD (E + F = G) 434.86 148.977.1 Add: Balance transfer from Unrealised
Appreciation Reserve 3.31 –7.2 Less: Balance transfer to Unrealised
Appreciation Reserve – 3.317.3 Add / (Less): Equalisation – –7.4 Transfer from Reserve Fund 6.06 –7.5 Transfer from Unit Premium Reserve – –
8 TOTAL 444.23 145.669 Dividend Appropriation9.1 Income Distributed during the year / period 21.54 –9.2 Tax on income distributed during the year / period 4.38 –10 Retained Surplus / (Deficit)
carried forward to Balance Sheet 418.30 145.66
Notes to Accounts - Annexure I
* Commission to Agents is included in Marketing & Distribution Expenses.** Management Fees is inclusive of Service Tax.*** Refer note - 8
Abridged Revenue Account for the year ended March 31, 2009

41
Rs. in Lakhs
HSBC FIXED TERM SERIES 42
Current PreviousYear ended Year ended
March 31, 2009 March 31, 2008
1 INCOME1.1 Dividend – –1.2 Interest 5,999.62 891.141.3 Realised Gain / (Loss) on Foreign Exchange Transactions – –1.4 Realised Gains / (Losses) on Interscheme sale of
investments (0.40) –1.5 Realised Gains / (Losses) on External
sale / redemption of investments 0.01 (0.08)1.6 Realised Gains / (Losses) on Derivative Transactions – –1.7 Other Income *** – –
(A) 5,999.23 891.062 EXPENSES2.1 Management fees 83.57 12.472.2 Service tax on Management fees ** – –2.3 Transfer agents fees and expenses 13.11 1.172.4 Custodian fees 7.19 1.102.5 Trusteeship fees 0.27 0.032.6 Commission to Agents * – –2.7 Marketing & Distribution expenses – –2.8 Audit fees 0.05 0.062.9 Other operating expenses 42.27 6.19
(B) 146.46 21.023 NET REALISED GAINS / (LOSSES)
FOR THE YEAR / PERIOD (A - B = C) 5,852.77 870.044 Change in Unrealised Depreciation
in value of investments (D) 421.17 290.655 NET GAINS / (LOSSES) FOR THE
YEAR / PERIOD [E = (C - D)] 5,431.60 579.396 Change in Unrealised Appreciation
in the value of investments (F) – –7 NET SURPLUS / (DEFICIT) FOR THE
YEAR / PERIOD (E + F = G) 5,431.60 579.397.1 Add: Balance transfer from Unrealised
Appreciation Reserve – –7.2 Less: Balance transfer to Unrealised
Appreciation Reserve – –7.3 Add / (Less): Equalisation – –7.4 Transfer from Reserve Fund – –7.5 Transfer from Unit Premium Reserve – –
8 TOTAL 5,431.60 579.399 Dividend Appropriation9.1 Income Distributed during the year / period – –9.2 Tax on income distributed during the year / period – –10 Retained Surplus / (Deficit)
carried forward to Balance Sheet 5,431.60 579.39
Notes to Accounts - Annexure I
* Commission to Agents is included in Marketing & Distribution Expenses.** Management Fees is inclusive of Service Tax.*** Refer note - 8
Abridged Revenue Account for the year ended March 31, 2009

42
Rs. in Lakhs
HSBC FIXED TERM SERIES 44
Current PreviousYear ended Year ended
March 31, 2009 March 31, 2008
1 INCOME1.1 Dividend – –1.2 Interest 1,077.60 62.291.3 Realised Gain / (Loss) on Foreign Exchange Transactions – –1.4 Realised Gains / (Losses) on Interscheme sale of
investments – –1.5 Realised Gains / (Losses) on External
sale / redemption of investments 1.84 (0.06)1.6 Realised Gains / (Losses) on Derivative Transactions – –1.7 Other Income *** – –
(A) 1,079.44 62.232 EXPENSES2.1 Management fees 19.76 0.832.2 Service tax on Management fees ** – –2.3 Transfer agents fees and expenses 2.13 0.102.4 Custodian fees 1.29 0.092.5 Trusteeship fees 0.05 0.002.6 Commission to Agents * – –2.7 Marketing & Distribution expenses 0.11 –2.8 Audit fees 0.05 0.062.9 Other operating expenses 0.03 0.05
(B) 23.42 1.133 NET REALISED GAINS / (LOSSES)
FOR THE YEAR / PERIOD (A - B = C) 1,056.02 61.104 Change in Unrealised Depreciation
in value of investments (D) – –5 NET GAINS / (LOSSES) FOR THE
YEAR / PERIOD [E = (C - D)] 1,056.02 61.106 Change in Unrealised Appreciation
in the value of investments (F) – –7 NET SURPLUS / (DEFICIT) FOR THE
YEAR / PERIOD (E + F = G) 1,056.02 61.107.1 Add: Balance transfer from Unrealised
Appreciation Reserve – –7.2 Less: Balance transfer to Unrealised
Appreciation Reserve – –7.3 Add / (Less): Equalisation – –7.4 Transfer from Reserve Fund 0.20 –7.5 Transfer from Unit Premium Reserve – –
8 TOTAL 1,056.22 61.109 Dividend Appropriation9.1 Income Distributed during the year / period 4.02 –9.2 Tax on income distributed during the year / period 0.57 –10 Retained Surplus / (Deficit)
carried forward to Balance Sheet 1,051.63 61.10
Notes to Accounts - Annexure I
* Commission to Agents is included in Marketing & Distribution Expenses.** Management Fees is inclusive of Service Tax.*** Refer note - 8
Abridged Revenue Account for the year ended March 31, 2009

43
Rs. in Lakhs
HSBC FIXED TERM SERIES 45
Current PreviousYear ended Year ended
March 31, 2009 March 31, 2008
1 INCOME1.1 Dividend – –1.2 Interest 229.22 8.411.3 Realised Gain / (Loss) on Foreign Exchange Transactions – –1.4 Realised Gains / (Losses) on Interscheme sale of
investments – –1.5 Realised Gains / (Losses) on External
sale / redemption of investments (15.46) (0.03)1.6 Realised Gains / (Losses) on Derivative Transactions – –1.7 Other Income *** – –
(A) 213.76 8.392 EXPENSES2.1 Management fees 6.47 0.152.2 Service tax on Management fees ** – –2.3 Transfer agents fees and expenses 0.45 0.012.4 Custodian fees 0.27 0.012.5 Trusteeship fees 0.01 –2.6 Commission to Agents * – –2.7 Marketing & Distribution expenses 0.02 –2.8 Audit fees 0.05 0.062.9 Other operating expenses 0.16 (0.03)2.10 Less: Expenses to be Reimbursed by the
Investment Manager – (0.07)
(B) 7.43 0.193 NET REALISED GAINS / (LOSSES)
FOR THE YEAR / PERIOD (A - B = C) 206.33 8.204 Change in Unrealised Depreciation
in value of investments (D) – –5 NET GAINS / (LOSSES) FOR THE
YEAR / PERIOD [E = (C - D)] 206.33 8.206 Change in Unrealised Appreciation
in the value of investments (F) – –7 NET SURPLUS / (DEFICIT) FOR THE
YEAR / PERIOD (E + F = G) 206.33 8.207.1 Add: Balance transfer from Unrealised
Appreciation Reserve – –7.2 Less: Balance transfer to Unrealised
Appreciation Reserve – –7.3 Add / (Less): Equalisation – –7.4 Transfer from Reserve Fund 0.07 –7.5 Transfer from Unit Premium Reserve – –
8 TOTAL 206.40 8.209 Dividend Appropriation9.1 Income Distributed during the year / period 1.88 –9.2 Tax on income distributed during the year / period 0.26 –10 Retained Surplus / (Deficit)
carried forward to Balance Sheet 204.26 8.20
Notes to Accounts - Annexure I
* Commission to Agents is included in Marketing & Distribution Expenses.** Management Fees is inclusive of Service Tax.*** Refer note - 8
Abridged Revenue Account for the year ended March 31, 2009

44
Rs. in Lakhs
HSBC FIXED TERM SERIES 46
Current PreviousYear ended Year ended
March 31, 2009 March 31, 2008
1 INCOME1.1 Dividend – –1.2 Interest 2,450.07 26.741.3 Realised Gain / (Loss) on Foreign Exchange Transactions – –1.4 Realised Gains / (Losses) on Interscheme sale of
investments (10.92) –1.5 Realised Gains / (Losses) on External
sale / redemption of investments (138.42) (0.00)1.6 Realised Gains / (Losses) on Derivative Transactions – –1.7 Other Income *** – –
(A) 2,300.73 26.732 EXPENSES2.1 Management fees 104.11 0.992.2 Service tax on Management fees ** – –2.3 Transfer agents fees and expenses 4.75 0.062.4 Custodian fees 2.61 0.032.5 Trusteeship fees 0.11 –2.6 Commission to Agents * – –2.7 Marketing & Distribution expenses 0.02 –2.8 Audit fees 0.05 0.062.9 Other operating expenses 0.94 0.02
(B) 112.59 1.173 NET REALISED GAINS / (LOSSES)
FOR THE YEAR / PERIOD (A - B = C) 2,188.14 25.564 Change in Unrealised Depreciation
in value of investments (D) – –5 NET GAINS / (LOSSES) FOR THE
YEAR / PERIOD [E = (C - D)] 2,188.14 25.566 Change in Unrealised Appreciation
in the value of investments (F) (1.21) 1.217 NET SURPLUS / (DEFICIT) FOR THE
YEAR / PERIOD (E + F = G) 2,186.93 26.777.1 Add: Balance transfer from Unrealised
Appreciation Reserve 1.21 –7.2 Less: Balance transfer to Unrealised
Appreciation Reserve – 1.217.3 Add / (Less): Equalisation – –7.4 Transfer from Reserve Fund 0.11 –7.5 Transfer from Unit Premium Reserve – –
8 TOTAL 2,188.25 25.569 Dividend Appropriation9.1 Income Distributed during the year / period 12.47 –9.2 Tax on income distributed during the year / period 2.37 –10 Retained Surplus / (Deficit)
carried forward to Balance Sheet 2,173.41 25.56
Notes to Accounts - Annexure I
* Commission to Agents is included in Marketing & Distribution Expenses.** Management Fees is inclusive of Service Tax.*** Refer note - 8
Abridged Revenue Account for the year ended March 31, 2009

45
Rs. in Lakhs
HSBC FIXED TERM SERIES 49
Current PreviousYear ended Year ended
March 31, 2009 March 31, 2008
1 INCOME1.1 Dividend – –1.2 Interest 3,188.05 32.721.3 Realised Gain / (Loss) on Foreign Exchange Transactions – –1.4 Realised Gains / (Losses) on Interscheme sale of
investments 1.09 –1.5 Realised Gains / (Losses) on External
sale / redemption of investments – (0.03)1.6 Realised Gains / (Losses) on Derivative Transactions – –1.7 Other Income *** – –
(A) 3,189.14 32.702 EXPENSES2.1 Management fees 75.93 0.732.2 Service tax on Management fees ** – –2.3 Transfer agents fees and expenses 6.48 0.082.4 Custodian fees 3.58 0.042.5 Trusteeship fees 0.14 –2.6 Commission to Agents * – –2.7 Marketing & Distribution expenses – –2.8 Audit fees 0.05 0.062.9 Other operating expenses 0.21 (0.01)2.10 Expenses to be Reimbursed by the Investment Manager – (0.05)
(B) 86.39 0.903 NET REALISED GAINS / (LOSSES)
FOR THE YEAR / PERIOD (A - B = C) 3,102.75 31.794 Change in Unrealised Depreciation
in value of investments (D) – –5 NET GAINS / (LOSSES) FOR THE
YEAR / PERIOD [E = (C - D)] 3,102.75 31.796 Change in Unrealised Appreciation
in the value of investments (F) (1.26) 1.267 NET SURPLUS / (DEFICIT) FOR THE
YEAR / PERIOD (E + F = G) 3,101.49 33.057.1 Add: Balance transfer from Unrealised
Appreciation Reserve 1.26 –7.2 Less: Balance transfer to Unrealised
Appreciation Reserve – 1.267.3 Add / (Less): Equalisation – –7.4 Transfer from Reserve Fund – –7.5 Transfer from Unit Premium Reserve – –
8 TOTAL 3,102.75 31.799 Dividend Appropriation9.1 Income Distributed during the year / period – –9.2 Tax on income distributed during the year / period – –10 Retained Surplus / (Deficit)
carried forward to Balance Sheet 3,102.75 31.79
Notes to Accounts - Annexure I
* Commission to Agents is included in Marketing & Distribution Expenses.** Management Fees is inclusive of Service Tax.*** Refer note - 8
Abridged Revenue Account for the year ended March 31, 2009

46
Rs. in Lakhs
HSBC FIXED HSBC FIXEDTERM SERIES 50 TERM SERIES 52
Current CurrentPeriod ended Period endedMarch 31, 2009 March 31, 2009
1 INCOME1.1 Dividend – –1.2 Interest 3,833.99 2,263.431.3 Realised Gain / (Loss) on Foreign Exchange Transactions – –1.4 Realised Gains / (Losses) on Interscheme sale of
investments (0.16) (25.85)1.5 Realised Gains / (Losses) on External
sale / redemption of investments (0.08) (249.70)1.6 Realised Gains / (Losses) on Derivative Transactions – –1.7 Other Income *** – –
(A) 3,833.75 1,987.882 EXPENSES2.1 Management fees 92.96 96.582.2 Service tax on Management fees ** – –2.3 Transfer agents fees and expenses 7.79 3.982.4 Custodian fees 4.70 2.512.5 Trusteeship fees 0.19 0.102.6 Commission to Agents * – –2.7 Marketing & Distribution expenses – 0.022.8 Audit fees 0.05 0.052.9 Other operating expenses 0.05 0.28
(B) 105.74 103.523 NET REALISED GAINS / (LOSSES)
FOR THE YEAR / PERIOD (A - B = C) 3,728.01 1,884.364 Change in Unrealised Depreciation
in value of investments (D) 51.40 187.275 NET GAINS / (LOSSES) FOR THE
YEAR / PERIOD [E = (C - D)] 3,676.61 1,697.096 Change in Unrealised Appreciation
in the value of investments (F) – –7 NET SURPLUS / (DEFICIT) FOR THE
YEAR / PERIOD (E + F = G) 3,676.61 1,697.097.1 Add: Balance transfer from Unrealised
Appreciation Reserve – –7.2 Less: Balance transfer to Unrealised
Appreciation Reserve – –7.3 Add / (Less): Equalisation – –7.4 Transfer from Reserve Fund – –7.5 Transfer from Unit Premium Reserve – –
8 TOTAL 3,676.61 1,697.099 Dividend Appropriation9.1 Income Distributed during the year / period – 33.139.2 Tax on income distributed during the year / period – 6.0610 Retained Surplus / (Deficit)
carried forward to Balance Sheet 3,676.61 1,657.90
Notes to Accounts - Annexure I
* Commission to Agents is included in Marketing & Distribution Expenses.** Management Fees is inclusive of Service Tax.*** Refer note - 8
Abridged Revenue Account for the period ended March 31, 2009

47
Rs. in Lakhs
HSBC FIXED HSBC FIXEDTERM SERIES 53 TERM SERIES 54
Current CurrentPeriod ended Period endedMarch 31, 2009 March 31, 2009
1 INCOME1.1 Dividend – –1.2 Interest 1,519.25 1,649.041.3 Realised Gain / (Loss) on Foreign Exchange Transactions – –1.4 Realised Gains / (Losses) on Interscheme sale of
investments (5.48) (16.66)1.5 Realised Gains / (Losses) on External
sale / redemption of investments (252.81) (128.22)1.6 Realised Gains / (Losses) on Derivative Transactions – –1.7 Other Income *** – –
(A) 1,260.96 1,504.162 EXPENSES2.1 Management fees 72.27 101.672.2 Service tax on Management fees ** – –2.3 Transfer agents fees and expenses 2.53 2.732.4 Custodian fees 1.71 1.792.5 Trusteeship fees 0.07 0.082.6 Commission to Agents * – –2.7 Marketing & Distribution expenses 0.02 0.022.8 Audit fees 0.05 0.052.9 Other operating expenses 0.09 0.22
(B) 76.74 106.563 NET REALISED GAINS / (LOSSES)
FOR THE YEAR / PERIOD (A - B = C) 1,184.21 1,397.604 Change in Unrealised Depreciation
in value of investments (D) 18.94 76.645 NET GAINS / (LOSSES) FOR THE
YEAR / PERIOD [E = (C - D)] 1,165.28 1,320.966 Change in Unrealised Appreciation
in the value of investments (F) – –7 NET SURPLUS / (DEFICIT) FOR THE
YEAR / PERIOD (E + F = G) 1,165.28 1,320.967.1 Add: Balance transfer from Unrealised
Appreciation Reserve – –7.2 Less: Balance transfer to Unrealised
Appreciation Reserve – –7.3 Add / (Less): Equalisation – –7.4 Transfer from Reserve Fund – –7.5 Transfer from Unit Premium Reserve – –
8 TOTAL 1,165.28 1,320.969 Dividend Appropriation9.1 Income Distributed during the year / period 38.52 133.349.2 Tax on income distributed during the year / period 5.87 26.8010 Retained Surplus / (Deficit)
carried forward to Balance Sheet 1,120.89 1,160.82
Notes to Accounts - Annexure I
* Commission to Agents is included in Marketing & Distribution Expenses.** Management Fees is inclusive of Service Tax.*** Refer note - 8
Abridged Revenue Account for the period ended March 31, 2009

48
Rs. in Lakhs
HSBC FIXED HSBC FIXEDTERM SERIES 56 TERM SERIES 57
Current CurrentPeriod ended Period endedMarch 31, 2009 March 31, 2009
1 INCOME1.1 Dividend – –1.2 Interest 948.58 375.951.3 Realised Gain / (Loss) on Foreign Exchange Transactions – –1.4 Realised Gains / (Losses) on Interscheme sale of
investments – –1.5 Realised Gains / (Losses) on External
sale / redemption of investments (63.21) 0.951.6 Realised Gains / (Losses) on Derivative Transactions – –1.7 Other Income *** – –
(A) 885.37 376.902 EXPENSES2.1 Management fees 40.76 14.602.2 Service tax on Management fees ** – –2.3 Transfer agents fees and expenses 1.35 0.652.4 Custodian fees 0.92 0.412.5 Trusteeship fees 0.05 0.022.6 Commission to Agents * – –2.7 Marketing & Distribution expenses – –2.8 Audit fees 0.05 0.052.9 Other operating expenses 0.08 0.05
(B) 43.21 15.783 NET REALISED GAINS / (LOSSES)
FOR THE YEAR / PERIOD (A - B = C) 842.16 361.124 Change in Unrealised Depreciation
in value of investments (D) 41.36 –5 NET GAINS / (LOSSES) FOR THE
YEAR / PERIOD [E = (C - D)] 800.80 361.126 Change in Unrealised Appreciation
in the value of investments (F) 28.55 –7 NET SURPLUS / (DEFICIT) FOR THE
YEAR / PERIOD (E + F = G) 829.35 361.127.1 Add: Balance transfer from Unrealised
Appreciation Reserve – –7.2 Less: Balance transfer to Unrealised
Appreciation Reserve 28.55 –7.3 Add / (Less): Equalisation – –7.4 Transfer from Reserve Fund – –7.5 Transfer from Unit Premium Reserve – –
8 TOTAL 800.80 361.129 Dividend Appropriation9.1 Income Distributed during the year / period 90.29 5.839.2 Tax on income distributed during the year / period 16.34 0.9010 Retained Surplus / (Deficit)
carried forward to Balance Sheet 694.17 354.39
Notes to Accounts - Annexure I
* Commission to Agents is included in Marketing & Distribution Expenses.** Management Fees is inclusive of Service Tax.*** Refer note - 8
Abridged Revenue Account for the period ended March 31, 2009

49
Rs. in Lakhs
HSBC FIXED HSBC FIXEDTERM SERIES 59 TERM SERIES 61
Current CurrentPeriod ended Period endedMarch 31, 2009 March 31, 2009
1 INCOME1.1 Dividend – –1.2 Interest 2,764.38 751.481.3 Realised Gain / (Loss) on Foreign Exchange Transactions – –1.4 Realised Gains / (Losses) on Interscheme sale of
investments – (33.58)1.5 Realised Gains / (Losses) on External
sale / redemption of investments (62.78) (20.00)1.6 Realised Gains / (Losses) on Derivative Transactions – –1.7 Other Income *** – –
(A) 2,701.60 697.902 EXPENSES2.1 Management fees 84.25 27.032.2 Service tax on Management fees ** – –2.3 Transfer agents fees and expenses 4.13 1.052.4 Custodian fees 2.74 0.742.5 Trusteeship fees 0.14 0.042.6 Commission to Agents * – –2.7 Marketing & Distribution expenses – –2.8 Audit fees 0.05 0.052.9 Other operating expenses 0.17 0.09
(B) 91.48 29.003 NET REALISED GAINS / (LOSSES)
FOR THE YEAR / PERIOD (A - B = C) 2,610.12 668.904 Change in Unrealised Depreciation
in value of investments (D) 173.23 23.275 NET GAINS / (LOSSES) FOR THE
YEAR / PERIOD [E = (C - D)] 2,436.89 645.636 Change in Unrealised Appreciation
in the value of investments (F) – 17.447 NET SURPLUS / (DEFICIT) FOR THE
YEAR / PERIOD (E + F = G) 2,436.89 663.077.1 Add: Balance transfer from Unrealised
Appreciation Reserve – –7.2 Less: Balance transfer to Unrealised
Appreciation Reserve – 17.447.3 Add / (Less): Equalisation – –7.4 Transfer from Reserve Fund – –7.5 Transfer from Unit Premium Reserve – –
8 TOTAL 2,436.89 645.649 Dividend Appropriation9.1 Income Distributed during the year / period 69.78 21.689.2 Tax on income distributed during the year / period 10.04 3.8610 Retained Surplus / (Deficit)
carried forward to Balance Sheet 2,357.08 620.10
Notes to Accounts - Annexure I
* Commission to Agents is included in Marketing & Distribution Expenses.** Management Fees is inclusive of Service Tax.*** Refer note - 8
Abridged Revenue Account for the period ended March 31, 2009

50
Rs. in Lakhs
HSBC FIXED HSBC FIXEDTERM SERIES 62 TERM SERIES 63
Current CurrentPeriod ended Period endedMarch 31, 2009 March 31, 2009
1 INCOME1.1 Dividend – –1.2 Interest 2,912.18 568.811.3 Realised Gain / (Loss) on Foreign Exchange Transactions – –1.4 Realised Gains / (Losses) on Interscheme sale of
investments – –1.5 Realised Gains / (Losses) on External
sale / redemption of investments 6.26 (74.67)1.6 Realised Gains / (Losses) on Derivative Transactions – –1.7 Other Income *** – 13.87
(A) 2,918.44 508.012 EXPENSES2.1 Management fees 60.78 3.302.2 Service tax on Management fees ** – –2.3 Transfer agents fees and expenses 4.83 1.052.4 Custodian fees 2.95 0.602.5 Trusteeship fees 0.18 0.042.6 Commission to Agents * – –2.7 Marketing & Distribution expenses 117.85 18.442.8 Audit fees 0.05 0.052.9 Other operating expenses 0.05 0.062.10 Less: Expenses to be Reimbursed by the
Investment Manager – (3.06)
(B) 186.69 20.483 NET REALISED GAINS / (LOSSES)
FOR THE YEAR / PERIOD (A - B = C) 2,731.75 487.534 Change in Unrealised Depreciation
in value of investments (D) 71.18 –5 NET GAINS / (LOSSES) FOR THE
YEAR / PERIOD [E = (C - D)] 2,660.57 487.536 Change in Unrealised Appreciation
in the value of investments (F) – 32.757 NET SURPLUS / (DEFICIT) FOR THE
YEAR / PERIOD (E + F = G) 2,660.57 520.287.1 Add: Balance transfer from Unrealised
Appreciation Reserve – –7.2 Less: Balance transfer to Unrealised
Appreciation Reserve – 32.757.3 Add / (Less): Equalisation – –7.4 Transfer from Reserve Fund – –7.5 Transfer from Unit Premium Reserve – –
8 TOTAL 2,660.57 487.539 Dividend Appropriation9.1 Income Distributed during the year / period 3.58 4.199.2 Tax on income distributed during the year / period 0.61 0.5910 Retained Surplus / (Deficit)
carried forward to Balance Sheet 2,656.38 482.75
Notes to Accounts - Annexure I
* Commission to Agents is included in Marketing & Distribution Expenses.** Management Fees is inclusive of Service Tax.*** Refer note - 8
Abridged Revenue Account for the period ended March 31, 2009

51
Rs. in Lakhs
HSBC FIXED TERM SERIES 66
Current Period endedMarch 31, 2009
1 INCOME1.1 Dividend –1.2 Interest 321.641.3 Realised Gain / (Loss) on Foreign Exchange Transactions –1.4 Realised Gains / (Losses) on Interscheme sale of investments –1.5 Realised Gains / (Losses) on External sale / redemption of
investments 11.911.6 Realised Gains / (Losses) on Derivative Transactions –1.7 Other Income *** 7.18
(A) 340.732 EXPENSES2.1 Management fees 5.142.2 Service tax on Management fees ** –2.3 Transfer agents fees and expenses 0.722.4 Custodian fees 0.362.5 Trusteeship fees 0.032.6 Commission to Agents * –2.7 Marketing & Distribution expenses 26.302.8 Audit fees 0.052.9 Other operating expenses 0.11
(B) 32.713 NET REALISED GAINS / (LOSSES)
FOR THE YEAR / PERIOD (A - B = C) 308.024 Change in Unrealised Depreciation in value of investments (D) –5 NET GAINS / (LOSSES) FOR THE YEAR / PERIOD [E = (C - D)] 308.026 Change in Unrealised Appreciation in the value of
investments (F) 40.377 NET SURPLUS / (DEFICIT) FOR THE YEAR / PERIOD (E + F = G) 348.397.1 Add: Balance transfer from Unrealised Appreciation Reserve –7.2 Less: Balance transfer to Unrealised Appreciation Reserve 40.377.3 Add / (Less): Equalisation –7.4 Transfer from Reserve Fund –7.5 Transfer from Unit Premium Reserve –
8 TOTAL 308.02
9 Dividend Appropriation9.1 Income Distributed during the year / period 22.419.2 Tax on income distributed during the year / period 3.2610 Retained Surplus / (Deficit)
carried forward to Balance Sheet 282.35
Notes to Accounts - Annexure I
* Commission to Agents is included in Marketing & Distribution Expenses.** Management Fees is inclusive of Service Tax.*** Refer note - 8
Abridged Revenue Account for the period ended March 31, 2009

52
Key Statistics for the year ended March 31, 2009
HSBC FIXED TERM SERIES 30
Current PreviousYear ended Year ended
March 31, 2009 March 31, 2008
1. NAV per unit (Rs.):
Open
Regular Growth Option 10.9311 –
Regular Dividend Option 10.4450 –
Institutional Growth Option 10.9311 –
Institutional Dividend Option 10.4346 –
High
Regular Growth Option 11.6034 10.9311
Regular Dividend Option 10.5824 10.7218
Institutional Growth Option 11.6034 10.9311
Institutional Dividend Option 10.5719 10.7218
Low
Regular Growth Option 10.5148 10.0031
Regular Dividend Option 9.5131 10.0031
Institutional Growth Option 10.5148 10.0031
Institutional Dividend Option 9.5131 10.0031
End
Regular Growth Option 11.6034 10.9311
Regular Dividend Option 10.0762 10.4450
Institutional Growth Option 11.6034 10.9311
Institutional Dividend Option – 10.4346
2. Closing Assets Under Management (Rs. in Lakhs)
End 8,708 10,531
Average (AAuM)1 9,630 10,708
3. Gross income as % of AAuM2 9.56% 8.42%
4. Expense Ratio:
a. Total Expense as % of AAuM (planwise)
Regular Growth Option 1.18% 1.06%
Regular Dividend Option 1.18% 1.06%
Institutional Growth Option 1.18% 1.06%
Institutional Dividend Option 1.18% 1.06%
b. Management Fee as % of AAuM (planwise)
Regular Growth Option 0.47% 0.41%
Regular Dividend Option 0.47% 0.41%
Institutional Growth Option 0.47% 0.41%
Institutional Dividend Option 0.47% 0.41%

53
Key Statistics for the year ended March 31, 2009 (Contd...)
HSBC FIXED TERM SERIES 30
Current PreviousYear ended Year ended
March 31, 2009 March 31, 2008
1 Gross income = amount against (A) in the Revenue Account i.e. Income.
2 Net income = amount against (C) in the Revenue Account i.e. NET REALISED GAINS / (LOSSES)FOR THE YEAR / PERIOD
3 Portfolio Turnover = Lower of sales or purchase divided by the Average AuM for the year / period.
4 AAuM = Average daily net assets
5. Net Income as a percentage of AAuM3 8.38% 7.45%
6. Portfolio turnover ratio4 – –
7. Total Dividend per unit distributedduring the year / period (planwise)
Individual / HUF
Regular Dividend Option 0.3667 0.4171
Institutional Dividend Option – 0.4261
Corporate
Regular Dividend Option 0.3413 0.3882
Institutional Dividend Option – –
8. Returns:
a. Last One Year
Scheme
Regular Growth Option 6.1503 3.0748
Regular Dividend Option 4.9175 4.1333
Institutional Growth Option 6.1503 3.0622
Institutional Dividend Option – 4.1333
Benchmark
CRISIL Short-Term Bond Fund Index 9.79% NA
CRISIL Liquid Fund Index NA NA
b. Since Inception
Scheme
Regular Growth Option 8.59% 7.1035
Regular Dividend Option 7.56% 8.0706
Institutional Growth Option 8.59% 7.0920
Institutional Dividend Option – 8.0706
Benchmark
CRISIL Short-Term Bond Fund Index 9.08% 6.5526
CRISIL Liquid Fund Index NA NA

54
Key Statistics for the year ended March 31, 2009
HSBC FIXED TERM SERIES 41
Current PreviousYear ended Year ended
March 31, 2009 March 31, 2008
1. NAV per unit (Rs.):
Open
Regular Growth Option 10.2514 –
Regular Dividend Option 10.2514 –
Institutional Growth Option 10.2620 –
Institutional Dividend Option 10.2620 –
High
Regular Growth Option 11.1842 10.2514
Regular Dividend Option 10.6385 10.2514
Institutional Growth Option 11.2335 10.2620
Institutional Dividend Option 10.6670 10.2620
Low
Regular Growth Option 10.2514 10.0042
Regular Dividend Option 10.0000 10.0042
Institutional Growth Option 10.2620 10.0042
Institutional Dividend Option 10.0000 10.0042
End
Regular Growth Option 11.1842 10.2514
Regular Dividend Option 10.0648 10.2514
Institutional Growth Option 11.2335 10.2620
Institutional Dividend Option 10.0681 10.2620
2. Closing Assets Under Management (Rs. in Lakhs)
End 3,608 5,884
Average (AAuM)1 4,938 5,808
3. Gross income as % of AAuM2 9.04% 2.63%
4. Expense Ratio:
a. Total Expense as % of AAuM (planwise)
Regular Growth Option 0.49% 0.50%
Regular Dividend Option 0.49% 0.50%
Institutional Growth Option 0.15% 0.14%
Institutional Dividend Option 0.15% 0.14%
b. Management Fee as % of AAuM (planwise)
Regular Growth Option 0.10% 0.06%
Regular Dividend Option 0.10% 0.06%
Institutional Growth Option 0.10% 0.06%
Institutional Dividend Option 0.10% 0.06%
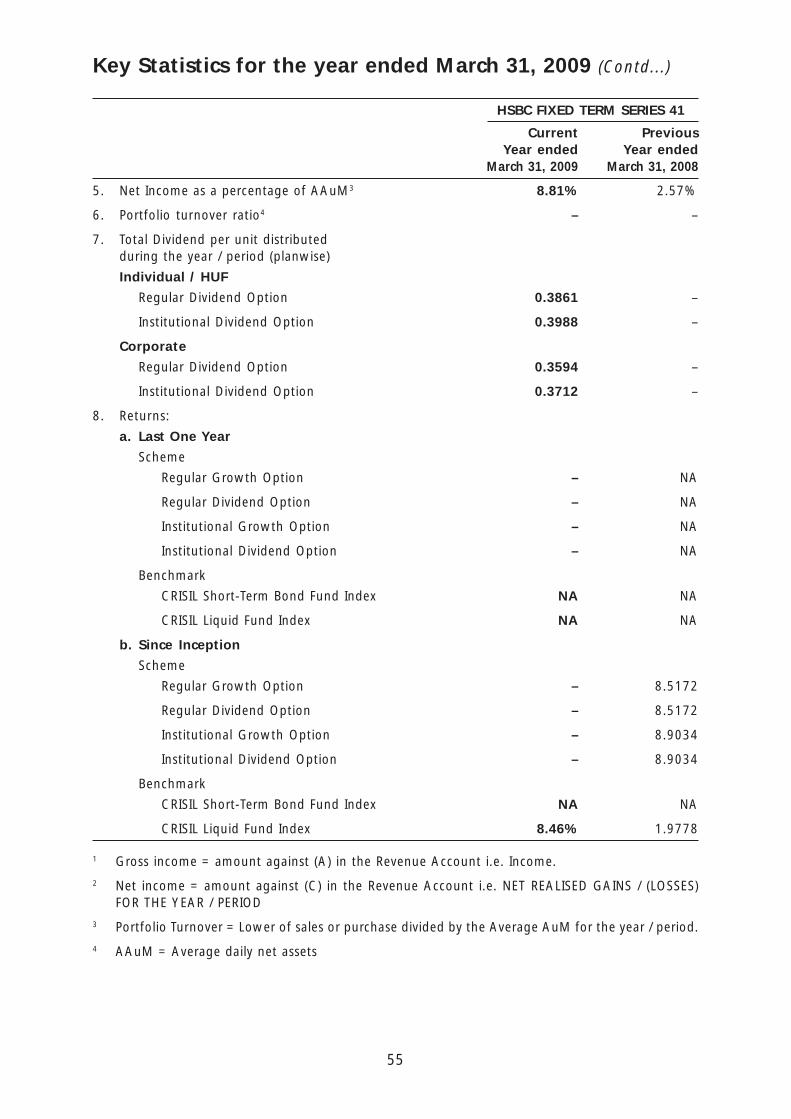
55
Key Statistics for the year ended March 31, 2009 (Contd...)
HSBC FIXED TERM SERIES 41
Current PreviousYear ended Year ended
March 31, 2009 March 31, 2008
1 Gross income = amount against (A) in the Revenue Account i.e. Income.
2 Net income = amount against (C) in the Revenue Account i.e. NET REALISED GAINS / (LOSSES)FOR THE YEAR / PERIOD
3 Portfolio Turnover = Lower of sales or purchase divided by the Average AuM for the year / period.
4 AAuM = Average daily net assets
5. Net Income as a percentage of AAuM3 8.81% 2.57%
6. Portfolio turnover ratio4 – –
7. Total Dividend per unit distributedduring the year / period (planwise)
Individual / HUF
Regular Dividend Option 0.3861 –
Institutional Dividend Option 0.3988 –
Corporate
Regular Dividend Option 0.3594 –
Institutional Dividend Option 0.3712 –
8. Returns:
a. Last One Year
Scheme
Regular Growth Option – NA
Regular Dividend Option – NA
Institutional Growth Option – NA
Institutional Dividend Option – NA
Benchmark
CRISIL Short-Term Bond Fund Index NA NA
CRISIL Liquid Fund Index NA NA
b. Since Inception
Scheme
Regular Growth Option – 8.5172
Regular Dividend Option – 8.5172
Institutional Growth Option – 8.9034
Institutional Dividend Option – 8.9034
Benchmark
CRISIL Short-Term Bond Fund Index NA NA
CRISIL Liquid Fund Index 8.46% 1.9778

56
Key Statistics for the year ended March 31, 2009
HSBC FIXED TERM SERIES 42
Current PreviousYear ended Year ended
March 31, 2009 March 31, 2008
1. NAV per unit (Rs.):
Open
Regular Growth Option 10.0927 –
Regular Dividend Option – –
Institutional Growth Option 10.0927 –
Institutional Dividend Option – –
High
Regular Growth Option 10.9618 10.0927
Regular Dividend Option – –
Institutional Growth Option 10.9618 10.0927
Institutional Dividend Option – –
Low
Regular Growth Option 10.0927 9.9902
Regular Dividend Option – –
Institutional Growth Option 10.0927 9.9902
Institutional Dividend Option – –
End
Regular Growth Option 10.9618 10.0927
Regular Dividend Option – –
Institutional Growth Option 10.9618 10.0927
Institutional Dividend Option – –
2. Closing Assets Under Management (Rs. in Lakhs)
End 68,510 63,078
Average (AAuM)1 65,193 125,231
3. Gross income as % of AAuM2 9.20% 0.71%
4. Expense Ratio:
a. Total Expense as % of AAuM (planwise)
Regular Growth Option 0.22% 0.19%
Regular Dividend Option – –
Institutional Growth Option 0.22% 0.19%
Institutional Dividend Option – –
b. Management Fee as % of AAuM (planwise)
Regular Growth Option 0.13% 0.10%
Regular Dividend Option – –
Institutional Growth Option 0.13% 0.10%
Institutional Dividend Option – –

57
Key Statistics for the year ended March 31, 2009 (Contd...)
HSBC FIXED TERM SERIES 42
Current PreviousYear ended Year ended
March 31, 2009 March 31, 2008
1 Gross income = amount against (A) in the Revenue Account i.e. Income.
2 Net income = amount against (C) in the Revenue Account i.e. NET REALISED GAINS / (LOSSES)FOR THE YEAR / PERIOD
3 Portfolio Turnover = Lower of sales or purchase divided by the Average AuM for the year / period.
4 AAuM = Average daily net assets
5. Net Income as a percentage of AAuM3 8.98% 0.69%
6. Portfolio turnover ratio4 – –
7. Total Dividend per unit distributedduring the year / period (planwise)
Individual / HUF
Regular Dividend Option – –
Institutional Dividend Option – –
Corporate
Regular Dividend Option – –
Institutional Dividend Option – –
8. Returns:
a. Last One Year
Scheme
Regular Growth Option 8.61% NA
Regular Dividend Option – NA
Institutional Growth Option 8.61% NA
Institutional Dividend Option – NA
Benchmark
CRISIL Short-Term Bond Fund Index NA NA
CRISIL Liquid Fund Index 8.78% NA
b. Since Inception
Scheme
Regular Growth Option 8.37% NA
Regular Dividend Option – 5.8820
Institutional Growth Option 8.37% NA
Institutional Dividend Option – 5.8820
Benchmark
CRISIL Short-Term Bond Fund Index NA NA
CRISIL Liquid Fund Index 8.63% 1.0220

58
Key Statistics for the year ended March 31, 2009
HSBC FIXED TERM SERIES 44
Current PreviousYear ended Year ended
March 31, 2009 March 31, 2008
1. NAV per unit (Rs.):
Open
Regular Growth Option 10.0444 –
Regular Dividend Option 10.0444 –
Institutional Growth Option 10.0462 –
Institutional Dividend Option – –
High
Regular Growth Option 10.9516 10.0444
Regular Dividend Option 10.4752 10.0444
Institutional Growth Option 11.0085 10.0462
Institutional Dividend Option – –
Low
Regular Growth Option 10.0444 10.0127
Regular Dividend Option 10.0000 10.0127
Institutional Growth Option 10.0462 10.0127
Institutional Dividend Option – –
End
Regular Growth Option 10.9516 10.0444
Regular Dividend Option 10.0282 10.0444
Institutional Growth Option 11.0085 10.0462
Institutional Dividend Option – –
2. Closing Assets Under Management (Rs. in Lakhs)
End 9,952 13,371
Average (AAuM)1 11,612 13,346
3. Gross income as % of AAuM2 9.30% 0.47%
4. Expense Ratio:
a. Total Expense as % of AAuM (planwise)
Regular Growth Option 0.60% 0.36%
Regular Dividend Option 0.60% 0.29%
Institutional Growth Option 0.10% 0.06%
Institutional Dividend Option – –
b. Management Fee as % of AAuM (planwise)
Regular Growth Option 0.17% 0.40%
Regular Dividend Option 0.17% 0.32%
Institutional Growth Option 0.17% 0.09%
Institutional Dividend Option – –

59
Key Statistics for the year ended March 31, 2009 (Contd...)
HSBC FIXED TERM SERIES 44
Current PreviousYear ended Year ended
March 31, 2009 March 31, 2008
1 Gross income = amount against (A) in the Revenue Account i.e. Income.
2 Net income = amount against (C) in the Revenue Account i.e. NET REALISED GAINS / (LOSSES)FOR THE YEAR / PERIOD
3 Portfolio Turnover = Lower of sales or purchase divided by the Average AuM for the year / period.
4 AAuM = Average daily net assets
5. Net Income as a percentage of AAuM3 9.09% 0.46%
6. Portfolio turnover ratio4 – –
7. Total Dividend per unit distributedduring the year / period (planwise)
Individual / HUF
Regular Dividend Option 0.7850 –
Institutional Dividend Option – –
Corporate
Regular Dividend Option 0.3432 –
Institutional Dividend Option – –
8. Returns:
a. Last One Year
Scheme
Regular Growth Option NA NA
Regular Dividend Option NA NA
Institutional Growth Option NA NA
Institutional Dividend Option NA NA
Benchmark
CRISIL Short-Term Bond Fund Index NA NA
CRISIL Liquid Fund Index NA NA
b. Since Inception
Scheme
Regular Growth Option 9.20% 9.9667
Regular Dividend Option – 9.9667
Institutional Growth Option – NA
Institutional Dividend Option – 10.4897
Benchmark
CRISIL Short-Term Bond Fund Index NA NA
CRISIL Liquid Fund Index 8.88% 0.3498

60
Key Statistics for the year ended March 31, 2009
HSBC FIXED TERM SERIES 45
Current PreviousYear ended Year ended
March 31, 2009 March 31, 2008
1. NAV per unit (Rs.):
Open
Regular Growth Option 10.0287 –
Regular Dividend Option 10.0287 –
Institutional Growth Option 10.0292 –
Institutional Dividend Option – –
High
Regular Growth Option 10.8420 10.0287
Regular Dividend Option 10.4353 10.0287
Institutional Growth Option 10.8859 10.0292
Institutional Dividend Option – –
Low
Regular Growth Option 10.0287 10.0199
Regular Dividend Option 9.9914 10.0199
Institutional Growth Option 10.0292 10.0199
Institutional Dividend Option – –
End
Regular Growth Option 10.8420 10.0287
Regular Dividend Option 10.0294 10.0287
Institutional Growth Option 10.8859 10.0292
Institutional Dividend Option – –
2. Closing Assets Under Management (Rs. in Lakhs)
End 1,998 2,827
Average (AAuM)1 2,500 2,825
3. Gross income as % of AAuM2 8.55% 0.30%
4. Expense Ratio:
a. Total Expense as % of AAuM (planwise)
Regular Growth Option 0.60% 0.27%
Regular Dividend Option 0.60% 0.27%
Institutional Growth Option 0.20% 0.15%
Institutional Dividend Option 0.20% 0.00%
b. Management Fee as % of AAuM (planwise)
Regular Growth Option 0.26% 0.40%
Regular Dividend Option 0.26% 0.40%
Institutional Growth Option 0.26% 0.29%
Institutional Dividend Option 0.26% –

61
Key Statistics for the year ended March 31, 2009 (Contd...)
HSBC FIXED TERM SERIES 45
Current PreviousYear ended Year ended
March 31, 2009 March 31, 2008
1 Gross income = amount against (A) in the Revenue Account i.e. Income.
2 Net income = amount against (C) in the Revenue Account i.e. NET REALISED GAINS / (LOSSES)FOR THE YEAR / PERIOD
3 Portfolio Turnover = Lower of sales or purchase divided by the Average AuM for the year / period.
4 AAuM = Average daily net assets
5. Net Income as a percentage of AAuM3 8.25% 0.29%
6. Portfolio turnover ratio4 – –
7. Total Dividend per unit distributedduring the year / period (planwise)
Individual / HUF
Regular Dividend Option 0.6934 –
Institutional Dividend Option – –
Corporate
Regular Dividend Option 0.2905 –
Institutional Dividend Option – –
8. Returns:
a. Last One Year
Scheme
Regular Growth Option – NA
Regular Dividend Option – NA
Institutional Growth Option – NA
Institutional Dividend Option – NA
Benchmark
CRISIL Short-Term Bond Fund Index – NA
CRISIL Liquid Fund Index – NA
b. Since Inception
Scheme
Regular Growth Option 8.35% 9.5893
Regular Dividend Option – 9.5893
Institutional Growth Option – NA
Institutional Dividend Option – 10.0039
Benchmark
CRISIL Short-Term Bond Fund Index – NA
CRISIL Liquid Fund Index 8.83% 0.0900

62
Key Statistics for the year ended March 31, 2009
HSBC FIXED TERM SERIES 46
Current PreviousYear ended Year ended
March 31, 2009 March 31, 2008
1. NAV per unit (Rs.):
Open
Regular Growth Option 10.0100 –
Regular Dividend Option 10.0100 –
Institutional Growth Option 10.0104 –
Institutional Dividend Option 10.0104 –
High
Regular Growth Option 10.8717 10.0100
Regular Dividend Option 10.3100 10.0100
Institutional Growth Option 10.9151 10.0104
Institutional Dividend Option 10.3291 10.0104
Low
Regular Growth Option 10.0100 10.0000
Regular Dividend Option 10.0000 10.0000
Institutional Growth Option 10.0104 10.0000
Institutional Dividend Option 0.0000 10.0000
End
Regular Growth Option 10.8717 10.0100
Regular Dividend Option 10.0385 10.0100
Institutional Growth Option 10.9151 10.0104
Institutional Dividend Option 10.0399 10.0104
2. Closing Assets Under Management (Rs. in Lakhs)
End 24,871 25,702
Average (AAuM)1 5,663 25,685
3. Gross income as % of AAuM2 8.97% 0.10%
4. Expense Ratio:
a. Total Expense as % of AAuM (planwise)
Regular Growth Option 0.81% 0.80%
Regular Dividend Option 0.81% 0.80%
Institutional Growth Option 0.42% 0.40%
Institutional Dividend Option 0.42% 0.40%
b. Management Fee as % of AAuM (planwise)
Regular Growth Option 0.41% 1.15%
Regular Dividend Option 0.41% 1.15%
Institutional Growth Option 0.41% 0.75%
Institutional Dividend Option 0.41% 1.15%

63
Key Statistics for the year ended March 31, 2009 (Contd...)
HSBC FIXED TERM SERIES 46
Current PreviousYear ended Year ended
March 31, 2009 March 31, 2008
1 Gross income = amount against (A) in the Revenue Account i.e. Income.
2 Net income = amount against (C) in the Revenue Account i.e. NET REALISED GAINS / (LOSSES)FOR THE YEAR / PERIOD
3 Portfolio Turnover = Lower of sales or purchase divided by the Average AuM for the year / period.
4 AAuM = Average daily net assets
5. Net Income as a percentage of AAuM3 8.53% 0.10%
6. Portfolio turnover ratio4 – –
7. Total Dividend per unit distributedduring the year / period (planwise)
Individual / HUF
Regular Dividend Option 0.7081 –
Institutional Dividend Option 0.4546 –
Corporate
Regular Dividend Option 0.4064 –
Institutional Dividend Option 0.6914 –
8. Returns:
a. Last One Year
Scheme
Regular Growth Option – NA
Regular Dividend Option – NA
Institutional Growth Option – NA
Institutional Dividend Option – NA
Benchmark
CRISIL Short-Term Bond Fund Index – NA
CRISIL Liquid Fund Index – NA
b. Since Inception
Scheme
Regular Growth Option 8.64% 5.8926
Regular Dividend Option – 5.8926
Institutional Growth Option – 6.3043
Institutional Dividend Option – 6.3043
Benchmark
CRISIL Short-Term Bond Fund Index – NA
CRISIL Liquid Fund Index 8.83% 0.0900

64
Key Statistics for the year ended March 31, 2009
HSBC FIXED TERM SERIES 49
Current PreviousYear ended Year ended
March 31, 2009 March 31, 2008
1. NAV per unit (Rs.):
Open
Regular Growth Option 10.0100 –
Regular Dividend Option 10.0100 –
Institutional Growth Option 10.0100 –
Institutional Dividend Option – –
High
Regular Growth Option 10.9504 10.0100
Regular Dividend Option 10.9504 10.0100
Institutional Growth Option 10.9504 10.0100
Institutional Dividend Option – –
Low
Regular Growth Option 10.0100 10.0000
Regular Dividend Option 10.0100 10.0000
Institutional Growth Option 10.0100 10.0000
Institutional Dividend Option – –
End
Regular Growth Option 10.9494 10.0100
Regular Dividend Option 10.9494 10.0100
Institutional Growth Option 10.9494 10.0100
Institutional Dividend Option – –
2. Closing Assets Under Management (Rs. in Lakhs)
End 36,150 33,051
Average (AAuM)1 34,565 33,030
3. Gross income as % of AAuM2 9.23% 0.10%
4. Expense Ratio:
a. Total Expense as % of AAuM (planwise)
Regular Growth Option 0.25% 0.25%
Regular Dividend Option 0.25% 0.25%
Institutional Growth Option 0.25% 0.25%
Institutional Dividend Option – –
b. Management Fee as % of AAuM (planwise)
Regular Growth Option 0.22% 0.45%
Regular Dividend Option 0.22% 0.45%
Institutional Growth Option 0.22% 0.45%
Institutional Dividend Option – –

65
Key Statistics for the year ended March 31, 2009 (Contd...)
HSBC FIXED TERM SERIES 49
Current PreviousYear ended Year ended
March 31, 2009 March 31, 2008
5. Net Income as a percentage of AAuM3 8.98% 0.10%
6. Portfolio turnover ratio4 – –
7. Total Dividend per unit distributedduring the year / period (planwise)
Individual / HUF
Regular Dividend Option – –
Institutional Dividend Option – –
Corporate
Regular Dividend Option – –
Institutional Dividend Option – –
8. Returns:
a. Last One Year
Scheme
Regular Growth Option – NA
Regular Dividend Option – NA
Institutional Growth Option – NA
Institutional Dividend Option – NA
Benchmark
CRISIL Short-Term Bond Fund Index – NA
CRISIL Liquid Fund Index – NA
b. Since Inception
Scheme
Regular Growth Option 9.41% 8.7045
Regular Dividend Option – 8.7045
Institutional Growth Option – NA
Institutional Dividend Option – 8.7045
Benchmark
CRISIL Short-Term Bond Fund Index – NA
CRISIL Liquid Fund Index 8.83% 0.0900
1 Gross income = amount against (A) in the Revenue Account i.e. Income.
2 Net income = amount against (C) in the Revenue Account i.e. NET REALISED GAINS / (LOSSES)FOR THE YEAR / PERIOD
3 Portfolio Turnover = Lower of sales or purchase divided by the Average AuM for the year / period.
4 AAuM = Average daily net assets

66
Key Statistics for the year ended March 31, 2009
HSBC FIXED HSBC FIXEDTERM SERIES 50 TERM SERIES 52
Current CurrentYear ended Year ended
March 31, 2009 March 31, 2009
1. NAV per unit (Rs.):
Open
Regular Growth Option – –
Regular Dividend Option – –
Institutional Growth Option – –
Institutional Dividend Option – –
High
Regular Growth Option 10.8332 10.7536
Regular Dividend Option – 10.3729
Institutional Growth Option 10.8332 10.7925
Institutional Dividend Option – 10.3832
Low
Regular Growth Option 10.0000 9.9899
Regular Dividend Option – 9.7848
Institutional Growth Option 10.0000 10.0001
Institutional Dividend Option 9.7885
End
Regular Growth Option 10.8332 10.7536
Regular Dividend Option – 10.0677
Institutional Growth Option 10.8332 10.7925
Institutional Dividend Option – 10.0697
2. Closing Assets Under Management (Rs. in Lakhs)
End 47,801 22,115
Average (AAuM)1 45,816 24,816
3. Gross income as % of AAuM2 9.04% 8.83%
4. Expense Ratio:
a. Total Expense as % of AAuM (planwise)
Regular Growth Option 0.25% 0.70%
Regular Dividend Option – 0.70%
Institutional Growth Option 0.25% 0.30%
Institutional Dividend Option – 0.30%
b. Management Fee as % of AAuM (planwise)
Regular Growth Option 0.22% 0.43%
Regular Dividend Option – 0.43%
Institutional Growth Option 0.22% 0.43%

67
Key Statistics for the year ended March 31, 2009 (Contd...)
HSBC FIXED HSBC FIXEDTERM SERIES 50 TERM SERIES 52
Current CurrentYear ended Year ended
March 31, 2009 March 31, 2009
1 Gross income = amount against (A) in the Revenue Account i.e. Income.
2 Net income = amount against (C) in the Revenue Account i.e. NET REALISED GAINS / (LOSSES)FOR THE YEAR / PERIOD
3 Portfolio Turnover = Lower of sales or purchase divided by the Average AuM for the year / period.
4 AAuM = Average daily net assets
Institutional Dividend Option – 0.43%
5. Net Income as a percentage of AAuM3 8.79% 8.37%
6. Portfolio turnover ratio4 – –
7. Total Dividend per unit distributedduring the year / period (planwise)
Individual / HUF
Regular Dividend Option – 0.5856
Institutional Dividend Option – 0.6161
Corporate
Regular Dividend Option – 0.5450
Institutional Dividend Option – 0.5734
8. Returns:
a. Last One Year
Scheme
Regular Growth Option NA NA
Regular Dividend Option NA NA
Institutional Growth Option NA NA
Institutional Dividend Option NA NA
Benchmark
CRISIL Short-Term Bond Fund Index NA NA
CRISIL Liquid Fund Index NA NA
b. Since Inception
Scheme
Regular Growth Option – –
Regular Dividend Option – –
Institutional Growth Option NA NA
Institutional Dividend Option – –
Benchmark
CRISIL Short-Term Bond Fund Index NA NA
CRISIL Liquid Fund Index 8.83% 7.80%

68
Key Statistics for the year ended March 31, 2009
HSBC FIXED HSBC FIXEDTERM SERIES 53 TERM SERIES 54
Current CurrentYear ended Year ended
March 31, 2009 March 31, 2009
1. NAV per unit (Rs.):
Open
Regular Growth Option – –
Regular Dividend Option – –
Institutional Growth Option – –
Institutional Dividend Option – –
High
Regular Growth Option 10.7199 10.7039
Regular Dividend Option 10.2686 10.3057
Institutional Growth Option 10.7560 10.7643
Institutional Dividend Option – 10.3236
Low
Regular Growth Option 10.0041 10.0043
Regular Dividend Option 9.9418 9.8969
Institutional Growth Option 10.0041 10.0043
Institutional Dividend Option – 9.9041
End
Regular Growth Option 10.7199 10.7039
Regular Dividend Option 10.1022 10.0525
Institutional Growth Option 10.7560 10.7643
Institutional Dividend Option – 10.0615
2. Closing Assets Under Management (Rs. in Lakhs)
End 13,862 17,472
Average (AAuM)1 17,842 20,003
3. Gross income as % of AAuM2 8.38% 9.34%
4. Expense Ratio:
a. Total Expense as % of AAuM (planwise)
Regular Growth Option 0.75% 0.95%
Regular Dividend Option 0.75% 0.95%
Institutional Growth Option 0.35% 0.25%
Institutional Dividend Option 0.35% 0.25%
b. Management Fee as % of AAuM (planwise)
Regular Growth Option 0.48% 0.63%
Regular Dividend Option 0.48% 0.63%
Institutional Growth Option 0.48% 0.63%
Institutional Dividend Option – 0.63%

69
Key Statistics for the year ended March 31, 2009 (Contd...)
HSBC FIXED HSBC FIXEDTERM SERIES 53 TERM SERIES 54
Current CurrentYear ended Year ended
March 31, 2009 March 31, 2009
1 Gross income = amount against (A) in the Revenue Account i.e. Income.
2 Net income = amount against (C) in the Revenue Account i.e. NET REALISED GAINS / (LOSSES)FOR THE YEAR / PERIOD
3 Portfolio Turnover = Lower of sales or purchase divided by the Average AuM for the year / period.
4 AAuM = Average daily net assets
5. Net Income as a percentage of AAuM3 7.87% 8.67%
6. Portfolio turnover ratio4 – –
7. Total Dividend per unit distributedduring the year / period (planwise)
Individual / HUF
Regular Dividend Option 0.5261 0.5564
Institutional Dividend Option – 0.4410
Corporate
Regular Dividend Option 0.4896 0.3857
Institutional Dividend Option – 0.5573
8. Returns:
a. Last One Year
Scheme
Regular Growth Option NA NA
Regular Dividend Option NA NA
Institutional Growth Option NA NA
Institutional Dividend Option NA NA
Benchmark
CRISIL Short-Term Bond Fund Index NA NA
CRISIL Liquid Fund Index NA NA
b. Since Inception
Scheme
Regular Growth Option 8.59% 8.80%
Regular Dividend Option 7.66% 7.77%
Institutional Growth Option 9.02% 9.55%
Institutional Dividend Option – 8.44%
Benchmark
CRISIL Short-Term Bond Fund Index NA NA
CRISIL Liquid Fund Index 7.41% 7.16%

70
Key Statistics for the year ended March 31, 2009
HSBC FIXED HSBC FIXEDTERM SERIES 56 TERM SERIES 57
Current CurrentYear ended Year ended
March 31, 2009 March 31, 2009
1. NAV per unit (Rs.):
Open
Regular Growth Option – –
Regular Dividend Option – –
Institutional Growth Option – –
Institutional Dividend Option – –
High
Regular Growth Option 10.6740 10.6105
Regular Dividend Option 10.4278 10.2478
Institutional Growth Option 10.7365 10.6590
Institutional Dividend Option 10.3770 –
Low
Regular Growth Option 9.9387 10.0030
Regular Dividend Option 9.8369 10.0000
Institutional Growth Option 9.9571 10.0030
Institutional Dividend Option 9.8462 –
End
Regular Growth Option 10.6740 10.6105
Regular Dividend Option 10.1279 10.0482
Institutional Growth Option 10.7365 10.6590
Institutional Dividend Option 10.1483 –
2. Closing Assets Under Management (Rs. in Lakhs)
End 12,140 5,901
Average (AAuM)1 12,382 5,740
3. Gross income as % of AAuM2 10.97% 10.75%
4. Expense Ratio:
a. Total Expense as % of AAuM (planwise)
Regular Growth Option 1.15% 1.05%
Regular Dividend Option 1.15% 1.05%
Institutional Growth Option 0.25% 0.30%
Institutional Dividend Option 0.25% 0.30%
b. Management Fee as % of AAuM (planwise)
Regular Growth Option 0.50% 0.42%
Regular Dividend Option 0.50% 0.42%
Institutional Growth Option 0.50% 0.42%
Institutional Dividend Option 0.50% 0.42%

71
Key Statistics for the year ended March 31, 2009 (Contd...)
HSBC FIXED HSBC FIXEDTERM SERIES 56 TERM SERIES 57
Current CurrentYear ended Year ended
March 31, 2009 March 31, 2009
1 Gross income = amount against (A) in the Revenue Account i.e. Income.
2 Net income = amount against (C) in the Revenue Account i.e. NET REALISED GAINS / (LOSSES)FOR THE YEAR / PERIOD
3 Portfolio Turnover = Lower of sales or purchase divided by the Average AuM for the year / period.
4 AAuM = Average daily net assets
5. Net Income as a percentage of AAuM3 10.43% 10.30%
6. Portfolio turnover ratio4 – –
7. Total Dividend per unit distributedduring the year / period (planwise)
Individual / HUF
Regular Dividend Option 0.4688 0.4824
Institutional Dividend Option 0.5011 –
Corporate
Regular Dividend Option 0.4363 0.4490
Institutional Dividend Option 0.4663 –
8. Returns:
a. Last One Year
Scheme
Regular Growth Option NA NA
Regular Dividend Option NA NA
Institutional Growth Option NA NA
Institutional Dividend Option NA NA
Benchmark
CRISIL Short-Term Bond Fund Index NA NA
CRISIL Liquid Fund Index NA NA
b. Since Inception
Scheme
Regular Growth Option 10.42% 10.22%
Regular Dividend Option 9.36% 9.04%
Institutional Growth Option 11.39% 11.03%
Institutional Dividend Option 10.24% –
Benchmark
CRISIL Short-Term Bond Fund Index NA NA
CRISIL Liquid Fund Index 5.94% 5.56%

72
Key Statistics for the year ended March 31, 2009
HSBC FIXED HSBC FIXEDTERM SERIES 59 TERM SERIES 61
Current CurrentYear ended Year ended
March 31, 2009 March 31, 2009
1. NAV per unit (Rs.):
Open
Regular Growth Option – –
Regular Dividend Option – –
Institutional Growth Option – –
Institutional Dividend Option – –
High
Regular Growth Option 10.7121 10.7000
Regular Dividend Option 10.3614 10.3447
Institutional Growth Option 10.7695 10.7506
Institutional Dividend Option 10.3808 10.3628
Low
Regular Growth Option 9.9089 9.9415
Regular Dividend Option 9.7780 9.8123
Institutional Growth Option 9.9289 9.9575
Institutional Dividend Option 9.7856 9.8194
End
Regular Growth Option 10.7121 10.7000
Regular Dividend Option 10.0644 10.0753
Institutional Growth Option 10.7695 10.7506
Institutional Dividend Option 10.0681 10.0842
2. Closing Assets Under Management (Rs. in Lakhs)
End 33,937 9,153
Average (AAuM)1 34,127 9,803
3. Gross income as % of AAuM2 11.07% 10.52%
4. Expense Ratio:
a. Total Expense as % of AAuM (planwise)
Regular Growth Option 1.00% 0.95%
Regular Dividend Option 1.00% 0.95%
Institutional Growth Option 0.25% 0.25%
Institutional Dividend Option 0.25% 0.25%
b. Management Fee as % of AAuM (planwise)
Regular Growth Option 0.35% 0.41%
Regular Dividend Option 0.35% 0.41%
Institutional Growth Option 0.35% 0.41%
Institutional Dividend Option 0.35% 0.41%

73
Key Statistics for the year ended March 31, 2009 (Contd...)
HSBC FIXED HSBC FIXEDTERM SERIES 59 TERM SERIES 61
Current CurrentYear ended Year ended
March 31, 2009 March 31, 2009
1 Gross income = amount against (A) in the Revenue Account i.e. Income.
2 Net income = amount against (C) in the Revenue Account i.e. NET REALISED GAINS / (LOSSES)FOR THE YEAR / PERIOD
3 Portfolio Turnover = Lower of sales or purchase divided by the Average AuM for the year / period.
4 AAuM = Average daily net assets
5. Net Income as a percentage of AAuM3 10.70% 10.08%
6. Portfolio turnover ratio4 – –
7. Total Dividend per unit distributedduring the year / period (planwise)
Individual / HUF
Regular Dividend Option 0.5535 0.5339
Institutional Dividend Option 0.5980 0.4451
Corporate
Regular Dividend Option 0.5151 0.4969
Institutional Dividend Option 0.4372 0.5289
8. Returns:
a. Last One Year
Scheme
Regular Growth Option NA NA
Regular Dividend Option NA NA
Institutional Growth Option NA NA
Institutional Dividend Option NA NA
Benchmark
CRISIL Short-Term Bond Fund Index NA NA
CRISIL Liquid Fund Index NA NA
b. Since Inception
Scheme
Regular Growth Option 10.04% 10.43%
Regular Dividend Option 8.88% 9.26%
Institutional Growth Option 10.84% 11.18%
Institutional Dividend Option 9.60% 9.93%
Benchmark
CRISIL Short-Term Bond Fund Index NA NA
CRISIL Liquid Fund Index 6.55% 6.19%

74
Key Statistics for the year ended March 31, 2009
HSBC FIXED HSBC FIXEDTERM SERIES 62 TERM SERIES 63
Current CurrentYear ended Year ended
March 31, 2009 March 31, 2009
1. NAV per unit (Rs.):
Open
Regular Growth Option – –
Regular Dividend Option – –
Institutional Growth Option – –
Institutional Dividend Option – –
High
Regular Growth Option 10.6388 10.5440
Regular Dividend Option 10.2961 10.3122
Institutional Growth Option 10.6604 10.5824
Institutional Dividend Option – –
Low
Regular Growth Option 10.0101 10.0000
Regular Dividend Option 10.0000 10.0000
Institutional Growth Option 10.0101 10.0000
Institutional Dividend Option – –
End
Regular Growth Option 10.6388 10.5440
Regular Dividend Option 10.0554 10.0888
Institutional Growth Option 10.6604 10.5824
Institutional Dividend Option – –
2. Closing Assets Under Management (Rs. in Lakhs)
End 44,216 9,503
Average (AAuM)1 42,828 9,451
3. Gross income as % of AAuM2 11.36% 9.57%
4. Expense Ratio:
a. Total Expense as % of AAuM (planwise)
Regular Growth Option 0.74% 0.85%
Regular Dividend Option 0.74% 0.85%
Institutional Growth Option 0.40% 0.20%
Institutional Dividend Option – 0.00
b. Management Fee as % of AAuM (planwise)
Regular Growth Option 0.24% 0.06%
Regular Dividend Option 0.24% 0.06%
Institutional Growth Option 0.24% 0.06%
Institutional Dividend Option 0.24% 0.06%

75
Key Statistics for the year ended March 31, 2009 (Contd...)
HSBC FIXED HSBC FIXEDTERM SERIES 62 TERM SERIES 63
Current CurrentYear ended Year ended
March 31, 2009 March 31, 2009
1 Gross income = amount against (A) in the Revenue Account i.e. Income.
2 Net income = amount against (C) in the Revenue Account i.e. NET REALISED GAINS / (LOSSES)FOR THE YEAR / PERIOD
3 Portfolio Turnover = Lower of sales or purchase divided by the Average AuM for the year / period.
4 AAuM = Average daily net assets
5. Net Income as a percentage of AAuM3 10.63% 9.18%
6. Portfolio turnover ratio4 – –
7. Total Dividend per unit distributedduring the year / period (planwise)
Individual / HUF
Regular Dividend Option 0.5000 0.3925
Institutional Dividend Option – –
Corporate
Regular Dividend Option 0.4653 0.3653
Institutional Dividend Option – –
8. Returns:
a. Last One Year
Scheme
Regular Growth Option NA NA
Regular Dividend Option NA NA
Institutional Growth Option NA NA
Institutional Dividend Option NA NA
Benchmark
CRISIL Short-Term Bond Fund Index NA NA
CRISIL Liquid Fund Index NA NA
b. Since Inception
Scheme
Regular Growth Option 10.74% 9.78%
Regular Dividend Option 9.51% 8.76%
Institutional Growth Option 11.11% 10.47%
Institutional Dividend Option – –
Benchmark
CRISIL Short-Term Bond Fund Index NA NA
CRISIL Liquid Fund Index 5.53% 5.13%

76
Key Statistics for the year ended March 31, 2009
HSBC FIXED TERM SERIES 66
Current Year endedMarch 31, 2009
1. NAV per unit (Rs.):
Open
Regular Growth Option –
Regular Dividend Option –
Institutional Growth Option –
Institutional Dividend Option –
High
Regular Growth Option 10.5506
Regular Dividend Option 10.3455
Institutional Growth Option 10.5506
Institutional Dividend Option 10.0166
Low
Regular Growth Option 10.0064
Regular Dividend Option 10.0064
Institutional Growth Option 10.0064
Institutional Dividend Option 10.0064
End
Regular Growth Option 10.5506
Regular Dividend Option 10.1051
Institutional Growth Option 10.5506
Institutional Dividend Option –
2. Closing Assets Under Management (Rs. in Lakhs)
End
Average (AAuM)1 6,497
3. Gross income as % of AAuM2 10.58%
4. Expense Ratio:
a. Total Expense as % of AAuM (planwise)
Regular Growth Option 1.02%
Regular Dividend Option 1.02%
Institutional Growth Option 1.02%
Institutional Dividend Option 1.02%
b. Management Fee as % of AAuM (planwise)
Regular Growth Option 0.16%
Regular Dividend Option 0.16%
Institutional Growth Option 0.16%
Institutional Dividend Option 0.16%

77
Key Statistics for the year ended March 31, 2009 (Contd...)
HSBC FIXED TERM SERIES 66
Current Year endedMarch 31, 2009
1 Gross income = amount against (A) in the Revenue Account i.e. Income.
2 Net income = amount against (C) in the Revenue Account i.e. NET REALISED GAINS / (LOSSES)FOR THE YEAR / PERIOD
3 Portfolio Turnover = Lower of sales or purchase divided by the Average AuM for the year / period.
4 AAuM = Average daily net assets
5. Net Income as a percentage of AAuM3 9.56%
6. Portfolio turnover ratio4 –
7. Total Dividend per unit distributed during the year / period (planwise)
Individual / HUF
Regular Dividend Option 0.3842
Institutional Dividend Option –
Corporate
Regular Dividend Option 0.3575
Institutional Dividend Option –
8. Returns:
a. Last One Year
Scheme
Regular Growth Option NA
Regular Dividend Option NA
Institutional Growth Option NA
Institutional Dividend Option NA
Benchmark
CRISIL Short-Term Bond Fund Index NA
CRISIL Liquid Fund Index NA
b. Since Inception
Scheme
Regular Growth Option 11.23%
Regular Dividend Option 10.09%
Institutional Growth Option 11.23%
Institutional Dividend Option –
Benchmark
CRISIL Short-Term Bond Fund Index 6.79%
CRISIL Liquid Fund Index NA

78
HSBC FIXED TERM SERIES1 Investments:-
1.1 It is confirmed that investments of the Scheme are registered in the name of the Trustees forthe benefit of the Schemes’ Unitholders.
1.2 Open Positions of derivatives amount are NIL as at March 31, 2009 and March 31, 2008.
1.3 Investments in Associates and Group Companies as of March 31, 2009 and March 31, 2008are NIL.
1.4 Open positions of Securities Borrowed and / or Lent by the Scheme as of years ended 2009and 2008 are NIL.
1.5 No NPAs as at March 31, 2009 and March 31, 2008.
1.6 Aggregate Unrealised Gain / Loss as at the end of the Financial year 2008 - 09 and percentageto net assets.
HSBC FIXED TERM SERIES 30
Security Amount Percentage to Amount Percentage toCategory (Rs.) Net Assets (Rs.) Net Assets
2009 2008
NCDs and Bonds Listed / Awaiting Listing
– Appreciation – – 8,792,569 0.83%
– Depreciation 6,587,393 0.76% – –
NCDs and Bonds Privately Placed
– Appreciation – – 5,154,255 0.49%
– Depreciation 10,079,072 1.16% – –
Asset Backed Securities
– Appreciation 745,872 0.09% 1,246,645 0.12%
– Depreciation – – – –
HSBC FIXED TERM SERIES 41
Security Amount Percentage to Amount Percentage toCategory (Rs.) Net Assets (Rs.) Net Assets
2009 2008
NCDs and Bonds Listed / Awaiting Listing
– Appreciation – – 330,750 0.06%
– Depreciation 21,345 0.01% – –
Asset Backed Securities
– Appreciation – – – –
– Depreciation – – 346,160 0.06%
Notes to Accounts - Annexure ITo the Abridged Balance Sheet and Revenue Account for the year ended March 31, 2009

79
HSBC FIXED TERM SERIES 42
Security Amount Percentage to Amount Percentage toCategory (Rs.) Net Assets (Rs.) Net Assets
2009 2008
NCDs and Bonds Listed / Awaiting Listing
– Appreciation – – – –
– Depreciation 27,979,231 0.41% 6,399,374 0.10%
NCDs and Bonds Privately Placed
– Appreciation – 0.00% – –
– Depreciation 23,787,608 0.35% 16,219,823 0.26%
Asset Backed Securities
– Appreciation – – 1,142,480 0.02%
– Depreciation 19,415,374 0.28% 7,588,573 0.12%
HSBC FIXED TERM SERIES 46
Security Amount Percentage to Amount Percentage toCategory (Rs.) Net Assets (Rs.) Net Assets
2009 2008
NCDs and Bonds Privately Placed
– Appreciation – – 139,867 0.01%
– Depreciation – – 19,226 0.00%
HSBC FIXED TERM SERIES 49
Security Amount Percentage to Amount Percentage toCategory (Rs.) Net Assets (Rs.) Net Assets
2009 2008
NCDs and Bonds Privately Placed
– Appreciation – – 125,881 0.00%
– Depreciation – – – –
HSBC FIXED TERM SERIES 50 HSBC FIXED TERM SERIES 52
Security Amount Percentage to Amount Percentage toCategory (Rs.) Net Assets (Rs.) Net Assets
2009 2009
NCDs and Bonds Listed / Awaiting Listing
– Appreciation – – – 0.00%
– Depreciation 2,310,102 0.05% 6,441,550 0.29%
NCDs and Bonds Privately Placed
– Appreciation – – – –
– Depreciation – – 3,985,867 0.18%
Asset Backed Securities
– Appreciation – – – –
– Depreciation 2,829,546 0.06% 8,299,194 0.38%
Notes to Accounts - Annexure I (Contd...)To the Abridged Balance Sheet and Revenue Account for the year ended March 31, 2009

80
HSBC FIXED TERM SERIES 53 HSBC FIXED TERM SERIES 54
Security Amount Percentage to Amount Percentage toCategory (Rs.) Net Assets (Rs.) Net Assets
2009 2009
NCDs and Bonds Listed / Awaiting Listing
– Appreciation – – – –
– Depreciation 1,893,577 0.14% 4,406,230 0.25%
NCDs and Bonds Privately Placed
– Appreciation – – – –
– Depreciation – – 3,258,038 0.19%
Asset Backed Securities
– Appreciation – – – –
– Depreciation – – – –
HSBC FIXED TERM SERIES 56 HSBC FIXED TERM SERIES 57
Security Amount Percentage to Amount Percentage toCategory (Rs.) Net Assets (Rs.) Net Assets
2009 2009
NCDs and Bonds Listed / Awaiting Listing
– Appreciation – – – –
– Depreciation 2,845,709 0.23% – –
NCDs and Bonds Privately Placed
– Appreciation – – – –
– Depreciation 1,290,554 0.11% – –
Asset Backed Securities
– Appreciation 4,136,569 0.34% – –
– Depreciation 1,281,951 0.11% – –
HSBC FIXED TERM SERIES 59 HSBC FIXED TERM SERIES 61
Security Amount Percentage to Amount Percentage toCategory (Rs.) Net Assets (Rs.) Net Assets
2009 2009
NCDs and Bonds Listed / Awaiting Listing
– Appreciation 1,623,132 0.05% 969,499 0.11%
– Depreciation 10,645,173 0.31% 1,839,250 0.20%
NCDs and Bonds Privately Placed
– Appreciation – 0.00% – –
– Depreciation 4,309,763 0.13% 1,457,317 0.16%
Asset Backed Securities
– Appreciation 1,534,851 0.05% 1,744,148 0.19%
– Depreciation 5,526,314 0.16% – –
Notes to Accounts - Annexure I (Contd...)To the Abridged Balance Sheet and Revenue Account for the year ended March 31, 2009

81
HSBC FIXED TERM SERIES 62 HSBC FIXED TERM SERIES 63
Security Amount Percentage to Amount Percentage toCategory (Rs.) Net Assets (Rs.) Net Assets
2009 2009
NCDs and Bonds Listed / Awaiting Listing
– Appreciation – – – –
– Depreciation 4,318,783 0.10% – –
NCDs and Bonds Privately Placed
– Appreciation – – – –
– Depreciation 2,798,866 0.06% – –
Asset Backed Securities
– Appreciation – – 3,274,784 0.34%
– Depreciation – – – –
HSBC FIXED TERM SERIES 66
Security Amount Percentage toCategory (Rs.) Net Assets
2009
NCDs and Bonds Listed / Awaiting Listing
– Appreciation 775,539 0.12%
– Depreciation – 0.00%
NCDs and Bonds Privately Placed
– Appreciation – 0.00%
– Depreciation – 0.00%
Asset Backed Securities
– Appreciation 3,261,080 0.50%
– Depreciation – 0.00%
Notes to Accounts - Annexure I (Contd...)To the Abridged Balance Sheet and Revenue Account for the year ended March 31, 2009

82
1.7 Aggregate Value of Purchase and Sale of Investments
The aggregate value of investment securities purchased and sold (including matured) duringthe period (excluding accretion of discount) are as follows:
2009
Accretion of Discount Aggregate Purchase Aggregate Sale
Name of the Rupees Rupees Percentage of Rupees Percentage ofScheme Average Daily Average Daily
Net Assets Net Assets
Fixed Term Series 30 101,170,058 11,907,733 1.24% 243,259,449 25.26%
Fixed Term Series 41 13,611,763 678,603,855 137.44% 938,785,330 190.13%
Fixed Term Series 42 351,573,882 1,031,733,156 15.83% 858,457,108 13.17%
Fixed Term Series 44 106,961,146 1,368,975,111 117.89% 1,895,260,845 163.21%
Fixed Term Series 45 22,378,038 215,442,237 86.13% 419,218,541 167.60%
Fixed Term Series 46 114,209,187 5,525,056,026 215.30% 7,726,807,558 301.09%
Fixed Term Series 49 273,391,583 1,309,350,956 37.88% 4,367,613,757 126.36%
Fixed Term Series 50* 300,245,607 4,451,334,896 105.22% 27,892,660 0.66%
Fixed Term Series 52* 148,256,976 4,819,409,655 214.87% 2,799,719,317 124.82%
Fixed Term Series 53* 13,530,839 3,060,723,206 204.10% 1,779,689,319 118.68%
Fixed Term Series 54* 613,045 2,979,450,294 185.64% 1,329,172,678 82.82%
Fixed Term Series 56* 46,373,677 3,266,348,832 406.41% 2,165,699,243 269.46%
Fixed Term Series 57* 36,407,297 706,660,939 202.38% 155,691,522 44.59%
Fixed Term Series 59* 83,281,114 11,650,148,373 479.29% 8,499,917,134 349.69%
Fixed Term Series 61* 19,313,547 2,378,804,484 360.27% 1,552,025,100 235.06%
Fixed Term Series 62* 246,777,450 10,102,035,398 394.88% 6,006,692,554 234.80%
Fixed Term Series 63* 55,508,759 2,973,025,958 563.02% 2,090,502,207 395.89%
Fixed Term Series 66* 22,172,816 1,552,743,929 484.59% 951,822,774 297.05%
2008
Accretion of Discount Aggregate Purchase Aggregate Sale
Name of the Rupees Rupees Percentage of Rupees Percentage ofScheme Average Daily Average Daily
Net Assets Net Assets
Fixed Term Series 30* 87,220,006 1,017,758,560 110.08% 81,476,857 8.81%
Fixed Term Series 41* 8,643,798 1,146,723,160 688.16% 600,311,434 360.25%
Fixed Term Series 42* 50,324,757 7,692,123,218 817.49% 1,449,988,869 154.10%
Fixed Term Series 44* 5,652,484 1,323,905,339 1910.90% – –
Fixed Term Series 45* 510,918 182,432,450 1818.03% – –
Fixed Term Series 46* 1,258,722 2,953,165,948 10520.00% 499,999,657 1781.14%
Fixed Term Series 47* 1,023,512 1,840,262,805 6041.62% – –
Fixed Term Series 49* 2,371,482 3,282,298,706 9092.72% – –
* Annualized
Notes to Accounts - Annexure I (Contd...)To the Abridged Balance Sheet and Revenue Account for the year ended March 31, 2009

83
1.8. Non-Traded securities in the portfolio:
Aggregate Value of Equity, Debt & Money Market Instruments and percentage to net assets isas under
HSBC FIXED TERM SERIES 30
Security No. of Fair Value % to Net No. of Fair Value % to NetCategory Shares (Rs.) Asset Shares (Rs.) Asset
2009 2008
Debt Instruments 806 870,636,238 99.98% 1,091 1,040,976,126 98.85%
Total 806 870,636,238 99.98% 1,091 1,040,976,126 98.85%
HSBC FIXED TERM SERIES 41
Security No. of Fair Value % to Net No. of Fair Value % to NetCategory Shares (Rs.) Asset Shares (Rs.) Asset
2009 2008
Debt Instruments 486 200,696,664 55.62% 297 390,631,389 66.39%
Money market Instruments 1,050 104,886,212 29.07% 360 164,462,977 27.95%
Total 1,536 305,582,876 84.69% 657 555,094,366 94.34%
HSBC FIXED TERM SERIES 42
Security No. of Fair Value % to Net No. of Fair Value % to NetCategory Shares (Rs.) Asset Shares (Rs.) Asset
2009 2008
Debt Instruments 8,474 5,726,293,660 83.58% 8,551 6,263,385,458 99.30%
Money market Instruments 10,270 1,019,787,020 14.89% – – –
Total 18,744.00 6,746,080,680 98.47% 8,551 6,263,385,458 99.30%
HSBC FIXED TERM SERIES 44
Security No. of Fair Value % to Net No. of Fair Value % to NetCategory Shares (Rs.) Asset Shares (Rs.) Asset
2009 2008
Money market Instruments 9,120 910,418,282 91.49% 14,500 1,329,557,250 99.43%
Total 9,120 910,418,282 91.49% 14,500 1,329,557,250 99.43%
HSBC FIXED TERM SERIES 45
Security No. of Fair Value % to Net No. of Fair Value % to NetCategory Shares (Rs.) Asset Shares (Rs.) Asset
2009 2008
Debt Instruments – – – – – –
Money market Instruments – – – 2,000 182,942,973 64.72%
Total – – – 2,000 182,942,973 64.72%
Notes to Accounts - Annexure I (Contd...)To the Abridged Balance Sheet and Revenue Account for the year ended March 31, 2009

84
HSBC FIXED TERM SERIES 46
Security No. of Fair Value % to Net No. of Fair Value % to NetCategory Shares (Rs.) Asset Shares (Rs.) Asset
2009 2008
Debt Instruments – – – 3,500 800,120,642 31.13%
Money market Instruments 3,520 351,950,777 14.15% 18,000 1,654,424,572 64.37%
Total 3,520 351,950,777 14.15% 21,500 2,454,545,214 95.50%
HSBC FIXED TERM SERIES 49
Security No. of Fair Value % to Net No. of Fair Value % to NetCategory Shares (Rs.) Asset Shares (Rs.) Asset
2009 2008
Debt Instruments – – 0.00% 450 450,125,880 13.62%
Money market Instruments 5,000 499,917,890 13.83% 26,600 2,834,669,888 85.77%
Total 5,000 499,917,890 13.83% 27,050 3,284,795,768 99.38%
HSBC FIXED TERM SERIES 50 HSBC FIXED TERM SERIES 52
Security No. of Fair Value % to Net No. of Fair Value % to NetCategory Shares (Rs.) Asset Shares (Rs.) Asset
2009 2009
Equities – – – – – –
Debt Instruments 982 1,412,092,318 29.54% 3,074 2,120,473,920 95.89%
Money market Instruments 29,710 3,306,432,297 69.17% – – –
Total 30,692 4,718,524,615 98.71% 3,074 2,120,473,920 95.89%
HSBC FIXED TERM SERIES 53 HSBC FIXED TERM SERIES 54
Security No. of Fair Value % to Net No. of Fair Value % to NetCategory Shares (Rs.) Asset Shares (Rs.) Asset
2009 2009
Equities – – – – – –
Debt Instruments 696 1,259,240,408 90.84% 4,689 1,625,891,784 93.05%
Money market Instruments 60 5,992,705 0.43% – – –
Total 756 1,265,233,113 91.27% 4,689 1,625,891,784 93.05%
HSBC FIXED TERM SERIES 56 HSBC FIXED TERM SERIES 57
Security No. of Fair Value % to Net No. of Fair Value % to NetCategory Shares (Rs.) Asset Shares (Rs.) Asset
2009 2009
Equities – – – – – –
Debt Instruments 659 1,110,695,623 91.49% – – –
Money market Instruments 300 28,725,383 2.37% 6,140 587,472,629 99.56%
Total 959 1,139,421,006 93.86% 6,140 587,472,629 99.56%
Notes to Accounts - Annexure I (Contd...)To the Abridged Balance Sheet and Revenue Account for the year ended March 31, 2009

85
HSBC FIXED TERM SERIES 59 HSBC FIXED TERM SERIES 61
Security No. of Fair Value % to Net No. of Fair Value % to NetCategory Shares (Rs.) Asset Shares (Rs.) Asset
2009 2009
Equities – – – – – –
Debt Instruments 238,087 3,206,563,894 94.49% – – –
Money market Instruments – – 0.00% 114,510 839,761,005 91.75%
Total 238,087 3,206,563,894 94.49% 114,510 839,761,005 91.75%
HSBC FIXED TERM SERIES 62 HSBC FIXED TERM SERIES 63
Security No. of Fair Value % to Net No. of Fair Value % to NetCategory Shares (Rs.) Asset Shares (Rs.) Asset
2009 2009
Equities – – – – – –
Debt Instruments 1,050 1,078,748,105 24.40% 219 406,117,183 42.73%
Money market Instruments 24,850 3,256,882,789 73.66% 3,748 527,723,555 55.53%
Total 25,900 4,335,630,894 98.06% 3,967 933,840,738 98.26%
HSBC FIXED TERM SERIES 66
Security Category No. of Shares Fair Value (Rs.) % to Net Asset
2009
Equities – – –
Debt Instruments 212 313,435,704 47.64%
Money market Instruments 2,347 314,886,920 47.86%
Total 2,559 628,322,624 95.50%
2 During the year, The Hongkong and Shanghai Banking Corporation Limited, an associate entityof HSBC Asset Management (India) Private Limited was paid brokerage for procuring unitsubscriptions for the Schemes as follows:
Name of the Scheme Brokerage for Procuring Unit Subscriptions(Rupees)
2009 2008
Fixed Term Series 30 54,938 692,848
Fixed Term Series 62 87,518 –
3 Large Holdings in the Scheme (i.e. in excess of 25% of the net assets).
Name of the Scheme No. of holders % Holding No. of holders % Holding
2009 2008
HSBC Fixed Term Series 41 1 37.38 0 0
HSBC Fixed Term Series 46 1 27.21 0 0
HSBC Fixed Term Series 59 1 25.39 0 0
Notes to Accounts - Annexure I (Contd...)To the Abridged Balance Sheet and Revenue Account for the year ended March 31, 2009

86
4 Unit Capital movement during the years ended March 31, 2009 and March 31, 2008:
HSBC FIXED TERM SERIES 30
2008-2009
Description Opening Units Subscription Redemption Closing Units Face Value
Regular Growth 66,659,279.315 513,000.000 14,015,348.251 53,156,931.064 531,569,310.64
Regular Dividend 17,128,539.151 1,013,052.321 3,789,025.406 14,352,566.066 143,525,660.66
Institutional Growth 11,400,000.000 – 1,975,762.070 9,424,237.930 94,242,379.30
Institutional Dividend 2,000,000.000 – 2,000,000.000 – –
2007-2008
Description Opening Units Subscription Redemption Closing Units Face Value
Regular Growth – 71,305,871.725 4,646,592.410 66,659,279.315 666,592,793.15
Regular Dividend – 18,471,973.607 1,343,434.456 17,128,539.151 171,285,391.51
Institutional Growth – 12,400,000.000 1,000,000.000 11,400,000.000 114,000,000.00
Institutional Dividend – 2,000,000.000 – 2,000,000.000 20,000,000.00
HSBC FIXED TERM SERIES 41
2008-2009
Description Opening Units Subscription Redemption Closing Units Face Value
Regular Growth 10,781,890.753 18,500.000 3,006,864.125 7,793,526.628 77,935,266.28
Regular Dividend 1,401,500.000 121,483.668 100,000.000 1,422,983.668 14,229,836.68
Institutional Growth 44,163,565.052 1,005,000.000 23,062,445.409 22,106,119.643 221,061,196.43
Institutional Dividend 1,000,000.000 93,826.354 – 1,093,826.354 10,938,263.54
2007-2008
Description Opening Units Subscription Redemption Closing Units Face Value
Regular Growth – 10,781,890.753 – 10,781,890.753 107,818,907.53
Regular Dividend – 1,401,500.000 – 1,401,500.000 14,015,000.00
Institutional Growth – 44,163,565.052 – 44,163,565.052 441,635,650.52
Institutional Dividend – 1,000,000.000 – 1,000,000.000 10,000,000.00
HSBC FIXED TERM SERIES 42
2008-2009
Description Opening Units Subscription Redemption Closing Units Face Value
Regular Growth 11,983,530.000 – – 11,983,530.000 119,835,300.00
Regular Dividend –
Institutional Growth 613,005,370.600 – – 613,005,370.600 6,130,053,706.00
Institutional Dividend – – – – –
2007-2008
Description Opening Units Subscription Redemption Closing Units Face Value
Regular Growth – 11,983,530.000 – 11,983,530.000 119,835,300.00
Regular Dividend – – – – –
Institutional Growth – 613,005,370.600 – 613,005,370.600 6,130,053,706.00
Institutional Dividend – – – – –
Notes to Accounts - Annexure I (Contd...)To the Abridged Balance Sheet and Revenue Account for the year ended March 31, 2009

87
HSBC FIXED TERM SERIES 44
2008-2009
Description Opening Units Subscription Redemption Closing Units Face Value
Regular Growth 23,354,214.556 – 3,184,400.000 20,169,814.556 201,698,145.56
Regular Dividend 500,000.000 45,223.130 5,028.149 540,194.981 5,401,949.81
Institutional Growth 109,246,680.609 2,000,000.000 41,405,850.326 69,840,830.283 698,408,302.83
Institutional Dividend – – – – –
2007-2008
Description Opening Units Subscription Redemption Closing Units Face Value
Regular Growth – 23,354,214.556 – 23,354,214.556 233,542,145.56
Regular Dividend – 500,000.000 – 500,000.000 5,000,000.00
Institutional Growth – 109,246,680.609 – 109,246,680.609 1,092,466,806.09
Institutional Dividend – – – – –
HSBC FIXED TERM SERIES 45
2008-2009
Description Opening Units Subscription Redemption Closing Units Face Value
Regular Growth 5,880,176.978 – 809,101.889 5,071,075.089 50,710,750.89
Regular Dividend 265,000.000 18,752.905 – 283,752.905 2,837,529.05
Institutional Growth 22,039,710.249 – 9,001,966.584 13,037,743.665 130,377,436.65
Institutional Dividend – – – – –
2007-2008
Description Opening Units Subscription Redemption Closing Units Face Value
Regular Growth – 5,880,176.978 – 5,880,176.978 58,801,769.78
Regular Dividend – 265,000.000 – 265,000.000 2,650,000.00
Institutional Growth – 22,039,710.249 – 22,039,710.249 220,397,102.49
Institutional Dividend – – – – –
HSBC FIXED TERM SERIES 46
2008-2009
Description Opening Units Subscription Redemption Closing Units Face Value
Regular Growth 11,640,684.365 – 3,383,015.439 8,257,668.926 82,576,689.26
Regular Dividend 744,990.000 53,983.690 – 798,973.690 7,989,736.90
Institutional Growth 243,369,032.680 6,054,676.489 31,505,680.230 217,918,028.939 2,179,180,289.39
Institutional Dividend 1,000,000.000 70,711.061 – 1,070,711.061 10,707,110.61
2007-2008
Description Opening Units Subscription Redemption Closing Units Face Value
Regular Growth – 11,640,684.365 – 11,640,684.365 116,406,843.65
Regular Dividend – 744,990.000 – 744,990.000 7,449,900.00
Institutional Growth – 243,369,032.680 – 243,369,032.680 2,433,690,326.80
Institutional Dividend – 1,000,000.000 – 1,000,000.000 10,000,000.00
Notes to Accounts - Annexure I (Contd...)To the Abridged Balance Sheet and Revenue Account for the year ended March 31, 2009

88
HSBC FIXED TERM SERIES 49
2008-2009
Description Opening Units Subscription Redemption Closing Units Face Value
Regular Growth 18,961,210.400 70,000.000 100,000.000 18,931,210.400 189,312,104.00
Regular Dividend 50,000.000 – – 50,000.000 500,000.00
Institutional Growth 311,172,714.100 – – 311,172,714.100 3,111,727,141.00
Institutional Dividend – – – – –
2007-2008
Description Opening Units Subscription Redemption Closing Units Face Value
Regular Growth – 18,961,210.400 – 18,961,210.400 189,612,104.00
Regular Dividend – 50,000.000 – 50,000.000 500,000.00
Institutional Growth – 311,172,714.100 – 311,172,714.100 3,111,727,141.00
Institutional Dividend – – – – –
HSBC FIXED TERM SERIES 50
2008-2009
Description Opening Units Subscription Redemption Closing Units Face Value
Regular Growth – 21,018,994.800 – 21,018,994.800 210,189,948.00
Regular Dividend – – – – –
Institutional Growth – 420,229,151.872 – 420,229,151.872 4,202,291,518.72
Institutional Dividend – – – – –
HSBC FIXED TERM SERIES 52
2008-2009
Description Opening Units Subscription Redemption Closing Units Face Value
Regular Growth – 106,856,911.453 23,948,100.814 82,908,810.639 829,088,106.39
Regular Dividend – 3,511,594.780 1,100,374.164 2,411,220.616 24,112,206.16
Institutional Growth – 165,486,501.944 47,955,279.900 117,531,222.044 1,175,312,220.44
Institutional Dividend – 4,126,213.169 1,427,543.195 2,698,669.974 26,986,699.74
HSBC FIXED TERM SERIES 53
2008-2009
Description Opening Units Subscription Redemption Closing Units Face Value
Regular Growth – 70,338,132.732 15,973,413.236 54,364,719.496 543,647,194.96
Regular Dividend – 7,982,436.254 504,178.393 7,478,257.861 74,782,578.61
Institutional Growth – 141,158,809.866 73,485,552.302 67,673,257.564 676,732,575.64
Institutional Dividend – – – – –
HSBC FIXED TERM SERIES 54
2008-2009
Description Opening Units Subscription Redemption Closing Units Face Value
Regular Growth – 118,614,077.412 21,301,802.404 97,312,275.008 973,122,750.08
Regular Dividend – 8,292,229.051 1,204,289.383 7,087,939.668 70,879,396.68
Institutional Growth – 85,778,132.620 43,063,606.738 42,714,525.882 427,145,258.82
Institutional Dividend – 17,350,908.374 – 17,350,908.374 173,509,083.74
Notes to Accounts - Annexure I (Contd...)To the Abridged Balance Sheet and Revenue Account for the year ended March 31, 2009

89
HSBC FIXED TERM SERIES 56
2008-2009
Description Opening Units Subscription Redemption Closing Units Face Value
Regular Growth – 38,157,995.909 7,717,261.460 30,440,734.449 304,407,344.49
Regular Dividend – 4,463,719.745 141,019.492 4,322,700.253 43,227,002.53
Institutional Growth – 81,405,612.351 17,950,000.000 63,455,612.351 634,556,123.51
Institutional Dividend – 22,259,516.169 6,098,288.167 16,161,228.002 161,612,280.02
HSBC FIXED TERM SERIES 57
2008-2009
Description Opening Units Subscription Redemption Closing Units Face Value
Regular Growth – 10,307,246.746 420,095.215 9,887,151.531 98,871,515.31
Regular Dividend – 1,399,556.600 150,740.740 1,248,815.860 12,488,158.60
Institutional Growth – 44,337,614.974 – 44,337,614.974 443,376,149.74
Institutional Dividend – – – – –
HSBC FIXED TERM SERIES 59
2008-2009
Description Opening Units Subscription Redemption Closing Units Face Value
Regular Growth – 57,936,835.528 10,160,815.394 47,776,020.134 477,760,201.34
Regular Dividend – 4,433,144.178 569,432.505 3,863,711.673 38,637,116.73
Institutional Growth – 281,656,725.736 25,605,199.701 256,051,526.035 2,560,515,260.35
Institutional Dividend – 8,486,907.255 – 8,486,907.255 84,869,072.55
HSBC FIXED TERM SERIES 61
2008-2009
Description Opening Units Subscription Redemption Closing Units Face Value
Regular Growth – 24,352,358.802 2,944,239.211 21,408,119.591 214,081,195.91
Regular Dividend – 3,340,123.823 151,730.090 3,188,393.733 31,883,937.33
Institutional Growth – 85,351,112.810 25,500,000.000 59,851,112.810 598,511,128.10
Institutional Dividend – 1,053,681.411 – 1,053,681.411 10,536,814.11
HSBC FIXED TERM SERIES 62
2008-2009
Description Opening Units Subscription Redemption Closing Units Face Value
Regular Growth – 403,112,100.032 50,000.000 403,062,100.032 4,030,621,000.32
Regular Dividend – 967,758.678 409,663.747 558,094.931 5,580,949.31
Institutional Growth – 13,010,000.000 1,010,000.000 12,000,000.000 120,000,000.00
Institutional Dividend – – – – –
Notes to Accounts - Annexure I (Contd...)To the Abridged Balance Sheet and Revenue Account for the year ended March 31, 2009

90
HSBC FIXED TERM SERIES 63
2008-2009
Description Opening Units Subscription Redemption Closing Units Face Value
Regular Growth – 27,094,676.541 2,087,435.146 25,007,241.395 250,072,413.95
Regular Dividend – 1,462,323.807 370,304.811 1,092,018.996 10,920,189.96
Institutional Growth – 72,845,554.072 9,000,000.000 63,845,554.072 638,455,540.72
Institutional Dividend – – – – –
HSBC FIXED TERM SERIES 66
2008-2009
Description Opening Units Subscription Redemption Closing Units Face Value
Regular Growth – 43,547,532.076 2,644,712.835 40,902,819.241 409,028,192.41
Regular Dividend – 8,263,358.455 2,720,470.299 5,542,888.156 55,428,881.56
Institutional Growth – 16,150,000.000 – 16,150,000.000 161,500,000.00
Institutional Dividend – 1,000,000.000 1,000,000.000 – –
Notes to Accounts - Annexure I (Contd...)To the Abridged Balance Sheet and Revenue Account for the year ended March 31, 2009
5 Previous year’s figures have been re-grouped / re-arranged where appropriate.
6 No contingent liabilities for the years ended March 31, 2009 and March 31, 2008.
7 Expenses other than Management Fees are Inclusive of Service Tax where applicable.
8 The Annual Accounts of the Schemes prepared in accordance with the accounting policies andstandards specified in the Ninth Schedule of The Securities and Exchange Board of India (MutualFunds) Regulations, 1996 has been approved by the Board of Directors of HSBC Asset Management(India) Private Limited and The Board of Trustees of HSBC Mutual Fund at their meeting held onJuly 22, 2009. The audit report attached herewith refers to the said annual accounts. The aforesaidabridged accounts are an extract of the Annual Accounts and are prepared in accordance withSEBI Circular No. IMD/Cir 8/132968/2008 dated July 24, 2008.

91
DISCLAIMERSThe content of this report has been prepared by HSBC Asset Management (India) Private Limited(HSBC) for information purposes only and should not be construed as an offer or solicitation of anoffer for purchase of any of the funds of HSBC Mutual Fund. The information is for general informationonly and does not have regard to specific investment objectives, financial situation and the particularneeds of any specific person who may receive this information. Investments in mutual funds inherentlyinvolve risks and investors should read the relevant documents / information for details and riskfactors and consult their legal, tax and financial advisors before investing. Investors should understandthat statements made herein regarding future prospects may not be realised. Neither this documentnor the units of HSBC Mutual Fund have been registered in any jurisdiction. The distribution of thisdocument in certain jurisdictions may be restricted or totally prohibited and accordingly, personswho come into possession of this document are required to inform themselves about, and to observe,any such restrictions.
Investors may obtain Statement of Additional Information, Combined Scheme Information Documentand Common Key Information Memorandums along with application forms from the office of HSBCMutual Fund, 314, D. N. Road, Fort, Mumbai 400 001. Tel: 022-6666 8819.
Statutory Details:HSBC Mutual Fund has been set up as a trust by HSBC Securities and Capital Markets (India) PrivateLimited (liability restricted to the corpus of Rs. 1 lakh). The Sponsor/associates of the Sponsor/AssetManagement Company (AMC) are not responsible or liable for any loss or shortfall resulting from theoperation of the Schemes. The Trustees of HSBC Mutual Fund have appointed HSBC Asset Management(India) Private Limited as the Investment Manager.
Risk Factors:All investments in mutual funds and securities are subject to market risks and the Net Asset Value(NAV) of the Scheme(s) may go up or down depending on the factors and forces affecting the securitiesmarkets. There can be no assurance that the objectives of the Scheme(s) will be achieved. Pastperformance of the Sponsor, AMC, Mutual Fund or any associates of the Sponsor/AMC does notindicate the future performance of the Scheme(s) of the Mutual Fund. HSBC Fixed Term Series (HFTS)is the name of the Scheme and does not in any manner indicate the quality of the Scheme or itsfuture prospects or returns.
Terms of Issue:Units of the Scheme(s) are being offered at NAV based prices, subject to the prevailing loads. TheAMC calculates and publishes NAVs and offers for sale, redemption and switch outs, units of theScheme(s) on all Business Days, at the Applicable NAV for all Schemes (at least once a week, i.e.,every Wednesday and daily during the period of redemption in case of HSCF). HUOF, HSCF & HFTSwill not be open for ongoing subscriptions/ switch ins. HUOF & HSCF would be available for sale onan ongoing basis (after a period of 3 years from the date of allotment). Conversion of HUOF & HSCFto an open-ended scheme will be done only after the balance unamortized amount has been fullyrecovered from the Scheme. Units can be redeemed/switched out on every Business Day at NAVbased prices, subject to prevailing exit loads. In case of HSCF, units can be redeemed / switched outon a monthly basis on the stipulated date i.e. last 3 business days of every month at NAV basedprices, subject to provisions of exit load, if any and recovery of balance proportionate unamortizedNFO expenses.
Load Structure (includes SIP/STP):For HFTS 30, 41, 42, 44, 45, 46, 49, 50, 52, 53, 54, 56, 57, 59, 61, 62 & 63 :
Entry Load - Nil. Exit Load - 2% if exited before maturity. No Exit Load on redemption/ switch outof Units on the maturity date. The entry/ exit load set forth above is subject to change at the discretionof the AMC and such changes shall be implemented prospectively.
For HFTS 66 :
Entry Load - Nil. Exit Load - 3% if exited before maturity. No Exit Load on redemption/ switch outof Units on the maturity date. The entry/ exit load set forth above is subject to change at the discretionof the AMC and such changes shall be implemented prospectively.

92
Consult the nearest investor service centre for details.
Mutual Fund investments are subject to market risks. Please read the Statement of AdditionalInformation and Scheme Information Document carefully before investing.
Value Research Online DisclaimerValue Research Fund Ratings: Value Research Fund Ratings are a composite measure of historical risk-adjusted returns. In the case of equity funds this rating is based on the average monthly returns forthe last 3-year and 5-year period. These ratings do not take into account any entry or exit load.
Value Research Fund Ratings are subject to change every month. Current Fund Ratings are as onMarch 31, 2009. 142 open-ended Equity: Diversified Funds were rated. The Rating is based on primarydata provided by respective funds; Value Research does not guarantee the accuracy. Ranking Entity:Value Research Online.
ICRA Online Ranking MethodologyHSBC Monthly Income - Savings Plan has been ranked as a Five Star Fund in the category of 'OpenEnded Marginal Equity' schemes for its 3 year performance till December 31, 2008.
The rank is an outcome of an objective and comparative analysis against various parameters, including:risk adjusted return, fund size, company concentration, portfolio turnover and liquidity. The rankingmethodology did not take into account entry and exit loads imposed by the Fund. There were 27schemes considered in 'Open Ended Marginal Equity' category for the ranking exercise. The rank isneither a certificate of statutory compliance nor any guarantee on the future performance of HSBCMonthly Income - Savings Plan. Ranking Source & Publisher: ICRA Online Limited.
CRISIL Ranking MethodologyThe selection for the awards is based on the CRISIL FundServices' Composite Performance Ranking(CRISIL~CPR) methodology.
The CRISIL Composite Performance Ranking (CRISIL~CPR) is a quarterly ranking of mutual fund schemesbased on two year performance (excepting for the liquid and short term debt categories where a oneyear performance horizon is considered). The methodology is based on global best practices,customized to account for Indian market nuances. Over time, the rankings have become the industrystandard with good acceptance among Investors, Fund Intermediaries, Asset Management Companies,etc. The performance criteria covers not only risk adjusted returns, which are historical, but also theportfolio constitution to make the analysis forward looking.
CRISIL DisclaimerThe overall ranking is assigned to the scheme based on its weighted average score on a range ofparameters: Superior Return Score, Concentration, Liquidity, Asset Quality - Measures the creditquality of the portfolio, Average Maturity and Asset Size. HSBC MIP - Savings was the only schemethat won the CNBC TV18 - CRISIL Mutual Fund of the Year Award in the Category - Monthly IncomePlans - Aggressive. In total 13 schemes were eligible for the award universe. Schemes present in allfour quarterly CRISIL CPRs were considered for the award. The award is based on consistency of thescheme's performance in the four quarterly CRISIL CPR rankings released during the calendar year2008. The individual CRISIL CPR parameter scores averaged for the four quarters were further multipliedby the parameter weights as per the CRISIL CPR methodology to arrive at the final scores. A detailedmethodology of the CRISIL CPR is available at www.crisil.com. Past performance is no guarantee offuture results. Rankings and Award Source: CRISIL Fund Services, CRISIL Ltd. HSBC Monthly Income -Savings Plan has been ranked as a Five Star Fund in the category of 'Open Ended Marginal Equity'schemes for its 3 year performance till December 31, 2008. The rank is an outcome of an objectiveand comparative analysis against various parameters, including: risk adjusted return, fund size,company concentration, portfolio turnover and liquidity. The ranking methodology did not take intoaccount entry and exit loads imposed by the Fund. There were 27 schemes considered in 'OpenEnded Marginal Equity' category for the ranking exercise. The rank is neither a certificate of statutorycompliance nor any guarantee on the future performance of HSBC Monthly Income - Savings Plan.Ranking Source & Publisher: ICRA Online Limited.

If undelivered please return to:
Computer Age Management Services (P) Ltd.“Rayala Towers”, 2nd Floor, 158, Anna Salai, CHENNAI - 600 002Unit : HSBC Mutual Fund
HSBC MUTUAL FUND INVESTOR SERVICE CENTRES
City Telephone No.
Ahmedabad 98983 77319
Bengaluru 080 - 4118 6519
Chandigarh 0172 - 500 8119
Chennai 044 - 4200 8719
Coimbatore 98944 77319
Hyderabad 040 - 6667 4719
Indore 98934 77319
Kochi 98954 77319
Kolkata 033 - 2213 9919
Lucknow 99367 97319
Mumbai 022 - 6666 8819
New Delhi 011 - 4149 0719
Pune 020 - 2600 1119
Vadodara 98983 77319
HSBC Asset Management (India) Private LimitedRegistered Office :314, D. N. Road, Fort, Mumbai 400 001Tel. : 022-6666 8819Fax : 022-4002 9600Email : [email protected] : www.assetmanagement.hsbc.com/in.
sms INVEST TO 56767
Book-Post