Embed Size (px)
Citation preview
TSF: Trajectory-based Statistical Forwarding for Infrastructure-to-Vehicle Data Delivery
in Vehicular Networks
Jaehoon Jeong, Shuo Guo, Yu Gu, Tian He, and David DuDepartment of Computer Science and Engineering
June 23, 2010
ICDCS 2010

2
Intelligent Transportation Systems (ITS)
ITS provides the transport safety and efficiency through the computing and communications among transport systems.

Vehicle Trajectory
Vehicle follows the route provided by GPS-based navigation systems for efficient driving.
GPS-based Navigation
Vehicle Trajectory
Vehicle moves along its trajectory with bounded speed.

Road Network Layout
Road Map Road Network Graph
Road network layout can be represented as road map.
This road map can be reduced to the road network graph.

Vehicular Traffic StatisticsRoad Map
Road Segment
Road Segment
Vehicle Density
Vehicular traffic statistics can be measured per road segment.
Vehicle density can be measured by vehicle inter-arrival time.

6
Motivation We design Data Forwarding for Vehicular
Networks based on these four characteristics of road networks: Vehicle Trajectory Road Network Layout Vehicular Traffic Statistics
Data Forwarding for Vehicular Networks In this paper, we investigate the Data Forwarding for
Infrastructure-to-Vehicle Data Delivery.

Problem Definition
7
Good RendezvousPoint
!

Challenge in Reverse Data Forwarding
8
Target Missing!
Inaccurate Delay
Estimation
The destination vehicle moves along its trajectory.

9
Data Delivery by VADD from AP to Target Point
Expected Delay Actual Delay Error
489 sec 413 sec 16%
Expected STD Actual STD Error
10 sec 139 sec 1277%
Difficult to deliver packets with these errors!

10
Packet Forwarding based onStationary Nodes
Assume each intersection has a stationary node for packet buffering.
1. Source Routing to Target Stationary Node
2. Source Routing to Destination Vehicle

Target Point Selection
Miss! Miss! Miss!
Hit!
Hit!
Hit!
Target point with a minimum delay and a high delivery probability.
Minimum Delay
Target Point
Design Challenges
12
How to model Packet Delay and Vehicle Delay?Modeling of Packet Delay Distribution and
Vehicle Delay Distribution as Gamma Distributions
How to select an Optimal Target Point?Optimal Target Point Selection Algorithm using
the Distributions of Packet and Vehicle Delays
13
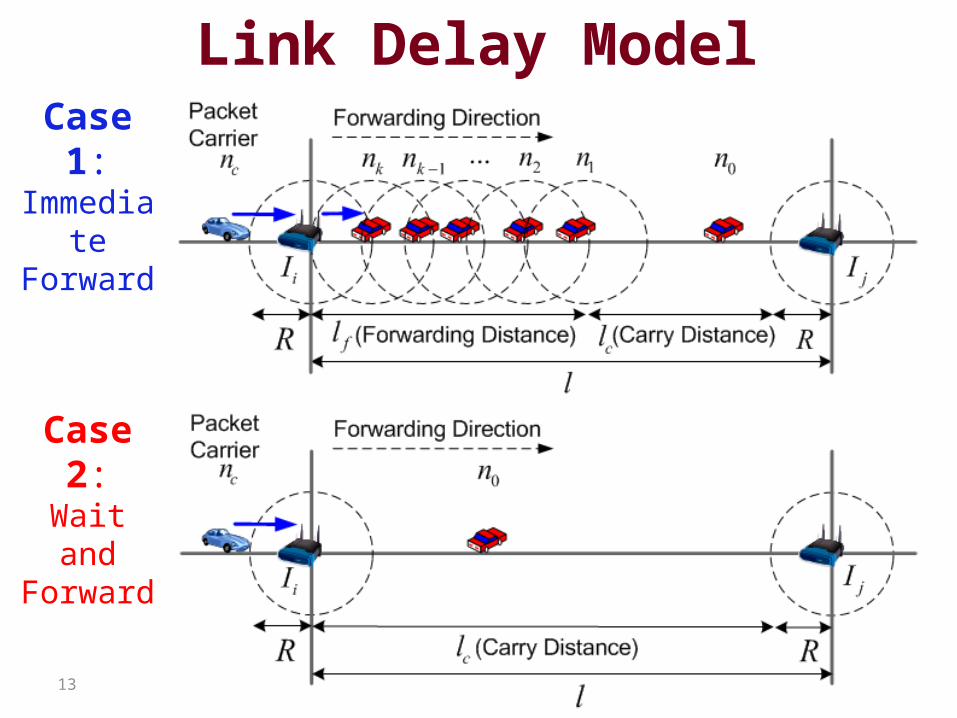
Link Delay ModelCase 1:
Immediate Forward
Case 2:Wait andForward

Link Delay ModelCase 1: Immediate ForwardCase 2: Wait and Forward
Let d be the link delay for a road segment.
1. Expectation of link delay
2. Variance of link delay
].wait[] wait|delay link [
]forward[]forward |delay link [][
PE
PEdE
.][][][ 22 dEdEdVar
Case 1
Case 2
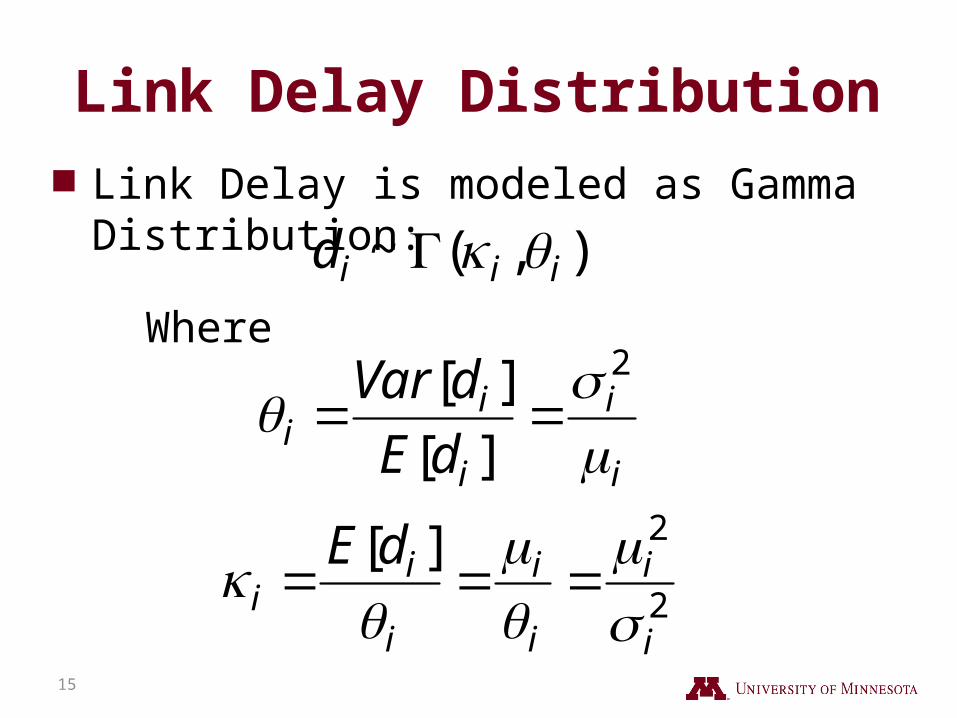
Link Delay Distribution Link Delay is modeled as Gamma Distribution:
),(~ iiid Where
i
i
i
ii dE
dVar
2
][
][
2
2][
i
i
i
i
i
ii
dE
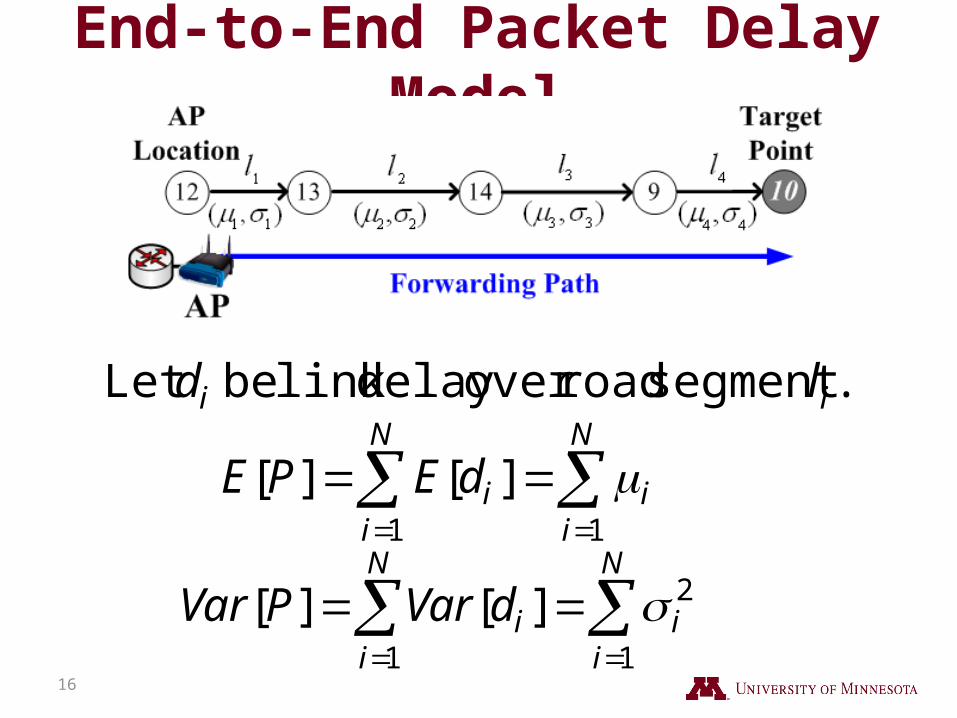
End-to-End Packet Delay Model
N
ii
N
iidEPE
11
][][
N
ii
N
iidVarPVar
1
2
1
][][
.segment roadover delay link be Let ii ld

Vehicle Delay Model
N
ii
N
iitEVE
11
][][
N
ii
N
iitVarVVar
1
2
1
][][
.segment roadover time travelbe Let ii lt

50 100 150 200 250 300 350 4000
0.002
0.004
0.006
0.008
0.01
Delay [sec]
PD
FPacket Delay (P)Vehicle Delay (V)
Delay Distributions for intersection i
Optimization
Optimal Target Point Selection
18
TTL v
ii
iiiTi
dpdvvgpfVPP
VPPVEi
0 0.)()(][ re whe
][ subject to ][minarg*

19
Performance Evaluation Simulation Setting
Road Network: 5.1miles x 5.6 miles (49 intersections) Communication Range: 200 meters (656 feet)
Performance Metrics Average delivery delay Packet Delivery ratio
Baselines compared with TSF Random Trajectory Point (RTP) Last Trajectory Point (LTP)

20
CDF Comparison for Delivery Delay

21
Impact of Vehicle Density
For TSF, as the more vehicles exist, 1. The shorter delivery delay is obtained and.2. The higher delivery ratio is obtained.

22
Impact of Delivery Probability Threshold
For TSF, as the threshold α increases, 1. The delivery delay increases and.2. The delivery ratio increases.

23
Conclusion This paper designs a trajectory-based statistical
data forwarding tailored for vehicular networks, Considering road network characteristics:
• Vehicle Trajectory• Road Network Layout• Vehicular Traffic Statistics
As future work, we will continue to investigate vehicle trajectory for vehicular networking: Data Forwarding, Data Dissemination, and Vehicle
Detouring Protocol.