Embed Size (px)
Citation preview
Tsunami Evacuation Process and Human Loss Distribution in the 2011 Great East Japan Earthquake - A Case Study of Natori City, Miyagi Prefecture - H. Murakami, K. Takimoto Graduate School of Science and Engr., Yamaguchi University, Japan A. Pomonis Cambridge Architectural Research Limited, U.K.
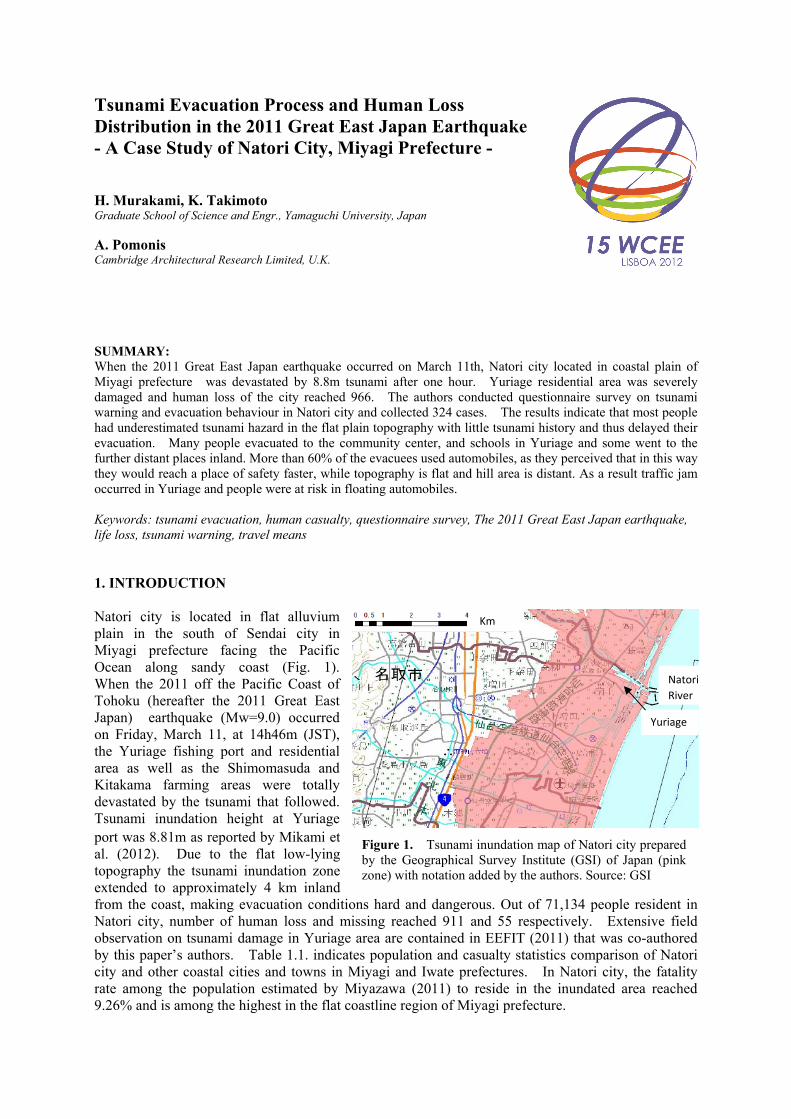
SUMMARY: When the 2011 Great East Japan earthquake occurred on March 11th, Natori city located in coastal plain of Miyagi prefecture was devastated by 8.8m tsunami after one hour. Yuriage residential area was severely damaged and human loss of the city reached 966. The authors conducted questionnaire survey on tsunami warning and evacuation behaviour in Natori city and collected 324 cases. The results indicate that most people had underestimated tsunami hazard in the flat plain topography with little tsunami history and thus delayed their evacuation. Many people evacuated to the community center, and schools in Yuriage and some went to the further distant places inland. More than 60% of the evacuees used automobiles, as they perceived that in this way they would reach a place of safety faster, while topography is flat and hill area is distant. As a result traffic jam occurred in Yuriage and people were at risk in floating automobiles. Keywords: tsunami evacuation, human casualty, questionnaire survey, The 2011 Great East Japan earthquake, life loss, tsunami warning, travel means 1. INTRODUCTION Natori city is located in flat alluvium plain in the south of Sendai city in Miyagi prefecture facing the Pacific Ocean along sandy coast (Fig. 1). When the 2011 off the Pacific Coast of Tohoku (hereafter the 2011 Great East Japan) earthquake (Mw=9.0) occurred on Friday, March 11, at 14h46m (JST), the Yuriage fishing port and residential area as well as the Shimomasuda and Kitakama farming areas were totally devastated by the tsunami that followed. Tsunami inundation height at Yuriage port was 8.81m as reported by Mikami et al. (2012). Due to the flat low-lying topography the tsunami inundation zone extended to approximately 4 km inland from the coast, making evacuation conditions hard and dangerous. Out of 71,134 people resident in Natori city, number of human loss and missing reached 911 and 55 respectively. Extensive field observation on tsunami damage in Yuriage area are contained in EEFIT (2011) that was co-authored by this paper’s authors. Table 1.1. indicates population and casualty statistics comparison of Natori city and other coastal cities and towns in Miyagi and Iwate prefectures. In Natori city, the fatality rate among the population estimated by Miyazawa (2011) to reside in the inundated area reached 9.26% and is among the highest in the flat coastline region of Miyagi prefecture.
Figure 1. Tsunami inundation map of Natori city prepared by the Geographical Survey Institute (GSI) of Japan (pink zone) with notation added by the authors. Source: GSI
Km
Yuriage
Natori River

Table 1.1. Population and casualty statistics comparison
City / Town
(ordered North to
South)
Dead+Missing
Population in
inundated area
in 2010 by
Miyazawa
(2011)
Household in
inundated area
in 2010 by
Miyazawa
(2011)
% of population
previously
living in
inundated area
Fatality rate
ininundated
area
% of pop. >=65
years of age (in
2010)
Miyako C. 527 11740 4660 19.8% 4.49% 30.9%
Yamada T. 757 7050 2650 37.9% 10.74% 31.8%
Otsuchi T. 1,282 9300 3660 60.9% 13.78% 32.4%
Kamaishi C. 1,046 11390 4770 28.8% 9.18% 34.8%
Ofunato C. 424 8990 3440 22.1% 4.72% 30.8%
Rikuzentakata C. 1,795 9960 3530 42.7% 18.02% 34.9%
Kesennuma C. 1,356 20880 7620 28.4% 6.49% 30.8%
Minamisanriku T. 845 8480 2720 48.7% 9.96% 30.1%
Onagawa T. 915 5150 2030 51.2% 17.77% 33.4%
Ishinomaki C. 3,735 92210 35330 57.3% 4.05% 27.2%
Higashimatsushima 1,105 28800 9610 67.1% 3.84% 23.1%
Tagajo C. 189 13160 5340 20.9% 1.44% 18.3%
Sendai C. 829 19580 6640 1.9% 4.23% 18.3%
Miyagino Ward - 12830 4720 6.7% - 16.5%
Wakabayashi Ward - 6750 1920 5.1% - 18.1%
Natori C. 966 10430 3400 14.3% 9.26% 19.1%
Iwanuma C. 182 6570 1820 14.9% 2.77% 19.7%
Watari T. 269 10920 3230 31.3% 2.46% 23.2%
Yamamoto T. 690 7460 2390 44.7% 9.25% 31.6%
Iwate
Prefec
ture
Miyagi
Prefec
ture
Photo 1. Yuriage 1-chome, a shopping street with remaining houses
Photo 2. In Yuriage 4-chome near the fishing port, houses were totally lost, only foundations of wooden
houses remain
Photo 4. Yuriage junior high school where 800 people took refuge and survived
Photo 3. Yuriage community center in which 43 people evacuated 2nd floor and survived
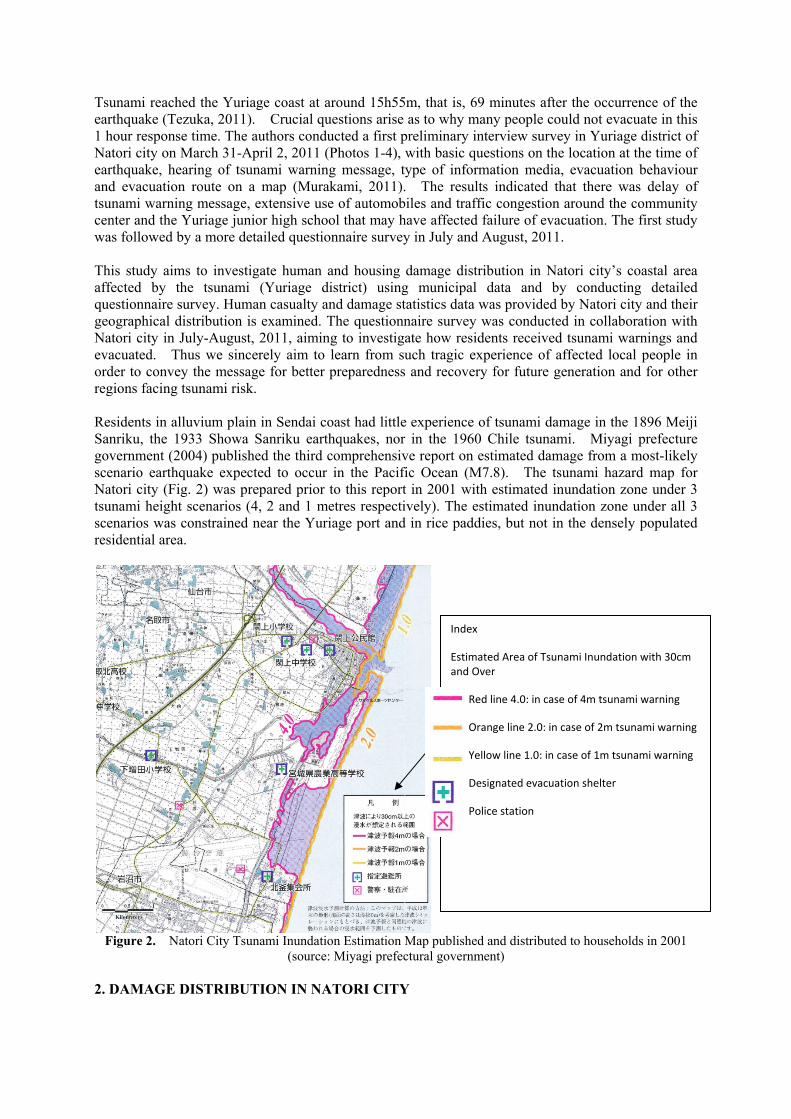
Tsunami reached the Yuriage coast at around 15h55m, that is, 69 minutes after the occurrence of the earthquake (Tezuka, 2011). Crucial questions arise as to why many people could not evacuate in this 1 hour response time. The authors conducted a first preliminary interview survey in Yuriage district of Natori city on March 31-April 2, 2011 (Photos 1-4), with basic questions on the location at the time of earthquake, hearing of tsunami warning message, type of information media, evacuation behaviour and evacuation route on a map (Murakami, 2011). The results indicated that there was delay of tsunami warning message, extensive use of automobiles and traffic congestion around the community center and the Yuriage junior high school that may have affected failure of evacuation. The first study was followed by a more detailed questionnaire survey in July and August, 2011. This study aims to investigate human and housing damage distribution in Natori city’s coastal area affected by the tsunami (Yuriage district) using municipal data and by conducting detailed questionnaire survey. Human casualty and damage statistics data was provided by Natori city and their geographical distribution is examined. The questionnaire survey was conducted in collaboration with Natori city in July-August, 2011, aiming to investigate how residents received tsunami warnings and evacuated. Thus we sincerely aim to learn from such tragic experience of affected local people in order to convey the message for better preparedness and recovery for future generation and for other regions facing tsunami risk. Residents in alluvium plain in Sendai coast had little experience of tsunami damage in the 1896 Meiji Sanriku, the 1933 Showa Sanriku earthquakes, nor in the 1960 Chile tsunami. Miyagi prefecture government (2004) published the third comprehensive report on estimated damage from a most-likely scenario earthquake expected to occur in the Pacific Ocean (M7.8). The tsunami hazard map for Natori city (Fig. 2) was prepared prior to this report in 2001 with estimated inundation zone under 3 tsunami height scenarios (4, 2 and 1 metres respectively). The estimated inundation zone under all 3 scenarios was constrained near the Yuriage port and in rice paddies, but not in the densely populated residential area.
Figure 2. Natori City Tsunami Inundation Estimation Map published and distributed to households in 2001
(source: Miyagi prefectural government) 2. DAMAGE DISTRIBUTION IN NATORI CITY
Index
Estimated Area of Tsunami Inundation with 30cm and Over
Red line 4.0: in case of 4m tsunami warning
Orange line 2.0: in case of 2m tsunami warning
Yellow line 1.0: in case of 1m tsunami warning
Designated evacuation shelter
Police station

2.1. Age and Sex Distribution of Life Loss The list of people who lost their lives by age, sex, and address of residence was provided by Natori municipal office and classified by groups (Fig. 3). It is noted that the number of deaths is high for the age groups 65 and over. From interviews with city officials we learned that 67 fatalities in Natori, concerned people not residing in Natori. We also learned that many city officials lost their life trying to assist in the tsunami evacuation, whilst in addition several Natori residents died in other locations. The fatality rate by age group population in inundated area is shown in Fig. 4. where we note an almost constant increase in fatality rate as the age increased, peaking at just under 30% for those aged 85 and over. Similar tendencies are pointed out from tsunami evacuation studies in Yamada town in rias coast and in Ishinomaki city by Goto et al. (2012). Higher human loss rate in elderly groups seems to depend on physical handicap to move, walk, and drive, and lesser exposure to channels of information. 2.2. Geographical Distribution of Life Loss and Damage to Dwellings Fig. 5 is aerial view of Yuriage district, which indicates post-tsunami damage conditions. Yuriage district is subdivided into 7 neighbourhoods (akin to postcode areas) called “chome” and the boundaries can be seen in Fig. 6. The confirmed fatalities were classified by address divisions and compared with rate of elderly population, ratio of houses destroyed/washed-away (Table 2.1.). Life loss rate and ratio of totally lost houses for each chome are shown in the map with inundation levels and major evacuation places (Fig. 6). The topography of Yuriage area is flat coastal plain with most elevation less than 5m, thus prompt evacuation to nearby natural hills like in some towns
0
10
20
30
40
50
60
numbe
r of h
uman
loss
age group
male female
Figure 4. Age distribution of fatality rate in inundated area of Natori city (age group
population data from 2005 census)
Figure 3. Age and sex distribution of human loss in Natori city (n=910 confirmed losses)
Figure 5. Aerial view of Yuriage district, Natori city after tsunami disaster by Google Earth
0%
5%
10%
15%
20%
25%
30%
0~4
5~9
10~1
4
15~1
9
20~2
9
30~3
9
40~4
9
50~5
9
60~6
4
65~6
9
70~7
9
80~8
4
85~
Fatality Rate (%)
Age Group

in the rias coastline of Miyagi and Iwate prefectures (e.g. Ofunato) is not possible. Yuriage community center (2 storeys), Yuriage junior high school (3 storeys), and Yuriage elementary school (3 storeys) are all reinforced concrete (RC) buildings designated as evacuation shelters in the hazard map (Fig. 2), but were not meant to be vertical tsunami evacuation buildings (Murakami, et al., 2012). Yuriage 3- to 5-chomes are located east of Teizan-bori canal, closer to the ocean, where inundation height was higher (8.5m – 6.95m), and ratio of wooden houses washed away was from 100% to 96%. Human loss ratio there was from 11% to 12%. In 6-chome, RC apartment buildings were located and housing damage ratio did not reach 100%. Worst affected was Yuriage 2-chome, where life loss rate reached 22.3%, while housing loss was 81%.The rate of elderly population was highest in surrounding farming area of Kozukahara (18.9%) and 3-chome (17.3%), whilst in 2-chome (14.6%) was the third highest. The hypothesis is that many residents of 3- to 5-chomes situated nearest to the ocean evacuated promptly while in 2-chome many of the residents thought that major tsunami will not attack their place which is approximately 1 to 1.4 km inland and thus did not start evacuation promptly. This hypothesis will be examined by the results of the questionnaire survey (see section 3.3 and Fig. 15). Table 2.1. Damage statistics by Yuriage areas (Murakami and Kashiwabara, 2011)
Figure 6. Human loss % and damage ratio of houses washed away with inundation depth in the map of
Yuriage, Natori city (water depth as reported by Natori city office (2011)
Yuriage areas 1 chome 2 chome 3 chome 4 chome 5 chome 6 chome 7 chomeKozukah
araTotal
Number of human loss 49 200 43 84 64 138 89 54 721
Population in 2009 667 895 356 755 533 1062 832 566 5666
Human loss ratio (%) 7.3 22.3 12.1 11.1 12.0 13.0 10.7 9.5 12.7
Ratio of elders - ageover 75 in 2005 (%)
11.8 14.6 17.3 16.5 7.4 9.7 4.9 18.9 -
Ratio of houses washedaway #1 (%)
21 81 100 100 96 90 91 - -
note #1: Houses washed away were counted using Googlemap areal photo taken on 6 April 2011 with comparison of the Zenrin house map
Map of Yuriage district, Natori city
(C) ESRI
7%
21%
22%
81%
12%
100%
11%
100%
12%
96%
13%
90%
11%
91%
Water depth GL+ 8.50m
Water depth GL+ 6.95m
Water depth GL+ 1.87m
Community Center
Human loss %
Houses washed %
1‐chome2‐chome
3‐chome
4‐chome
5‐chome
6‐chome
7‐chome
Elementary sch
Junior high
m
3. FINDINGS FROM THE QUESTIONNAIRE SURVEY ON TSUNAMI EVACUATION 3.1. Survey Method Table 3.1 indicates outline of the tsunami evacuation questionnaire form used in Natori city. The questionnaire contains 47 questions regarding the location when the earthquake occurred, exposure to the tsunami warning and information media, trigger to start evacuation, destination, travel means of evacuation, traffic conditions. For those who did not evacuate, reasons, behaviour, life threat, injury of oneself, family members, damage to own dwelling. Preparedness and awareness before the earthquake such as learning hazard maps, participating disaster drills, personal attributes, free opinions and so forth. Plotting where one was located when the earthquake occurred, one’s house and trace of evacuation route in a map. Table 3.1. Outline of tsunami evacuation questionnaire in Natori city
Distributed on July 28, 2011 by city officials to all of 935 temporary housing units occupied in the city (one questionnaire per household), and to 200 households who became homeless and are temporarily living in vacant apartments for shelter in and around Natori city by post
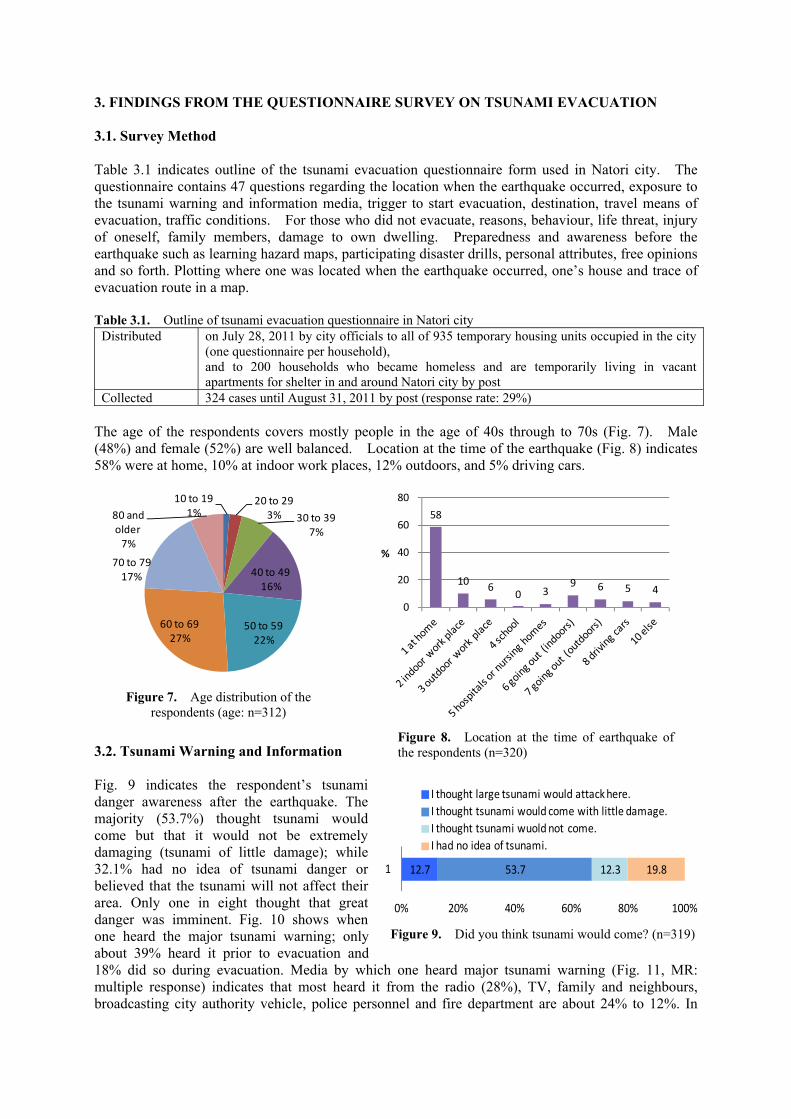
Collected 324 cases until August 31, 2011 by post (response rate: 29%) The age of the respondents covers mostly people in the age of 40s through to 70s (Fig. 7). Male (48%) and female (52%) are well balanced. Location at the time of the earthquake (Fig. 8) indicates 58% were at home, 10% at indoor work places, 12% outdoors, and 5% driving cars. 3.2. Tsunami Warning and Information Fig. 9 indicates the respondent’s tsunami danger awareness after the earthquake. The majority (53.7%) thought tsunami would come but that it would not be extremely damaging (tsunami of little damage); while 32.1% had no idea of tsunami danger or believed that the tsunami will not affect their area. Only one in eight thought that great danger was imminent. Fig. 10 shows when one heard the major tsunami warning; only about 39% heard it prior to evacuation and 18% did so during evacuation. Media by which one heard major tsunami warning (Fig. 11, MR: multiple response) indicates that most heard it from the radio (28%), TV, family and neighbours, broadcasting city authority vehicle, police personnel and fire department are about 24% to 12%. In
10 to 191%
20 to 293% 30 to 39
7%
40 to 4916%
50 to 5922%
60 to 6927%
70 to 7917%
80 and older7%
58
10 6 0 3
9 6 5 4
0
20
40
60
80
%
12.7 53.7 12.3 19.8
0% 20% 40% 60% 80% 100%
1
I thought large tsunami would attack here.I thought tsunami would come with little damage.I thought tsunami wuold not come.I had no idea of tsunami.
Figure 9. Did you think tsunami would come? (n=319)
Figure 7. Age distribution of the respondents (age: n=312)
Figure 8. Location at the time of earthquake of the respondents (n=320)
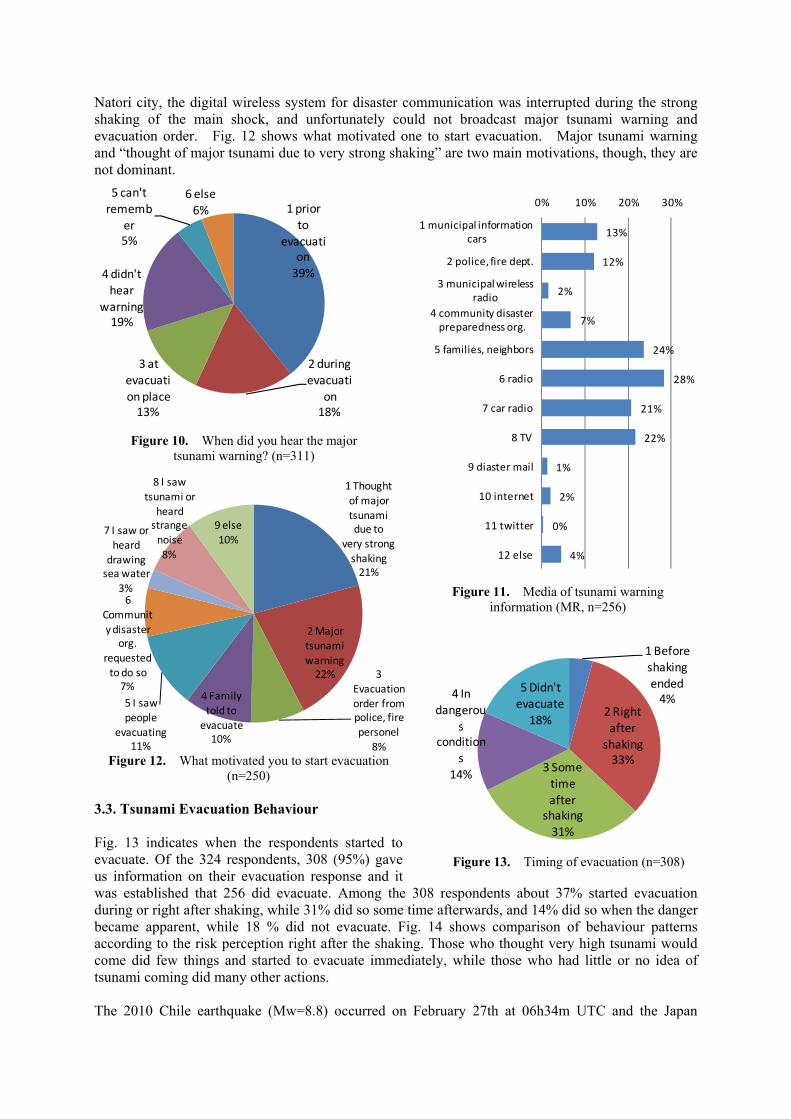
Natori city, the digital wireless system for disaster communication was interrupted during the strong shaking of the main shock, and unfortunately could not broadcast major tsunami warning and evacuation order. Fig. 12 shows what motivated one to start evacuation. Major tsunami warning and “thought of major tsunami due to very strong shaking” are two main motivations, though, they are not dominant.
Figure 12. What motivated you to start evacuation (n=250)
3.3. Tsunami Evacuation Behaviour Fig. 13 indicates when the respondents started to evacuate. Of the 324 respondents, 308 (95%) gave us information on their evacuation response and it was established that 256 did evacuate. Among the 308 respondents about 37% started evacuation during or right after shaking, while 31% did so some time afterwards, and 14% did so when the danger became apparent, while 18 % did not evacuate. Fig. 14 shows comparison of behaviour patterns according to the risk perception right after the shaking. Those who thought very high tsunami would come did few things and started to evacuate immediately, while those who had little or no idea of tsunami coming did many other actions. The 2010 Chile earthquake (Mw=8.8) occurred on February 27th at 06h34m UTC and the Japan
1 prior to
evacuation39%
2 during evacuati
on18%
3 at evacuation place13%
4 didn't hear
warning19%
5 can't rememb
er5%
6 else6%
13%
12%
2%
7%
24%
28%
21%
22%
1%
2%
0%
4%
0% 10% 20% 30%
1 municipal information cars
2 police, fire dept.
3 municipal wireless radio
4 community disaster preparedness org.
5 families, neighbors
6 radio
7 car radio
8 TV
9 diaster mail
10 internet
11 twitter
12 else
1 Before shaking ended4%
2 Right after shaking33%
3 Some time after shaking31%
4 In dangerou
s condition
s14%
5 Didn't evacuate18%
Figure 11. Media of tsunami warning information (MR, n=256)
Figure 10. When did you hear the major tsunami warning? (n=311)
1 Thought of major tsunami due to
very strong shaking21%
2 Major tsunami warning22% 3
Evacuation order from police, fire personel
8%
4 Family told to evacuate10%
5 I saw people
evacuating11%
6 Community disaster
org. requested to do so7%
7 I saw or heard drawing sea water
3%
8 I saw tsunami or heard strange noise8%
9 else10%
Figure 13. Timing of evacuation (n=308)
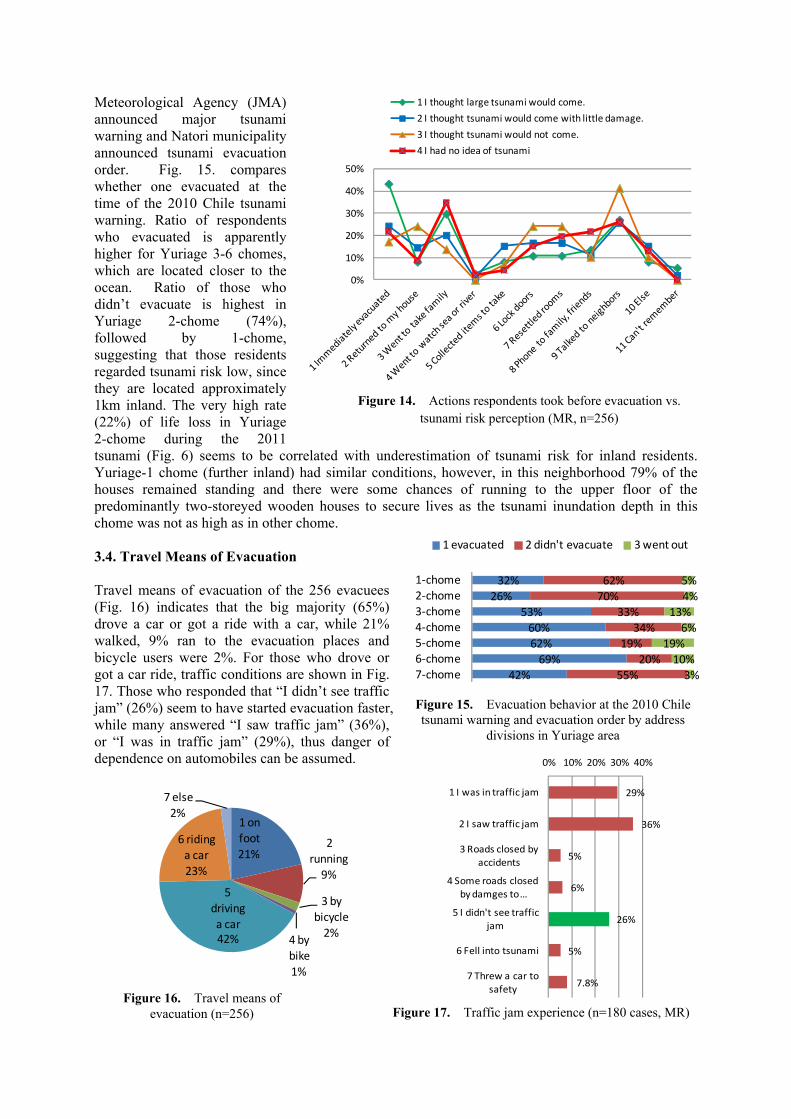
Meteorological Agency (JMA) announced major tsunami warning and Natori municipality announced tsunami evacuation order. Fig. 15. compares whether one evacuated at the time of the 2010 Chile tsunami warning. Ratio of respondents who evacuated is apparently higher for Yuriage 3-6 chomes, which are located closer to the ocean. Ratio of those who didn’t evacuate is highest in Yuriage 2-chome (74%), followed by 1-chome, suggesting that those residents regarded tsunami risk low, since they are located approximately 1km inland. The very high rate (22%) of life loss in Yuriage 2-chome during the 2011 tsunami (Fig. 6) seems to be correlated with underestimation of tsunami risk for inland residents. Yuriage-1 chome (further inland) had similar conditions, however, in this neighborhood 79% of the houses remained standing and there were some chances of running to the upper floor of the predominantly two-storeyed wooden houses to secure lives as the tsunami inundation depth in this chome was not as high as in other chome. 3.4. Travel Means of Evacuation Travel means of evacuation of the 256 evacuees (Fig. 16) indicates that the big majority (65%) drove a car or got a ride with a car, while 21% walked, 9% ran to the evacuation places and bicycle users were 2%. For those who drove or got a car ride, traffic conditions are shown in Fig. 17. Those who responded that “I didn’t see traffic jam” (26%) seem to have started evacuation faster, while many answered “I saw traffic jam” (36%), or “I was in traffic jam” (29%), thus danger of dependence on automobiles can be assumed.
1 on foot21%
2 running9%
3 by bicycle2%4 by
bike1%
5 driving a car42%
6 riding a car23%
7 else2%
29%
36%
5%
6%
26%
5%
7.8%
0% 10% 20% 30% 40%
1 I was in traffic jam
2 I saw traffic jam
3 Roads closed by accidents
4 Some roads closed by damges to …
5 I didn't see traffic jam
6 Fell into tsunami
7 Threw a car to safety
32%26%
53%60%62%69%
42%
62%70%
33%34%
19%20%
55%
5%4%
13%6%
19%10%3%
1‐chome2‐chome3‐chome4‐chome5‐chome6‐chome7‐chome
1 evacuated 2 didn't evacuate 3 went out
Figure 15. Evacuation behavior at the 2010 Chile tsunami warning and evacuation order by address
divisions in Yuriage area
0%
10%
20%
30%
40%
50%
1 I thought large tsunami would come.
2 I thought tsunami would come with little damage.
3 I thought tsunami would not come.
4 I had no idea of tsunami
Figure 14. Actions respondents took before evacuation vs. tsunami risk perception (MR, n=256)
Figure 17. Traffic jam experience (n=180 cases, MR) Figure 16. Travel means of
evacuation (n=256)
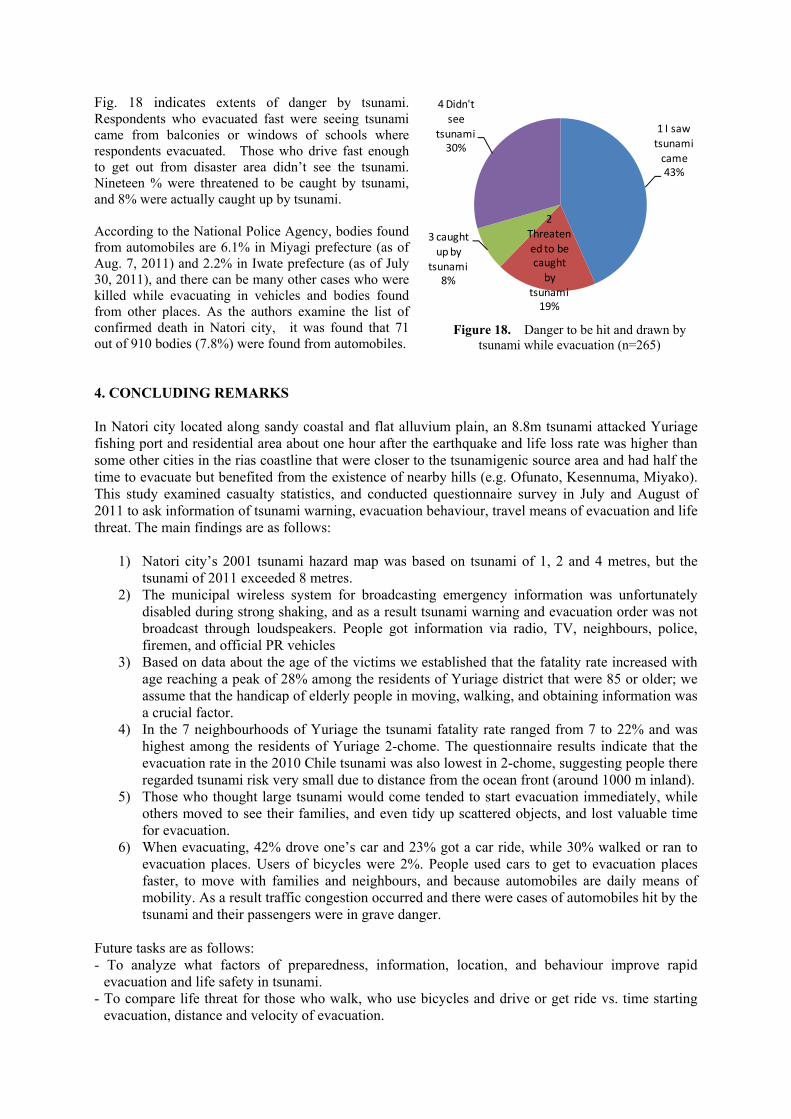
Fig. 18 indicates extents of danger by tsunami. Respondents who evacuated fast were seeing tsunami came from balconies or windows of schools where respondents evacuated. Those who drive fast enough to get out from disaster area didn’t see the tsunami. Nineteen % were threatened to be caught by tsunami, and 8% were actually caught up by tsunami. According to the National Police Agency, bodies found from automobiles are 6.1% in Miyagi prefecture (as of Aug. 7, 2011) and 2.2% in Iwate prefecture (as of July 30, 2011), and there can be many other cases who were killed while evacuating in vehicles and bodies found from other places. As the authors examine the list of confirmed death in Natori city, it was found that 71 out of 910 bodies (7.8%) were found from automobiles. 4. CONCLUDING REMARKS In Natori city located along sandy coastal and flat alluvium plain, an 8.8m tsunami attacked Yuriage fishing port and residential area about one hour after the earthquake and life loss rate was higher than some other cities in the rias coastline that were closer to the tsunamigenic source area and had half the time to evacuate but benefited from the existence of nearby hills (e.g. Ofunato, Kesennuma, Miyako). This study examined casualty statistics, and conducted questionnaire survey in July and August of 2011 to ask information of tsunami warning, evacuation behaviour, travel means of evacuation and life threat. The main findings are as follows:
1) Natori city’s 2001 tsunami hazard map was based on tsunami of 1, 2 and 4 metres, but the tsunami of 2011 exceeded 8 metres.
2) The municipal wireless system for broadcasting emergency information was unfortunately disabled during strong shaking, and as a result tsunami warning and evacuation order was not broadcast through loudspeakers. People got information via radio, TV, neighbours, police, firemen, and official PR vehicles
3) Based on data about the age of the victims we established that the fatality rate increased with age reaching a peak of 28% among the residents of Yuriage district that were 85 or older; we assume that the handicap of elderly people in moving, walking, and obtaining information was a crucial factor.
4) In the 7 neighbourhoods of Yuriage the tsunami fatality rate ranged from 7 to 22% and was highest among the residents of Yuriage 2-chome. The questionnaire results indicate that the evacuation rate in the 2010 Chile tsunami was also lowest in 2-chome, suggesting people there regarded tsunami risk very small due to distance from the ocean front (around 1000 m inland).
5) Those who thought large tsunami would come tended to start evacuation immediately, while others moved to see their families, and even tidy up scattered objects, and lost valuable time for evacuation.
6) When evacuating, 42% drove one’s car and 23% got a car ride, while 30% walked or ran to evacuation places. Users of bicycles were 2%. People used cars to get to evacuation places faster, to move with families and neighbours, and because automobiles are daily means of mobility. As a result traffic congestion occurred and there were cases of automobiles hit by the tsunami and their passengers were in grave danger.
Future tasks are as follows: - To analyze what factors of preparedness, information, location, and behaviour improve rapid
evacuation and life safety in tsunami. - To compare life threat for those who walk, who use bicycles and drive or get ride vs. time starting
evacuation, distance and velocity of evacuation.
1 I saw tsunami came43%
2 Threatened to be caught by
tsunami19%
3 caught up by
tsunami8%
4 Didn't see
tsunami30%
Figure 18. Danger to be hit and drawn by tsunami while evacuation (n=265)

- To examine evacuation route, TEB destination and traffic conditions in geographic and road network.
AKCNOWLEDGEMENT Authors sincerely acknowledge affected people in Natori city who kindly cooperated in the survey remembering life threatening experiences and loss of families and neighbours in disaster. Collaboration with Natori municipal office and staffs in Disaster Management Section has been very helpful to promote this study. We wish early recovery and restoration of damaged area and living conditions of affected people. The author (HM) has been an active member of special study group of tsunami evacuation chaired by Prof. F. Imamura of Tohoku University and coordinated by Dr. Yozo Goto of the University of Tokyo and wish to appreciate discussion and support during survey and analysis. This study was supported by Grants-in-Aid for Scientific Research by JSPS (Project ID 21510179, Principal Investigator; Hitomi Murakami). The author (HM) is a member of the SATREPS Japan-Chile Research Project on Enhancement of Technology to Develop Tsunami-Resilient Community with grants from JST and JICA, and meetings and discussion in the this project have been very helpful for this research. REFERENCES EEFIT. (2011). The Mw9.0 Tohoku earthquake and tsunami of 11th March 2011 - A field report by EEFIT.
London, UK. Fire and Disaster Management Agency of Japan. (2012). Report 145 on the effects of the March 11, 2011 Great
Tōhoku earthquake, October 11, 2011. http://www.fdma.go.jp/bn/2012/detail/691.html [Accessed 26 March 2012].
Goto, Y., Mikami, T., and Nakabayashi, I. (2012). Fact-finding about the evacuation from the unexpectedly large tsunami of March 11, 2011 in East Japan, Proc. 15th World Conf. on Earthq. Engr, in print, Lisbon, Portugal..
Mikami, T., Shibayama, T., Esteban, M., and Matsumaru, R. (2012). Field survey of the 2011 Tohoku earthquake and tsunami in Miyagi and Fukushima prefectures, Coastal Engineering Journal, 54: 1, 1250011, pp. 1-26.
Miyagi Prefectural Government: Tsunami hazard map (Natori city). Available at http://www.pref.miyagi.jp/sabomizusi/bousai/bou-ht2.html> [Accessed April 23, 2012].
Miyagi Prefectural Government (2004). Report on estimated damages by the third scenario earthquakes in Miyagi prefecture. Available at http://www.pref.miyagi.jp/kikitaisaku/jishin_chishiki/3higaishin/sanzihigaitop.htm [Accessed 2 February 2012].
Miyazawa, H. (2011). Population in areas affected by the 2011 tsunami off the Pacific coast caused by the Tohoku earthquake: From Sanriku coast to Sendai Bay area, the 2011 East Japan Earthquake Bulletin of the Tohoku Geographical Association. Available at
< http://tohokugeo.jp/disaster/articles/e-contents16.html> [Accessed April 23, 2012]. (in English) Murakami, H. and Umezu, Y. (2011). Hearing survey on tsunami evacuation after the 2011off the Pacific coast
of Tohoku earthquake in Yuriage area, Natori city, Proc. of the 8th Annual Meeting of Japan Association for Earthquake Engineering, pp. 64-65.
Murakami, H. and Kashiwabara, K. (2011). Travel means for tsunami evacuation in the 2011 Tohoku Pacific Ocean Earthquake - Questionnaire survey in Natori city –, Proc. of the Annual Conf. of the Institute of Social Safety Science, No. 29, 67-70, (in Japanese with English abstract).
Murakami, H., Fraser, S., Leonard, G., and Matsuo, I. (2012). A field study on conditions and roles of tsunami evacuation buildings in the 2011 Tohoku Pacific earthquake and tsunami, Joint Coference Proceedings, 9th Intern. Conf. on Urban Earthq. Engr./ 4th Asia Conf. on Earthq. Engr., pp. 89-95, Tokyo Institute of Technology, Tokyo.
National Police Agency Natori city (2001). Tsunami inundation hazard map with evacuation places. Statistics Bureau (2012). Statistics data of the Pacific coast in East Japan region related to damages.
Available at <http://www.stat.go.jp/info/shinsai/> [Accessed 2 April 2012]. Tezuka, K. (2011). A powerful tsunami surges toward Japanese coastline, swallowing business and residential
areas in Natori City, Photo taken from helicopter, at 3:55 pm, March 11, 2011, Mainichi Shimbun Co. Available at < http://www.tumblr.com/tagged/koichiro-tezuka> [Accessed 23 April 2012].