Embed Size (px)
Citation preview

BRINGING OUR NEIGHBOUR CLOSERFOUR REFORmS tO maxImISE tOURISm FROm NEW ZEaLaND – aUStRaLIa’S LaRGESt INtERNatIONaL vISItOR maRkEt
aUGUSt 2014

2 | BRINGING OUR NEIGHBOUR CLOSER
For further information, please contact:
Justin Wastnage Director, Aviation Policy Tourism & Transport Forum (TTF)
T +61 2 9240 2034 M +61 410 219131 E [email protected]
www.ttf.org.au
The Tourism & Transport Forum (TTF) is the peak industry group for the Australian tourism, transport, aviation and investment sectors. A national, member-funded CEO forum, TTF advocates the public policy interests of the leading corporations and institutions in these sectors.
TTF uses its experience and networks to influence public policy outcomes and business practices and to assist the delivery of major tourism, aviation and transport-related infrastructure projects.
TTF would like to acknowledge the following organisations for their significant contribution to the delivery of this paper:
Air New Zealand Auckland Airport Australian Customs and Border Protection Service Australia New Zealand Leadership Forum Casinos and Resorts Australasia Dunedin Airport Emirates Jetstar Airways Newcastle Airport New Zealand Customs Service New Zealand High Commission Qantas Airways Queensland Airports Sunshine Coast Airport Sydney Airport Tourism Industry Association New Zealand Trans-Tasman Business Circle Virgin Australia

GUIDING PRINCIPLEStO maxImISE tRavEL BEtWEEN NEW ZEaLaND aND aUStRaLIa, WE NEED tO SHORtEN tHE tOtaL jOURNEy tImE aND OPEN UP NEW POINtS OF aRRIvaL.
aRRIvING ON a FL IGHt FROm NEW ZEaLaND SHOULD FEEL L IkE StEPPING OFF a DOmEStIC aUStRaLIaN FLIGHt, WItH tECHNOLOGy aND PaSSENGER PROFIL ING BEHIND tHE SCENES tO ENSURE OUR BORDERS REmaIN SECURE.

Image courtesy of Auckland Airport

CONtENtSExECUtIvE SUmmaRy 4
tHE COmmON BORDER OBjECtIvE 6The growth potential of tourism from New Zealand 11
REFORm 1 – a DOmEStIC-L IkE tRavEL ExPERIENCE 13Automated departure controls at major airports 18Dedicated Tasman quarantine direct exit channel 21Potential impact of reform 1 25
REFORm 2 – CUt tHE DEPaRtURE tax tO $25 27Potential impact of reform 2 34
REFORm 3 – OPEN aDDItIONaL POINtS OF ENtRy 35Create a new class of Tasman-only airport 38Deploy small, inter-agency clearance teams 40Potential impact of reform 3 42
REFORm 4 – DEvELOP COmmON vISItOR vISaS 44Potential impact of reform 4 49
CONCLUSION 52A centenary to celebrate 52
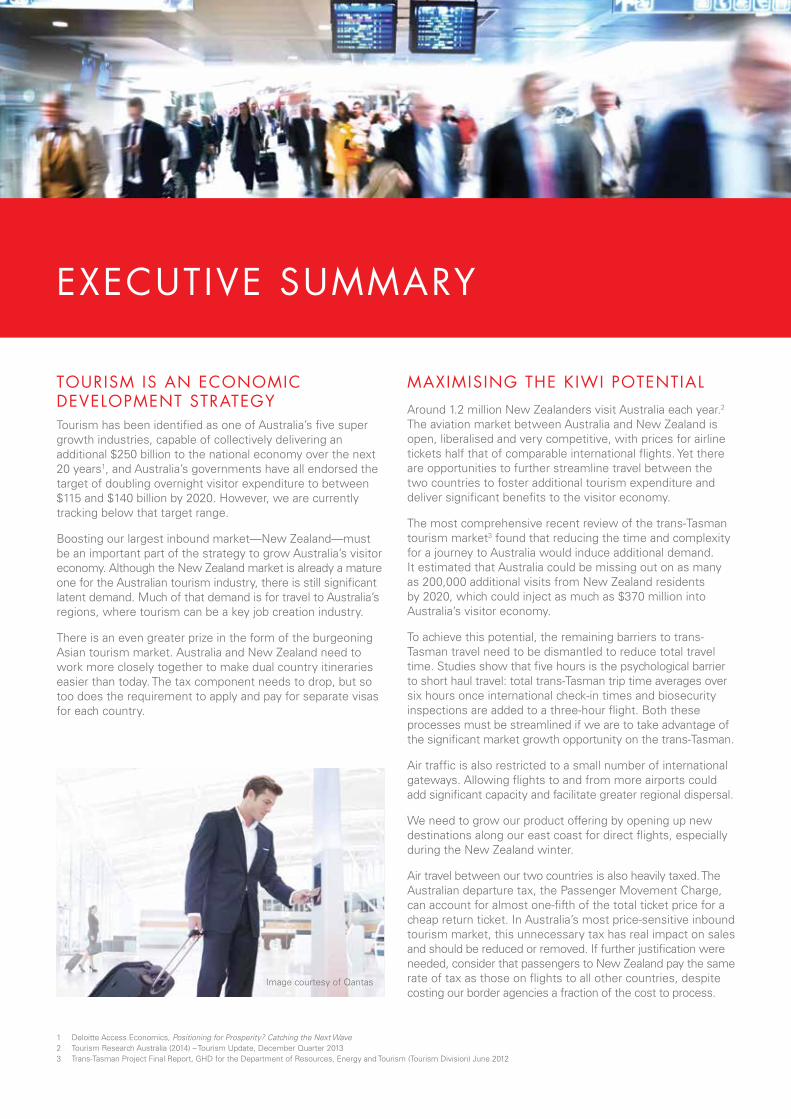
tOURISm IS aN ECONOmIC DEvELOPmENt StRatEGyTourism has been identified as one of Australia’s five super growth industries, capable of collectively delivering an additional $250 billion to the national economy over the next 20 years1, and Australia’s governments have all endorsed the target of doubling overnight visitor expenditure to between $115 and $140 billion by 2020. However, we are currently tracking below that target range.
Boosting our largest inbound market—New Zealand—must be an important part of the strategy to grow Australia’s visitor economy. Although the New Zealand market is already a mature one for the Australian tourism industry, there is still significant latent demand. Much of that demand is for travel to Australia’s regions, where tourism can be a key job creation industry.
There is an even greater prize in the form of the burgeoning Asian tourism market. Australia and New Zealand need to work more closely together to make dual country itineraries easier than today. The tax component needs to drop, but so too does the requirement to apply and pay for separate visas for each country.
maxImISING tHE kIWI POtENtIaL
Around 1.2 million New Zealanders visit Australia each year.2 The aviation market between Australia and New Zealand is open, liberalised and very competitive, with prices for airline tickets half that of comparable international flights. Yet there are opportunities to further streamline travel between the two countries to foster additional tourism expenditure and deliver significant benefits to the visitor economy.
The most comprehensive recent review of the trans-Tasman tourism market3 found that reducing the time and complexity for a journey to Australia would induce additional demand. It estimated that Australia could be missing out on as many as 200,000 additional visits from New Zealand residents by 2020, which could inject as much as $370 million into Australia’s visitor economy.
To achieve this potential, the remaining barriers to trans-Tasman travel need to be dismantled to reduce total travel time. Studies show that five hours is the psychological barrier to short haul travel: total trans-Tasman trip time averages over six hours once international check-in times and biosecurity inspections are added to a three-hour flight. Both these processes must be streamlined if we are to take advantage of the significant market growth opportunity on the trans-Tasman.
Air traffic is also restricted to a small number of international gateways. Allowing flights to and from more airports could add significant capacity and facilitate greater regional dispersal.
We need to grow our product offering by opening up new destinations along our east coast for direct flights, especially during the New Zealand winter.
Air travel between our two countries is also heavily taxed. The Australian departure tax, the Passenger Movement Charge, can account for almost one-fifth of the total ticket price for a cheap return ticket. In Australia’s most price-sensitive inbound tourism market, this unnecessary tax has real impact on sales and should be reduced or removed. If further justification were needed, consider that passengers to New Zealand pay the same rate of tax as those on flights to all other countries, despite costing our border agencies a fraction of the cost to process.
ExECUtIvE SUmmaRy
1 Deloitte Access Economics, Positioning for Prosperity? Catching the Next Wave2 Tourism Research Australia (2014) – Tourism Update, December Quarter 20133 Trans-Tasman Project Final Report, GHD for the Department of Resources, Energy and Tourism (Tourism Division) June 2012
Image courtesy of Qantas
FOUR REFORmS tO GROW tHE PIE
The once-pioneering Trans-Tasman Travel Arrangements deal now lags behind border reforms enacted by other friendly neighbours. Some countries bound by free trade pacts have also moved to free up the movement of people between them. In contrast, the Productivity Commission recently found that the 30-year old Closer Economic Relations agreement is being hindered by the relative lack of travel freedoms.4
This paper sets out four broad areas of reform to our border and immigration procedures that will be key to unlocking this latent demand:
1. Boost demand by cutting travel times at our major airports
2. Induce more travel from New Zealand by halving the Passenger Movement Charge
3. Open up more regional airports to trans-Tasman flights to provide access to more Australian destinations
4. Introduce common visas to encourage more Asian visitors to combine both countries in one trip
LONG-tERm OBjECtIvES
Although a true common border, enveloped by an all-encompassing customs union, remains the ultimate goal, waiting for constitutional lawyers to redraft treaties is unacceptable, with technology already able to deliver many of the requirements. Using risk profiling to replace mandatory inspection, Australia can look and feel more like a domestic destination from New Zealand without any loss of sovereignty to either country.
Widening the Tasman air bridge would give New Zealanders easier and cheaper access to more destinations in Australia than they have today. But until arriving on a trans-Tasman flight feels like arriving on a domestic flight, the true travel potential of both the New Zealand origin market and dual-destination travel by foreign nationals cannot be met.
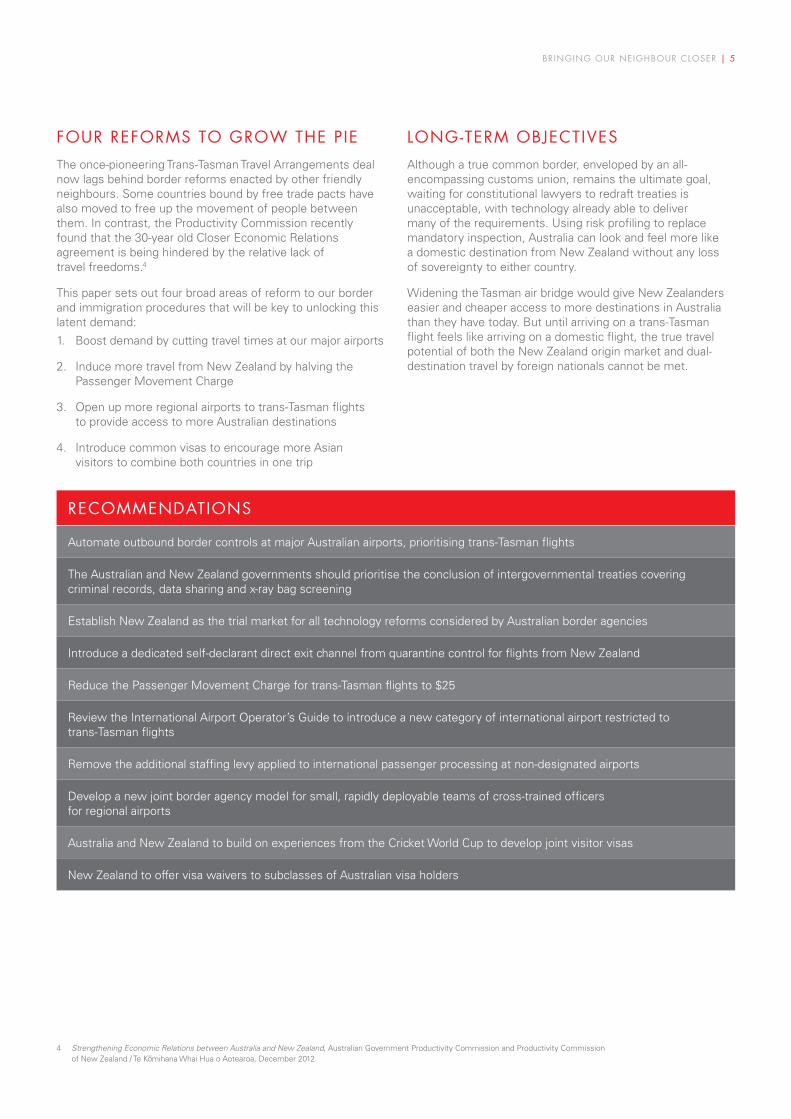
RECOmmENDatIONS
Automate outbound border controls at major Australian airports, prioritising trans-Tasman flights
The Australian and New Zealand governments should prioritise the conclusion of intergovernmental treaties covering criminal records, data sharing and x-ray bag screening
Establish New Zealand as the trial market for all technology reforms considered by Australian border agencies
Introduce a dedicated self-declarant direct exit channel from quarantine control for flights from New Zealand
Reduce the Passenger Movement Charge for trans-Tasman flights to $25
Review the International Airport Operator’s Guide to introduce a new category of international airport restricted to trans-Tasman flights
Remove the additional staffing levy applied to international passenger processing at non-designated airports
Develop a new joint border agency model for small, rapidly deployable teams of cross-trained officers for regional airports
Australia and New Zealand to build on experiences from the Cricket World Cup to develop joint visitor visas
New Zealand to offer visa waivers to subclasses of Australian visa holders
4 Strengthening Economic Relations between Australia and New Zealand, Australian Government Productivity Commission and Productivity Commission of New Zealand / Te K mihana Whai Hua o Aotearoa, December 2012
BRINGING OUR NEIGHBOUR CLOSER | 5

6 | BRINGING OUR NEIGHBOUR CLOSER
5 Cross border movement of people, draft supplementary paper to Strengthening Economic Relations between Australia and New Zealand, Australian Government Productivity Commission and Productivity Commission of New Zealand / Te Komihana Whai Hua o Aotearoa, December 2012
6 News release by Ian McPhee, Minister for Immigration and Ethnic Affairs, Canberra, 24 April 1981.7 Schengen Area (as of March 2014) comprises: Austria, Belgium, the Czech Republic, Denmark (excluding Greenland and the Faroe Islands), Estonia, Finland, France, (excluding overseas
departments and territories), Germany, Greece, Hungary, Iceland, Italy, Latvia, Liechtenstein, Lithuania, Luxembourg, Malta, the Netherlands (excluding Aruba, Curaçao, Sint Maarten and the Caribbean Netherlands), Norway (excluding Svalbard), Poland, Portugal, Slovakia, Slovenia, Spain (excluding Ceuta and Melilla), Sweden and Switzerland. Also extends de facto to Andorra, Monaco, the Vatican City and San Marino.
8 European Pact on Immigration and Asylum, Council of the European Union, September 20089 The Trans-Tasman Travel Arrangement, New Zealand Ministry of Foreign Affairs & Trade / Manat Aorere10 When talk of racism is just not cricket. Sydney Morning Herald, December 16, 200511 Telegram from Francis to Muldoon (No 1355), Canberra, 30 April 1981. Archives New Zealand / Te Whare Tohu Tuhituhinga 0 Aotearoa12 Strengthening Economic Relations between Australia and New Zealand, Australian Government Productivity Commission and Productivity Commission of New Zealand / Te K mihana Whai
Hua o Aotearoa, December 2012
Thanks to our shared history and deep intergenerational connections, Australia and New Zealand consider each other as family. In 1973 this special relationship led to the creation of a free travel zone that allowed for passport-free trans-Tasman travel for Australians and New Zealanders, as well as British citizens and those from Commonwealth Dominions.5 In that era, this accounted for the vast bulk of travellers and was, in essence, a risk-profile scenario where almost all passengers disembarking aircraft passed through no formalities.
Yet the family bonds have been weakened over the past three decades, commencing with the introduction in 1981 of passport checks for travel between the two countries in response to several high-profile drug smuggling and child abduction cases6 and followed by a tightening of biosecurity and immigration checks on New Zealanders.
This runs contrary to the experience elsewhere in the world, with friendly neighbours dismantling both travel and trade restrictions simultaneously. The European Union, for example, has reinforced its free trade zone with the Schengen Treaty that now affords passport-free travel to the residents of some 26 European countries and four micro states.7 Asylum and immigration policy lies outside this framework.8 The United Kingdom, while outside the Schengen area, nonetheless has its own Common Travel Area linking it with Ireland and smaller British Isles.
Travel formalities between neighbouring trading partners also often provide preferential treatment for each other. The USA, for example, has two complementary schemes in place with Canada and Mexico, allowing easier travel for those who pre-register, while the Eurasian Commission between Russia and its former Soviet satellites of Belarus and Kazakhstan allows for free movement between the three. Today eight
trade blocs have provisions for free movement of people (see map on page 7).
Australia and New Zealand are now out of step with this global trend. Despite New Zealanders having the right to live and work freely in Australia,9 it is harder to cross the Tasman now than prior to the signing of Australia-New Zealand Closer Economic Relations Trade Agreement (ANZCERTA) in 1981 (see Figure 1).
It was the politics of the time —chiefly the Australian opposition to the rebel South African rugby union tour of New Zealand in 198110—that led to free movement being omitted from the early talks on the ANZCERTA.11 Yet as the productivity commissions of each country recently found, unless today’s leaders commit to reopening the borders between Australia and New Zealand, the Closer Economic Relations treaty will remain incomplete.12
There is a political opportunity to once again take Australia’s bilateral relationship with New Zealand forward. New protocols could be signed that make trans-Tasman journeys appear to the traveller like a domestic trip, with technology, risk-profiling and data sharing behind the scenes ensuring both nations’ borders remain secure.
Border agencies on both sides of the Tasman already make assessments and recognise each other as low-risk origin points. Yet without a new, legal recognition of this, our airports and seaports are unable to reap the benefits and expedite passengers through border formalities.
In 2015, it is time to not only celebrate a centenary of the ANZAC friendship, but also celebrate over 30 years of free trade through a new push to restart the Australasian free travel movement of the 1970s.
tHE COmmON BORDER OBjECtIvE
COMMON TRAVEL AREA
EURASIAN ECONOMIC COMMUNITYUS BORDER PRECLEARANCE PROGRAM
CENTRAL AMERICA-4 BORDER CONTROL AGREEMENT
ANDEANCOMMUNITY
NORDIC PASSPORT UNION
SCHENGEN AREA
EAST AFRICAN COMMUNITY
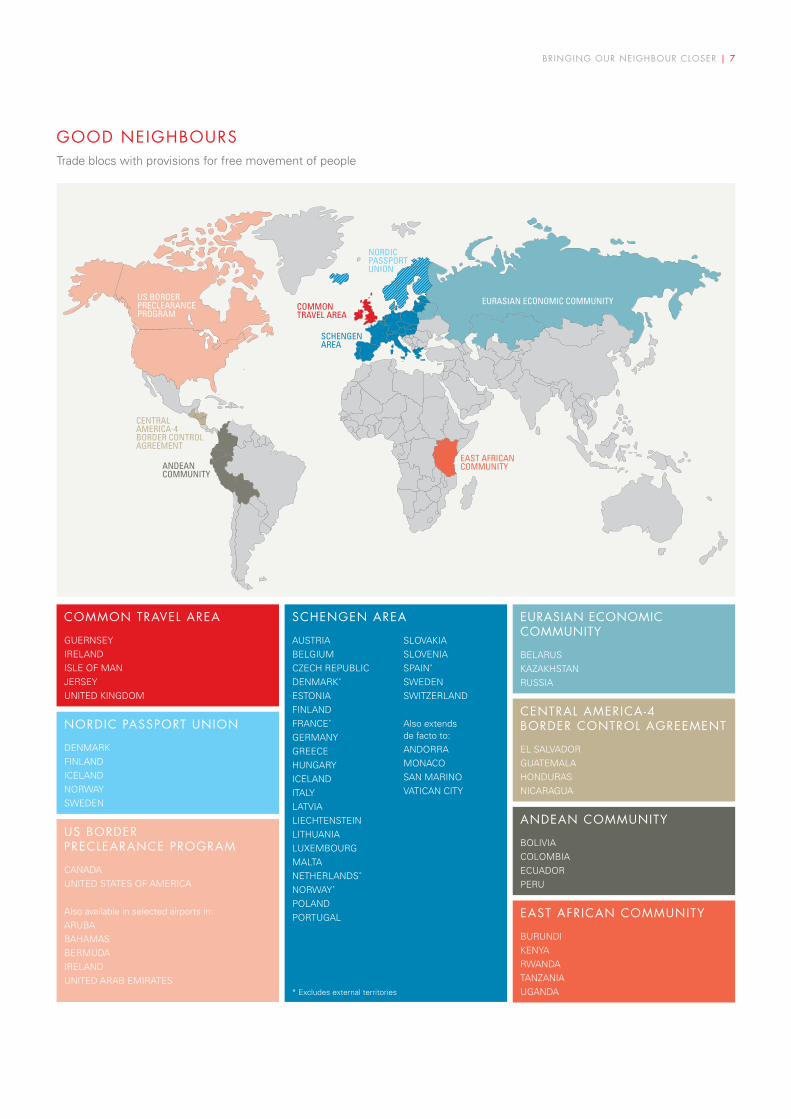
COmmON tRavEL aREa
GUERNSEYIRELANDISLE OF MANJERSEYUNITED KINGDOM
NORDIC PaSSPORt UNION
DENMARKFINLANDICELANDNORWAYSWEDEN
US BORDER PRECLEaRaNCE PROGRam
CANADAUNITED STATES OF AMERICA
Also available in selected airports in: ARUBABAHAMASBERMUDAIRELANDUNITED ARAB EMIRATES
SCHENGEN aREa
AUSTRIABELGIUMCZECH REPUBLICDENMARK*
ESTONIAFINLANDFRANCE*
GERMANYGREECEHUNGARYICELANDITALYLATVIALIECHTENSTEINLITHUANIALUXEMBOURGMALTANETHERLANDS*
NORWAY*
POLANDPORTUGAL
SLOVAKIASLOVENIASPAIN*
SWEDENSWITZERLAND
Also extends de facto to:ANDORRAMONACOSAN MARINOVATICAN CITY
EURaSIaN ECONOmIC COmmUNIty
BELARUSKAZAKHSTANRUSSIA
CENtRaL amERICa-4 BORDER CONtROL aGREEmENt
EL SALVADORGUATEMALAHONDURASNICARAGUA
aNDEaN COmmUNIty
BOLIVIACOLOMBIAECUADORPERU
EaSt aFRICaN COmmUNIty
BURUNDIKENYARWANDATANZANIAUGANDA
GOOD NEIGHBOURSTrade blocs with provisions for free movement of people
* Excludes external territories
BRINGING OUR NEIGHBOUR CLOSER | 7

8 | BRINGING OUR NEIGHBOUR CLOSER
POLIt ICaL SUPPORtOver the past 30 years, prime ministers of both countries have promoted the cause of an Australasian common border or easing travel restrictions. Some achievements should be celebrated, such as the advanced passenger processing (APP) protocols signed into law by the Howard government13 that laid the groundwork for a series of other minor reforms.
Credit should also be given to former Australian prime minister Kevin Rudd whose joint 2009 pledge with New Zealand Prime Minister John Key14 to “work towards full implementation of a new trans-Tasman passenger clearance model”15 led to the introduction of SmartGate self-service passport kiosks.
Prime Minister Tony Abbott has already recognised the need for Australia to continue down its path towards closer border integration with New Zealand. On the eve of a summit meeting with Mr Key in February 2014, the Prime Minister reconfirmed the special relationship.16
“ OUR RELatIONSHIP WItH NEW ZEaLaND IS L IkE NO OtHER. WItH tHE CENtENaRy OF aNZaC FaSt aPPROaCHING, [tHE vISIt By mR kEy] IS aNOtHER OPPORtUNIty tO REFLECt ON tHE UNIqUE BONDS tHat BIND OUR tWO NatIONS, OUR SHaRED HIStORy aND OUR COmmON vaLUES.” Hon Tony ABBoTT MP, FeBruAry 2014
The two leaders matched their words with action: the inbound clearance function performed by SmartGate will be matched by a self-service system for departure passport checks for trans-Tasman flights, with a trial starting in Brisbane in August17. The two prime ministers also launched a common visitor visa for the Cricket World Cup, which has been a key goal of TTF advocacy in the trans-Tasman arena.
The joint communiqué has reignited the trans-Tasman border objective at a time that it had stalled. For too long the objective of easier travel has been stalled by high-level talk of a true common border. Mr Abbott and Mr Key have now grasped the nettle of reform and look set on delivering more incremental steps along the path toward a “domestic-like passenger experience” that was outlined most comprehensively in a 2011 Australian government-commissioned roadmap.18
13 Hawke, Allan, The ANZAC Relationship, address to The Australian Institute of International Affairs, Canberra, April 200614 Joint Statement by Prime Ministers Rudd and Key, 20 August 2009, Australian Treasury Archive15 Plan will turn New Zealand flights into domestic bliss, Sydney Morning Herald, March 21, 200916 Press release. Prime Minister of Australia. Visit by New Zealand Prime Minister John Key, 3 February 201417 Joint Statement by Prime Minister Abbott and Prime Minister Key, Friday, 7 February 201418 Trans-Tasman Travel: Desired Future State Passenger Processing, Capgemini, 2011
Image courtesy of the Office of the Prime Minister

BRINGING OUR NEIGHBOUR CLOSER | 9
SUPPORt OF kEy StatE GOvERNmENtS aND tERRItORIES While border formalities remain a federal competence, there is growing appetite for reform from state governments, particularly those in New South Wales and Queensland, where the opportunity to open up regional airports to trans-Tasman flights presents the biggest opportunity.
The Australian Capital Territory government is devoting both time and money19 towards the effort to attract international carriers to Canberra Airport, with New Zealand identified as one of two likely initial destinations.20 While Canberra Airport has ensured infrastructure requirements of border agencies can be accommodated in its newly redeveloped terminal,21 the additional levy the airport would have to pass on to passengers for border agency staffing could jeopardise any new service’s viability.
New South Wales could expect to see New Zealander visitor numbers to its Hunter and Capital Country regions swell quickly if border restrictions were eased, as Newcastle and Canberra airports are both well advanced in plans to attract trans-Tasman flights. Acknowledging the potential for additional New Zealand visitors, the final report of the NSW Visitor Economy Taskforce recommended the state government support the introduction of a “common air border between Australia and New Zealand, which would result in significant opportunities for increased international flights to regional airports, particularly Newcastle.”22
The NSW government acted upon this recommendation in August 2013 through the grant of $11 million to fund the international terminal facility upgrades required at Newcastle Airport as part of the government’s Hunter Infrastructure Investment Fund.23
The Queensland government has specifically included New Zealand flights to regional airports in its state aviation plan.24 Part of this blueprint strategy will be to attract more New Zealand services to its existing international airports but also to trial international services to new airports not currently designated.
The state was very supportive of the 2012 trial to Sunshine Coast Airport from Auckland and was instrumental in gaining agreement from Air New Zealand to continue the seasonal service for three further years into 2017 and extend the period of operation to 28 weeks, with an extra flight
per week.25 The state government has offset the border agency staffing levy to level the playing field with southeast Queensland’s established international airports.
Although Tasmania has a similar appeal to that of New Zealand in visitors’ minds, there is likely to be sufficient traffic between Auckland and Hobart to support a direct service, if the barriers were lifted. The feasibility of direct international services will be more likely once the federal government-funded 500 metre runway extension is completed in 2016.26 Tourism Tasmania is currently writing its aviation strategy, which is likely to include New Zealand services as a priority primarily to attract nature-based dual destination itineraries.
Tourism Victoria has highlighted New Zealand as a potential growth market for weekend and short-break visitors from Auckland and Christchurch. An easing of border restrictions at Melbourne Airport and associated reduction in airline costs would assist in creating growth in the mature, price-sensitive New Zealand market. Additionally, Victoria has a stated objective to grow international services from Avalon Airport near Geelong, restated in its Tourism 2020 strategy document.27 In early 2014 the Victorian government committed an estimated $11 million to secure airline services at Avalon until 2015.28 As part of this strategy, international services are envisaged, with New Zealand a likely initial market.
Any change to the immigration and customs regulations between Australia and New Zealand should also benefit Norfolk Island (an external territory of Australia) and the Cook Islands (in free association with New Zealand), both of which have direct flights to Australia and New Zealand.
The Australian government is keen to grow tourism to Norfolk Island as part of an effort to rebalance the island’s moribund economy. In addition to direct financial assistance, the Department of Infrastructure and Regional Affairs also underwrites the air service linking Norfolk Island with Sydney. Despite this, air fares remain high in part due to the need to complete two sets of customs, immigration and quarantine formalities. The Norfolk Island Government is reviewing its immigration act29 and the eradication of pests30 is paving the way for Norfolk Island to be cleared as a pest and disease free territory for biosecurity purposes.
19 Budget Papers 2013-14, Australian Capital Territory Government, June 201320 Action Plan from ACT Aviation Taskforce Meeting, 18 April 2012 (Internal document)21 Media release. All dressed up and ready to go – Prime Minister Tony Abbott officially opens Canberra Airport, Canberra Airport 4 April 2014.22 Final report of the NSW Visitor Economy Taskforce, June 201223 Funding announcement makes Newcastle Airport expansion a reality, Newcastle Airport press release, April 201324 Queensland Tourism Aviation Blueprint to 2016, Tourism and Events Queensland Acquisition Group, July 201325 Media release, Air New Zealand flights to continue with extended seasons, Sunshine Coast Council, 9 December 201326 Martin, Hannah. Overseas visitors flock to Tassie as Qantas says Emirates partnership boosts global traffic to state’s shores. Hobart Mercury 2 April 201427 Victoria’s 2020 Tourism Strategy, State Government Victoria, July 201328 Media Release, Avalon’s future secure – growing tourism and building jobs for the Geelong region, The Hon Dr Denis Napthine MP, Premier of Victoria, 11 December 201329 Immigration (Amendment) Bill 2014 / Imagrieshan (Chienjen) Bil 2014, Explanatory Memorandum, The Government of Norfolk Island, 15 May 201430 Media Release Exotic Pest Alert: Potato-Tomato Psyllid , Update 1, The Government of Norfolk Island, 1 May 2014

10 | BRINGING OUR NEIGHBOUR CLOSER
Figure 1 Trans-Tasman travel – key dates
yEaR mEaSURE
1928 First successful trans-Tasman flight
1944 The Canberra Pact details areas of mutual interest including free travel
1973 Open door travel policy introduced between Australia and New Zealand
1981 Australia introduces requirements for passports for all arriving passengers including New Zealanders
1983 Australia New Zealand Closer Economic Relations Trade Agreement enters into force
1984 New Zealanders lose right to vote in Australia
1986 Revocation of automatic right to welfare benefits for New Zealanders in Australia
1994 Introduction in Australia of universal visa requirement leads to creation of New Zealand Special Category Visa
1996 Entry into force of Australia-New Zealand Single Aviation Market
1997 The Trans-Tasman Mutual Recognition Act on professional qualifications
2000 Restrictions to reciprocal welfare payments introduced in Australia and New Zealand
2000 Australia-New Zealand Open Skies treaty replaces bilateral air services agreements
2001 Bilateral Social Security Agreement leads to new resident visa for New Zealanders living in Australia
2004 New Zealand and Australian passport lines introduced at major airports
2007 SmartGate kiosks introduced in Australia for inbound processing of Australian citizens (pictured below)
2007 Entry into force of Australia-New Zealand Maritime Treaty affects trans-Tasman cruising itineraries
2007 Australian Government abolishes New Zealand permanent resident visas for skilled workers
2009 New Zealand passport holders eligible for SmartGate in Australia
2011 SmartGate kiosks introduced in New Zealand for outbound Australian and New Zealand citizens
2012 Trial of completing Australian formalities on departure from New Zealand using SmartGate
2013 Australia-New Zealand passport lanes at Australian airports broadened to include Papua New Guinea citizens
2013 UK and US citizens eligible for SmartGate passport processing
2014 Common visas for Cricket World Cup 2015 announced
2014 Trial of automated departure self-serviced passport kiosks for trans-Tasman
Image courtesy of ACBPS

BRINGING OUR NEIGHBOUR CLOSER | 11
the growth potential of tourism from New ZealandNew Zealand is the single largest visitor source market for Australia, with about 1.2 million visitors from New Zealand annually31. Flights from New Zealand bring close to one-fifth of total arrivals into Australia. On the New Zealand side the facts are even starker: more than two fifths of arrivals into New Zealand originate in Australia.32
New Zealanders are valuable visitors to Australia. There is a higher proportion of business travellers than from almost any other international market. There is also a large component of people visiting friends and relatives, the oft-forgotten segment of tourism that delivers benefits deep into communities outside major city centres.33
The same is true of dispersal. New Zealanders know Australia better than any other nationality of visitor and travel to more regions. New Zealanders’ familiarity with Australia makes them comfortable with self-drive and exploring the hidden destinations beyond the major centres. New Zealand residents also holiday in Australia year-round.
These factors combined continue to ensure that the New Zealand market is a very important one to the Australian tourism industry.
The trans-Tasman market does continue to grow, but at a much slower pace than other markets. The pure holiday component of the traffic has seen a slight decline over the past five years, even as other segments —such as visiting friends and relatives, business or employment travel— have continued to grow (see Figure 2).
The reasons for this lack of growth are varied and are a symptom of the market maturity. However, the lack of new options in Australia for New Zealanders has been identified as a factor by Tourism Australia, as has the growing competition Australia faces in the New Zealand market from increasingly accessible and affordable destinations in Asia and the Pacific.34 This is particularly true of Queensland destinations, whose competition now includes Bali and Hawaii as well as traditional New Zealander beach destinations of Fiji and the Cook Islands. For the first time in 21 years, Air New Zealand will scale back its service to Cairns to a seasonal one from November this year.35
Despite this, the New Zealand market presents low-hanging fruit for the Australian tourism industry. The sales and marketing networks are well established, there is an affinity for our country in New Zealand, and our program of sporting and cultural events make our cities attractive to New Zealanders. There is plenty of spare air capacity as well: it is a sad fact of the trans-Tasman aviation market that more than one million airline seats fly empty between our two countries every year.
The most comprehensive paper done in this field, prepared by consultants GHD for the Tourism Access Working Group through the former Australian Department of Resources, Energy and Tourism (RET), estimated the latent potential of the trans-Tasman market to be as large as 200,000 additional visitors per year.36 By 2020, this would create $370 million in additional expenditure in Australia by New Zealand tourists.37
A potential upswing of 14 per cent could only be met, the report found, if travel between the two countries were like a domestic journey, with no evident frontier checks and no international taxes or charges on airline tickets. This in turn would lead to market stimulation through lower fares, shorter travel times and the opening up of new destinations. The benefits would flow not only from additional visits by New Zealanders, but also by third country nationals taking up two-country itineraries, as has happened in the UK and Ireland.
For this reason, the goal of easier border crossings between Australia and New Zealand remains a core focus for the tourism and travel industries. This paper sets out the reforms needed to unblock the trans-Tasman pipeline and let the Australian tourism industry reap the benefits.
Figure 2 New Zealand arrivals by purpose of visit
tOtaL(000s)
HOLIDay(000s)
vFR(000s)
BUSINESS(000s)
FY 2013 1,173 468 390 208
FY 2014 1,203 468 423 210
FY 2015 1,245 486 434 220
FY 2016 1,281 502 445 223
FY 2017 1,313 519 455 226
FY 2018 1,340 533 463 227
FY 2019 1,367 547 471 229
FY 2020 1,397 562 481 230
FY 2021 1,428 577 491 232
FY 2022 1,460 593 502 233
FY 2023 1,492 609 513 235
FY 2003-2008 6.9% 8.1% 9.6% 7.4%
FY 2008-2013 1.1% -0.9% 4.4% -0.4%
FY 2013-2018 2.7% 2.7% 3.5% 1.8%
FY 2018-2023 2.2% 2.7% 2.1% 0.7%
Source: Tourism Research Australia (2014) - Tourism Forecasts, Autumn 2014
Note: All forward year projections are based on a business-as-usual scenario without the reforms laid out in this paper.
31 Australian Bureau of Statistics, Overseas arrivals and departures, Australia, cat. no. 3401.032 Statistics New Zealand / Tatauranga Aotearoa, International Travel and Migration, December 201233 Elisa Backer, VFR Travel: An Examination of the expenditures of VFR travellers and their hosts, School of Tourism and Hospitality Management, Southern Cross University, 2007,
Current Issues in Tourism, Vol. 10, Issue 434 New Zealand Market Profile, Tourism Australia April 2013.35 Air New Zealand press release. Northern Winter 2014-15 Schedule. 36 Trans-Tasman Project Final Report, GHD for the Department of Resources, Energy and Tourism (Tourism Division) June 201237 ibid

12 | BRINGING OUR NEIGHBOUR CLOSER
FaCtORS REStRICtING GROWtH IN tHE tRaNS-taSmaN maRkEt
Factor Description
Distance Even at the closest point, Australia is over 2000km from New Zealand. In classic airline marketing terms, this makes the eastern seaboard of Australia a medium-haul market for New Zealand. For Western Australia, the Northern Territory and South Australia, New Zealand is a long-haul source market.
Inconvenience Research shows that five hours’ travel time is a psychological barrier for those taking three or four night trips.38 International entry requirements and formalities, including long check-in times and strict security controls, are negative factors in deciding whether to travel to Australia from New Zealand.
Cost Australia is at least NZ$80 more expensive than any New Zealand domestic destination due to airline taxes and airport security charges. A recent Tourism Australia survey of travel intentions cited value for money as a motivator for 62 per cent of New Zealand respondents, the single biggest factor.39
Destination fatigue Another factor identified by Tourism Australia is destination fatigue. Many New Zealanders have already been to the key Australian cities and so the lure of the novel is missing. There is a sense that many New Zealanders have literally ‘been there, done that’ when it comes to Australia.
Duplicate visas Trans-Tasman flights often fly with many more empty seats than the global average.40 Unlike domestic legs in either country, airlines cannot sell seats as easily to third-country nationals due to visa restrictions. Open jaw and circle fares are popular among existing tourism markets, but dual-country itineraries are rarer among the emerging source markets of Asia.
Apart from distance, each of these demand-constricting factors can be overcome through government changes. This paper sets out some key reforms that will address each of these hurdles.
Reform 1 – Create a domestic-like travel experience Once longer check-in times and border formalities are taken into account, eastern Australia still lies outside the five-hour total travel time ‘sweet spot’ for short-break travel from New Zealand. The way we can break through this psychological barrier41 and induce demand for long weekends and shorter holidays is to streamline border processing at our major airports.
Reform 2 – Cut the departure tax to $25 New Zealand is Australia’s most price-sensitive inbound market,42 with every fluctuation in airfare directly linking to demand. The federal government-imposed $55 Passenger Movement Charge can represent around one-third of a one-way fare. This tax should be no more than $25.
Reform 3 – Open additional points of entryGlobally, new markets are being developed by direct flights serving regions previously served by connecting flights.43 For Australia to grow the New Zealand market, it will also need to offer new product in the form of new destinations. A new, low-cost passenger processing model for regional airports must be developed to open up additional points of entry and refresh Australia’s product offering.
Reform 4 – Develop common visitor visasAs the emerging markets of Asia move from all-inclusive packages to fully independent travel, Australia and New Zealand need to work together to ensure we are an attractive dual-country destination. To do so, we need to build on the work being undertaken for the Cricket World Cup 2015 and offer common visitor visas.
38 Pike, Steven. Destination Marketing Organisations, Routledge, June 201339 Understanding the NZ Consumer, BDA Marketing Planning for Tourism Australia, April 201340 Press release. Passenger Demand Maintains Historic Growth Rates in 2013. International Air Transport Association. February 2014.41 Sharma, KK The macroperspective of international short breaks, Tourism and Development, Sarup & Sons 2005 p6942 Factors affecting the inbound tourism sector, Tourism Research Australia, Department of Resources, Energy and Tourism, June 201143 Johnston, Marsha W. Tomorrow’s Airline Industry: Hub-and-spoke or point-to-point? Global Business Journal 7, Association of Corporate Travel Executives

44 Travel by Australians, Quarterly results of the National Visitor Survey, June 2013, Tourism Research Australia45 Qantas and Emirates trans-Tasman alliance in the hands of New Zealand’s Transport Minister, CAPA Centre For Aviation 28 January 201346 Press release. Passenger Demand Maintains Historic Growth Rates in 2013. International Air Transport Association. February 2014 47 Grow sustainable air connectivity – Tourism 2025 – Growing Value Together / Manaakitanga 2025 – Whakatipu Uara Ngätahi, Tourism Industry Association New Zealand, March 2014
The vast majority of arrivals from New Zealand do so at four international airports: Brisbane, Gold Coast, Melbourne, and Sydney. If we want to bring our two countries closer together, we need to reduce the total travel time between these airports and their New Zealand origin or departure points.
In many ways New Zealand behaves like a domestic tourism market. Tourism Australia and eastern Australian state tourism organisations market to New Zealand as if it were an Australian state; such is the familiarity of New Zealanders with Australia. But viewed in this context, New Zealand underperforms as New Zealand residents only take around half as many trips to Australia as Australians take interstate trips.44
The Tasman does not suffer from a lack of air capacity, thanks chiefly to a highly liberalised market.45 With up to seven airlines competing on the trans-Tasman, there are tens of thousands of airline seats available every week. However, with load factors some ten percentage points lower than the global average,46 airlines are keen to find ways to secure sustainable growth without additional investment.47 By removing the barriers to growth that currently exist in the form of frontier checks, airline could maximise their existing air capacity and still grow traffic.
Figure 3 Air capacity to Australian destinations from New Zealand, 2013
aIRPORt OF aRRIvaL PaSSENGERS SHaRE avaILaBLE SEatS SHaRE LOaD FaCtORS
Sydney 1,160,323 39.9% 1,781,285 42.7% 65.1%
Melbourne 738,483 25.4% 1,041,565 25.0% 70.9%
Brisbane 681,390 23.4% 937,864 22.5% 72.7%
Gold Coast 164,905 5.7% 210,981 5.1% 78.2%
Perth 85,486 2.9% 107,213 2.6% 79.7%
Adelaide 33,965 1.2% 49,308 1.2% 68.9%
Cairns 34,901 1.2% 30,344 0.7% 115.0%
Norfolk Island 5,169 0.2% 8,992 0.2% 57.5%
Sunshine Coast 2,864 0.1% 5,712 0.1% 50.1%
Total 2,907,486 100% 4,173,264 100% 69.7%
Source: Bureau of Transport, Infrastructure & Regional Economics (2014), International Airline Activity – City Pairs Data And International Airline Operated Flights and Seats
REFORm 1 a DOmEStIC-LIkE tRavEL ExPERIENCE

14 | BRINGING OUR NEIGHBOUR CLOSER
ExamPLES OF LatENt vISItOR DEmaND FROm NEW ZEaLaND
CONFERENCE DELEGatESThe meetings, incentives, conferences and exhibitions market in the Hunter Valley struggles to attract Australasian events due to lack of direct air links from Auckland to Newcastle. A two-hour drive from Sydney is incompatible with two- or three-day events.
GOvERNmENt tRavELLERSThere is demand for intergovernmental traffic to Canberra from Wellington. Canberra is one of only a handful of national capitals not to have international flights, the others being either micro-states like Andorra or the Vatican City or countries with new capitals, like Bolivia and Belize. In its attempt to rectify this situation, the Australian Capital Territory government has prioritised New Zealand as one of the first international destinations for international flights from Canberra International Airport.
RESOURCES WORkERSTownsville Airport and Mackay Airport could facilitate many more resources workers than currently if they had direct flights from both North and South Island New Zealand labour markets.
HIGH-END tRavELLERSDirect services from Auckland to Hamilton Island would cater to a small but important niche of New Zealand travellers. Even if payload-restricted (due to the island’s short runway), a twice-weekly flight would attract sufficient high-end visitors to make it viable.
PROFESSIONaL COUPLESThere is an emerging travel trend for short breaks, especially among the professional class in Auckland, Christchurch and Wellington. Australia’s major cities such as Brisbane, Melbourne and Sydney are well placed with their events calendars to attract much of this new market.
SUN SEEkERSAs has been demonstrated by the winter trial services from Auckland to Sunshine Coast Airport (Maroochydore), there is significant demand from New Zealander to visit sunny destinations in northern New South Wales and Queensland, especially during the winter months.
$

BRINGING OUR NEIGHBOUR CLOSER | 15
tHE 5-HOUR tRIP GOaLShort breaks have proved to be a high growth area in European tourism markets.48 These short-break visitors are particularly valuable, as there is little displacement effect in the trips, which are taken year-round and in addition to other holidays.
But while Tourism Australia has worked with state tourism organisations to develop urban and hinterland short-stay itineraries under the Three Great Days marketing campaign,49 to date most activity around the short breaks has been focused on domestic travellers due to New Zealand lying outside the optimum travel time for short breaks.
Despite flight times a little over as three hours, 90-minute bag check- in minima for international flights50 coupled with entry controls typically take the total trip time to six hours. This lies outside the standard industry accepted definition of short break travel time.51
To give one example, the Eurostar high speed train has a journey time from London of two hours to Brussels and two hours and 15 minutes to Paris. The immigration and customs authorities in Belgium, France and the UK agreed to cooperate and juxtapose controls to each other’s territories, allowing passengers to clear both countries’ formalities at check-in.52 This has allowed check-in times to be reduced to 30 minutes and eliminate arrivals controls, allowing for a total journey time under three hours. In understanding the enormous shift in consumer behaviour towards short-breaks to Paris or Brussels that has taken place over the past decade, the stimulation effect presented by the direct train
link has been more than doubled by the psychological impact of increased ease-of-travel.53
One area that illustrates the trans-Tasman potential is around sporting events. Beyond the high profile Bledisloe Cup that is played as part of the Rugby Championship and the Cricket World Cup taking place in 2015, trans-Tasman sporting cooperation extends to almost every Australian sporting league. The Trans-Tasman Netball League features equal numbers of teams from each country, while the Australian Rugby League, the Australian National Basketball League and the A-League each feature one New Zealand side, while V8 Supercars has had a New Zealand race on its calendar since 1992.
These events do not necessarily reach their full potential in terms of visiting spectators. To take one example of the potential, looking at the attendance figures of the five New Zealand teams competing in the Super Rugby championship, when playing another New Zealand team, around one-third of spectators are away fans, who have travelled domestically within New Zealand.54 However, at games played between a New Zealand team and one based in Australia, this figure drops to around 20 per cent.55
Cultural events too represent a huge opportunity for the short-break market. Concert promoters will take the largest global acts to Auckland, but not the smaller ones. This leaves many New Zealand-based fans with the choice usually of Brisbane, Melbourne or Sydney to see their favourite bands.56 In Europe, low- cost airlines actively target the youth demographic for concert-related short-break travel.57
48 Lohmann, Martin. New Demand Factors in Tourism, Institut für Tourismus- und Bäderforschung in Nordeuropa. Paper presented to the European Tourism Forum. Budapest, October 200449 Short Breaks in Australia, Tourism Australia 201350 International Check-in Times, Qantas.com51 Murphy, Peter (with Niininen, Outi and Sanders, Dale), Short-Break holidays – a Competitive Destination Strategy, CRC for Sustainable Tourism 201052 An Inspection of Juxtaposed Controls, John Vine CBE QPM, UK Independent Chief Inspector of Borders and Immigration, March 201353 De Lombaerde, Philippe; Flores, Renato; Iapadre, Lelio & Schulz, Michael. The Regional Integration Manual: Quantitative and Qualitative Methods. Routledge54 Who gets the crowds: Super Rugby attendance trends, Green & Gold Rugby, September 201255 Super Rugby crowd numbers hit 500,000 after round four, The Roar, Super Rugby 2013 round 4 attendance data (source: South Africa, New Zealand and Australia Rugby (SANZAR)),
analysed by blogger BiltongBek56 LeBlanc Larry, Industry Profile: Michael Chugg, Celebrity Access MediaWire. February 200957 Boost for European festival-goers as Ryanair announce new routes, Hot Press, Dublin June 2012
Image credit: ANZ Championship

16 | BRINGING OUR NEIGHBOUR CLOSER
tECHNOLOGy CaN BRING OUR NatIONS CLOSER tOGEtHERWith shorter check-in and exit formalities from New Zealand coupled with a swifter entry into Australia, the five-hour travel time target could be achieved for trans-Tasman flights. This will require a further move towards risk profiling and away from mandatory screening.
Both the Australian Customs and Border Protection Service and New Zealand Customs are already committed to moving further down their paths of intelligence-led, risk-based passenger processing. This approach drives resourcing decisions and means identifying the areas of highest risk and only intervening where there is a threat to the border.58 As has been demonstrated before, arrivals from New Zealand present a low-risk environment to implement new passenger processing initiatives.
Viewed through the prism of market segmentation, New Zealand residents are Australian tourism’s most loyal customers. Over 94 per cent of New Zealand visitors to Australia are repeat visitors59 and around a fifth of New Zealand visitors to Australia do so more than once a year. By rewarding its most loyal customers, Australia can leverage brand loyalty, but in security terms it means border agencies have a far clearer picture of who is entering the country than for any other country.
Thus using both pre-embarkation checks performed in New Zealand and reusing passenger profiles for return visitors, data can be used to guide decisions for Australian border agencies. Both sides share data and collaborate extensively so the next step is to formalise this arrangement into some concrete and visible reforms. Additionally, the greater use of technology, once capital costs are set aside, will allow for savings to be passed on to customers in the form of lower departure taxes.
The use of risk-based passenger processing is in line with the first of nine principles of completing the Australia-New Zealand Single Economic Market, as laid down by prime ministers Key and Rudd in 2009.60
“ PERSONS IN aUStRaLIa OR NEW ZEaLaND SHOULD NOt HavE tO ENGaGE IN tHE SamE PROCESS OR PROvIDE tHE SamE INFORmatION tWICE.”
Currently, however, travel between Australia and New Zealand typically involves 17 checkpoints or other government-mandated process, three more than the 14 considered standard for international travel by the International Air Transport Association.61 Capgemini’s trans-Tasman model, the Desired Future State Passenger Processing, places greater emphasis on unobtrusive background checks by government agencies as a way to reduce the number of physical steps.
Increasing the level of certainty about the risk that passengers represent as early as possible would enable border agencies to make risk-based intervention decisions.62 It also enables passengers who pose no risk to move through the border processes more quickly. The Australian Customs and Border Protection Service’s Blueprint for Reform 2013-2018 envisages legitimate passengers having very limited contact with a human officer in the future.63
As the service progresses with reforms, it would make sense to pilot new technological reforms on New Zealand, where well-developed cooperation and trust will allow for significant trials. However, rather than being the de facto situation, it would be symbolic to announce New Zealand as the official partner on many programs, as with Smartgate self-service passport kiosks.
The two parts of this reform cover exit controls of passports and inbound quarantine checks. Each is discussed in more detail on pages 18 and 21.
58 2012–13 Australian Customs and Border Protection Service Annual Plan. Canberra 201259 Mapping Australia’s Aviation Markets – July 2012 Update, Tourism Access Working Group60 Joint Statement by Prime Ministers Rudd and Key, 20 August 2009, Australian Treasury Archive61 Trans-Tasman Travel: Desired Future State Passenger Processing, Capgemini, Version 1.02. August 201162 Australian Customs and Border Protection Service Annual Report 201163 Blueprint for Reform 2013-2018, Australian Customs and Border Protection Service, 2013

BRINGING OUR NEIGHBOUR CLOSER | 17
NEW ZEaLaNDERS’ tRavEL tO aUStRaLIa
NEW ZEaLaND IS tHE SINGLE LaRGESt vISItOR SOURCE maRkEt FOR aUStRaLIa, WItH 1.2 mill ion vISItORS FROm NEW ZEaLaND INtO aUStRaLIa IN 2013.
NEW ZEaLaNDERS REPRESENt over one-fifth of total arrivals INtO aUStRaLIa – aLmOSt tHE SamE aS tHE NExt BIGGESt tWO maRkEtS (CHINa aND Uk) COmBINED.
NEW ZEaLaND RESIDENtS aRE aLSO vERy HIGH REPEat vISItORS, WItH 94 per cent OF aLL aRRIvaLS FROm NEW ZEaLaND HavING BEEN tO aUStRaLIa BEFORE.
NEW ZEaLaNDERS aRE mORE L IkELy tHaN OtHER NatIONaLItIES tO BE BUSINESS vISItORS, WItH SOmE 18% of all arrivals travelling on business , COmPaRED WItH aN avERaGE OF 13%.
tHE avERaGE LENGtH OF Stay OF a NEW ZEaLaND RESIDENt IS 14 nights.
one third OF aLL tRaFFIC IN BOtH DIRECtIONS IS FROm tHOSE vISItING FRIENDS aND RELatIvES (vFR), a HIGHER PROPORtION tHaN BEtWEEN OtHER SOURCE maRkEtS. WHILE vFR tRavELLERS may SPEND LESS PER Day, tHIS IS COmPENSatED By LONGER Stay DURatION aND mORE FREqUENt tRIPS. aLSO SPENDING By HOStS IS OFtEN CONSIDERaBLE.
60%other 19%
new Zealand
11%china
10%united Kingdom

18 | BRINGING OUR NEIGHBOUR CLOSER
automated departure controls at major airportsAustralia is unusual in having emigration controls in addition to immigration controls.64 The human check on persons exiting against an alert list has developed over time, but was always chiefly a law enforcement function delegated to Customs by around 30 state and federal agencies serving departure prohibition orders (DPOs).
But DPOs are a tool of the last century. Technology has allowed more offenders to be intercepted onshore. The policy rationale behind these has diminished over time.
The use of Customs officers to perform the function of checking passengers’ right to fly is inefficient in the digital age. Officers no longer stamp passports on exit and there is a strong case to be made for the full automation of departure controls at major airports. This reality was recognised by New Zealand in 2012 when it extended SmartGate self-
service passport kiosks to outbound processing and is being tested by the Australian government in 2014 with a trial of two kiosks. The results should lead to automated departure control by 2015.
Under the automated scenario, airline check-in would be cross referenced with the no-fly list (the list of DPOs) or other lists of persons of interest. A database holding biometric and biographical data verifies legal departure. In the case of departure being denied, police would be alerted to detain or question. If a foreign national fails to exit and overstays their visa, that data would be added to a national criminal database with appropriate follow-up. For this automation of outbound controls to be feasible, trans-Tasman work on extending the advance passenger information system (APIS) to outbound must be completed.
kEy aGENCIES SERvING DEPaRtURE PROHIBIt ION ORDERS
Agency Reason
Attorney-General’s Department
Exit checks were bolstered during the 1980s as a measure to stop international parental child abductions. While this remains an issue, a raft of additional onshore legislation has reduced reliance on departure checks.65
Australian Crime Commission
Those with debts to the Australian Taxation Office,66 those involved in serious fraud, drug trafficking or sex crimes can also be served a DPO and prohibited from leaving the country.67 Again, with financial information now digitised, rates of interception are very low.
Department of Human Services
Child support decisions can include raising DPOs on child support debtors. A 2009 review led to a sharp reduction in the rates of interception.68
Australian Federal Police Law enforcement agencies also have an interest in the ability to prevent wanted radicals from exiting the country.69 This counterterrorism function is core to the Australian Federal Police’s presence at airports but does not rely solely on intercepting persons of interest at the outbound Customs desk.
64 Harzig, Christiane and Hoerder, Dirk. What is Migration History? John Wiley & Sons, April 201365 Stronger laws to deal with international child abduction, Joint Media Release by Attorney-General Hon. Robert McClelland MP and Minister for Families, Housing, Community Services and
Indigenous Affairs, Hon. Jenny Macklin MP. 19 September 201166 Taxation Administration Act 1953 - Sect 14s67 Australian Crime Commission Act 200268 Prof. McMillan, John, Administration of Departure Prohibition Order Powers of the Child Support Agency, the Commonwealth Ombudsman, June 200969 The Politics and Practicalities of Exit Controls, Center for Immigration Studies Symposium, Washington DC, August 2010

BRINGING OUR NEIGHBOUR CLOSER | 19
Through the APIS, international airlines are currently required to submit passenger name and passport details to government agencies before their arrival in Australia. Border agencies then use the data for advance passenger processing of arriving travellers.70
However the system is not currently in place for outbound checks performed by Australian airlines for flights to New Zealand. Data sharing protocols are in train and should be prioritised to ensure that the APIS can allow technology and data profiling to automate the exit controls for trans-Tasman flights from Australian major airports.
To overcome the anomaly of New Zealanders being the only nationality able to arrive in Australia without having previously
submitted their details to Australian authorities, access to New Zealand criminal history checks by Australian police forces would be required. Although relatively simple from a technology point of view, data privacy concerns have to be addressed.71
There has been a trial taking place between the New Zealand Ministry of Justice and Queensland Police over criminal history checks for government agency and childcare workers. This trial was extended until July 2013 and the results are now being validated.72 If successful, the program could roll out to all other states. New Zealand Police became an accredited data partner of the Australia Federal Police database CrimTrac, which coordinates state-based criminal records databases.
70 Managing Australia’s Borders - Advanced Passenger Information (API). Department of Immigration and Citizenship71 Privacy Impact Assessment: Report on the Trans-Tasman Criminal History Information Sharing Trial, New Zealand Ministry of Justice / Tahu o te Ture, Wellington January 201372 Privacy Impact Assessment, Trial exchange between the Government of New Zealand and the Government of Australia of criminal history information for vetting purposes,
Attorney-General’s Department, 2013

20 | BRINGING OUR NEIGHBOUR CLOSER
An extension of this kind of criminal records sharing would be to allow border agencies access to the New Zealand Ministry of Justice criminal records case management system and grant reciprocal access to CrimTrac for New Zealand authorities.
A further reason for controls on exit is to ensure security within the airside section of international airports by restricting entry to those boarding flights. This leads to the requirement to sight boarding passes to permit entry into the sterile area. But this task can be transferred to the security screeners, as has happened in the UK, where airlines are responsible for ensuring passengers have the right to travel and then airport security screeners allow only those who have been cleared by the airline.
At London Heathrow, e-gates scan boarding cards that are checked against passenger name record databases, which are in turn linked to immigration files.
The collection of outgoing passenger cards, essential for the creation of statistics, would have to be addressed in this scenario. At present there is some anecdotal evidence that only a small proportion of cards collected by Customs are analysed. This would validate a move to a randomised sampling of departing passengers, as happens in many other countries.
The legal questions and declarations could be built into airline booking processes, or collected at check-in for example, as has happened in New Zealand where a simplified departure card was introduced in early 2014.73 As an interim measure, until APIS transfer is completed, airline kiosks could pre-populate and print out departure cards that are collected by airline employees at the gate alongside boarding card checks.
These issues and others will be addressed by the trial of automated departure gates in Brisbane from August 2014. The initial focus of this trial will be trans-Tasman travellers and the results will be used to formulate the automation processes going forward.
It is right that the trans-Tasman should be used as the test case for these reforms, allowing departing passengers travelling to New Zealand to bypass the Customs checkpoint at major airports and go straight to security. A “New Zealand departures” lane at major Australian airports would be similar to the “EU departures” lane at most European Union airports. The precedent would be the domestic departure procedure through the exit checks for those travelling on a domestic leg of an international flight.
At those airports with combined international and domestic terminals, it would also allow for a reduction in Customs staffing at departure times for flights to New Zealand with the benefit of higher staffing levels at busier long-haul international flight departure times.
DUty FREE SaLESAs outbound controls are automated, there would be no impact on duty free sales. All persons leaving Australia have the right to purchase goods free of duty and other taxes if they are for use outside Australia. Duty free legislation describes export verification as exiting Australian territory. Therefore, even under the ultimate goal of a common external border, duty free sales of liquor and other goods would still be possible.
Under the scenario where New Zealand flights depart or arrive from Australian domestic terminals, as foreshadowed in airport master plans, duty free shops would also be possible, with prices reflecting either duty-paid for domestic departures or duty-free for international departures (including New Zealand). Delivery of duty free at the gate might be required to eliminate the possibility of New Zealand-bound passengers passing duty free to domestic passengers.
73 New Zealand arrival and departure information: Consultation. Statistics New Zealand / Tatauranga Aotearoa, Wellington February 2013
Image courtesy of Sydney Airport

BRINGING OUR NEIGHBOUR CLOSER | 21
Dedicated tasman quarantine direct exit channelAt Australia’s international airports, inbound passenger processing at the primary line has been expedited by SmartGate self-service passport control kiosks. The average time from aircraft arrival to clearing the primary line has dropped from 20 minutes in 2009 to 16 minutes in 2012.74
However, the secondary screening line, where the border agencies question passengers and search baggage, remains a time impediment for travellers from New Zealand at Australian airports.75 Of acute concern are business travellers with hand baggage only.
Reforms to the biosecurity regime in both countries have already led to significant reductions in time for most trans-Tasman travellers. Much of this has been achieved as customs and biosecurity agencies on both sides of the Tasman have moved away from mandatory screening towards risk-based profiling. Risk typically covers those areas of interest for national security, immigration or biosecurity.
New Zealanders and passengers of other nationalities who have previously spent time in New Zealand (as opposed to
transit passengers) are considered low-risk by biosecurity authorities. This has allowed for one innovation in the arrivals hall, the direct exit door. Rather than subject passengers to mandatory screening of bags, officers now question arriving passengers in the baggage reclaim area and allow those of low quarantine risk to exit the baggage hall directly, in what is known by border agencies as a ‘free run’. Most arrivals from New Zealand now currently get a free run, avoiding the baggage x-ray machines.
Lower intervention with low-risk passengers has allowed more resources to be dedicated to high-risk passengers. A recent study found that 93 per cent of biosecurity officers believed this type of risk profiling to be either very effective or sometimes effective.76 The study goes on to prove the officers’ hunch: over the first six months of 2011, the rate of non-compliant passengers at Perth International Airport was no different in the peak period of January and the off-peak month of June, despite the quieter month having roughly double the number of manual inspections by the then Australian Quarantine Inspection Service.
74 Minutes of the National Passenger Facilitation Committee, meeting 18, 4 July 201375 Pitchforth, Jegar and Wu, Dr Paul, Complex Systems Performance Framework Trial: Prototype Inbound Passenger Facilitation Model Final Report, Airports of the Future Project, Queensland
University of Technology 201376 Ducie, Joseph Daniel, Risk-Based Intervention Profiling in Complex Environments (Impacted by Time-Restricted Conditions), Faculty of Computing, Health and Science, Edith Cowan
University, Perth, 2011
22 | BRINGING OUR NEIGHBOUR CLOSER
tHE ‘aRRIvaLS FROm NEW ZEaLaND’ LaNE
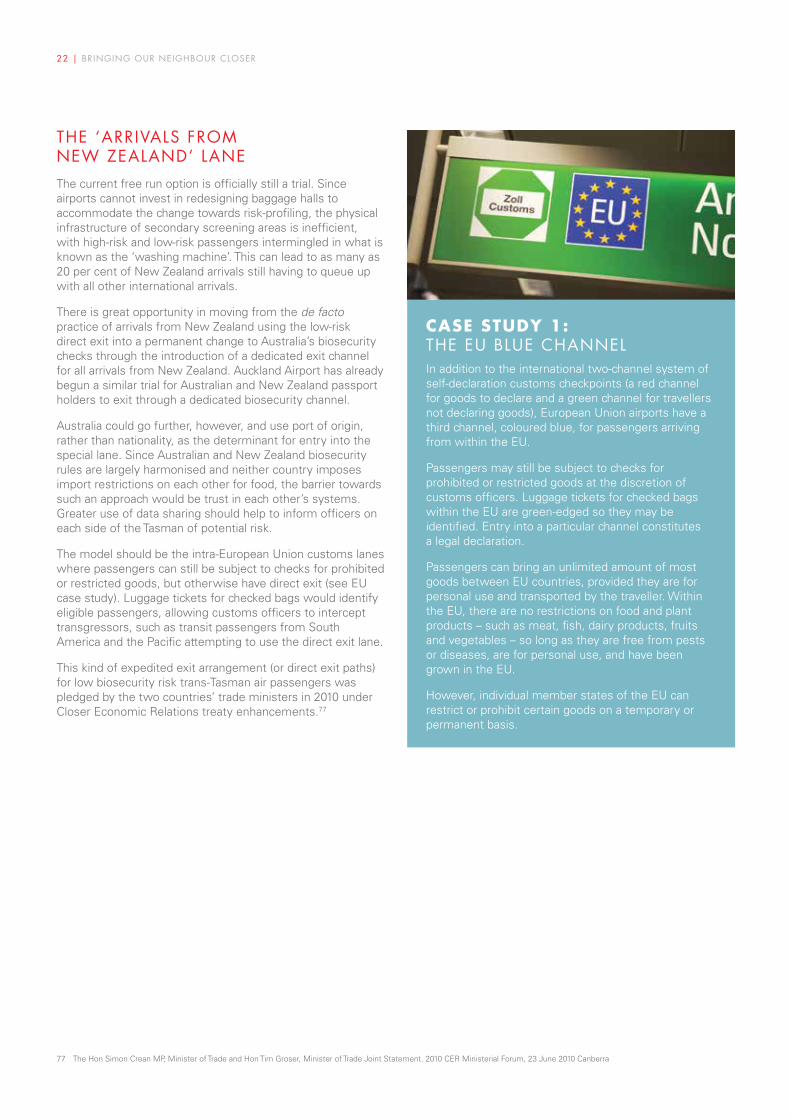
The current free run option is officially still a trial. Since airports cannot invest in redesigning baggage halls to accommodate the change towards risk-profiling, the physical infrastructure of secondary screening areas is inefficient, with high-risk and low-risk passengers intermingled in what is known as the ‘washing machine’. This can lead to as many as 20 per cent of New Zealand arrivals still having to queue up with all other international arrivals.
There is great opportunity in moving from the de facto practice of arrivals from New Zealand using the low-risk direct exit into a permanent change to Australia’s biosecurity checks through the introduction of a dedicated exit channel for all arrivals from New Zealand. Auckland Airport has already begun a similar trial for Australian and New Zealand passport holders to exit through a dedicated biosecurity channel.
Australia could go further, however, and use port of origin, rather than nationality, as the determinant for entry into the special lane. Since Australian and New Zealand biosecurity rules are largely harmonised and neither country imposes import restrictions on each other for food, the barrier towards such an approach would be trust in each other’s systems. Greater use of data sharing should help to inform officers on each side of the Tasman of potential risk.
The model should be the intra-European Union customs lanes where passengers can still be subject to checks for prohibited or restricted goods, but otherwise have direct exit (see EU case study). Luggage tickets for checked bags would identify eligible passengers, allowing customs officers to intercept transgressors, such as transit passengers from South America and the Pacific attempting to use the direct exit lane.
This kind of expedited exit arrangement (or direct exit paths) for low biosecurity risk trans-Tasman air passengers was pledged by the two countries’ trade ministers in 2010 under Closer Economic Relations treaty enhancements.77
CASe STuDy 1: tHE EU BLUE CHaNNEL In addition to the international two-channel system of self-declaration customs checkpoints (a red channel for goods to declare and a green channel for travellers not declaring goods), European Union airports have a third channel, coloured blue, for passengers arriving from within the EU.
Passengers may still be subject to checks for prohibited or restricted goods at the discretion of customs officers. Luggage tickets for checked bags within the EU are green-edged so they may be identified. Entry into a particular channel constitutes a legal declaration.
Passengers can bring an unlimited amount of most goods between EU countries, provided they are for personal use and transported by the traveller. Within the EU, there are no restrictions on food and plant products – such as meat, fish, dairy products, fruits and vegetables – so long as they are free from pests or diseases, are for personal use, and have been grown in the EU.
However, individual member states of the EU can restrict or prohibit certain goods on a temporary or permanent basis.
77 The Hon Simon Crean MP, Minister of Trade and Hon Tim Groser, Minister of Trade Joint Statement. 2010 CER Ministerial Forum, 23 June 2010 Canberra

BRINGING OUR NEIGHBOUR CLOSER | 23
SELF -DECLaRaNt LaNES: INSPECtION By ExCEPtIONUnlike the current situation where every passenger is questioned by a biosecurity officer prior to exiting, the Arrivals from New Zealand lane would see intervention by exception. Only those passengers profiled by Customs or the Department of Agriculture as risks would be subjected to x-rays or physical bag searches.
Another global example of this kind of lane are the self-declarant lanes through US customs for pre-enrolled Canadian citizens through the Nexus78 program or the similar Secure Electronic Network for Travelers Rapid Inspection (SENTRI) for Mexican nationals. Both schemes combine dedicated e-passport kiosks with direct exit lanes out of the customs hall, but are geared according to the risk associated with the respective origin country. The use of the radio frequency identification (RFID) chips on the Nexus and SENTRI cards allow US border agents to preview a traveller’s personal data as they walk or drive through the border checkpoints.79
In the Tasman space, entry into the direct exit lane could be construed as a legal declaration through a change to regulation. Those airports with significant arrivals from New Zealand would welcome the opportunity to reduce the footprint taken up by border agencies through the introduction of direct exit paths over the longer term.
To help officers easily identify New Zealand originating luggage, a coloured strip down either side of the baggage tag would be required. A similar requirement exists both in the EU for intra-EU flights (green edging) and also in the US for bags tagged at self-service kiosks (purple). In this regard, the relevant software updates for bag tag printers has already been developed and would not impose a significant cost to airlines.
As airlines, led by Qantas, move away from paper bag tags towards permanent RFID bag tags, near-field readers would alert customs officers of the presence of non-compliant passengers in the new exit channel. Another innovation is the use of self-service bag drop on the Tasman, pioneered by Air New Zealand,80 which uses a paper bag tag in order to comply with New Zealand Customs regulations. An interim solution, recently unveiled by Spanish carrier Iberia, is the RFID print-out card that accompanies the airline systems’ RFID with a physical tag for Customs purposes.
In order to maximise the efficiency of such a self-declarant exit channel, airports would prioritise baggage coming from New Zealand. Although currently the longest delay in the international arrivals process is often baggage reclaim,81 the major airports have all committed to investing in technology that prioritises bags from certain flights.
78 Formerly known as: The North American Free Trade Agreement (NAFTA) Entry eXpedition into the US program79 Muller, Benjamin J. “Unsafe at any speed? Borders, mobility and ‘safe citizenship,’ Citizenship Studies, 14(1), February 2010 pp75-88.80 Air New Zealand. International Check-in81 Processing passengers faster at airports (chapter 5 of Realising benefits from six public sector technology projects). Controller and Auditor-General New Zealand / Tumuaki o te Mana
Arotake, Wellington November 2012

24 | BRINGING OUR NEIGHBOUR CLOSER
LoW rISK, BuT noT no-rISK ExamPLES OF NEW ZEaLaND BIOSECURIty RISkS tO aUStRaLIa• Honey bee mite (Varroa destructor) is a parasitic
mite that attacks European honey bees in New Zealand. Risk is in home-produced honey.
• Fire blight (Erwinia amylovora) is a contagious disease affecting apples, pears and other orchard fruits. Risk is highest in home-grown apples and pears.
• Rock snot (Didymosphenia geminate) is a freshwater algae found in New Zealand rivers. Risk is from anglers’ footwear.
• Traditionally-grown Pacific Island taro can have both taro planthopper (Tarophagus proserpina) and taro leaf blight (Phytophthora colocasiæ). Risk is in domestically grown tubers.
In all these cases, commercially-grown produce is not the risk. The Department of Agriculture believes greater education at time of ticket purchase could significantly reduce the numbers of travellers bringing home-grown produce with them.
The Department of Agriculture estimates that over 99% of visitors to Australia pose no biosecurity risk, but some 40% of passengers declare an item that requires investigation (typically pre-packaged food).82 Flights from New Zealand pose the lowest threat to biosecurity of all origin points, but some risks remain (see box left). This remaining risk can be mitigated in the following ways:
1. The extension of advance passenger processing (APP) on departure, coupled with improved risk profiling to better distinguish between high and low risk passengers, will provide biosecurity officers the chance to better identify persons of interest on flights from New Zealand. Typically these would be passengers who have engaged in fishing or rural activities, or who are attempting to bring in home-grown produce.
2. Since New Zealand arrivals also have a very high compliance rate, the few cases of biosecurity risk introduced each year tend to be inadvertent. To combat this, providing more information on the kind of foodstuffs and plants prohibited in Australia at time of ticket purchase or check-in would further minimise the chance of non-compliance. Air New Zealand does so for tickets to New Zealand.
3. Technology can assist in the crime prevention element of secondary screening through the electronic transfer of pre-flight baggage x-rays performed in New Zealand. The New Zealand Ministry of Primary Industries has led a project into x-ray transfers of stowed baggage, leading a trial of the system in July 2013 on flights between Melbourne and Auckland.83 A hurdle remains data privacy.
4. Amnesty bins for produce, akin to those in Tasmania and Western Australia for domestic flights, coupled with increased fines for failing to declare or dispose of biosecurity risk goods.
Taken together, these safeguards will reduce the risk involved in allowing the majority of trans-Tasman travellers to exit freely to a level acceptable under the Australian government’s guidelines. The benefit to travellers, particularly those travelling on business, will far outweigh any remaining risk.
82 Klar, Dr Danielle, Department of Agriculture – Future Directions – presented at the National Passenger Facilitation Committee Meeting, 27 February 201483 X-ray transfer system offers biosecurity boost, New Zealand Government media release, Hon Nathan Guy, Minister for Primary Industries, 11 July 2013
RECOmmENDatIONS
Automate outbound border controls at major Australian airports, prioritising trans-Tasman flights
The Australian and New Zealand governments should prioritise the conclusion of intergovernmental treaties covering criminal records, data sharing and x-ray bag screening
Establish New Zealand as the trial market for all technology reforms considered by Australian border agencies
Introduce a dedicated self-declarant direct exit channel from quarantine control for flights from New Zealand

BRINGING OUR NEIGHBOUR CLOSER | 25
Potential impact of reform 1The economic benefit to Australia of streamlining border formalities at major airports would combine the two elements of the reform proposed.
REDUCtION IN tRavEL tImEInternational entry requirements and formalities, including long check-in times and strict security controls, are cited as negative factors in deciding whether to travel to a destination.84
For example, the USA has a particularly poor image in this regard and, in a recent survey, two thirds of potential
travellers said they would be more interested in travelling to the USA if its immigration and customs wait times were shorter.85
In the trans-Tasman space, reducing total journey time would bring the elusive five-hour travel time window into reach. If both outbound and inbound biosecurity controls could be streamlined further, it would lead to more New Zealanders travelling. Research from Airports Council International in Europe points to a 12 per cent rise in air traffic after the introduction in the EU of direct exit channels for intra-European flights in the mid-1990s, although this was also coupled with wider air liberalisation that decreased the average ticket price.86
84 The Travel & Tourism Competitiveness Report 2013, World Economic Forum, March 201385 Traveler Survey, U.S. Travel Association/Consensus Research, March 201386 Promoting a Single EU Border Control Standard, Airport Business Communiqué, January 2013
Flight
1 hour 2 hour 3 hour 4 hour 5 hour 5h 40minArrive
1 hour 2 hour 3 hour 4 hour 4h 35minArrive at airport
– checked in
Check in Boarding
Emigration check
Security screening
Departure retail
Arrivals concourse
Entry control point
Baggage hall
Bag reclaim
Queue
Secondary examination
Exit airport
Gate lounge
Bag drop
Bag drop Arrivals concourse
Automated departure Baggage reclaim
Security screening SmartGate
Departure retailExit airport through quarantine
Boarding Flight
Flight departure
Current system
Streamlined system
PaSSENGER PROCESSING tImELINE
Sources: Current system based on model of inbound passenger facilitation at Brisbane Airport conducted by Dr Paul Wu of Queensland University of Technology for Airports of the Future Project, 2013. Streamlined system reflects TTF calculation of cumulative reductions in time if all reforms in this paper were enacted.

26 | BRINGING OUR NEIGHBOUR CLOSER
The less comprehensive streamlining of border facilitation between the US and Canada has also delivered benefits. The Nexus program, whereby Canadians can pre-enrol as a trusted traveller by submitting personal data to US authorities ahead of travel, was fully rolled out in 2011.87 The following year trans-border air traffic between the US and Canada rose 4.7 per cent, compared with a three per cent rise in other international travel.88 However, this period coincided with an upturn in the economy in both countries. The similar SENTRI program for Mexican residents resulted in a 32 per cent increase in border crossings by Mexicans in the first six months of 2012.89
SPECIaL tREatmENt DIvIDENDThere is also a stimulus associated with the psychological effect of New Zealanders perceiving themselves as being more trusted or more favoured than citizens of other countries.90 In the corporate world, marketers often design loyalty programs to tap into consumers’ strong desire for status.91
Although a less tangible stimulatory effect than air fare reductions, maintaining preferential treatment for New Zealanders at Australian airports is also likely to boost visitation. The science is imperfect, but an upswing in visitation would be expected through affording New Zealanders special privileges at Australian ports of entry thanks to the ‘special treatment dividend’.92
The last time this approach was taken was in November 2005, when the Australian citizens’ primary line signage at Sydney, Brisbane and Melbourne airports was amended to include New Zealand passport holders.93 Holiday arrivals topped the 500,000 mark not long after, with many (predominantly young) New Zealanders citing the preferential treatment they
received at Australian airports as a contributory factor in their decision to take a return trip.94
To remain most effective, New Zealanders must continue to be afforded treatment that is differentiated from that given to other nationalities. For example, SmartGate eligibility is being progressively extended to other nationalities, starting with British, Singaporean and US citizens, and will extend to Chinese travellers once language packs are developed in the next iteration.95 Meanwhile the Australia-New Zealand primary line is also now welcoming Papua New Guineans96 at Brisbane and Cairns airports. A new, visible way of rewarding Australia’s most loyal travellers must now be found to convey the trust between the two nations.
Measuring the special treatment dividend is hard. But taking the conservative estimate of a 0.6 per cent upswing resulting from more streamlined entry at existing international airports97 contained in the GHD report for DRET, an additional 20,000 visitors from New Zealand would be expected through the four major gateway airports that currently handle 93 per cent of arrivals. Sydney alone could expect to welcome over 8,000 more travellers through this one reform.
Since the GHD modelling was based on the streamlining of entry formalities only, TTF believes the cumulative upswing of streamlined entry and exit formalities, as proposed in this paper, to be closer to one per cent. This would equate to an additional 35,000 New Zealanders across all Australian airports (see Figure 4).
If the two elements of the reform could reduce the total travel time to under the five hour mark, business travel in particular would be expected to rise the most steeply. The value of this traffic is higher than leisure, so would be particularly welcome for the airlines seeking to raise yield, as well as for accommodation providers and other hospitality operators.
Figure 4 Potential impact of streamlining border formalities at the four busiest trans-Tasman airports
StREamLINED ENtRy ONLy StREamLINED ENtRy aND ExIt
aIRPORt OF aRRIvaL
2013aCtUaL
2020FORECaSt
2020 FORECaSt
aDDItIONaL aRRIvaLS
2020 FORECaSt
aDDItIONaL aRRIvaLS
Sydney 1,160,323 1,379,340 1,387,617 8,276 1,393,134 13,793
Melbourne 738,483 877,876 883,143 5,267 886,655 8,779
Brisbane 681,390 810,006 814,866 4,860 818,106 8,100
Gold Coast 164,905 196,032 197,208 1,176 197,992 1,960
All Australian airports
2,907,486 3,456,290 3,477,028 20,738 3,490,853 34,563
Note: 2020 forecast figures include a compound annual growth rate of 2.5%, reflecting the forecast national growth rate between 2013 and 2020 from Tourism Forecasts, Autumn 2014, Tourism Research Australia. Streamlined entry reflects proposed reforms to biosecurity lanes at Australian airports and assumes additional growth of 0.6% per annum on top of the forecast for 2020, as set out in GHD Trans-Tasman Project Final Report 2012. Streamlined entry and exit combines biosecurity reform with automated departure controls and is forecast to contribute 1% additional annual growth, based on TTF hypothesis.
Source: Bureau of Transport, Infrastructure & Regional Economics (2014), International Airline Activity – City Pairs Data And International Airline Operated Flights and Seats
87 Beyond the Border Action Plan: Progress Report on Facilitating the Conduct of Cross-Border Business / Plan d’action Par-delà la frontière : Rapport d’étape sur la facilitation de la tenue des activités commerciales transfrontalières, Citizenship and Immigration Canada / Citoyenneté et Immigration Canada , Ottawa 2013
88 The Daily, 20 September 2013: Airport activity, 2012, Statistic Canada / Statistique Canada. Ottawa89 Figueroa, Alejandro. Realizing the Full Value of Tourism from Mexico to the United States. Arizona State University, 201290 Understanding the WTO: Principles of the trading system. World Trade Organization, January 201391 Henderson, C.M., et al., Review of the theoretical underpinnings of loyalty programs, Journal of Consumer Psychology (2011), University of Washington, Seattle, WA, USA92 Prof O’Cass, Aron & McEwen, Emily, Exploring consumer status and conspicuous consumption, Journal of Consumer Behaviour, Volume 4, Issue 1, pages 25–39, September 200493 Hawke, Allan. Neighbours, friends and all too often rivals, New Zealand Herald, 8 December 2005; p.A1894 Richards, Greg. Youth travel matters: understanding the global phenomenon of youth travel. World Tourism Organization, June 200895 McDonell, Stephen and Woodley, Naomi. Australia locks in annual leadership talks with China PM Australian Broadcasting Corporation, 10 Apr 201396 Minutes of the National Passenger Facilitation Committee, meeting 18, 4 July 201397 Trans-Tasman Project - Final Report, Department of Resources, Energy and Tourism (Tourism Division), June 2012

27 | BRINGING OUR NEIGHBOUR CLOSER
Air services between Australia and New Zealand are highly deregulated. The Australia-New Zealand Single Aviation Market (ANZ SAM) treaty, which came into effect in 1996, guarantees each country’s airlines unfettered access to each other’s market.98 The ANZ SAM also contains more liberal flying rights for foreign carriers than is found in many other parts of the world.
The home carriers Air New Zealand, Jetstar, Qantas and Virgin Australia all vie for space in the Tasman sky with Taiwan’s China Airways, Chile’s LAN Airlines, Air Tahiti Nui and Emirates Airways, the latter of which flies daily services from Auckland to Brisbane, Melbourne and Sydney using 500-seater Airbus A380 aircraft (pictured overleaf).
As a result, there is significant third country airline competition on trans-Tasman routes, making the air corridor one of the most price-competitive in the world.
For example, an analysis of real ticket prices from Sydney over the 18-month period to June 2012 shows that an average economy return fare to Auckland route was $437, with Christchurch only slightly more expensive (see Figure 5, below). The per-kilometre price is comparable to Cairns at around 2000km. This compares to the New Caledonian capital Nouméa and Port Vila in Vanuatu, which both only have two airlines competing on the route from Sydney and a higher per-kilometre price.
Competition has delivered benefits for consumers on the trans-Tasman routes. However, the low fares now expose the sheer scale of taxes and charges applied either directly or indirectly by governments on both sides, although disproportionately so by the Australian government through its tax on international travel, the Passenger Movement Charge (PMC).
New Zealand is a very price sensitive market, especially in leisure markets like the Gold Coast, where every dollar increase in fare can contribute to a dampening of demand.99 Modelling by the International Air Transport Association suggests that leisure travellers (as distinct from those travelling to visit friends or relatives) are most sensitive to tourism taxes such as the PMC, with every price increase of 10 per cent is estimated to generate a decline of 5-7 per cent in the number of leisure passengers travelling.100 TTF analysis shows the $55 PMC represents around 18 per cent of the cheapest low season return air fare (see Figure 6). Its removal would induce demand by over 10 per cent under the IATA model.
Through liberalisation, the Australian government has reduced air fares on the Tasman (see Figure 7). But now the market has delivered as much juice as it can. To squeeze more out, government must remove the remaining hurdles and make trans-Tasman air fares comparable to domestic Australian fares. This would unlock the spare capacity on the route without any additional capital outlay by airlines.
Figure 5 Ticket prices for selected short-haul international destinations from Sydney
COUNtRy DEStINatION DIStaNCE HIGHESt PRICE LOWESt PRICE avERaGE PRICE avERaGE PRICE PER km
New Zealand Auckland 2,164 km $1,310.30 $265.70 $436.49 $0.20
New Zealand Christchurch 2,129 km $2,289.40 $260.30 $477.72 $0.22
Fiji Nadi 3,170 km $2,334.50 $563.00 $855.71 $0.27
Australia Cairns 1,966 km $2,520.80 $344.70 $578.31 $0.29
Vanuatu Port Vila 2,481 km $2,165.00 $357.90 $779.89 $0.31
New Caledonia Nouméa 1,980 km $2,622.00 $621.30 $1,065.86 $0.54
Source: TTF analysis based on data supplied by CAPA Centre for Aviation
Ranked by average ticket price per km. Real ticket prices from Oct 2010 to Jun 2012. Destinations within 2000-3000km range from Sydney.
Image above courtesy of Jetstar
98 Australia-New Zealand Single Aviation Market Arrangements, Department of Foreign Affairs and Trade, Canberra 199699 Annual Report 2011/2012, Gold Coast Tourism Corporation100 Tourism Tax. International Air Transport Association, 2013.
REFORm 2 CUt tHE DEPaRtURE tax tO $25

28 | BRINGING OUR NEIGHBOUR CLOSER
Figure 6 PMC as proportion of total return airfare
Inb
ou
nd
pas
sen
ger
s fr
om
New
Zea
lan
d
1991 1992 1993 1994 1995 1996 1997 1998 1999 2000 2001 2002 2003 2004 2005 2006 2007 2008 2009 2010 2011 2012 20130
500,000
1,000,000
1,500,000
2,000,000
2,500,000
3,000,000
First low-cost carriers on Tasman routes: Freedom Air and Kiwi
Open Skies treaty replaces bilateral air services agreements
Adoption of one-way pricing by Virgin Blue and Jetstar
AUCKLAND – SYDNEY RETURNLOWEST ECONOMY FARE
Air New ZealandLowest fare available $307.34,
for travel 20 August 2014
Base airfare
44%
5%
4%
Fuel surcharge
Security surcharge
Airport charges
29%
PMC
18%
Figure 7 Effect of liberalisation on New Zealand arrivals to Australia
Image courtesy of Emirates
Source: Matrix Airfare Search, ITA Software by Google
Source: Flying here and flying there: tracking airfares in the CPI. Statistics New Zealand / Tatauranga Aotearoa 2009

BRINGING OUR NEIGHBOUR CLOSER | 29
tHE PmC: a HaNDBRakE ON NEW ZEaLaND tRavEL tO aUStRaLIaThe PMC was introduced in 1995 to replace the previous departure tax to recover the cost associated with border processing at airports. Since then, the PMC has risen on several occasions to cover increased border processing costs such as the 2000 Sydney Olympics and the foot-and-mouth epidemic of 2001 (see Figure 8). The tax currently stands at $55 for every international passenger over 12 years of age.
The Australian government revenue from the PMC is now significantly more than the amount required to fund its border agencies and PMC revenue collection is forecast to total over $1 billion by 2016-17, while expenditure on passenger facilitation at international airports will drop to $239 million.
Instead of funding tourism infrastructure and processing at airports and seaports as originally designed, it has become, in the view of the Centre for Economics and Policy Study, “a transfer payment from tourism to non-tourism industries …(as) an additional export tax, on top of existing taxes that international tourists pay.”101
The profit made by the government from the tax should be redirected into passenger facilitation initiatives, rather than flow into consolidated revenue. The reforms outlined in the paper could all be funded through the over-collection and still leave sufficient funds to reduce the rate charged on trans-Tasman routes to $25 (see Figure 9).
Figure 8 Passenger Movement Charge – increases over time
matES’ RatES FOR kIWIS
The justification for a differentiated rate for New Zealand routes lies in the inherent poor design of the PMC as a tax. Although the PMC is the second highest departure tax in the developed world102 after the United Kingdom’s air passenger duty (APD), because the PMC is not distance-tiered, for journeys under 3220km the PMC is the highest (see Figure 10).
For example, a passenger flying from London to Istanbul – about 2500km - would pay around $22 in tax under the APD, whereas a passenger on a comparable journey from Sydney to Auckland (2200km) pays $55.
Although there was anger in New Zealand over the June 2012 rate rise,103 very few New Zealanders (or other nationality of international visitor) protest the payment, making it an attractive tax to the Australian Treasury.104 Indeed, the PMC meets the classic Colbertism definition of a tax that is easy to collect by government in that the goose being plucked produces many feathers with very little hissing.105
0
10
20
30
40
50
60
Dep
artu
re t
ax r
ate
(Au
stra
lian
Do
llars
)
1988 1989 1990 1991 1992 1993 1994 1995 1996 1997 1998 1999 2000 2001 2002 2003 2004 2005 2006 2007 2008 2009 2010 2011 2012 2013 2014
Response to pilots’ strike
Sydney Olympics levy
National aviationsecurity measures
No reason provided
Foot-and-mouth disease levy
Tourism promotion Full cost recovery for customs, immigration, quarantine and visa processing
$10
$20
$25 $2
7 $30
$38
$47
$55
101 Forsyth, Peter, Dr Hoque, Serajul, Dwyer, Larry, Dr Phạm, Tiến Đức and Spurr, Ray. The Impacts of the Passenger Movement Charge on Tourism Output and the Economy p. 4, The Centre for Economics and Policy Study, Canberra 2011
102 Defined as member countries of the Organisation for Economic Cooperation and Development (OECD)103 Anger over Australia’s departure tax hike. 3 News NZ, Thursday 17 May 2012104 Johnston, Donald. Fiscalité et croissance, L’Observateur de l’OCDE, Nº230, Paris January 2002105 Quote attributed to Jean-Baptiste Colbert, Comptroller general of Finance of the Kingdom of France, 1665-1683 «L ’art de lever l’impôt consiste à plumer l’oie sans la faire criailler »
“The art of taxation consists in so plucking the goose as to get the most feathers with the least hissing”
Sources: Departure Tax Act 1978, Departure Tax Amendment Act 1981, Departure Tax Amendment Act 1988, Departure Tax Amendment Act 1991, Departure Tax Amendment Act 1993, Departure Tax Amendment Act 1994, Passenger Movement Charge Amendment Act 1998, Passenger Movement Charge Amendment Act 2001, Passenger Movement Charge Amendment Bill 2008, Passenger Movement Charge Amendment Bill 2012

30 | BRINGING OUR NEIGHBOUR CLOSER

Under the reforms outlined in this paper, passenger processing costs for New Zealanders are estimated to fall to as low as $6, making the disparity between the $55 tax paid and services received even greater.
But beyond reasons of fairness, the argument to make an exception for trans-Tasman flights stacks up on commercial grounds. In Australia, the Gold Coast and Cairns in particular, compete with destinations such as the Cook Islands, Fiji, Vanuatu and Hawaii for family holidays in the New Zealand market.106
So for New Zealanders, the impact of the PMC is more immediate: at the decision-making stage of a potential visit to Australia. For every New Zealand family of four with teenage kids who take a holiday in Australia, the tax represents an additional NZ$250 hidden in the air fare or in the holiday package deal.
Although flights to Nadi (Fiji), Rarotonga (Cook Islands) and Port Vila (Vanuatu) tend to be around NZ$100 ($95) more expensive107 and those to Hawaii some NZ$200 ($190) dearer, the total cost of package holidays remains attractive due to lower labour and accommodation costs. This is even true in Fiji, whose departure tax dwarfs even Australia’s at F$200 ($120).108
Figure 9 Passenger Movement Charge over-collection
Source: Australian Customs & Border Protection Service - Annual Reports, 2006-07 to 2012-13
Au
stra
lian
Do
llar
(mill
ion
s)
2005-06 2006-07 2007-08 2008-09 2009-10 2010-11 2011-12 2012-13
$375m $393m$420m
$503m
$571m$615m
$646m
$777m
0
100
200
300
400
500
600
700
800
900
Passenger Facilitation program – expenditure
Passenger Movement Charge – revenue
$279
m
$297
m
$213
m
$243
m
$231
m
$243
m
$249
m
$234
m
PMC INCREASED TO $55 AS OF 1 JULY 2012
PMC INCREASED TO $47 AS OF 1 JULY 2008
106 New Zealand Market Profile April 2013, Tourism Australia107 TTF analysis of average fares for July 2014 from data on ITA Software Airfare Matrix108 Panapasa, Geraldine, Departure tax to rise, Fiji Times Online, Suva, November 9, 2013
BRINGING OUR NEIGHBOUR CLOSER | 31

32 | BRINGING OUR NEIGHBOUR CLOSER
Figure 10 Comparison of departure taxes in the OECD ranked by short-haul rate
COUNtRy tax NamE RatE (SHORt-HaUL) RatE (LONG-HaUL)
Local currency Australian dollar Local currency Australian dollar
Australia Passenger Movement Charge (PMC)
$55 $55 $55 $55
Mexico Derecho de No Inmigrante (DNI) Mx$294 $25.22 Mx$294 $25.22
United Kingdom(excludes. N. Ireland)
Air Passenger Duty (APD) Economy class
£13 $24.24 £94 $175.26
Band A (0 – 3220km) Band D (>8000km)
Germany Luftverkehrsteuergesetz (LuftVStG) €7.50 $11.53 €42.18 $64.85
Band A countries All other countries
Austria Flugabgabegesetz (FlugAbgG) €7 $10.76 €35 $53.81
Band A countries All other countries
Sources: HM Customs and Revenue (UK). Australian Customs and Border Protection Service, Bundesministeriums der Finanzen (Germany), Bundeskanzleramt Österreich (Austria) and Instituto Nacional de Migración (México).
Exchange rates: GBP-AUD 1.8645, EUR-AUD 1.5375, MXP-AUD 0.08577. As of 21 January 2014. Source: www.fx-exchange.com
REtURN aIRFaRES FOR UNDER NZ$400Jetstar, part of the Qantas group, has long advocated for an easing in border restrictions on trans-Tasman flights as a way to stimulate a price-sensitive and mature market. A 2009 study showed that a full common border scenario would result in a $234 million reduction in operating costs to airlines.109
Were New Zealand to be an Australian domestic destination, Jetstar estimated airport charges and government charges would remove as much as NZ$60 from the price of a one-way fare from New Zealand to Australia. This would reduce a typical lead-in Auckland to Sydney fare from around NZ$200 to NZ$140 – the same as domestic routes such as Auckland to Dunedin or Queenstown.
Looking at return air fares, TTF analysis shows the average real fare paid on the Auckland-Sydney route over an 18 month period ending June 2012 to have been $437. Eliminating the PMC would bring this return fare to $385, still under the psychological NZ$400 barrier under current exchange rates.
The savings to airlines of any removal of the PMC could translate into a 13 per cent additional yield which could underwrite new route development, reduce fares or boost seat capacity on existing routes. In simpler terms, unfeasible routes would become feasible and existing routes more profitable.110
109 Webber, Dr Tony, The Impact of Australia-New Zealand Aviation Border Simplification, Qantas Economics, October 2009110 Grow sustainable air connectivity – Tourism 2025 – Growing Value Together / Manaakitanga 2025 - Whakatipu Uara Ngatahi, Tourism Industry Association New Zealand, March 2014
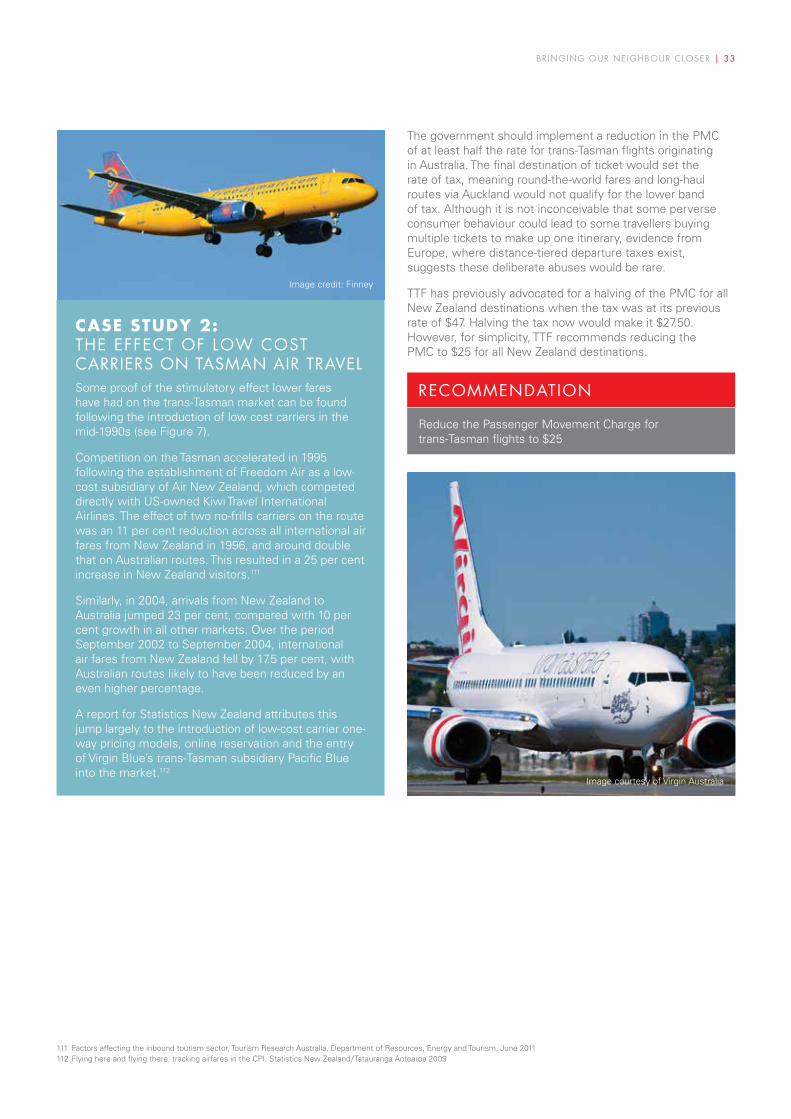
BRINGING OUR NEIGHBOUR CLOSER | 33
CASe STuDy 2: tHE EFFECt OF LOW COSt CaRRIERS ON taSmaN aIR tRavELSome proof of the stimulatory effect lower fares have had on the trans-Tasman market can be found following the introduction of low cost carriers in the mid-1990s (see Figure 7).
Competition on the Tasman accelerated in 1995 following the establishment of Freedom Air as a low-cost subsidiary of Air New Zealand, which competed directly with US-owned Kiwi Travel International Airlines. The effect of two no-frills carriers on the route was an 11 per cent reduction across all international air fares from New Zealand in 1996, and around double that on Australian routes. This resulted in a 25 per cent increase in New Zealand visitors.111
Similarly, in 2004, arrivals from New Zealand to Australia jumped 23 per cent, compared with 10 per cent growth in all other markets. Over the period September 2002 to September 2004, international air fares from New Zealand fell by 17.5 per cent, with Australian routes likely to have been reduced by an even higher percentage.
A report for Statistics New Zealand attributes this jump largely to the introduction of low-cost carrier one-way pricing models, online reservation and the entry of Virgin Blue’s trans-Tasman subsidiary Pacific Blue into the market.112
The government should implement a reduction in the PMC of at least half the rate for trans-Tasman flights originating in Australia. The final destination of ticket would set the rate of tax, meaning round-the-world fares and long-haul routes via Auckland would not qualify for the lower band of tax. Although it is not inconceivable that some perverse consumer behaviour could lead to some travellers buying multiple tickets to make up one itinerary, evidence from Europe, where distance-tiered departure taxes exist, suggests these deliberate abuses would be rare.
TTF has previously advocated for a halving of the PMC for all New Zealand destinations when the tax was at its previous rate of $47. Halving the tax now would make it $27.50. However, for simplicity, TTF recommends reducing the PMC to $25 for all New Zealand destinations.
RECOmmENDatION
Reduce the Passenger Movement Charge for trans-Tasman flights to $25
111 Factors affecting the inbound tourism sector, Tourism Research Australia, Department of Resources, Energy and Tourism, June 2011112 Flying here and flying there: tracking airfares in the CPI. Statistics New Zealand/Tatauranga Aotearoa 2009
Image credit: Finney
Image courtesy of Virgin Australia

34 | BRINGING OUR NEIGHBOUR CLOSER
Potential impact of reform 2New Zealand is one of the most price-sensitive to air fare changes of all tourist markets tracked by Tourism Research Australia.113 Of the three elasticity drivers studied by TRA, fare elasticity is the most pertinent on the trans-Tasman route, since New Zealand incomes are on the rise after decades of decline114 and as has been demonstrated elsewhere, air capacity between Australia and New Zealand outstrips demand. Although a number of factors drive fare elasticity on particular routes (such as whether the traveller is travelling for business, pleasure, work or visiting friends or relatives)115 the level of the average airfare is the dominant factor for New Zealand residents in considering travel to Australia.
The most comprehensive review of the market depression that departure taxes exert was conducted on behalf of the Netherlands Ministry of Infrastructure and the Environment to understand the impact of its short-lived Air Passenger Tax, levied at €11.25 for European destinations and €45 for long-haul routes. For the period of one year from July 2008 to July 2009 Amsterdam Schipol recorded a net loss of approximately two million origin-destination passengers, leading the Dutch government to repeal the tax. Although half of the two million chose to fly from airports in neighbouring countries, the remainder opted not to travel.116
A comparable market to New Zealand is Ireland, which abolished its Air Travel Tax in April117 after economic modelling showed the losses to the economy of around €482 million.118 Ireland has had a number of new international air services introduced from the United Kingdom and long-haul routes following the zero-rating of the tax.
Similarly, Mexican legislators recently voted down an increase to their departure tax, mindful of the decrease in US travellers the move would provoke.119 Even the United Kingdom government has pledged to reduce its APD for long-haul travel from April 2015 to stimulate the travel industry.120
The price stimulatory effect of lower air fares across the Tasman has been proved before. Low cost carriers
revolutionised the market in the late 1990s and early 2000s, with an 11 per cent jump in New Zealand arrivals in 1996, the year Air New Zealand’s Freedom Air entered the market and a further 21 per cent increase in 2004 following Virgin Blue’s Pacific Blue entrance and subsequent move to one-way fares (see case study 2). Statistics New Zealand figures for average international air fares over the same period show a broad correlation between increased competition on the Tasman routes and a drop in fares.121
The GHD report drew on work carried out by Qantas to model price elasticity on Tasman routes between 2008 and 2009 that found the short term price elasticity of demand for the New Zealand market was -0.74.122 This would suggest that every 1.5 per cent rise in fare would lead to a drop in demand of one per cent.
In this context, the additional $55 departure tax charged by the Australian government is therefore a serious demand inhibitor.123 Because it is a per-unit tax on a price-elastic good, the tax is passed through and thus the burden borne by consumers. On a $440 return air fare, the $55 tax represents a 12.5 per cent price increase over base fare, suggesting a dampening of demand of around 9.3 per cent on leisure fares, based on the InterVistas elasticities. TTF calculates that an additional 110,000 New Zealanders would have crossed the Ditch last year if there had been no PMC, assuming a total elasticity of -0.74 (see Figure 11). Looking ahead to 2020, removal of the PMC would see 130,000 additional arrivals from New Zealand.
Even if the government were not bold enough to completely abolish the tax, there are still significant gains to be made through reducing it for short haul routes such as New Zealand. Using the same elasticity assumption, had the tax been set at a middle ground rate of $25 in 2013, close to an additional 60,000 trans-Tasman trips would have been taken by New Zealand residents. This is equivalent to an additional 71,000 visitors from New Zealand in 2020.
Figure 11 Potential additional New Zealand arrivals through reduction of the PMC
PmC RatE avERaGE REtURN aIRFaRE
DECREaSE IN aIRFaRE
INCREaSE IN DEmaND
aDDItIONaL NZ aRRIvaLS (2013)
aDDItIONaL NZ aRRIvaLS (2020)
tOtaL NZ aRRIvaLS (2020)
$55 $440 0.0% 0.0% - - 1,412,592
$25 $415 6.8% 5.0% 60,042 71,082 1,483,674
$0 $385 12.5% 9.3% 110,371 130,665 1,543,257
Source: TTF calculations using Tourism Forecasts, Autumn 2014, Tourism Research Australia and applying price elasticity of -0.74 modelled by InterVistas Consulting in Estimating Air Travel Demand Elasticities 2007.
113 Factors affecting the inbound tourism sector, Tourism Research Australia, Department of Resources, Energy and Tourism, June 2011114 Cope, Jeff. National income and GDP – International comparisons, Te Ara – the Encyclopaedia of New Zealand, updated July 2012115 InterVistas Consulting, Estimating Air Travel Demand Elasticities – Final Report, International Air Transport Association, 2007116 Gordijn, Hugo and Kolkman, Joost. Effecten van de vliegbelasting – Gedragsreacties van reizigers, luchtvaartmaatschappijen en luchthavens / Effects of the Air Passenger Tax – Behavioral
responses of passengers, airlines and airports. Kennisinstituut voor Mobiliteitsbeleid (KiM) / Netherlands Institute for Transport Policy Analysis, Ministerie van Infrastructuur en Milieu / Ministry of Infrastructure and the Environment, The Hague February 2011
117 Summary of 2014 Budget Measures Policy Changes / Achoimre ar Bhearta Bhuiséad 2014 - Athruithe Beartais. Department of Public Expenditure and Reform / An Roinn Caiteachais Phoiblí agus Athchóirithe. Dublin October 2013
118 Veldhuis, J & Zuidberg, J. The Implications of the Irish Air Travel Tax. SEO Economic Research, Amsterdam 2009119 Román, José Antonìo. Reprueba sector aéreo posible aumento al DNI. La Jornada, Mexico City, 5 October 2011120 Javid, Sajid. Budget Report – March 2014 as laid before the House of Commons by the Chancellor of the Exchequer, Her Majesty’s Treasury, 19 March 2014121 Flying here and flying there: tracking air fares in the CPI. Statistics New Zealand 2009122 Webber, Tony, The Impact of Australian-New Zealand Aviation Border Simplification, Qantas Economics, 2009123 Wall, Stuart & Griffiths, Alan. Economics for Business and Management. Financial Times Prentice Hall. 2008.

REFORm 3 OPEN aDDItIONaL POINtS OF ENtRy
The third, and potentially largest, area of reform needed in the trans-Tasman market is the opening up of additional points of entry.
It is Australian government policy to open up regional ports to international flights.124 Although there is a roadmap published to guide aspiring airports along this journey, the spirit is not matched by budgetary commitments. In fact, rather than aid the creation of new international airports, border agency budgets act as a disincentive to their creation through the imposition of additional staffing levies for new services.
Unlike tourists from emerging source markets of Asia, who tend to restrict themselves to either large cities or well-defined tourist destinations,125 New Zealanders have a good grasp of Australian geography and are happy to go off the beaten track. Indeed, New Zealanders have highest dispersal rate of all international tourists to Australia, with some 7.5 million room nights spent by New Zealanders outside capital cities in 2012.126
Growing New Zealand visitation, therefore, represents a great opportunity for regional tourism operators in NSW and Queensland as the growth from traditional long-haul markets of Europe and North America is forecast to slow over coming years.
Yet entry into Australia from New Zealand is restricted to those arriving at full international airports. This has led to destination fatigue among New Zealanders, who only have the choice of four short-haul destinations on the eastern seaboard available year-round (Brisbane, Gold Coast, Melbourne and Sydney).127
This is despite there being over 100 airports in NSW and Queensland with runways able to accommodate a trans- Tasman flight in a regional jet similar to the Embraer E-190 used by Virgin Australia.128
REGIONS WItH POtENtIaL tO BENEFIt FROm DIRECt tRaNS-taSmaN FLIGHtS
NORTHERN
TOURISM REGIONS IN NORTHERN AUSTRALIA
WHITSUNDAYS
MACKAY
WESTERN
HOBART AND THE SOUTH
NORTH COAST
HUNTER
CAPITAL COUNTRY
GEELONG
SUNSHINECOAST
AVALON AIRPORT
NEWCASTLE AIRPORT
SUNSHINE COAST AIRPORT
BALLINA-BYRON AIRPORT
COFFS HARBOUR AIRPORT
MACKAY AIRPORT
GREAT BARRIER REEF AIRPORTTOWNSVILLE AIRPORT
QUEENSLAND
NSW
VICTORIA
TASMANIA
ACT
CANBERRA AIRPORT
HOBART AIRPORT
124 Appendix A, Flight Path to the Future National Aviation Policy White Paper, Australian Government, December 2009125 2012-15 Corporate Plan, Tourism Australia 126 New Zealand Market Profile, Tourism Australia 127 Selling business events in the international market, Tourism Australia128 Range specifications, Embraer Commercial Aviation, E-Jets E-190
Source: Airports with potential for trans-Tasman flights defined by GHD in Trans-Tasman Project Final Report. Tourism regions defined by the Australian Bureau of Statistics

36 | BRINGING OUR NEIGHBOUR CLOSER
Clearly not all of these regional airports could sustain direct services from New Zealand, but airline transfer data points to very real latent demand from New Zealand to Australian secondary airports. In its 2012 report for the former Department of Resources, Energy and Tourism, consultants GHD found that the airports of Avalon, Canberra, Hobart, Newcastle and the Sunshine Coast could all support direct flights from New Zealand.129
Of the five airports identified as having immediate potential, only Sunshine Coast Airport (formerly Maroochydore Airport) has launched New Zealand services. Air New Zealand started with a twice-weekly service from its Auckland hub over the 2012 winter, which it repeated with a longer season in 2013 and has further extended for the next three years130 (see case study 3).
NEW aIRPORtS CREatE NEW maRkEtSAn additional five airports (Ballina-Byron, Coffs Harbour, Great Barrier Reef Airport on Hamilton Island, Mackay and Townsville) are also considered potential candidates for limited New Zealand services in the GHD report. Yet there are also a whole host of smaller airports which could conceivably enter the market if the barriers to entry were lower.
As has been demonstrated elsewhere in the world, airlines can create entirely new catchment areas to stimulate demand by flying to regional airports. The best demonstration of the use of secondary airports is the Irish low cost carrier Ryanair, which operates mainly from secondary airports in its vast European network. Among these are some very secondary airports, such as Beauvais for Paris, Bergamo for Milan and Girona for Barcelona.
Defunct carriers Kiwi Air and Freedom Air both established international services from secondary airports during their period of trans-Tasman expansion in the late 1990s and early 2000s. Freedom Air flew from New Zealand regional centres such as Hamilton (for Auckland), Palmerston North (for Wellington) and Dunedin (for the South Island). In Australia, Freedom Air was responsible for opening Gold Coast Airport (formerly Coolangatta Airport) to international services.
Following the approval of trans-Tasman cooperation between the Qantas Group and Emirates and between Air New Zealand and Virgin Australia, there has been a consolidation of traffic on the four busiest trans-Tasman routes (Sydney-Auckland, Melbourne-Auckland, Brisbane-Auckland and Sydney-Christchurch).131 With over 95 per cent of the market now in one of the two new groupings, the new groupings may need a fresh incentive to enter new markets.132 This incentive could be provided by changes to the regulatory framework surrounding international airport designation that effectively bars smaller airports from trialling new services.
Since the Kiwi Air/Freedom air era there has been no expansion of trans-Tasman services to regional ports. As a result, crucial tourism regions, including the Hunter and the Whitsundays, that would benefit from direct trans-Tasman flights (see map) are missing out on significant potential visitor inflows.
There are two significant barriers erected by the federal government in the way of aspirant airports trialling new international services.
1. Physical infrastructure costs Dedicated border agency-mandated facilities require a capital outlay that is too onerous for most small regional airports to undertake.
2. Border agency staffing costs Border agency staffing levels were previously prescribed and geared towards large airports and make marginal services unfeasible. At non-designated airports, there is an additional charge for border agency staff.
The barrier to more regional airports opening their doors to trans-Tasman flights is the cost and bureaucracy involved in attaining and maintaining international airport status. Yet without full international status, the airport operator is liable to pay for all border agency staffing required.
This paradoxical situation can be resolved through reform to the way international airports are designated and categorised. Recognition of the lower risk profile associated with flights to and from New Zealand should allow for the creation of a new designation of international airport solely for trans-Tasman flights. Border agency staffing should be scaled back accordingly, with technology allowing remote oversight of small, mobile teams.
129 Trans-Tasman Project Final Report, GHD for the Department of Resources, Energy and Tourism (Tourism Division) June 2012130 Air New Zealand flights to continue with extended seasons, Media release, Sunshine Coast Council, 9 December 2013131 Qantas and Emirates trans-Tasman alliance in the hands of New Zealand’s Transport Minister, CAPA Aviation Analysis, 28th January, 2013132 Submission on ACCC draft determination on applications for authorisation of Qantas/Emirates master coordination agreement, Christchurch Airport – 25 January 2013

BRINGING OUR NEIGHBOUR CLOSER | 37
CASe STuDy 3: aIR NEW ZEaLaND WINtER FL IGHtS tO SUNSHINE COaSt Air New Zealand, Sunshine Coast Destination and Sunshine Coast Airport have worked collaboratively with border agencies, led by the Australian Customs and Border Protection Service, over three successive winter seasons to develop a smaller border processing solution for direct services from Auckland.
In 2012, a twice-weekly Airbus A320 service ran for 12 weeks from July 1 to September 18. In 2013, the service was expanded to 17 weeks, from June 18 through October 15. The service will resume for a further three winters from 2014 to 2016.
In the 2012 winter, a total of 5713 passengers flew, with load factors approaching the industry average of 70 per cent. Around 65 per cent of passengers were New Zealanders.
The 2012 service is estimated to have generated $14.5 million in additional visitor expenditure on the Sunshine Coast. $1.5 million in GST receipts flowed to the federal treasury as a result of the trial. In 2013, the figure was closer to $19 million in additional expenditure on the Sunshine Coast.
Over the 2012 trial period, arrivals from New Zealand to Brisbane grew by six per cent and to the Gold Coast by three per cent, suggesting no cannibalisation of existing markets.
Sunshine Coast Airport invested around $1 million in 2012 in upgrading its facilities to accommodate the service, of which around half was purely for border agencies. Additional upgrades to the international arrivals area of the terminal were carried out before the 2013 season. The processing area for trans-Tasman passengers was created from existing office space inside the main terminal. The international baggage claim facility was separated from the general baggage claim hall by an operable wall.
There were some marked differences between 2012 and 2013 in terms of border agency personnel levels. In 2012, around 15 to 20 Brisbane-based border agency staff typically processed each flight, working overtime shifts at the airline’s expense at a total cost of $63,569 recovered by Customs.
After a risk assessment of the 2012 trial, total border agency staffing levels were reduced to around ten for the 2013 service. Typically there are four Customs officers with one supervisor for each flight, three biosecurity inspectors, and two immigration officers processing each flight.
Close cooperation with the airline was responsible for some of the staffing reduction, with a 90-minute turnaround in 2013 (in place of 60 minutes in 2012) allowing the same customs officers to process outbound and inbound passengers. Agriculture has a project underway to push Australian biosecurity information out to Air New Zealand passengers prior to check-in to further minimise the inspection requirement at Sunshine Coast.
ChameleonsEye – Shutterstock.com

38 | BRINGING OUR NEIGHBOUR CLOSER
133 Air Navigation Act 1920, Australian Government134 Designated International Airports in Australia, Department of Infrastructure and Regional Development, February 2014 135 Border Sector Strategy 2008-2013 - A Framework for Collaboration for Border Sector Agencies New Zealand Border Sector Governance Group, 2008136 National aviation policy whitepaper: flight path to the future Department of Infrastructure, Transport, Regional Development and Local Government, Canberra, December 2009137 Procedures for International Flights at Non-International Airports, Department of Infrastructure and Regional Development February 2014
Create a new class of tasman-only airportThe designation of international airports is an obligation of national governments133 although there is little global standardisation in the categories of international airport. At present there are five official categories of international airport in Australia ranging from the ‘major international airport’ category that covers Adelaide, Brisbane, Cairns, Darwin, Melbourne, Sydney and Perth, to the non-scheduled restricted international category in use only at Horn Island in Cape York (see Figure 12). In addition, there are international airports on Australia’s external territories134 classified separately and those only to be used as alternates in an emergency.
However, in the middle lies the category ‘restricted use’ in which most aspirant trans-Tasman airports sit. These airports do not (with the exception of Gold Coast Airport) have regular international flights but have border agency passenger processing available if pre-arranged.
Making the leap between a restricted airport and a major international airport is evidently too hard. Even with regular international operations, Gold Coast Airport has not made the jump and nor did Newcastle or Townsville when they had international regular passenger transport flights in the past five years.
What is missing in Australia is a middle category of airport that allows for limited international operation. In contrast to Australia, the New Zealand authorities understand the economic value of direct international flights to smaller communities and have an intermediate category of international airport restricted by hours of operation.135 In addition to its two full international airports with permanent border agency staffing (Auckland and Christchurch), New Zealand has four limited international airports with a part-time customs and immigration presence (see Figure 12), which take flights only from Australia.
Reform to the Australian designation has been attempted before. The previous federal government placed an emphasis on expanding international services at regional airports.136 To streamline the process, the National Passenger Processing Committee (NPPC) was established to consider applications by domestic airports wanting international status.137
Despite the establishment of the committee, no airport has yet succeeded in switching status or even obtaining the restricted use category. The Air New Zealand services to Sunshine Coast Airport are still officially deemed trials, despite being scheduled for the next three years, due in part to inconsistencies between the aims of the NPPC process and the prescriptive rules governing international airport operations.
Figure 12 Airport categories in Australia and New Zealand
aUStRaLIa NEW ZEaLaND
Major international airports 24-hour international airports
Adelaide (ADL) Auckland (AKL)
Brisbane (BNE) Christchurch (CHC)
Cairns (CNS)
Darwin (DRW)
Melbourne (MEL)
Perth (PER)
Sydney (SYD)
Limited international airports
Dunedin (DUD)
Queenstown (ZQN)
Rotorua (ROT)
Wellington (WLG)
Restricted-use international airports
Avalon (AVV)* Palmerston North (PMR)
Broome (BME) Waikato (HLZ)
Canberra (CBR)*
Coffs Harbour (CFS)*
Gold Coast (OOL)*
Hobart (HBA)
Learmonth (LEA)*
Lord Howe Island (LDH)
Newcastle (NTL)
Port Hedland (PHE)*
Townsville (TSV)
Alternate international airports
Customs-designated military air bases
Alice Springs (ASP) RNZAF Base Auckland / Whenuapai
Kalgoorlie-Boulder (KGI) RNZAF Base Ohakea (OHA)
Katherine Tindal (KTR)
Launceston (LST)
Rockhampton (ROK)
Non-scheduled international airport
Horn Island (HID)
Australian external territory international airports
International airports in New Zealand associated states
Christmas Island (XCH) Hanan (IUE)
Cocos (Keeling) Island (CCK) Rarotonga (RAR)
Norfolk Island (NLK)
Trial international airport
Sunshine Coast (MCY)
Sources: Department of Infrastructure and Regional Development, New Zealand Customs Service / Te Mana Arai o Aotearoa* Denotes alternate airport
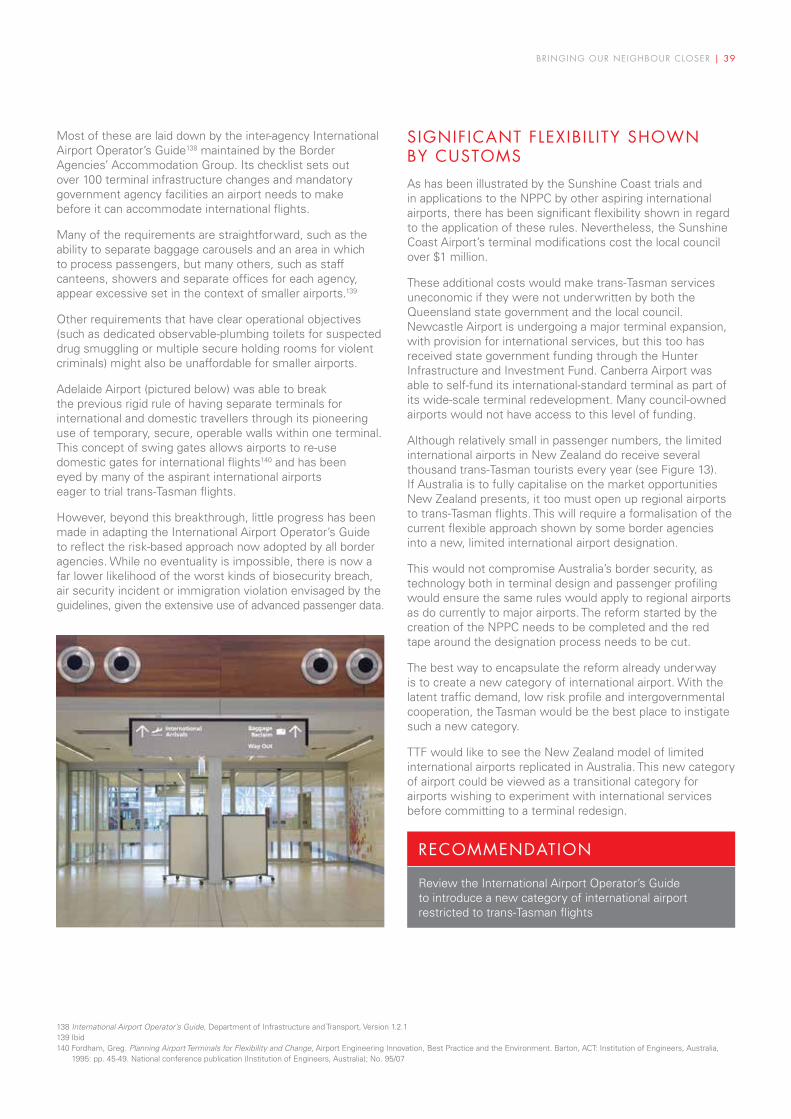
BRINGING OUR NEIGHBOUR CLOSER | 39
Most of these are laid down by the inter-agency International Airport Operator’s Guide138 maintained by the Border Agencies’ Accommodation Group. Its checklist sets out over 100 terminal infrastructure changes and mandatory government agency facilities an airport needs to make before it can accommodate international flights.
Many of the requirements are straightforward, such as the ability to separate baggage carousels and an area in which to process passengers, but many others, such as staff canteens, showers and separate offices for each agency, appear excessive set in the context of smaller airports.139
Other requirements that have clear operational objectives (such as dedicated observable-plumbing toilets for suspected drug smuggling or multiple secure holding rooms for violent criminals) might also be unaffordable for smaller airports.
Adelaide Airport (pictured below) was able to break the previous rigid rule of having separate terminals for international and domestic travellers through its pioneering use of temporary, secure, operable walls within one terminal. This concept of swing gates allows airports to re-use domestic gates for international flights140 and has been eyed by many of the aspirant international airports eager to trial trans-Tasman flights.
However, beyond this breakthrough, little progress has been made in adapting the International Airport Operator’s Guide to reflect the risk-based approach now adopted by all border agencies. While no eventuality is impossible, there is now a far lower likelihood of the worst kinds of biosecurity breach, air security incident or immigration violation envisaged by the guidelines, given the extensive use of advanced passenger data.
SIGNIFICaNt FLExIBIL Ity SHOWN By CUStOmS
As has been illustrated by the Sunshine Coast trials and in applications to the NPPC by other aspiring international airports, there has been significant flexibility shown in regard to the application of these rules. Nevertheless, the Sunshine Coast Airport’s terminal modifications cost the local council over $1 million.
These additional costs would make trans-Tasman services uneconomic if they were not underwritten by both the Queensland state government and the local council. Newcastle Airport is undergoing a major terminal expansion, with provision for international services, but this too has received state government funding through the Hunter Infrastructure and Investment Fund. Canberra Airport was able to self-fund its international-standard terminal as part of its wide-scale terminal redevelopment. Many council-owned airports would not have access to this level of funding.
Although relatively small in passenger numbers, the limited international airports in New Zealand do receive several thousand trans-Tasman tourists every year (see Figure 13). If Australia is to fully capitalise on the market opportunities New Zealand presents, it too must open up regional airports to trans-Tasman flights. This will require a formalisation of the current flexible approach shown by some border agencies into a new, limited international airport designation.
This would not compromise Australia’s border security, as technology both in terminal design and passenger profiling would ensure the same rules would apply to regional airports as do currently to major airports. The reform started by the creation of the NPPC needs to be completed and the red tape around the designation process needs to be cut.
The best way to encapsulate the reform already underway is to create a new category of international airport. With the latent traffic demand, low risk profile and intergovernmental cooperation, the Tasman would be the best place to instigate such a new category.
TTF would like to see the New Zealand model of limited international airports replicated in Australia. This new category of airport could be viewed as a transitional category for airports wishing to experiment with international services before committing to a terminal redesign.
RECOmmENDatION
Review the International Airport Operator’s Guide to introduce a new category of international airport restricted to trans-Tasman flights
138 International Airport Operator’s Guide, Department of Infrastructure and Transport, Version 1.2.1139 Ibid140 Fordham, Greg. Planning Airport Terminals for Flexibility and Change, Airport Engineering Innovation, Best Practice and the Environment. Barton, ACT: Institution of Engineers, Australia,
1995: pp. 45-49. National conference publication (Institution of Engineers, Australia); No. 95/07

40 | BRINGING OUR NEIGHBOUR CLOSER
Figure 13 Trans-Tasman passengers to New Zealand airports, 2013
aIRPORt OF aRRIvaL PaSSENGERS
Auckland 1,862,611
Christchurch 496,436
Wellington 336,015
Queenstown 118,707
Dunedin 31,127
Rotorua 11,169
Hamilton 8,703
Total 2,864,768
Source: Bureau of Transport, Infrastructure & Regional Economics (2014), International Airline Activity – City pairs data
Note: Blue shading denotes 24 hour international airports. All other airports are limited international.
Deploy small, inter-agency clearance teamsWithout designation as a full international airport, any regional airport wishing to trial international services or offer seasonal flights is liable to pay an additional levy to fund the border agencies required to process the flights.
Yet without proving the viability of a service through a series of trials, airport operators would be loath to embark on the lengthy and costly process of obtaining full international status.
This paradoxical situation is, in part, an explanation as to why the former federal government’s goal of opening regional airports to international services was not achieved, with the exception of the Sunshine Coast service. The 2009 aviation
white paper set down new guidelines for regional airports wanting to become international airports,141 but did not address the funding question surrounding the provision of government services.
The current situation leads to confusion and business uncertainty. For example, despite being officially designated as only a restricted use international airport, Gold Coast Airport does not pay an additional levy for its customs, immigration and quarantine inspections, as its predecessor Coolangatta Airport launched international services before the rules were established. Conversely, Newcastle Airport used to receive Customs clearance of flights from Norfolk Island ex gratia until those flights ended in 2011, but has been advised it would be liable for the levy if it establishes new international services.
The additional levy is charged in addition to the PMC. Depending on distance from an existing customs base, this levy translates into an additional charge of $8-$38 per passenger on top of the $55 PMC. This additional charge places an additional hurdle in front of aspiring international airports.
Since airlines have to recoup the cost of border processing when trialling new international routes to domestic regional airports in Australia, the charge is highly damaging to a new route’s viability. To put this in context, the $64,000 charge to Air New Zealand during the 2012 trial to Sunshine Coast for Customs processing at a non-designated airport was split between fewer than 6000 passengers in 2012. This equated to a levy of over $11 per head. This is despite an extra $1.5 million in GST receipts that flowed to the federal treasury as a result of the trial (see case study 3).
The additional levy is unjust and provides a disincentive to trial new services. TTF recommends it be scrapped to level the playing field with existing airports.
141 Appendix A, Flight Path to the Future National Aviation Policy White Paper, Australian Government, December 2009
Artist impression of terminal courtesy of Newcastle Airport

BRINGING OUR NEIGHBOUR CLOSER | 41
a FLy- IN, FLy-OUt BORDER FORCEThere is also an opportunity for the federal government to develop a lightweight border processing model that leverages off the technological advances detailed in Reform 1 to deliver secure borders with fewer personnel.
Work towards this goal is already well progressed. Using a risk-based approach, the border agencies handling New Zealand passengers at the Sunshine Coast were able to significantly scale back their presence between the 2012 and 2013 seasons from an average of 20 to eight. This was achieved through delegation of responsibilities and greater use of technology to risk profile passengers.
Any new model would be based on the experience gained by the border agencies after three years of trials at Sunshine Coast Airport (see case study 3). Since TTF would expect these small teams to be funded directly from existing border agency appropriations, there is an incentive for the government to make these work as efficiently as possible.
In New Zealand, there is also a contract with airports restricting the hours of operation for border agency staffing at limited international airports in order to provide business certainty. For example, whereas Wellington has full Customs staffing at all hours except 2am- 4am, Rotorua only has Customs officers present on Tuesdays and Saturdays from 1:30pm until 5:30pm, specifically to process one Sydney-bound flight.142
In Australia, if a new category of airport with less onerous infrastructure requirements could be introduced as outlined above, a new small inter-agency border agency force could be deployed to process all elements of passenger clearance. This would refine the Sunshine Coast trial further.
In New Zealand, for example, teams of as few as six staff meet Australian flights at the limited international airports. Due to the lower risk associated with trans-Tasman flights, New Zealand border agencies operate at lower staffing levels at these ports. To achieve this, customs officers are often proxies for the other agencies under the coordinated border strategy introduced in 2008.143 The small teams of border staff are backed up by personnel in larger cities, where passengers can be transported to larger airports for further questioning in the case of immigration breaches.
Although the majority of Australian arrivals to New Zealand do so through the country’s two 24-hour major international airports, tens of thousands of trans-Tasman passengers arrive into cities served by limited international airports every year (see Figure 13).
In Australia, the announcement of the creation of an Australian Border Force performing both customs and immigration checks144 is a step in the right direction. For smaller airports, TTF believes this could go further and this new force could also be delegated biosecurity and human health authority. Technology would allow high definition video links back to central office for unusual quarantine or disease cases to be assessed and powers of detention delegated to state police offices.
Delegation of biosecurity responsibilities to specially trained Australian Border Force staff would follow a logical move towards single agency coordinated border management, as championed by the World Customs Organization, the World Bank, and other international bodies.145 Consolidation of border agency functions has led to the establishment of both the US Customs and Border Protection and also the Canada Border Services Agency, which both carry out agricultural inspections in addition to immigration checks and customs enforcement.
Even ahead of possible wider organisational change,146 an existing memorandum of understanding between Customs and the Department of Agriculture is in place to foster close cooperation at minor airports.147 This agreement could be used to test the concept of cross-trained border officers, capable of doing immigration, customs and biosecurity checks. This move is also the next logical step on the path to consolidation of inspections that started with the delegation of human health and disease checks in the 1980s and continued through to the creation of a single biosecurity inspection service in 2008.148
This vision is shared in the Customs Blueprint for Reform 2013-2018, which envisages border force officers deployed regionally by locale or function, using mobile technology to communicate back to larger bases in times of unusual operational needs.149
The rapid-deployable teams would be based in capital cities in easy access of a major airport and would fly-in, fly- out of regional airports and seaports. Alternatively, where there is an existing Customs presence, such as at the Port of Newcastle, the Port of Geelong or Customs headquarters in Canberra, the same model could apply to cross-trained local teams. The small squads would be in addition to frontline staff at major airports. Once established, the teams could also service ad hoc cruise ship arrivals and irregular international charter flights. New Zealand arrivals at smaller regional airports would be an ideal testing ground for the new concept of border force flying squads.
142 Customs-designated airports, New Zealand Customs Service/ Te Mana Arai O Aotearoa143 Border Sector Strategy 2008-2013 - A Framework for Collaboration for Border Sector Agencies New Zealand Border Sector Governance Group, 2008144 Minister for Immigration and Border Protection, A new force protecting Australia’s borders, The Hon. Scott Morrison MP Address to the Lowy Institute for International Policy,
Sydney Friday, 09 May 2014145 Kieck, Erich, Coordinated border management: unlocking trade opportunities through one stop border posts, World Customs Journal Volume 4, Number 1146 Clarke, Melissa, Federal Cabinet divided over how much power and resources Australian Border Force should have, Lateline. Australian Broadcasting Corporation, 27 May 2014.147 Sec. 4, Passenger and crew processing at International and minor airports, An Annex to the Memorandum of Understanding on the collaborative working relationships between
the Australian Customs and Border protection Service and the Department of Agriculture, Fisheries and Forestry, Canberra November 2012148 Press release, Federal Minister for Agriculture, Fisheries and Forestry Tony Burke, December 18, 2008149 Blueprint for Reform, 2013-2018, Australian Customs and Border Protection Service, Canberra 2013

42 | BRINGING OUR NEIGHBOUR CLOSER
150 Trans-Tasman Project Final Report, GHD for the Department of Resources, Energy and Tourism (Tourism Division) June 2012151 Ask Canberra! Grey Digital, Canberra 2012
CRUISE tERmINaLSOverseas passenger terminals servicing cruise ships face many of the same problems as regional airports. The level of customs processing required for greeting long-haul itineraries is not required for the level of risk associated with trans-Tasman cruises.
Equally, returning Australians and New Zealanders on international cruises should benefit from the lighter processing envisaged under the Tasman International Airport model. At a minimum, SmartGate kiosks and direct exit paths should be implemented at Sydney’s Overseas Passenger Terminal and Brisbane’s Portside Wharf. The inter-agency flying squad model envisaged for regional airports can then be replicated at smaller cruise shipping terminals.
RECOmmENDatIONS
Remove the additional staffing levy applied to international passenger processing at non-designated airports
Develop a new joint border agency model for small, rapidly deployable teams of cross-trained officers for regional airports
Potential impact of reform 3The goal of opening up additional points of entry to New Zealand flights can only be achieved if the infrastructure costs and border agency staffing costs are both reduced significantly.
People prefer non-stop flights, especially in the medium haul market of New Zealand. Under the GHD modelling, direct flights result in an upswing of around 4.4 per cent for leisure travellers and 14.1 per cent for business. The combined weight is around five per cent.150 Evidence of this preference for direct services can be found in a recent survey of 200 Canberra residents that showed a doubling of intention to visit New Zealand in the next two years from 17 per cent to 34 per cent if the transfer in Sydney could be avoided.151
Through reform to the international airport designations, a new category of international regional airport could be created and staffed at a lower level by border agencies for trans-Tasman flights. Looking at the ten airports identified by GHD as having potential for direct trans-Tasman flights, the current lost opportunity to the Australian tourism industry could be as large as 102,000 additional visits by New Zealanders.
Based on the assumption that most services would be operated by 170-seater narrow body jets, there would be around 100 New Zealanders on every flight at typical splits. Even at small airports with potential only for seasonal services like Ballina-Byron, this equates to around 3,100 additional visitors per year. At the larger airports, like Avalon, Canberra and Newcastle, year-round services would swell the pie by at least 15,000 per year at each airport (see Figure 14).
Services start small, but grow as more people become aware of them. The Sunshine Coast is an example: Air New Zealand has grown seat capacity each year by extending the season and adding extra flights. In 2014, the airline will offer around 13,000 seats on the route, up 75 per cent from the 7500 available in 2012.
GHD also argued there would be little substitution effect, as any new services would attract new customers rather than diverting from existing airports. This assumption is supported by the winter 2012 trial by Air New Zealand into the Sunshine Coast, during which period New Zealand traffic to Brisbane also grew by three per cent.
In order to produce a low estimate of the impact of this reform, it is worth narrowing the forecast down to the three most likely initial airports (Canberra, Newcastle and the Sunshine Coast), where physical infrastructure is already either in place or underway to accommodate international services. Even opening just these three could lead to an additional 45,600 New Zealanders visiting Australia each year.
The next two airports likely to be in a position to welcome trans-Tasman services would be Avalon and Hobart, which would take the total additional to over 76,000. Longer term, if all ten airports opened direct services, the number of additional New Zealand visitors to Australia would be over 100,000 (see Figure 14).
Image courtesy of ACBPS

BRINGING OUR NEIGHBOUR CLOSER | 43
Figure 14 Potential additional arrivals at regional airports
tImE SCaLE aIRPORt OF aRRIvaL
WEEkS OF OPERatION
FLIGHtSPER
WEEk
aIRCRaFt tyPE
SEatSPER
FLIGHt
LOaDFaCtOR
PaSSENGERSPER FLIGHt
aDDItIONaL PaSSENGERS
PER yEaR
aDDItIONaL NZ PaSSENGERS
PER yEaR
Short-Term
Newcastle 52 4 A320 168 75% 126 26,200 18,900
Canberra 52 6 E-190 94 75% 71 22,000 15,800
Sunshine Coast
40 3 A320 168 75% 126 15,100 10,900
Medium-Term
Avalon 52 3 A320 180 80% 144 22,500 16,200
Hobart 52 3 E-190 168 75% 126 19,700 14,200
Longer-Term
Mackay 48 2 A320 168 75% 126 12,100 8,700
Townsville 48 2 A320 168 75% 126 12,100 8,700
Great Barrier Reef*
17 3 A320 168 65%# 109 5,600 4,000
Ballina-Byron 17 2 A320 168 75% 126 4,300 3,100
Coffs Harbour 17 2 E-190 94 75% 71 2,400 1,700
All airports 141,900 102,200
Assumptions: 75% load factor (except 80% at AVV), 72% of passengers originate in New Zealand (based on MCY trial). Embraer E-190 maximum seats 94, A320 maximum seats 164-190 configuration-dependent. # Hamilton Island airport runway length reduces maximum seats on A320. * Formerly Hamilton Island Airport.
Image courtesy of Tourism Australia

DUaL-DEStINatION It INERaRIESTravellers today make choices on their destinations based on the lure of a country, its people, places and food. But the cost and inconvenience of reaching a destination is also considered early in the decision-making phase. Visitor visas fall into the category of potentially costly and burdensome pre-embarkation government processes that could deter potential travellers to visit Australia.
This point is underscored by a 2013 report for the United Nations World Tourism Organization (UNWTO) and the World Travel & Tourism Council (WTTC).152
“ tRavELLERS SEE vISaS maINLy aS a FORmaLIty tHat ImPOSES a COSt. IF tHE COSt OF OBtaINING a vISa – EItHER tHE DIRECt mONEtaRy COSt ImPOSED IN tHE FORm OF FEES OR tHE INDIRECt COStS, WHICH CaN INCLUDE DIStaNCE, tImE SPENt WaItING IN L INES, aND tHE COmPLExIty OF tHE PROCESS – ExCEEDS a tHRESHOLD, POtENtIaL tRavELLERS aRE SImPLy DEtERRED FROm makING a PaRtICULaR jOURNEy OR CHOOSE aN aLtERNatIvE DEStINatION WItH LESS HaSSLE.” unWTo AnD WTTC
Australia was a signatory to the very first UN protocol in 1963 that recommended visa-free travel as a way to foster international travel and tourism153 and made some impressive headway in achieving this goal in the 1990s and early 2000s through the introduction of both low-cost electronic travel authorities154 (ETA) for some Asian and North American visitors and the free eVisitor visa open to all Europeans.
However, Australia has been slower in recent years in rolling out this progress to Asian visitors, aside from those already covered by earlier agreements. In contrast to the two-minute online application and fee-free visa a British or French citizen can expect before a visit to Australia, an Indonesian or Chinese visitor will have to pay $130 for an application, plus associated costs and endure an application process that is lengthy and laborious.
Countries covered by New Zealand’s visa waiver scheme are largely aligned with those eligible for either Australia’s ETA or eVisitor visa155, being comprised of European, North American and several Asian countries. For those countries outside the New Zealand visa waiver scheme, the application is similar in time and expense to that of Australia’s.
As both our source markets shift from traditional markets of Europe and North America to Asia, it would be reasonable to expect that without reform, fewer visitors will take joint-country itineraries than do so presently. To ensure neither misses out on the full potential, both countries should investigate opportunities for common visitor visas.
152 World Tourism Organization and World Travel & Tourism Council, The Impact of Visa Facilitation in APEC Economies, UNWTO, Madrid 2013153 United Nations Conference on International Travel and Tourism (1963), Recommendations on International Travel and Tourism, Rome, September 1963154 Electronic Travel Authority, Department of Immigration and Border Protection155 Visa-waiver countries (effective 1 July 2013), Immigration New Zealand / Ta Ratonga Manene, April 2014
REFORm 4 DEvELOP COmmON vISItOR vISaS

FULLy INDEPENDENt CHINESEThis requirement will become more pressing as China progressively moves away from group tours towards fully independent travel. Currently both Australia and New Zealand offer Approved Destination Status visas for Chinese citizens travelling as part of an organised tour. However, recent changes to ADS approval, which is regulated by both the immigration officials of the destination country and by the China National Tourism Administration,156 prohibited commission-based add-ons that reduced the lead-in price of the package.
Prices for escorted tours of Australia doubled following the introduction of the new China Travel Law in October 2013157 and Chinese arrivals fell by nine per cent in November last year partly as a result. However, the fall in group visa travellers has been accompanied by a rise in the standard class of visitor visas, both in Australia and New Zealand.158
The risk going forward is that fewer Chinese travellers take in both Australia and New Zealand in a single itinerary now that travellers have to apply for their own visa (the ADS subclass could be completed and lodged by a travel agent). Auckland-based consultants Covec found that Chinese visitors were highly likely to cross the Tasman (some 54 per cent) when the two countries were packaged together.159 Looking at a parallel with the Japanese market, where today only eight per cent visit both Australia and New Zealand in a single trip (compared with 45 per cent in the 1990s), the tourism industry fears a decline in dual-destination itineraries. This issue was identified by a recent New Zealand government study of the Chinese market that showed the country was potentially losing out on tourists put off by having to apply and pay twice.160
To counter this, Australia and New Zealand need to reduce the complexity and cost involved in applying for visitors visas. Each government can do so unilaterally, but there is also an opportunity to do so collectively.
Reforms to the trans-Tasman border arrangements outlined in the first three reforms in this paper are underpinned by greater cooperation and data sharing between the two countries. This would also open the door to the issuance of common visitor visas. Other friendly neighbours have
already recognised the competitive advantage that offering dual-destination itineraries presents in a crowded tourism marketplace.
Most obvious is the Schengen zone of 28 European countries, which offers one visa for travel throughout the zone for 90 days. Individual states can restrict entry into their country, although in practice this is rarely applied. The halo effect of France and Italy (which rate far higher as destinations among Chinese than other European countries) shines on their neighbours: some 32 per cent of Chinese visitors to France also visit one of its Schengen neighbours.
The United Kingdom and the Republic of Ireland have been spurred into action by their own poor performance in attracting Chinese visitors relative to other European countries. In 2012, almost 180,000 Chinese tourists visited the UK, compared with 1.4 million Chinese visiting France.161
The UK and Ireland lie outside the Schengen zone and until recently each required separate visas on top of Schengen. The neighbours agreed in June 2013 to fully align their tourist visa regimes and issue joint visitor visas.162
In the case of transgression, third country nationals can be denied boarding for flights and ferries between the UK and Ireland.163 In the context of Australia and New Zealand, any arrangement would also need to take into account the semi-autonomous external territories associated with each country. Specifically Norfolk Island,164 the Cook Islands,165 Niu 166 and Tokelau167 maintain their own immigration rules. A parallel would be the Crown Dependencies of Jersey, Guernsey and the Isle of Man, which are part of the Common Travel Area of the British Isles but retain legislation on immigration, residency, and citizenship. Airlines and ferries are required to pass passenger details to island officials.168
Elsewhere destinations keen to grow the tourism economy are working with neighbours to grow the collective pie. Rwanda, Kenya and Uganda announced a new single tourist visa will be available from January 2014 to citizens of 40 countries169 (mainly European Union) while citizens of 33 approved countries (again, mainly European Union) may apply for a joint tourist visa for free travel between Qatar and Oman.170
156 Fact Sheet 58 – China: Approved Destination Status. Department of Immigration and Border Protection157 Allen, Lisa. Winners and losers as China hits the brakes on rip-off tours, The Australian. January 18, 2014158 Market Trends – China, Tourism New Zealand, 19 November 2013159 Carboni, Andrea & Schiff, Aaron, NZ Aviation Operational Environment: Selected Analysis. Covec.5 October 2010160 China Market Review, Ministry of Business, Innovation and Employment / Hikina Whakatutuki, April 2013161 Tourisme: la DGCIS au service des acteurs de la filière, La DGCIS & Vous, N°12, la Direction générale de la compétitivité, de l’industrie et des services (DGCIS), Paris, November 2013162 Smyth, Jamie. UK and Ireland plan visa-free common travel area to boost growth, Financial Times, 17 July, 2013163 If you are travelling to or from the Republic of Ireland, the Channel Islands or the Isle of Man, leaflet, UK Border Agency, Home Office. London 2013164 Fact Sheet 59 - Immigration Arrangements for Norfolk Island,Department of Immigration and Border Protection165 Employment & Applying for a Work Permit, Cook Islands Government166 Getting to Niue. Niue Tourism website167 Tokelau Immigration Regulations 1991 (SR 1991/117). Parliamentary Counsel Office / Te Tari Tohutohu Paremata168 Immigration (Passenger, Crew and Service Information – Police Powers) (Jersey) Order 2013. States of Jersey.169 Wahito, Margaret. EAC to reap from joint tourist visas from 2014, Capital FM Business & Finance, Nairobi 6 November 2013170 Joint Tourist Visa, Hukoomi, Qatari- e-Government
BRINGING OUR NEIGHBOUR CLOSER | 45

46 | BRINGING OUR NEIGHBOUR CLOSER
DEStINatION aUStRaLaSIa In many of our traditional tourism markets, potential visitors see Australia and New Zealand as one destination. Australia and New Zealand are often brochured together in key European markets, backpackers often tailor their own itineraries including both countries, and cruise line sailing itineraries routinely include both countries (see pictures below).
In total, around 40 per cent of all non-Australian visitors to New Zealand are dual-destination visitors to both Australia and New Zealand.171 Some of this is logistical; in the USA, New Zealand is an obvious stopover for Australian holidays either on the outward or return leg172 and, having flown so far, Europeans seize the opportunity to take in both countries.
But coordinated tourism promotion is also a factor. In June 2013, Air New Zealand signed a $6 million cooperative marketing agreement with Tourism Australia that stressed promotion of dual-country itineraries.173 Also, after years of having rival stands at major trade fairs, Australia and New Zealand joined forces to create a combined Australasian stand at the world’s largest, the Internationale Tourismus-Börse (ITB), in Berlin in 2013.174
At a regional level there is cooperation too. For example, the Great Southern Touring Route along Victoria’s Great Ocean Road and the Great New Zealand Touring Route on the North Island’s Coromandel Peninsula were promoted together as the Great Downunder Tour175 for several years under a partnership between the two regions’ tourism boards.
This kind of dual-destination itinerary is possible for visitors from Australia and New Zealand’s traditional long-haul tourism markets of Europe and North America, because visitors can travel visa-free to New Zealand and obtain either a $20 electronic travel authority or fee-free eVisitor visa to travel to Australia.
Airlines can offer attractive ticket prices by using circle fares, open jaw, or round-the-world tickets that include both Australia and New Zealand. This is a straightforward ticketing issue for airlines that improves the yield on the point-to-point services. But the opportunity to sell open jaw tickets to the new wave of tourists coming from the burgeoning middle classes of Asia will be compromised by the reality that, unlike our traditional visitors, citizens of many Asian countries will have to apply and pay for two visas.
171 Carboni, Andrea & Schiff, Aaron, NZ Aviation Operational Environment: Selected Analysis. Covec.5 October 2010172 Performance of Qantas Vacations and Viva! Holidays in North America, Annual report 2013, Jetset Travelworld Limited and Controlled entities173 Sandilands, Ben. Air NZ tourism deal points to more trans-Tasman action, Crikey, June 30, 2013174 Media release – ITB Berlin 2013: high demand from the Middle East, Asia and South America, 18 January 2013175 Promotional literature, Great Downunder Tour, Geelong Otway Tourism and Tourism Coromandel, 2011
The Australia and New Zealand Panorama 2014 by escorted tour specialist Trafalgar Tours
Examples of joint Australia-New Zealand brochures from European markets

BRINGING OUR NEIGHBOUR CLOSER | 47
CRICkEt WORLD CUP 2015The Cricket World Cup, taking place in 2015 jointly in Australia and New Zealand, raised the spectre of tourism not being maximised due to visa restrictions. Although many of the travelling cricket fans (such as those following England) can travel freely between Australia and New Zealand, those travelling from India would have had to apply and pay twice. Since venues for the matches are evenly spread between the two countries,176 many fans are likely to include some trans-Tasman travel.
The tourism industry on both sides of the Tasman welcomed the announcement decision by prime ministers Abbott and Key in February 2014 to allow Cricket World Cup visitors to apply once for a visa to visit both countries.177 The visa pilot program will run for the duration of the tournament and apply Australian visa rules for visitors wishing to visit both countries during their trip.
This prompted both governments to act, pledging a unified application system for the tournament. Until this event, Australia and New Zealand had not explored the possibility of issuing joint visas. Yet as Asia becomes the dominant source market for both Australia and New Zealand tourism industries, the barrier to dual-destination travel presented by having to obtain two separate visas will become even more evident.
The joint visa approach is being taken in other free trade areas. In June 2013, Indonesia, Myanmar, Cambodia, and the Philippines launched a plan for a common electronic
visa. The stated aim was to enhance tourism and foster economic growth in the region.178 The e-visa, modelled on Australia’s ETA, builds on the common visa program between Cambodia and Thailand that started in January 2013 and will be extended to other members of the Association of South East Asian Nations (ASEAN) as their immigration systems comply to joint standards.179
We believe that as the logistics of a joint visa for the Cricket World Cup are worked out, the experience of the Department of Immigration and Border Protection working together with Immigration New Zealand will provide an excellent starting point to review challenges and use learnings for the future creation of joint visitor visas. Furthermore, the memoranda of understanding, data transfer protocols, and information system harmonisation efforts that have been put in place for the Cricket World Cup will enable the roll out of common visas longer term.
New Zealand has already moved to harmonise its entry requirements with those of Australia to some extent and to iron out areas of Australian concern. For example, New Zealand’s visa waiver scheme now extends to those covered by either Australia’s eVisitor or ETA schemes, Pacific Island nations having been moved to a new class of entry visa180 for New Zealand. As New Zealand digitises its immigration system, it is anticipated that those in its visa waiver scheme will be required submit pre-travel passenger information in a similar manner to the Australian ETA process, rather than be granted a visa on arrival.
176 ICC Cricket World Cup 2015 – information for host cities, CWC2015 Ticketing Program177 Media Release, Hon Tony Abbott MP, Prime Minister of Australia joint statement with New Zealand Prime Minister John Key, 7 February 2014178 Kunakornpaiboonsiri, Thanya, ASEAN Countries to adopt common smart visa scheme. Asia Pacific FutureGov 11 June 2013179 Media release, Association of South East Asian Nations, Naypyidaw, 5 June 2013180 Pacific Access Category, Immigration New Zealand / Ta Ratonga Manene
Mitch Gunn – Shutterstock.com

48 | BRINGING OUR NEIGHBOUR CLOSER
INtERIm mEaSURESTrue common visitor visas would require Australia and New Zealand to harmonise entry requirements as well as establish data sharing protocols covering passenger data and assessments. None of this is impossible, but as the Cricket World Cup process shows, New Zealand acceptance of Australian visa decisions is an easier first step towards an eventual common visa regime across Australia and New Zealand.
A further example of a free trade neighbour leveraging off the efforts of its partner is Canada, which is offering a visa waiver for those Mexicans who have already been granted a US visitor visa. In the first year of the Can+ program, Canada recorded a 16.6 per cent increase in Mexican visitors.181
This mutual acceptance allows one country’s immigration agency to leverage off the work of a trusted neighbour.182 Ireland, for example, introduced a short-stay visa waiver program in July 2011 for any traveller with a valid UK visitor visa. Visitors have to pass through the UK and be processed by British border agents prior to arrival in Ireland and produce a stamped passport upon arrival into Ireland to prove their status.183 The agreement covers 19 non-EU countries, including China.
Similarly, some African and South Asian visitors to Turkey are eligible for visas on arrival if they hold a valid US, UK or Schengen visa and have a return air ticket.184
This practice is not restricted to neighbouring states. Some less developed nations accept visas issued by highly developed countries whose entry requirements they trust. For example, certain higher-risk nationalities such as Russians, Lebanese, Malaysians, Afghans and Algerians can enter Costa Rica without a visa if they already hold a valid visa issued by an EU country, the USA, Canada, Japan or South Korea.
As an interim measure the acceptance of Australian visas by New Zealand would be a straightforward option and could be limited to certain visa classes as a trial. There is a short-term opportunity, for example, for New Zealand to offer the 500,000 foreign students in Australia visa waivers185 to encourage them to cross the Tasman while pursuing education.
Another short-term measure could be for key cities to permit short-term visits by citizens of non-visa waiver countries in restricted zones. Proof of onward travel to Australia would be required upon arrival in New Zealand.
A parallel would be the 72-hour visa free policies of various Chinese cities introduced in August 2013 that allow tourists from 45 countries to stay for three days without a visa.186 Similarly, special tourist zones in most Mexican states bordering the USA, extending some 40-110km, allow visa-free travel for 72 hours.187
In the New Zealand context, the application of this kind of temporary exemption would be for inbound tour groups and could be restricted to the greater Auckland or Christchurch areas as part of an Australian itinerary.
RECOmmENDatIONS
Australia and New Zealand to build on experiences from the Cricket World Cup to develop joint visitor visas
New Zealand to offer visa waivers to subclasses of Australian visa holders
181 Canadá flexibiliza trámite de visa para mexicanos, Excelsior En Línea. Mexico City, 12 May 2014182 The Impact of Visa Facilitation on Job Creation in the G20 Economies, UN World Tourism Organization (UNWTO) and the World Travel & Tourism Council (WTTC), Madrid 2012183 Irish Naturalisation and Immigration Service, the Irish Short-stay Visa Waiver Program, Information Note, Department of Justice and Equality / An Roinn Dlí agus Cirt agus Comhionannais,
Dublin, March 2012184 The Impact of Visa Facilitation on Job Creation in the G20 Economies, UN World Tourism Organization (UNWTO) and the World Travel & Tourism Council (WTTC), Madrid 2012185 Grow sustainable air connectivity – Tourism 2025 – Growing Value Together / Manaakitanga 2025 – Whakatipu Uara Ngätahi, Tourism Industry Association New Zealand, March 2014186 Media Release, New 72 Hour Travel Without Visa Policy To Begin August 1, China Southern Airways187 U.S.–Mexico Border Information (927i), American Automobile Association

BRINGING OUR NEIGHBOUR CLOSER | 49
Potential impact of reform 4Gauging the impact of visa facilitation on tourist arrivals is a complex proposition. The most comprehensive analysis of the policy implications of easing visa restrictions was conducted jointly by the United Nations World Tourism Organization and the World Travel & Tourism Council in June 2012 ahead of a summit of tourism ministers from the group of twenty leading economies (G20).188 Its report analysed case studies of visa liberalisation across the G20 and beyond.189
The policy effect for each case study ranged from one per cent growth in arrivals to 90 per cent. However, most fell into two broad bands, with an average growth achieved of 5.4 per cent for low impact visa reforms such as electronic visas, to an average of 24.8 per cent for high impact reforms, such as visa waiver programs. Equally, past experience can be a guide: Australia’s own ETA program was followed by an average annual growth of 8.9 per cent for visitors from eligible nations in the three years after its introduction in 1996.190
The report was updated and methodology refined a year later and widened to look at all economies within the Asia-Pacific Economic Cooperation forum. In attempting to quantify the
potential effect of visa policy reform in the Tasman space, this latter report is useful as it paints a low end and high end estimate for both Australia and New Zealand. Australia, it predicts, would see visitation swell by between 6.9 and 9.1 per cent through visa reform,191 while New Zealand would benefit by 9.6-12.9 per cent (see Figure 15).
In attempting to model the impact of visa reform in the trans-Tasman context, replacing two visa applications with a single process represents the major reform that would induce demand for dual destination itineraries. The inducement could be greater if the cost of this common visa were also significantly cheaper than the $270 applicable today through two sets of visa processing fees. As outlined previously, some 40 per cent of third-country arrivals to New Zealand already also take in Australia on the same trip. In preparing our forecast of the impact of common visitor visas, we have discounted those travellers who already do visit both countries (see Figure 15). No additional growth is forecast from those countries who currently require no visa to enter New Zealand and who are eligible for ETAs to visit Australia.
Figure 15 Potential additional Asian visitors to Australia and New Zealand through implementation of common visitor visas
COmmON vISaS REDUCED FEE COmmON vISaS
kEy aSIaN maRkEtS
aUStRaLIaN Eta vISa
NEW ZEaLaND vISa WaIvER
aRRIvaLS 2013 (aCtUaL)
aRRIvaLS 2020 (FORECaSt)
2020 FORECaSt
aDDItIONaL aRRIvaLS
2020 FORECaSt
aDDItIONaL aRRIvaLS
China N N 704,557 1,327,259 1,427,018 99,759 1,459,549 132,291
Singapore Y Y 297,754 437,732 437,732 - 437,732 -
Japan Y Y 304,096 330,933 330,933 - 330,933 -
Malaysia Y Y 239,866 364,859 364,859 - 364,859 -
South Korea
Y Y 188,755 250,967 250,967 - 250,967 -
HongKong Y Y 164,128 215,186 215,186 - 215,186 -
India N N 153,626 230,614 247,050 16,436 252,336 21,722
Indonesia N N 121,347 179,374 191,983 12,608 196,023 16,649
Taiwan Y Y 99,146 138,590 138,590 - 138,590 -
Thailand N N 72,742 89,461 95,983 6,523 98,094 8,633
Philippines N N 59,619 83,991 89,963 5,972 91,883 7,891
TOTAL 141,297 187,186
Note: Projected scenario analysis by TTF using impact of visa reform modelling by United Nations World Tourism Organization and World Travel & Tourism Council in showing a low estimate of 6.9% and a high estimate of 9.1% growth for arrivals to Australia through visa reform and a low estimate of 9.6% and a high estimate of 12.9% growth for New Zealand under the same conditions. TTF has taken common visa to be a low impact reform and a reduced fee common visa to be a high impact reform for this calculation.
Arrivals figures shown represent the base potential market of visitors to Australia and New Zealand in 2013 with those visiting both removed. To make this calculation we have applied a 40% reduction in total arrivals to New Zealand from the markets above, as per national average of arrivals to New Zealand on dual destination itineraries, as supplied by Covec consultants. Australian arrivals have been reduced by 20% as a TTF estimate of those on dual destination itineraries also including New Zealand.
Base source: Overseas Arrivals and Departures, Australian Bureau of Statistics and International Visitor Arrivals, Statistics New Zealand. 2020 forecasts from Tourism Forecasts, Autumn 2014,
Tourism Research Australia and New Zealand Tourism Sector Outlook, Forecasts 2013-2019, Ministry of Business, Innovation and Employment (2013).’
188 Argentina, Australia, Brazil, Canada, China, France, Germany, India, Indonesia, Italy, Japan, Mexico, Russia, Saudi Arabia, South Africa, South Korea, Turkey, United Kingdom and United States of America, with the European Union as an observer and Spain as a permanent invitee
189 The Impact of Visa Facilitation on Job Creation in the G20 Economies, UN World Tourism Organization (UNWTO) and the World Tr avel & Tourism Council (WTTC), Madrid 2012190 ibid191 The Impact of Visa Facilitation in APEC Economies. United Nations World Tourism Organization and World Travel & Tourism Council, Madrid, 2013.

50 | BRINGING OUR NEIGHBOUR CLOSER
For New Zealand, the benefit is likely to be higher than for Australia, given the larger country’s status as an air transport hub. In 2013, over half of all Chinese visitors to New Zealand transited through an Australian airport en route to Auckland or Christchurch.192 An analogous example for New Zealand is Ireland, whose visa waiver for Asian visitors holding a valid UK visa resulted in a 21 per cent increase in arrivals in the first year of the waiver program.193
Looking at the Asian target markets defined by Tourism Australia under the Tourism 2020 strategy, New Zealand’s visa waiver program extends to the same countries as Australia’s ETA scheme. Given the relative ease of trans-Tasman travel for these visitors, little growth would be anticipated from common visas or reciprocal acceptance of visitor visas. But for citizens of China, India, Indonesia, Philippines and Vietnam, who all require visas to visit both Australia and New Zealand, the gains that harmonised Australasian visas could deliver could be significant in achieving the Tourism 2020 (and New Zealand’s Tourism 2025) targets.
Some 43 per cent of the world’s population require a paper visa to enter Australia and 77 per cent to enter New Zealand (see Figure 16). Add this complexity to the cost of visas and you can see the potential for reform.
Based on a weighted increase to both countries’ arrivals from Asian countries currently requiring visas, a conservative estimate of the impact a move to an affordable common electronic travel authority valid in both countries shows such a product would lead to an additional 132,000 Chinese arrivals to Australia and New Zealand by 2020 and 190,000 additional visitors from all target Asian countries whose citizens currently require a full visa to complete a trans-Tasman itinerary. This kind of shift would be the game changer the governments of both countries need to achieve their ambitious tourism strategies.
192 International Visitor Arrivals to New Zealand: November 2013, Statistics New Zealand / Tatauranga Aotearoa Wellington 2013193 O’Halloran, Barry, Irish and British governments to trial common tourist visa this year, The Irish Times, 18 July 2013
Figure 16 Global population by visitor visa application types to Australia and New Zealand, 2013
OPENNESS vISa WaIvER vISa ON aRRIvaL ELECtRONIC vISa PaPER vISa
Australia - 0.6%* 57.0% 42.4%
New Zealand 23.0% - - 77.0%
World average 18.0% 15.0% 3.0% 64.0%
Sources: New Zealand - The Impact of Visa Facilitation in APEC Economies. UNWTO and WTTC. Australia – TTF analysis based on UNWTO/WTTC figures and minutes from Tourism Visa Advisory Group meeting June 2014’
Note: *denotes New Zealand Special Purpose Visa granted on arrival in Australia


a centenary to celebrateThis paper sets out the immediate next steps needed to stimulate the trans-Tasman market.
The Tasman is a relatively mature market and one that is very price sensitive. Despite this, there remains latent demand which can be stimulated through operational shifts to our border processing regime. Increasing access and affordability will encourage more trips from New Zealand to Australia.
TTF firmly believes that opening up major regional airports in Australia to flights from New Zealand, as has already begun with trial services to the Sunshine Coast, is an easy way to stimulate demand. We believe too that more can be done to streamline the experience at major airports to bring the total travel time down to below five hours by both automating departure controls and moving to self-declarant exit channels for biosecurity. This will expedite legitimate travel while lowering the cost for using border services.
This lower cost needs to pass back to travellers in the form of a reduced passenger movement charge. Australia’s departure tax is the highest among OECD countries for short-haul traffic and places a very real barrier in the way of maximising the existing spare capacity on trans-Tasman air routes.
We believe too that joint visitor visas, increasingly common in the rest of the world between neighbouring states, will be achievable between Australia and New Zealand. The Cricket World Cup 2015 will provide a test case on which to base future plans. These will be crucial in ensuring Asian visitors combine our two nations in one itinerary into the future, as visitors from our traditional markets do today.
All of these measures are achievable in relatively short timeframes. As the centenary year of our ANZAC collaboration, 2015 is the year to move on these reforms to commemorate our shared history and to cement even closer future ties between Australia and New Zealand to our mutual benefit.
In addition to the historic links between our two countries, Australia and New Zealand are also bound by a free trade treaty, the Closer Economic Relations pact. The tightening of travel restrictions during the 30 years of the treaty runs contrary to its aims and practices.
Border agency reform is being undertaken in Australia and New Zealand, moving towards a risk-profiling model. Using technology to understand the risk posed by travellers allows border agencies to be leaner and more targeted in their intervention. Legitimate travellers need not be impeded any more.
While this move will eventually extend to visitors from all countries, the Tasman has long been a testing ground for new ideas. The governments on each side trust and know each other and have similar requirements. Moves are underway on many of the initiatives outlined in this paper. What is needed is for an overarching government strategy to celebrate a century of Australia-New Zealand cooperation and mark this symbolically through eased travel restrictions.
CONCLUSION


54 | BRINGING OUR NEIGHBOUR CLOSER
For further information, please contact:
Tourism & Transport Forum (TTF) Level 8 8-10 Loftus Street Sydney NSW 2000 T: +61 2 9240 2000 www.ttf.org.au