Embed Size (px)
DESCRIPTION
Tuition Policy Advisory Committee Meeting September 2, 2003. Committee Meeting #1. Today’s Agenda. President’s Welcome Procedural Issues Background Information recent history university finances… next year’s budget tuition & fees. Welcome and Thank You for Agreeing to Serve!. - PowerPoint PPT Presentation
Citation preview

Tuition Policy AdvisoryTuition Policy AdvisoryCommittee MeetingCommittee Meeting
September 2, 2003September 2, 2003
Committee Meeting #1

Today’s AgendaToday’s Agenda
President’s WelcomePresident’s Welcome Procedural IssuesProcedural Issues Background InformationBackground Information
– recent historyrecent history– university finances…university finances…– next year’s budgetnext year’s budget– tuition & feestuition & fees

Welcome and Thank You Welcome and Thank You for Agreeing to Serve!for Agreeing to Serve!

Procedural IssuesProcedural Issues

Working TimelineWorking Timeline
September October NovemberWeek Beginning 2 8 15 22 29 6 13 20 27 3 10 17 24
Recommended Working Timeline: TPC Meeting Sessions TPC Public Hearing Tuition Policy Committee presents recommendation to President Public Hearings / Comment Period (2 Hearings) President develops final Regental recommendation Submission date for Chancellor / Regent's Materials Chancellor Tuition Policy Deliberations Regents Tuition Meeting - 11/18

Recent HistoryRecent History
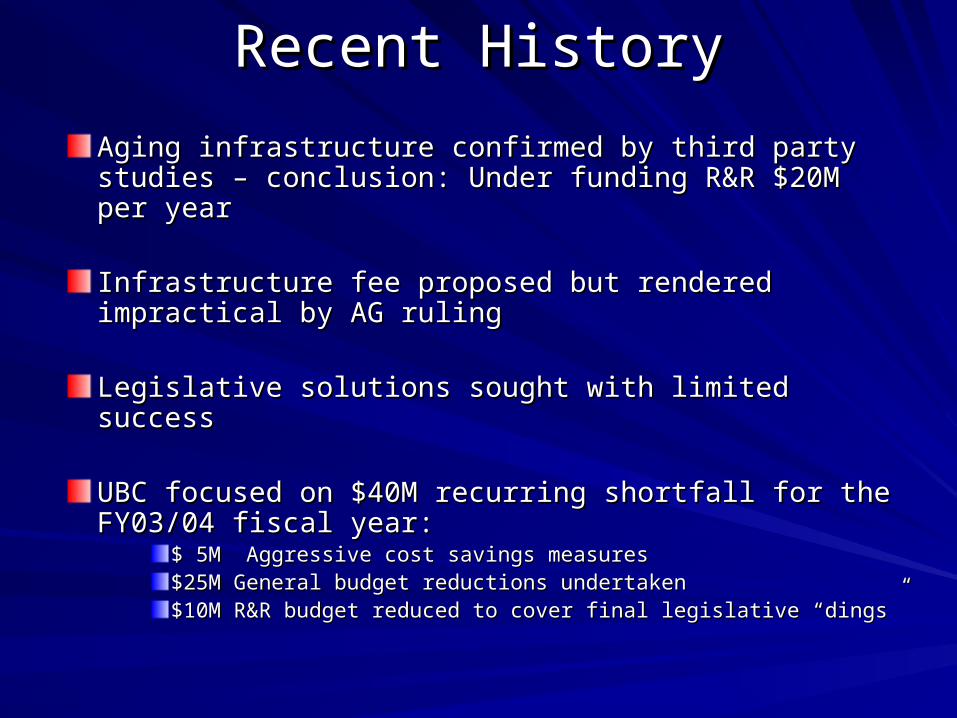
Recent HistoryRecent History
Aging infrastructure confirmed by third party studies – Aging infrastructure confirmed by third party studies – conclusion: Under funding R&R $20M per yearconclusion: Under funding R&R $20M per year
Infrastructure fee proposed but rendered impractical by Infrastructure fee proposed but rendered impractical by AG rulingAG ruling
Legislative solutions sought with limited successLegislative solutions sought with limited success
UBC focused on $40M recurring shortfall for the FY03/04 UBC focused on $40M recurring shortfall for the FY03/04 fiscal year: fiscal year:
$ 5M Aggressive cost savings measures $ 5M Aggressive cost savings measures $25M General budget reductions undertaken$25M General budget reductions undertaken$10M R&R budget reduced to cover final legislative “dings”$10M R&R budget reduced to cover final legislative “dings”

Legislative Session OutcomeLegislative Session OutcomePositivesPositives NegativesNegatives
• 100% IDC Retention 100% IDC Retention +$20M+$20M
• Tuition FlexibilityTuition Flexibility
• Continued downward Continued downward trend in State financial trend in State financial supportsupport
GR reduction GR reduction ($22M)($22M)
P/T Benefits P/T Benefits ($6M)($6M)
90 Day Wait 90 Day Wait ($2M)($2M)
TX Tomorrow TX Tomorrow ($3M)($3M)
B-on-Time B-on-Time ($?M)($?M)
Higher tuition set Higher tuition set asidesasides
$20M
-$33M

Budget issues to Deal withBudget issues to Deal with
$30M annual shortfall in R&R funding$30M annual shortfall in R&R funding– $20M annual coming into the year$20M annual coming into the year– $10M reduction to balance the Fy03/04 $10M reduction to balance the Fy03/04
budgetbudget
$15M recurring shortfall in competitive $15M recurring shortfall in competitive compensation funding compensation funding

University FinancesUniversity Finances

Total University Total University BudgetBudget
Educational Educational & General & General ComponentComponent
59%59%
Endowment Endowment ComponentComponent
9%9%
Research Research ComponentComponent
20%20%
Auxiliary Auxiliary ComponentComponent
12%12%
$846.7M$846.7M+ 6.8%+ 6.8%
University FinancesUniversity Finances
FY03/04 Total University Budget $1.44BFY03/04 Total University Budget $1.44B
$176.6M $176.6M + 2.2%+ 2.2%
$129.1M $129.1M – 1.0%– 1.0%
$292.2M $292.2M + 12.6%+ 12.6%
$1.44B $1.44B + 4.7% + 4.7%
or $63Mor $63M

University FinancesUniversity Finances
How does State General Revenue fit into the Picture?How does State General Revenue fit into the Picture?
30 Years 20 Years 10 Years Today
(in millions) 1972/73 1982/83 1992/93 2003/04
State GR Funding 57.9$ 168.8$ 207.7$ 291.8$
Total Budget 119.9$ 360.6$ 726.9$ 1,444.6$
Percent State Funding 48.3% 46.8% 28.6% 20.2%
adjusted for expense shift ===> 19.4%

The Permanent University Fund (PUF)The Permanent University Fund (PUF)Why isn’t it enough?Why isn’t it enough?
PUF LandsPUF Lands ==> 02’ Market Value $6.7B==> 02’ Market Value $6.7B
AAvailable vailable UUniversity niversity FFundund
2/3 UT System2/3 UT System 1/3 A&M System1/3 A&M System
System CostsSystem Costs
PUF BondsPUF Bonds
UT AustinUT AustinUT Austin receives about 30% of the
total distributed income from the PUF
UT AustinUT Austin
<== return on investmentreturn on investment
Fy03/04 $109.4MFy03/04 $109.4M

Next Year’s BudgetNext Year’s Budget

Budget AccomplishmentsBudget Accomplishments
For our StateFor our State
• Improved research competitiveness Improved research competitiveness
For our StudentsFor our Students
• Additional faculty positionsAdditional faculty positions
• Increased tuition & scholarship supportIncreased tuition & scholarship support
• Capacity to invest in specific programmatic Capacity to invest in specific programmatic initiativesinitiatives
For our EmployeesFor our Employees
• Preservation of a competitive benefit programPreservation of a competitive benefit program
• Possibility of mid-year salary programPossibility of mid-year salary program

It was a challenge to balance the It was a challenge to balance the budget!budget!
Efficiency ImprovementsEfficiency Improvements
• $5M from Office Supplies & Credit Card $5M from Office Supplies & Credit Card changes…more to comechanges…more to come
Across-the-board Budget ReductionsAcross-the-board Budget Reductions
• $25M total reductions…$4M from $25M total reductions…$4M from occupied occupied positionspositions
Reduced Infrastructure FundingReduced Infrastructure Funding
• $10M reduction in an area already $10M reduction in an area already under under funded!funded!

What are our Continuing What are our Continuing Challenges?Challenges?
Infrastructure Funding - $30M Infrastructure Funding - $30M annual shortfallannual shortfall

Facility Aging Drives Repair & Renovation (R&R) Facility Aging Drives Repair & Renovation (R&R) RequirementsRequirementsThere is a significant bubble of R&R requirements in the near There is a significant bubble of R&R requirements in the near future.future.
0
500,000
1,000,000
1,500,000
2,000,000
2,500,000
3,000,000
3,500,000
4,000,000
1910 1920 1930 1940 1950 1960 1970 1980 1990
Construction Decade
Gro
ss S
quare
Foota
ge
A substantial portion of the University’s Plant, those projects built in the 50’s A substantial portion of the University’s Plant, those projects built in the 50’s through 80’s, is approaching 30-60 years old and will require substantial repair through 80’s, is approaching 30-60 years old and will require substantial repair
and renovation.and renovation.

Why is a Near Term Infrastructure Why is a Near Term Infrastructure Solution Needed – Why can’t this wait?Solution Needed – Why can’t this wait?
• Campus & Building Safety
• Cost
• Usability / Habitability
• Continuity of Plant Operations

What are our Continuing What are our Continuing Challenges?Challenges?
Competitive Compensation Program Competitive Compensation Program Funding - $15M recurringFunding - $15M recurring
Tuition & FeesTuition & Fees
$0K
$5K
$10K
$15K
$20K
$25K
Michigan UC Berkeley UCLA Wisconsin Illinois UT Austin
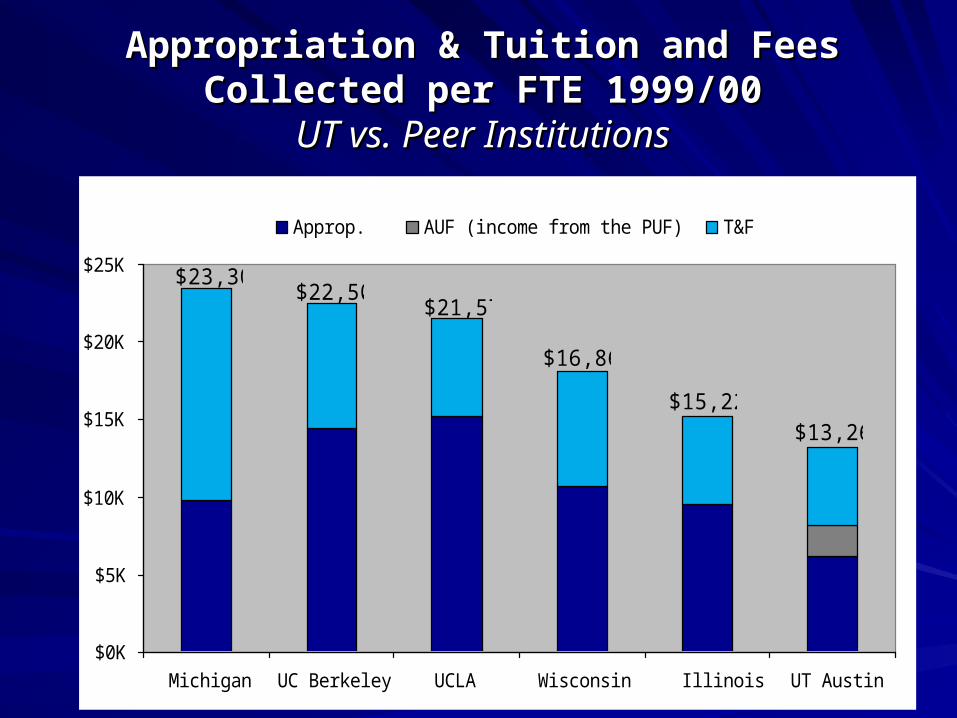
Approp. AUF (income from the PUF) T&F
$23,306
$13,265$15,224
$16,868
$21,573$22,503
Appropriation & Tuition and Fees Collected per FTE Appropriation & Tuition and Fees Collected per FTE 1999/001999/00
UT vs. Peer InstitutionsUT vs. Peer Institutions

Competitive Position – Tuition & Mandatory FeesCompetitive Position – Tuition & Mandatory FeesUT vs. Other InstitutionsUT vs. Other Institutions
(2002 Data)(2002 Data)
$29,060 $29,600
$27,612 $27,230
$17,961
$27,549$28,400
$23,289
$10,490
$19,990
$29,256
$28,206
$4,780$3,950
$7,411
$0
$5,000
$10,000
$15,000
$20,000
$25,000
$30,000
$35,000
Columbia Dartmouth Harvard M IT Notre Dame P rinceton Rice Stanford Yale M ichigan(Ann Arbor)
Texas(Austin)
Virginia
Tuition
In-State Tuition
Out-of-State Tuition
A vg. 4-Year Private
A vg. 4-Year Public Out-of-State
A vg. 4-Year Public In-State
Source: Morgan Stanley, based on information from the College Board and the Chronicle of Higher Education..

A Rule of ThumbA Rule of Thumb for Planning for Planning
Every dollar increase in tuition generates about $1M of net revenue, after set-asides, for the University on an annual basis.
Therefore, a student taking 28 SCH annually would pay $28 more in tuition per year for each $1 increase in tuition.

Next StepsNext Steps

The Challenge SummaryThe Challenge Summary
Infrastructure Funding - $30M annualInfrastructure Funding - $30M annual
Compensation Program Funding - $15M Compensation Program Funding - $15M recurringrecurring

Possible Near Term SolutionsPossible Near Term Solutions• Reduce expenses elsewhere and reinvest in R&R
• Just completed exhaustive effort
• Impossible to not impact people
• Reduce / eliminate January compensation program
• Increases competitive issues
• Not a long-term fix
• Increase tuition

Thank YouThank You