Embed Size (px)
Citation preview
February 2010
Tulsa Parks and Recreation Master Plan

Tulsa, OK Parks and Recreation Master Plan Final Report | i
Acknowledgements Th is pr oje ct c om men ced in February , 200 9. Pha se I i s schedu led f or c omple t i on by Spr ing , 2 010 .
Be l ow i s a c ompr ehens ive l i s t of th os e wh o c on tr ibut ed t o the Ma ster P lann ing proces s .
City of Tulsa Project Team Dewey F . Bar t le tt J r . , May or Kathy Tay l or , Form er May or
Susan N ea l , D i r ec tor , C om munity De ve l opmen t and E ducat i on Nancy Atwa ter , For mer Di rect or , Par ks and Recr eat i on
Lucy D ol man, D ire ct or , Pa rks and Re crea t i on John Ac t on , Manager , For mer S truc tura l Res our ce M aintenance
Gary S che l lhorn , Res our ce and Fac i l i t ie s C oord ina t or Joe Robber s on , Eng inee r in g P lanner I I
Ros s We l ler , Adm in i stra t i on Sandra Cr i sp , Adm in i stra t i on
Karen Hans on, Adm in i stra t i ve As s is tant Bob Hendr ic k , Spe c ia l E ve nts
Theron War l i ck , P lan iTu ls a Martha S chu l tz , P lan iTu l s a
Dean R i chardv i l le , Park M anager
Core Project Team Marg ie Warr en
Jami e Z ink Susan N ea l Ph i l La k in
Da le Mc Na mara Lucy D ol man
Nancy Atwa ter Pat T readway - Land Legac y
City Council Jack H enders on , C ounci l D is t r i ct 1 R ic k We st cott , C ounc i l D is t r i ct 2 Ros c oe Turner , C ounc i l D is t r i ct 3
Dav id Patr ic k , For mer Cou nci l D is t r i ct 3 Mar ia Barne s , Coun ci l D i st r ic t 4
Er ic G omez , Forme r C ounc i l D is t r i ct 4 Chr i st opher T ra i l , C ounc i l D i st r ic t 5
B i l l Mart in s on , Former C ounci l D is t r i ct 5 James Maut in o, Coun ci l D i st r i c t 6
Denn i s T r oyer , Former C ou nci l D is t r i ct 6 John Eag l et on , Coun ci l D i s t r i ct 7
B i l l Chr i s ten sen , Coun ci l D is t r i ct 8 G.T . Bynu m, C ounci l D i st r i ct 9
City of Tulsa, Recreation and Park Board Dale Mc Na mara , Cha irpers on
Yvonne H ove l l Joe Schu lte
Marg ie Warr en Mayor Kathy Tay l or
Consultant Team GreenP lay , LLC
ii | Tulsa, OK Parks and Recreation Master Plan Final Report
Table of Contents
I. Executive Summary ................................................................................................. 1
II. Past, Present, and Future – The Planning Context .................................................... 1
A. Purpose of this Plan ............................................................................................................... 17
B. History of Tulsa Parks and Recreation Department .............................................................. 18
C. Parks and Recreation Department Overview ........................................................................ 20
D. Tulsa Parks Vision Statement ................................................................................................ 20
E. Related Planning Efforts and Integration ............................................................................... 20
F. Methodology of this Planning Process ................................................................................... 21
G. Timeline for Completing the Master Plan ............................................................................. 22
III. What We Want- Our Community and Identified Needs ......................................... 23
A. Community Profile and Demographic Information ............................................................... 23
B. Current Park and Recreation Trends ..................................................................................... 29
C. Community and Stakeholder Input ........................................................................................ 34
D. Statistically-Valid Community Survey Findings ...................................................................... 38
IV. What We Have Now- An Analysis of Programs and Spaces ................................... 86
A. Financial and Programming Analysis ..................................................................................... 86
B. GRASP Inventory and Level of Service ................................................................................... 95
V. Funding .............................................................................................................. 121
A. Tulsa Parks Potential Funding Sources ................................................................................ 121
VI. Great Things to Come – Recommendations & Action Plans ................................. 132
A. Recommendations ............................................................................................................... 132
B. Action Plan, Timetable, and Cost Estimates ........................................................................ 159
Tulsa, OK Parks and Recreation Master Plan Final Report | iii
Appendices I. Survey Instrument
II. Agency Chart
III. Data Tables by Subarea
IV. Random Sample Comments
V. Open Link Web Comments
VI. Agency Comments
VII. GRASP® History and Methodology
VIII. Tulsa Park and Facility Inventory
IX. GRASP® Maps and Perspectives
Map A: Regional Map B: System Map C: Population Density Destination Parks Map Perspective A: Neighborhood Access to All Components Perspective B: Walkable Access to All Components Perspective C: Neighborhood Access to All Facilities Perspective D: Neighborhood Access to Trails Perspective D2: Trailshed Analysis Perspective E: Neighborhood Access to All Aquatic Components Perspective F: Neighborhood Access to Playgrounds X. GRASP® Index Tables
XI. Grants and Funding
XII. Facility Removal Flowchart
iv | Tulsa, OK Parks and Recreation Master Plan Final Report
List of Figures Figure 1: Percent Change in Population 2000 to 2009- City of Tulsa, Tulsa CBSA, Oklahoma .................. 23 Figure 2: 2007 Population Breakdown Percent of Total by Age- Tulsa, Tulsa CBSA, and Oklahoma ........ 25 Figure 3: Population by Age City of Tulsa- 2000, 2009, 2014 ..................................................................... 25 Figure 4: Households by Income- Tulsa, Tulsa CBSA, Oklahoma ............................................................... 27 Figure 5: Population Projections and Estimates- Tulsa ............................................................................... 28 Figure 6: Respondent Demographics- Gender, Age, Household Status, People in Household, Ethnicity .. 41 Figure 7: Respondent Demographics- Household Income, Length of Residency, Location of Residence .. 42 Figure 8: Current Usage of City of Tulsa Facilities and Programs- Used Once in Last 12 months .............. 43 Figure 9: Current Usage of City of Tulsa Facilities and Programs- Visits in Last 12 Months ....................... 44 Figure 10: Importance of Facilities, Programs, and Services to the Community ........................................ 45 Figure 11: Satisfaction that Facilities and Programs are Meeting Community Needs ............................... 46 Figure 12: Importance/Satisfaction Matrix- Four Quadrants ..................................................................... 47 Figure 13: Importance/Satisfaction Matrix- High Importance/Lower Unmet Needs Quadrant ................ 48 Figure 14: Areas for Improvement and Reasons for Not Using Facilities ................................................... 51 Figure 15: Other Recreation Facilities and Programs Used ........................................................................ 52 Figure 16: Tulsa Community Centers Visited in Last 12 Months ................................................................ 53 Figure 17: Most Visited Community Center................................................................................................ 54 Figure 18: Quality of Services and Facilities Provided by Each Community Center ................................... 55 Figure 19: Support for Alternative Policy Directions .................................................................................. 56 Figure 20: Support for Alternative Policy Directions .................................................................................. 57 Figure 21: Future Direction ......................................................................................................................... 57 Figure 22: Greatest Needs for Indoor Facilities in 5-10 Years .................................................................... 60 Figure 23: Most important Needs for Indoor Facilities............................................................................... 61 Figure 24: Most Important Needs for Indoor Facilities- Top Three Combined .......................................... 62 Figure 25: Importance of Outdoor Facilities to be Improved or Added- Group One ................................. 63 Figure 26: Importance of Outdoor Facilities to be Improved or Added- Group Two ................................. 64 Figure 27: Importance of Outdoor Facilities to be Improved or Added- Top Three ................................... 65 Figure 28: Programming Needs .................................................................................................................. 66 Figure 29: Programming Needs Met- Random Sample Respondents ........................................................ 67 Figure 30: Programming Needs Met- Random Sample and Open-Link/Association Respondents ............ 68 Figure 31: Most Important Needs for Programs ......................................................................................... 69 Figure 32: Most Important Needs for Programs- Top Three ...................................................................... 70 Figure 33: Satisfaction with City Dissemination of Parks and Recreation Information .............................. 71 Figure 34: Communications- How Information is Received ....................................................................... 72 Figure 35: Amount of Dollars Spent by City- Random Sample Respondents ............................................. 73 Figure 36: Amount of Dollars Spent by City- Open-link/Association Respondents .................................... 74 Figure 37: Funding Mechanisms Support- Random Sample Respondents ................................................. 75 Figure 38: Funding Mechanisms Support- Random Sample and Open-Link/Association Respondents .... 76 Figure 39: Areas for Improvement and Reasons for Not Using Facilities- by Subarea ............................... 80 Figure 40: Support for Alternative Funding Mechanisms ........................................................................... 81 Figure 41: General Future Direction of Tulsa .............................................................................................. 81 Figure 42: Most Important Needs for Indoor Facilities- by Subarea .......................................................... 82 Figure 43: Most Important Needs for Outdoor Facilities- by Subarea ....................................................... 83 Figure 44: Most Important Needs for Programs- by Subarea .................................................................... 84 Figure 45: Support for Funding Mechanisms- by Subarea .......................................................................... 85 Figure 46: 2008 Municipal Pool Attendances ............................................................................................. 93
Tulsa, OK Parks and Recreation Master Plan Final Report | v
List of Tables Table 1: Subarea population estimates and projections- 2000, 2009, 2014 .............................................. 24 Table 2: Race/Ethnicity Comparisons for 2009 ........................................................................................... 26 Table 3: Educational Attainment – 25 Years and Older (2009)................................................................... 26 Table 4: Housing Units (2009) ..................................................................................................................... 27 Table 5: Attendance by Age Group- Selected Arts Activities 2007 ............................................................. 32 Table 6: Focus Group/Public Process Input ................................................................................................ 35 Table 7: Overall Parks and Recreation Department Budget (in Millions) ................................................... 87 Table 8: Community Center Expenses and Revenues ................................................................................. 89 Table 9: Community Center Cost Recovery and Subsidy 2008 .................................................................. 89 Table 10: Community Center Program Enrollments and Point-of-Sale Transactions - 2008 ..................... 90 Table 11: 2008 Community Center Major Program Areas.......................................................................... 91 Table 12: Pools Expenses, Revenues, and Cost Recovery ........................................................................... 92 Table 13: Resource Map B- System............................................................................................................. 98 Table 14: GRASP® Comparative Data ........................................................................................................ 104 Table 15: Perspective A- Neighborhood Access to All Components ........................................................ 105 Table 16: Perspective B- Walkable Access to All Components ................................................................. 108 Table 17: Perspective C- Neighborhood Access to Indoor Facilities ......................................................... 109 Table 18: Perspective D- Neighborhood Access to Trails ......................................................................... 111 Table 19: Facility and Park Access by Tulsa Trail Network ........................................................................ 112 Table 20: Perspective E- Neighborhood Access to Aquatics ..................................................................... 113 Table 21: Subarea Access to Multipurpose Fields .................................................................................... 114 Table 22: Subarea Access to Tennis .......................................................................................................... 114 Table 23: Subarea Access to Playgrounds ................................................................................................. 115 Table 24: Service Coverage Summary- Percent with Service ................................................................... 116 Table 25: Projected Community Components GRASP® Index 2014 ......................................................... 117 Table 26: Capacities LOS for Community Components ............................................................................ 119 Table 27: Components with a Score of One for Neighborhood Service ................................................... 136 Table 28: Service Assessment Matrix........................................................................................................ 147 Table 29: Recommended Priorities and Cost Estimates ........................................................................... 159

Tulsa, OK Parks and Recreation Master Plan Final Report| 1
I. Executive Summary Purpose of this Plan The Tulsa Parks and Recreation Master Plan is intended to help meet the needs of current and future residents by positioning Tulsa to sustain and improve the community’s vast and unique parks and recreation assets. The citizen-driven plan establishes a clear direction to guide city staff, advisory committees, and elected officials in their efforts to enhance the community’s parks and recreation services and facilities.
The City of Tulsa
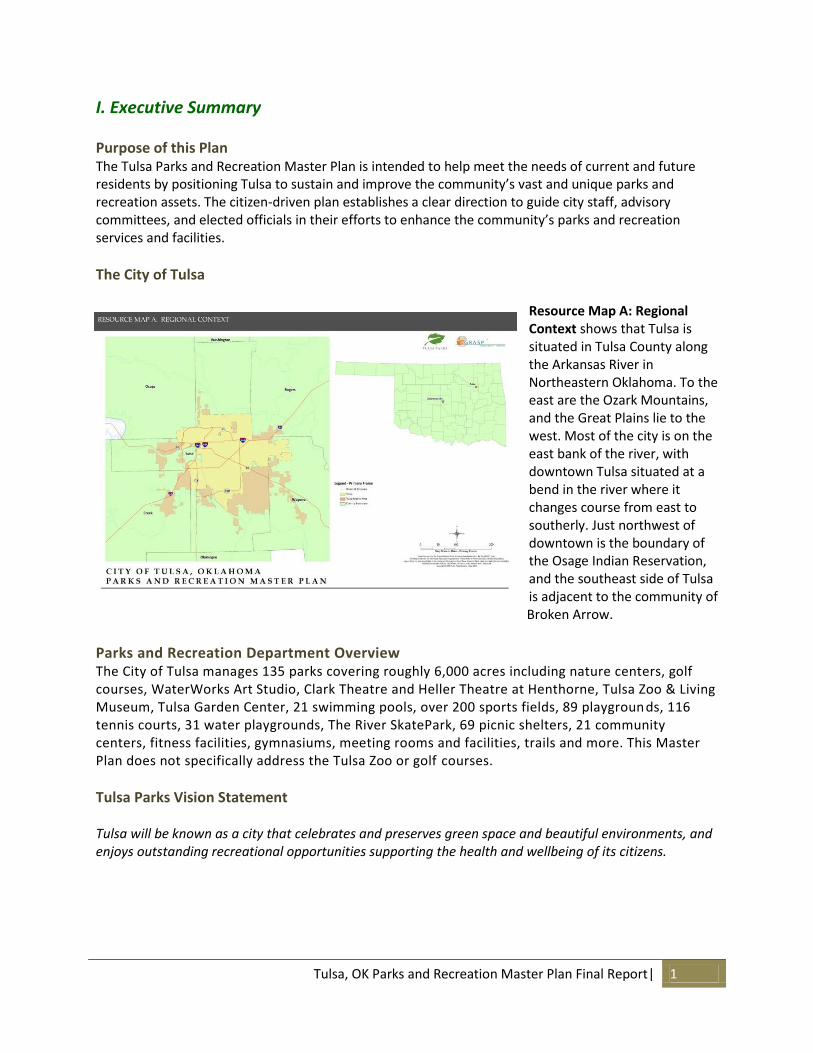
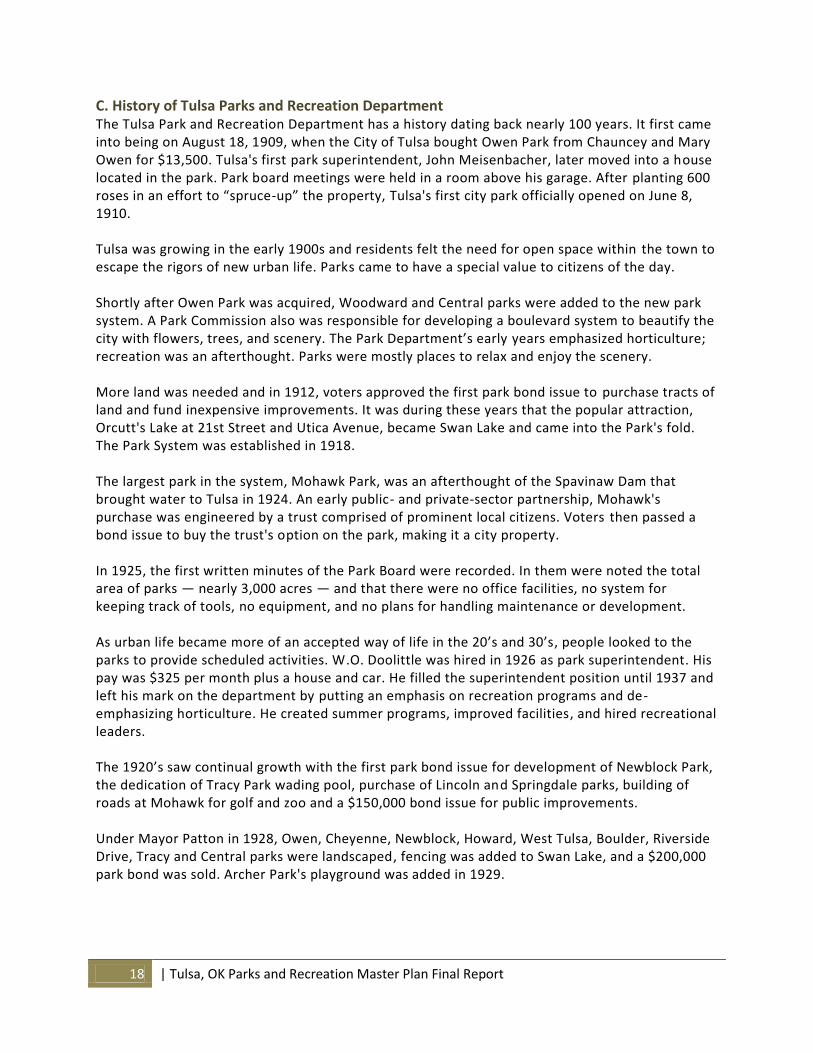
Resource Map A: Regional Context shows that Tulsa is situated in Tulsa County along the Arkansas River in Northeastern Oklahoma. To the east are the Ozark Mountains, and the Great Plains lie to the west. Most of the city is on the east bank of the river, with downtown Tulsa situated at a bend in the river where it changes course from east to southerly. Just northwest of downtown is the boundary of the Osage Indian Reservation, and the southeast side of Tulsa is adjacent to the community of
Broken Arrow.
Parks and Recreation Department Overview The City of Tulsa manages 135 parks covering roughly 6,000 acres including nature centers, golf courses, WaterWorks Art Studio, Clark Theatre and Heller Theatre at Henthorne, Tulsa Zoo & Living Museum, Tulsa Garden Center, 21 swimming pools, over 200 sports fields, 89 playgrounds, 116 tennis courts, 31 water playgrounds, The River SkatePark, 69 picnic shelters, 21 community centers, fitness facilities, gymnasiums, meeting rooms and facilities, trails and more. This Master Plan does not specifically address the Tulsa Zoo or golf courses.
Tulsa Parks Vision Statement Tulsa will be known as a city that celebrates and preserves green space and beautiful environments, and enjoys outstanding recreational opportunities supporting the health and wellbeing of its citizens.
2 | Tulsa, OK Parks and Recreation Master Plan Final Report
Related Planning Efforts and Integration This Master Plan has integrated information from additional planning efforts for the City of Tulsa that have helped inform the planning process for this Plan. These include:
Summary of recent ten-year plan updates for Tulsa Neighborhood Implementation Plan Studies, 2008
Downtown Tulsa Master Plan, 2009 (Draft)
Brady Village Trail Plan, 2009
Strategic Plan for the City of Tulsa Parks and Recreation Department, 2009-10
PLANiTULSA, currently in progress
Aquatics Inventory Analysis 2007
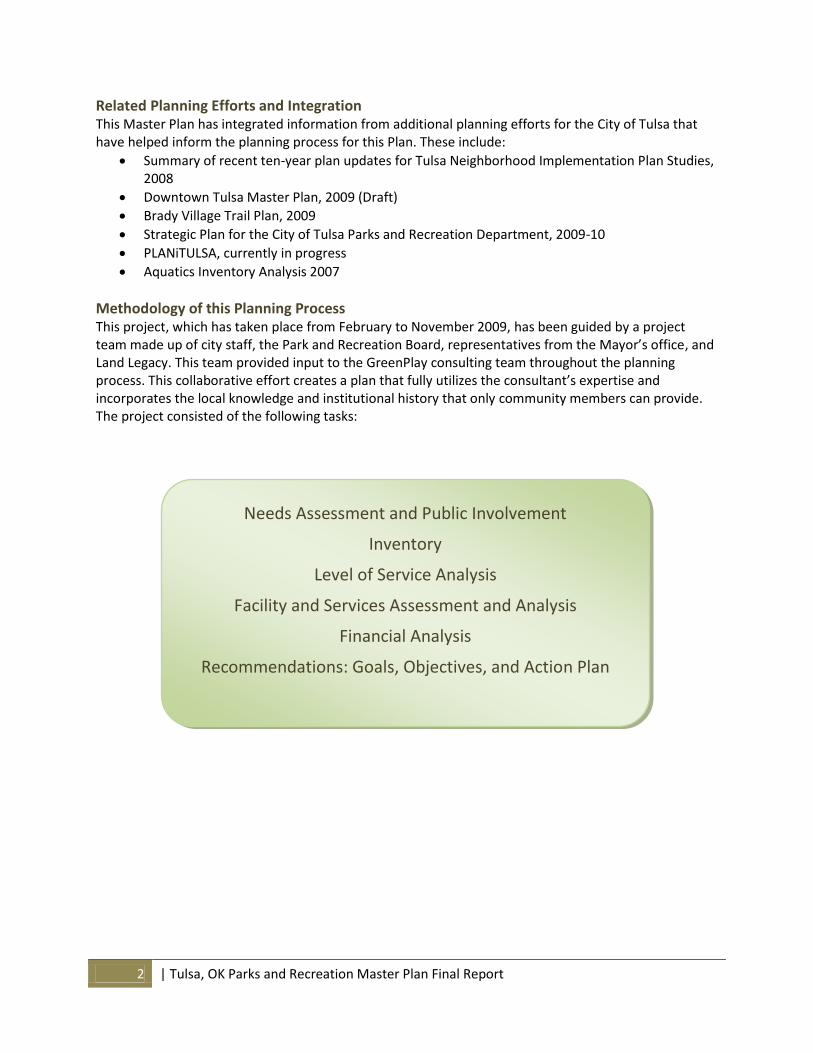
Methodology of this Planning Process This project, which has taken place from February to November 2009, has been guided by a project team made up of city staff, the Park and Recreation Board, representatives from the Mayor’s office, and Land Legacy. This team provided input to the GreenPlay consulting team throughout the planning process. This collaborative effort creates a plan that fully utilizes the consultant’s expertise and incorporates the local knowledge and institutional history that only community members can provide. The project consisted of the following tasks:
Needs Assessment and Public Involvement
Inventory
Level of Service Analysis
Facility and Services Assessment and Analysis
Financial Analysis
Recommendations: Goals, Objectives, and Action Plan
Tulsa, OK Parks and Recreation Master Plan Final Report| 3
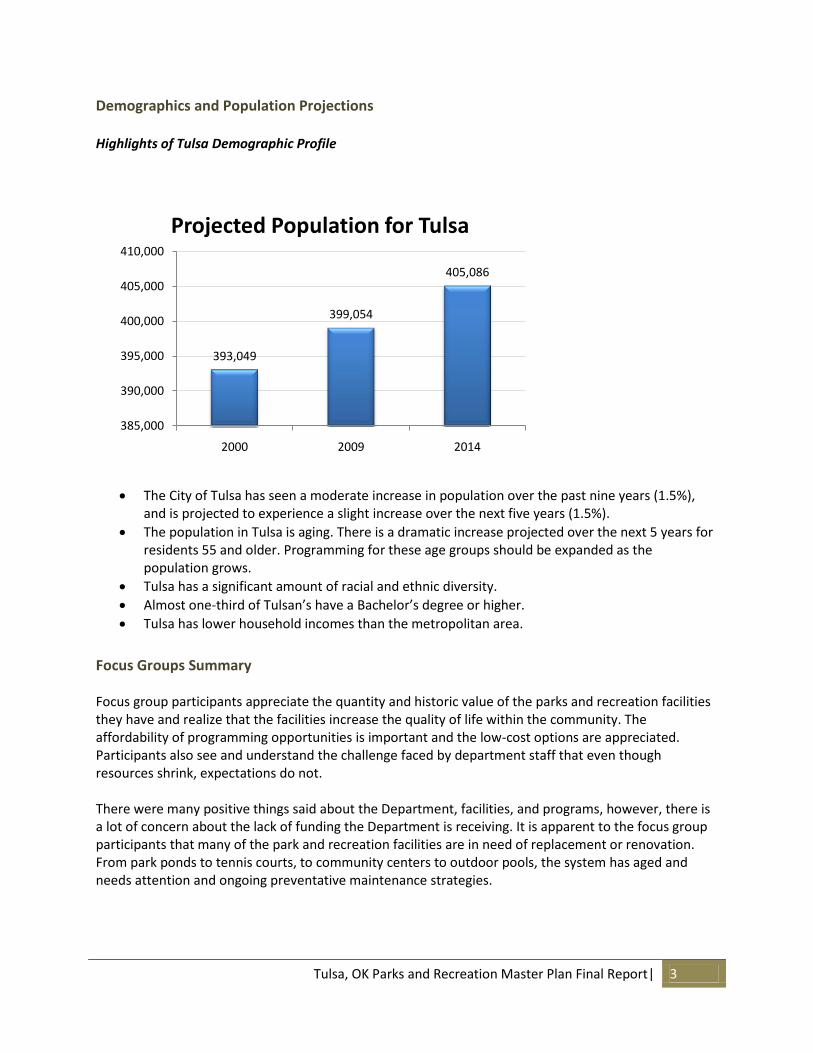
Demographics and Population Projections Highlights of Tulsa Demographic Profile
The City of Tulsa has seen a moderate increase in population over the past nine years (1.5%), and is projected to experience a slight increase over the next five years (1.5%).
The population in Tulsa is aging. There is a dramatic increase projected over the next 5 years for residents 55 and older. Programming for these age groups should be expanded as the population grows.
Tulsa has a significant amount of racial and ethnic diversity.
Almost one-third of Tulsan’s have a Bachelor’s degree or higher.
Tulsa has lower household incomes than the metropolitan area.
Focus Groups Summary Focus group participants appreciate the quantity and historic value of the parks and recreation facilities they have and realize that the facilities increase the quality of life within the community. The affordability of programming opportunities is important and the low-cost options are appreciated. Participants also see and understand the challenge faced by department staff that even though resources shrink, expectations do not. There were many positive things said about the Department, facilities, and programs, however, there is a lot of concern about the lack of funding the Department is receiving. It is apparent to the focus group participants that many of the park and recreation facilities are in need of replacement or renovation. From park ponds to tennis courts, to community centers to outdoor pools, the system has aged and needs attention and ongoing preventative maintenance strategies.
393,049
399,054
405,086
385,000
390,000
395,000
400,000
405,000
410,000
2000 2009 2014
Projected Population for Tulsa
4 | Tulsa, OK Parks and Recreation Master Plan Final Report
Input varied in regards to additional programming needs, but the need for non-team sports programming was consistent. Programming examples included: environmental, afterschool, arts, concerts in the parks, and family inclusive programming. Additionally, the need for programming that focuses on participants aged 10-25 was consistent. New facility needs that were identified include sports complexes (football and soccer), dog parks, expanded arts facilities (WaterWorks), and aquatic facilities. Almost every area of the City was identified as having shortcomings in regards to parks and recreation facilities and services. Filtering the input shows that the need for parks and recreation facilities, programs, and services is apparent regardless of age, income levels, or neighborhood.
Survey Summary The citizen survey was dispersed using three approaches: as a random sample mailback survey (which was also supplemented with an online version and doorknob surveys), an open-link web and handout survey, and a web survey that was distributed to agency representatives, stakeholders, and associations. Special interest groups are likely to seek out the open-link surveys in order to express their opinions. Overall, there were 1,306 responses received. There were 450 random survey responses received, which have a margin of error of approximately +/- 4.6 percentage points calculated for questions at a 50% response rate. Survey highlights include:
Parks and city trails are used most often, ranked highest as most important to the community, and received the most positive satisfaction ratings.
Outdoor swimming pools are used least often, ranked the lowest in importance to the community, and received the lowest satisfaction ratings.
Within the Importance-Satisfaction Matrix (comparing importance scores against satisfaction scores), all of the facilities, programs, and services listed in the survey fell into the “high importance/low unmet need” quadrant.
McClure was the most frequently visited community center, followed by Hicks and Whiteside.
There was strong support for funding improvements to community centers through the creation of a new dedicated funding source through vote of the people.
Respondents indicated that additional youth and teen activity areas are the current most important needs for indoor facilities, and will be the greatest need over the next 5-10 years to add, expand, or improve indoor recreation facilities, followed by additional designated areas for seniors/active adults 60+.
Restrooms, playgrounds, and trails and trail connections are the most important to add, expand, or improve for outdoor recreation facilities.
Programs and activities with the highest need are special events, followed by fitness and wellness programs.
Overall the level at which respondents’ needs were being met was relatively low for most programs.
Respondents gave a rating of 2.9 (on a 5-point scale with 5 being excellent) in regard to how the City of Tulsa does in providing them with information about recreation facilities, parks, trails, and programs.
When asked about additional funding mechanisms respondents indicated that “reallocation from general sales tax funds and fees from unobtrusive oil drilling in large tracts of undeveloped park land” was the most supported.
Tulsa, OK Parks and Recreation Master Plan Final Report| 5
Programming and Level of Service Analysis An extensive programming analysis was conducted and is available in the Final Report. Additionally, a Level of Service Analysis was conducted. This detailed analysis is also available in the Final Report.
Recommendations Capital Improvements While Tulsa is typical of many mid-sized cities in the United States with relatively low population densities, it nonetheless has a robust park system, with over 6,000 acres of parkland in the inventory, or about 15 acres per 1,000 persons. This is a healthy ratio and a satisfactory one that does not call for any major adjustments. The focus should be on what is offered within this acreage and how it meets the needs of Tulsans. The park acreage currently is a mix of developed and undeveloped sites. These are well distributed throughout the city. A more critical issue is the condition and configuration of those parks. Tulsa has many parks of approximately the same age that are reaching a point in their life cycle where replacement/refurbishment/repurposing/etc. is needed. An organized strategy is needed. Tulsa’s parks need to be looked at closely to determine what things within them are timeless, and what things are no longer relevant. Strategic prioritization is needed to determine if some things should be removed or replaced, if funds become available, or a new use is found, etc. A strategy for addressing the repair/refurbishment/replacement or re-purposing of low-functioning components is included in the final report. It is possible that through ongoing public input, and as needs and trends evolve, new needs will be identified for existing parks. If there is no room in an existing park for new needs, the decision may be made to remove or re-purpose an existing component, even if it is quite functional. Trends to keep an eye on as Tulsa decides what to do with low-functioning facilities, or how to make existing parks fit the needs of residents as highly as possible, include things like:
Dog parks continue to grow in popularity.
Skating continues to grow in popularity.
A desire for locally grown food and concerns about health and sustainability.
Events in parks, from a neighborhood “movie in the park” to large festivals in regional parks, are growing in popularity as a way to build a sense of community.
Sprayparks are growing rapidly in popularity, even in cooler climates than Tulsa’s.
New types of playgrounds are emerging, including discovery play, nature play, adventure play, and art play.
Integrating nature into parks by creating natural areas is a trend for a number of reasons. These include a desire to make parks more sustainable and introduce people of all ages to the natural environment. An educational aspect is an important part of these areas.
Walkability Tulsa’s land area and low density make it difficult to provide a walkable park system. However, concerns about obesity, diabetes, heart disease, and other ills across the nation have made walkability a goal for most communities and their park systems. Fortunately, Tulsa’s parks, schools, and other public lands are fairly well distributed throughout the city, offering the potential for greatly enhanced walkability for the community. The key is to make sure these lands are desirable destinations to which people can walk.
6 | Tulsa, OK Parks and Recreation Master Plan Final Report
This can be done by assuring that people feel safe and comfortable. Parks should have shade, comfortable places to sit, and accommodation for basic needs like drinking water. Other opportunities to add more greenspace can be sought out wherever possible. For example, park amenities can be required in redevelopments of existing areas. Recreational trails should be extended into existing neighborhoods and parks as much as possible. A simple loop trail with interpretive signs, benches, and picnic tables would be sufficient to make the reservoirs into healthy and enjoyable destinations for local residents. Destination Parks - Matching Service to Citizen Desires in Tulsa The most important needs for outdoor facilities for Tulsa Parks and Recreation were identified in the Master Plan Survey. Trails and trail connections were the highest-ranking in terms of total responses identifying them as first, second, or third most important. They were followed very closely by playgrounds. In fact, playgrounds were ranked the “most important” by more respondents than trails. Other capital improvement areas that surfaced as of particular interest to this study include nature centers/open space, aquatics, and tennis. Trails Tulsa has a good start on an effective network of trails. There are 78 existing miles of trail listed in the inventory, and several of these are connected together into a nearly complete loop of 67 miles. Because Tulsa covers such a large area, providing trails coverage for the entire city presents a huge challenge. While a connected system of trails throughout the city is an ideal, shorter individual loops can be effective as well.
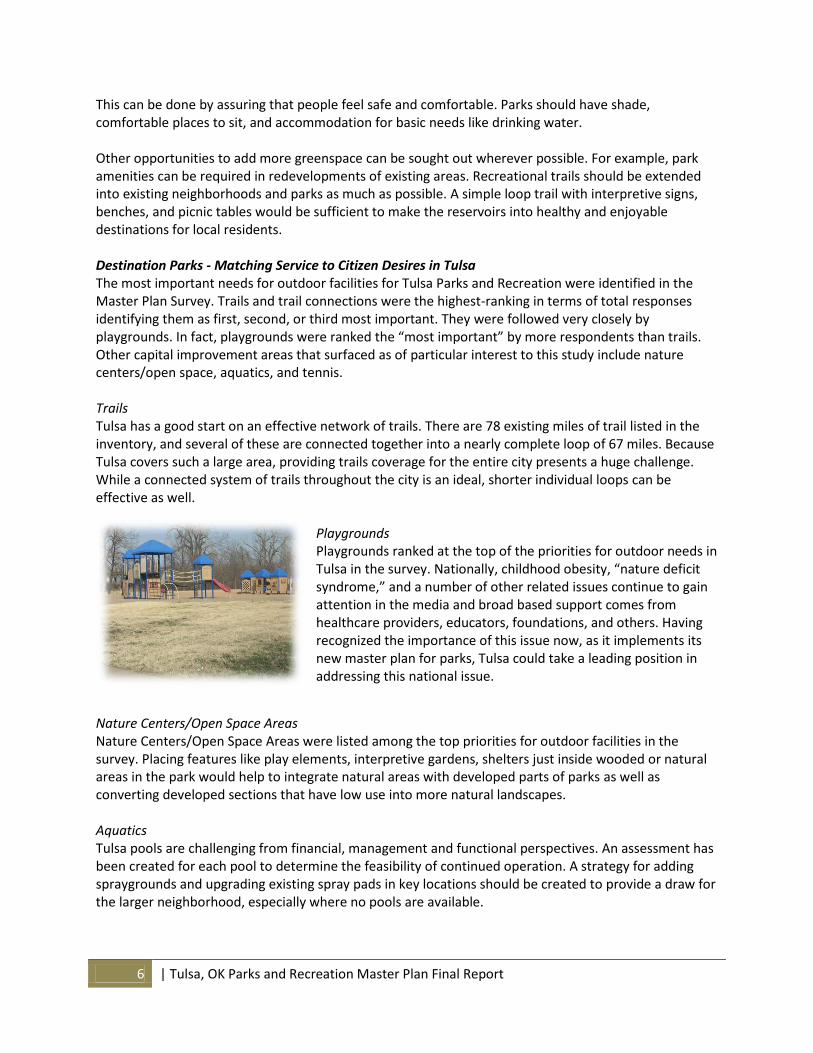
Playgrounds Playgrounds ranked at the top of the priorities for outdoor needs in Tulsa in the survey. Nationally, childhood obesity, “nature deficit syndrome,” and a number of other related issues continue to gain attention in the media and broad based support comes from healthcare providers, educators, foundations, and others. Having recognized the importance of this issue now, as it implements its new master plan for parks, Tulsa could take a leading position in addressing this national issue.
Nature Centers/Open Space Areas Nature Centers/Open Space Areas were listed among the top priorities for outdoor facilities in the survey. Placing features like play elements, interpretive gardens, shelters just inside wooded or natural areas in the park would help to integrate natural areas with developed parts of parks as well as converting developed sections that have low use into more natural landscapes. Aquatics Tulsa pools are challenging from financial, management and functional perspectives. An assessment has been created for each pool to determine the feasibility of continued operation. A strategy for adding spraygrounds and upgrading existing spray pads in key locations should be created to provide a draw for the larger neighborhood, especially where no pools are available.
Tulsa, OK Parks and Recreation Master Plan Final Report| 7
Tennis Many courts in Tulsa are currently in very poor condition. However, trends indicate that the popularity of tennis is once again on the rise. This trend should be monitored in Tulsa to determine if courts that are currently underused will be in demand at some point in the future. Programming The Tulsa Parks and Recreation staff takes great pride in providing programs that improve quality of life, create positive lifestyle choices and allow for the exploration of new experiences. Over the years, declining funding has become a limitation for the creation and/or expansion of city recreation programs. This situation will only become more complex if future budgets continue to decrease and staffing and facility resources shrink. Survey respondents identified recreation and environmental programming as important to the community but also indicated that these services were only marginally meeting their needs. Programs identified as top priorities by the community input are:
Special events (i.e. concerts in the parks, festivals, etc.)
Fitness and wellness programs
Cultural/arts programs
Family programs To determine additional potential programming opportunities, further review of citizen survey data should be conducted and used in conjunction with additional customer feedback on an ongoing basis. Comprehensive Service Assessment Current budgetary realities make it impossible for the Department to fulfill all of the desires identified through the public input process. It is important for the Department to focus on delivering quality in a more focused (and perhaps limited) way. Completing a service assessment of all facilities, programs, and services will help decide where the focus should be placed. Pricing and Cost Recovery Philosophy It is important for the City to develop a pricing and cost recovery philosophy that reflects the values of the community and the responsibility it has to the community. This philosophy will be especially important if the City moves forward in the development of new programs, additional and/or expanded facilities. Funding Opportunities The City of Tulsa has experienced challenging times in the recent past, with limited funding and staffing levels, and the Department should explore the best means of achieving its funding goals. Alternative funding methods will be instrumental to the operations of the City’s park and recreation facilities and services on an ongoing basis. Allocating resources (assigning staff time, matching funds, etc.) to pursue alternative funding should be considered an investment in the future, with an outlined and expected positive rate of return. Building partnerships within the community is an alternative source of funding, bringing together those with mutual goals to take advantage of existing facilities, share facilities, and provide additional programming and services to the community.

8 | Tulsa, OK Parks and Recreation Master Plan Final Report
Goals and Strategies GOAL 1: MAXIMIZE THE PLANNING EFFORT Strategy 1.1: Incorporate the action items of this plan into the Department and City goals to achieve the recommendations of this plan and to enhance effectiveness of staff effort. Strategic Step: 1.1.1 Create a citizen involvement structure to address these five areas: facilities, programs, public relations, finance, and trails by Spring 2010 1.1.2 Assign responsibility and time frame, and allocate resources necessary to complete each action identified in annual work plans. Strategy 1.2: Assure that all levels of staff are informed of and are set up to work together to implement the recommendations and strategies of the plan. Strategic Steps:
1.2.1 Inform all levels of staff of the direction of the Plan, allow for staff input, encourage buy-in, and encourage input from all staff members. 1.2.2 Provide external departmental staff teams/team members, as appropriate, with education development opportunities, necessary equipment, and supplies.
Strategy 1.3: Examine existing organizational structure of the Parks and Recreation Department Strategy 1.4: Recommend any needed changes to current organizational structure to ensure efficient plan implementation. GOAL 2: ENHANCE MARKETING AND COMMUNICATIONS Strategy 2.1: Generate awareness and community engagement regarding Tulsa Parks and Recreation offerings and needs as expressed by the public through this planning process and ongoing annual efforts. Strategic Steps:
2.1.1 Hire or contract dedicated staff to coordinate all marketing efforts for the Department. 2.1.2 Formalize an evaluation and annual in-house benchmarking program to solicit participant feedback and drive programming efforts. 2.1.3 Collect feedback data that supports the expressed desire for improvements to programs and activities. 2.1.4 Create a “Mystery Shopper” program where secret shoppers evaluate services anonymously and results are tracked.

Tulsa, OK Parks and Recreation Master Plan Final Report| 9
2.1.5 Prepare an annual report providing information to the public about parks and recreation funding, stewardship of tax dollars, and fees and charges. Distribute the report as widely as possible. 2.1.6 Update an annual marketing plan for the Parks and Recreation Department. 2.1.7 Develop an evaluation process for marketing media such as newspaper, seasonal brochures, website, direct mail, targeted e-mails, social media (ie. Facebook, Twitter, etc.), and radio and television advertising to continuously determine effectiveness of marketing dollars. 2.1.8 Create seamless product delivery for park and recreation services that delivers from a consumer vantage point. 2.1.9 Develop a comprehensive cross training program for all staff and key instructors including knowledge of all program areas and customer service. 2.1.10 Use program tracking and evaluation tools to capacity by designing reports to readily identify life cycles of programs, identify programs not meeting minimum capacity (review all program minimums for cost effectiveness), identify waiting lists, etc.
GOAL 3: UPDATE PARKS AND FACILITIES TO ADDRESS CHANGING NEEDS AND DESIRES Strategy 3.1: Improve existing parks to meet community standards. Strategic Steps:
3.1.1 Add comfort and convenience features to parks where they are lacking. These include benches, shade, drinking fountains, etc. 3.1.2 Use the park inventory and scoring spreadsheet to identify specific park components that need to be updated or replaced. 3.1.3 Develop a schedule, budget, and methodology to complete these improvements.
Strategy 3.2: Address existing swimming pools. Strategic Steps:
3.2.1 Utilize an inventory analysis of existing pools to determine which ones are functional, which need repairs, and which should be replaced or decommissioned. 3.2.2 Formulate a plan to take appropriate action at each pool based on the inventory analysis.

10 | Tulsa, OK Parks and Recreation Master Plan Final Report
Strategy 3.3: Improve spray parks
Strategic Steps: 3.3.1 Identify at least one park per subarea as the location for an upgraded sprayground (i.e. themed, multi-jet customized interactive spray pad). 3.3.2 Develop an action plan for completing the upgrades. Update the CIP (Capital Improvement Plan) as needed. Strategy 3.4: Increase access to natural areas and open space. Strategic Steps: 3.4.1 Improve access to undeveloped parklands with trails, interpretive signage, and other amenities. 3.4.2 Integrate and connect existing undeveloped and natural areas in parks into the developed parts. 3.4.3 Look for opportunities to convert parts of existing parks to more natural conditions as means of increasing the availability of natural areas. Strategy 3.5: Create a series of destination parks throughout Tulsa.
Strategic Steps: 3.5.1 Using the parks identified as potential destination parks, select at least one per subarea to be the initial prototypes.

Tulsa, OK Parks and Recreation Master Plan Final Report| 11
3.5.2 Use design charrettes to develop concepts, guidelines, or strategies for these parks. Each park should have unique and identifiable elements that reflect the character and context of its surrounding neighborhoods. It should also serve a range of ages, interests, and abilities. 3.5.3 Include a strong public process in the development or redevelopment of the destination parks. 3.5.4 Update the CIP (Capital Improvement Plan) as needed. 3.5.5 Look for ways to get the local community involved in the creation of destination parks.
Strategy 3.6: Coordinate Parks and Recreation Department Capital Improvement Program (CIP) existing and future projects with the City Finance and Public Works Departments. Strategic Step: 3.6.1 Work to insure inclusion of parks projects within the City’s CIP at appropriate levels Strategy 3.7: Achieve and maintain appropriate levels of service for all parts of Tulsa. Strategic Steps:
3.7.1 Maintain what you have. Make sure that all components found here function as intended and do not appear to be neglected. 3.7.2 Provide additional components in areas with relatively low LOS for the population found there, particularly in the middle and southern parts of Tulsa. If additional parkland is needed to accomplish this but unavailable, consider partnering with schools and others to provide the additional components. 3.7.3 Provide new parks and additional components in the eastern part of Tulsa to match population growth and changing demographics.
GOAL 4: MAXIMIZE RECREATION PROGRAM MANAGEMENT Strategy 4.1: Enhance recreation program planning methods. Strategic Steps:
4.1.1 Establish service objectives to ensure that a program, activity, or event is needed or desired and that it is measured to determine success and effectiveness. 4.1.2 Conduct standard and consistent formative (mid-term) and summative (post) participant evaluations for each program, activity, and event that addresses participant satisfaction, facility appropriateness, and future interest. 4.1.3 Consider an incentive for completion and return of evaluations as a way to increase response.
12 | Tulsa, OK Parks and Recreation Master Plan Final Report
4.1.4 Conduct staff evaluations that include an objective review and analysis of the program, activity, or event. Analysis should include budget information including revenues and expenditures (consistently applied for each service), participant evaluation data, and future recommendations.
Strategy 4.2: Conduct a program life cycle analysis. Strategic Step:
4.2.1 Measure each program or program area to determine where it is in its program life cycle. For programs in the saturation or decline phases, consider adjustments to, or discontinuation of the program.
Strategy 4.3: Implement new programs based on research and feedback. Strategic Steps:
4.3.1 Develop new programs after examining need/demand/trends, budget requirements for staffing and materials, location and instructor availability, and marketing effort required.
Strategy 4.4: Assess services to determine the City’s responsibility for the provision of each type of service offered. Strategic Step:
4.4.1 Conduct a service assessment using the Service Assessment Tool to provide an intensive review of each program, activity, event, and facility. (See Table 28: Service Assessment Matrix)
Strategy 4.5: Develop procedures and policies to accurately track program participation and drop-in facility use. Strategic Steps:
4.5.1 Institute written policies that provide direction to staff to consistently and accurately track and report program and facility participation, particularly ones that utilize existing Safari ® (Rec-Ware) registration software. 4.5.2 Invest in a program like Safari ® (Rec-Ware) “Attendance Module” to electronically track, through card swipes, and drop in use of facilities. Coordinate with IT Department.
Strategy 4.6: Create and implement a Cost Recovery Philosophy and Policy. Strategic Step:
4.6.1 Use the Core Services and Resource Allocation Pyramid Methodology to develop ongoing systems that help define and set cost recovery goals1:
1 A Core Services and Resource Allocation Pyramid Methodology overview has been provided separately as a staff
resource document.

Tulsa, OK Parks and Recreation Master Plan Final Report| 13
Strategy 4.7: Track performance measures for all park and recreation activities and services. Strategic Steps:
4.7.1 Establish service standards for all community services activities addressing staffing, volunteers, programs components, and major maintenance tasks. 4.7.2 Evaluate and develop a scoring system for each task to meet desired and consistent service levels. 4.7.3 Involve staff in the development of the standards and scoring system.
Strategy 4.8: Track performance measures for all park and recreation maintenance services. Strategic Steps: 4.8.1 Set goals with Public Works for maintenance standards training for all staff. 4.8.2 Establish and monitor record keeping procedures to document the actual hours and material costs for each maintenance operation. 4.8.3 Apply appropriate maintenance standards and define setup/tear down requirements for all special events, tournaments, or other activities that currently stress resources. GOAL 5: ENHANCE FINANCIAL STRATEGIES Strategy 5.1: Create a task force for strategic planning, finance, and development. Strategic Step:
5.1.1 Implement by the 2nd Quarter of 2010 or an appropriate timeframe Strategy 5.2: Research potential traditional funding opportunities. Strategic Steps:
5.2.1 Work with residents and partners to establish additional revenue through a combination of funding sources, located in Section IV in this report, to implement the recommendations of the Master Plan. 5.2.2 Investigate support for establishing a dedicated funding source for the Tulsa Park and Recreation Department operations. 5.2.3 Investigate support for establishing a dedicated funding source for capital improvements identified in this Park and Recreation Master Plan.
14 | Tulsa, OK Parks and Recreation Master Plan Final Report
Strategy 5.3: Pursue alternative funding to implement the Master Plan. Strategic Steps:
5.3.1 Identify opportunities to increase community support and revenue opportunities such as grants, partnerships, sponsorships, volunteers and earned income (See Section IV for Alternative Funding Sources). 5.3.2 Develop a “Wish List” to identify philanthropic opportunities that align with these needs. Once identified, aggressively apply for grant funding. 5.3.3 Consider expanding and formalize a volunteer program to include standards, recruiting, training, retaining, and rewarding volunteers in all program areas. 5.3.4 Create an annual “Sponsorship Manual” listing all the opportunities for the year and distribute within the community in a menu format that creates a sense of urgency within the business community.
GOAL 6: STRATEGICALLY INCREASE PARTNERSHIPS Strategy 6.1: Increase partnerships and collaborative efforts. Strategic Steps:
6.1.1 Investigate partnerships with local medical and health organizations to increase fitness and health programming for the aging population within the community. 6.1.2 Strengthen and expand Intergovernmental Agreements (IGAs) with schools for use of fields, gyms, and multipurpose spaces. 6.1.3 Explore the possibility of promoting an adopt-a-park program to help with park maintenance, beautification, and civic pride. 6.1.4 Explore the possibility of promoting a Neighborhood Work Day for each park to give a face-lift to the park in one day. 6.1.5 Explore the possibility of collaborating with local artists and neighborhood groups to paint murals on neighborhood park facilities historically significant to the neighborhood. 6.1.6 Explore the possibility of implementing a WORKREATION program to allow children to complete everyday tasks in park facilities in exchange for “Play Dough” they can use in place of fees. This program can also be used in addition to the scholarship program for those unable to pay. 6.1.7 Support the Backyard Partner Program.
Tulsa, OK Parks and Recreation Master Plan Final Report| 15
Strategy 6.2: Align agency philosophies with City Council goals and objectives. Strategic Step:
6.2.1 Engage City Council in the discussion and seek consensus about pricing and cost recovery goals.
Strategy 6.3: Evaluate and manage existing partnerships to ensure benefit is appropriate to the City and Parks and Recreation Department Strategic Step: 6.3.1 Analyze existing partnerships based upon value to citizens and the Department. Strategy 6.4: Maximize and manage potential partnerships and alliances with public and private schools, neighborhood organizations, foundations, and volunteers. GOAL 7: IMPROVE TRAIL CONNECTIVITY AND WALKABILITY Strategy 7.1: Work with other government agencies and community partners to improve walkable access to parks and recreation opportunities throughout Tulsa. Strategic Steps:
7.1.1 Make parks desirable destinations for walking by providing comfort and convenience facilities, especially drinking fountains, wherever possible. This may be done in partnership with other entities next to the park, such as schools, churches, or businesses. 7.1.2 Partner with schools, libraries, and other public places to provide park and recreation amenities throughout neighborhoods and close to homes. 7.1.3 Consider opportunities for trails in areas that have little or none currently. The long-term goal should be to connect with existing trail network where possible. 7.1.4 Provide additional trails and loop walks within existing parks where feasible, especially in undeveloped and natural areas 7.1.5 Develop partnerships and user agreements with utility companies to develop trail corridors in easement right-of ways where safe and appropriate. 7.1.6 Work with other City departments and community groups to ensure safe pedestrian access across physical barriers to parks and recreation facilities. Incorporate traffic calming strategies at access points to parks, open space, and trail heads. 7.1.7 Create walking /bicycle maps with routes and mileages of park and trails. Make these available online and in printed form. Provide wayfinding signage along trails and walking routes to make them more useful to visitors.

16 | Tulsa, OK Parks and Recreation Master Plan Final Report
7.1.8 Look for opportunities to provide trail links to specific destinations like schools, parks, indoor recreational facilities, and businesses. 7.1.9 Add and improve sidewalks between designated connections.
GOAL 8: CONSIDER COMBINING THE EXISTING CITY PARKS AND RECREATION DEPARTMENT WITH THE RIVER PARKS AUTHORITY AND THE TULSA COUNTY PARKS DEPARTMENT Strategy 8.1: Begin dialogue with the Mayor, City Council, Park Board, Park Director, River Parks Authority Board of Trustees and Executive Director, the Tulsa County Commissioners, Tulsa County Park Board, and the Director of the County Parks to determine potential desirability, feasibility, and benefits of combining the three entities into a single entity, department, or district. 8.1.1 Identify Task Force to examine potential and issue a report by the end of 2010.
Tulsa, OK Parks and Recreation Master Plan Final Report| 17
II. Past, Present, and Future – The Planning Context
A. Purpose of this Plan The Tulsa Parks and Recreation Master Plan is intended to help meet the needs of current and future residents by positioning Tulsa to sustain and improve the community’s vast and unique parks and recreation assets. The citizen-driven plan establishes a clear direction to guide city staff, advisory committees, and elected officials in their efforts to enhance the community’s parks and recreation services and facilities. This Master Planning process does not specifically address the Tulsa Zoo or Golf Course.
B. The City of Tulsa Resource Map A: Regional Context shows that Tulsa is situated in Tulsa County along the Arkansas River in Northeastern Oklahoma. To the east are the Ozark Mountains, and the Great Plains lie to the west. Most of the city is on the east bank of the river, with downtown Tulsa situated at a bend in the river where it changes course from east to southerly. Just northwest of downtown is the boundary of the Osage Indian Reservation, and the southeast side of Tulsa is adjacent to the community of Broken Arrow. Tulsa sits about 700 feet above sea level, although Holmes Peak in the northwest part of the city rises to 1030 feet. Tulsa gets about 39 inches of rainfall a year, most of which comes during intense storms, although the average snowfall is about nine inches per year. Temperatures can range from as low as 20 degrees below zero (F) in rare cases to highs of more than 100 degrees (F) in summer. Creek Indians settled here in the first half of the 1800’s. The city’s name is derived from their language. The discoveries of oil just after the turn of the 20th Century lead Tulsa to become known as the “Oil Capital of the World,” and one of America’s most beautiful cities by the 1950’s. Today Tulsa continues to rank high on many “most livable city” lists. The justification for this includes many fine parks, a zoo, botanical gardens, and other facilities. Tulsa Parks is the primary provider of such facilities, although Tulsa County also provides parks and recreation facilities and the River Parks Authority manages a ten-mile stretch of shoreline along the Arkansas River.
18 | Tulsa, OK Parks and Recreation Master Plan Final Report
C. History of Tulsa Parks and Recreation Department The Tulsa Park and Recreation Department has a history dating back nearly 100 years. It first came into being on August 18, 1909, when the City of Tulsa bought Owen Park from Chauncey and Mary Owen for $13,500. Tulsa's first park superintendent, John Meisenbacher, later moved into a house located in the park. Park board meetings were held in a room above his garage. After planting 600 roses in an effort to “spruce-up” the property, Tulsa's first city park officially opened on June 8, 1910. Tulsa was growing in the early 1900s and residents felt the need for open space within the town to escape the rigors of new urban life. Parks came to have a special value to citizens of the day. Shortly after Owen Park was acquired, Woodward and Central parks were added to the new park system. A Park Commission also was responsible for developing a boulevard system to beautify the city with flowers, trees, and scenery. The Park Department’s early years emphasized horticulture; recreation was an afterthought. Parks were mostly places to relax and enjoy the scenery. More land was needed and in 1912, voters approved the first park bond issue to purchase tracts of land and fund inexpensive improvements. It was during these years that the popular attraction, Orcutt's Lake at 21st Street and Utica Avenue, became Swan Lake and came into the Park's fold. The Park System was established in 1918. The largest park in the system, Mohawk Park, was an afterthought of the Spavinaw Dam that brought water to Tulsa in 1924. An early public- and private-sector partnership, Mohawk's purchase was engineered by a trust comprised of prominent local citizens. Voters then passed a bond issue to buy the trust's option on the park, making it a city property. In 1925, the first written minutes of the Park Board were recorded. In them were noted the total area of parks — nearly 3,000 acres — and that there were no office facilities, no system for keeping track of tools, no equipment, and no plans for handling maintenance or development. As urban life became more of an accepted way of life in the 20’s and 30’s, people looked to the parks to provide scheduled activities. W.O. Doolittle was hired in 1926 as park superintendent. His pay was $325 per month plus a house and car. He filled the superintendent position until 1937 and left his mark on the department by putting an emphasis on recreation programs and de-emphasizing horticulture. He created summer programs, improved facilities, and hired recreational leaders. The 1920’s saw continual growth with the first park bond issue for development of Newblock Park, the dedication of Tracy Park wading pool, purchase of Lincoln and Springdale parks, building of roads at Mohawk for golf and zoo and a $150,000 bond issue for public improvements. Under Mayor Patton in 1928, Owen, Cheyenne, Newblock, Howard, West Tulsa, Boulder, Riverside Drive, Tracy and Central parks were landscaped, fencing was added to Swan Lake, and a $200,000 park bond was sold. Archer Park's playground was added in 1929.
Tulsa, OK Parks and Recreation Master Plan Final Report| 19
Tulsa's economy suffered during the Depression in the 30’s but the Park Department profited from work programs. The Civilian Conservation Corps and the Works Progress Administration workers cleared outlying parks of everything but trees and helped build the Rock Garden and Rose Garden at Woodward Park. The National Park Service took over planning of structures in Mohawk Park from the City Par k Department. The WPA workers built bridges, roads, and shelters to blend in with the natural landscape. They also brought waterlines and restrooms into Mohawk for the first time. Parks were now a chief source of leisure for the public. When O.E. Zeigler, a disciple of Doolittle, became superintendent in 1937 he further developed recreation programs. People crowded into city parks on nights and weekends in the 30’s, 40’s and 50’s. The City created a recreation department in 1946. A 1947 study discovered Tulsa had 10 acres of parkland to 4,615 people. The standard ratio was 10 acres per 1,000 people. The Department was handicapped on correcting the problem by an unusually small operating budget. Recreation leaders were underpaid and there were no year -round programs. As the city grew after World War II, there was an urgent need to acquire parkland in the new residential developments. Voters passed bond issues for acquisition and capital improvements on a regular basis until the mid 60’s, but the parks still lagged behind the booming population increases. A bond issue in 1952 built much of the park system. The Garden Center was purchased and playgrounds and pools were added to many areas. George Taylor was appointed program and recreation director. For years, the Park Department was directed by the same board as the airport. The political importance of the airport did not allow adequate time for the direction of the ever -increasing park system. With the separation of the boards in 1958, the Park Department took on a new look and Gilcrease Museum was added to the Department, Mohawk was revitalized, new arts and crafts programs were offered, and a year-round recreation program was initiated. Funding took a new turn in 1960 when, through a Park Department initiative, a partnership was formed with Tulsa Public Schools to take advantage of federal programs. The Community School Coordinating Committee was established and led to facility exchange and the joint use agreement in 1963. Recreation was formally joined with Parks and in 1961 Bob Hunter became the first Parks and Recreation Department director. Bond issues became tougher to pass and in 1969 an omnibus bond issue failed. Continued federal funding was used for recreation programs and 30 Park and Recreation sites, 12 community agencies, and 3 county recreation programs were funded with Department of Labor money and administered through Tulsa Park and Recreation.
20 | Tulsa, OK Parks and Recreation Master Plan Final Report
In 1972, voters passed a $13 million bond issue that was matched with $3 million in federal fund s to build park facilities. Oxley Nature Center was established in Mohawk Park in 1974 and private monies in 1977 allowed for its development. Hugh McKnight became the director of the Tulsa Park and Recreation Department in 1975 and retired in January 2001. During his tenure the last two recreation centers, and Manion and Hicks Parks, were built in 1976. The next year held major reorganization efforts for the Zoo. An investigation into animal care led to the end of Tulsa Zoological Society and the creation of a group that later became Zoo Friends. Mary Ann Summerfield became the department director in July 2002 and retired at the end of 2007. During her time in the position, private and public cooperative efforts were instituted resulting in more than $1.4 million in donations for the construction of new park facilities, including a new 12,000 square foot community/senior center at Centennial Park that opened in 2006 and the improvement of several existing facilities. Max Wiens was named Interim Director, after the retirement of Mary Ann Summerfield at the end of 2007, and oversaw the privatization of golf course management. In September, 2008 Nancy Atwater became the Director of Parks and Recreation. She initiated the master planning process. In July 2009, Lucy Dolman assumed the position of Director, oversaw the completion of the Plan, and will be charged with implementing the recommendations set forth.
D. Parks and Recreation Department Overview The City of Tulsa manages 135 parks covering roughly 6,000 acres including nature centers, golf courses, WaterWorks Art Studio, Clark Theatre and Heller Theatre at Henthorne, Tulsa Zoo & Living Museum, Tulsa Garden Center, 21 swimming pools, over 200 sports fields, 89 playgrounds, 116 tennis courts, 31 water playgrounds, The River SkatePark, 69 picnic shelters, 21 community centers, fitness facilities, gymnasiums, meeting rooms and facilities, trails and more. This Master Plan does not specifically address the Tulsa Zoo or golf courses.
E. Tulsa Parks Vision Statement Tulsa will be known as a city that celebrates and preserves green space, beautiful environments and enjoys outstanding recreational opportunities supporting the health and wellbeing of its citizens.
F. Related Planning Efforts and Integration This Master Plan has integrated information from additional planning efforts for the City of Tulsa that have helped inform the planning process for this Plan. These include:
Summary of recent ten-year plan updates for Tulsa Neighborhood Implementation Plan Studies, 2008
Downtown Tulsa Master Plan, 2009 (Draft)
Brady Village Trail Plan, 2009
Strategic Plan for the City of Tulsa Parks and Recreation Department, 2009-10
PLANiTULSA, currently in progress
Tulsa, OK Parks and Recreation Master Plan Final Report| 21
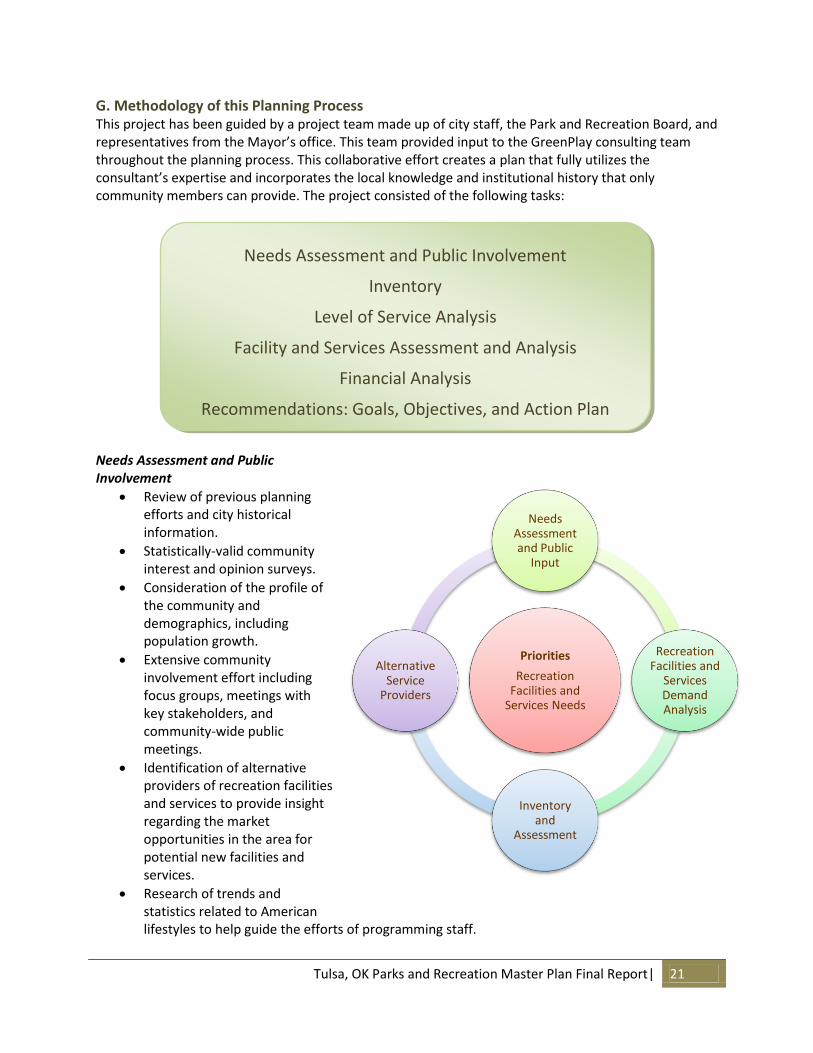
Priorities
Recreation Facilities and
Services Needs
Needs Assessment and Public
Input
Recreation Facilities and
Services Demand Analysis
Inventory and
Assessment
Alternative Service
Providers
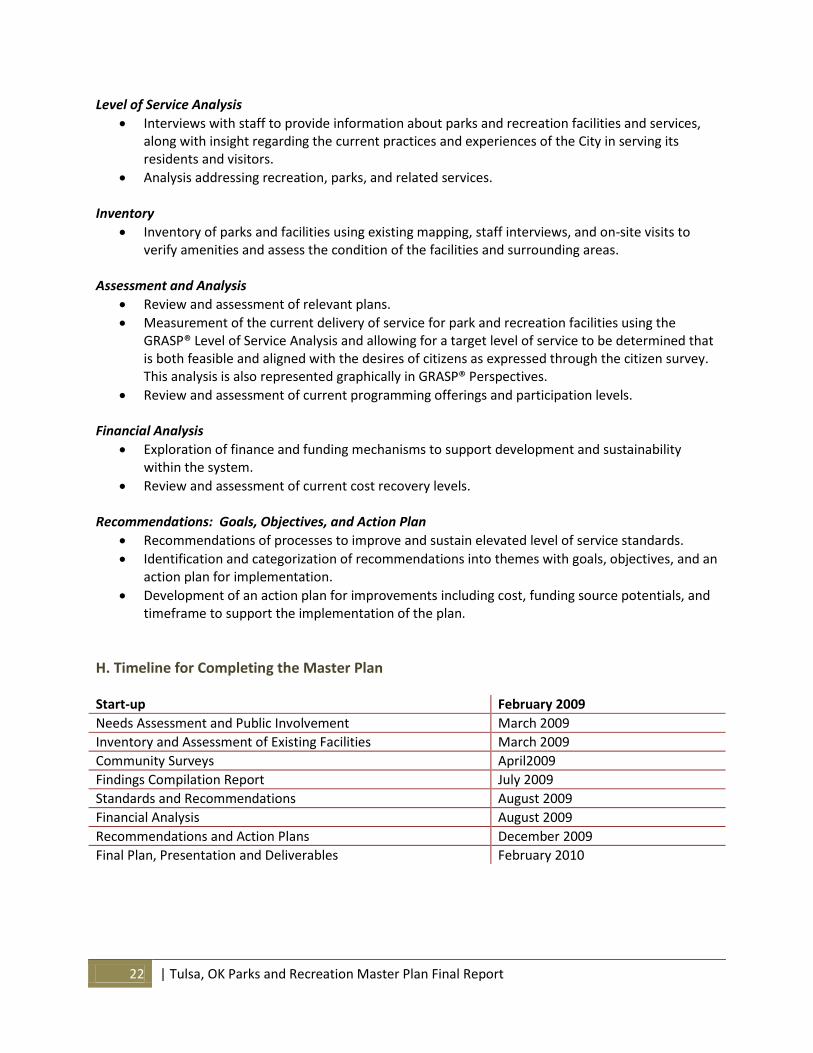
G. Methodology of this Planning Process This project has been guided by a project team made up of city staff, the Park and Recreation Board, and representatives from the Mayor’s office. This team provided input to the GreenPlay consulting team throughout the planning process. This collaborative effort creates a plan that fully utilizes the consultant’s expertise and incorporates the local knowledge and institutional history that only community members can provide. The project consisted of the following tasks:
Needs Assessment and Public Involvement
Review of previous planning efforts and city historical information.
Statistically-valid community interest and opinion surveys.
Consideration of the profile of the community and demographics, including population growth.
Extensive community involvement effort including focus groups, meetings with key stakeholders, and community-wide public meetings.
Identification of alternative providers of recreation facilities and services to provide insight regarding the market opportunities in the area for potential new facilities and services.
Research of trends and statistics related to American lifestyles to help guide the efforts of programming staff.
Needs Assessment and Public Involvement
Inventory
Level of Service Analysis
Facility and Services Assessment and Analysis
Financial Analysis
Recommendations: Goals, Objectives, and Action Plan
22 | Tulsa, OK Parks and Recreation Master Plan Final Report
Level of Service Analysis
Interviews with staff to provide information about parks and recreation facilities and services, along with insight regarding the current practices and experiences of the City in serving its residents and visitors.
Analysis addressing recreation, parks, and related services. Inventory
Inventory of parks and facilities using existing mapping, staff interviews, and on-site visits to verify amenities and assess the condition of the facilities and surrounding areas.
Assessment and Analysis
Review and assessment of relevant plans.
Measurement of the current delivery of service for park and recreation facilities using the GRASP® Level of Service Analysis and allowing for a target level of service to be determined that is both feasible and aligned with the desires of citizens as expressed through the citizen survey. This analysis is also represented graphically in GRASP® Perspectives.
Review and assessment of current programming offerings and participation levels. Financial Analysis
Exploration of finance and funding mechanisms to support development and sustainability within the system.
Review and assessment of current cost recovery levels. Recommendations: Goals, Objectives, and Action Plan
Recommendations of processes to improve and sustain elevated level of service standards.
Identification and categorization of recommendations into themes with goals, objectives, and an action plan for implementation.
Development of an action plan for improvements including cost, funding source potentials, and timeframe to support the implementation of the plan.
H. Timeline for Completing the Master Plan Start-up February 2009
Needs Assessment and Public Involvement March 2009
Inventory and Assessment of Existing Facilities March 2009
Community Surveys April2009
Findings Compilation Report July 2009
Standards and Recommendations August 2009
Financial Analysis August 2009
Recommendations and Action Plans December 2009
Final Plan, Presentation and Deliverables February 2010
Tulsa, OK Parks and Recreation Master Plan Final Report| 23
III. What We Want- Our Community and Identified Needs
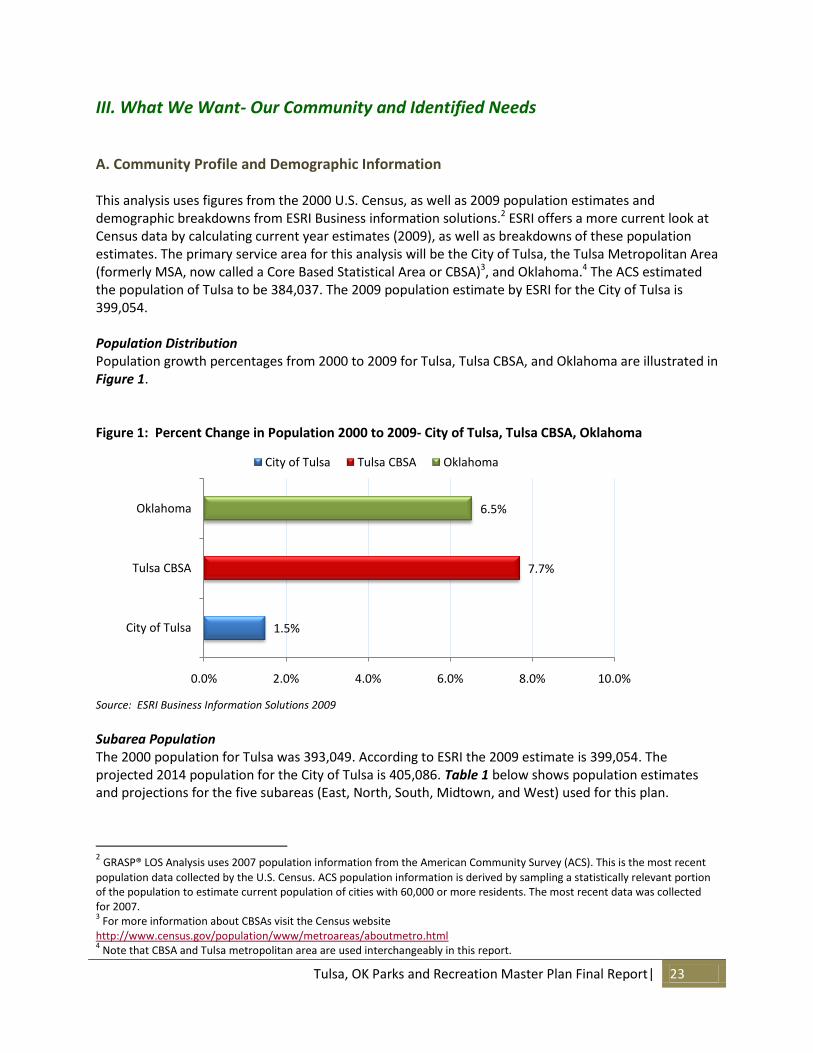
A. Community Profile and Demographic Information This analysis uses figures from the 2000 U.S. Census, as well as 2009 population estimates and demographic breakdowns from ESRI Business information solutions.2 ESRI offers a more current look at Census data by calculating current year estimates (2009), as well as breakdowns of these population estimates. The primary service area for this analysis will be the City of Tulsa, the Tulsa Metropolitan Area (formerly MSA, now called a Core Based Statistical Area or CBSA)3, and Oklahoma.4 The ACS estimated the population of Tulsa to be 384,037. The 2009 population estimate by ESRI for the City of Tulsa is 399,054. Population Distribution Population growth percentages from 2000 to 2009 for Tulsa, Tulsa CBSA, and Oklahoma are illustrated in Figure 1. Figure 1: Percent Change in Population 2000 to 2009- City of Tulsa, Tulsa CBSA, Oklahoma
Source: ESRI Business Information Solutions 2009
Subarea Population The 2000 population for Tulsa was 393,049. According to ESRI the 2009 estimate is 399,054. The projected 2014 population for the City of Tulsa is 405,086. Table 1 below shows population estimates and projections for the five subareas (East, North, South, Midtown, and West) used for this plan.
2 GRASP® LOS Analysis uses 2007 population information from the American Community Survey (ACS). This is the most recent
population data collected by the U.S. Census. ACS population information is derived by sampling a statistically relevant portion of the population to estimate current population of cities with 60,000 or more residents. The most recent data was collected for 2007. 3 For more information about CBSAs visit the Census website
http://www.census.gov/population/www/metroareas/aboutmetro.html 4 Note that CBSA and Tulsa metropolitan area are used interchangeably in this report.
1.5%
7.7%
6.5%
0.0% 2.0% 4.0% 6.0% 8.0% 10.0%
City of Tulsa
Tulsa CBSA
Oklahoma
City of Tulsa Tulsa CBSA Oklahoma
24 | Tulsa, OK Parks and Recreation Master Plan Final Report
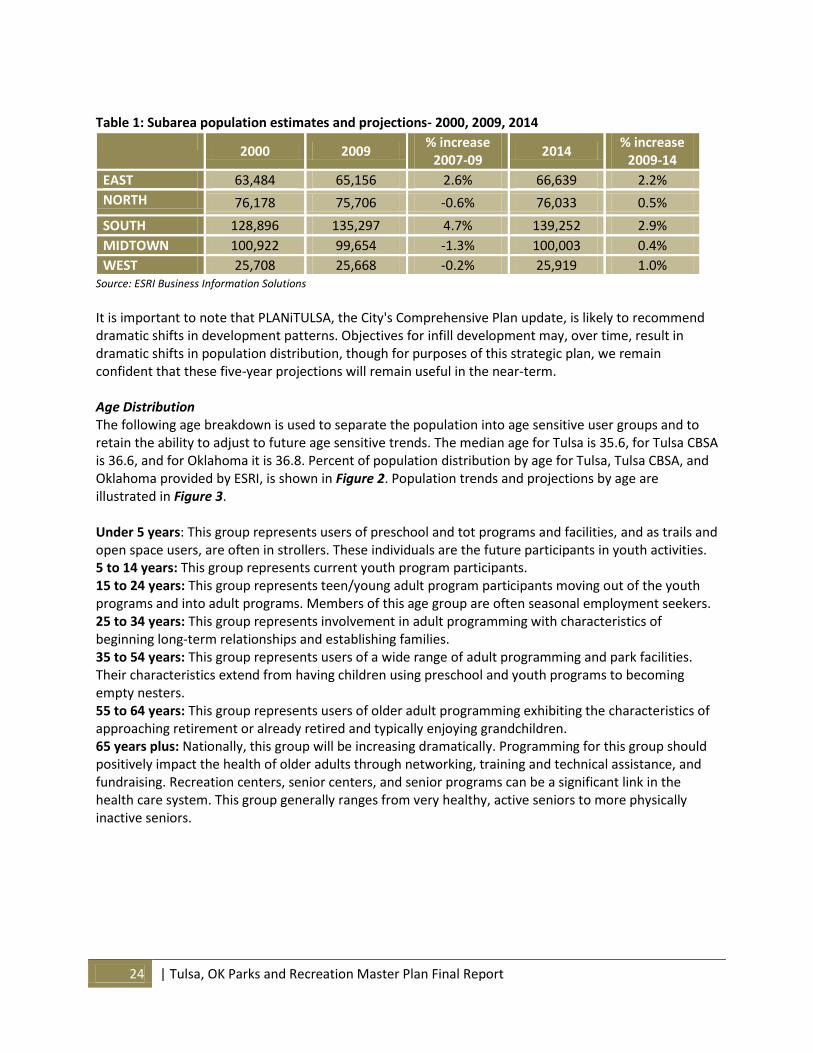
Table 1: Subarea population estimates and projections- 2000, 2009, 2014
2000 2009
% increase 2007-09
2014 % increase
2009-14
EAST 63,484 65,156 2.6% 66,639 2.2%
NORTH 76,178 75,706 -0.6% 76,033 0.5%
SOUTH 128,896 135,297 4.7% 139,252 2.9%
MIDTOWN 100,922 99,654 -1.3% 100,003 0.4%
WEST 25,708 25,668 -0.2% 25,919 1.0% Source: ESRI Business Information Solutions
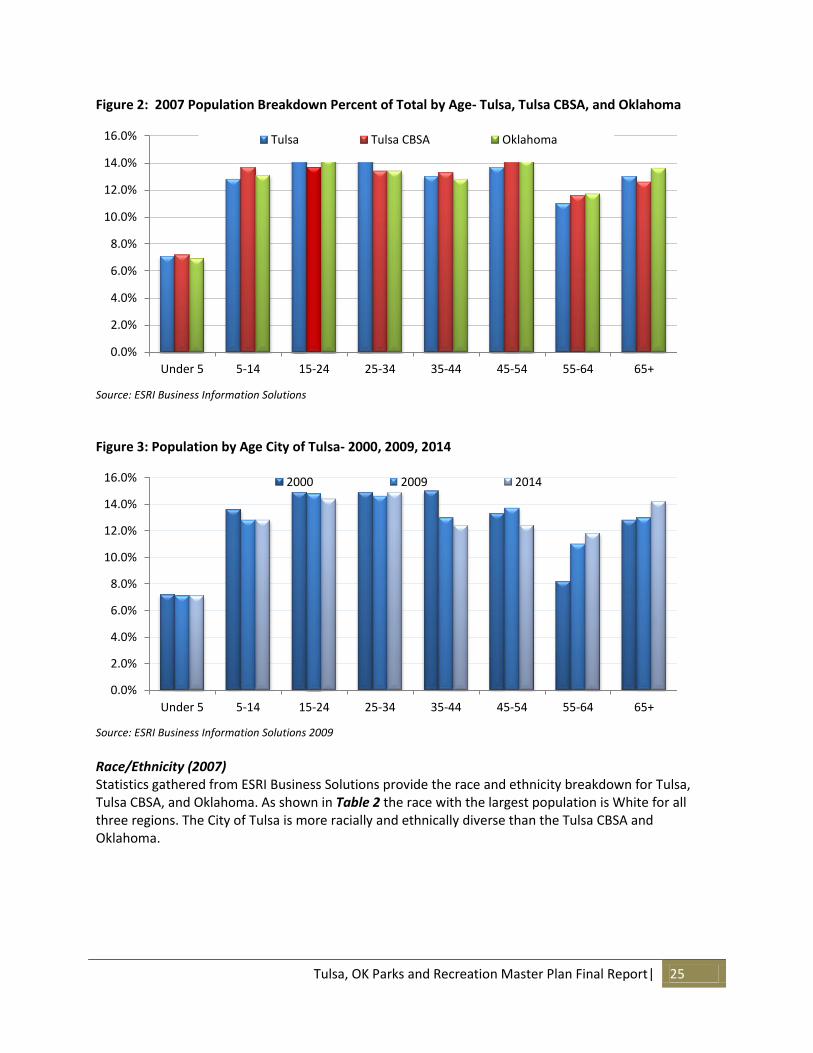
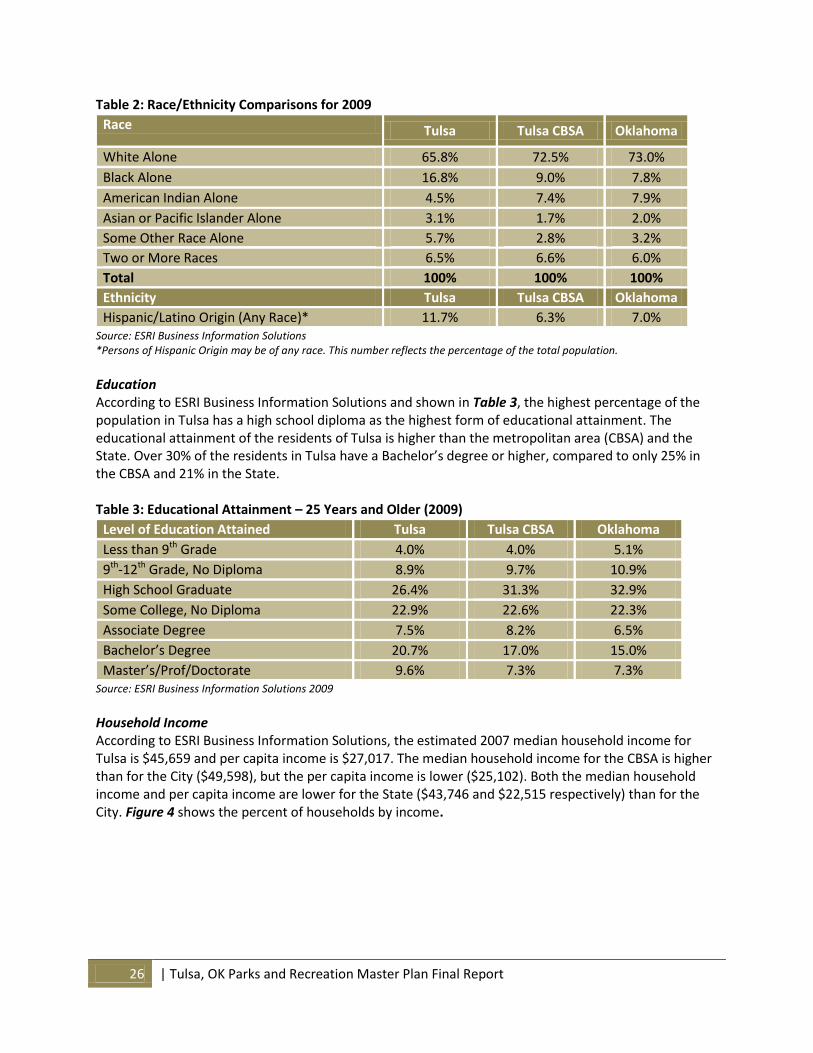
It is important to note that PLANiTULSA, the City's Comprehensive Plan update, is likely to recommend dramatic shifts in development patterns. Objectives for infill development may, over time, result in dramatic shifts in population distribution, though for purposes of this strategic plan, we remain confident that these five-year projections will remain useful in the near-term. Age Distribution The following age breakdown is used to separate the population into age sensitive user groups and to retain the ability to adjust to future age sensitive trends. The median age for Tulsa is 35.6, for Tulsa CBSA is 36.6, and for Oklahoma it is 36.8. Percent of population distribution by age for Tulsa, Tulsa CBSA, and Oklahoma provided by ESRI, is shown in Figure 2. Population trends and projections by age are illustrated in Figure 3. Under 5 years: This group represents users of preschool and tot programs and facilities, and as trails and open space users, are often in strollers. These individuals are the future participants in youth activities. 5 to 14 years: This group represents current youth program participants. 15 to 24 years: This group represents teen/young adult program participants moving out of the youth programs and into adult programs. Members of this age group are often seasonal employment seekers. 25 to 34 years: This group represents involvement in adult programming with characteristics of beginning long-term relationships and establishing families. 35 to 54 years: This group represents users of a wide range of adult programming and park facilities. Their characteristics extend from having children using preschool and youth programs to becoming empty nesters. 55 to 64 years: This group represents users of older adult programming exhibiting the characteristics of approaching retirement or already retired and typically enjoying grandchildren. 65 years plus: Nationally, this group will be increasing dramatically. Programming for this group should positively impact the health of older adults through networking, training and technical assistance, and fundraising. Recreation centers, senior centers, and senior programs can be a significant link in the health care system. This group generally ranges from very healthy, active seniors to more physically inactive seniors.
Tulsa, OK Parks and Recreation Master Plan Final Report| 25
Figure 2: 2007 Population Breakdown Percent of Total by Age- Tulsa, Tulsa CBSA, and Oklahoma
Source: ESRI Business Information Solutions
Figure 3: Population by Age City of Tulsa- 2000, 2009, 2014
Source: ESRI Business Information Solutions 2009
Race/Ethnicity (2007) Statistics gathered from ESRI Business Solutions provide the race and ethnicity breakdown for Tulsa, Tulsa CBSA, and Oklahoma. As shown in Table 2 the race with the largest population is White for all three regions. The City of Tulsa is more racially and ethnically diverse than the Tulsa CBSA and Oklahoma.
0.0%
2.0%
4.0%
6.0%
8.0%
10.0%
12.0%
14.0%
16.0%
Under 5 5-14 15-24 25-34 35-44 45-54 55-64 65+
Tulsa Tulsa CBSA Oklahoma
0.0%
2.0%
4.0%
6.0%
8.0%
10.0%
12.0%
14.0%
16.0%
Under 5 5-14 15-24 25-34 35-44 45-54 55-64 65+
2000 2009 2014
26 | Tulsa, OK Parks and Recreation Master Plan Final Report
Table 2: Race/Ethnicity Comparisons for 2009
Race Tulsa Tulsa CBSA Oklahoma
White Alone 65.8% 72.5% 73.0%
Black Alone 16.8% 9.0% 7.8%
American Indian Alone 4.5% 7.4% 7.9%
Asian or Pacific Islander Alone 3.1% 1.7% 2.0%
Some Other Race Alone 5.7% 2.8% 3.2%
Two or More Races 6.5% 6.6% 6.0%
Total 100% 100% 100%
Ethnicity Tulsa Tulsa CBSA Oklahoma
Hispanic/Latino Origin (Any Race)* 11.7% 6.3% 7.0% Source: ESRI Business Information Solutions *Persons of Hispanic Origin may be of any race. This number reflects the percentage of the total population.
Education According to ESRI Business Information Solutions and shown in Table 3, the highest percentage of the population in Tulsa has a high school diploma as the highest form of educational attainment. The educational attainment of the residents of Tulsa is higher than the metropolitan area (CBSA) and the State. Over 30% of the residents in Tulsa have a Bachelor’s degree or higher, compared to only 25% in the CBSA and 21% in the State. Table 3: Educational Attainment – 25 Years and Older (2009)
Level of Education Attained Tulsa Tulsa CBSA Oklahoma
Less than 9th Grade 4.0% 4.0% 5.1%
9th-12th Grade, No Diploma 8.9% 9.7% 10.9%
High School Graduate 26.4% 31.3% 32.9%
Some College, No Diploma 22.9% 22.6% 22.3%
Associate Degree 7.5% 8.2% 6.5%
Bachelor’s Degree 20.7% 17.0% 15.0%
Master’s/Prof/Doctorate 9.6% 7.3% 7.3% Source: ESRI Business Information Solutions 2009
Household Income According to ESRI Business Information Solutions, the estimated 2007 median household income for Tulsa is $45,659 and per capita income is $27,017. The median household income for the CBSA is higher than for the City ($49,598), but the per capita income is lower ($25,102). Both the median household income and per capita income are lower for the State ($43,746 and $22,515 respectively) than for the City. Figure 4 shows the percent of households by income.
Tulsa, OK Parks and Recreation Master Plan Final Report| 27
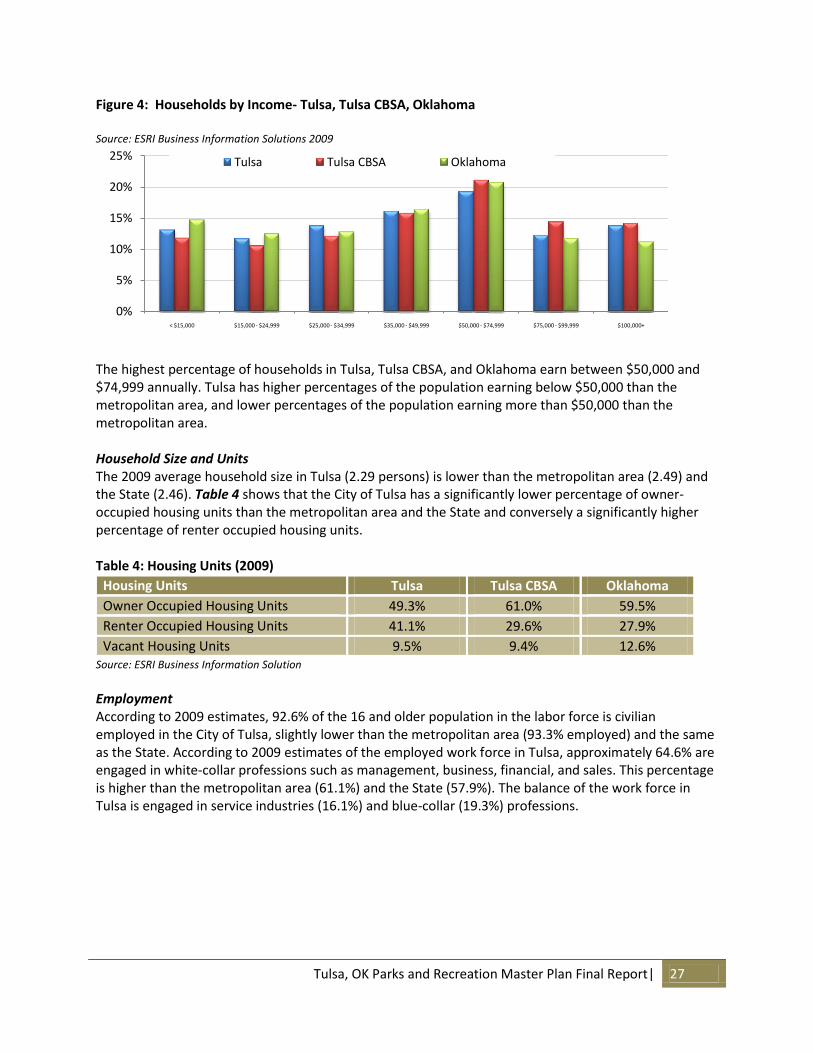
Figure 4: Households by Income- Tulsa, Tulsa CBSA, Oklahoma Source: ESRI Business Information Solutions 2009
The highest percentage of households in Tulsa, Tulsa CBSA, and Oklahoma earn between $50,000 and $74,999 annually. Tulsa has higher percentages of the population earning below $50,000 than the metropolitan area, and lower percentages of the population earning more than $50,000 than the metropolitan area. Household Size and Units The 2009 average household size in Tulsa (2.29 persons) is lower than the metropolitan area (2.49) and the State (2.46). Table 4 shows that the City of Tulsa has a significantly lower percentage of owner-occupied housing units than the metropolitan area and the State and conversely a significantly higher percentage of renter occupied housing units. Table 4: Housing Units (2009)
Housing Units Tulsa Tulsa CBSA Oklahoma
Owner Occupied Housing Units 49.3% 61.0% 59.5%
Renter Occupied Housing Units 41.1% 29.6% 27.9%
Vacant Housing Units 9.5% 9.4% 12.6% Source: ESRI Business Information Solution
Employment According to 2009 estimates, 92.6% of the 16 and older population in the labor force is civilian employed in the City of Tulsa, slightly lower than the metropolitan area (93.3% employed) and the same as the State. According to 2009 estimates of the employed work force in Tulsa, approximately 64.6% are engaged in white-collar professions such as management, business, financial, and sales. This percentage is higher than the metropolitan area (61.1%) and the State (57.9%). The balance of the work force in Tulsa is engaged in service industries (16.1%) and blue-collar (19.3%) professions.
0%
5%
10%
15%
20%
25%
< $15,000 $15,000 - $24,999 $25,000 - $34,999 $35,000 - $49,999 $50,000 - $74,999 $75,000 - $99,999 $100,000+
Tulsa Tulsa CBSA Oklahoma
28 | Tulsa, OK Parks and Recreation Master Plan Final Report
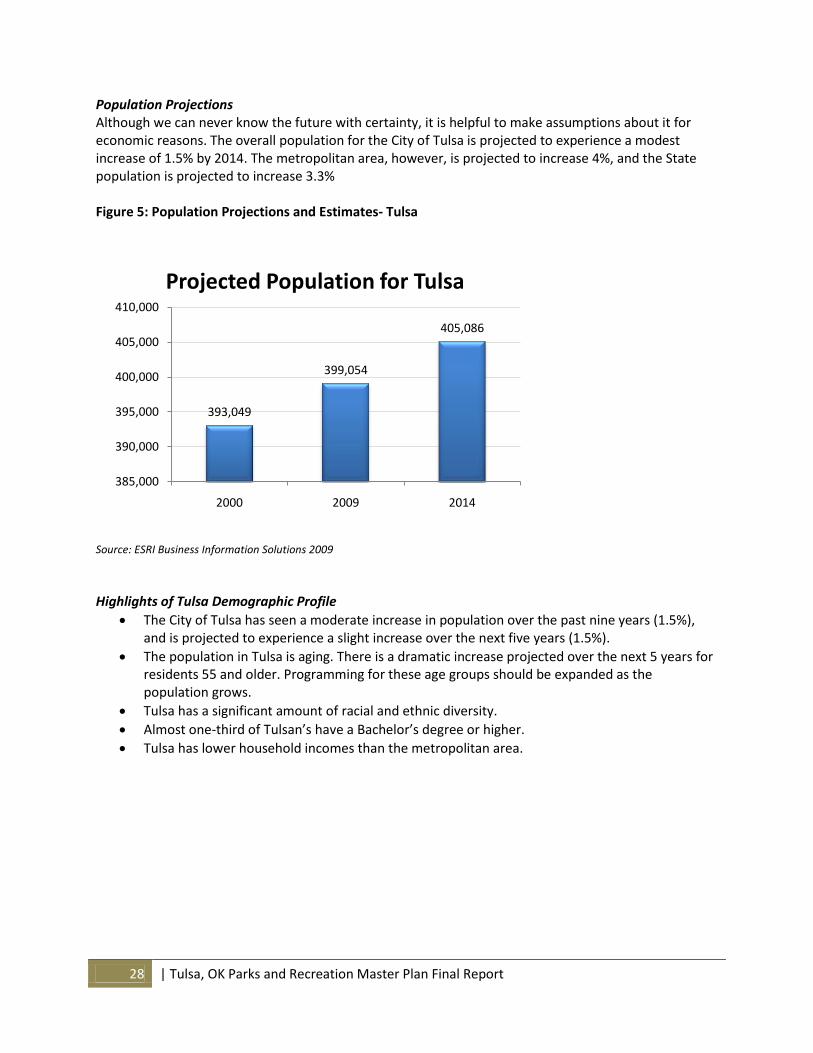
Population Projections Although we can never know the future with certainty, it is helpful to make assumptions about it for economic reasons. The overall population for the City of Tulsa is projected to experience a modest increase of 1.5% by 2014. The metropolitan area, however, is projected to increase 4%, and the State population is projected to increase 3.3% Figure 5: Population Projections and Estimates- Tulsa
Source: ESRI Business Information Solutions 2009
Highlights of Tulsa Demographic Profile
The City of Tulsa has seen a moderate increase in population over the past nine years (1.5%), and is projected to experience a slight increase over the next five years (1.5%).
The population in Tulsa is aging. There is a dramatic increase projected over the next 5 years for residents 55 and older. Programming for these age groups should be expanded as the population grows.
Tulsa has a significant amount of racial and ethnic diversity.
Almost one-third of Tulsan’s have a Bachelor’s degree or higher.
Tulsa has lower household incomes than the metropolitan area.
393,049
399,054
405,086
385,000
390,000
395,000
400,000
405,000
410,000
2000 2009 2014
Projected Population for Tulsa
Tulsa, OK Parks and Recreation Master Plan Final Report| 29
B. Current Park and Recreation Trends A challenge of Parks and Recreation Departments is to continue to understand and respond to the changing characteristics of those it serves. In this fast-paced society it is important to stay on top of current trends impacting parks and recreation. The following information highlights relevant local, regional, and national parks and recreational trends. The demographic profile of the City of Tulsa was taken into consideration when compiling applicable trends. Trends by Age Older Adults
The demographic analysis indicates that Tulsa’s older adult population is growing. The following are trends related to the aging population in the United States.
America is aging and it is estimated that by 2010, the median age will be 37 years, and by 2030 the median age will be 39 years.
The current life expectancy in the United States is 77.9 years.
There is a growing body of evidence that indicates that aging has more to do with lifestyles and health behaviors than genetics.
Seniors control more than 70 percent of the disposable income and have more than $1.6 trillion in spending power, according to Packaged Facts, a division of MarketResearch.com, which publishes market intelligence on several consumer industries.
In 2007, there were 9.9 million health club members over the age of 55, an increase of 411% from 1990. (2007 International Health, Racquet and Sportsclub Association, IHRSA/ American Sports Data Health Club Trend Report.)
Baby Boomers Baby Boomers are adults born between 1946 and 1964. This generation makes up approximately 25 percent of the total population in the United States. The oldest Boomers turned 60 years old in 2006, and are about to retire in record numbers. These trends are important to recognize and may explain the changing national demands, from traditional low-cost social services to more active programming for which older residents are willing to pay. The following are trends of this generation: Baby Boomers leisure time is increasingly being spent doing physical activities, in educational classes, turning hobbies into investments, utilizing online retail and education websites, partaking in adventure travel, and attending sporting events. Approximately 70 percent of the current retired population entered retirement before the age of 65. New retirees are younger, healthier, and have more wealth to spend for the services they want. Many may feel an important need for part-time employment in recreation, for fun, socializing, and added fulfillment in their lives.
30 | Tulsa, OK Parks and Recreation Master Plan Final Report
Seniors With seniors getting into exercise, there is a growing trend towards specialized programs for older adults. These programs focus on the special needs of seniors like arthritis, osteoporosis, balance issues, flexibility, and better daily functioning. According to AARP, 2008’s latest trends for the older population include:
Virtual Birding – View a photo gallery and name that bird’s tune
Electronic games – Adults over 50 are enjoying Wii and other electronic games. For instance, golf, brain teasers, and other sports games
Incentive-based walking programs
Wellness seminars The top three sports activities for persons 65 years and older in 2007 were: exercise walking, exercising with equipment, and swimming. The majority (60%) of the most popular activities for seniors are fitness related according to the Sporting Goods Manufacturers Association 2006 Edition of Sports Participation. There are more than 10 million people ages 55 years and older who exercise walk and more than 8 million who stretch and exercise with a treadmill. Facility Trends Recreation Facilities The current national trend is toward a “one-stop” facility to serve all ages. Large multipurpose regional centers (65,000-125,000 sq. feet) are designed to appeal to all age groups and interest levels. This design helps increase cost recovery because it saves on staff costs, it encourages retention and participation, and it saves on operating expenses. Typical amenities of these facilities may include:
Leisure and therapeutic pools
Weight and cardiovascular equipment
Interactive game rooms
Nature centers, outdoor recreation, and education centers
Regional playgrounds for all ages of youth
In-line hockey and skate parks
Indoor walking tracks
Themed décor Amenities that are still considered alternative but are increasing in popularity include:
Climbing walls
Indoor soccer
Cultural art facilities
Green design techniques and certifications (such as Leadership in Energy and Environmental Design (LEED))
In a recent survey, 52% of the recreation industry survey respondents indicated they were willing to pay more for green design knowing it would significantly reduce or eliminate the negative impact of buildings on the environment and occupants.
Tulsa, OK Parks and Recreation Master Plan Final Report| 31
The June 2007 “State of the Industry” report surveyed all types of organizations including public, private, and nonprofit, from all over the country.
More than three-quarters of respondents reported that they have plans to build new facilities, add to their existing facilities, or renovate their existing facilities within the next three years.
On average, facilities operators are planning to spend nearly $3.8 million on new facilities, additions, and renovations over the next several years.
Across the board, the most common amenity included in facilities of all kinds were outdoor sport courts for such sports as tennis and basketball, locker rooms, bleachers and seating, natural turf sports fields for sports like baseball, football and soccer, and concession areas.
More than 60% of respondents said their facility included an outdoor sports court. Recreation facilities do not always require a large one-stop shop recreation center. Often community centers provide agencies multiuse space that addresses the needs of residents of all ages. Additionally, Recreation Management magazine included in the June 2008, State of the Industry Report the following list of most popular amenities planning to be added:
Bleachers and seating
Climbing walls
Playgrounds
Park structures, such as shelters and restroom buildings
Dog parks
Fitness centers
Splash play areas
Trails and open spaces, such as gardens and natural areas
Concession areas
Classrooms and meeting rooms Extreme Sports and Nontraditional Facilities
An increase in extreme and alternative sports has prompted agencies to build and expand facilities. Skate parks, BMX parks, Ultimate Frisbee courses, and running trails are being built at an increased rate.
According to the Sporting Goods Manufacturers Association (SGMA), extreme sports are not just a fad. Regardless of the time of year, extreme sports are increasing in participation
Nearly 45 percent of all inline skaters participate 13 days or more a year.
More than 3.8 million skateboarders participate 25+ days a year.
Trail running participation has been steady since 2000.
Ultimate Frisbee is more popular than lacrosse, wrestling, beach volleyball, fast-pitch softball, rugby, field hockey, ice hockey, and roller hockey.
Roller hockey’s biggest challenge is getting access to proper venues.
Two of the emerging specialty parks include skate parks and dog parks. (van der Smissen et al.)
The Sporting Goods Manufacturers Association estimates there are about 1,000 skateboard parks in the United States.
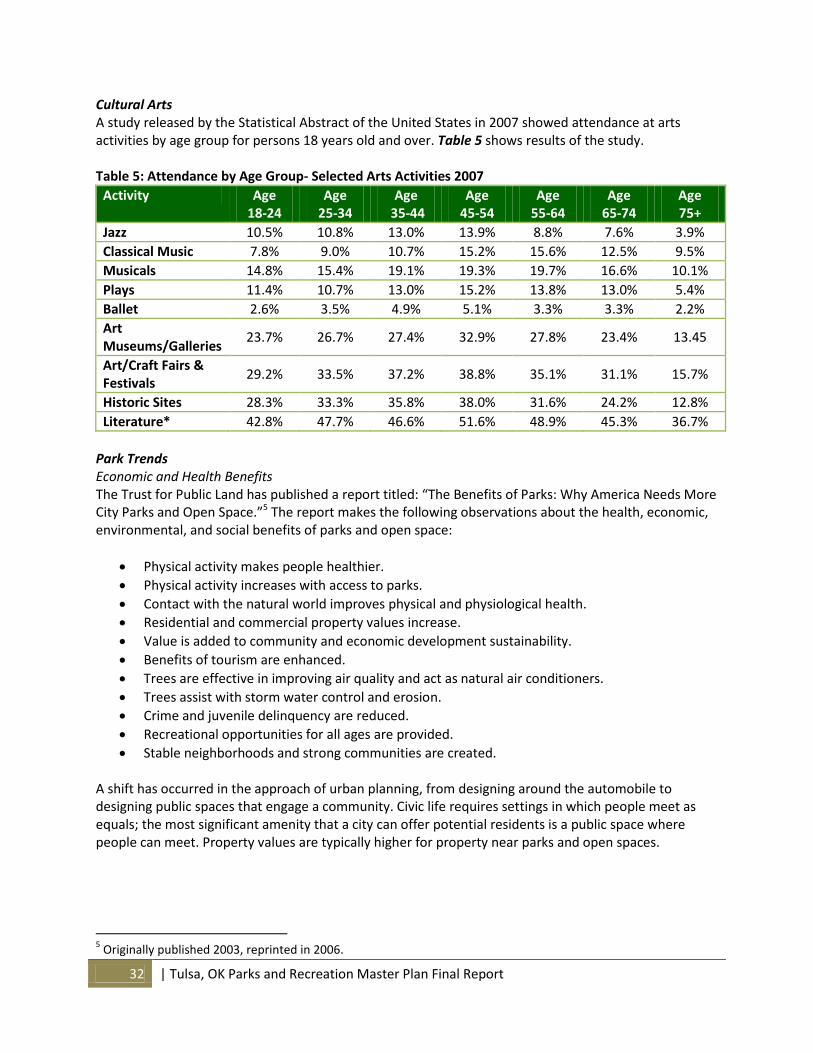
32 | Tulsa, OK Parks and Recreation Master Plan Final Report
Cultural Arts A study released by the Statistical Abstract of the United States in 2007 showed attendance at arts activities by age group for persons 18 years old and over. Table 5 shows results of the study. Table 5: Attendance by Age Group- Selected Arts Activities 2007
Activity Age 18-24
Age 25-34
Age 35-44
Age 45-54
Age 55-64
Age 65-74
Age 75+
Jazz 10.5% 10.8% 13.0% 13.9% 8.8% 7.6% 3.9%
Classical Music 7.8% 9.0% 10.7% 15.2% 15.6% 12.5% 9.5%
Musicals 14.8% 15.4% 19.1% 19.3% 19.7% 16.6% 10.1%
Plays 11.4% 10.7% 13.0% 15.2% 13.8% 13.0% 5.4%
Ballet 2.6% 3.5% 4.9% 5.1% 3.3% 3.3% 2.2%
Art Museums/Galleries
23.7% 26.7% 27.4% 32.9% 27.8% 23.4% 13.45
Art/Craft Fairs & Festivals
29.2% 33.5% 37.2% 38.8% 35.1% 31.1% 15.7%
Historic Sites 28.3% 33.3% 35.8% 38.0% 31.6% 24.2% 12.8%
Literature* 42.8% 47.7% 46.6% 51.6% 48.9% 45.3% 36.7%
Park Trends Economic and Health Benefits The Trust for Public Land has published a report titled: “The Benefits of Parks: Why America Needs More City Parks and Open Space.”5 The report makes the following observations about the health, economic, environmental, and social benefits of parks and open space:
Physical activity makes people healthier.
Physical activity increases with access to parks.
Contact with the natural world improves physical and physiological health.
Residential and commercial property values increase.
Value is added to community and economic development sustainability.
Benefits of tourism are enhanced.
Trees are effective in improving air quality and act as natural air conditioners.
Trees assist with storm water control and erosion.
Crime and juvenile delinquency are reduced.
Recreational opportunities for all ages are provided.
Stable neighborhoods and strong communities are created. A shift has occurred in the approach of urban planning, from designing around the automobile to designing public spaces that engage a community. Civic life requires settings in which people meet as equals; the most significant amenity that a city can offer potential residents is a public space where people can meet. Property values are typically higher for property near parks and open spaces.
5 Originally published 2003, reprinted in 2006.
Tulsa, OK Parks and Recreation Master Plan Final Report| 33
There are numerous economic and health benefits of parks, including the following:
Trails, parks, and playgrounds are among the five most important community amenities considered when selecting a home, according to a 2002 survey of recent homebuyers conducted by the National Association of Home Builders and the National Association of Realtors. (Pack, A. & Schunel)
Research from the University of Illinois shows that trees, parks, and green spaces have a profound impact on people’s health and mental outlook. U.S. Forest Service research indicates that when the economic benefits produced by trees are assessed, total value can be two to six times the cost for tree planting and care.
Parks & Recreation Administration Trends Park and Recreation professionals face many challenges and opportunities including:
Doing more with less, requiring partnership development.
Partnering between non-profit and public agencies.
Increasing the quality and diversity of services.
Moving toward a more business-like model while not competing with private sector.
The ability to maintaining increasing parks and open spaces.
Providing support for the socially and economically disadvantaged through programs in areas such as childcare, nutrition, etc.
Increasing responsibility for measurement and evaluation of programs and services. The trend in park and recreation management is toward outcome-based management, reflecting the effect on quality of life of those who participate or benefit from parks and recreation opportunities. Outcome-based management is useful in establishing the benefit to the community and to individuals. (van der Smissen et al.) Information technology has allowed for tracking and reporting of park and recreation services and operations. Level of subsidy for programs is declining and more “enterprise” activities are being developed, thereby allowing the subsidy to be used where deemed appropriate. Agencies across the United States are increasing revenue production and cost recovery. Pricing is often done by peak, off-peak, and off-season rates. Municipal parks and recreation structures and delivery systems have changed and more alternative methods of delivering services are emerging. There is more contracting out of certain services, and cooperative agreements with nonprofit groups and other public institutions. Newer partners include the health system, social services, justice, education, the corporate sector, and community service agencies. These partnerships reflect both a broader interpretation of the mandate of parks and recreation agencies, and the increased willingness of other sectors to work together to address community issues. The relationship with health will be vital in promoting wellness. The traditional relationship with education, the sharing of facilities through joint use agreements, is evolving into cooperative planning and programming aimed at addressing youth inactivity levels and community needs. Listed below are additional administrative national trends:
Level of subsidy for programs is lessening and more “enterprise” activities are being developed, thereby allowing subsidy to be used where deemed appropriate.
Information technology allows for tracking and reporting.
34 | Tulsa, OK Parks and Recreation Master Plan Final Report
Pricing is often done by peak, off-peak, and off-season rates.
More agencies are partnering with private, public, and nonprofit groups. Partnerships In the Parks and Recreation industry it is common to form partnerships with other organizations either to increase funding potential or to improve programming options. According to the June 2007 State of the Industry Report published in Recreation Management Magazine, 96.3% of survey respondents in the Parks and Recreation industry have found one way or another to partner with other organizations to accomplish their missions.
78.3% of parks and recreation departments reported forming partnerships with local schools.
Local government was the second most common partnership. More than 67% of parks and recreation departments in the survey listed local government as a partner.
Other partners listed in the survey include: IHRSA, Professional Golf Association (PGA), Rotary International, Lions and Elks Clubs, faith-based organizations, the Boys and Girls Clubs, Boy Scouts and Girl Scouts, the Special Olympics, and local and state tourism boards.
Facilities least likely to form partnerships with external organizations included: resorts, hotels, water parks, amusement parks, campgrounds, youth camps, private camps and RV parks.
C. Community and Stakeholder Input Tulsa Parks and Recreation Master Plan Focus Groups Summary Six initial focus groups and one public meeting were held March 3rd, 4th, and 5th 2009 to obtain public input for the Parks and Recreation Master Plan. Participants were asked to discuss key issues, opportunities, and priorities for parks and recreation in Tulsa. These meetings were held at the Central Community Center. Over 90 people attended these focus groups representing various interests concerning parks and recreation including:
Neighborhood organizations
YMCA
City Counselors
Tulsa Garden Center
Tulsa County
INCOG
IHCRC
Tulsa Parks Board
Youth Sports Organizations
Adult Sports Organizations
Tulsa Economic Roundtable The length of time focus group attendees have lived in Tulsa varied, but the majority (55%) has lived in the City for more than five years.
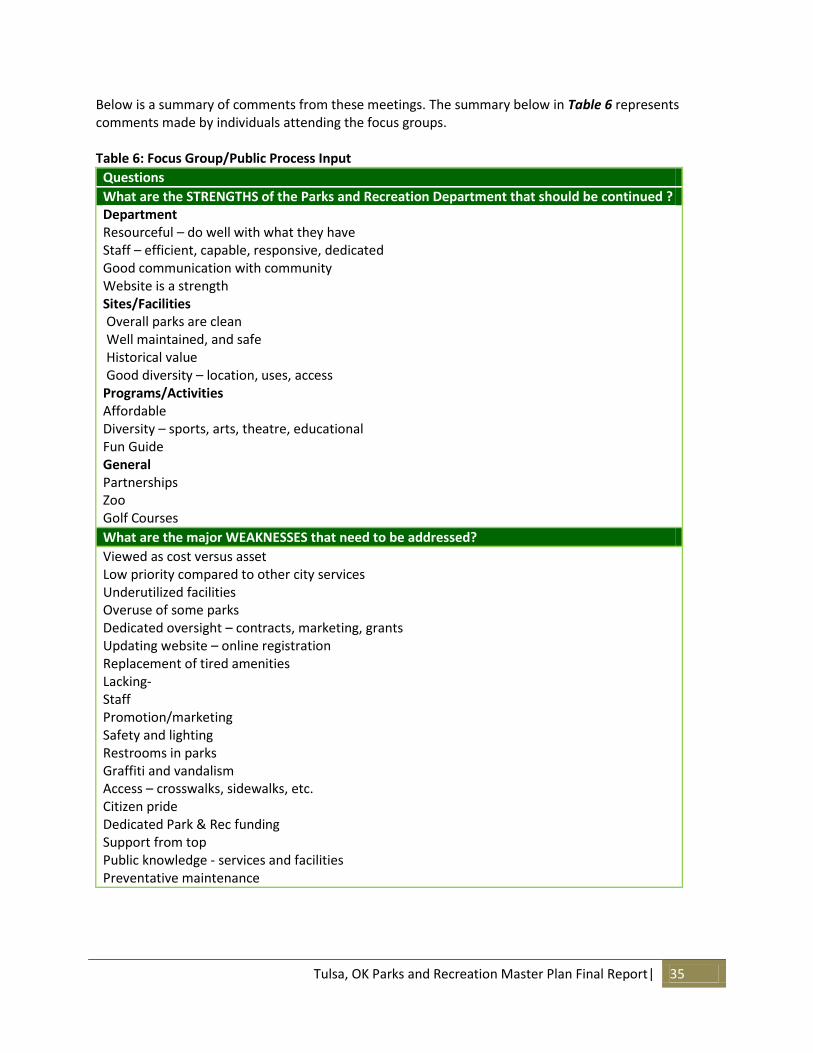
Tulsa, OK Parks and Recreation Master Plan Final Report| 35
Below is a summary of comments from these meetings. The summary below in Table 6 represents comments made by individuals attending the focus groups. Table 6: Focus Group/Public Process Input
Questions
What are the STRENGTHS of the Parks and Recreation Department that should be continued ? Department Resourceful – do well with what they have Staff – efficient, capable, responsive, dedicated Good communication with community Website is a strength Sites/Facilities Overall parks are clean Well maintained, and safe Historical value Good diversity – location, uses, access Programs/Activities Affordable Diversity – sports, arts, theatre, educational Fun Guide General Partnerships Zoo Golf Courses
What are the major WEAKNESSES that need to be addressed?
Viewed as cost versus asset Low priority compared to other city services Underutilized facilities Overuse of some parks Dedicated oversight – contracts, marketing, grants Updating website – online registration Replacement of tired amenities Lacking- Staff Promotion/marketing Safety and lighting Restrooms in parks Graffiti and vandalism Access – crosswalks, sidewalks, etc. Citizen pride Dedicated Park & Rec funding Support from top Public knowledge - services and facilities Preventative maintenance
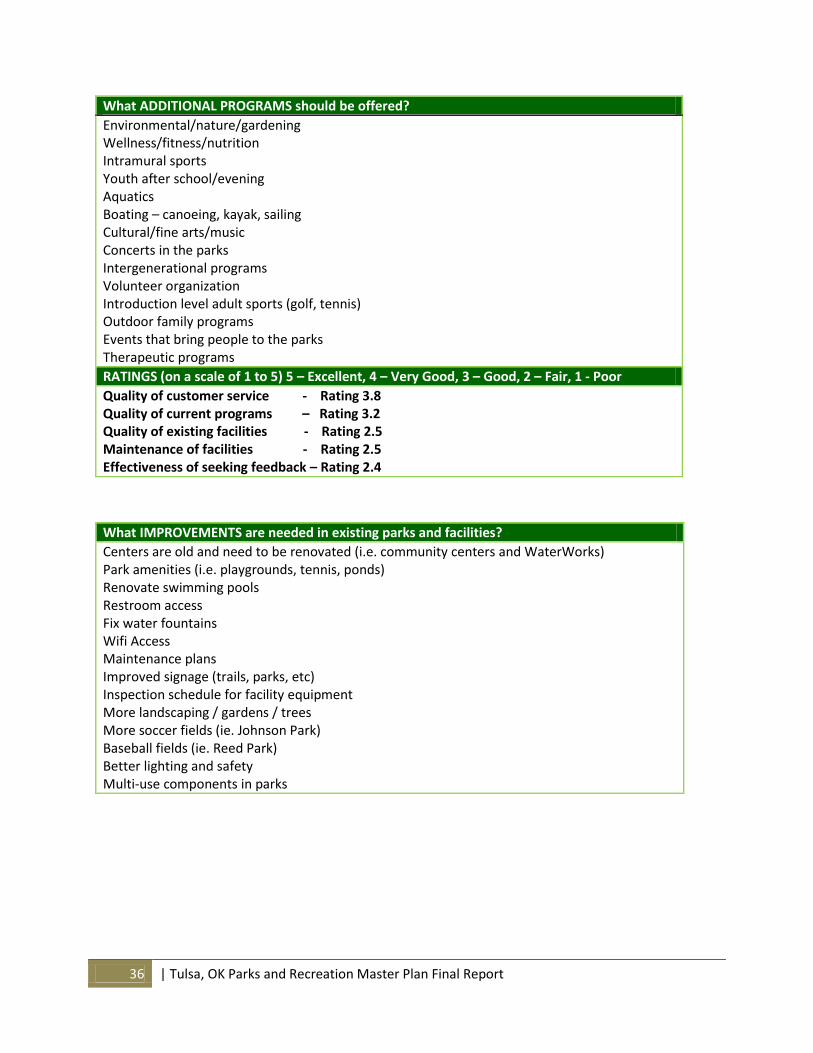
36 | Tulsa, OK Parks and Recreation Master Plan Final Report
What ADDITIONAL PROGRAMS should be offered?
Environmental/nature/gardening Wellness/fitness/nutrition Intramural sports Youth after school/evening Aquatics Boating – canoeing, kayak, sailing Cultural/fine arts/music Concerts in the parks Intergenerational programs Volunteer organization Introduction level adult sports (golf, tennis) Outdoor family programs Events that bring people to the parks Therapeutic programs
RATINGS (on a scale of 1 to 5) 5 – Excellent, 4 – Very Good, 3 – Good, 2 – Fair, 1 - Poor
Quality of customer service - Rating 3.8 Quality of current programs – Rating 3.2 Quality of existing facilities - Rating 2.5 Maintenance of facilities - Rating 2.5 Effectiveness of seeking feedback – Rating 2.4
What IMPROVEMENTS are needed in existing parks and facilities?
Centers are old and need to be renovated (i.e. community centers and WaterWorks) Park amenities (i.e. playgrounds, tennis, ponds) Renovate swimming pools Restroom access Fix water fountains Wifi Access Maintenance plans Improved signage (trails, parks, etc) Inspection schedule for facility equipment More landscaping / gardens / trees More soccer fields (ie. Johnson Park) Baseball fields (ie. Reed Park) Better lighting and safety Multi-use components in parks
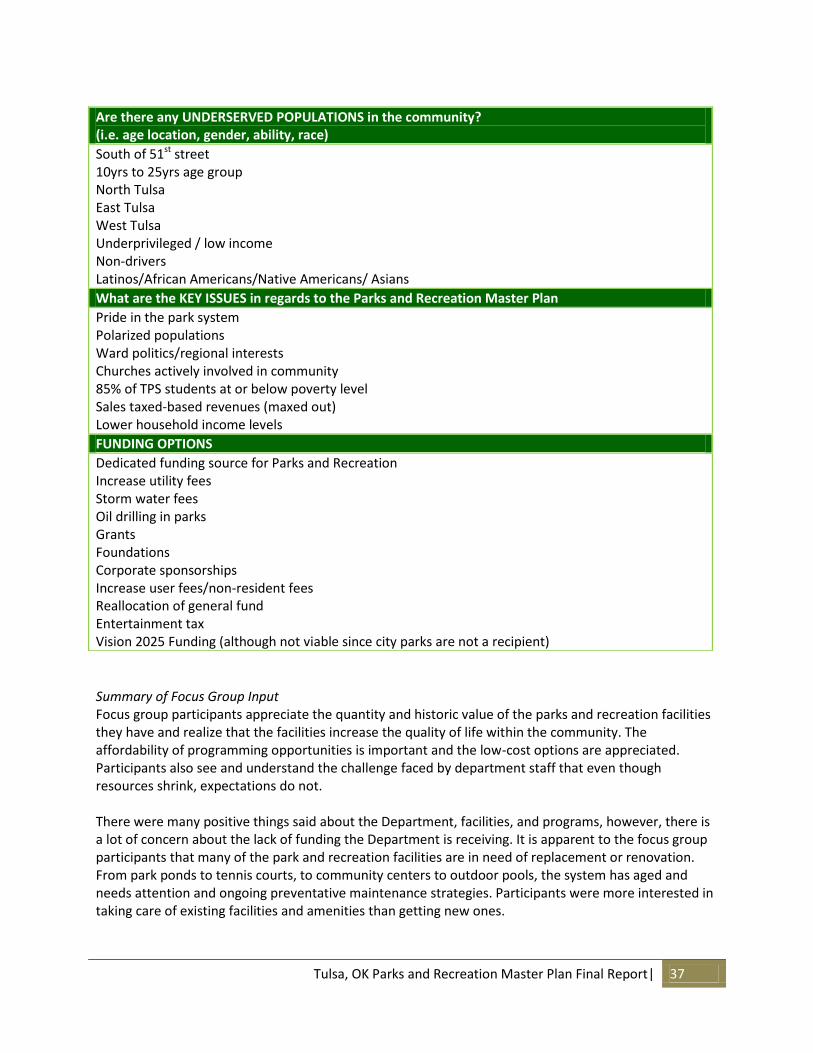
Tulsa, OK Parks and Recreation Master Plan Final Report| 37
Summary of Focus Group Input Focus group participants appreciate the quantity and historic value of the parks and recreation facilities they have and realize that the facilities increase the quality of life within the community. The affordability of programming opportunities is important and the low-cost options are appreciated. Participants also see and understand the challenge faced by department staff that even though resources shrink, expectations do not. There were many positive things said about the Department, facilities, and programs, however, there is a lot of concern about the lack of funding the Department is receiving. It is apparent to the focus group participants that many of the park and recreation facilities are in need of replacement or renovation. From park ponds to tennis courts, to community centers to outdoor pools, the system has aged and needs attention and ongoing preventative maintenance strategies. Participants were more interested in taking care of existing facilities and amenities than getting new ones.
Are there any UNDERSERVED POPULATIONS in the community? (i.e. age location, gender, ability, race)
South of 51st street 10yrs to 25yrs age group North Tulsa East Tulsa West Tulsa Underprivileged / low income Non-drivers Latinos/African Americans/Native Americans/ Asians
What are the KEY ISSUES in regards to the Parks and Recreation Master Plan
Pride in the park system Polarized populations Ward politics/regional interests Churches actively involved in community 85% of TPS students at or below poverty level Sales taxed-based revenues (maxed out) Lower household income levels
FUNDING OPTIONS
Dedicated funding source for Parks and Recreation Increase utility fees Storm water fees Oil drilling in parks Grants Foundations Corporate sponsorships Increase user fees/non-resident fees Reallocation of general fund Entertainment tax Vision 2025 Funding (although not viable since city parks are not a recipient)
38 | Tulsa, OK Parks and Recreation Master Plan Final Report
Input varied in regards to additional programming needs, but the need for non-team sports programming was consistent. Programming examples included: environmental, afterschool, arts, concerts in the parks, and family inclusive programming. Additionally the need for programming that focuses on participants aged 10-25 was consistent. New facility needs that were identified include sports complexes (football and soccer), dog parks, expanded arts facilities (WaterWorks), and aquatic facilities. Almost every area of the City was identified as having shortcomings in regards to parks and recreation facilities and services. Filtering the input shows that the need for parks and recreation facilities, programs, and services is apparent regardless of age, income levels, or neighborhood.
D. Statistically-Valid Community Survey Findings Introduction and Methodology Extensive community outreach was undertaken (including coverage in the local media, public meetings, etc.) in the effort to encourage broad participation in the survey. Six primary research methodologies were utilized to obtain citizen input for the survey, in the three approaches summarized below. Random Sample Survey The Master Plan Survey was conducted primarily through a mailback survey, and was also supplemented with an online version and doorknob surveys. The survey was originally mailed to 8,000 randomly selected households located in the City of Tulsa and the ZIP codes associated with it, which may include households outside the City limits as well as Tulsa P.O. boxes belonging to residents who live outside the City limits. A link and individually assigned password (one per household) were also included in the mailed invitation, in order to allow recipients to complete the survey online, should they prefer. In addition, 1,000 surveys were distributed via door hanging in selected neighborhoods and developments in Tulsa. The goal of the special outreach via door hanging was to try to encourage increased participation from some of the neighborhoods that otherwise might be expected to have relatively low response to the mailed surveys (however, only 11 surveys were returned through this effort). Completed mail and online surveys received totaled 439 out of a net estimated 7,600 delivered (approximately 5 percent of surveys mailed are returned "undeliverable" due to invalid addresses and/or residents who have moved and no longer reside at a particular address). This represents a response rate of approximately 5.8%. Together with the door hanging surveys, a total sample size of 450 random survey responses were received, which have a margin of error of approximately +/- 4.6 percentage points calculated for questions at 50% response6. Also, note that the resultant database is weighted by age, ethnicity, and area of residence of respondent to ensure appropriate representation of City residents across different demographic cohorts in the overall sample.
6 For the total sample size of 450, margin of error is +/- 4.6 percent calculated for questions at 50% response (if the response for a particular
question is “50%”—the standard way to generalize margin of error is to state the larger margin, which occurs for responses at 50%). Note that the margin of error is different for every single question response on the survey depending on the resultant sample sizes, proportion of responses, and number of answer categories for each question. Comparison of differences in the data between various segments, therefore, should take into consideration these factors. As a general comment, it is sometimes more appropriate to focus attention on the general trends and patterns in the data rather than on the individual percentages.
Tulsa, OK Parks and Recreation Master Plan Final Report| 39
The primary list source used for the mailing was a third party list purchased from Melissa Data Corp., a leading provider of data quality solutions with emphasis on U.S., Canadian, and international address and phone verification and postal software. Use of the Melissa Data list also includes renters in the sample who are frequently missed in other list sources such as utility billing lists. Open-link Web and Handout Surveys Additionally, an open-link version of the online questionnaire was made available to all residents of Tulsa, who could complete the questionnaire if they did not receive one by invitation in the mail. Two hundred paper surveys were also made available as handouts in a few select locations around Tulsa. This allowed interested parties who may not have received the Mail or the Web version of the survey (or those who do not have internet access) to participate in the process. A total of 607 open-link web and handout surveys were completed. Web Surveys Distributed To Agency Representatives, Stakeholders, and Associations A web version of the survey was designed for email distribution through City agencies, neighborhood interest groups, sports organizations, and other various community stakeholders. The email survey was designed so that it could be forwarded to members and participants by all interested agency contacts. While it is not an exact random sampling of the community, it represents a means of gaining wider input from those who are interested in the issues and to obtain better information from segments of the community that otherwise might be under represented. Of the 420 agencies/associations emailed a survey invitation, a total of 249 association surveys were completed, representing approximately 61 total organizations in Tulsa. Total Responses Received Total responses received from all survey methodologies was 1,306, representing a very good response rate overall and an excellent database with which to work for analysis of the data. As the open-link, handout, and agency survey responses are “self-selected” and not a part of the randomly selected sample of residents, results are kept separate from the mail, invitation web, and door hanging versions of the survey. All surveys were considered in the overall analysis of the data and are broken out separately in the graphic illustrations and discussion of results that follow. While the report primarily focuses on results from the randomly selected sample of residents, responses from the open-link / association surveys overall were very similar to random sample responses, and are shown in comparison to each other throughout the report. Given the high degree of similarity in results between the random and open-link / association samples, the subarea analysis, included as a separate section of the report, combines the random and open-link responses in order to increase sample sizes and information content at this level of analysis. This segmentation of the results helps to further identify “local” opinions and provides additional insight to parks and recreation issues in the area. Data tables showing these segmentations are provided as Appendix III.
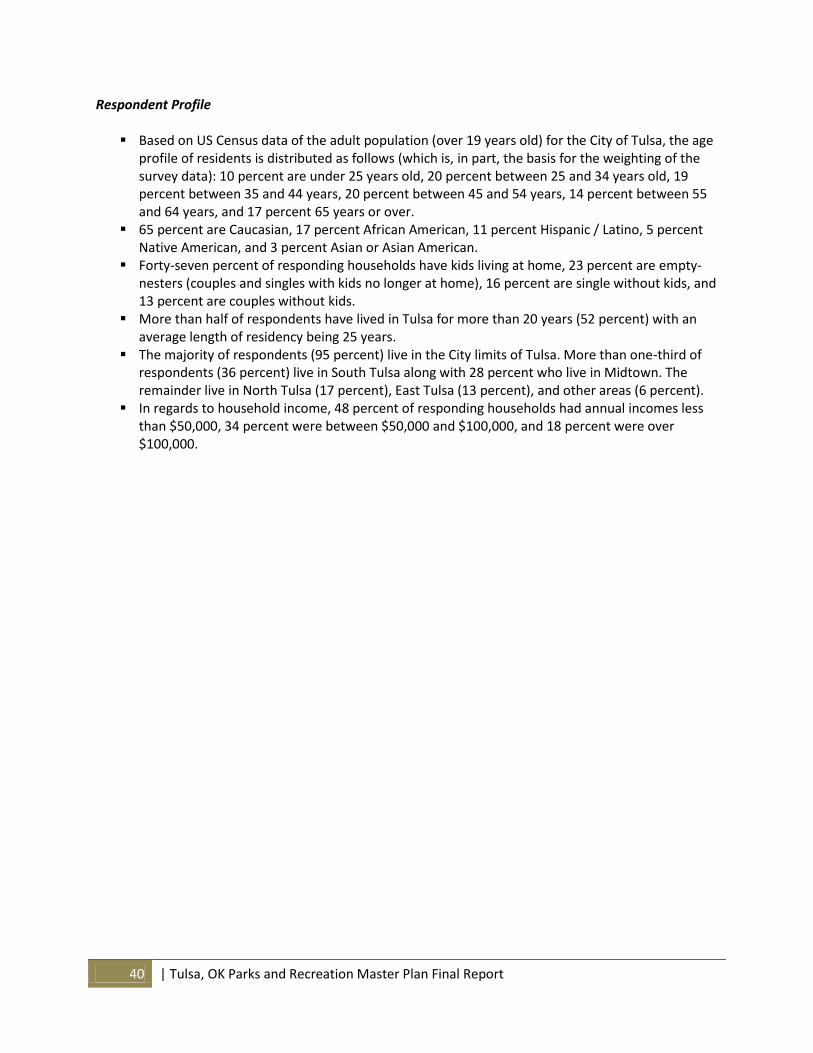
40 | Tulsa, OK Parks and Recreation Master Plan Final Report
Respondent Profile
Based on US Census data of the adult population (over 19 years old) for the City of Tulsa, the age profile of residents is distributed as follows (which is, in part, the basis for the weighting of the survey data): 10 percent are under 25 years old, 20 percent between 25 and 34 years old, 19 percent between 35 and 44 years, 20 percent between 45 and 54 years, 14 percent between 55 and 64 years, and 17 percent 65 years or over.
65 percent are Caucasian, 17 percent African American, 11 percent Hispanic / Latino, 5 percent Native American, and 3 percent Asian or Asian American.
Forty-seven percent of responding households have kids living at home, 23 percent are empty-nesters (couples and singles with kids no longer at home), 16 percent are single without kids, and 13 percent are couples without kids.
More than half of respondents have lived in Tulsa for more than 20 years (52 percent) with an average length of residency being 25 years.
The majority of respondents (95 percent) live in the City limits of Tulsa. More than one-third of respondents (36 percent) live in South Tulsa along with 28 percent who live in Midtown. The remainder live in North Tulsa (17 percent), East Tulsa (13 percent), and other areas (6 percent).
In regards to household income, 48 percent of responding households had annual incomes less than $50,000, 34 percent were between $50,000 and $100,000, and 18 percent were over $100,000.
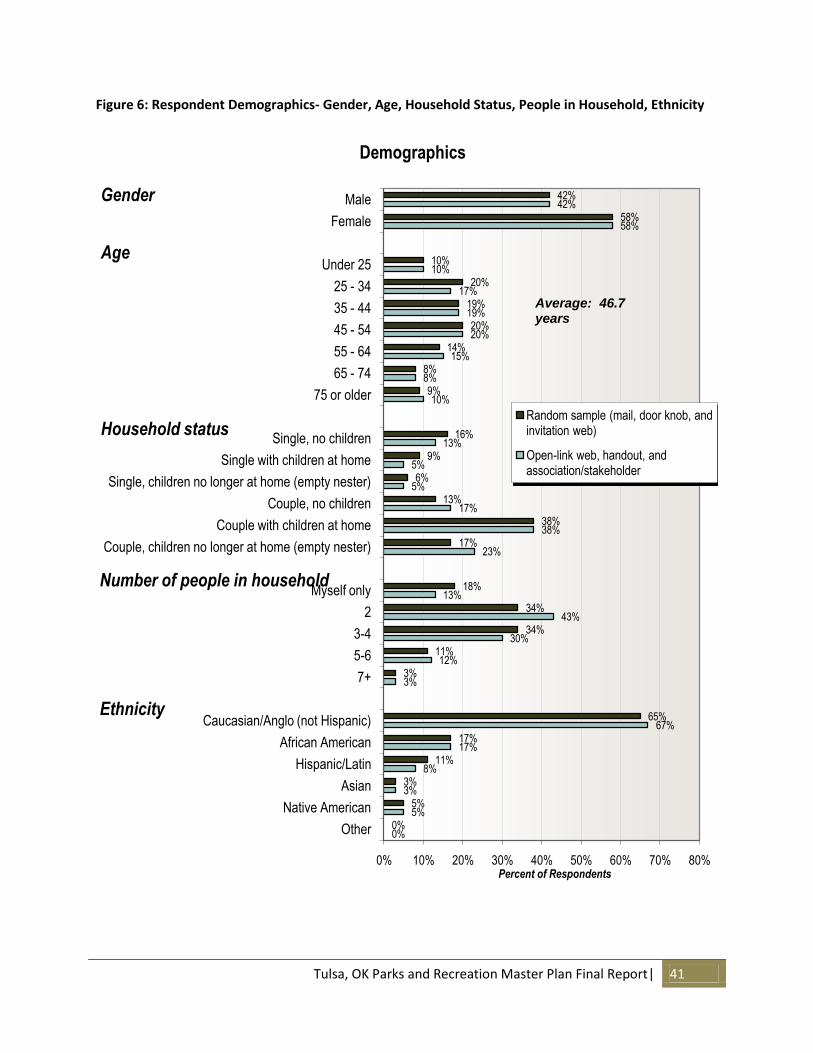
Tulsa, OK Parks and Recreation Master Plan Final Report| 41
Figure 6: Respondent Demographics- Gender, Age, Household Status, People in Household, Ethnicity
42%
58%
10%
20%
19%
20%
14%
8%
9%
16%
9%
6%
13%
38%
17%
18%
34%
34%
11%
3%
65%
17%
11%
3%
5%
0%
42%
58%
10%
17%
19%
20%
15%
8%
10%
13%
5%
5%
17%
38%
23%
13%
43%
30%
12%
3%
67%
17%
8%
3%
5%
0%
0% 10% 20% 30% 40% 50% 60% 70% 80%
Male
Female
Under 25
25 - 34
35 - 44
45 - 54
55 - 64
65 - 74
75 or older
Single, no children
Single with children at home
Single, children no longer at home (empty nester)
Couple, no children
Couple with children at home
Couple, children no longer at home (empty nester)
Myself only
2
3-4
5-6
7+
Caucasian/Anglo (not Hispanic)
African American
Hispanic/Latin
Asian
Native American
Other
Percent of Respondents
Demographics
Random sample (mail, door knob, and invitation web)
Open-link web, handout, and association/stakeholder
Gender
Age
Household status
Number of people in household
Ethnicity
Average: 46.7 years
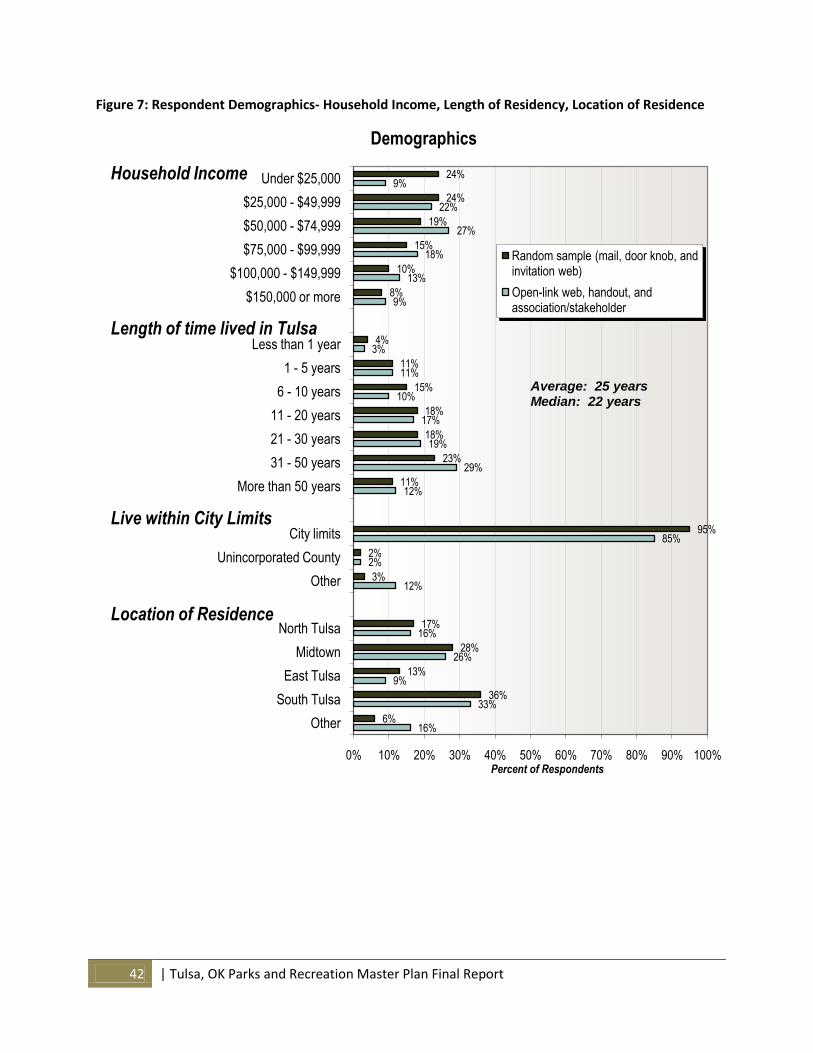
42 | Tulsa, OK Parks and Recreation Master Plan Final Report
Figure 7: Respondent Demographics- Household Income, Length of Residency, Location of Residence
24%
24%
19%
15%
10%
8%
4%
11%
15%
18%
18%
23%
11%
95%
2%
3%
17%
28%
13%
36%
6%
9%
22%
27%
18%
13%
9%
3%
11%
10%
17%
19%
29%
12%
85%
2%
12%
16%
26%
9%
33%
16%
0% 10% 20% 30% 40% 50% 60% 70% 80% 90% 100%
Under $25,000
$25,000 - $49,999
$50,000 - $74,999
$75,000 - $99,999
$100,000 - $149,999
$150,000 or more
Less than 1 year
1 - 5 years
6 - 10 years
11 - 20 years
21 - 30 years
31 - 50 years
More than 50 years
City limits
Unincorporated County
Other
North Tulsa
Midtown
East Tulsa
South Tulsa
Other
Percent of Respondents
Demographics
Random sample (mail, door knob, and invitation web)
Open-link web, handout, and association/stakeholder
Length of time lived in Tulsa
Location of Residence
Household Income
Live within City Limits
Average: 25 yearsMedian: 22 years
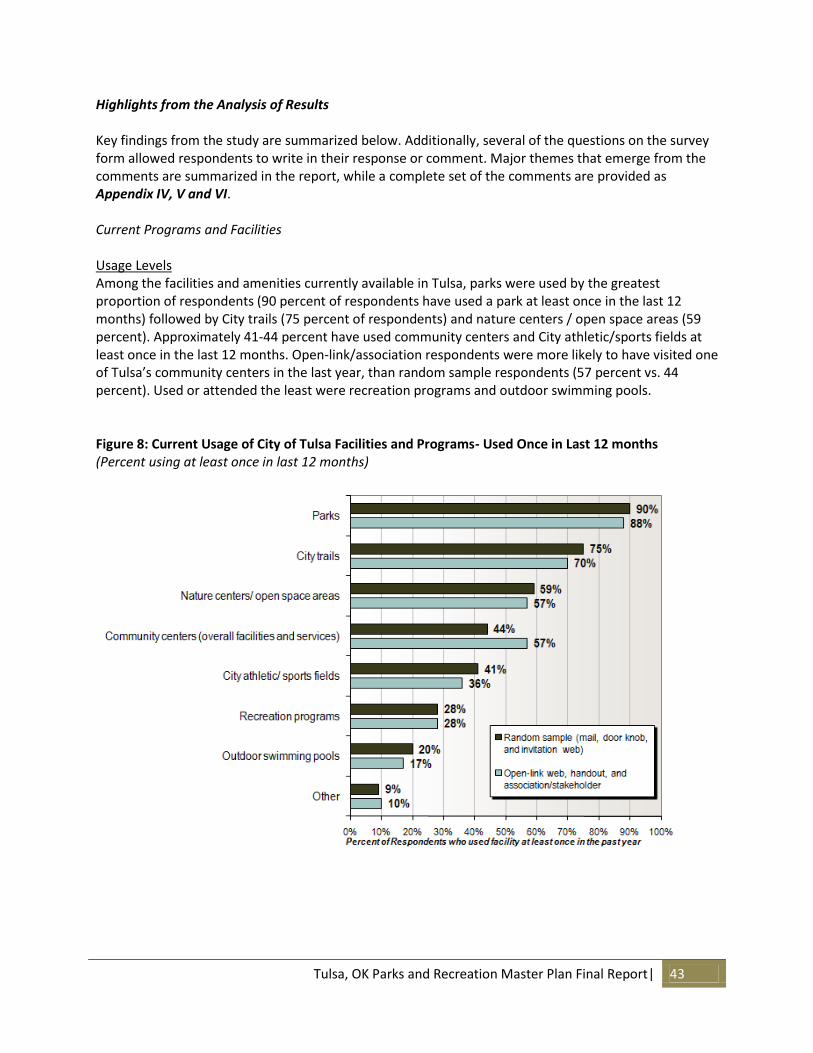
Tulsa, OK Parks and Recreation Master Plan Final Report| 43
Highlights from the Analysis of Results Key findings from the study are summarized below. Additionally, several of the questions on the survey form allowed respondents to write in their response or comment. Major themes that emerge from the comments are summarized in the report, while a complete set of the comments are provided as Appendix IV, V and VI. Current Programs and Facilities Usage Levels Among the facilities and amenities currently available in Tulsa, parks were used by the greatest proportion of respondents (90 percent of respondents have used a park at least once in the last 12 months) followed by City trails (75 percent of respondents) and nature centers / open space areas (59 percent). Approximately 41-44 percent have used community centers and City athletic/sports fields at least once in the last 12 months. Open-link/association respondents were more likely to have visited one of Tulsa’s community centers in the last year, than random sample respondents (57 percent vs. 44 percent). Used or attended the least were recreation programs and outdoor swimming pools. Figure 8: Current Usage of City of Tulsa Facilities and Programs- Used Once in Last 12 months (Percent using at least once in last 12 months)
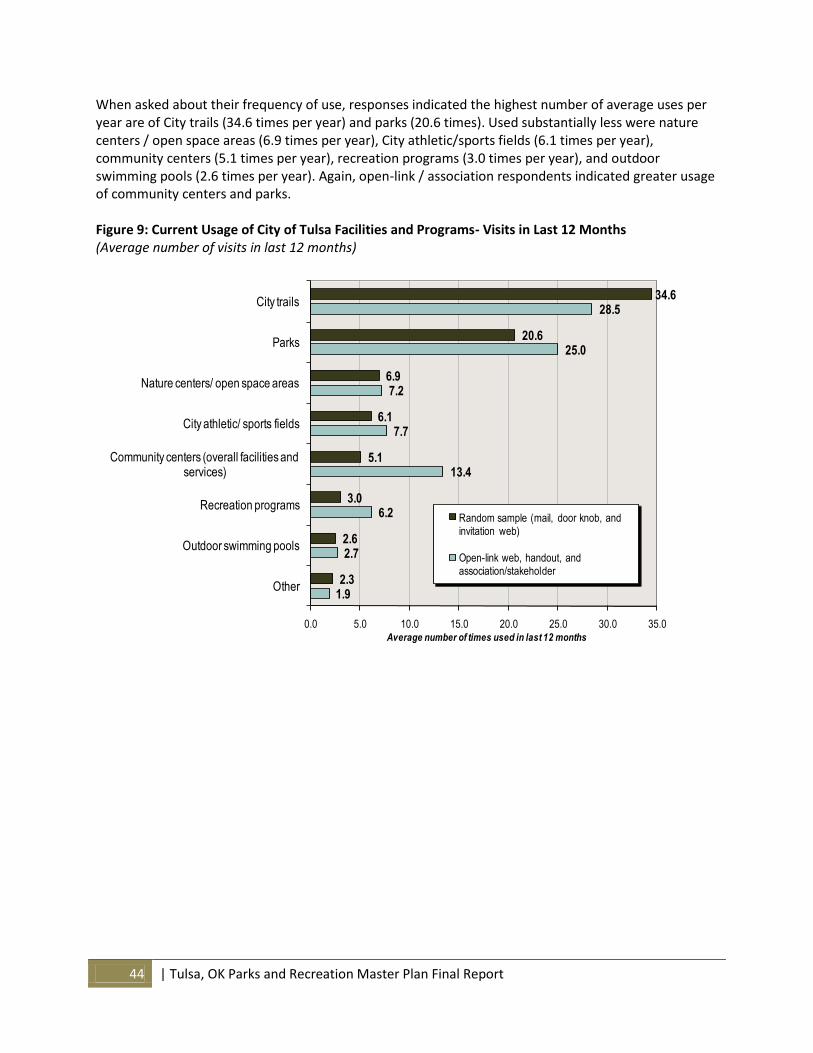
44 | Tulsa, OK Parks and Recreation Master Plan Final Report
When asked about their frequency of use, responses indicated the highest number of average uses per year are of City trails (34.6 times per year) and parks (20.6 times). Used substantially less were nature centers / open space areas (6.9 times per year), City athletic/sports fields (6.1 times per year), community centers (5.1 times per year), recreation programs (3.0 times per year), and outdoor swimming pools (2.6 times per year). Again, open-link / association respondents indicated greater usage of community centers and parks. Figure 9: Current Usage of City of Tulsa Facilities and Programs- Visits in Last 12 Months (Average number of visits in last 12 months)
34.6
20.6
6.9
6.1
5.1
3.0
2.6
2.3
28.5
25.0
7.2
7.7
13.4
6.2
2.7
1.9
0.0 5.0 10.0 15.0 20.0 25.0 30.0 35.0
City trails
Parks
Nature centers/ open space areas
City athletic/ sports fields
Community centers (overall facilities and services)
Recreation programs
Outdoor swimming pools
Other
Average number of times used in last 12 months
Current Usage of City of Tulsa Facilities and Programs
Random sample (mail, door knob, and invitation web)
Open-link web, handout, and association/stakeholder

Tulsa, OK Parks and Recreation Master Plan Final Report| 45
Importance to the Community Respondents were then asked to indicate how important each of these parks and recreation amenities are to the community. While the majority of facilities and amenities are rated as being relatively important to the community, parks were rated the highest (94 percent of respondents rated it “very important,” a 4 or 5 on a 5-point scale). Next were City trails (81 percent), followed by nature centers / open space areas (77 percent), City athletic/sports fields (72 percent), community centers (68 percent), and recreation programs (65 percent). Although still rated “very important” by 60 percent of respondents, swimming pools ranked behind the other amenities in importance (15 percent also indicated swimming pools were “not at all important”). Figure 10: Importance of Facilities, Programs, and Services to the Community (Random Sample Only)
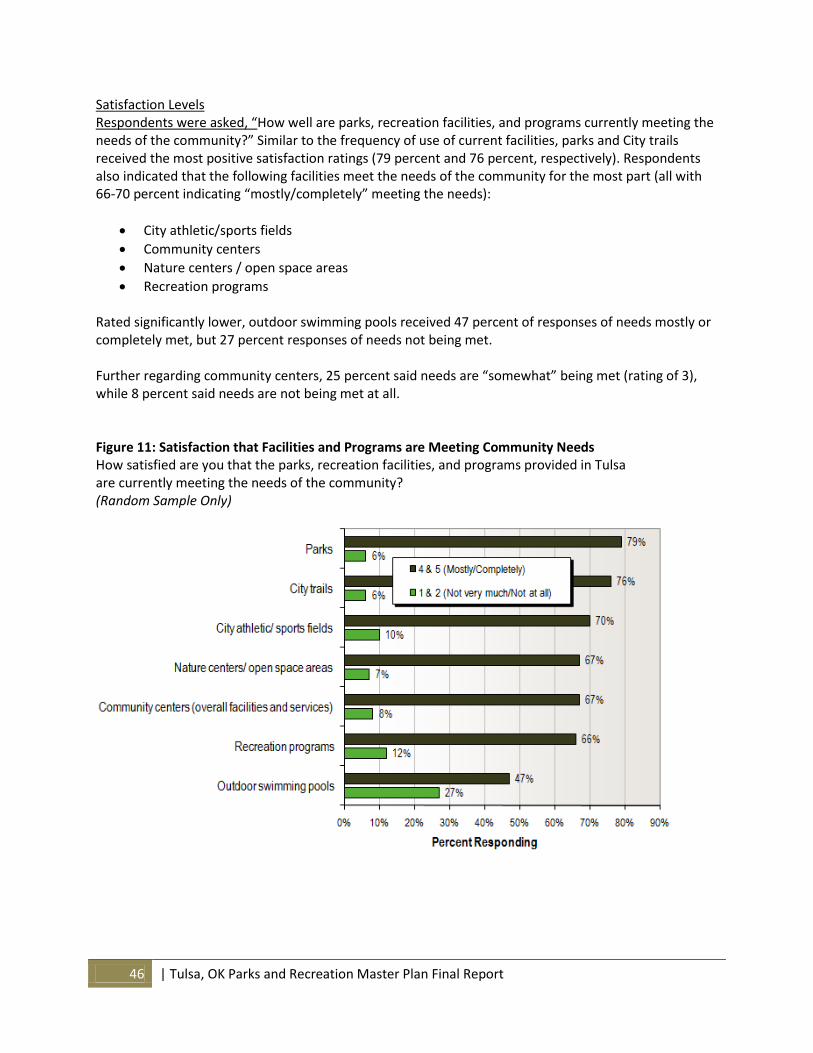
46 | Tulsa, OK Parks and Recreation Master Plan Final Report
Satisfaction Levels Respondents were asked, “How well are parks, recreation facilities, and programs currently meeting the needs of the community?” Similar to the frequency of use of current facilities, parks and City trails received the most positive satisfaction ratings (79 percent and 76 percent, respectively). Respondents also indicated that the following facilities meet the needs of the community for the most part (all with 66-70 percent indicating “mostly/completely” meeting the needs):
City athletic/sports fields
Community centers
Nature centers / open space areas
Recreation programs Rated significantly lower, outdoor swimming pools received 47 percent of responses of needs mostly or completely met, but 27 percent responses of needs not being met. Further regarding community centers, 25 percent said needs are “somewhat” being met (rating of 3), while 8 percent said needs are not being met at all. Figure 11: Satisfaction that Facilities and Programs are Meeting Community Needs How satisfied are you that the parks, recreation facilities, and programs provided in Tulsa are currently meeting the needs of the community? (Random Sample Only)
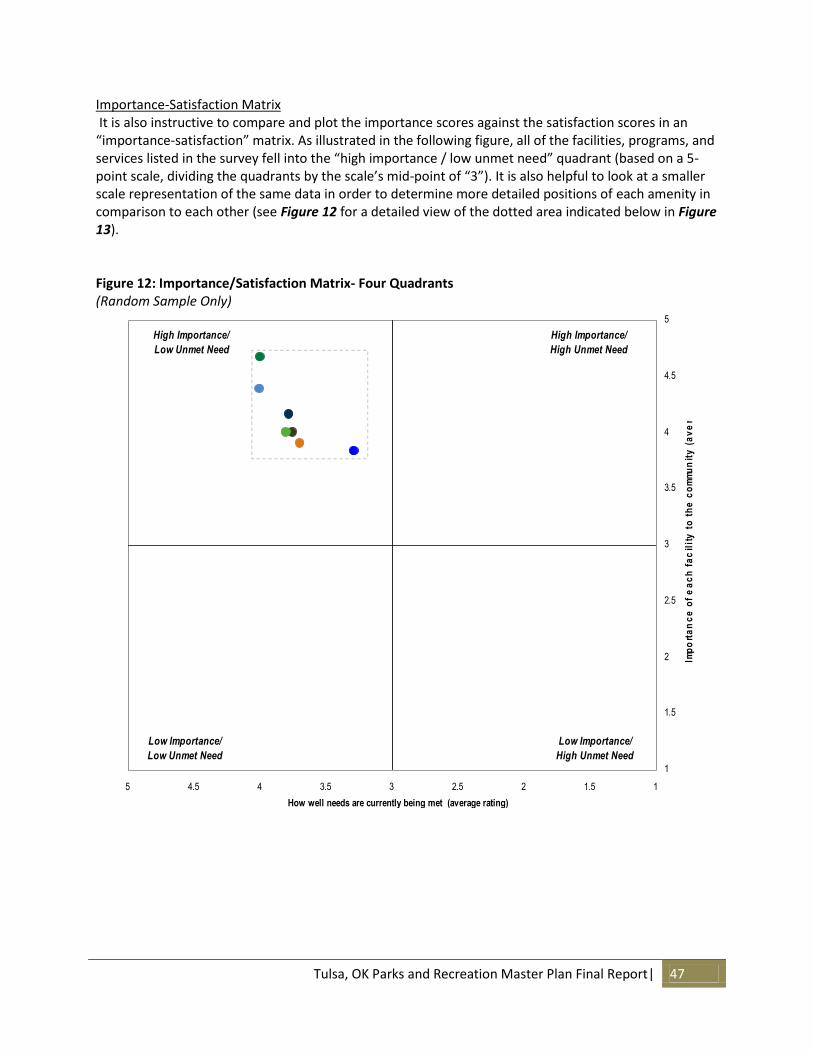
Tulsa, OK Parks and Recreation Master Plan Final Report| 47
Importance-Satisfaction Matrix It is also instructive to compare and plot the importance scores against the satisfaction scores in an “importance-satisfaction” matrix. As illustrated in the following figure, all of the facilities, programs, and services listed in the survey fell into the “high importance / low unmet need” quadrant (based on a 5-point scale, dividing the quadrants by the scale’s mid-point of “3”). It is also helpful to look at a smaller scale representation of the same data in order to determine more detailed positions of each amenity in comparison to each other (see Figure 12 for a detailed view of the dotted area indicated below in Figure 13). Figure 12: Importance/Satisfaction Matrix- Four Quadrants (Random Sample Only)
Importance/Satisfaction Matrix (Random sample only)
1
1.5
2
2.5
3
3.5
4
4.5
5
11.522.533.544.55
How well needs are currently being met (average rating)
Imp
ort
an
ce
of
ea
ch
fa
cil
ity
to
th
e c
om
mu
nit
y (
av
era
ge
ra
tin
g)
High Importance/
High Unmet Need
High Importance/
Low Unmet Need
Low Importance/
Low Unmet Need
Low Importance/
High Unmet Need
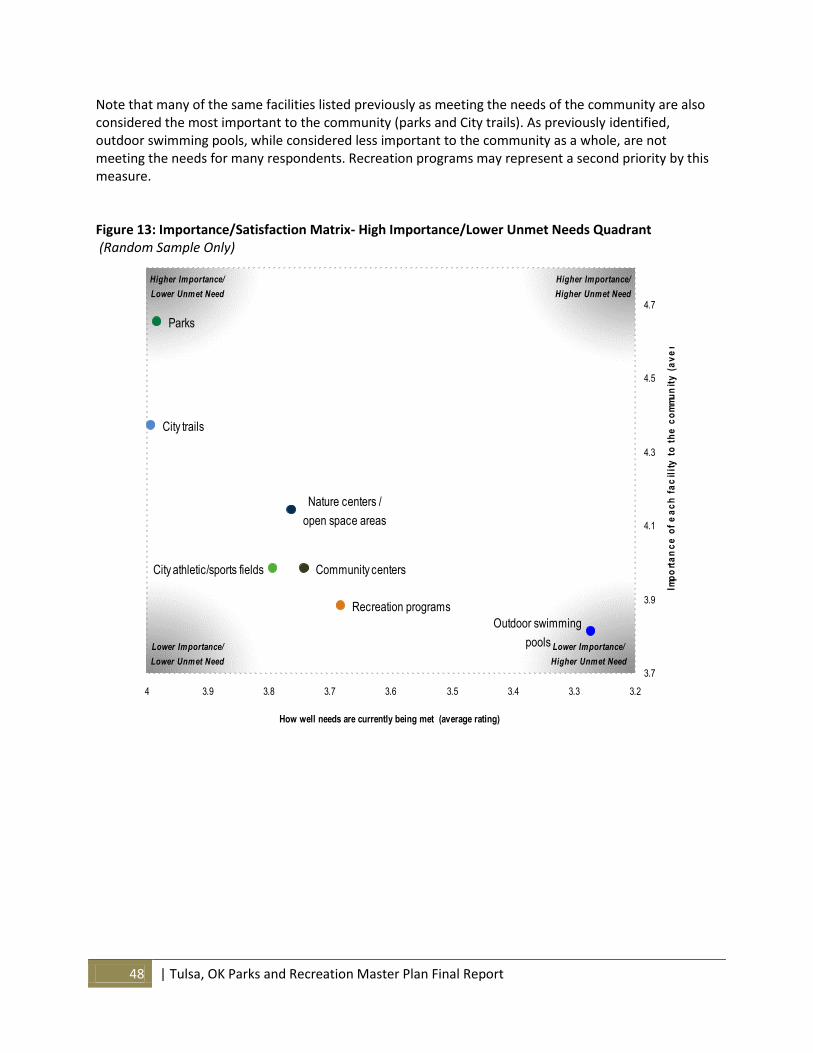
48 | Tulsa, OK Parks and Recreation Master Plan Final Report
Note that many of the same facilities listed previously as meeting the needs of the community are also considered the most important to the community (parks and City trails). As previously identified, outdoor swimming pools, while considered less important to the community as a whole, are not meeting the needs for many respondents. Recreation programs may represent a second priority by this measure. Figure 13: Importance/Satisfaction Matrix- High Importance/Lower Unmet Needs Quadrant (Random Sample Only)
Importance/Satisfaction Matrix (Random sample only)
Community centers
Recreation programs
City athletic/sports fields
City trails
Nature centers /
open space areas
Parks
Outdoor swimming
pools
3.7
3.9
4.1
4.3
4.5
4.7
3.23.33.43.53.63.73.83.94
How well needs are currently being met (average rating)
Imp
ort
an
ce
of
ea
ch
fa
cil
ity
to
th
e c
om
mu
nit
y (
av
era
ge
ra
tin
g)
Higher Importance/
Higher Unmet Need
Higher Importance/
Lower Unmet Need
Lower Importance/
Lower Unmet Need
Lower Importance/
Higher Unmet Need
Tulsa, OK Parks and Recreation Master Plan Final Report| 49
Respondent Comments To further probe satisfaction and desires of what is currently available in Tulsa, respondents were asked in an open-ended question if they had any comments or suggestions of what improvements could be made to better meet the needs of the community. A number of suggestions were offered, particularly in regards to increased maintenance and upkeep of facilities and parks, more amenities in parks and on trails (such as restrooms, lighting, water fountains, benches, and picnic facilities), and keeping parks and pools open throughout the summer. While overall satisfaction levels are mostly positive, there exists a sense in the comments that maintenance and upkeep of facilities and parks throughout the city is lacking and that it should be the focus before new facilities, parks, or trails are built. A sampling of the open-ended comments is listed below:
#1 priority is CLEAN the parks up. Debris is everywhere including broken glass on the tennis courts and in the sand around the play areas. Springdale park is a prime example of a neglected area. Play equipment is broken, old, inoperable, and filthy. I would not take my child to that pool, ever.
Additional classes to be available at Community Centers that are more varied than current classes.; 2. Have grills at more of the picnic tables located in the Parks.
A lot of the community centers are small and have limited facilities. I think there should be a renewed partnership with Tulsa Public Schools to use school facilities for community center activities, youth centers, etc. so there is less duplication of using funds for buildings, operations, maintenance, etc. and more money to go toward program implementation and staffing.
Better maintenance, trimming, mowing; restrooms and water fountains
Bike lanes would help a lot. The trails (especially River Parks) are good but they do not promote alternative transportation for commuters. Driving somewhere to ride a bike is a little silly.
City pools are very important in our area for the lower income children. I suggest that the city use a pay per use program with waivers for children under a certain family income.
Cleaner facilities
Community Centers are very outdated and old. The idea of a "community center" is old fashioned and doesn't fit anymore. They need to be more like a health club or YMCA / YWCA where they could offer the same classes and programs.; The integrated city trails are great, we just need to keep building more trails. I am very pleased with this. Lets keep it going.; I know money is tight, but the pools need to be open.
Educate/inform where they are located
I think the maintenance and availability can be improved
I use the walking trail at N. 56th & Cincinnati the most. There are vacant houses along the north side of the trail and there's a lot of brush and weeds/trees that is not safe for walkers. I sure wish this brush could be removed. The park itself is perfectly maintained - I love it that I don't have to go south every time I want to enjoy some quiet time and exercise.
I would like to see 5-6:30 AM lap swim times at city pools, and would pay up to $300 for a summer membership if I could lap swim outside. Don't add new stuff you can't maintain. FIX AND IMPROVE WHAT YOU'VE GOT AND EVALUATE FROM THERE.
Improve recreation programs available to those with special needs, especially summer day camps.
Keep parks and pools open in North Tulsa
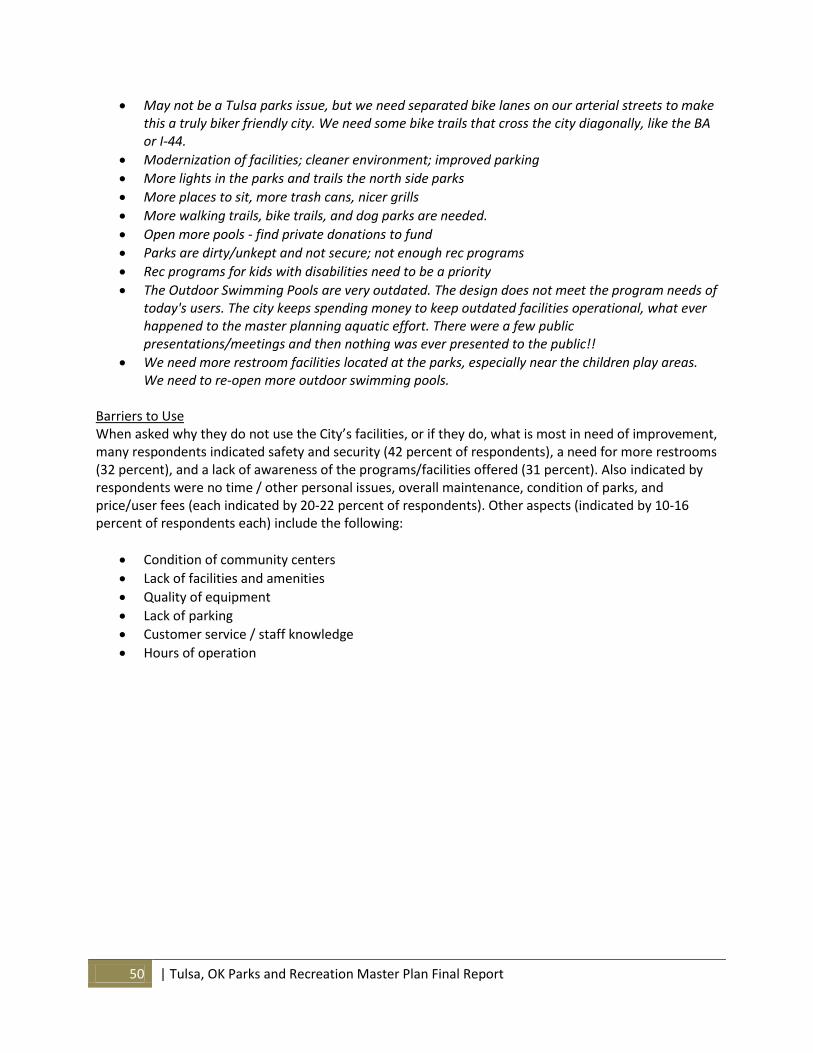
50 | Tulsa, OK Parks and Recreation Master Plan Final Report
May not be a Tulsa parks issue, but we need separated bike lanes on our arterial streets to make this a truly biker friendly city. We need some bike trails that cross the city diagonally, like the BA or I-44.
Modernization of facilities; cleaner environment; improved parking
More lights in the parks and trails the north side parks
More places to sit, more trash cans, nicer grills
More walking trails, bike trails, and dog parks are needed.
Open more pools - find private donations to fund
Parks are dirty/unkept and not secure; not enough rec programs
Rec programs for kids with disabilities need to be a priority
The Outdoor Swimming Pools are very outdated. The design does not meet the program needs of today's users. The city keeps spending money to keep outdated facilities operational, what ever happened to the master planning aquatic effort. There were a few public presentations/meetings and then nothing was ever presented to the public!!
We need more restroom facilities located at the parks, especially near the children play areas. We need to re-open more outdoor swimming pools.
Barriers to Use When asked why they do not use the City’s facilities, or if they do, what is most in need of improvement, many respondents indicated safety and security (42 percent of respondents), a need for more restrooms (32 percent), and a lack of awareness of the programs/facilities offered (31 percent). Also indicated by respondents were no time / other personal issues, overall maintenance, condition of parks, and price/user fees (each indicated by 20-22 percent of respondents). Other aspects (indicated by 10-16 percent of respondents each) include the following:
Condition of community centers
Lack of facilities and amenities
Quality of equipment
Lack of parking
Customer service / staff knowledge
Hours of operation
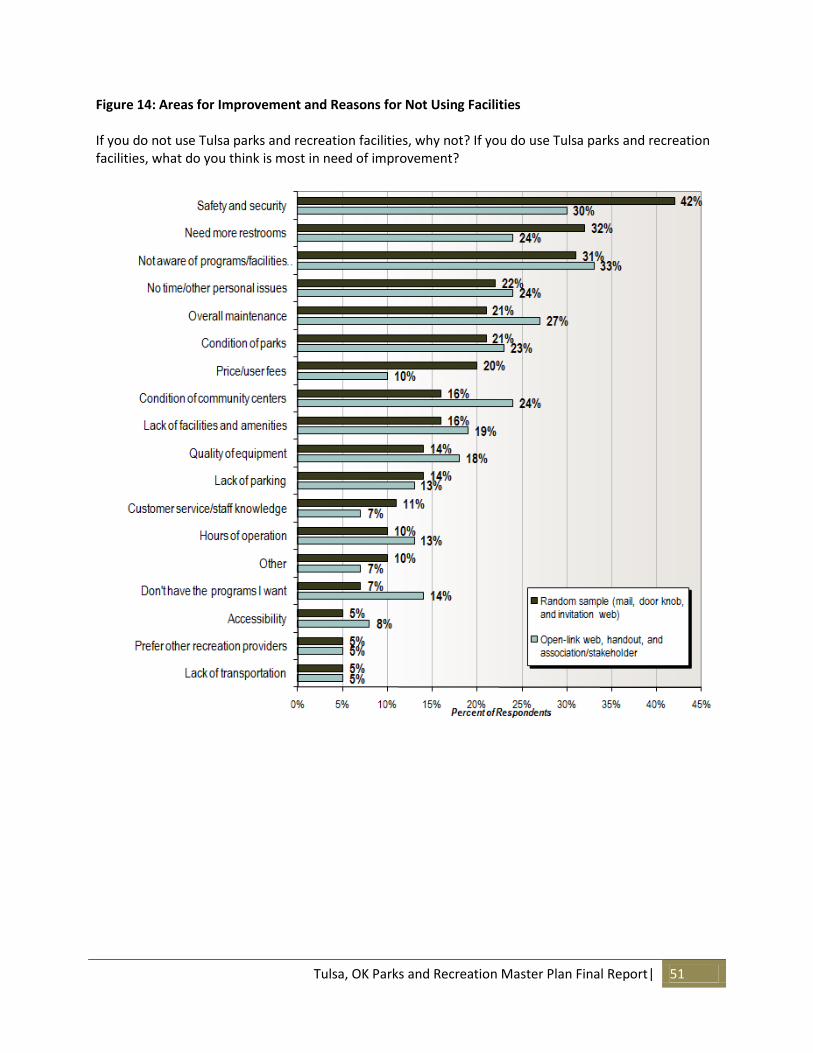
Tulsa, OK Parks and Recreation Master Plan Final Report| 51
Figure 14: Areas for Improvement and Reasons for Not Using Facilities If you do not use Tulsa parks and recreation facilities, why not? If you do use Tulsa parks and recreation facilities, what do you think is most in need of improvement?
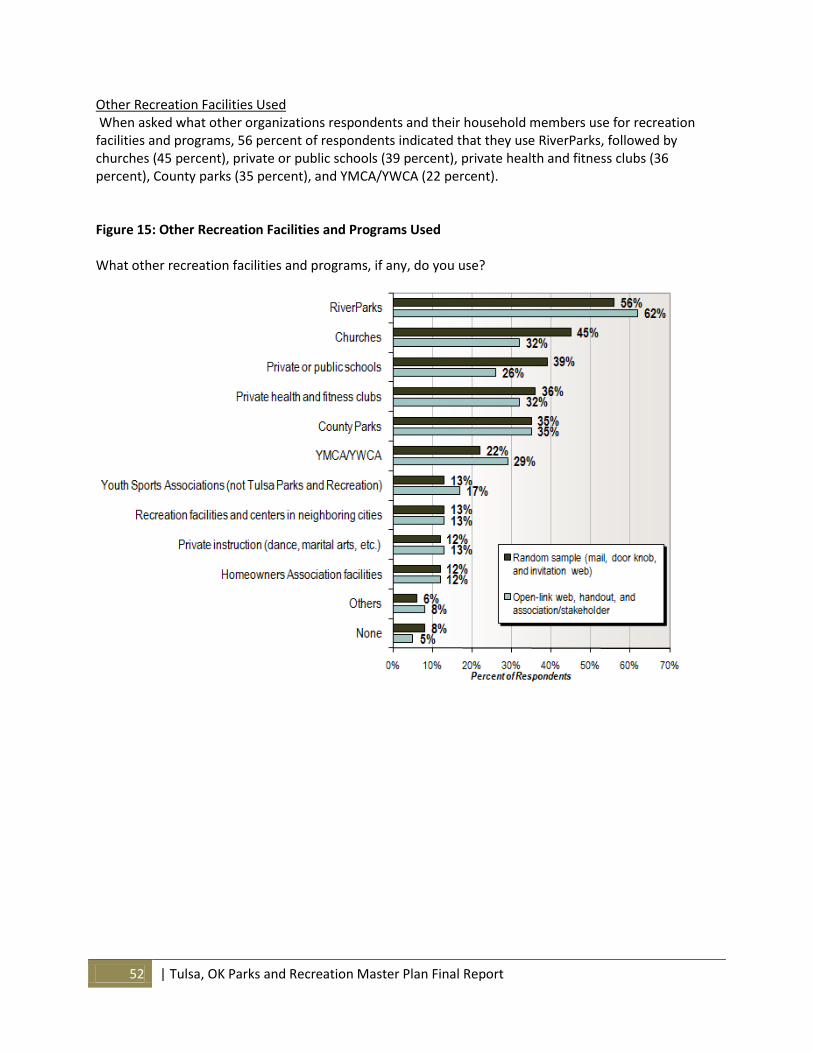
52 | Tulsa, OK Parks and Recreation Master Plan Final Report
Other Recreation Facilities Used When asked what other organizations respondents and their household members use for recreation facilities and programs, 56 percent of respondents indicated that they use RiverParks, followed by churches (45 percent), private or public schools (39 percent), private health and fitness clubs (36 percent), County parks (35 percent), and YMCA/YWCA (22 percent). Figure 15: Other Recreation Facilities and Programs Used What other recreation facilities and programs, if any, do you use?
Tulsa, OK Parks and Recreation Master Plan Final Report| 53
Community Center Visitation Respondents were asked to indicate which community centers in Tulsa they have visited over the last 12 months. Based on responder comments, 55 percent of respondents have used at least one community center (45 percent have not used any), with McClure being the most frequently visited (22 percent of respondents). Hicks, Lacy, Owen, and Whiteside also had relatively high levels of usage, with 12-15 percent of respondents indicating they had used each center. Community center usage was slightly higher among open-link / association respondents (62 percent of respondents indicated they have used at least one of the centers in the last 12 months). Usage among open-link / association respondents was comparatively higher at Whiteside, Centennial, and Heller. Figure 16: Tulsa Community Centers Visited in Last 12 Months Which community centers in Tulsa have you visited in the last 12 months?
Based on 2008 revenue, the site with the most visits was Whiteside, followed in order by Reed, Central, McClure, Hicks, Waterworks, Heller-Clark, Lacy, Henthorne-Owen, and Chamberlain.
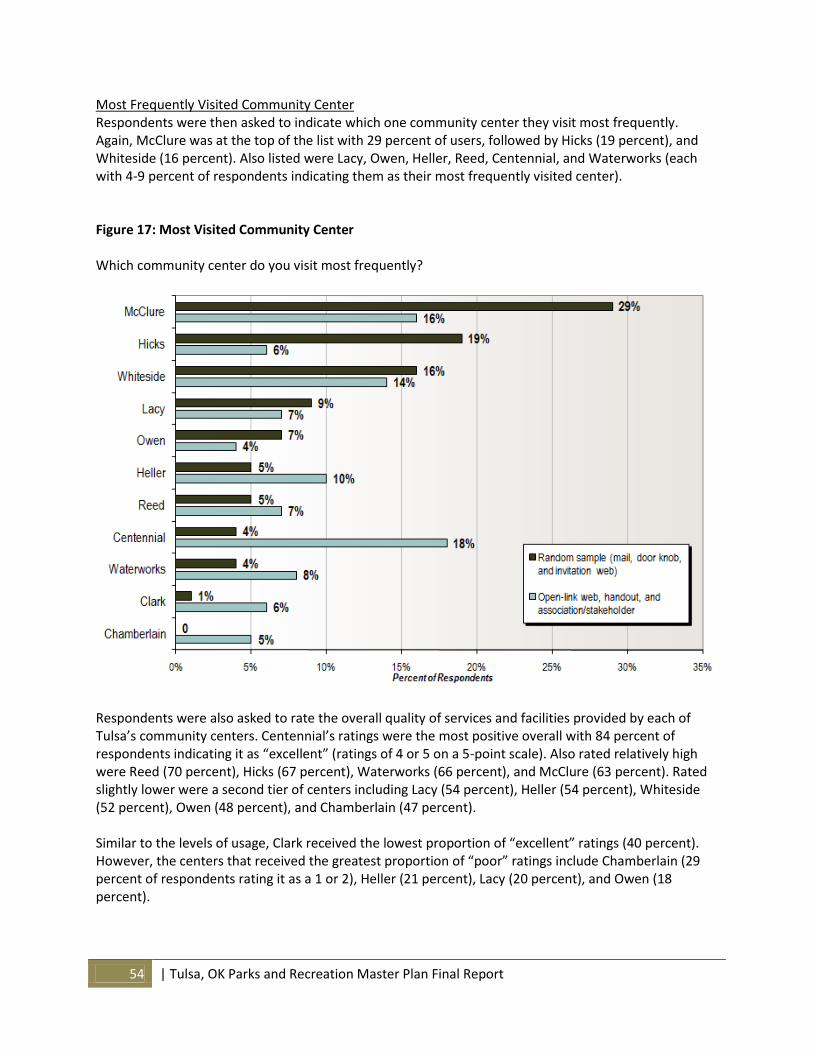
54 | Tulsa, OK Parks and Recreation Master Plan Final Report
Most Frequently Visited Community Center Respondents were then asked to indicate which one community center they visit most frequently. Again, McClure was at the top of the list with 29 percent of users, followed by Hicks (19 percent), and Whiteside (16 percent). Also listed were Lacy, Owen, Heller, Reed, Centennial, and Waterworks (each with 4-9 percent of respondents indicating them as their most frequently visited center). Figure 17: Most Visited Community Center Which community center do you visit most frequently?
Respondents were also asked to rate the overall quality of services and facilities provided by each of Tulsa’s community centers. Centennial’s ratings were the most positive overall with 84 percent of respondents indicating it as “excellent” (ratings of 4 or 5 on a 5-point scale). Also rated relatively high were Reed (70 percent), Hicks (67 percent), Waterworks (66 percent), and McClure (63 percent). Rated slightly lower were a second tier of centers including Lacy (54 percent), Heller (54 percent), Whiteside (52 percent), Owen (48 percent), and Chamberlain (47 percent). Similar to the levels of usage, Clark received the lowest proportion of “excellent” ratings (40 percent). However, the centers that received the greatest proportion of “poor” ratings include Chamberlain (29 percent of respondents rating it as a 1 or 2), Heller (21 percent), Lacy (20 percent), and Owen (18 percent).
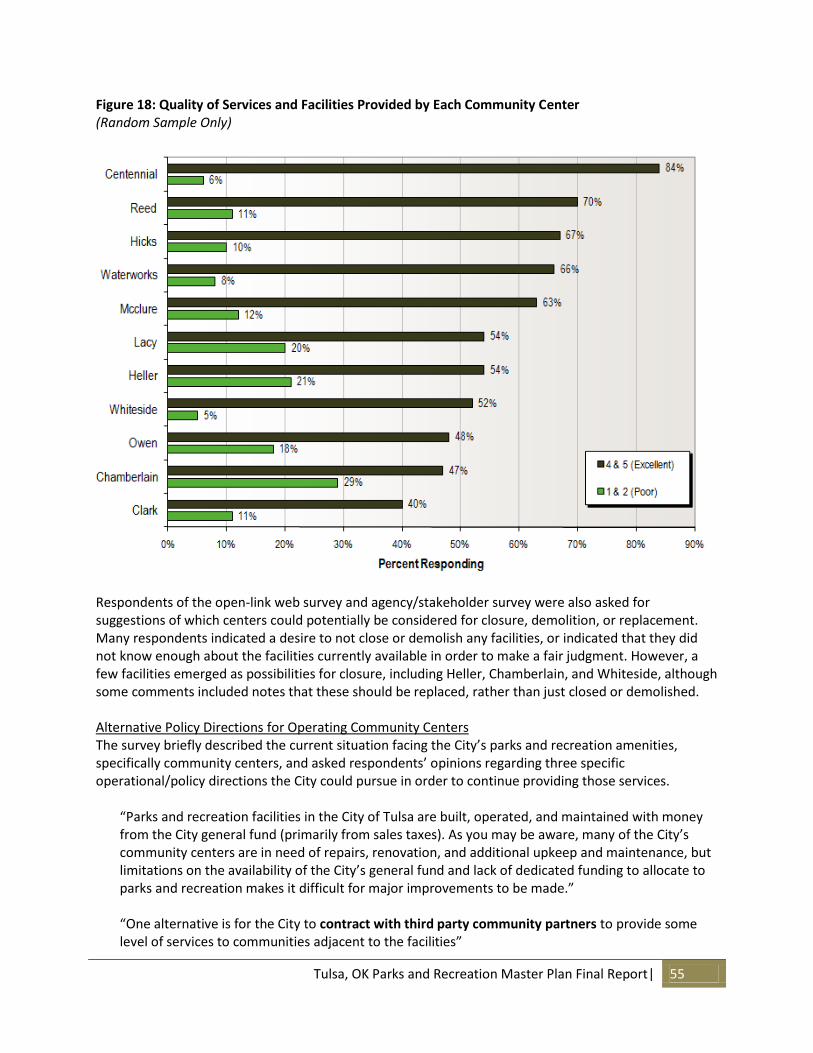
Tulsa, OK Parks and Recreation Master Plan Final Report| 55
Figure 18: Quality of Services and Facilities Provided by Each Community Center (Random Sample Only)
Respondents of the open-link web survey and agency/stakeholder survey were also asked for suggestions of which centers could potentially be considered for closure, demolition, or replacement. Many respondents indicated a desire to not close or demolish any facilities, or indicated that they did not know enough about the facilities currently available in order to make a fair judgment. However, a few facilities emerged as possibilities for closure, including Heller, Chamberlain, and Whiteside, although some comments included notes that these should be replaced, rather than just closed or demolished. Alternative Policy Directions for Operating Community Centers The survey briefly described the current situation facing the City’s parks and recreation amenities, specifically community centers, and asked respondents’ opinions regarding three specific operational/policy directions the City could pursue in order to continue providing those services.
“Parks and recreation facilities in the City of Tulsa are built, operated, and maintained with money from the City general fund (primarily from sales taxes). As you may be aware, many of the City’s community centers are in need of repairs, renovation, and additional upkeep and maintenance, but limitations on the availability of the City’s general fund and lack of dedicated funding to allocate to parks and recreation makes it difficult for major improvements to be made.” “One alternative is for the City to contract with third party community partners to provide some level of services to communities adjacent to the facilities”
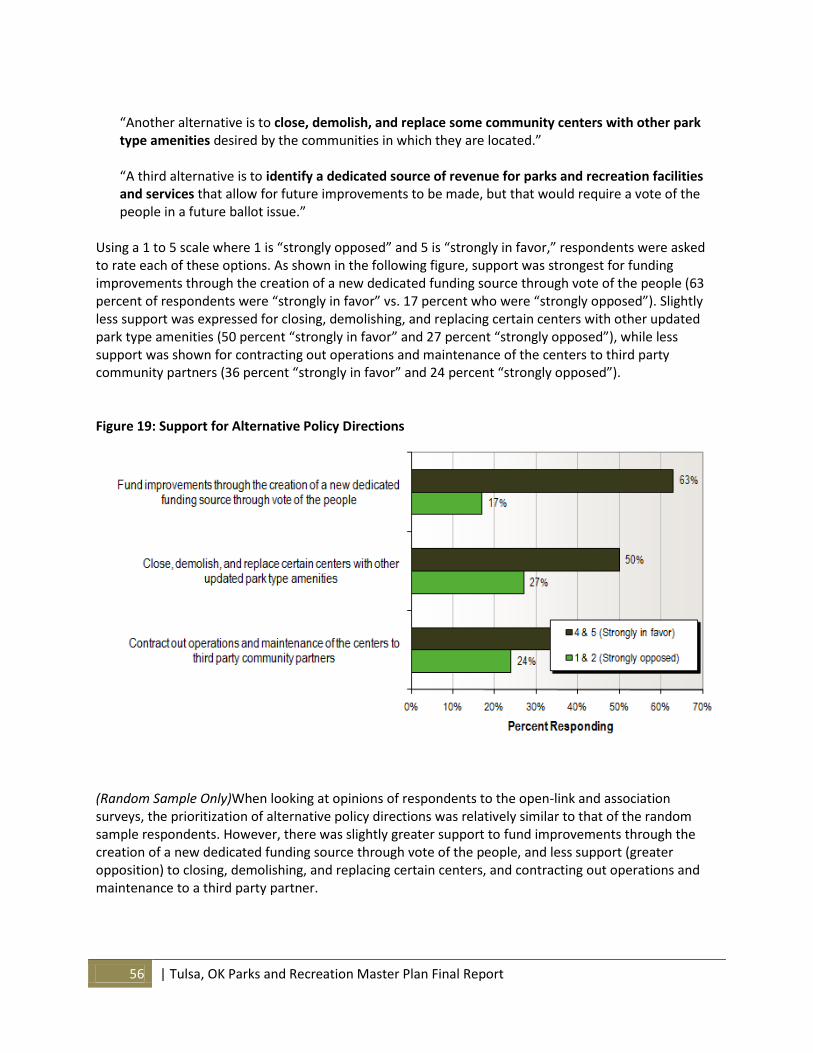
56 | Tulsa, OK Parks and Recreation Master Plan Final Report
“Another alternative is to close, demolish, and replace some community centers with other park type amenities desired by the communities in which they are located.” “A third alternative is to identify a dedicated source of revenue for parks and recreation facilities and services that allow for future improvements to be made, but that would require a vote of the people in a future ballot issue.”
Using a 1 to 5 scale where 1 is “strongly opposed” and 5 is “strongly in favor,” respondents were asked to rate each of these options. As shown in the following figure, support was strongest for funding improvements through the creation of a new dedicated funding source through vote of the people (63 percent of respondents were “strongly in favor” vs. 17 percent who were “strongly opposed”). Slightly less support was expressed for closing, demolishing, and replacing certain centers with other updated park type amenities (50 percent “strongly in favor” and 27 percent “strongly opposed”), while less support was shown for contracting out operations and maintenance of the centers to third party community partners (36 percent “strongly in favor” and 24 percent “strongly opposed”). Figure 19: Support for Alternative Policy Directions
(Random Sample Only)When looking at opinions of respondents to the open-link and association surveys, the prioritization of alternative policy directions was relatively similar to that of the random sample respondents. However, there was slightly greater support to fund improvements through the creation of a new dedicated funding source through vote of the people, and less support (greater opposition) to closing, demolishing, and replacing certain centers, and contracting out operations and maintenance to a third party partner.
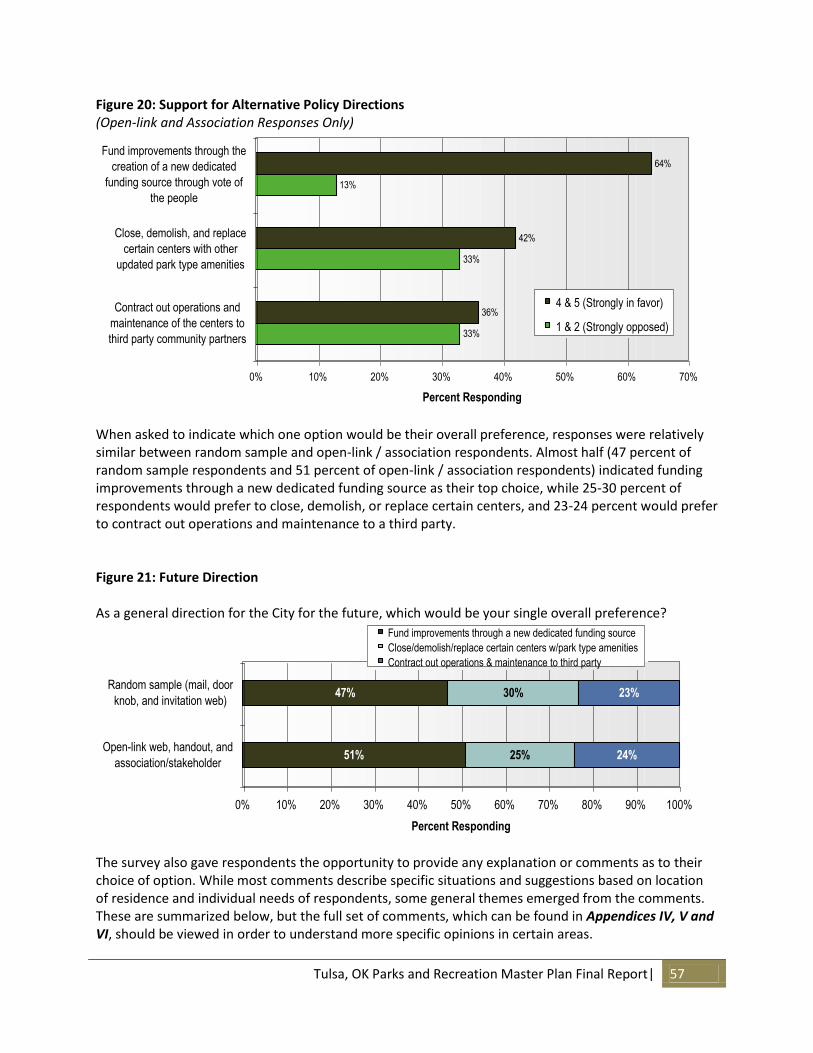
Tulsa, OK Parks and Recreation Master Plan Final Report| 57
Figure 20: Support for Alternative Policy Directions (Open-link and Association Responses Only)
When asked to indicate which one option would be their overall preference, responses were relatively similar between random sample and open-link / association respondents. Almost half (47 percent of random sample respondents and 51 percent of open-link / association respondents) indicated funding improvements through a new dedicated funding source as their top choice, while 25-30 percent of respondents would prefer to close, demolish, or replace certain centers, and 23-24 percent would prefer to contract out operations and maintenance to a third party. Figure 21: Future Direction As a general direction for the City for the future, which would be your single overall preference?
The survey also gave respondents the opportunity to provide any explanation or comments as to their choice of option. While most comments describe specific situations and suggestions based on location of residence and individual needs of respondents, some general themes emerged from the comments. These are summarized below, but the full set of comments, which can be found in Appendices IV, V and VI, should be viewed in order to understand more specific opinions in certain areas.
Support for alternative funding mechanisms
(Open-link and Association reponses only)
64%
42%
36%
13%
33%
33%
0% 10% 20% 30% 40% 50% 60% 70%
Fund improvements through the
creation of a new dedicated
funding source through vote of
the people
Close, demolish, and replace
certain centers with other
updated park type amenities
Contract out operations and
maintenance of the centers to
third party community partners
Percent Responding
4 & 5 (Strongly in favor)
1 & 2 (Strongly opposed)
AS A GENERAL DIRECTION OF THE CITY FOR THE FUTURE, WHICH
WOULD BE YOUR SINGLE OVERALL PREFERENCE?
47%
51%
30%
25%
23%
24%
0% 10% 20% 30% 40% 50% 60% 70% 80% 90% 100%
Random sample (mail, door
knob, and invitation web)
Open-link web, handout, and
association/stakeholder
Percent Responding
Fund improvements through a new dedicated funding source
Close/demolish/replace certain centers w/park type amenities
Contract out operations & maintenance to third party
58 | Tulsa, OK Parks and Recreation Master Plan Final Report
The comments overall seem to indicate that respondents chose their most preferred direction based on the “least-negative” option, rather than an actual “preferred” option. Many respondents indicated that while they do not want new taxes, third parties operating the centers, or center closures, they understand something needs to be done in order to be sustainable. While many respondents acknowledged the current economic climate and potentially bad timing of putting an additional funding source to vote, many comments emphasized the importance of parks and recreation facilities in general, and that an additional funding source, such as a new tax or local business sponsorships, may likely be necessary to sustain Tulsa’s parks and recreation offerings. Many comments also indicated an awareness that some of Tulsa’s current facilities are extremely outdated and that by closing, demolishing, or replacing the least-used or oldest centers, funds and resources could be more focused to the parks and facilities that benefit the community the most. There were mixed opinions in regards to contracting out operations and maintenance of the centers to third parties. Some respondents said services and communications would decrease while costs would go up, but some felt services and facilities would actually improve if they were provided by a third party. A sampling of these comments, arranged by the primary direction preference indicated by respondents, is listed below. Creation of a new dedicated funding source
Contracts to third party ‘community partners’ often proves to be an avenue of fraud run rampant. Case in point: roofs on TPS school buildings. When the People vote they own the project, and getting the vote of the people is always the best idea.
Every year the city never seems to have enough money for the Parks and Recreation to open all the pools and general operations and maintenance of the parks. So I think finding another source of funding for the parks is a good idea.
Funding through a vote of the people would ensure the people are truly interested and would give them the opportunity to improve a facility they may be unhappy with.
I believe in investing in our community even if it means paying a little more. That small investment returns greatly in quality of life and in property values.
I think that a combination of all 3 would most likely work best but I definitely believe we should have an official, firm, dedicated funding source to ensure continual upkeep and changes are made.
Maxwell has been contracted out and it has not been beneficial to the community as the community is unaware of anything going on there. Closing and demolishing would certainly be an option but what exactly is “Other updated Park type amenities” that could or could not be what the city wants. I think finding dedicated funding would be the best option but trying to get citizens to approve a new tax right now will be difficult. You also have to keep in mind that pricing cannot be increased much for most of the programs because people like me use the Park as a cheaper option than private recreation to save on the budget.
The City’s General Fund is over-utilized and underfunded. There should be a dedicated tax added for public safety and that would ease the burden on the general fund and free up funds for parks and public works.
Tulsa, OK Parks and Recreation Master Plan Final Report| 59
Close, demolish, and replace certain centers
As any citizen of Tulsa who has been to some of the older parks knows, they certainly need updates. I think that there are many that could be demolished, and with certain planning, their locations could be changed to make their Community Centers spread out for better accessibilities to Tulsans.
Fewer parks would free up money and time to better maintain others. Parks are located too close together so fewer better ones would be part of the solution.
Many of the centers are closed or are being operated by special interest groups. Instead of continuing to spend money on minimal upkeep of deteriorating and unused facilities, it would be better to recover these sites that have become eyesores into open parkland with updated amenities like walking trails, playgrounds, walking trails and picnic areas.
Some facilities are extremely outdated and becoming unpleasant. if they could be replaced with modern amenities they would attract more patrons.
The cost of maintaining old facilities is poor use of funds.
Contracting out usually results in poorer service, less contact with the people in the community and their needs. It may be that some of the centers are too dilapidated to maintain as they are.
Contract out operations and maintenance to third parties
With the appropriate contractor and reasonable price, third party contractors would have an incentive to do a better job.
Additional Comments
From what I’ve heard, contracting out to third party community partners is not working well - there’s a tendency to exclude non-members from the community centers. I don’t think there’s any chance that the citizens will agree to a Park tax.
I am well aware that many years ago Tulsa Public Schools went into partnership with community businesses to provide for additional funding for neighborhood schools. With that in mind, I think assistance from local business leaders would be best.
I feel the community centers are strong neighborhood assets and I support the most cost-effective measure to maintaining and improving them.
Things are so tight right now. Don’t believe the public would go for the increase. Future Recreation Facilities, Amenities, and Services Importance of Adding, Expanding, or Improving Indoor Recreation Facilities The survey provided a list of indoor facilities, amenities, and services and asked respondents what they thought would be the greatest needs for indoor facilities within the next 5-10 years. The results show that respondents feel additional youth and teen activity areas would be the most important (84 percent of respondents indicated each as “very important,” a 4 or 5 on a 5-point scale). Also important were the addition of the following amenities, each with between 53 and 73 percent of respondents indicating them as “very important”:
Designated areas for seniors/active adults
Fitness class space
Weight room and cardio fitness space
Multipurpose gymnasium space
Dedicated performing arts space
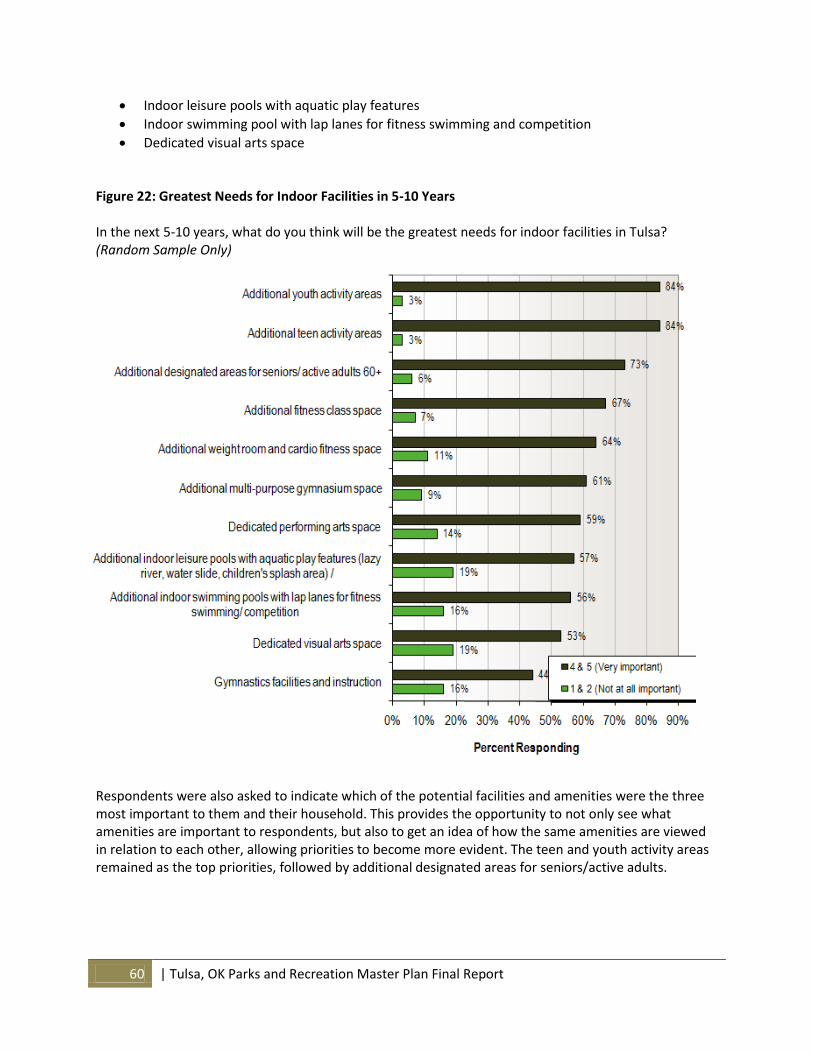
60 | Tulsa, OK Parks and Recreation Master Plan Final Report
Indoor leisure pools with aquatic play features
Indoor swimming pool with lap lanes for fitness swimming and competition
Dedicated visual arts space
Figure 22: Greatest Needs for Indoor Facilities in 5-10 Years In the next 5-10 years, what do you think will be the greatest needs for indoor facilities in Tulsa? (Random Sample Only)
Respondents were also asked to indicate which of the potential facilities and amenities were the three most important to them and their household. This provides the opportunity to not only see what amenities are important to respondents, but also to get an idea of how the same amenities are viewed in relation to each other, allowing priorities to become more evident. The teen and youth activity areas remained as the top priorities, followed by additional designated areas for seniors/active adults.
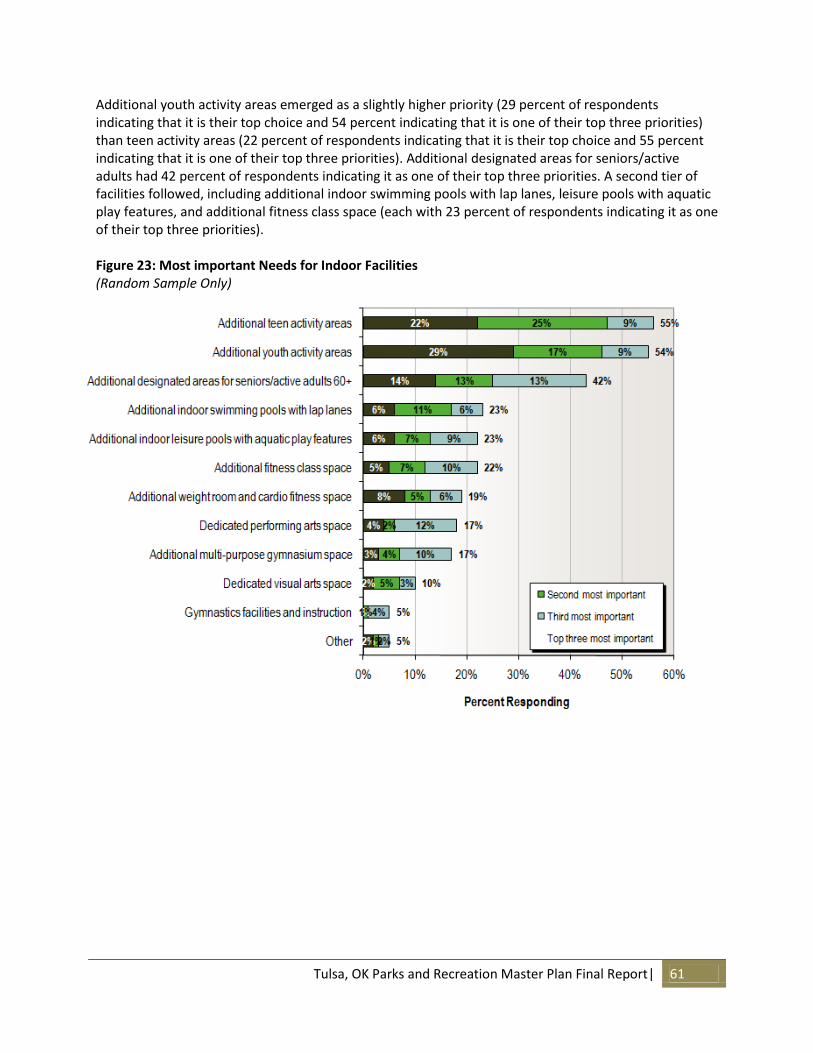
Tulsa, OK Parks and Recreation Master Plan Final Report| 61
Additional youth activity areas emerged as a slightly higher priority (29 percent of respondents indicating that it is their top choice and 54 percent indicating that it is one of their top three priorities) than teen activity areas (22 percent of respondents indicating that it is their top choice and 55 percent indicating that it is one of their top three priorities). Additional designated areas for seniors/active adults had 42 percent of respondents indicating it as one of their top three priorities. A second tier of facilities followed, including additional indoor swimming pools with lap lanes, leisure pools with aquatic play features, and additional fitness class space (each with 23 percent of respondents indicating it as one of their top three priorities). Figure 23: Most important Needs for Indoor Facilities (Random Sample Only)
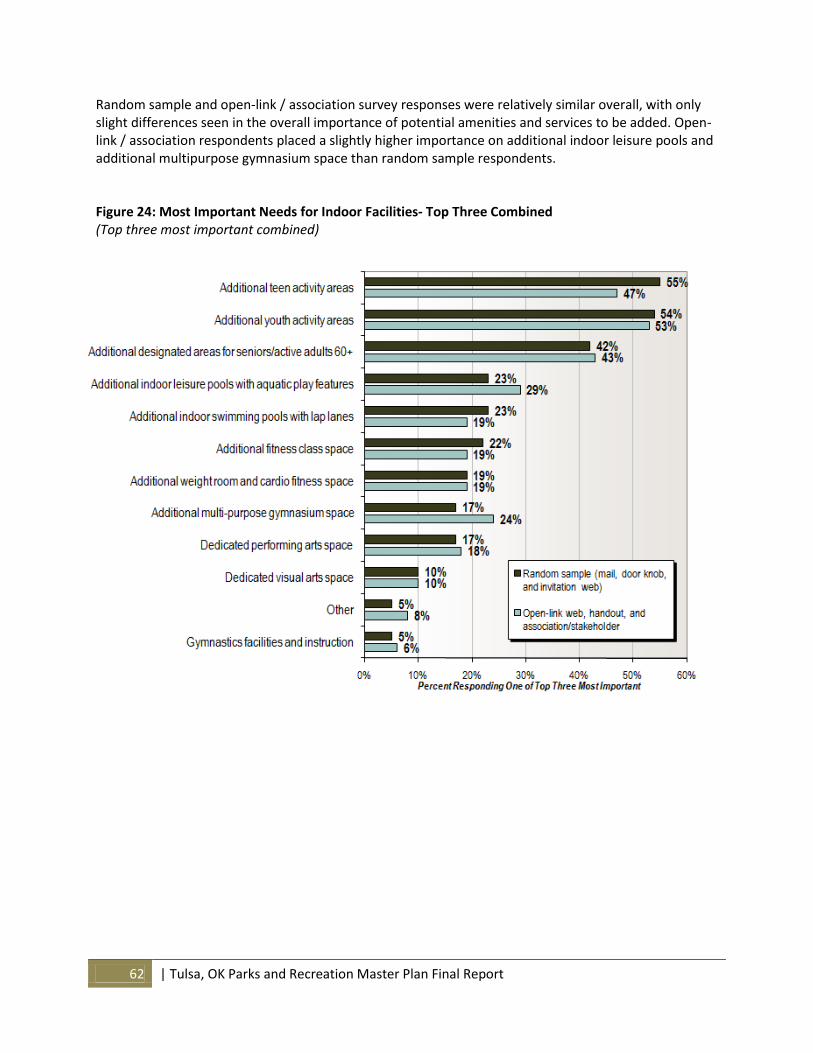
62 | Tulsa, OK Parks and Recreation Master Plan Final Report
Random sample and open-link / association survey responses were relatively similar overall, with only slight differences seen in the overall importance of potential amenities and services to be added. Open-link / association respondents placed a slightly higher importance on additional indoor leisure pools and additional multipurpose gymnasium space than random sample respondents. Figure 24: Most Important Needs for Indoor Facilities- Top Three Combined (Top three most important combined)
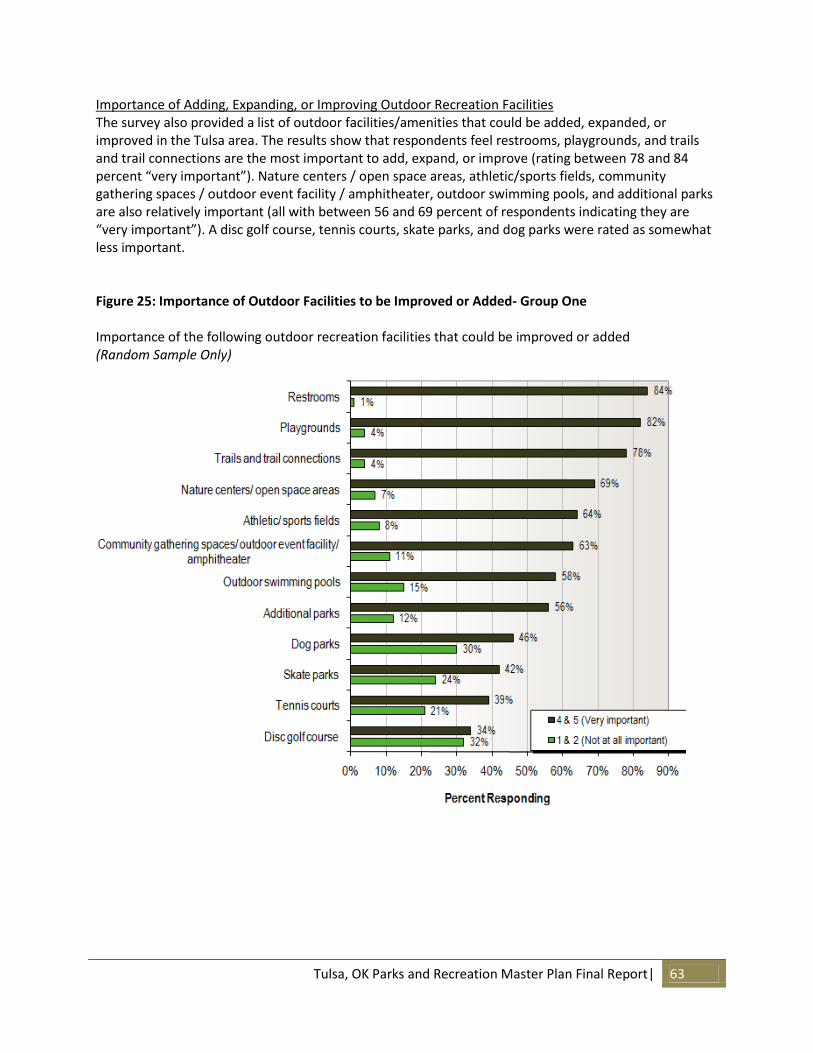
Tulsa, OK Parks and Recreation Master Plan Final Report| 63
Importance of Adding, Expanding, or Improving Outdoor Recreation Facilities The survey also provided a list of outdoor facilities/amenities that could be added, expanded, or improved in the Tulsa area. The results show that respondents feel restrooms, playgrounds, and trails and trail connections are the most important to add, expand, or improve (rating between 78 and 84 percent “very important”). Nature centers / open space areas, athletic/sports fields, community gathering spaces / outdoor event facility / amphitheater, outdoor swimming pools, and additional parks are also relatively important (all with between 56 and 69 percent of respondents indicating they are “very important”). A disc golf course, tennis courts, skate parks, and dog parks were rated as somewhat less important. Figure 25: Importance of Outdoor Facilities to be Improved or Added- Group One Importance of the following outdoor recreation facilities that could be improved or added (Random Sample Only)
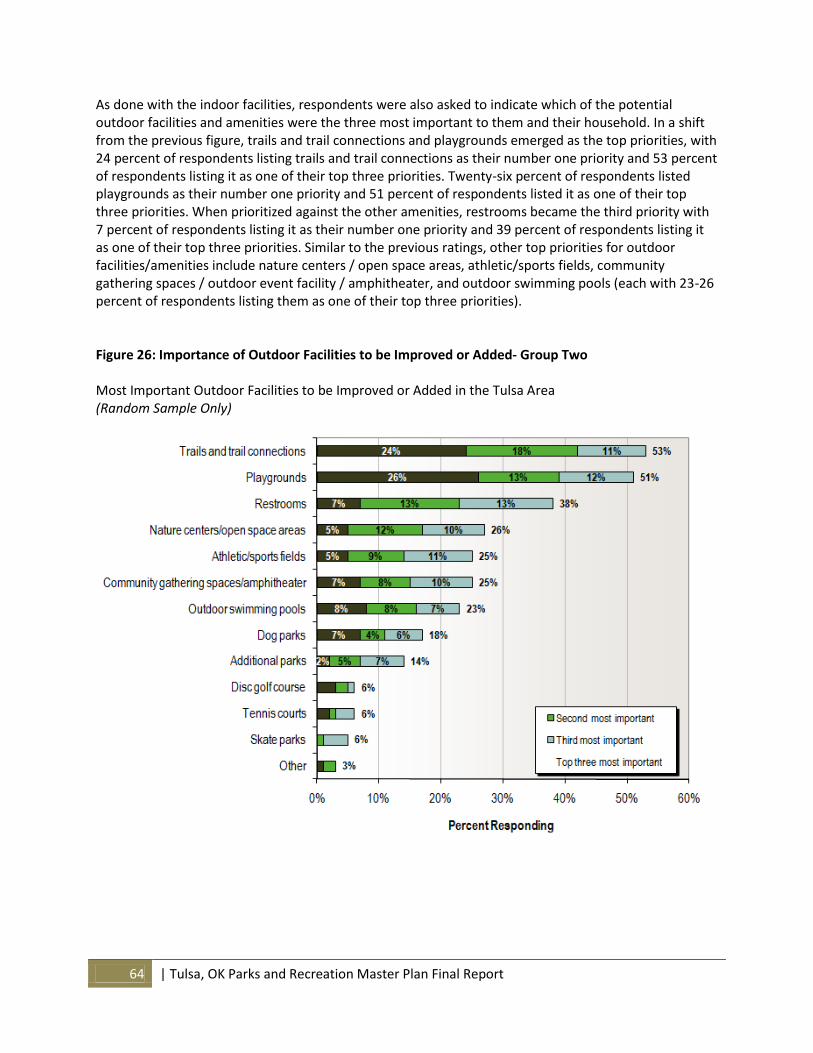
64 | Tulsa, OK Parks and Recreation Master Plan Final Report
As done with the indoor facilities, respondents were also asked to indicate which of the potential outdoor facilities and amenities were the three most important to them and their household. In a shift from the previous figure, trails and trail connections and playgrounds emerged as the top priorities, with 24 percent of respondents listing trails and trail connections as their number one priority and 53 percent of respondents listing it as one of their top three priorities. Twenty-six percent of respondents listed playgrounds as their number one priority and 51 percent of respondents listed it as one of their top three priorities. When prioritized against the other amenities, restrooms became the third priority with 7 percent of respondents listing it as their number one priority and 39 percent of respondents listing it as one of their top three priorities. Similar to the previous ratings, other top priorities for outdoor facilities/amenities include nature centers / open space areas, athletic/sports fields, community gathering spaces / outdoor event facility / amphitheater, and outdoor swimming pools (each with 23-26 percent of respondents listing them as one of their top three priorities). Figure 26: Importance of Outdoor Facilities to be Improved or Added- Group Two Most Important Outdoor Facilities to be Improved or Added in the Tulsa Area (Random Sample Only)
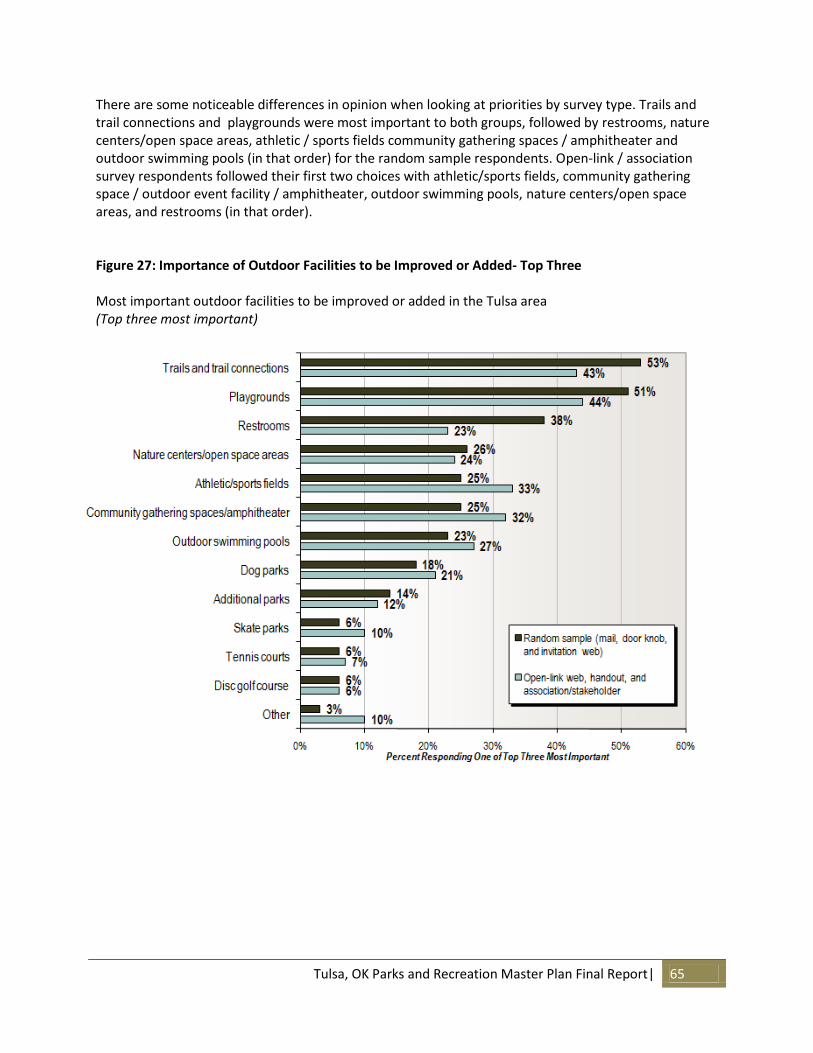
Tulsa, OK Parks and Recreation Master Plan Final Report| 65
There are some noticeable differences in opinion when looking at priorities by survey type. Trails and trail connections and playgrounds were most important to both groups, followed by restrooms, nature centers/open space areas, athletic / sports fields community gathering spaces / amphitheater and outdoor swimming pools (in that order) for the random sample respondents. Open-link / association survey respondents followed their first two choices with athletic/sports fields, community gathering space / outdoor event facility / amphitheater, outdoor swimming pools, nature centers/open space areas, and restrooms (in that order). Figure 27: Importance of Outdoor Facilities to be Improved or Added- Top Three Most important outdoor facilities to be improved or added in the Tulsa area (Top three most important)
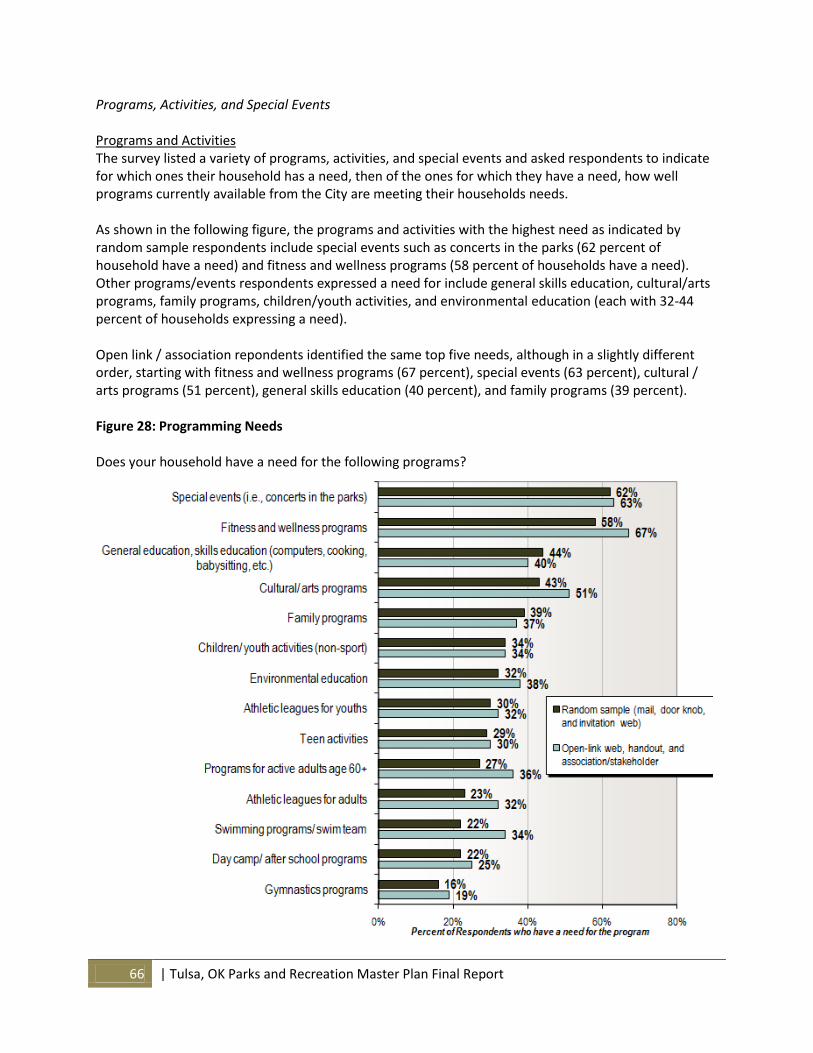
66 | Tulsa, OK Parks and Recreation Master Plan Final Report
Programs, Activities, and Special Events Programs and Activities The survey listed a variety of programs, activities, and special events and asked respondents to indicate for which ones their household has a need, then of the ones for which they have a need, how well programs currently available from the City are meeting their households needs. As shown in the following figure, the programs and activities with the highest need as indicated by random sample respondents include special events such as concerts in the parks (62 percent of household have a need) and fitness and wellness programs (58 percent of households have a need). Other programs/events respondents expressed a need for include general skills education, cultural/arts programs, family programs, children/youth activities, and environmental education (each with 32-44 percent of households expressing a need). Open link / association repondents identified the same top five needs, although in a slightly different order, starting with fitness and wellness programs (67 percent), special events (63 percent), cultural / arts programs (51 percent), general skills education (40 percent), and family programs (39 percent). Figure 28: Programming Needs Does your household have a need for the following programs?
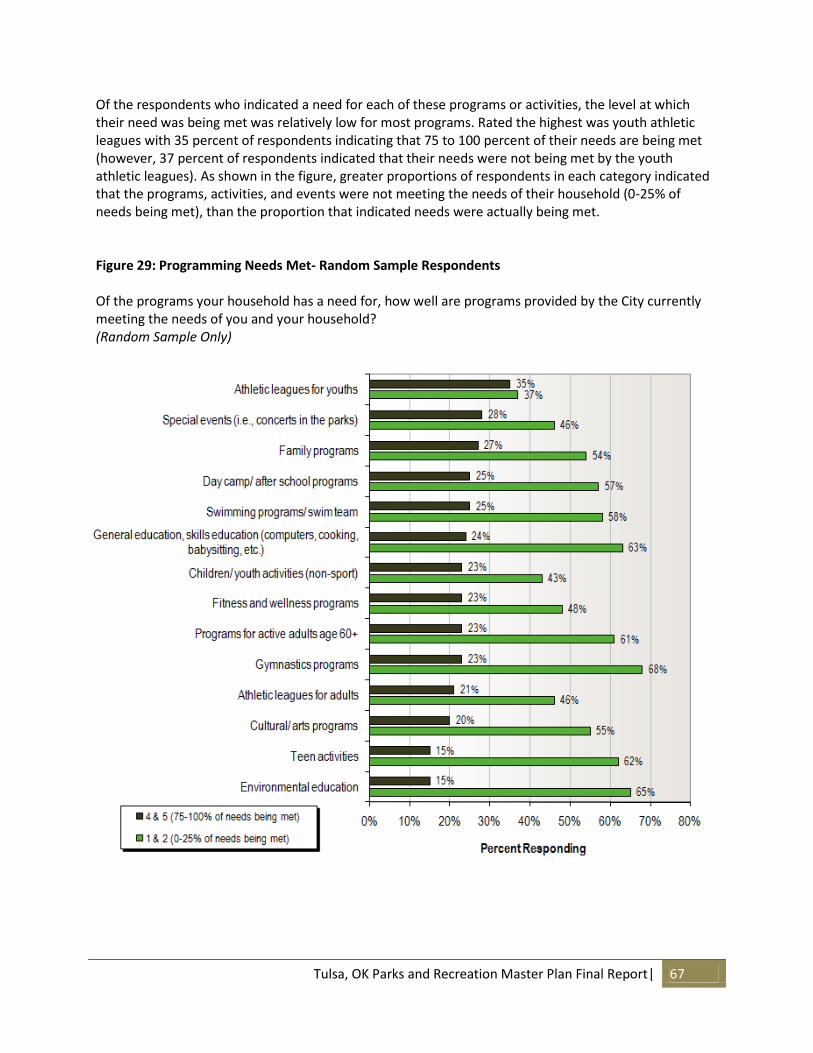
Tulsa, OK Parks and Recreation Master Plan Final Report| 67
Of the respondents who indicated a need for each of these programs or activities, the level at which their need was being met was relatively low for most programs. Rated the highest was youth athletic leagues with 35 percent of respondents indicating that 75 to 100 percent of their needs are being met (however, 37 percent of respondents indicated that their needs were not being met by the youth athletic leagues). As shown in the figure, greater proportions of respondents in each category indicated that the programs, activities, and events were not meeting the needs of their household (0-25% of needs being met), than the proportion that indicated needs were actually being met. Figure 29: Programming Needs Met- Random Sample Respondents Of the programs your household has a need for, how well are programs provided by the City currently meeting the needs of you and your household? (Random Sample Only)
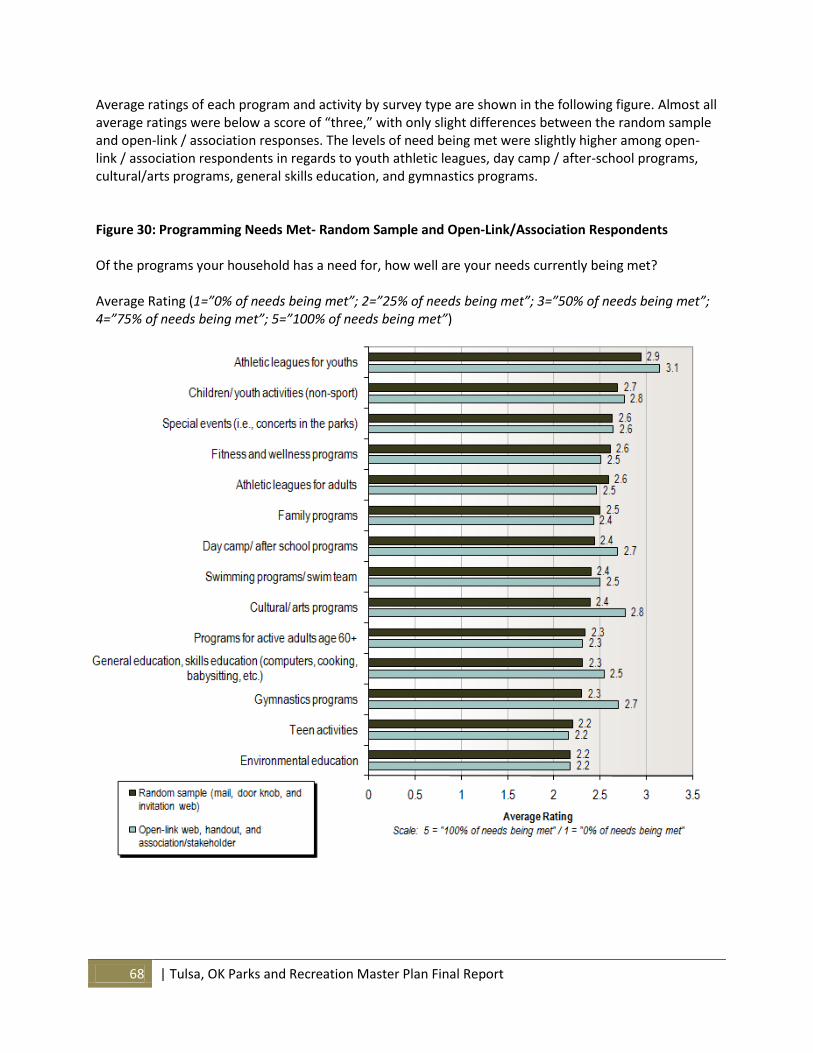
68 | Tulsa, OK Parks and Recreation Master Plan Final Report
Average ratings of each program and activity by survey type are shown in the following figure. Almost all average ratings were below a score of “three,” with only slight differences between the random sample and open-link / association responses. The levels of need being met were slightly higher among open-link / association respondents in regards to youth athletic leagues, day camp / after-school programs, cultural/arts programs, general skills education, and gymnastics programs. Figure 30: Programming Needs Met- Random Sample and Open-Link/Association Respondents Of the programs your household has a need for, how well are your needs currently being met? Average Rating (1=”0% of needs being met”; 2=”25% of needs being met”; 3=”50% of needs being met”; 4=”75% of needs being met”; 5=”100% of needs being met”)
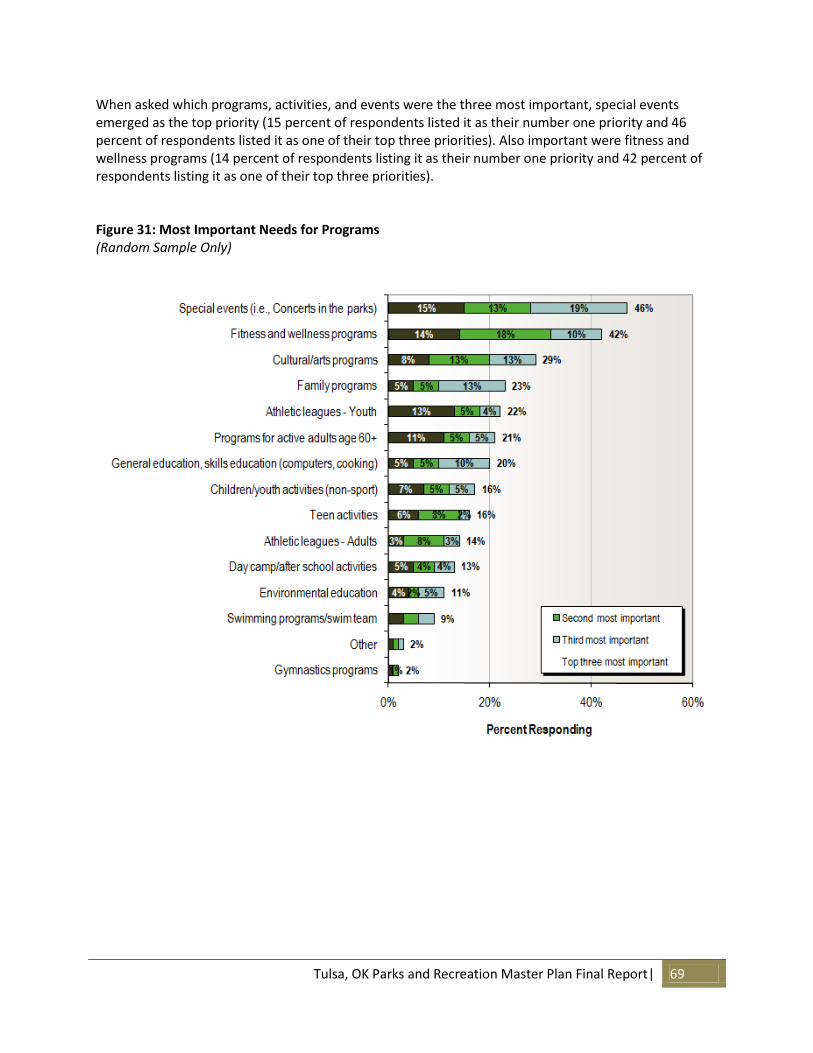
Tulsa, OK Parks and Recreation Master Plan Final Report| 69
When asked which programs, activities, and events were the three most important, special events emerged as the top priority (15 percent of respondents listed it as their number one priority and 46 percent of respondents listed it as one of their top three priorities). Also important were fitness and wellness programs (14 percent of respondents listing it as their number one priority and 42 percent of respondents listing it as one of their top three priorities). Figure 31: Most Important Needs for Programs (Random Sample Only)
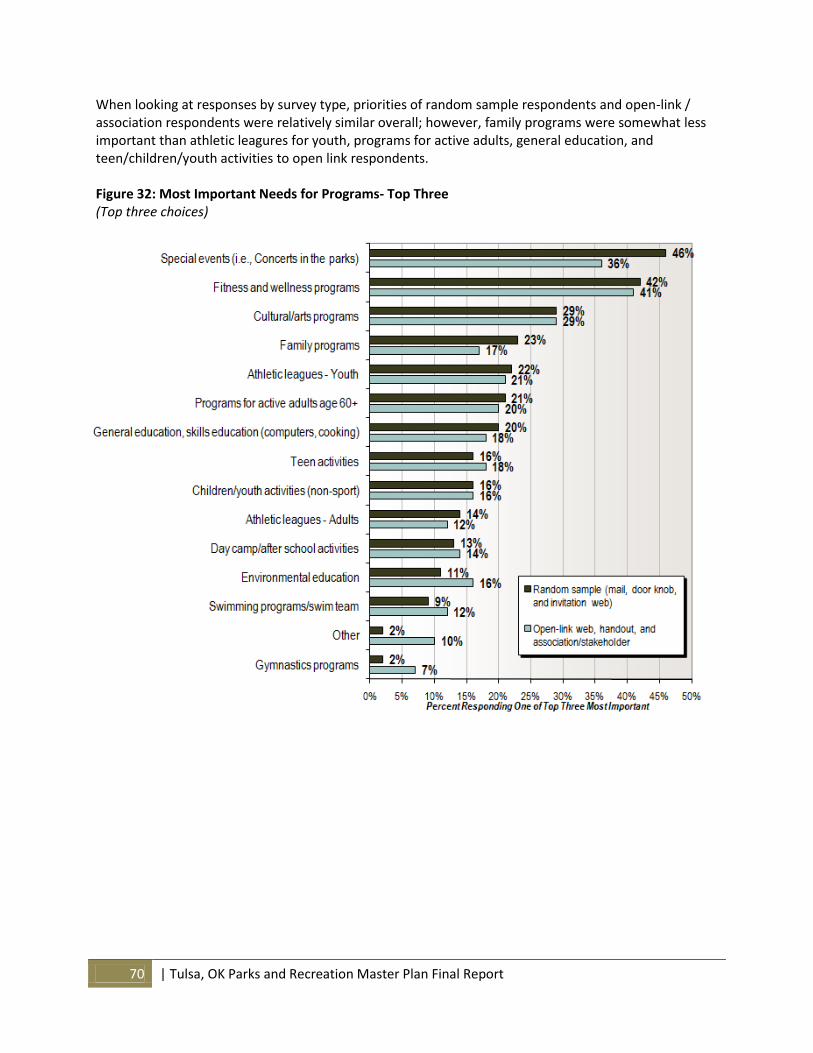
70 | Tulsa, OK Parks and Recreation Master Plan Final Report
When looking at responses by survey type, priorities of random sample respondents and open-link / association respondents were relatively similar overall; however, family programs were somewhat less important than athletic leagures for youth, programs for active adults, general education, and teen/children/youth activities to open link respondents. Figure 32: Most Important Needs for Programs- Top Three (Top three choices)
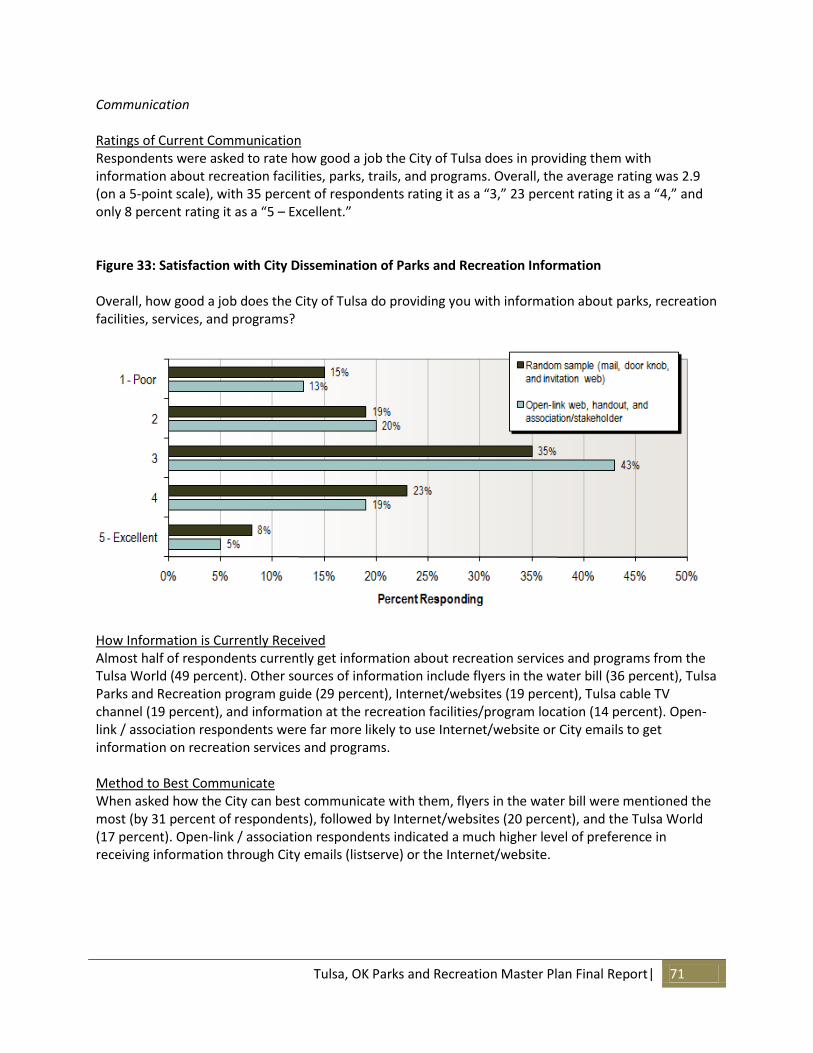
Tulsa, OK Parks and Recreation Master Plan Final Report| 71
Communication Ratings of Current Communication Respondents were asked to rate how good a job the City of Tulsa does in providing them with information about recreation facilities, parks, trails, and programs. Overall, the average rating was 2.9 (on a 5-point scale), with 35 percent of respondents rating it as a “3,” 23 percent rating it as a “4,” and only 8 percent rating it as a “5 – Excellent.” Figure 33: Satisfaction with City Dissemination of Parks and Recreation Information Overall, how good a job does the City of Tulsa do providing you with information about parks, recreation facilities, services, and programs?
How Information is Currently Received Almost half of respondents currently get information about recreation services and programs from the Tulsa World (49 percent). Other sources of information include flyers in the water bill (36 percent), Tulsa Parks and Recreation program guide (29 percent), Internet/websites (19 percent), Tulsa cable TV channel (19 percent), and information at the recreation facilities/program location (14 percent). Open-link / association respondents were far more likely to use Internet/website or City emails to get information on recreation services and programs. Method to Best Communicate When asked how the City can best communicate with them, flyers in the water bill were mentioned the most (by 31 percent of respondents), followed by Internet/websites (20 percent), and the Tulsa World (17 percent). Open-link / association respondents indicated a much higher level of preference in receiving information through City emails (listserve) or the Internet/website.
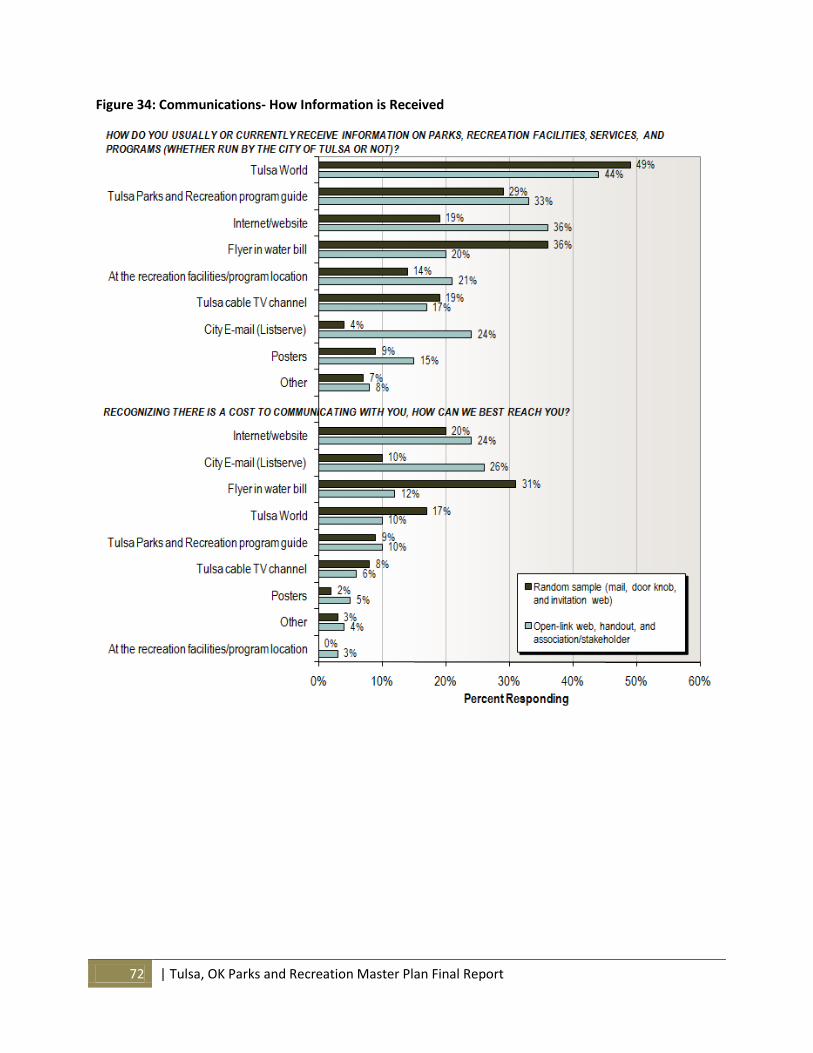
72 | Tulsa, OK Parks and Recreation Master Plan Final Report
Figure 34: Communications- How Information is Received
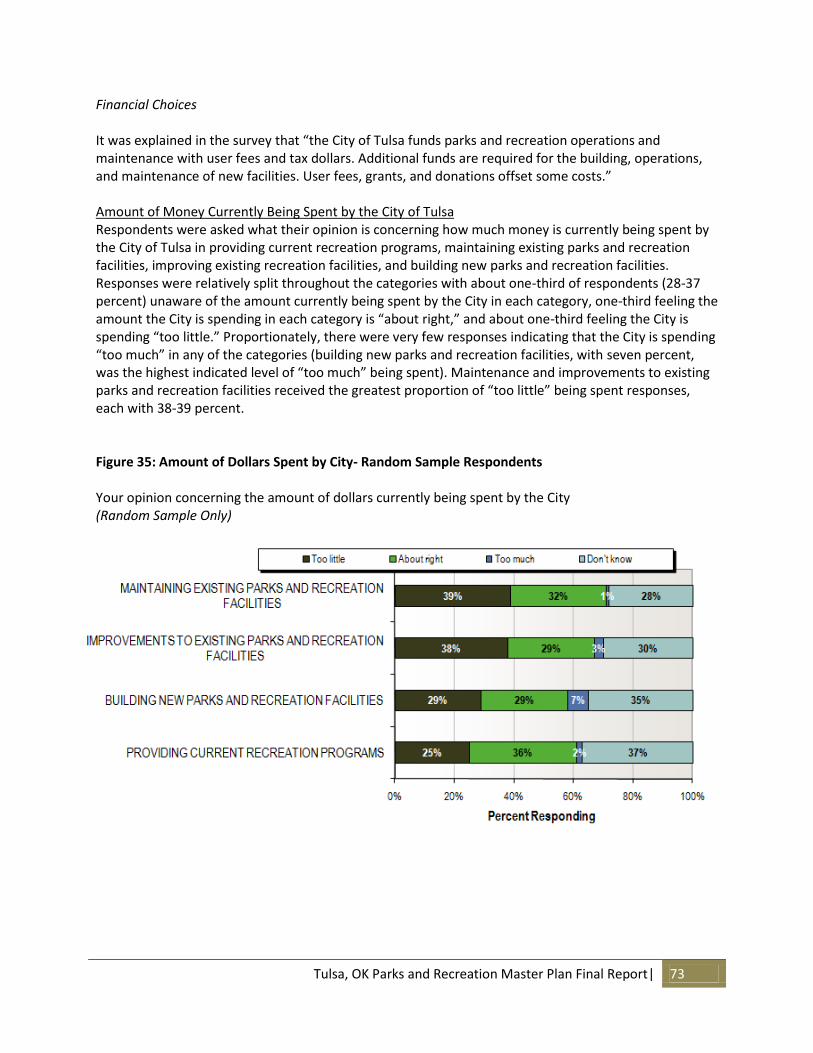
Tulsa, OK Parks and Recreation Master Plan Final Report| 73
Financial Choices It was explained in the survey that “the City of Tulsa funds parks and recreation operations and maintenance with user fees and tax dollars. Additional funds are required for the building, operations, and maintenance of new facilities. User fees, grants, and donations offset some costs.” Amount of Money Currently Being Spent by the City of Tulsa Respondents were asked what their opinion is concerning how much money is currently being spent by the City of Tulsa in providing current recreation programs, maintaining existing parks and recreation facilities, improving existing recreation facilities, and building new parks and recreation facilities. Responses were relatively split throughout the categories with about one-third of respondents (28-37 percent) unaware of the amount currently being spent by the City in each category, one-third feeling the amount the City is spending in each category is “about right,” and about one-third feeling the City is spending “too little.” Proportionately, there were very few responses indicating that the City is spending “too much” in any of the categories (building new parks and recreation facilities, with seven percent, was the highest indicated level of “too much” being spent). Maintenance and improvements to existing parks and recreation facilities received the greatest proportion of “too little” being spent responses, each with 38-39 percent. Figure 35: Amount of Dollars Spent by City- Random Sample Respondents Your opinion concerning the amount of dollars currently being spent by the City (Random Sample Only)
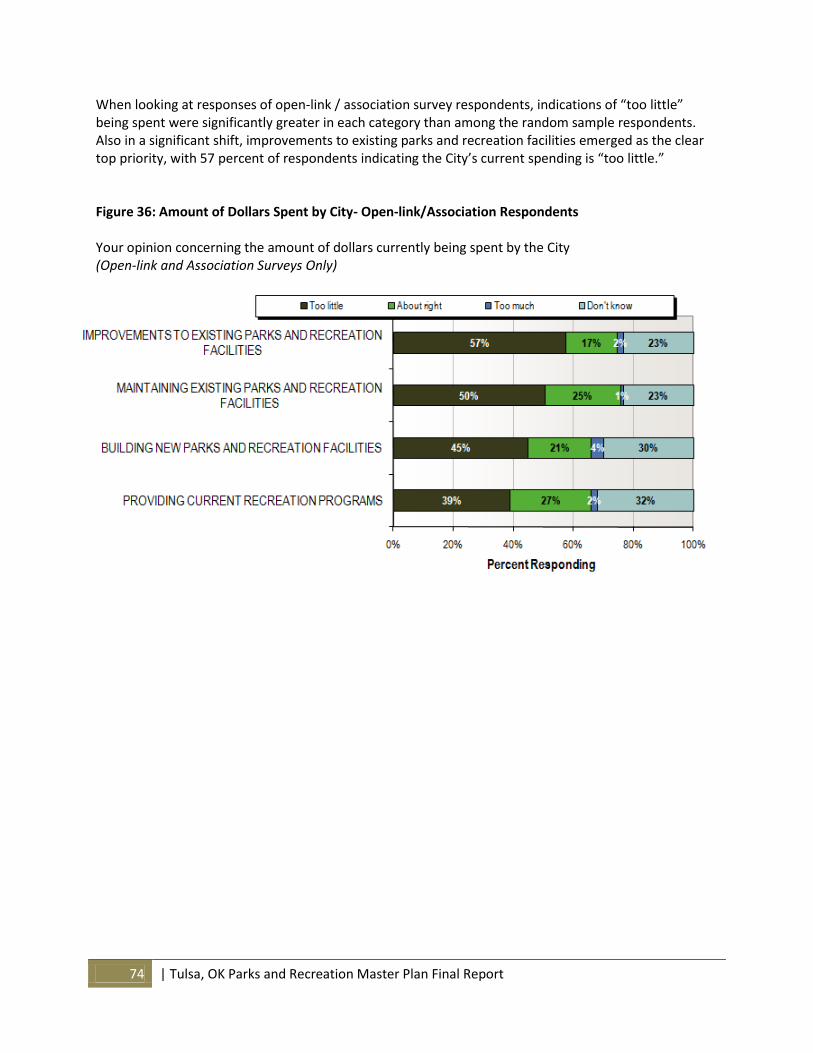
74 | Tulsa, OK Parks and Recreation Master Plan Final Report
When looking at responses of open-link / association survey respondents, indications of “too little” being spent were significantly greater in each category than among the random sample respondents. Also in a significant shift, improvements to existing parks and recreation facilities emerged as the clear top priority, with 57 percent of respondents indicating the City’s current spending is “too little.” Figure 36: Amount of Dollars Spent by City- Open-link/Association Respondents Your opinion concerning the amount of dollars currently being spent by the City (Open-link and Association Surveys Only)
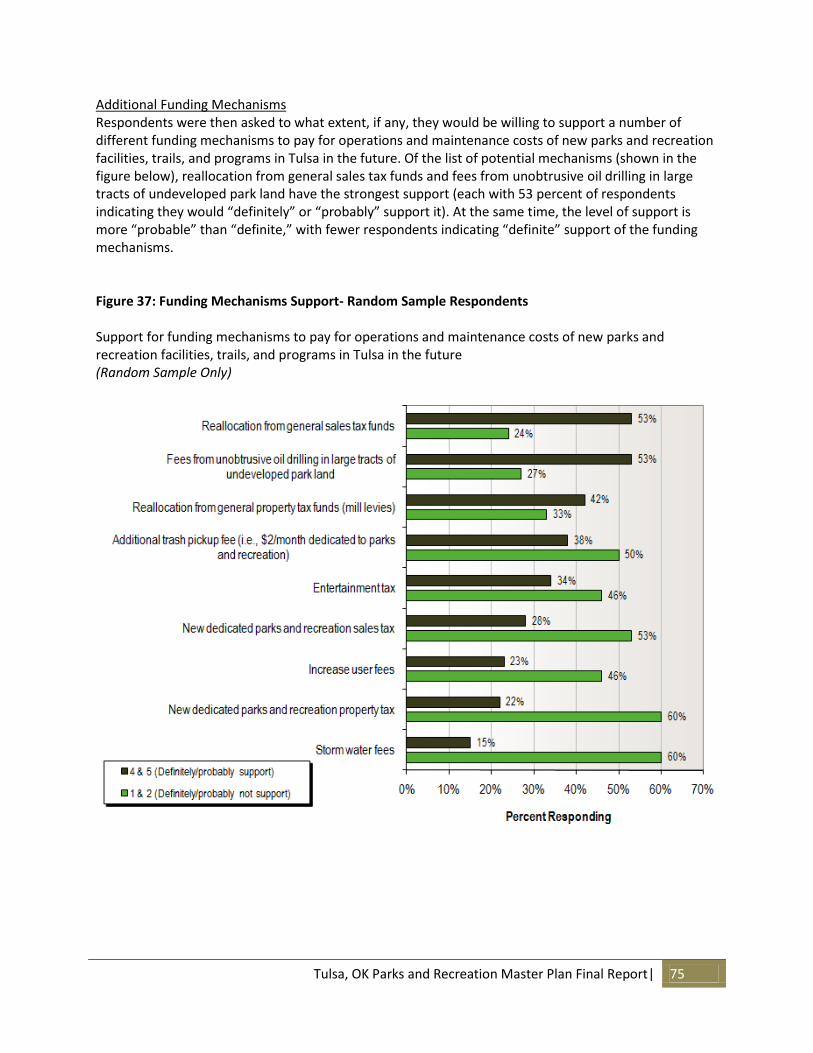
Tulsa, OK Parks and Recreation Master Plan Final Report| 75
Additional Funding Mechanisms Respondents were then asked to what extent, if any, they would be willing to support a number of different funding mechanisms to pay for operations and maintenance costs of new parks and recreation facilities, trails, and programs in Tulsa in the future. Of the list of potential mechanisms (shown in the figure below), reallocation from general sales tax funds and fees from unobtrusive oil drilling in large tracts of undeveloped park land have the strongest support (each with 53 percent of respondents indicating they would “definitely” or “probably” support it). At the same time, the level of support is more “probable” than “definite,” with fewer respondents indicating “definite” support of the funding mechanisms. Figure 37: Funding Mechanisms Support- Random Sample Respondents Support for funding mechanisms to pay for operations and maintenance costs of new parks and recreation facilities, trails, and programs in Tulsa in the future (Random Sample Only)
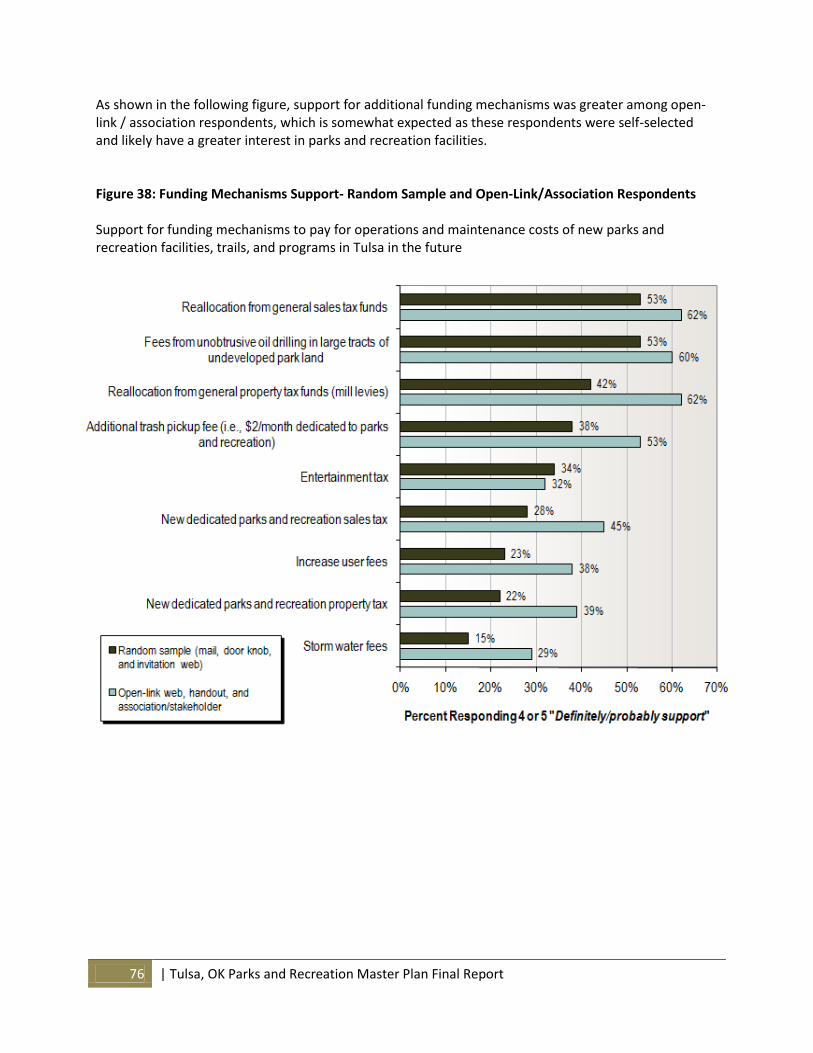
76 | Tulsa, OK Parks and Recreation Master Plan Final Report
As shown in the following figure, support for additional funding mechanisms was greater among open-link / association respondents, which is somewhat expected as these respondents were self-selected and likely have a greater interest in parks and recreation facilities. Figure 38: Funding Mechanisms Support- Random Sample and Open-Link/Association Respondents Support for funding mechanisms to pay for operations and maintenance costs of new parks and recreation facilities, trails, and programs in Tulsa in the future
Tulsa, OK Parks and Recreation Master Plan Final Report| 77
Subarea Analysis The City of Tulsa was initially divided into four subareas (North, South, Midtown, and East). In the compilation and review of survey results for the four subareas, it was recognized that the Level of Service assessments should be provided for five subareas generally recognized by the Tulsa community. Thus, the West subarea (the southwest portion of the original South subarea) was broken out into a separate subarea. The compilation LOS assessments into five community subareas is appropriate when discussing community needs and right on target. The initial compilation of survey results into four subareas does not compromise that assessment. As a general comment, most of the overriding themes and findings at the city level discussed in previous sections of the report tend to be consistent across the four subarea regions analyzed. Variations exist in the percentage response for the priorities from subarea to subarea, but for the most part, the top priorities tend to be the same in each of the subareas, just in different rank order. Specific unique characteristics of each subarea are summarized below. North Tulsa The North Tulsa subarea is characterized by racial/ethnic diversity, lower incomes, and greater proportion of households with children (both couples with children and singles with children at home). North Tulsa residents are clearly the biggest users of community centers, as well as being the biggest supporters of trying to fund community center improvements through the creation of a new dedicated funding source. They are also least supportive of any subarea of closing and demolishing centers or contracting out operations and maintenance of centers to third party partners. Based on the survey data, North Tulsa residents are also more frequent users of the City’s recreation programs, outdoor swimming pools, and nature centers / open space areas (along with Midtown). North Tulsa residents were most likely to cite “condition of community centers” as their primary reason for not using City facilities, or if they do use the facilities, what they feel is most in need of improvement. Next was condition of parks, quality of equipment, and then safety and security. In terms of future indoor facilities, additional teen and youth activity areas is clearly the most important (similar to the other subareas), followed by additional designated areas for seniors/active adults 60+, dedicated performing arts space (at 26 percent, higher than any other region), additional indoor swimming pools with lap lanes, and additional fitness class space. In terms of future outdoor facilities, playgrounds was mentioned the most frequently by far (56 percent —more than any other region). After playgrounds was community gathering spaces / amphitheater (38 percent—more than any other region), and outdoor swimming pools (36 percent—more than any other region). Although still important, North Tulsa residents were the least likely to mention trails and trail connections (34 percent). In terms of programs, after fitness and wellness programs with 36 percent, North Tulsa residents mentioned a variety of desired recreation programs with similar frequency, including teen activities (30 percent—much greater than any other region), youth athletic leagues (29 percent—more than any region), programs for active adults 60+ (29 percent—more than any region), special events (25 percent—the smallest of any region), and children/youth non-sport activities (24 percent—the most of any region). Also of note, along with East Tulsa residents, North Tulsa residents mentioned day camp/after school activities with above average frequency (18 percent).
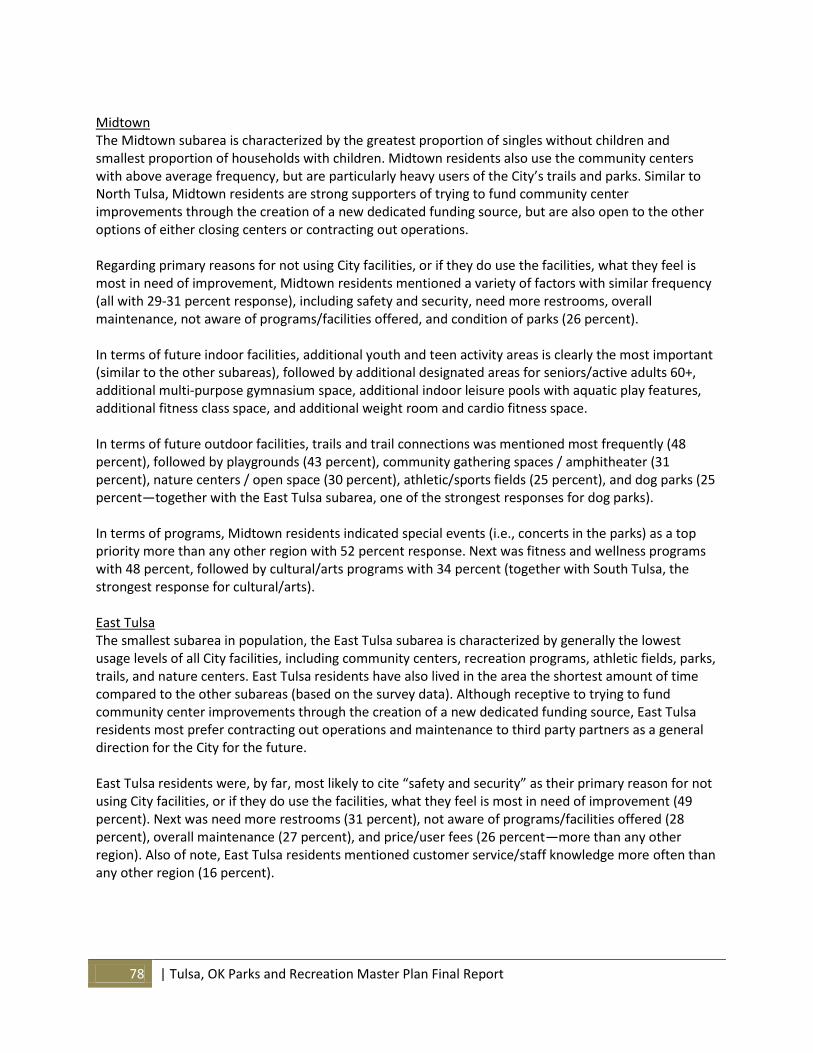
78 | Tulsa, OK Parks and Recreation Master Plan Final Report
Midtown The Midtown subarea is characterized by the greatest proportion of singles without children and smallest proportion of households with children. Midtown residents also use the community centers with above average frequency, but are particularly heavy users of the City’s trails and parks. Similar to North Tulsa, Midtown residents are strong supporters of trying to fund community center improvements through the creation of a new dedicated funding source, but are also open to the other options of either closing centers or contracting out operations. Regarding primary reasons for not using City facilities, or if they do use the facilities, what they feel is most in need of improvement, Midtown residents mentioned a variety of factors with similar frequency (all with 29-31 percent response), including safety and security, need more restrooms, overall maintenance, not aware of programs/facilities offered, and condition of parks (26 percent). In terms of future indoor facilities, additional youth and teen activity areas is clearly the most important (similar to the other subareas), followed by additional designated areas for seniors/active adults 60+, additional multi-purpose gymnasium space, additional indoor leisure pools with aquatic play features, additional fitness class space, and additional weight room and cardio fitness space. In terms of future outdoor facilities, trails and trail connections was mentioned most frequently (48 percent), followed by playgrounds (43 percent), community gathering spaces / amphitheater (31 percent), nature centers / open space (30 percent), athletic/sports fields (25 percent), and dog parks (25 percent—together with the East Tulsa subarea, one of the strongest responses for dog parks). In terms of programs, Midtown residents indicated special events (i.e., concerts in the parks) as a top priority more than any other region with 52 percent response. Next was fitness and wellness programs with 48 percent, followed by cultural/arts programs with 34 percent (together with South Tulsa, the strongest response for cultural/arts). East Tulsa The smallest subarea in population, the East Tulsa subarea is characterized by generally the lowest usage levels of all City facilities, including community centers, recreation programs, athletic fields, parks, trails, and nature centers. East Tulsa residents have also lived in the area the shortest amount of time compared to the other subareas (based on the survey data). Although receptive to trying to fund community center improvements through the creation of a new dedicated funding source, East Tulsa residents most prefer contracting out operations and maintenance to third party partners as a general direction for the City for the future. East Tulsa residents were, by far, most likely to cite “safety and security” as their primary reason for not using City facilities, or if they do use the facilities, what they feel is most in need of improvement (49 percent). Next was need more restrooms (31 percent), not aware of programs/facilities offered (28 percent), overall maintenance (27 percent), and price/user fees (26 percent—more than any other region). Also of note, East Tulsa residents mentioned customer service/staff knowledge more often than any other region (16 percent).
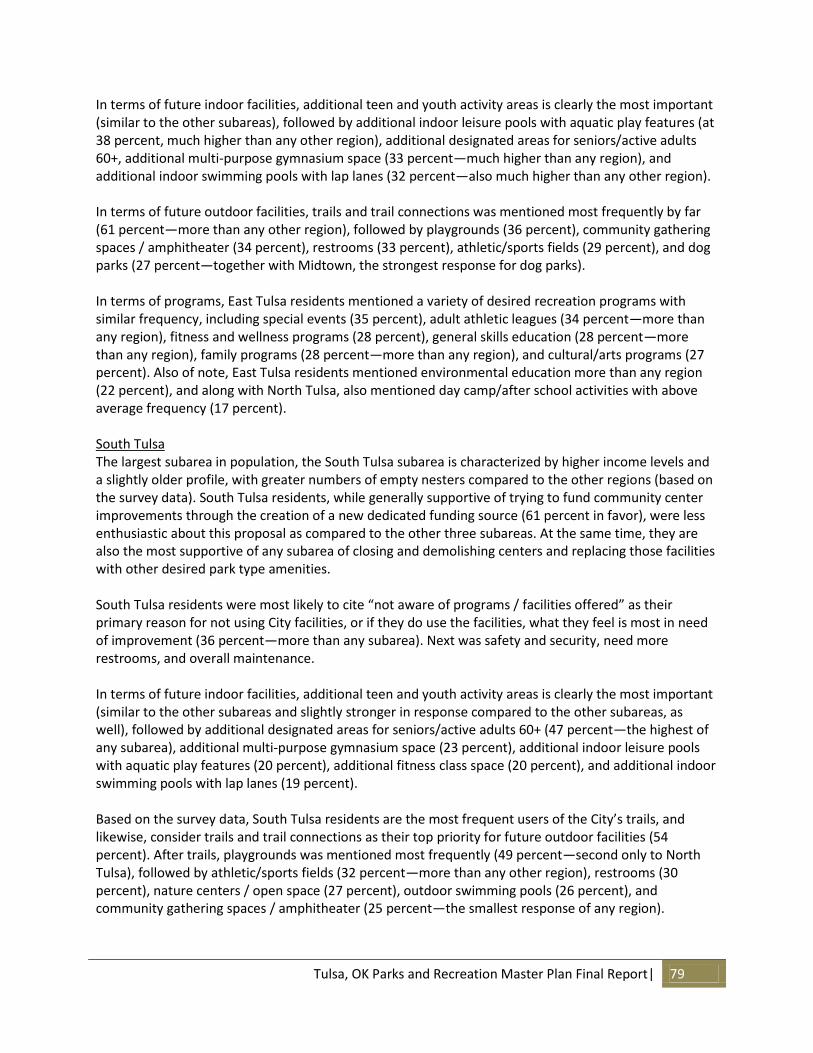
Tulsa, OK Parks and Recreation Master Plan Final Report| 79
In terms of future indoor facilities, additional teen and youth activity areas is clearly the most important (similar to the other subareas), followed by additional indoor leisure pools with aquatic play features (at 38 percent, much higher than any other region), additional designated areas for seniors/active adults 60+, additional multi-purpose gymnasium space (33 percent—much higher than any region), and additional indoor swimming pools with lap lanes (32 percent—also much higher than any other region). In terms of future outdoor facilities, trails and trail connections was mentioned most frequently by far (61 percent—more than any other region), followed by playgrounds (36 percent), community gathering spaces / amphitheater (34 percent), restrooms (33 percent), athletic/sports fields (29 percent), and dog parks (27 percent—together with Midtown, the strongest response for dog parks). In terms of programs, East Tulsa residents mentioned a variety of desired recreation programs with similar frequency, including special events (35 percent), adult athletic leagues (34 percent—more than any region), fitness and wellness programs (28 percent), general skills education (28 percent—more than any region), family programs (28 percent—more than any region), and cultural/arts programs (27 percent). Also of note, East Tulsa residents mentioned environmental education more than any region (22 percent), and along with North Tulsa, also mentioned day camp/after school activities with above average frequency (17 percent). South Tulsa The largest subarea in population, the South Tulsa subarea is characterized by higher income levels and a slightly older profile, with greater numbers of empty nesters compared to the other regions (based on the survey data). South Tulsa residents, while generally supportive of trying to fund community center improvements through the creation of a new dedicated funding source (61 percent in favor), were less enthusiastic about this proposal as compared to the other three subareas. At the same time, they are also the most supportive of any subarea of closing and demolishing centers and replacing those facilities with other desired park type amenities. South Tulsa residents were most likely to cite “not aware of programs / facilities offered” as their primary reason for not using City facilities, or if they do use the facilities, what they feel is most in need of improvement (36 percent—more than any subarea). Next was safety and security, need more restrooms, and overall maintenance. In terms of future indoor facilities, additional teen and youth activity areas is clearly the most important (similar to the other subareas and slightly stronger in response compared to the other subareas, as well), followed by additional designated areas for seniors/active adults 60+ (47 percent—the highest of any subarea), additional multi-purpose gymnasium space (23 percent), additional indoor leisure pools with aquatic play features (20 percent), additional fitness class space (20 percent), and additional indoor swimming pools with lap lanes (19 percent). Based on the survey data, South Tulsa residents are the most frequent users of the City’s trails, and likewise, consider trails and trail connections as their top priority for future outdoor facilities (54 percent). After trails, playgrounds was mentioned most frequently (49 percent—second only to North Tulsa), followed by athletic/sports fields (32 percent—more than any other region), restrooms (30 percent), nature centers / open space (27 percent), outdoor swimming pools (26 percent), and community gathering spaces / amphitheater (25 percent—the smallest response of any region).
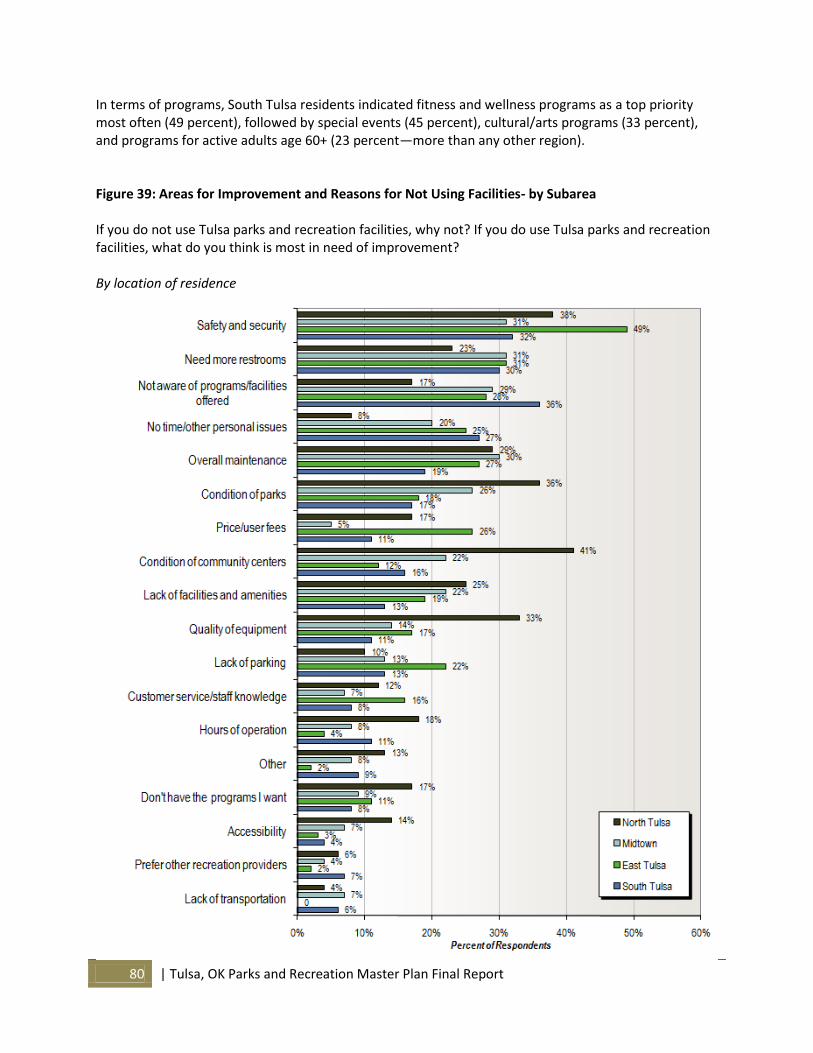
80 | Tulsa, OK Parks and Recreation Master Plan Final Report
In terms of programs, South Tulsa residents indicated fitness and wellness programs as a top priority most often (49 percent), followed by special events (45 percent), cultural/arts programs (33 percent), and programs for active adults age 60+ (23 percent—more than any other region). Figure 39: Areas for Improvement and Reasons for Not Using Facilities- by Subarea If you do not use Tulsa parks and recreation facilities, why not? If you do use Tulsa parks and recreation facilities, what do you think is most in need of improvement? By location of residence
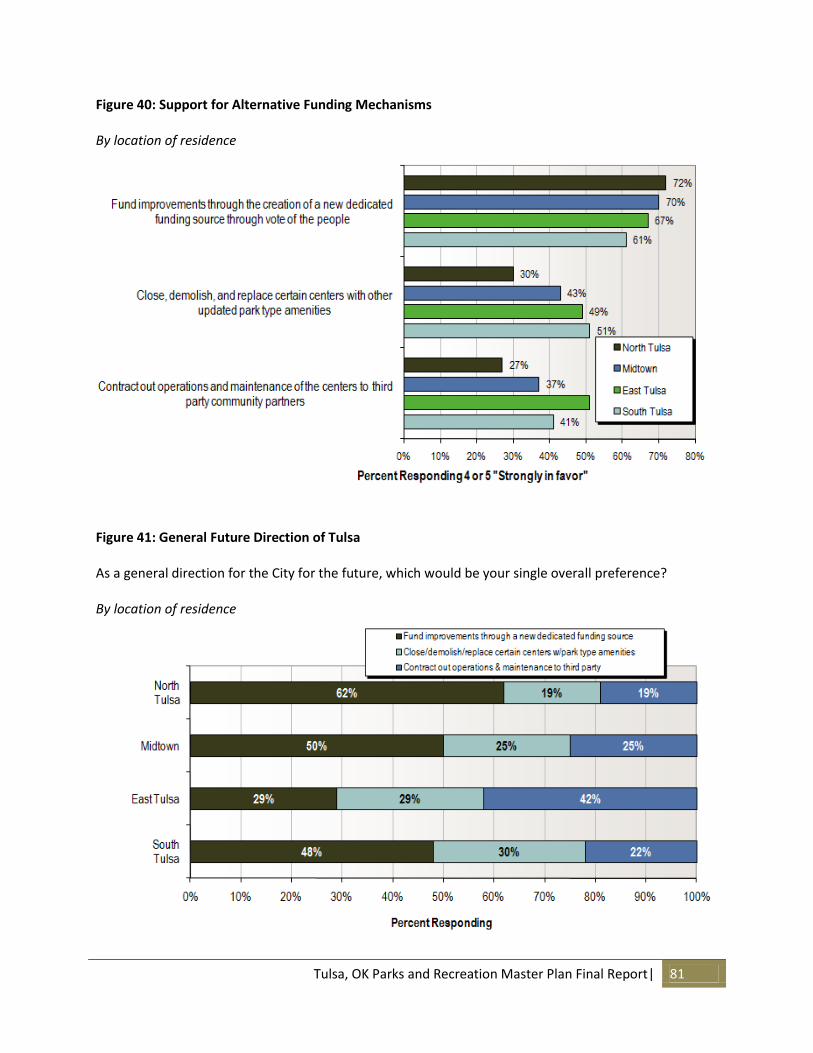
Tulsa, OK Parks and Recreation Master Plan Final Report| 81
Figure 40: Support for Alternative Funding Mechanisms By location of residence
Figure 41: General Future Direction of Tulsa As a general direction for the City for the future, which would be your single overall preference? By location of residence
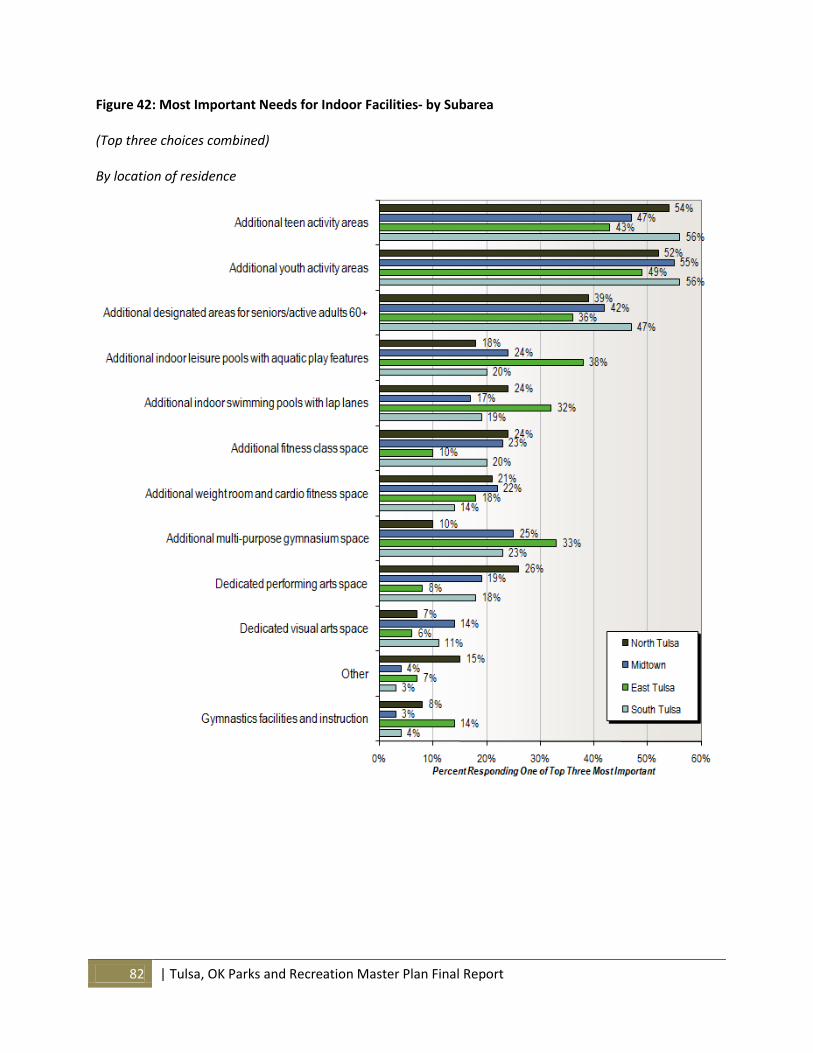
82 | Tulsa, OK Parks and Recreation Master Plan Final Report
Figure 42: Most Important Needs for Indoor Facilities- by Subarea (Top three choices combined) By location of residence
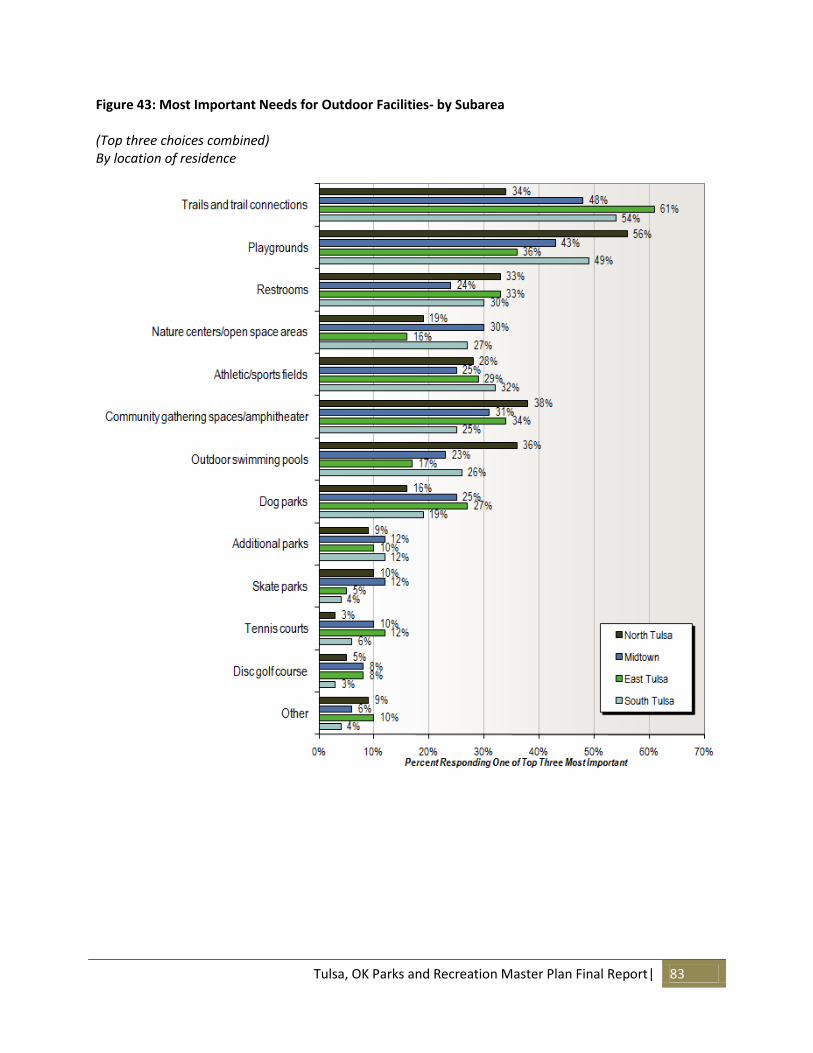
Tulsa, OK Parks and Recreation Master Plan Final Report| 83
Figure 43: Most Important Needs for Outdoor Facilities- by Subarea (Top three choices combined) By location of residence
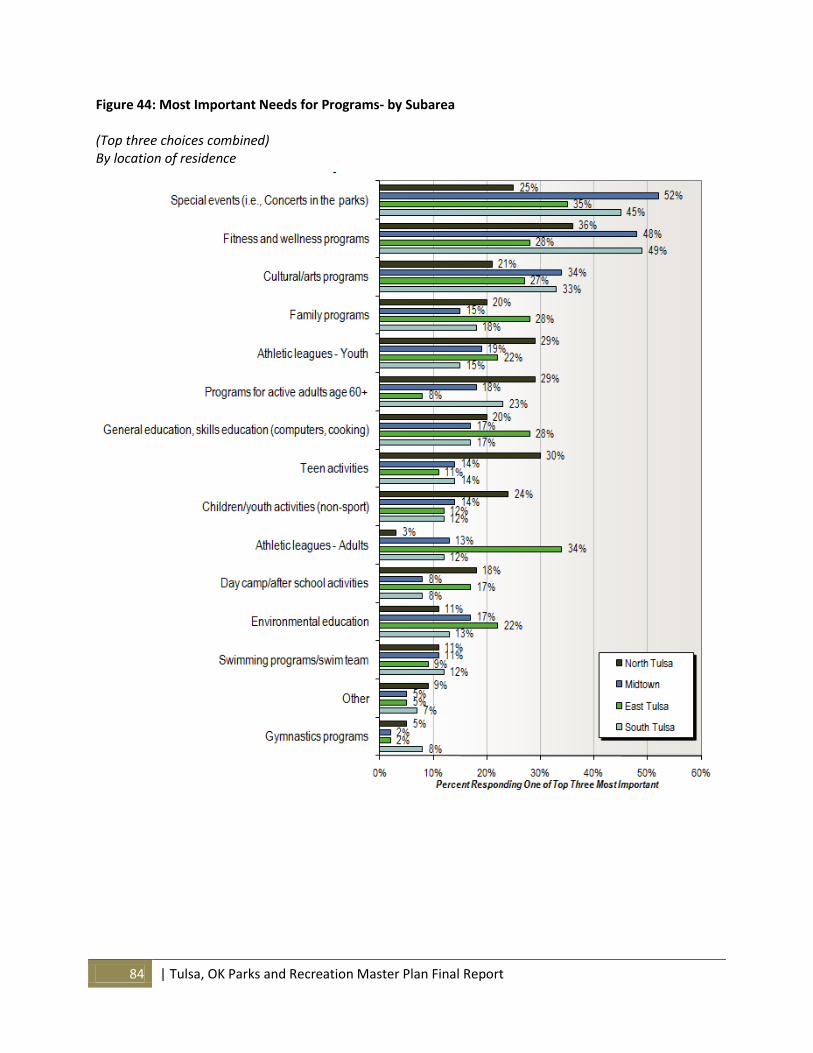
84 | Tulsa, OK Parks and Recreation Master Plan Final Report
Figure 44: Most Important Needs for Programs- by Subarea (Top three choices combined) By location of residence
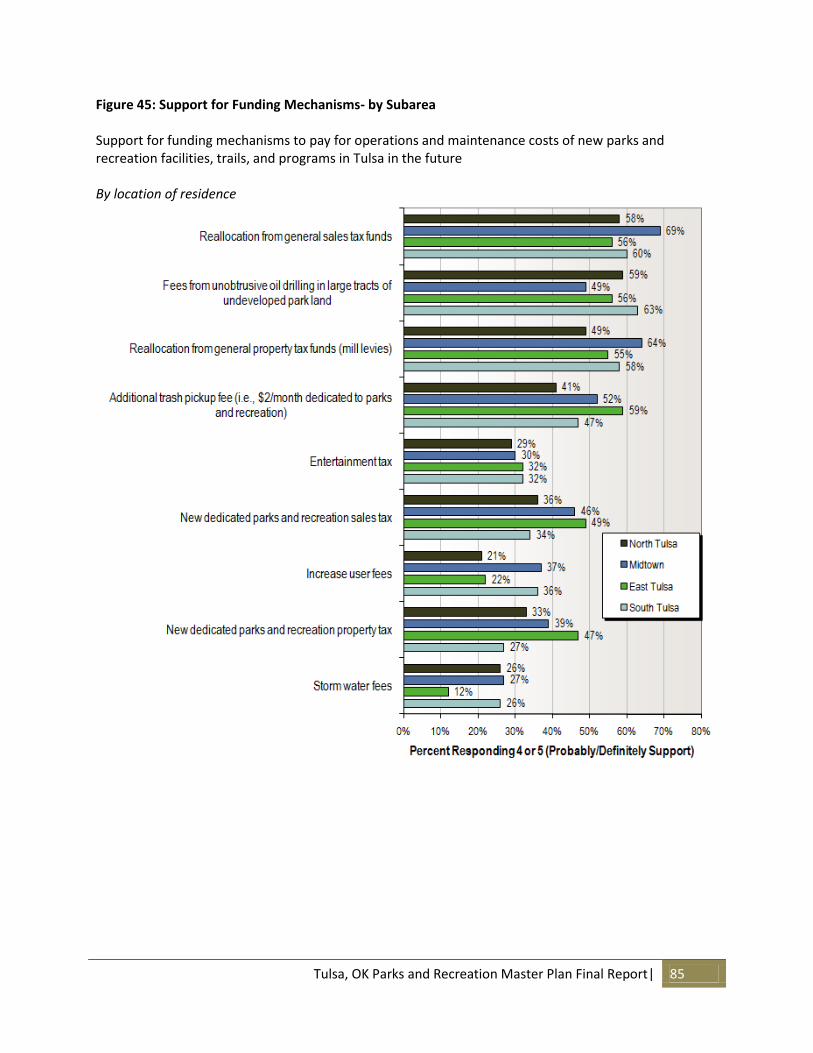
Tulsa, OK Parks and Recreation Master Plan Final Report| 85
Figure 45: Support for Funding Mechanisms- by Subarea Support for funding mechanisms to pay for operations and maintenance costs of new parks and recreation facilities, trails, and programs in Tulsa in the future By location of residence
86 | Tulsa, OK Parks and Recreation Master Plan Final Report
IV. What We Have Now- An Analysis of Programs and Spaces
A. Financial and Programming Analysis The Tulsa Parks and Recreation Department oversees 6,000 acres of land, 135 parks, 21 community centers, 21 swimming pools, 31 splashpads/water playgrounds, 4 golf courses, the Oxley and Redbud Valley Nature Centers, the Tulsa Zoo and the Living Museum. (This plan is focused on the parks and recreation aspects of the Department and, although included in this discussion, does not include the golf, zoo, and nature center operations or programming.) Most of the facilities in Tulsa were built in the 50’s, 60’s, or 70’s and are aging. Tulsa has not kept pace with best practices in its park system. There has not been enough funding for proper maintenance or operation, and the facilities have reached a critical point in their life cycle. Financial needs compounded by functional obsolescence, has created a system that is substandard and unable to meet community needs (nor building and pool safety standards). The overall department budget (including golf, zoo, and nature centers) remained relatively stable between 2006 and 2007 and saw a minor decrease in 2008. Golf operations were transferred to Billy Casper Golf on January 1, 2008, the middle of the 2008 fiscal year. For fiscal year 2009 the maintenance divisions and capital programming staff of the Parks and Recreation Department was moved to the Public Works Department and therefore the overall department budget was reduced by approximately 33% as shown in Table 7. Department revenues are generated from many sources including:
Program fees and charges
Zoo admissions
Athletic field rentals
Park shelter rentals
Park concessions
Golf fees
Donations Overall, department revenues decreased by 12% from 2006 to 2008, primarily driven by a transfer of golf revenues to another budget area.
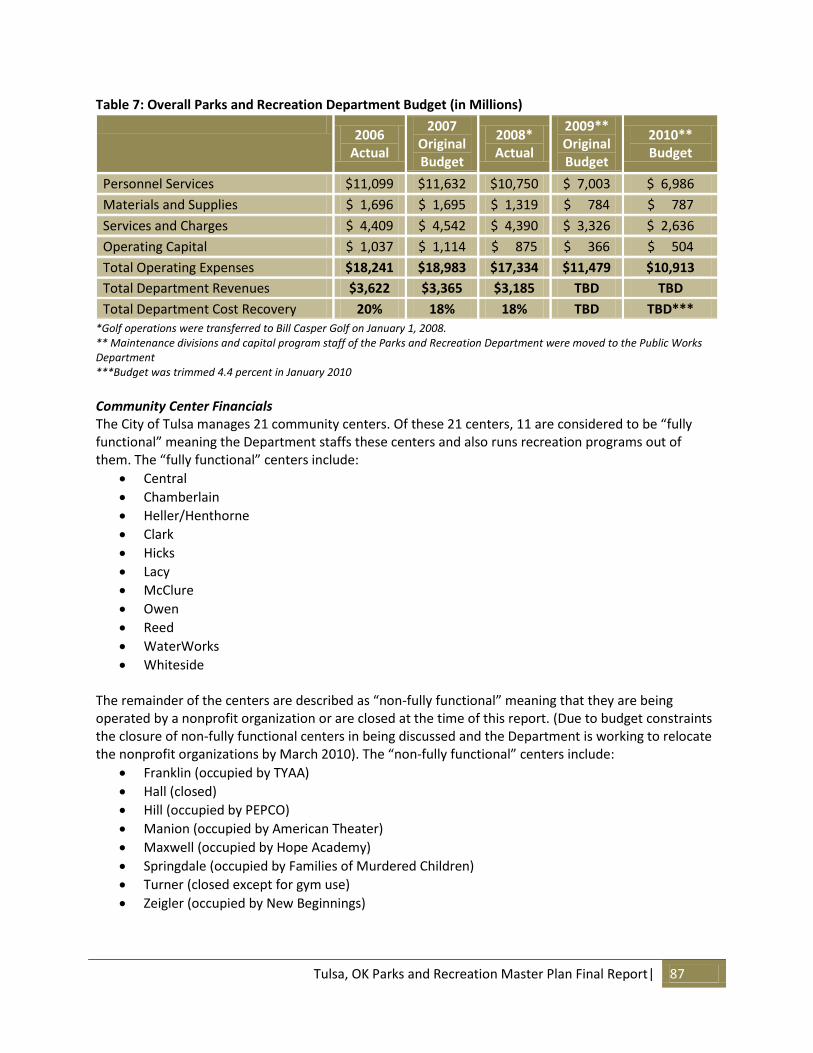
Tulsa, OK Parks and Recreation Master Plan Final Report| 87
Table 7: Overall Parks and Recreation Department Budget (in Millions)
2006
Actual
2007 Original Budget
2008* Actual
2009** Original Budget
2010** Budget
Personnel Services $11,099 $11,632 $10,750 $ 7,003 $ 6,986
Materials and Supplies $ 1,696 $ 1,695 $ 1,319 $ 784 $ 787
Services and Charges $ 4,409 $ 4,542 $ 4,390 $ 3,326 $ 2,636
Operating Capital $ 1,037 $ 1,114 $ 875 $ 366 $ 504
Total Operating Expenses $18,241 $18,983 $17,334 $11,479 $10,913
Total Department Revenues $3,622 $3,365 $3,185 TBD TBD
Total Department Cost Recovery 20% 18% 18% TBD TBD*** *Golf operations were transferred to Bill Casper Golf on January 1, 2008. ** Maintenance divisions and capital program staff of the Parks and Recreation Department were moved to the Public Works Department ***Budget was trimmed 4.4 percent in January 2010
Community Center Financials The City of Tulsa manages 21 community centers. Of these 21 centers, 11 are considered to be “fully functional” meaning the Department staffs these centers and also runs recreation programs out of them. The “fully functional” centers include:
Central
Chamberlain
Heller/Henthorne
Clark
Hicks
Lacy
McClure
Owen
Reed
WaterWorks
Whiteside The remainder of the centers are described as “non-fully functional” meaning that they are being operated by a nonprofit organization or are closed at the time of this report. (Due to budget constraints the closure of non-fully functional centers in being discussed and the Department is working to relocate the nonprofit organizations by March 2010). The “non-fully functional” centers include:
Franklin (occupied by TYAA)
Hall (closed)
Hill (occupied by PEPCO)
Manion (occupied by American Theater)
Maxwell (occupied by Hope Academy)
Springdale (occupied by Families of Murdered Children)
Turner (closed except for gym use)
Zeigler (occupied by New Beginnings)
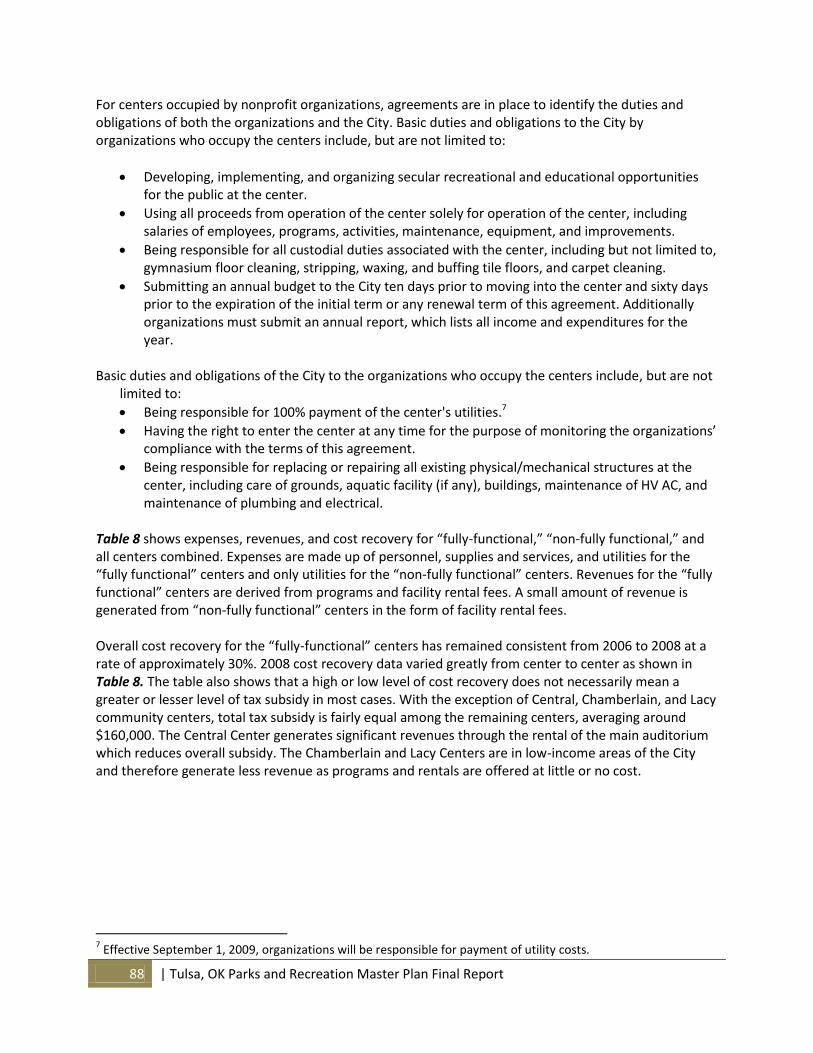
88 | Tulsa, OK Parks and Recreation Master Plan Final Report
For centers occupied by nonprofit organizations, agreements are in place to identify the duties and obligations of both the organizations and the City. Basic duties and obligations to the City by organizations who occupy the centers include, but are not limited to:
Developing, implementing, and organizing secular recreational and educational opportunities for the public at the center.
Using all proceeds from operation of the center solely for operation of the center, including salaries of employees, programs, activities, maintenance, equipment, and improvements.
Being responsible for all custodial duties associated with the center, including but not limited to, gymnasium floor cleaning, stripping, waxing, and buffing tile floors, and carpet cleaning.
Submitting an annual budget to the City ten days prior to moving into the center and sixty days prior to the expiration of the initial term or any renewal term of this agreement. Additionally organizations must submit an annual report, which lists all income and expenditures for the year.
Basic duties and obligations of the City to the organizations who occupy the centers include, but are not
limited to:
Being responsible for 100% payment of the center's utilities.7
Having the right to enter the center at any time for the purpose of monitoring the organizations’ compliance with the terms of this agreement.
Being responsible for replacing or repairing all existing physical/mechanical structures at the center, including care of grounds, aquatic facility (if any), buildings, maintenance of HV AC, and maintenance of plumbing and electrical.
Table 8 shows expenses, revenues, and cost recovery for “fully-functional,” “non-fully functional,” and all centers combined. Expenses are made up of personnel, supplies and services, and utilities for the “fully functional” centers and only utilities for the “non-fully functional” centers. Revenues for the “fully functional” centers are derived from programs and facility rental fees. A small amount of revenue is generated from “non-fully functional” centers in the form of facility rental fees. Overall cost recovery for the “fully-functional” centers has remained consistent from 2006 to 2008 at a rate of approximately 30%. 2008 cost recovery data varied greatly from center to center as shown in Table 8. The table also shows that a high or low level of cost recovery does not necessarily mean a greater or lesser level of tax subsidy in most cases. With the exception of Central, Chamberlain, and Lacy community centers, total tax subsidy is fairly equal among the remaining centers, averaging around $160,000. The Central Center generates significant revenues through the rental of the main auditorium which reduces overall subsidy. The Chamberlain and Lacy Centers are in low-income areas of the City and therefore generate less revenue as programs and rentals are offered at little or no cost.
7 Effective September 1, 2009, organizations will be responsible for payment of utility costs.
Tulsa, OK Parks and Recreation Master Plan Final Report| 89
Table 8: Community Center Expenses and Revenues
Fully Functional Centers 2006 2007 2008
Totals Expenses $2,245,366 $2,303,087 $2,413,437
Total Revenue $ 639,351 $ 705,303 $ 727,872
Cost Recovery 28% 31% 30%
Non- Fully Functional Centers
Total Expenses $ 121,740 $ 110,141 $ 106,706
Total Revenues* $ 23,627 $ 20,485 $ 19,745
Cost Recovery 19% 19% 19%
All Centers
Total Expenses $2,367,106 $2,413,228 $2,519,975
Total Revenues $ 662,978 $ 725,788 $ 747,617
Total Cost Recovery 28% 30% 30% *Turner Gym Revenues
Table 9: Community Center Cost Recovery and Subsidy 2008
Expenses Revenues Cost Recovery Total Subsidy
Central $233,834 $119,992 51% $113,842
Chamberlain $227,315 $ 5,076 2% $222,239
Heller/Clark $205,942 $ 44,443 22% $161,499
Henthorne/Owen* $166,415 $ 8,412 5% $158,003
Hicks $238,528 $ 67,860 28% $170,668
Lacy $250,747 $ 30,131 12% $220,616
McClure $240,862 $ 70,247 29% $170,615
Reed $294,319 $141,767 48% $152,552
WaterWorks $225,844 $ 64,137 28% $161,707
Whiteside $329,631 $175,807 53% $153,824 * In September 2008 Henthorne staff moved to Owen which was reopened. Heller/Clark operations moved to Henthorne in 2009 – 2010.
Community Center Programs and Participation Each center has particular indoor features that attract people to the centers. Almost all have gymnasiums for both drop-in and scheduled sports programming, and some have designated spaces for programs such as gymnastics, computer learning, and theater. Many centers have supporting outdoor facilities such as pools, tennis courts, sports fields and disk golf courses. Additionally the Department provides many programming opportunities that also attract people to the centers. Facility features and programming highlights include but are not limited to:
Central – has large auditorium with a stage and fitness room
Chamberlain – has arts and crafts, weight room, and special events
Clark – has wide variety of youth-oriented arts and performance related activities
Heller – specializes in adult theater programs
Hicks - has computer lab and fitness center along with providing sports, fitness, and senior programs
Lacy – has a state-of-the-art fitness center and provides dance classes and drop-in opportunities
McClure – provides preschool activities, sport and fitness programs, and special events
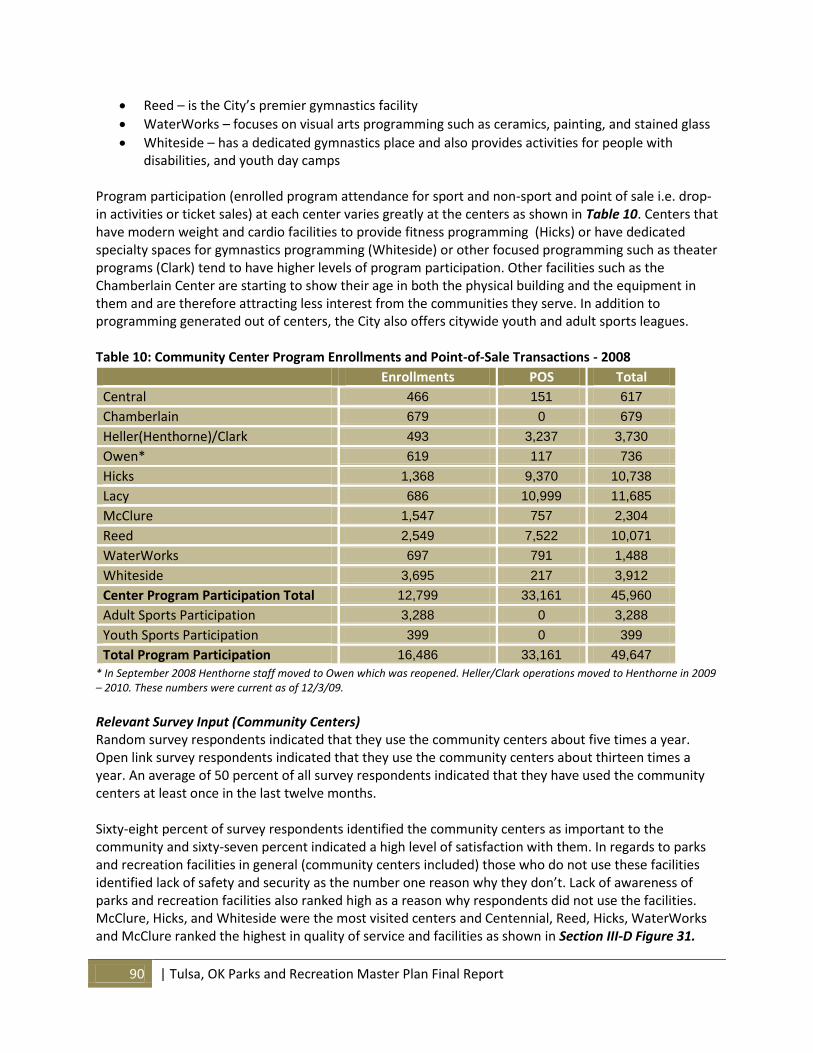
90 | Tulsa, OK Parks and Recreation Master Plan Final Report
Reed – is the City’s premier gymnastics facility
WaterWorks – focuses on visual arts programming such as ceramics, painting, and stained glass
Whiteside – has a dedicated gymnastics place and also provides activities for people with disabilities, and youth day camps
Program participation (enrolled program attendance for sport and non-sport and point of sale i.e. drop-in activities or ticket sales) at each center varies greatly at the centers as shown in Table 10. Centers that have modern weight and cardio facilities to provide fitness programming (Hicks) or have dedicated specialty spaces for gymnastics programming (Whiteside) or other focused programming such as theater programs (Clark) tend to have higher levels of program participation. Other facilities such as the Chamberlain Center are starting to show their age in both the physical building and the equipment in them and are therefore attracting less interest from the communities they serve. In addition to programming generated out of centers, the City also offers citywide youth and adult sports leagues.
Table 10: Community Center Program Enrollments and Point-of-Sale Transactions - 2008
Enrollments POS Total
Central 466 151 617
Chamberlain 679 0 679
Heller(Henthorne)/Clark 493 3,237 3,730
Owen* 619 117 736
Hicks 1,368 9,370 10,738
Lacy 686 10,999 11,685
McClure 1,547 757 2,304
Reed 2,549 7,522 10,071
WaterWorks 697 791 1,488
Whiteside 3,695 217 3,912
Center Program Participation Total 12,799 33,161 45,960
Adult Sports Participation 3,288 0 3,288
Youth Sports Participation 399 0 399
Total Program Participation 16,486 33,161 49,647
* In September 2008 Henthorne staff moved to Owen which was reopened. Heller/Clark operations moved to Henthorne in 2009 – 2010. These numbers were current as of 12/3/09.
Relevant Survey Input (Community Centers) Random survey respondents indicated that they use the community centers about five times a year. Open link survey respondents indicated that they use the community centers about thirteen times a year. An average of 50 percent of all survey respondents indicated that they have used the community centers at least once in the last twelve months. Sixty-eight percent of survey respondents identified the community centers as important to the community and sixty-seven percent indicated a high level of satisfaction with them. In regards to parks and recreation facilities in general (community centers included) those who do not use these facilities identified lack of safety and security as the number one reason why they don’t. Lack of awareness of parks and recreation facilities also ranked high as a reason why respondents did not use the facilities. McClure, Hicks, and Whiteside were the most visited centers and Centennial, Reed, Hicks, WaterWorks and McClure ranked the highest in quality of service and facilities as shown in Section III-D Figure 31.
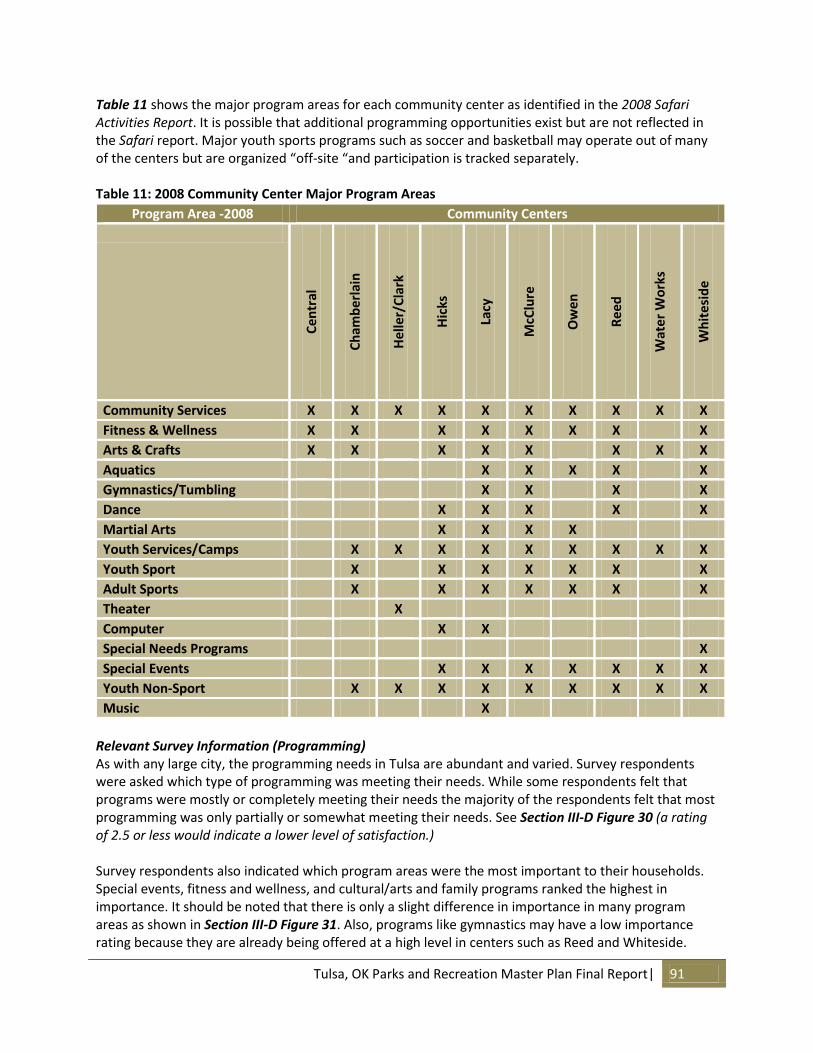
Tulsa, OK Parks and Recreation Master Plan Final Report| 91
Table 11 shows the major program areas for each community center as identified in the 2008 Safari Activities Report. It is possible that additional programming opportunities exist but are not reflected in the Safari report. Major youth sports programs such as soccer and basketball may operate out of many of the centers but are organized “off-site “and participation is tracked separately. Table 11: 2008 Community Center Major Program Areas
Program Area -2008 Community Centers
Cen
tral
Ch
amb
erla
in
Hel
ler/
Cla
rk
Hic
ks
Lacy
McC
lure
Ow
en
Re
ed
Wat
er
Wo
rks
Wh
ite
sid
e
Community Services X X X X X X X X X X
Fitness & Wellness X X X X X X X X
Arts & Crafts X X X X X X X X
Aquatics X X X X X
Gymnastics/Tumbling X X X X
Dance X X X X X
Martial Arts X X X X
Youth Services/Camps X X X X X X X X X
Youth Sport X X X X X X X
Adult Sports X X X X X X X
Theater X
Computer X X
Special Needs Programs X
Special Events X X X X X X X
Youth Non-Sport X X X X X X X X X
Music X
Relevant Survey Information (Programming) As with any large city, the programming needs in Tulsa are abundant and varied. Survey respondents were asked which type of programming was meeting their needs. While some respondents felt that programs were mostly or completely meeting their needs the majority of the respondents felt that most programming was only partially or somewhat meeting their needs. See Section III-D Figure 30 (a rating of 2.5 or less would indicate a lower level of satisfaction.)
Survey respondents also indicated which program areas were the most important to their households. Special events, fitness and wellness, and cultural/arts and family programs ranked the highest in importance. It should be noted that there is only a slight difference in importance in many program areas as shown in Section III-D Figure 31. Also, programs like gymnastics may have a low importance rating because they are already being offered at a high level in centers such as Reed and Whiteside.
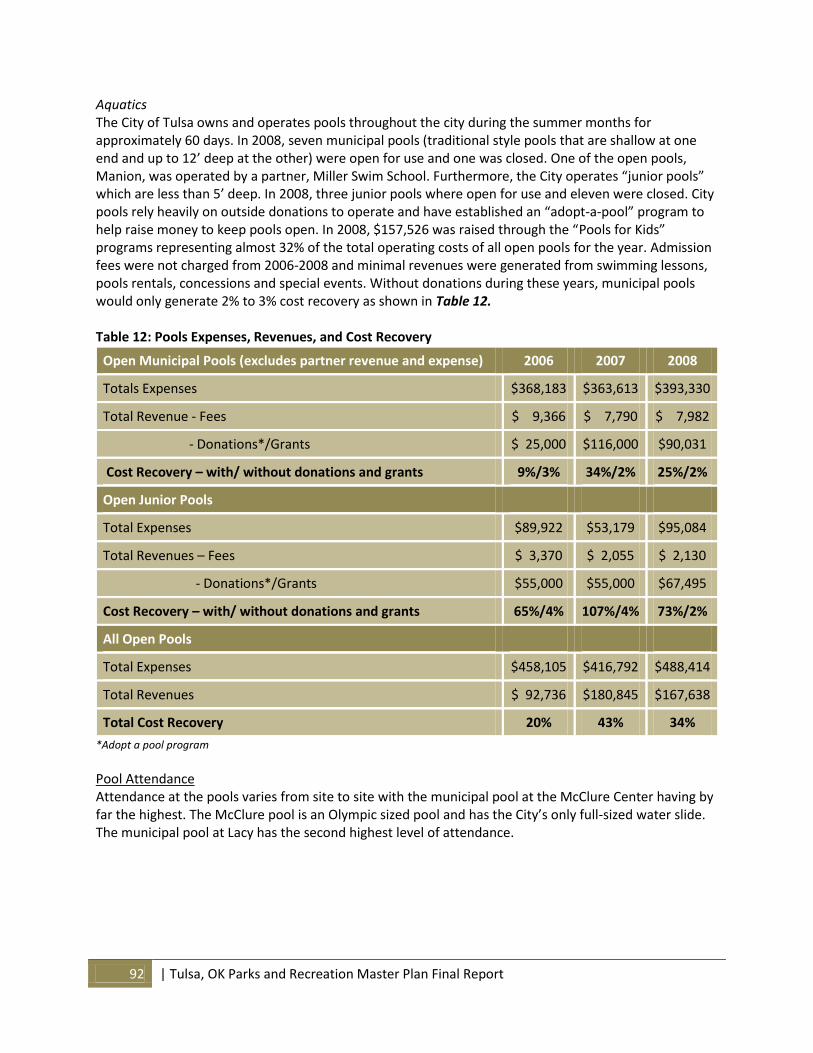
92 | Tulsa, OK Parks and Recreation Master Plan Final Report
Aquatics The City of Tulsa owns and operates pools throughout the city during the summer months for approximately 60 days. In 2008, seven municipal pools (traditional style pools that are shallow at one end and up to 12’ deep at the other) were open for use and one was closed. One of the open pools, Manion, was operated by a partner, Miller Swim School. Furthermore, the City operates “junior pools” which are less than 5’ deep. In 2008, three junior pools where open for use and eleven were closed. City pools rely heavily on outside donations to operate and have established an “adopt-a-pool” program to help raise money to keep pools open. In 2008, $157,526 was raised through the “Pools for Kids” programs representing almost 32% of the total operating costs of all open pools for the year. Admission fees were not charged from 2006-2008 and minimal revenues were generated from swimming lessons, pools rentals, concessions and special events. Without donations during these years, municipal pools would only generate 2% to 3% cost recovery as shown in Table 12. Table 12: Pools Expenses, Revenues, and Cost Recovery
Open Municipal Pools (excludes partner revenue and expense) 2006 2007 2008
Totals Expenses $368,183 $363,613 $393,330
Total Revenue - Fees $ 9,366 $ 7,790 $ 7,982
- Donations*/Grants $ 25,000 $116,000 $90,031
Cost Recovery – with/ without donations and grants 9%/3% 34%/2% 25%/2%
Open Junior Pools
Total Expenses $89,922 $53,179 $95,084
Total Revenues – Fees $ 3,370 $ 2,055 $ 2,130
- Donations*/Grants $55,000 $55,000 $67,495
Cost Recovery – with/ without donations and grants 65%/4% 107%/4% 73%/2%
All Open Pools
Total Expenses $458,105 $416,792 $488,414
Total Revenues $ 92,736 $180,845 $167,638
Total Cost Recovery 20% 43% 34%
*Adopt a pool program
Pool Attendance Attendance at the pools varies from site to site with the municipal pool at the McClure Center having by far the highest. The McClure pool is an Olympic sized pool and has the City’s only full-sized water slide. The municipal pool at Lacy has the second highest level of attendance.
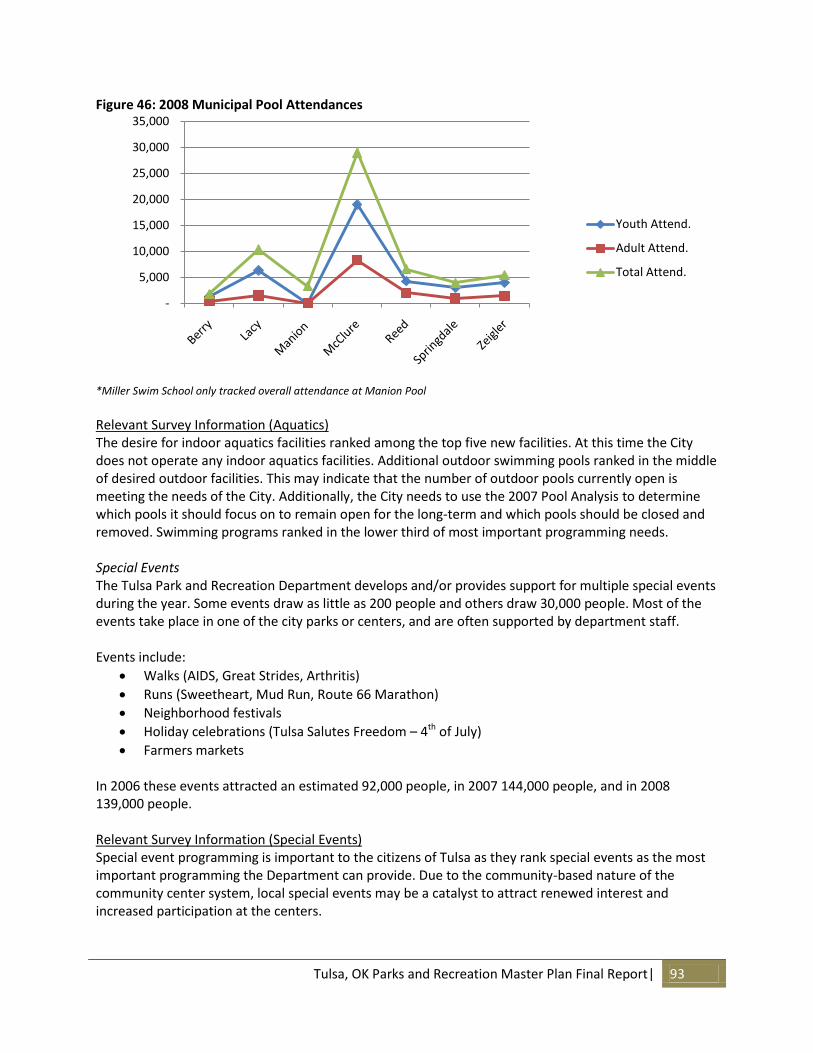
Tulsa, OK Parks and Recreation Master Plan Final Report| 93
Figure 46: 2008 Municipal Pool Attendances
*Miller Swim School only tracked overall attendance at Manion Pool
Relevant Survey Information (Aquatics) The desire for indoor aquatics facilities ranked among the top five new facilities. At this time the City does not operate any indoor aquatics facilities. Additional outdoor swimming pools ranked in the middle of desired outdoor facilities. This may indicate that the number of outdoor pools currently open is meeting the needs of the City. Additionally, the City needs to use the 2007 Pool Analysis to determine which pools it should focus on to remain open for the long-term and which pools should be closed and removed. Swimming programs ranked in the lower third of most important programming needs. Special Events The Tulsa Park and Recreation Department develops and/or provides support for multiple special events during the year. Some events draw as little as 200 people and others draw 30,000 people. Most of the events take place in one of the city parks or centers, and are often supported by department staff. Events include:
Walks (AIDS, Great Strides, Arthritis)
Runs (Sweetheart, Mud Run, Route 66 Marathon)
Neighborhood festivals
Holiday celebrations (Tulsa Salutes Freedom – 4th of July)
Farmers markets In 2006 these events attracted an estimated 92,000 people, in 2007 144,000 people, and in 2008 139,000 people. Relevant Survey Information (Special Events) Special event programming is important to the citizens of Tulsa as they rank special events as the most important programming the Department can provide. Due to the community-based nature of the community center system, local special events may be a catalyst to attract renewed interest and increased participation at the centers.
-
5,000
10,000
15,000
20,000
25,000
30,000
35,000
Youth Attend.
Adult Attend.
Total Attend.
94 | Tulsa, OK Parks and Recreation Master Plan Final Report
Nature and Environmental The Parks and Recreation Department operates the Mary K. Oxley Nature Center and the Redbud Valley Nature Preserve. The nature center and preserve are popular field trip destinations for the local schools. The nature facilities offer a variety of ongoing programs such as:
Junior Naturalists
Saturday Morning Bird Walks
Full Moon Walks
Astronomy Classes In 2007 the nature facilities had over 35,000 visitors combined. In 2008 the total number of visitors dropped to approximately 24,000. This decrease in visitors was primarily due to the Oxley Nature Center being closed for part of the year for remodeling. Attendance is expected to exceed 2007 levels in 2009. Relevant Survey Information (Nature & Environment) A total of 59% percent of survey respondents indicated they visited the nature facilities at least once in the past year. Overall 77% of survey respondents ranked the nature facilities as important to the community and 67% feel that the facilities are mostly or completely meeting their needs. Nature and environmental programming rank somewhat low in satisfaction as survey respondents were split between those who felt programming was meeting their needs and those who felt programming is not meeting their needs. Staff Input Staff feels strongly that their goal as a department is to play an important role in providing positive quality of life choices to the community. They strive to provide a safe environment in a well-maintained facility and promote that the community use their non-committed time in a positive manner through health and wellness, personal fitness, and life skills- particularly in regard to the city youth population. Staff feels that they provide a diversity of programs at an affordable price. They see opportunities in some cases to fill specialty program niches such as theater and gymnastics. Furthermore staff has the freedom to find new program opportunities that fit community needs. Excellent staff and collective teamwork helps retain quality programs and loyal customers in spite of ever-shrinking budgets. However, the age of the parks and recreation facilities, the closing of facilities, and funding cuts are starting to take a toll on the reputation of the Department. More modern suburban facilities are starting to draw residents away from the city facilities. Staff feels that there is a lack of focus when it comes to marketing, internal, and external communication, partnership development, and staff development. Staff realizes they cannot be all things to all people and look to concentrate on those things that provide the greatest community benefit such as:
Recreational youth/teen sports
Life skills/lifelong activities
Resources for social service programs
Introductory level non-sport activities for all ages
Swimming lessons, water safety, and leisure swimming
Drop-in opportunities
Rental opportunities
Tulsa, OK Parks and Recreation Master Plan Final Report| 95
B. GRASP® Inventory and Level of Service Inventory Existing Infrastructure The parks and recreation system can be thought of as an infrastructure that serves the health and well-being of people. This infrastructure is made up of parts that are combined in various ways to provide service. At the larger scale, a park, greenway, or indoor facility form the basic building blocks of the system. Each of these can be broken down as well into individual components, such as playing fields, interpretive features, or meeting rooms. For this project, a very complete and thorough database of amenities related to the provision of parks and recreation facilities in Tulsa was conducted. All of the individual components within the system were evaluated and recorded into the inventory dataset. This inventory and level of service (LOS) analysis includes all existing infrastructure as well as facilities and/or improvements that are planned and funded at this time. The inventory was conducted in the Spring of 2009 and includes Tulsa Parks facilities, as well as facilities belonging to several alternative providers. Alternative providers include elementary and middle schools, county parks, and YMCA’s. Alternative provider inventory data was collected by several methods, including contacting the agency, using GIS aerial photography, and consulting directories, or it was provided by Tulsa Parks staff. The inventory process was conducted by the consulting team, and included visits to almost all of the sites. Information on a few sites was provided by Tulsa Parks staff, who also reviewed the final dataset to verify its completeness and accuracy. The purpose of the inventory was to get as complete and accurate a picture as possible of the recreational opportunities available to the residents of Tulsa. Towards this end, information was collected on the locations of indoor and outdoor facilities described above. The information includes the location of the facilities and the components at each location. Components are generally described as amenities provided for the purpose of a recreational experience for visitors. This includes fields, courts, and other amenities used for organized activities, as well as open lawns, natural areas, and features that offer passive or non-programmed recreational experiences. The information collected includes site boundaries for Tulsa park sites, as obtained from the City’s Geographic Information System (GIS). Also included are aerial photographs of each site, on which all of the existing components are identified. The photos are linked to the GIS, as are the components shown on the photos. Each component was evaluated on its functionality, based on whether or not it met expectations for its primary intended purpose at its specific location. For each Department-owned site or facility, an assessment was also made of factors that enhance or detract from the functionality of the components. These are “comfort and convenience” elements, including the availability of adequate shade, seating, parking, restrooms, etc. The overall design and ambience of the site or facility was also assessed, including such things as good design, pleasing surroundings, etc.
96 | Tulsa, OK Parks and Recreation Master Plan Final Report
The Park System Tulsa Parks has over 6,000 acres of parkland. According to the inventory, Tulsa’s system includes 135 park locations and 21 indoor facilities. Among these are unique parks such as Woodward Park, a beautiful and historic passive urban park that is home to the city’s botanical gardens, and Mohawk Park, the third largest municipal park in the United States.8 Outdoor Facilities Tulsa’s parks offer a wide variety of features and activities. These range from undeveloped parks with natural stands of forest to very urban parks such as Plaza of the Americas and Cathedral Square, and from numerous small neighborhood parks with a playground and picnic shelter to the larger multipurpose parks like McClure and Hunter. There are also a variety of specialty parks like the Carl Smith Sports Complex, and unique one-of-a-kind parks like Swan Lake, and Creek Council Oak. Tulsa has several traditional picturesque parks like Owen and Woodward, but the typical Tulsa park is representative of the latter half of the 20th century, when the emphasis was on providing places for kids to play and things for families to do. The typical park in Tulsa has a playground, picnic shelter, tennis court, spray pad, and open areas of grass punctuated with shade trees. These parks are designed to serve the neighborhood around them, which is typically about one square mile in size. A great number of them appear to have been constructed within a period of about thirty years, between the 1950’s and 1980’s. Because of this, they are all aging at about the same rate, and are reaching a critical point in their life cycle where facilities need refurbishing. In addition, Tulsa was hit by a severe ice storm in recent years and many of the trees within its parks were lost or damaged. For these reasons, many of Tulsa’s parks are ripe for revitalization. They are a valuable resource that deserves to be brought into the new century. Indoor Facilities Tulsa has a number of indoor facilities, ranging from small community centers to the marvelous Waterworks Art Center. Like its parks, Tulsa’s indoor facilities are products of the last century and are at the stage where they could stand to be brought up to meet current needs and reflect trends. However, they provide the basis for a distributed system of indoor spaces to meet the programming needs of residents. Trails For a city that covers such a large area, Tulsa’s trails are an impressive start towards a well-connected trail network. Primary north/south legs run along the river and parallel to Highway 169. These are connected into a nearly complete loop along Highway 169 in the south and from downtown to Mohawk Park along the Highway 75 corridor on the north. Extensions branch out from this loop towards the north, west, and southeast. While there are large parts of the city without any trails, the ones that currently exist are sensibly placed and well connected to one another, allowing them to form a good basis for future expansion and connectivity.
8 http://www.tulsazoo.org/general.cfm?id=39
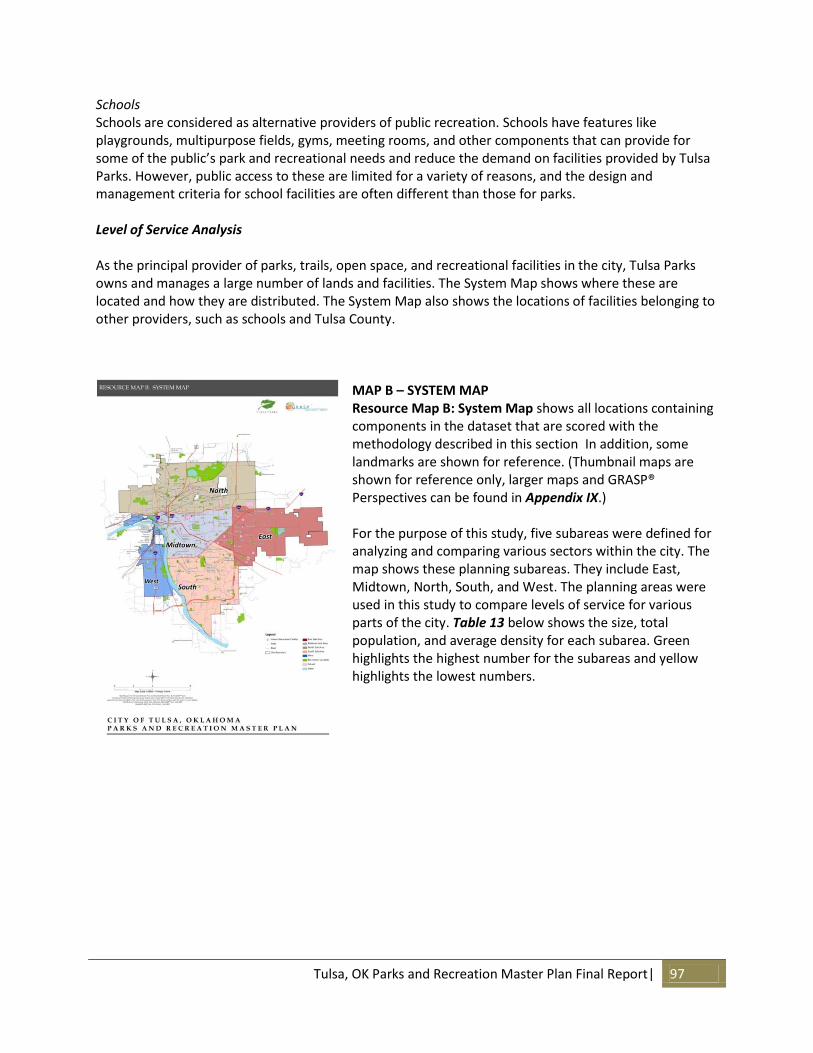
Tulsa, OK Parks and Recreation Master Plan Final Report| 97
Schools Schools are considered as alternative providers of public recreation. Schools have features like playgrounds, multipurpose fields, gyms, meeting rooms, and other components that can provide for some of the public’s park and recreational needs and reduce the demand on facilities provided by Tulsa Parks. However, public access to these are limited for a variety of reasons, and the design and management criteria for school facilities are often different than those for parks. Level of Service Analysis As the principal provider of parks, trails, open space, and recreational facilities in the city, Tulsa Parks owns and manages a large number of lands and facilities. The System Map shows where these are located and how they are distributed. The System Map also shows the locations of facilities belonging to other providers, such as schools and Tulsa County.
MAP B – SYSTEM MAP Resource Map B: System Map shows all locations containing components in the dataset that are scored with the methodology described in this section In addition, some landmarks are shown for reference. (Thumbnail maps are shown for reference only, larger maps and GRASP® Perspectives can be found in Appendix IX.) For the purpose of this study, five subareas were defined for analyzing and comparing various sectors within the city. The map shows these planning subareas. They include East, Midtown, North, South, and West. The planning areas were used in this study to compare levels of service for various parts of the city. Table 13 below shows the size, total population, and average density for each subarea. Green highlights the highest number for the subareas and yellow highlights the lowest numbers.
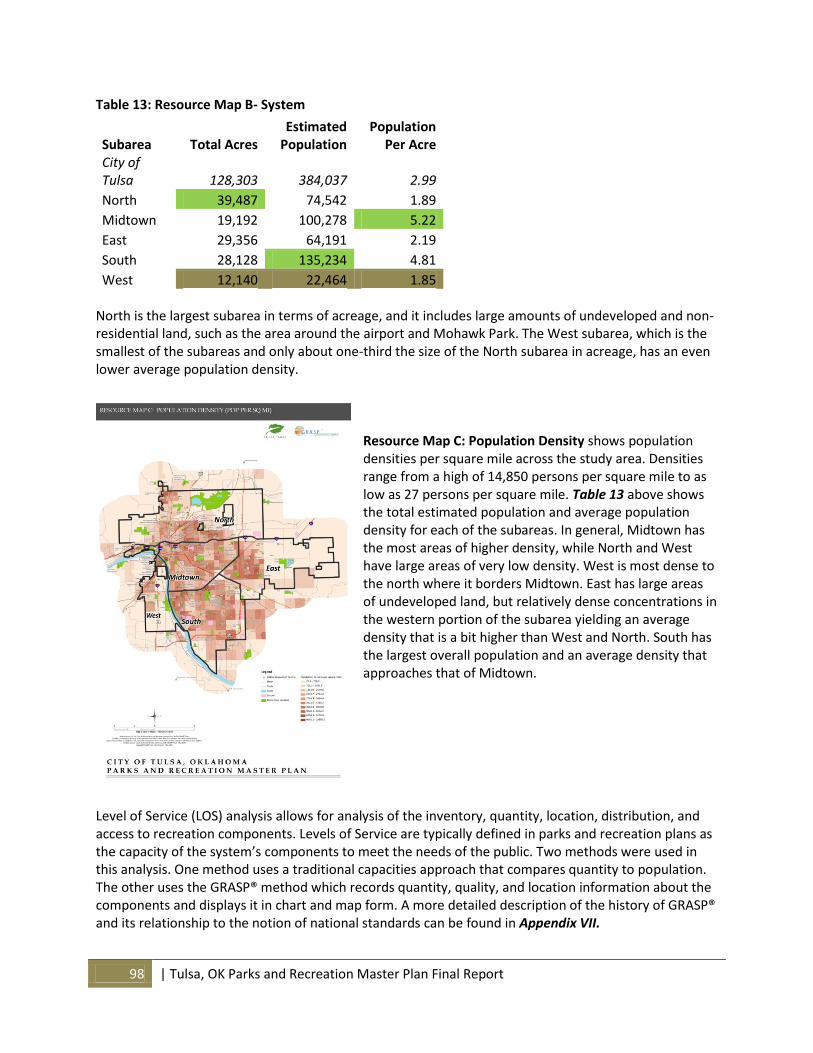
98 | Tulsa, OK Parks and Recreation Master Plan Final Report
Table 13: Resource Map B- System
Total Acres Estimated
Population Population
Per Acre Subarea City of Tulsa 128,303 384,037 2.99
North 39,487 74,542 1.89
Midtown 19,192 100,278 5.22
East 29,356 64,191 2.19
South 28,128 135,234 4.81
West 12,140 22,464 1.85 North is the largest subarea in terms of acreage, and it includes large amounts of undeveloped and non-residential land, such as the area around the airport and Mohawk Park. The West subarea, which is the smallest of the subareas and only about one-third the size of the North subarea in acreage, has an even lower average population density.
Resource Map C: Population Density shows population densities per square mile across the study area. Densities range from a high of 14,850 persons per square mile to as low as 27 persons per square mile. Table 13 above shows the total estimated population and average population density for each of the subareas. In general, Midtown has the most areas of higher density, while North and West have large areas of very low density. West is most dense to the north where it borders Midtown. East has large areas of undeveloped land, but relatively dense concentrations in the western portion of the subarea yielding an average density that is a bit higher than West and North. South has the largest overall population and an average density that approaches that of Midtown.
Level of Service (LOS) analysis allows for analysis of the inventory, quantity, location, distribution, and access to recreation components. Levels of Service are typically defined in parks and recreation plans as the capacity of the system’s components to meet the needs of the public. Two methods were used in this analysis. One method uses a traditional capacities approach that compares quantity to population. The other uses the GRASP® method which records quantity, quality, and location information about the components and displays it in chart and map form. A more detailed description of the history of GRASP® and its relationship to the notion of national standards can be found in Appendix VII.
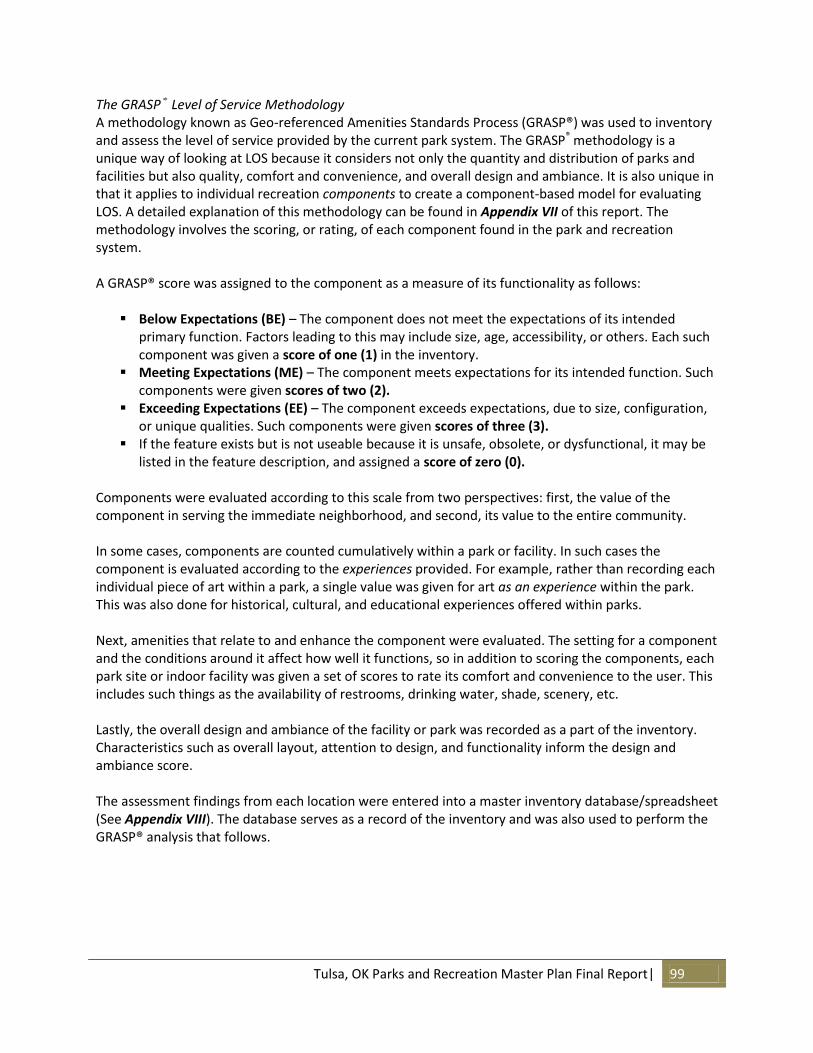
Tulsa, OK Parks and Recreation Master Plan Final Report| 99
The GRASP® Level of Service Methodology A methodology known as Geo-referenced Amenities Standards Process (GRASP®) was used to inventory and assess the level of service provided by the current park system. The GRASP® methodology is a unique way of looking at LOS because it considers not only the quantity and distribution of parks and facilities but also quality, comfort and convenience, and overall design and ambiance. It is also unique in that it applies to individual recreation components to create a component-based model for evaluating LOS. A detailed explanation of this methodology can be found in Appendix VII of this report. The methodology involves the scoring, or rating, of each component found in the park and recreation system. A GRASP® score was assigned to the component as a measure of its functionality as follows:
Below Expectations (BE) – The component does not meet the expectations of its intended primary function. Factors leading to this may include size, age, accessibility, or others. Each such component was given a score of one (1) in the inventory.
Meeting Expectations (ME) – The component meets expectations for its intended function. Such components were given scores of two (2).
Exceeding Expectations (EE) – The component exceeds expectations, due to size, configuration, or unique qualities. Such components were given scores of three (3).
If the feature exists but is not useable because it is unsafe, obsolete, or dysfunctional, it may be listed in the feature description, and assigned a score of zero (0).
Components were evaluated according to this scale from two perspectives: first, the value of the component in serving the immediate neighborhood, and second, its value to the entire community. In some cases, components are counted cumulatively within a park or facility. In such cases the component is evaluated according to the experiences provided. For example, rather than recording each individual piece of art within a park, a single value was given for art as an experience within the park. This was also done for historical, cultural, and educational experiences offered within parks. Next, amenities that relate to and enhance the component were evaluated. The setting for a component and the conditions around it affect how well it functions, so in addition to scoring the components, each park site or indoor facility was given a set of scores to rate its comfort and convenience to the user. This includes such things as the availability of restrooms, drinking water, shade, scenery, etc. Lastly, the overall design and ambiance of the facility or park was recorded as a part of the inventory. Characteristics such as overall layout, attention to design, and functionality inform the design and ambiance score. The assessment findings from each location were entered into a master inventory database/spreadsheet (See Appendix VIII). The database serves as a record of the inventory and was also used to perform the GRASP® analysis that follows.
100 | Tulsa, OK Parks and Recreation Master Plan Final Report
After scoring each component as outlined in the inventory description, GIS software was used to create graphic representations that allow for easy visual and numerical analysis of the recreation system. Some of the representations show raw data collected through the inventory process or received from other sources. These are referred to as Resource Maps. Other representations emerge from the processing of data within the GIS using composite values analysis. These analyses can look at both general and specific aspects of the system. Each of these representations is called a GRASP® Perspective. The following maps and perspectives were prepared for this report and can be found in Appendix IX.
Resource Map A: Regional Context Resource Map B: System Map Resource Map C: Population Density Perspective A: Neighborhood Access to All Components Perspective B: Walkable Access to All Components Perspective C: Neighborhood Access to Indoor Facilities Perspective D: Neighborhood Access to Trails Perspective D2: Trailshed Analysis Perspective E: Neighborhood Access to All Aquatic Components
For each GRASP® Perspective, each inventoried component has its GRASP® score applied to a service area, (or buffer), based on a radius from the component. The Neighborhood Composite Perspective applies the components’ qualitative score to both one mile and one third mile buffers. One-mile buffers represent a distance from which convenient access to the component can be achieved by normal means such as driving or bicycling. The one-third mile buffer shows the distance that a resident can reasonably walk in 10 minutes. Scores are doubled within the one-third mile buffer to reflect the added accessibility of walking, since almost anyone can reach the location on their own by walking, even if they don’t drive or ride a bicycle. When buffers with associated scores are plotted on a map, a picture emerges that represents the cumulative LOS. Where buffers for multiple components overlap, a darker shade results and indicates locations that are “served” by a combination of more components and/or higher quality ones. In other words, where there are darker shades, the level of service is higher for that particular Perspective. It is important to note that the shade overlaying any given point on the map represents the cumulative value offered by the surrounding park system to an individual situated in that specific location, rather than the service being provided by components at that location to the areas around it. GRASP® Target Scores Analysis For some of the GRASP® Perspectives, the buffers and associated scores are presented in two ways – with infinite tone ranges (orange) and in two tones based on target values (purple and yellow). The infinite tone map for each Perspective shows the GRASP® buffers with a tone range that portrays the nuances of service that is being provided to the community. This makes it possible to see the differences in services provided by parks and individual components. The complete Perspective series is set to the same tone scale so the different Perspectives can be compared side-by-side.
Tulsa, OK Parks and Recreation Master Plan Final Report| 101
The target scores maps show GRASP® score ranges bracketed into categories that represent the following: No Service, Service Below Target Minimum Score or Service At or Above Target Minimum Score. Target scores represent the score that would be achieved if a determined set of components, along with the appropriate modifiers, were accessible from a given location. The combination of components is based on the set of needs being evaluated, and varies for each Perspective. Unless otherwise noted, the target score is appropriate for a typical developed suburban residential area. For this reason, it should not be implied that all parts of the city should attain this score. In some areas, no service or a level of service below the target score is completely appropriate. Areas with yellow shading on the target values maps have at least some service (GRASP® score of greater than zero), but the service score is below the target. Areas with purple shading have service scores that meet or exceed the target value. Areas without shading have a service score of zero. Different target score breaks were used for each Perspective, depending on what is being measured. For this reason, these maps cannot be compared but are specific to each Perspective. The Maps and Perspective section below reviews the Perspectives and highlights where higher and lower levels of service are being provided from a given set of components. In addition to Tulsa Parks, some alternative providers have been included in the Level of Service (LOS) computations as described earlier and the remaining providers are shown for reference. Alternative providers included in the LOS analysis include schools, Tulsa County, and YMCA’s. GRASP® Scoring for Trails Some trails serve as independent parks or greenways, and are recreational destinations within themselves. Others serve as individual components within another park. For purposes of assigning scores, the former type of trail receives its own set of scores for modifiers and design and ambiance. Trails within other parks take on the modifiers and design and ambiance of the larger parks in which they reside. Trails are assumed to consist of three (3) components including one active component, one passive component, and the parcel itself. Scoring of LOS Alternative Providers Alternative providers included in the inventory include schools, Tulsa County Parks, and YMCA. For each, the GRASP® scoring system is used and assumptions are made based on the typical condition and accessibility of the component. The information below describes the scoring system and explains the assumptions that were made to arrive at the GRASP® score. For the purposes of this study, a list of public, private, and parochial schools was obtained and reviewed by staff to provide a reasonable dataset of schools that offer some park and recreational value to the public. While no specific listing of components at each school was generated, it has been assumed that each school has two (2) components (playground, multi-purpose field, etc.) and that like the parks in this study; the land on which it is located has a basic value. These two components and the parcel are assumed to be meeting the expectations (scores 2) of the community in the same way that park components meet expectations. The other parts to the GRASP® score relate to the comfort and design of the location, and are called modifiers. The aesthetic and recreational standards for schoolyards are typically lower than those for parks, so modifiers at schools are generally assigned a value of below expectations (score 1) even if they meet the expectations of the school.
102 | Tulsa, OK Parks and Recreation Master Plan Final Report
The final component in the GRASP® score is the ownership modifier. This is a percentage that is applied to the score that relates to the general public’s ability to access the facility. For schools it is assumed that the grounds are accessible for drop-in use roughly half of the time. The rest of the time the school is in session and therefore not available. This translates into the following formula for calculating the GRASP® score:
(Component number + Parcel) x Component score x Comfort x Design x ownership = GRASP® score or (2 +1) x 2 x 1.1 x 1 x 50% = 3.3
Therefore, all schools receive the same GRASP® score of 3.3. In the GRASP® Perspectives that follow, that value has been assigned to the location where each school is found and buffered accordingly. This value also is included in computations for the GRASP® Indices that are calculated along with each Perspective. However, since the specific components found at each school have not been identified, any components found at schools are not included in the inventory of components for the dataset. As a result, they are not included in any tables, calculations, or other references that are based on the quantities or values of specific types of components that may occur at schools. GRASP® scoring system: Component Below expectations = 1 Meets expectations = 2 Exceeds expectations = 3 Comfort and convenience Below expectations = 1.1 Meets expectations = 1.2 Exceeds expectations = 1.3 Design and Ambiance Below expectations = 1 Meets expectations = 2 Exceeds expectations = 3 Listed below is a table that summarizes the alternative provider inventory included in the LOS analysis.
NA= Not applicable or data unavailable
Provider Indoor Facilities Outdoor Facilities
Schools NA 129
City of Tulsa - PW NA 6
River Parks NA 9
YMCA / YWCA 12 NA
Other NA 6
Tulsa, OK Parks and Recreation Master Plan Final Report| 103
Comparison of Perspective Results for Other Communities The following table is a summary of analysis results from some other communities. The communities are not intended to be similar to Tulsa, but instead to show what the ranges of possibility are for various analyses that have been performed for this study. The values in the table are intended to provide a context and comparison of the GRASP® analysis, not to imply a set of standards. Results of this analysis will vary from community to community due to a number of reasons, including underlying geography, local expectations, alternative providers, and other conditions. It is important to keep in mind that Tulsa is different from many of these communities in that it covers a large area and has portions that range from fairly urbanized to very rural. The area inside the city limits according to the GIS is 128,303 acres in size. (A larger study area that encompasses unincorporated in-holdings within the city limits as well as reaching outside the city limits to capture some indoor facilities found in the dataset was also considered. It takes in a total of 228,080 acres, but does not include a comprehensive inventory of other facilities within it, so should be used for informational purposes only.) Tulsa has a relatively high coverage of service – 87% of the city by area has at least some service. It should be apparent from this table that the service available to residents differs from one community to another based on many things, including the size of parks, where they are located, and how intensely they are developed. There is no perfect model for this, and each community’s park system is the result of many decisions made over long periods of time. The table allows for a better understanding of what some of the differences are and how service can be measured and analyzed many different ways. The results of such analyses can then be compared to other information, such as needs assessments, demographics, etc. to plan for the best and most appropriate system for Tulsa.
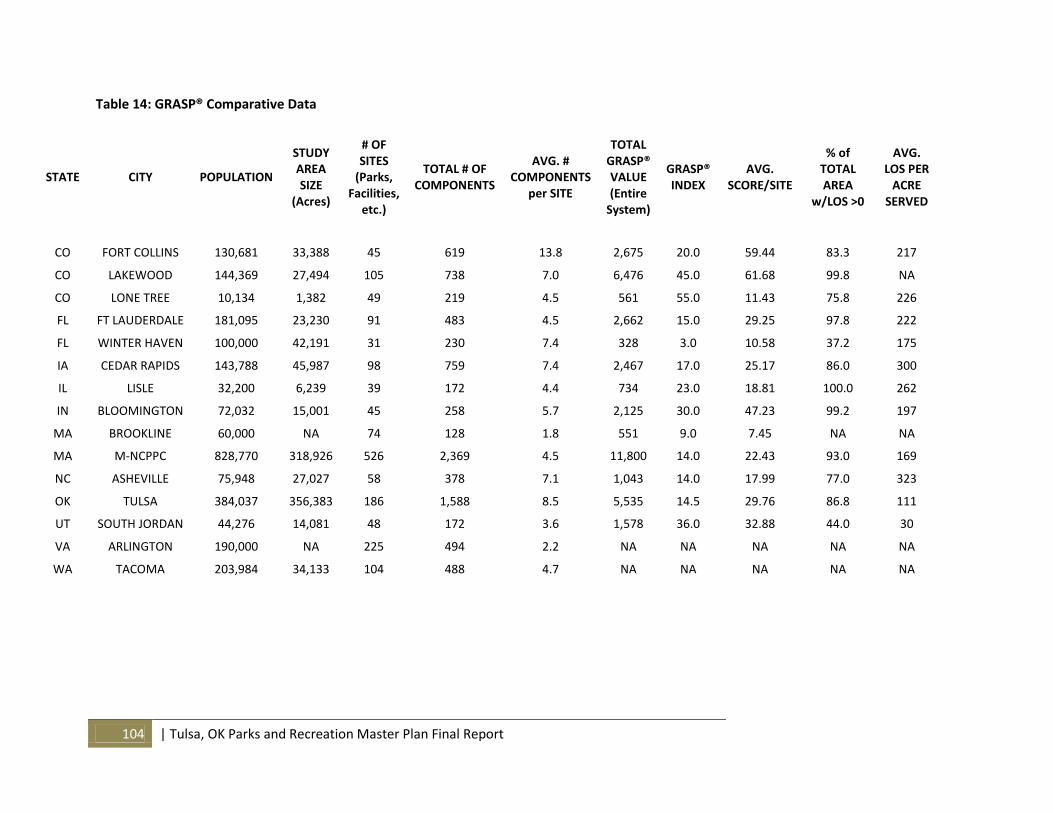
104 | Tulsa, OK Parks and Recreation Master Plan Final Report
Table 14: GRASP® Comparative Data
STATE CITY POPULATION
STUDY AREA SIZE
(Acres)
# OF SITES
(Parks, Facilities,
etc.)
TOTAL # OF COMPONENTS
AVG. # COMPONENTS
per SITE
TOTAL GRASP® VALUE (Entire
System)
GRASP® INDEX
AVG. SCORE/SITE
% of TOTAL AREA
w/LOS >0
AVG. LOS PER
ACRE SERVED
CO FORT COLLINS 130,681 33,388 45 619 13.8 2,675 20.0 59.44 83.3 217
CO LAKEWOOD 144,369 27,494 105 738 7.0 6,476 45.0 61.68 99.8 NA
CO LONE TREE 10,134 1,382 49 219 4.5 561 55.0 11.43 75.8 226
FL FT LAUDERDALE 181,095 23,230 91 483 4.5 2,662 15.0 29.25 97.8 222
FL WINTER HAVEN 100,000 42,191 31 230 7.4 328 3.0 10.58 37.2 175
IA CEDAR RAPIDS 143,788 45,987 98 759 7.4 2,467 17.0 25.17 86.0 300
IL LISLE 32,200 6,239 39 172 4.4 734 23.0 18.81 100.0 262
IN BLOOMINGTON 72,032 15,001 45 258 5.7 2,125 30.0 47.23 99.2 197
MA BROOKLINE 60,000 NA 74 128 1.8 551 9.0 7.45 NA NA
MA M-NCPPC 828,770 318,926 526 2,369 4.5 11,800 14.0 22.43 93.0 169
NC ASHEVILLE 75,948 27,027 58 378 7.1 1,043 14.0 17.99 77.0 323
OK TULSA 384,037 356,383 186 1,588 8.5 5,535 14.5 29.76 86.8 111
UT SOUTH JORDAN 44,276 14,081 48 172 3.6 1,578 36.0 32.88 44.0 30
VA ARLINGTON 190,000 NA 225 494 2.2 NA NA NA NA NA
WA TACOMA 203,984 34,133 104 488 4.7 NA NA NA NA NA
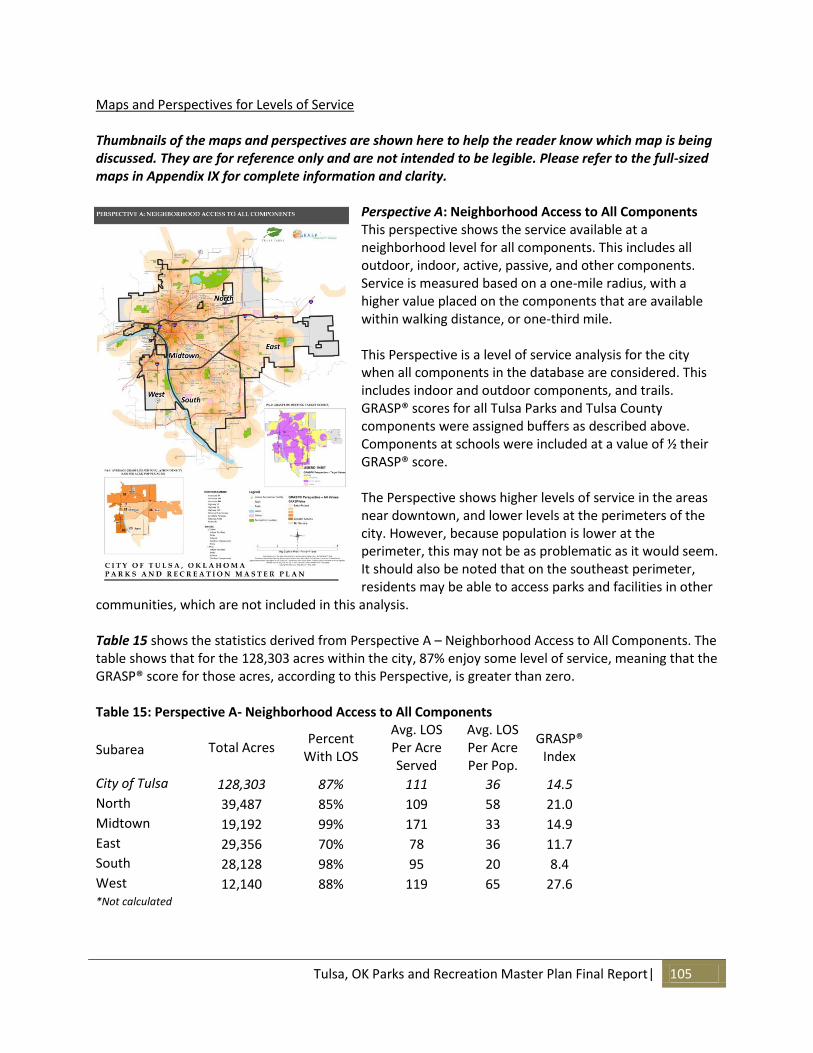
Tulsa, OK Parks and Recreation Master Plan Final Report| 105
Maps and Perspectives for Levels of Service Thumbnails of the maps and perspectives are shown here to help the reader know which map is being discussed. They are for reference only and are not intended to be legible. Please refer to the full-sized maps in Appendix IX for complete information and clarity.
Perspective A: Neighborhood Access to All Components This perspective shows the service available at a neighborhood level for all components. This includes all outdoor, indoor, active, passive, and other components. Service is measured based on a one-mile radius, with a higher value placed on the components that are available within walking distance, or one-third mile. This Perspective is a level of service analysis for the city when all components in the database are considered. This includes indoor and outdoor components, and trails. GRASP® scores for all Tulsa Parks and Tulsa County components were assigned buffers as described above. Components at schools were included at a value of ½ their GRASP® score. The Perspective shows higher levels of service in the areas near downtown, and lower levels at the perimeters of the city. However, because population is lower at the perimeter, this may not be as problematic as it would seem. It should also be noted that on the southeast perimeter, residents may be able to access parks and facilities in other
communities, which are not included in this analysis. Table 15 shows the statistics derived from Perspective A – Neighborhood Access to All Components. The table shows that for the 128,303 acres within the city, 87% enjoy some level of service, meaning that the GRASP® score for those acres, according to this Perspective, is greater than zero. Table 15: Perspective A- Neighborhood Access to All Components
Total Acres Percent
With LOS
Avg. LOS Per Acre Served
Avg. LOS Per Acre Per Pop.
GRASP® Index Subarea
City of Tulsa 128,303 87% 111 36 14.5
North 39,487 85% 109 58 21.0
Midtown 19,192 99% 171 33 14.9
East 29,356 70% 78 36 11.7
South 28,128 98% 95 20 8.4
West 12,140 88% 119 65 27.6 *Not calculated
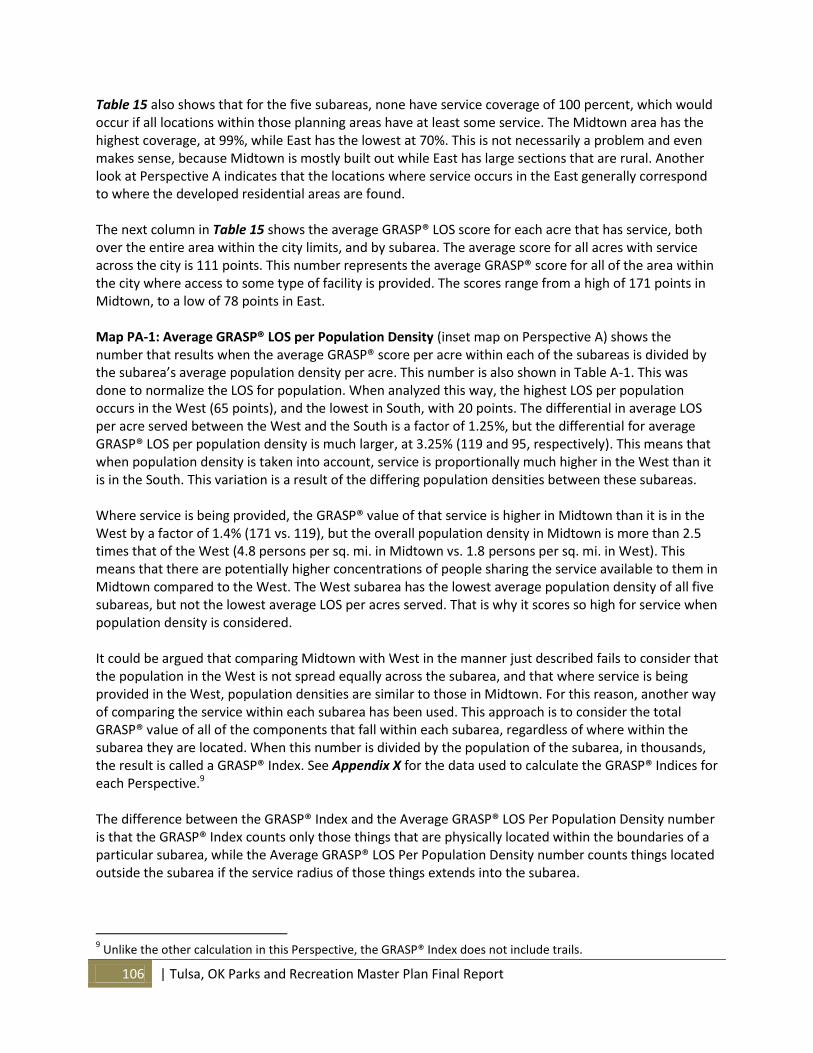
106 | Tulsa, OK Parks and Recreation Master Plan Final Report
Table 15 also shows that for the five subareas, none have service coverage of 100 percent, which would occur if all locations within those planning areas have at least some service. The Midtown area has the highest coverage, at 99%, while East has the lowest at 70%. This is not necessarily a problem and even makes sense, because Midtown is mostly built out while East has large sections that are rural. Another look at Perspective A indicates that the locations where service occurs in the East generally correspond to where the developed residential areas are found. The next column in Table 15 shows the average GRASP® LOS score for each acre that has service, both over the entire area within the city limits, and by subarea. The average score for all acres with service across the city is 111 points. This number represents the average GRASP® score for all of the area within the city where access to some type of facility is provided. The scores range from a high of 171 points in Midtown, to a low of 78 points in East. Map PA-1: Average GRASP® LOS per Population Density (inset map on Perspective A) shows the number that results when the average GRASP® score per acre within each of the subareas is divided by the subarea’s average population density per acre. This number is also shown in Table A-1. This was done to normalize the LOS for population. When analyzed this way, the highest LOS per population occurs in the West (65 points), and the lowest in South, with 20 points. The differential in average LOS per acre served between the West and the South is a factor of 1.25%, but the differential for average GRASP® LOS per population density is much larger, at 3.25% (119 and 95, respectively). This means that when population density is taken into account, service is proportionally much higher in the West than it is in the South. This variation is a result of the differing population densities between these subareas. Where service is being provided, the GRASP® value of that service is higher in Midtown than it is in the West by a factor of 1.4% (171 vs. 119), but the overall population density in Midtown is more than 2.5 times that of the West (4.8 persons per sq. mi. in Midtown vs. 1.8 persons per sq. mi. in West). This means that there are potentially higher concentrations of people sharing the service available to them in Midtown compared to the West. The West subarea has the lowest average population density of all five subareas, but not the lowest average LOS per acres served. That is why it scores so high for service when population density is considered. It could be argued that comparing Midtown with West in the manner just described fails to consider that the population in the West is not spread equally across the subarea, and that where service is being provided in the West, population densities are similar to those in Midtown. For this reason, another way of comparing the service within each subarea has been used. This approach is to consider the total GRASP® value of all of the components that fall within each subarea, regardless of where within the subarea they are located. When this number is divided by the population of the subarea, in thousands, the result is called a GRASP® Index. See Appendix X for the data used to calculate the GRASP® Indices for each Perspective.9 The difference between the GRASP® Index and the Average GRASP® LOS Per Population Density number is that the GRASP® Index counts only those things that are physically located within the boundaries of a particular subarea, while the Average GRASP® LOS Per Population Density number counts things located outside the subarea if the service radius of those things extends into the subarea.
9 Unlike the other calculation in this Perspective, the GRASP® Index does not include trails.
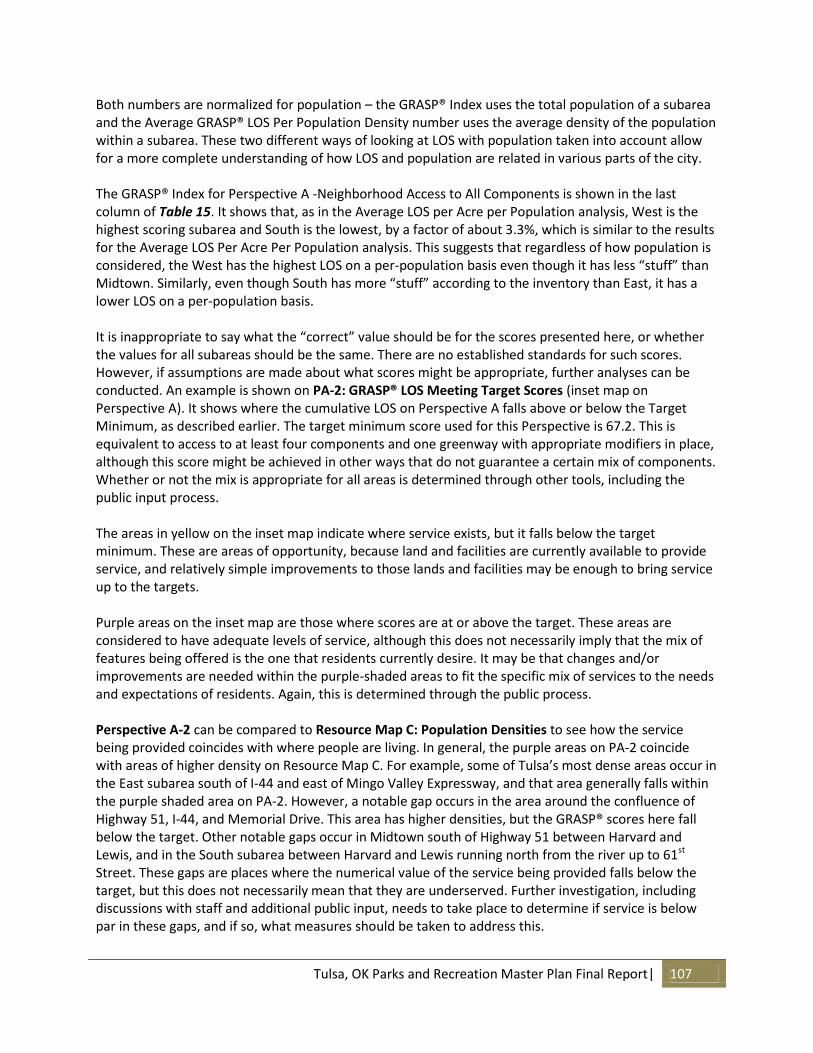
Tulsa, OK Parks and Recreation Master Plan Final Report| 107
Both numbers are normalized for population – the GRASP® Index uses the total population of a subarea and the Average GRASP® LOS Per Population Density number uses the average density of the population within a subarea. These two different ways of looking at LOS with population taken into account allow for a more complete understanding of how LOS and population are related in various parts of the city. The GRASP® Index for Perspective A -Neighborhood Access to All Components is shown in the last column of Table 15. It shows that, as in the Average LOS per Acre per Population analysis, West is the highest scoring subarea and South is the lowest, by a factor of about 3.3%, which is similar to the results for the Average LOS Per Acre Per Population analysis. This suggests that regardless of how population is considered, the West has the highest LOS on a per-population basis even though it has less “stuff” than Midtown. Similarly, even though South has more “stuff” according to the inventory than East, it has a lower LOS on a per-population basis. It is inappropriate to say what the “correct” value should be for the scores presented here, or whether the values for all subareas should be the same. There are no established standards for such scores. However, if assumptions are made about what scores might be appropriate, further analyses can be conducted. An example is shown on PA-2: GRASP® LOS Meeting Target Scores (inset map on Perspective A). It shows where the cumulative LOS on Perspective A falls above or below the Target Minimum, as described earlier. The target minimum score used for this Perspective is 67.2. This is equivalent to access to at least four components and one greenway with appropriate modifiers in place, although this score might be achieved in other ways that do not guarantee a certain mix of components. Whether or not the mix is appropriate for all areas is determined through other tools, including the public input process. The areas in yellow on the inset map indicate where service exists, but it falls below the target minimum. These are areas of opportunity, because land and facilities are currently available to provide service, and relatively simple improvements to those lands and facilities may be enough to bring service up to the targets. Purple areas on the inset map are those where scores are at or above the target. These areas are considered to have adequate levels of service, although this does not necessarily imply that the mix of features being offered is the one that residents currently desire. It may be that changes and/or improvements are needed within the purple-shaded areas to fit the specific mix of services to the needs and expectations of residents. Again, this is determined through the public process. Perspective A-2 can be compared to Resource Map C: Population Densities to see how the service being provided coincides with where people are living. In general, the purple areas on PA-2 coincide with areas of higher density on Resource Map C. For example, some of Tulsa’s most dense areas occur in the East subarea south of I-44 and east of Mingo Valley Expressway, and that area generally falls within the purple shaded area on PA-2. However, a notable gap occurs in the area around the confluence of Highway 51, I-44, and Memorial Drive. This area has higher densities, but the GRASP® scores here fall below the target. Other notable gaps occur in Midtown south of Highway 51 between Harvard and Lewis, and in the South subarea between Harvard and Lewis running north from the river up to 61st Street. These gaps are places where the numerical value of the service being provided falls below the target, but this does not necessarily mean that they are underserved. Further investigation, including discussions with staff and additional public input, needs to take place to determine if service is below par in these gaps, and if so, what measures should be taken to address this.
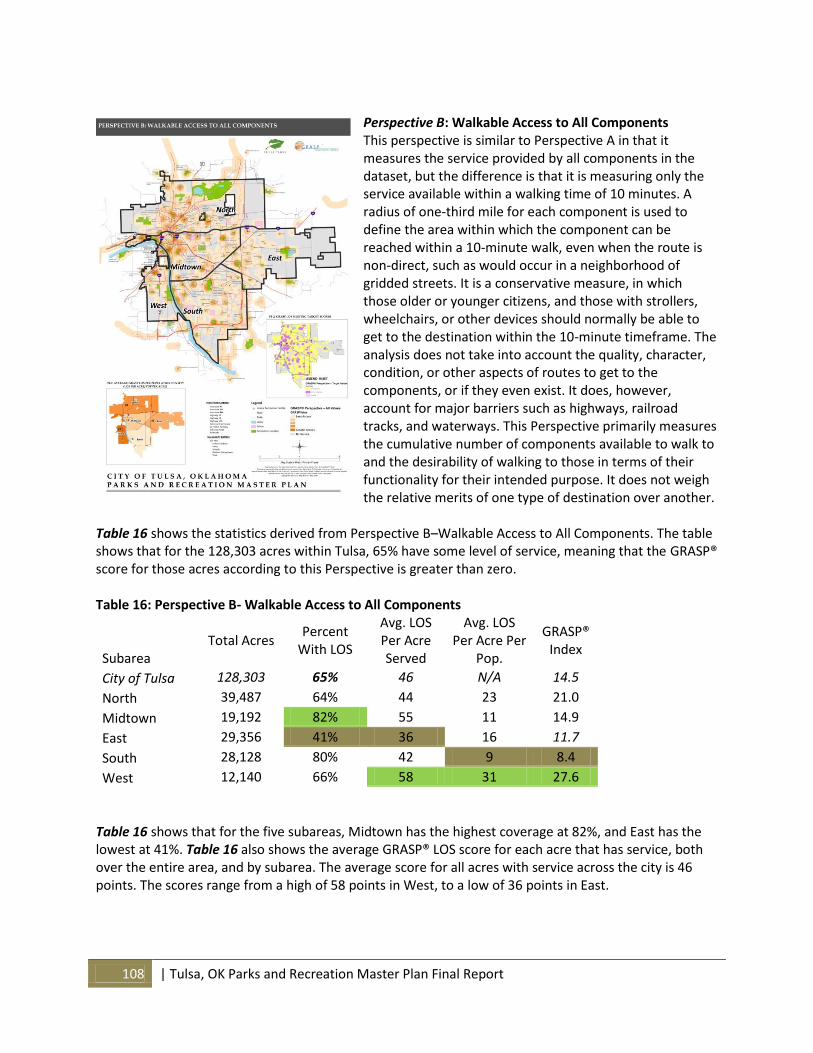
108 | Tulsa, OK Parks and Recreation Master Plan Final Report
Perspective B: Walkable Access to All Components This perspective is similar to Perspective A in that it measures the service provided by all components in the dataset, but the difference is that it is measuring only the service available within a walking time of 10 minutes. A radius of one-third mile for each component is used to define the area within which the component can be reached within a 10-minute walk, even when the route is non-direct, such as would occur in a neighborhood of gridded streets. It is a conservative measure, in which those older or younger citizens, and those with strollers, wheelchairs, or other devices should normally be able to get to the destination within the 10-minute timeframe. The analysis does not take into account the quality, character, condition, or other aspects of routes to get to the components, or if they even exist. It does, however, account for major barriers such as highways, railroad tracks, and waterways. This Perspective primarily measures the cumulative number of components available to walk to and the desirability of walking to those in terms of their functionality for their intended purpose. It does not weigh the relative merits of one type of destination over another.
Table 16 shows the statistics derived from Perspective B–Walkable Access to All Components. The table shows that for the 128,303 acres within Tulsa, 65% have some level of service, meaning that the GRASP® score for those acres according to this Perspective is greater than zero. Table 16: Perspective B- Walkable Access to All Components
Total Acres
Percent With LOS
Avg. LOS Per Acre Served
Avg. LOS Per Acre Per
Pop.
GRASP® Index
Subarea
City of Tulsa 128,303 65% 46 N/A 14.5
North 39,487 64% 44 23 21.0
Midtown 19,192 82% 55 11 14.9
East 29,356 41% 36 16 11.7
South 28,128 80% 42 9 8.4
West 12,140 66% 58 31 27.6
Table 16 shows that for the five subareas, Midtown has the highest coverage at 82%, and East has the lowest at 41%. Table 16 also shows the average GRASP® LOS score for each acre that has service, both over the entire area, and by subarea. The average score for all acres with service across the city is 46 points. The scores range from a high of 58 points in West, to a low of 36 points in East.
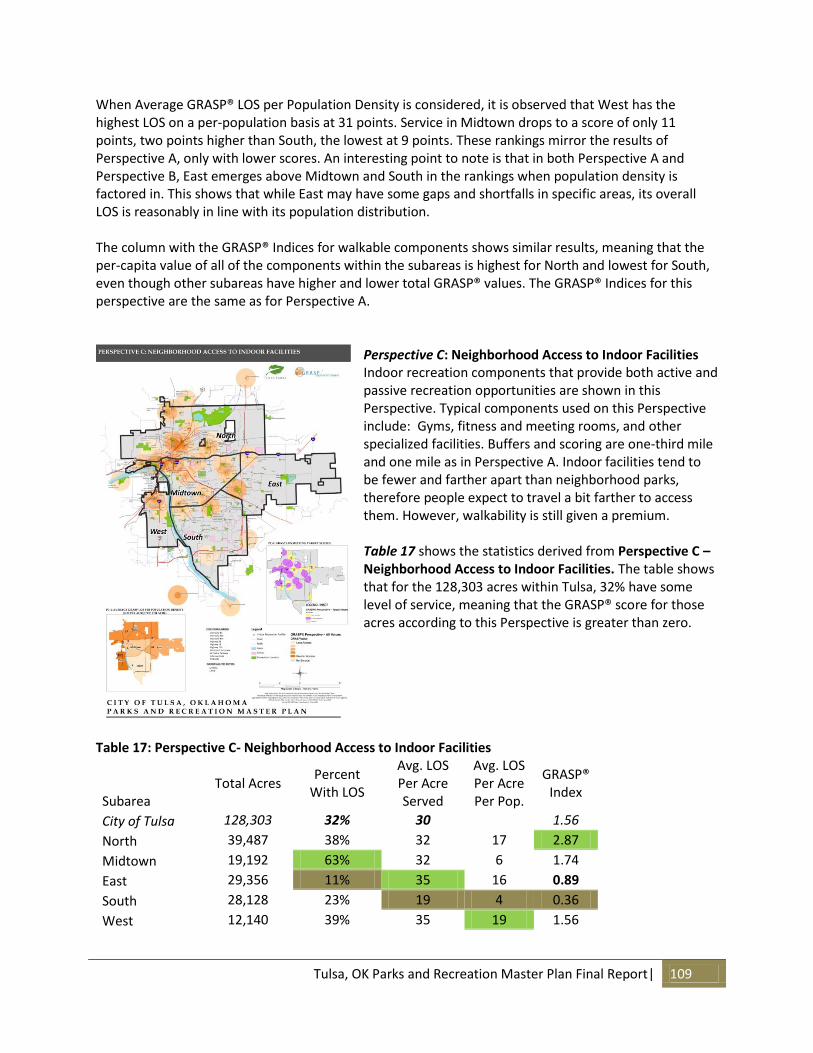
Tulsa, OK Parks and Recreation Master Plan Final Report| 109
When Average GRASP® LOS per Population Density is considered, it is observed that West has the highest LOS on a per-population basis at 31 points. Service in Midtown drops to a score of only 11 points, two points higher than South, the lowest at 9 points. These rankings mirror the results of Perspective A, only with lower scores. An interesting point to note is that in both Perspective A and Perspective B, East emerges above Midtown and South in the rankings when population density is factored in. This shows that while East may have some gaps and shortfalls in specific areas, its overall LOS is reasonably in line with its population distribution. The column with the GRASP® Indices for walkable components shows similar results, meaning that the per-capita value of all of the components within the subareas is highest for North and lowest for South, even though other subareas have higher and lower total GRASP® values. The GRASP® Indices for this perspective are the same as for Perspective A.
Perspective C: Neighborhood Access to Indoor Facilities Indoor recreation components that provide both active and passive recreation opportunities are shown in this Perspective. Typical components used on this Perspective include: Gyms, fitness and meeting rooms, and other specialized facilities. Buffers and scoring are one-third mile and one mile as in Perspective A. Indoor facilities tend to be fewer and farther apart than neighborhood parks, therefore people expect to travel a bit farther to access them. However, walkability is still given a premium. Table 17 shows the statistics derived from Perspective C – Neighborhood Access to Indoor Facilities. The table shows that for the 128,303 acres within Tulsa, 32% have some level of service, meaning that the GRASP® score for those acres according to this Perspective is greater than zero.
Table 17: Perspective C- Neighborhood Access to Indoor Facilities
Total Acres
Percent With LOS
Avg. LOS Per Acre Served
Avg. LOS Per Acre Per Pop.
GRASP® Index
Subarea
City of Tulsa 128,303 32% 30 1.56
North 39,487 38% 32 17 2.87
Midtown 19,192 63% 32 6 1.74
East 29,356 11% 35 16 0.89
South 28,128 23% 19 4 0.36
West 12,140 39% 35 19 1.56
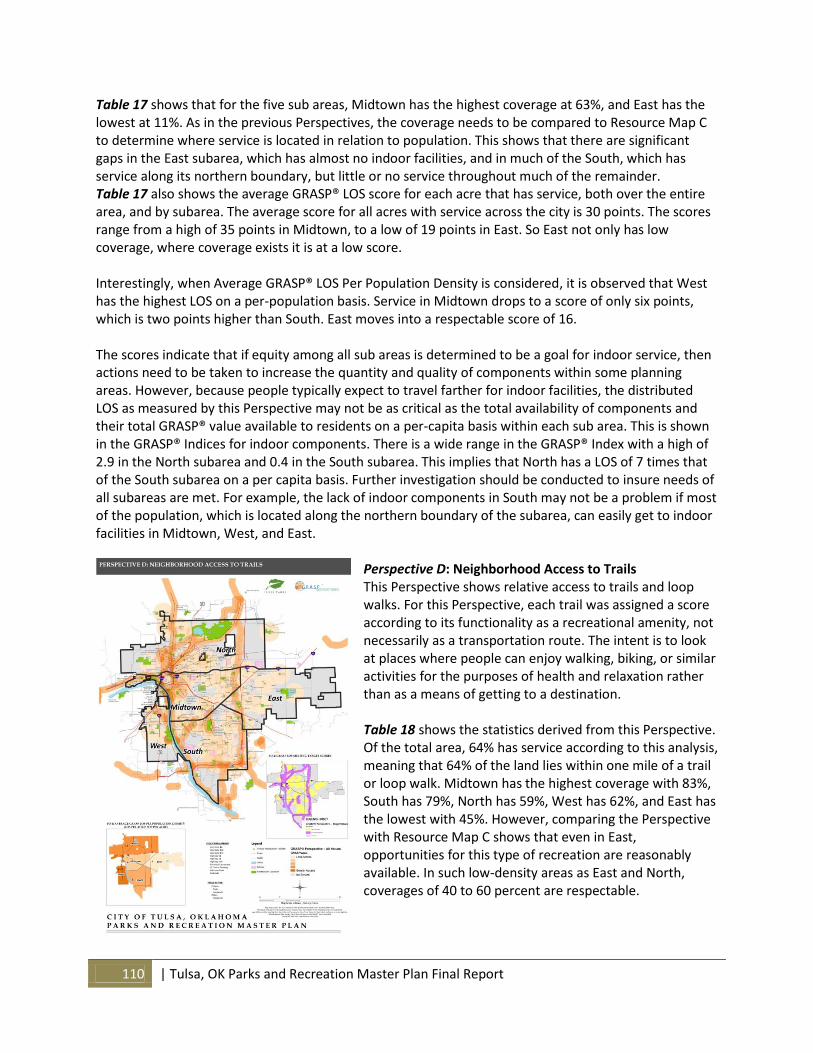
110 | Tulsa, OK Parks and Recreation Master Plan Final Report
Table 17 shows that for the five sub areas, Midtown has the highest coverage at 63%, and East has the lowest at 11%. As in the previous Perspectives, the coverage needs to be compared to Resource Map C to determine where service is located in relation to population. This shows that there are significant gaps in the East subarea, which has almost no indoor facilities, and in much of the South, which has service along its northern boundary, but little or no service throughout much of the remainder. Table 17 also shows the average GRASP® LOS score for each acre that has service, both over the entire area, and by subarea. The average score for all acres with service across the city is 30 points. The scores range from a high of 35 points in Midtown, to a low of 19 points in East. So East not only has low coverage, where coverage exists it is at a low score. Interestingly, when Average GRASP® LOS Per Population Density is considered, it is observed that West has the highest LOS on a per-population basis. Service in Midtown drops to a score of only six points, which is two points higher than South. East moves into a respectable score of 16. The scores indicate that if equity among all sub areas is determined to be a goal for indoor service, then actions need to be taken to increase the quantity and quality of components within some planning areas. However, because people typically expect to travel farther for indoor facilities, the distributed LOS as measured by this Perspective may not be as critical as the total availability of components and their total GRASP® value available to residents on a per-capita basis within each sub area. This is shown in the GRASP® Indices for indoor components. There is a wide range in the GRASP® Index with a high of 2.9 in the North subarea and 0.4 in the South subarea. This implies that North has a LOS of 7 times that of the South subarea on a per capita basis. Further investigation should be conducted to insure needs of all subareas are met. For example, the lack of indoor components in South may not be a problem if most of the population, which is located along the northern boundary of the subarea, can easily get to indoor facilities in Midtown, West, and East.
Perspective D: Neighborhood Access to Trails This Perspective shows relative access to trails and loop walks. For this Perspective, each trail was assigned a score according to its functionality as a recreational amenity, not necessarily as a transportation route. The intent is to look at places where people can enjoy walking, biking, or similar activities for the purposes of health and relaxation rather than as a means of getting to a destination. Table 18 shows the statistics derived from this Perspective. Of the total area, 64% has service according to this analysis, meaning that 64% of the land lies within one mile of a trail or loop walk. Midtown has the highest coverage with 83%, South has 79%, North has 59%, West has 62%, and East has the lowest with 45%. However, comparing the Perspective with Resource Map C shows that even in East, opportunities for this type of recreation are reasonably available. In such low-density areas as East and North, coverages of 40 to 60 percent are respectable.
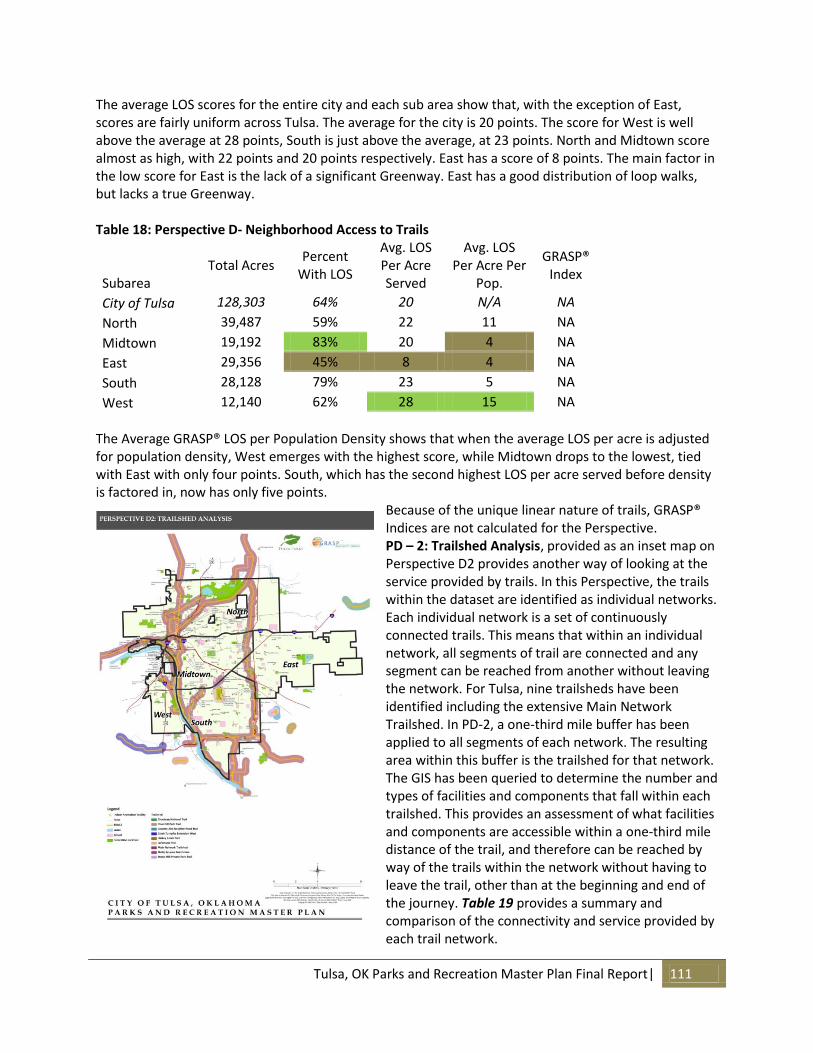
Tulsa, OK Parks and Recreation Master Plan Final Report| 111
The average LOS scores for the entire city and each sub area show that, with the exception of East, scores are fairly uniform across Tulsa. The average for the city is 20 points. The score for West is well above the average at 28 points, South is just above the average, at 23 points. North and Midtown score almost as high, with 22 points and 20 points respectively. East has a score of 8 points. The main factor in the low score for East is the lack of a significant Greenway. East has a good distribution of loop walks, but lacks a true Greenway. Table 18: Perspective D- Neighborhood Access to Trails
Total Acres
Percent With LOS
Avg. LOS Per Acre Served
Avg. LOS Per Acre Per
Pop.
GRASP® Index
Subarea
City of Tulsa 128,303 64% 20 N/A NA
North 39,487 59% 22 11 NA
Midtown 19,192 83% 20 4 NA
East 29,356 45% 8 4 NA
South 28,128 79% 23 5 NA
West 12,140 62% 28 15 NA
The Average GRASP® LOS per Population Density shows that when the average LOS per acre is adjusted for population density, West emerges with the highest score, while Midtown drops to the lowest, tied with East with only four points. South, which has the second highest LOS per acre served before density is factored in, now has only five points.
Because of the unique linear nature of trails, GRASP® Indices are not calculated for the Perspective. PD – 2: Trailshed Analysis, provided as an inset map on Perspective D2 provides another way of looking at the service provided by trails. In this Perspective, the trails within the dataset are identified as individual networks. Each individual network is a set of continuously connected trails. This means that within an individual network, all segments of trail are connected and any segment can be reached from another without leaving the network. For Tulsa, nine trailsheds have been identified including the extensive Main Network Trailshed. In PD-2, a one-third mile buffer has been applied to all segments of each network. The resulting area within this buffer is the trailshed for that network. The GIS has been queried to determine the number and types of facilities and components that fall within each trailshed. This provides an assessment of what facilities and components are accessible within a one-third mile distance of the trail, and therefore can be reached by way of the trails within the network without having to leave the trail, other than at the beginning and end of the journey. Table 19 provides a summary and comparison of the connectivity and service provided by each trail network.
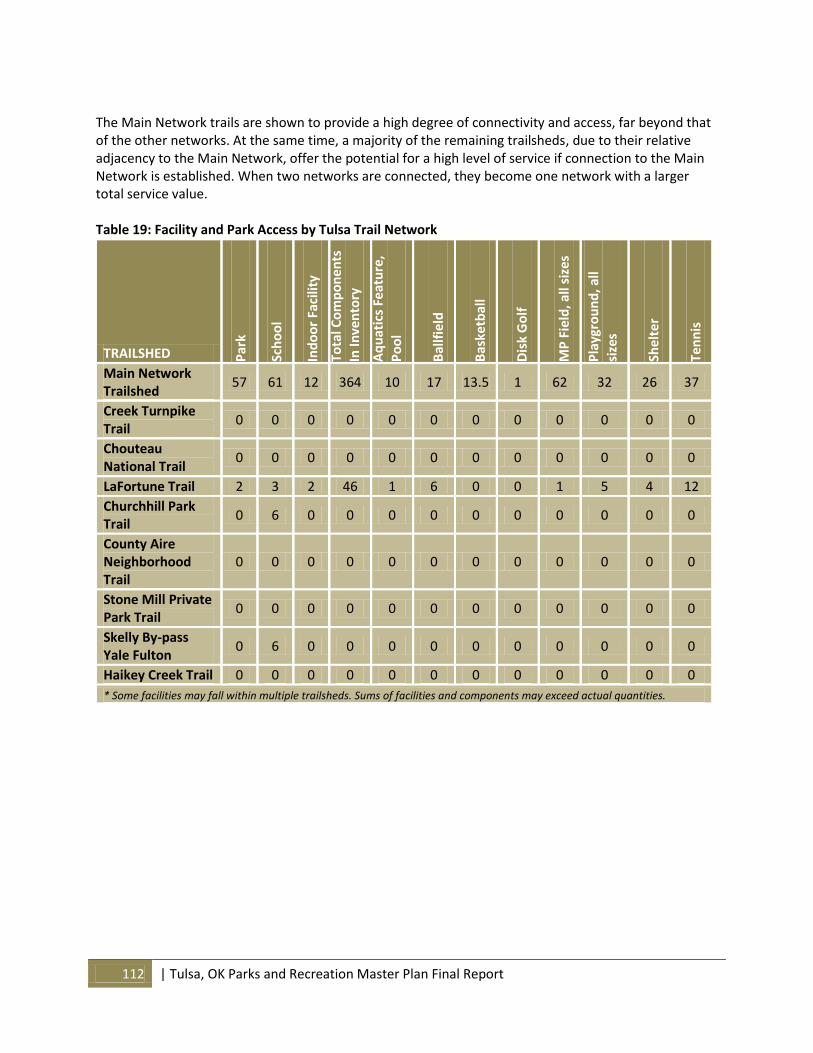
112 | Tulsa, OK Parks and Recreation Master Plan Final Report
The Main Network trails are shown to provide a high degree of connectivity and access, far beyond that of the other networks. At the same time, a majority of the remaining trailsheds, due to their relative adjacency to the Main Network, offer the potential for a high level of service if connection to the Main Network is established. When two networks are connected, they become one network with a larger total service value. Table 19: Facility and Park Access by Tulsa Trail Network
TRAILSHED Par
k
Sch
oo
l
Ind
oo
r Fa
cilit
y
Tota
l Co
mp
on
ents
In
Inve
nto
ry
Aq
uat
ics
Feat
ure
,
Po
ol
Bal
lfie
ld
Bas
ketb
all
Dis
k G
olf
MP
Fie
ld, a
ll si
zes
Pla
ygro
un
d, a
ll
size
s
Shel
ter
Ten
nis
Main Network Trailshed
57 61 12 364 10 17 13.5 1 62 32 26 37
Creek Turnpike Trail
0 0 0 0 0 0 0 0 0 0 0 0
Chouteau National Trail
0 0 0 0 0 0 0 0 0 0 0 0
LaFortune Trail 2 3 2 46 1 6 0 0 1 5 4 12
Churchhill Park Trail
0 6 0 0 0 0 0 0 0 0 0 0
County Aire Neighborhood Trail
0 0 0 0 0 0 0 0 0 0 0 0
Stone Mill Private Park Trail
0 0 0 0 0 0 0 0 0 0 0 0
Skelly By-pass Yale Fulton
0 6 0 0 0 0 0 0 0 0 0 0
Haikey Creek Trail 0 0 0 0 0 0 0 0 0 0 0 0
* Some facilities may fall within multiple trailsheds. Sums of facilities and components may exceed actual quantities.
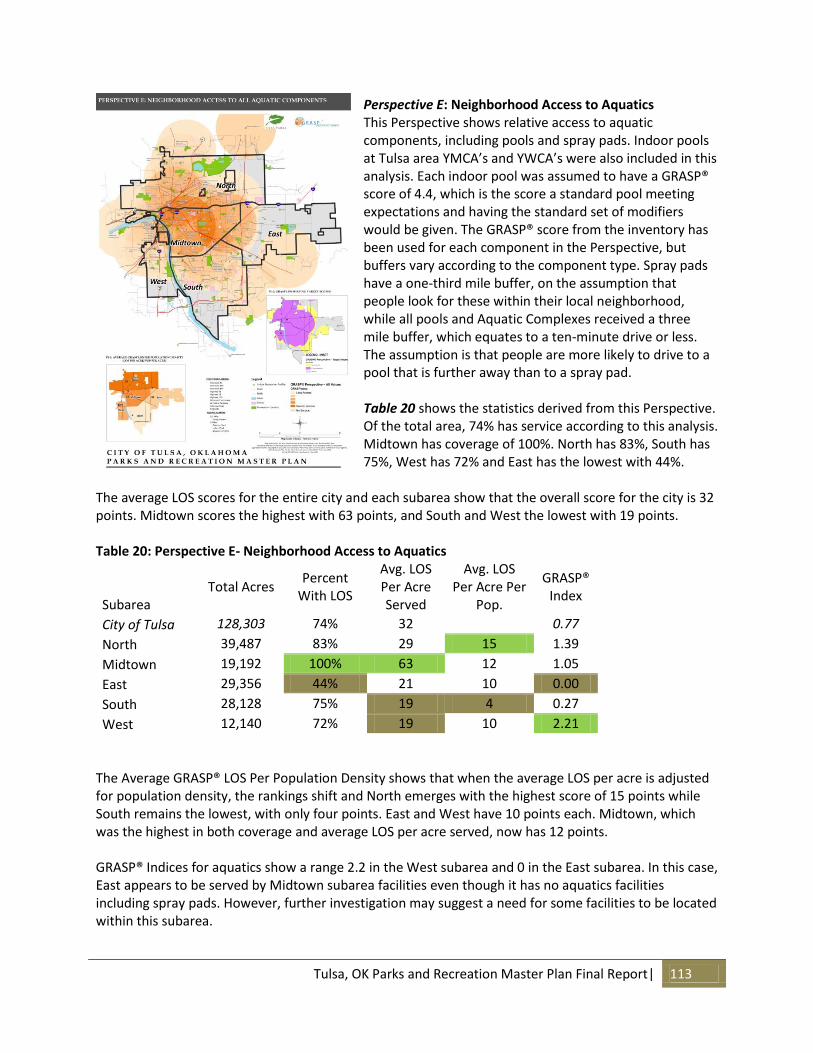
Tulsa, OK Parks and Recreation Master Plan Final Report| 113
Perspective E: Neighborhood Access to Aquatics This Perspective shows relative access to aquatic components, including pools and spray pads. Indoor pools at Tulsa area YMCA’s and YWCA’s were also included in this analysis. Each indoor pool was assumed to have a GRASP® score of 4.4, which is the score a standard pool meeting expectations and having the standard set of modifiers would be given. The GRASP® score from the inventory has been used for each component in the Perspective, but buffers vary according to the component type. Spray pads have a one-third mile buffer, on the assumption that people look for these within their local neighborhood, while all pools and Aquatic Complexes received a three mile buffer, which equates to a ten-minute drive or less. The assumption is that people are more likely to drive to a pool that is further away than to a spray pad. Table 20 shows the statistics derived from this Perspective. Of the total area, 74% has service according to this analysis. Midtown has coverage of 100%. North has 83%, South has 75%, West has 72% and East has the lowest with 44%.
The average LOS scores for the entire city and each subarea show that the overall score for the city is 32 points. Midtown scores the highest with 63 points, and South and West the lowest with 19 points. Table 20: Perspective E- Neighborhood Access to Aquatics
Total Acres
Percent With LOS
Avg. LOS Per Acre Served
Avg. LOS Per Acre Per
Pop.
GRASP® Index
Subarea
City of Tulsa 128,303 74% 32 0.77
North 39,487 83% 29 15 1.39
Midtown 19,192 100% 63 12 1.05
East 29,356 44% 21 10 0.00
South 28,128 75% 19 4 0.27
West 12,140 72% 19 10 2.21
The Average GRASP® LOS Per Population Density shows that when the average LOS per acre is adjusted for population density, the rankings shift and North emerges with the highest score of 15 points while South remains the lowest, with only four points. East and West have 10 points each. Midtown, which was the highest in both coverage and average LOS per acre served, now has 12 points. GRASP® Indices for aquatics show a range 2.2 in the West subarea and 0 in the East subarea. In this case, East appears to be served by Midtown subarea facilities even though it has no aquatics facilities including spray pads. However, further investigation may suggest a need for some facilities to be located within this subarea.
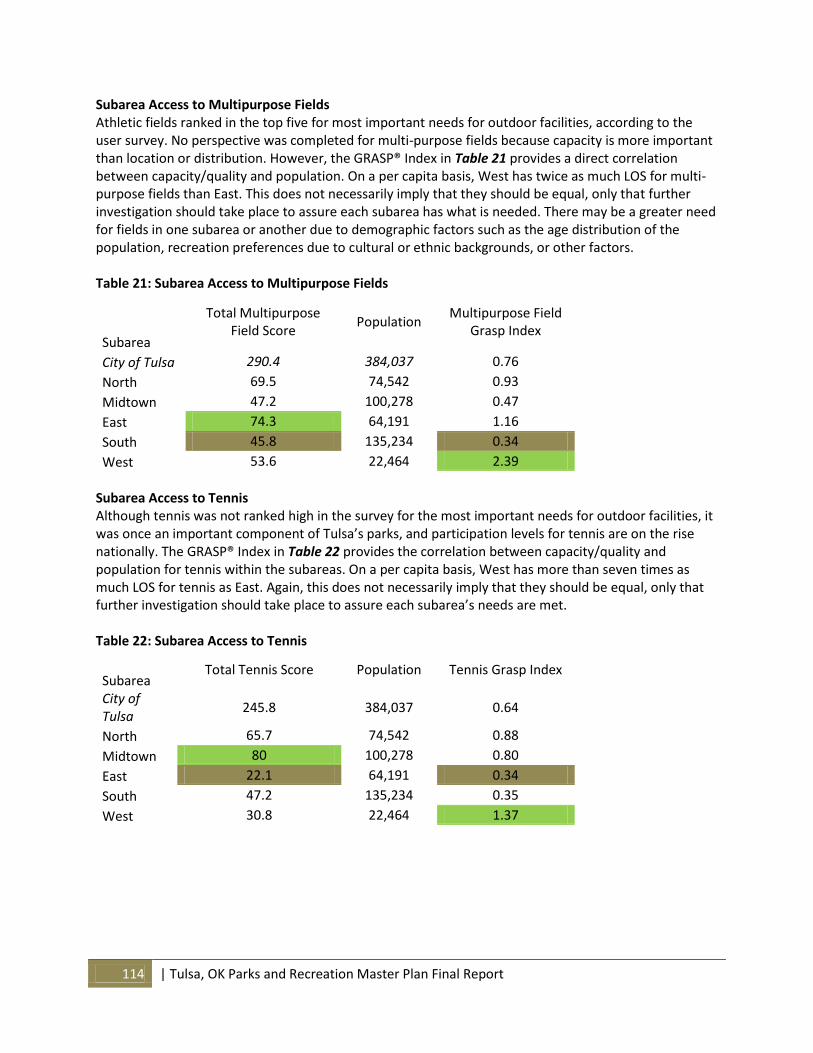
114 | Tulsa, OK Parks and Recreation Master Plan Final Report
Subarea Access to Multipurpose Fields Athletic fields ranked in the top five for most important needs for outdoor facilities, according to the user survey. No perspective was completed for multi-purpose fields because capacity is more important than location or distribution. However, the GRASP® Index in Table 21 provides a direct correlation between capacity/quality and population. On a per capita basis, West has twice as much LOS for multi-purpose fields than East. This does not necessarily imply that they should be equal, only that further investigation should take place to assure each subarea has what is needed. There may be a greater need for fields in one subarea or another due to demographic factors such as the age distribution of the population, recreation preferences due to cultural or ethnic backgrounds, or other factors. Table 21: Subarea Access to Multipurpose Fields
Subarea
Total Multipurpose Field Score
Population Multipurpose Field
Grasp Index
City of Tulsa 290.4 384,037 0.76
North 69.5 74,542 0.93
Midtown 47.2 100,278 0.47
East 74.3 64,191 1.16
South 45.8 135,234 0.34
West 53.6 22,464 2.39
Subarea Access to Tennis Although tennis was not ranked high in the survey for the most important needs for outdoor facilities, it was once an important component of Tulsa’s parks, and participation levels for tennis are on the rise nationally. The GRASP® Index in Table 22 provides the correlation between capacity/quality and population for tennis within the subareas. On a per capita basis, West has more than seven times as much LOS for tennis as East. Again, this does not necessarily imply that they should be equal, only that further investigation should take place to assure each subarea’s needs are met. Table 22: Subarea Access to Tennis
Subarea Total Tennis Score Population Tennis Grasp Index
City of Tulsa
245.8 384,037 0.64
North 65.7 74,542 0.88
Midtown 80 100,278 0.80
East 22.1 64,191 0.34
South 47.2 135,234 0.35
West 30.8 22,464 1.37
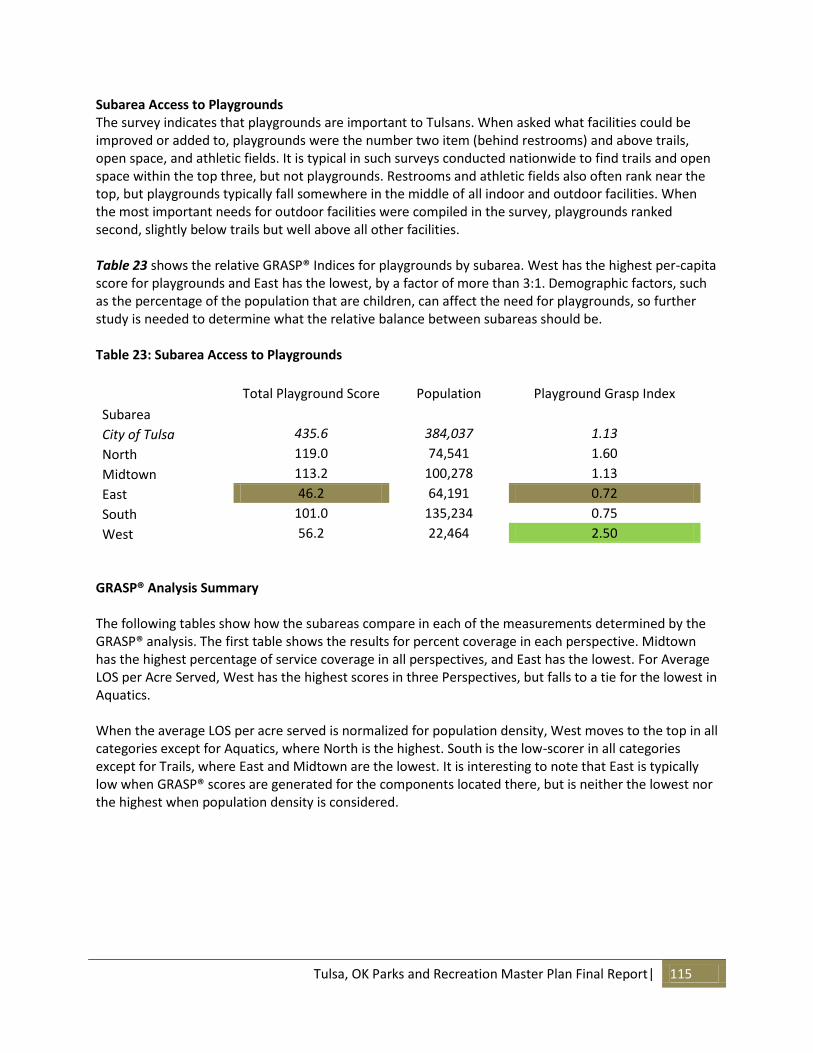
Tulsa, OK Parks and Recreation Master Plan Final Report| 115
Subarea Access to Playgrounds The survey indicates that playgrounds are important to Tulsans. When asked what facilities could be improved or added to, playgrounds were the number two item (behind restrooms) and above trails, open space, and athletic fields. It is typical in such surveys conducted nationwide to find trails and open space within the top three, but not playgrounds. Restrooms and athletic fields also often rank near the top, but playgrounds typically fall somewhere in the middle of all indoor and outdoor facilities. When the most important needs for outdoor facilities were compiled in the survey, playgrounds ranked second, slightly below trails but well above all other facilities. Table 23 shows the relative GRASP® Indices for playgrounds by subarea. West has the highest per-capita score for playgrounds and East has the lowest, by a factor of more than 3:1. Demographic factors, such as the percentage of the population that are children, can affect the need for playgrounds, so further study is needed to determine what the relative balance between subareas should be. Table 23: Subarea Access to Playgrounds
Subarea
Total Playground Score Population Playground Grasp Index
City of Tulsa 435.6 384,037 1.13
North 119.0 74,541 1.60
Midtown 113.2 100,278 1.13
East 46.2 64,191 0.72
South 101.0 135,234 0.75
West 56.2 22,464 2.50
GRASP® Analysis Summary The following tables show how the subareas compare in each of the measurements determined by the GRASP® analysis. The first table shows the results for percent coverage in each perspective. Midtown has the highest percentage of service coverage in all perspectives, and East has the lowest. For Average LOS per Acre Served, West has the highest scores in three Perspectives, but falls to a tie for the lowest in Aquatics. When the average LOS per acre served is normalized for population density, West moves to the top in all categories except for Aquatics, where North is the highest. South is the low-scorer in all categories except for Trails, where East and Midtown are the lowest. It is interesting to note that East is typically low when GRASP® scores are generated for the components located there, but is neither the lowest nor the highest when population density is considered.
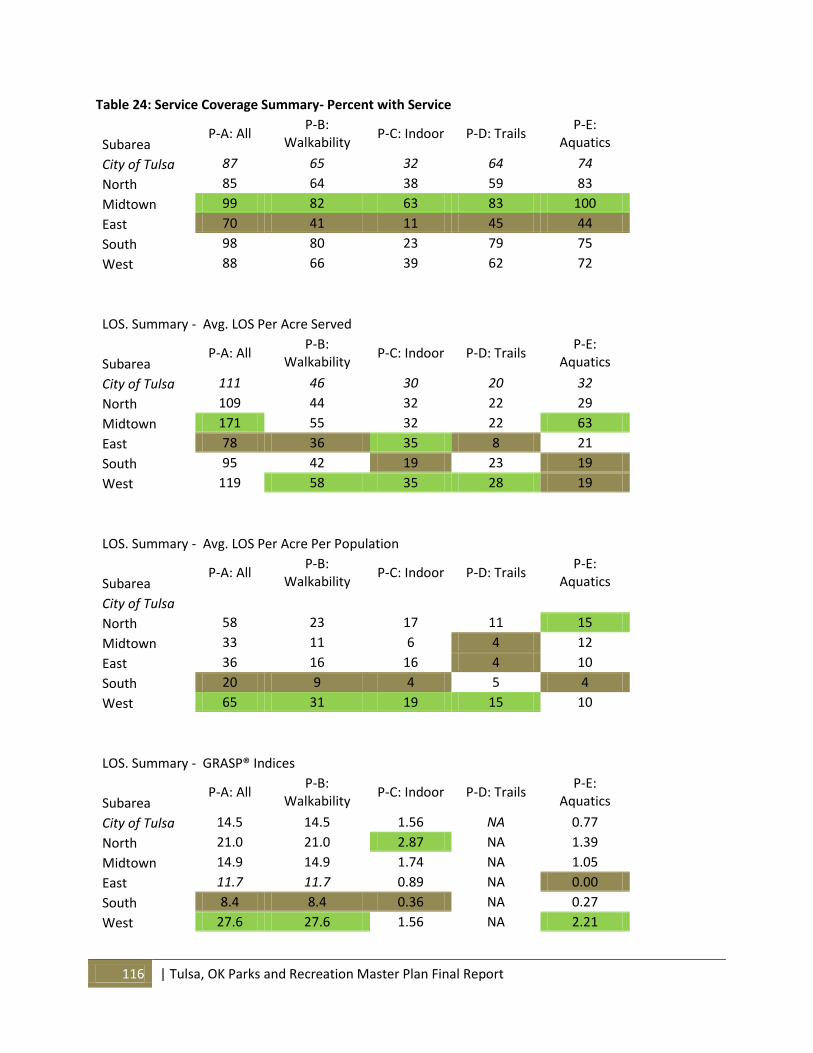
116 | Tulsa, OK Parks and Recreation Master Plan Final Report
Table 24: Service Coverage Summary- Percent with Service
P-A: All
P-B: Walkability
P-C: Indoor P-D: Trails P-E:
Aquatics Subarea
City of Tulsa 87 65 32 64 74
North 85 64 38 59 83
Midtown 99 82 63 83 100
East 70 41 11 45 44
South 98 80 23 79 75
West 88 66 39 62 72
LOS. Summary - Avg. LOS Per Acre Served
P-A: All
P-B: Walkability
P-C: Indoor P-D: Trails P-E:
Aquatics Subarea
City of Tulsa 111 46 30 20 32
North 109 44 32 22 29
Midtown 171 55 32 22 63
East 78 36 35 8 21
South 95 42 19 23 19
West 119 58 35 28 19
LOS. Summary - Avg. LOS Per Acre Per Population
P-A: All
P-B: Walkability
P-C: Indoor P-D: Trails P-E:
Aquatics Subarea
City of Tulsa
North 58 23 17 11 15
Midtown 33 11 6 4 12
East 36 16 16 4 10
South 20 9 4 5 4
West 65 31 19 15 10
LOS. Summary - GRASP® Indices
P-A: All
P-B: Walkability
P-C: Indoor P-D: Trails P-E:
Aquatics Subarea
City of Tulsa 14.5 14.5 1.56 NA 0.77
North 21.0 21.0 2.87 NA 1.39
Midtown 14.9 14.9 1.74 NA 1.05
East 11.7 11.7 0.89 NA 0.00
South 8.4 8.4 0.36 NA 0.27
West 27.6 27.6 1.56 NA 2.21
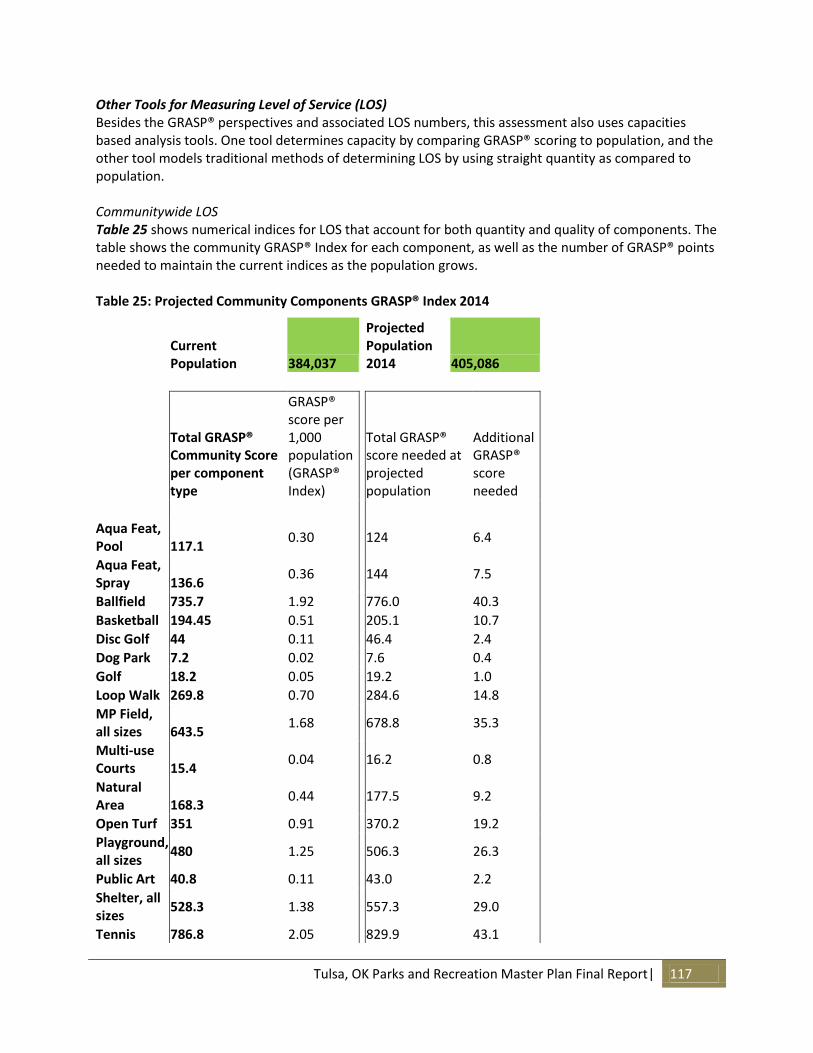
Tulsa, OK Parks and Recreation Master Plan Final Report| 117
Other Tools for Measuring Level of Service (LOS) Besides the GRASP® perspectives and associated LOS numbers, this assessment also uses capacities based analysis tools. One tool determines capacity by comparing GRASP® scoring to population, and the other tool models traditional methods of determining LOS by using straight quantity as compared to population. Communitywide LOS Table 25 shows numerical indices for LOS that account for both quantity and quality of components. The table shows the community GRASP® Index for each component, as well as the number of GRASP® points needed to maintain the current indices as the population grows. Table 25: Projected Community Components GRASP® Index 2014
Current Population 384,037
Projected Population 2014 405,086
Total GRASP® Community Score per component type
GRASP® score per 1,000 population (GRASP® Index)
Total GRASP® score needed at projected population
Additional GRASP® score needed
Aqua Feat, Pool 117.1
0.30 124 6.4
Aqua Feat, Spray 136.6
0.36 144 7.5
Ballfield 735.7 1.92 776.0 40.3
Basketball 194.45 0.51 205.1 10.7
Disc Golf 44 0.11 46.4 2.4
Dog Park 7.2 0.02 7.6 0.4
Golf 18.2 0.05 19.2 1.0
Loop Walk 269.8 0.70 284.6 14.8
MP Field, all sizes 643.5
1.68 678.8 35.3
Multi-use Courts 15.4
0.04 16.2 0.8
Natural Area 168.3
0.44 177.5 9.2
Open Turf 351 0.91 370.2 19.2
Playground, all sizes
480 1.25 506.3 26.3
Public Art 40.8 0.11 43.0 2.2
Shelter, all sizes
528.3 1.38 557.3 29.0
Tennis 786.8 2.05 829.9 43.1
118 | Tulsa, OK Parks and Recreation Master Plan Final Report
The first part of the Community Components GRASP® Index shows the total GRASP® score for that component when all of the components in the dataset are included. During the inventory process, two sets of scores were assigned to each component, a Neighborhood score and a Communitywide score. The Communitywide scores are used to create this table. The second column in the table shows the index that results when the GRASP® score is divided by the current population in thousands. This is the GRASP® Index for that component. The third column in the table shows the total GRASP® score that must exist to achieve the same GRASP® Index at the projected population 2014, and the fourth column shows the additional number of GRASP® points needed to achieve that score. This information can be used to plan for future improvements to the parks and recreation infrastructure to accommodate growth. Because GRASP® scores are a blend of quantity and quality; it is possible to increase them by either adding components or improving the quality of existing ones. In most cases, a combination of the two will be recommended. Used in conjunction with the Capacities LOS Table, the best combination of quantity and quality can be determined for planning purposes. The GRASP® Indices also allow the community to benchmark its combined LOS for quality and quantity of service over time and measure its progress. Capacities Level of Service For some components, the quantity needed is proportional to the population that will be served by that component. This is a fairly easy calculation when components are programmed for use. The programming determines how many people will be using the facilities over a period of time. Sports fields and courts fall into this category. For other components, the ratio of components to the population may vary, depending upon the size or capacity of the component and the participation levels within the community for the activity served by the component. Skate parks and group picnic facilities fall into this category.
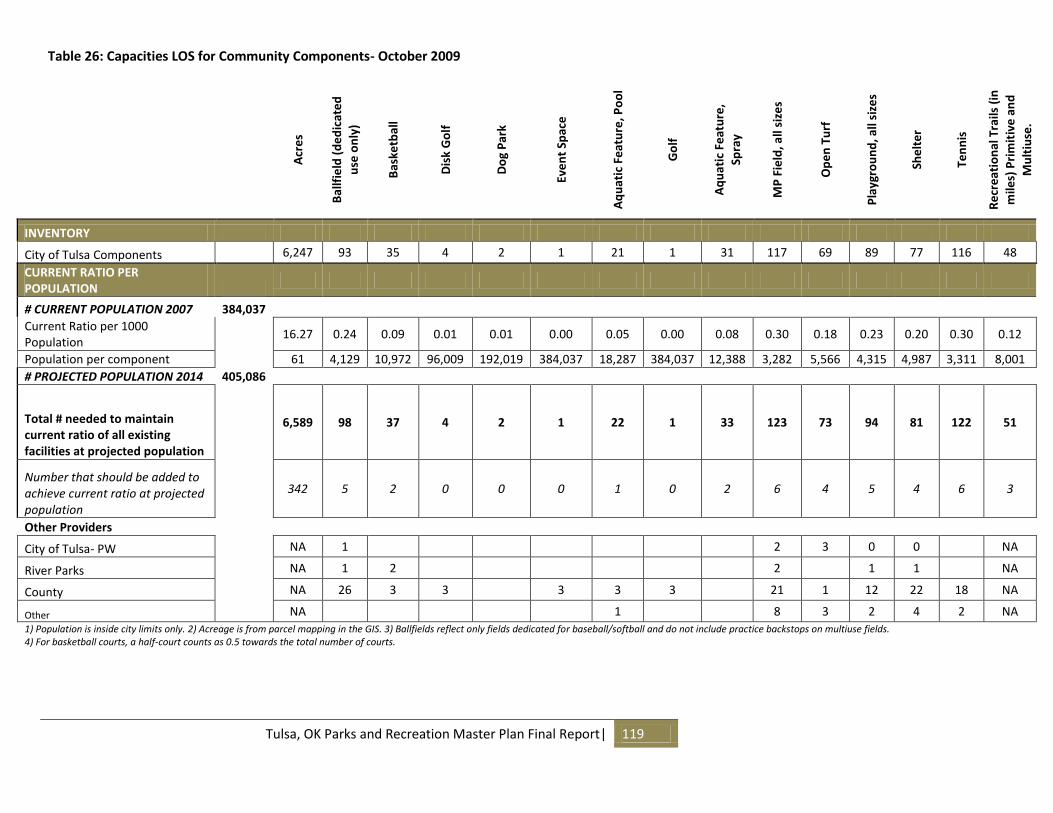
Tulsa, OK Parks and Recreation Master Plan Final Report| 119
Table 26: Capacities LOS for Community Components- October 2009
Acr
es
Bal
lfie
ld (
de
dic
ate
d
use
on
ly)
Bas
ketb
all
Dis
k G
olf
Do
g P
ark
Eve
nt
Spac
e
Aq
uat
ic F
eat
ure
, Po
ol
Go
lf
Aq
uat
ic F
eat
ure
,
Spra
y
MP
Fie
ld, a
ll si
zes
Op
en
Tu
rf
Pla
ygro
un
d, a
ll si
zes
She
lte
r
Ten
nis
Re
cre
atio
nal
Tra
ils (
in
mile
s) P
rim
itiv
e a
nd
Mu
ltiu
se.
INVENTORY
City of Tulsa Components 6,247 93 35 4 2 1 21 1 31 117 69 89 77 116 48
CURRENT RATIO PER POPULATION
# CURRENT POPULATION 2007 384,037
Current Ratio per 1000 Population
16.27 0.24 0.09 0.01 0.01 0.00 0.05 0.00 0.08 0.30 0.18 0.23 0.20 0.30 0.12
Population per component 61 4,129 10,972 96,009 192,019 384,037 18,287 384,037 12,388 3,282 5,566 4,315 4,987 3,311 8,001
# PROJECTED POPULATION 2014 405,086
Total # needed to maintain current ratio of all existing facilities at projected population
6,589 98 37 4 2 1 22 1 33 123 73 94 81 122 51
Number that should be added to achieve current ratio at projected population
342 5 2 0 0 0 1 0 2 6 4 5 4 6 3
Other Providers
City of Tulsa- PW NA 1 2 3 0 0 NA
River Parks NA 1 2 2 1 1 NA
County NA 26 3 3 3 3 3 21 1 12 22 18 NA
Other NA 1 8 3 2 4 2 NA
1) Population is inside city limits only. 2) Acreage is from parcel mapping in the GIS. 3) Ballfields reflect only fields dedicated for baseball/softball and do not include practice backstops on multiuse fields. 4) For basketball courts, a half-court counts as 0.5 towards the total number of courts.
120 | Tulsa, OK Parks and Recreation Master Plan Final Report
This table closely resembles a traditional LOS analysis and shows how the quantities of certain park and recreation components compare to population. For each component, the table shows the current quantity of that component on a “per-1000 persons” basis (referred to as the Capacity LOS) and the pro-rata number of persons in the community represented by each component. This kind of analysis can be used to show the capacity of the current inventory – in other words, how many people are potentially being served by park components. It can also be combined with the GRASP® Index to assure that the qualitative aspects of service are included in the planning process for the future. Just adding new components as population grows will not be sufficient to maintain existing levels of service if the quality of existing ones is allowed to deteriorate, either through wear and tear, or obsolescence. For example, the tables show that a total of seven new tennis courts will be needed in addition to the 136 courts currently available citywide to maintain current capacity ratios in the year 2014. But if the GRASP® score for the existing ones goes down in the meantime due to lack of maintenance, the GRASP® Index will fall, even though the capacity has been met. It is important to note that capacities tables are simply one tool that can be used to make final recommendations and establish budgets. The tables assume that the current ratios are satisfying today’s needs and that the same ratios will satisfy needs in the future. In reality, needs and desires change over time due to changes in demographics, recreational trends, and other factors. The numbers of facilities shown on this table may differ from the final recommendations due to availability of land, ability to upgrade existing facilities, and other factors. Level of Service Analysis Conclusions The findings from the GRASP® analysis show what the current levels of service are for a variety of parks and recreation needs. These include overall LOS provided by the system to all parts of the city, and specific LOS for particular needs such as indoor facilities, multi-purpose fields, etc. The analysis also allows for comparisons to be made in evaluating how equitably services are being provided across different parts of the city. While the GRASP® methodology allows quantitative measurements to be made for levels of service, there are no established standards for what the resultant numbers should be. This is because every community is different. However, the GRASP® values can be used in conjunction with other findings, such as community surveys and public input, to determine whether current LOS is meeting needs and expectations, then used as a benchmark for creating targets and measuring results in the future. In general, the findings show that Tulsa has a well-distributed system of parks and recreation facilities that is meeting a wide range of needs. Compared to other communities, Tulsa is spread out across a large area, yet it still manages to provide good access to parks for a large percentage of its corporate area. While the composite value of this service may be lower than other communities because it is so spread out, the per-capita value of service (GRASP® Index) is comparable to places like Asheville, North Carolina, which is recognized for its high quality of life, and Prince George’s County, Maryland, which has received many national Gold Medals for parks and recreation. Tulsa’s challenges now are to maintain its existing infrastructure of parks as they age in the face of tough economic times, and to bring its parks and recreation system into a new century of needs, desires, and conditions.
Tulsa, OK Parks and Recreation Master Plan Final Report| 121
V. Funding
A. Tulsa Parks Potential Funding Sources These funding sources are currently being used by the City of Tulsa Parks and Recreation Department to create the existing budgets for capital and operational expenditures. Many of these funding sources are not used to the fullest potential and should be expanded to create additional funding options for the implementation of this Master Plan. Partnerships Partnerships are joint development funding sources or operational funding sources between two separate agencies, such as two government entities, a non-profit and a City department, or a private business and a City agency. Two partners jointly develop revenue producing park and recreation facilities and share risk, operational costs, responsibilities, and asset management based on the strengths and weaknesses of each partner. Tulsa Parks has several partnerships in place with a few working well such as Gilcrease and the Zoo; Art Center Advisory Council at WaterWorks; TACTA, OCTA,Theatre Tulsa, SummerStage, Tulsa County Library, Arts Council of Tulsa, and Tulsa Public Schools at Tulsa Parks Theatre. There are several other partnerships that need to be revisited to address equity of the partnership, agreements in place with annual reviews, standards, and compliance inspections. Sales Tax The revenue source is very popular for funding park and recreation agencies either partially or fully. The normal sales tax rate is 1 cent for operations and one half cent for capital. This tax is very popular in high traffic tourism type cities. Reservations This revenue source comes from the right to reserve specific public property for a set amount of time. The reservation rates are usually set and apply to group picnic shelters, meeting rooms for weddings, reunions and outings or other type of facilities for a special activity. Volunteerism The revenue source is an indirect revenue source in that persons donate time to assist the department in providing a product or service on an hourly basis. This reduces the City’s cost in providing the service plus it builds advocacy into the system. Foundation/Gifts These dollars are raised from tax-exempt, non-profit organizations established with private donations in promotion of specific causes, activities, or issues. They offer a variety of means to fund capital projects, including capital campaigns, gifts catalogs, fundraisers, endowments, sales of items, etc. Park Friends, a 501 (c)(3) is the current method to accept and disperse gifts from the private sector. Recreation Service Fees This is a dedicated user fee, which can be established by a local ordinance or other government procedures for the purpose of constructing and operating and maintaining recreation facilities. The fee can apply to all organized activities, which require a reservation of some type, or other purposes as defined by the local government.
122 | Tulsa, OK Parks and Recreation Master Plan Final Report
Examples of such activities include adult basketball, volleyball, and softball leagues, youth baseball, soccer, and softball leagues, and special interest classes. The fee allows participants an opportunity to contribute directly toward the upkeep of the facilities being used and is in addition to the portion of the fee that covers the cost of the activity. Inter-modal Transportation and Efficiency Act This funding program, commonly called TEA-21 Grants was authorized by the Federal Government in 1991. Funds are distributed through the state. There are several million dollars in enhancement revenues available for transportation related projects, including bicycle and pedestrian trails, rail depot rehabilitation, landscaping, and beautification projects. Land and Water Conservation Fund These funds are awarded for acquisition and development of parks, recreation and supporting facilities through the National Park Service and State Park System. There are several stipulations for the use of these funds. LWCF has been utilized at Oxley and Mohawk Park. General Obligation Bonds Bonded indebtedness is issued with the approval of the electorate for capital improvements and general public improvements. Special Improvement District/Benefit District Taxing districts are established to provide funds for certain types of improvements that benefit a specific group of affected properties. Improvements may include landscaping, the erection of fountains, and acquisition of art, and supplemental services for improvement and promotion, including recreation and cultural enhancements. Inter-local Agreements Contractual relationships are entered into between two or more local units of government and/or between a local unit of government and a non-profit organization for the joint usage/development of sports fields, regional parks, or other facilities. Revenue Bonds Bonds are used for capital projects that will generate revenue for debt service where fees can be set aside to support repayment of the bond. Bond Referendum A bond referendum requires a vote by the citizens for general obligation bonds initiated through City Council approval prior to the citizen vote. Fees/Charges The Department should position its fees and charges to be market-driven and based on both public and private facilities while meeting the needs of the citizenry. National trends of revenue generation relating to public park and recreation agencies is in an average range from 35% to 50% of true operating expenditures.
Tulsa, OK Parks and Recreation Master Plan Final Report| 123
Benefit Assessment Act of 1982 (Government Code section 54703 et seq.) This statute provides a uniform procedure for the enactment of benefit assessments to finance the maintenance and operation costs of drainage, flood control, and street light services and the cost of installation and improvement of drainage or flood control facilities. Under legislation approved in 1989 (SB 975, Chapter 1449), this authority is expanded to include the maintenance of streets, roads, and highways. As with most other assessment acts, cities, counties, and special districts that are otherwise authorized to provide such services may use it. This funding mechanism is currently in place in Tulsa Parks with vegetation management. Friends Associations These groups are formed to raise money typically for a single focus purpose that could include a park facility or program that will better the community as a whole and their special interest. Heller and Clark both have Park Friend associations that assist in funding at these parks. Subordinate Easements – Recreation / Natural Area Easements/Greenways This revenue source is available when the City allows utility companies, businesses, or individuals to develop some type of an improvement above ground or below ground on their property for a set period of time and a set dollar amount to be received by the City on an annual basis. Life Estates This source of money is available when someone wants to leave their property to the City in exchange for them to live on their property until their death. The City usually can use a portion of the property for park purposes and then all of it after the person’s death. This revenue source is very popular for individuals who have a lot of wealth and their estate will be highly taxed at their death and their children have to sell of their property because of probate costs. This allows the person to receive a good tax deduction yearly on their property while leaving a life estate. It is good for the City because they do not have to pay for the land. Equipment Rental The revenue source is available on the rental of equipment such as tables, chairs, tents, stages, bicycles, roller blades, boogie boards, etc. that are used for recreation purposes. Gift Catalogs Gift catalogs provide organizations the opportunity to let the community know about their needs annually. The community purchases items from the gift catalog and donates them to the city. Agricultural Leases In some City parks, they lease low land property along rivers or excess land to farmers for crops. The City typically get one-third of the value of the crops or it is leased on a per acre basis. Land Swaps The city trades property to improve access of protection of resources. This could include property gained by the city for non-payment of taxes or where a developer needs a larger or smaller space to improve profitability. The city typically gains property for more recreation opportunities in exchange for the land swap.
124 | Tulsa, OK Parks and Recreation Master Plan Final Report
Membership and Season Pass Sales The city can sell memberships to specific types of amenities to offset operational costs. These membership fees can apply to recreational and fitness centers, tennis centers, golf courses, pools, ice-rinks, zoos, etc. Security and Clean-Up Fees Cities charge groups and individuals security and clean-up fees for special events other type of events held in parks. Surplus Sale of Equipment by Auction Cities hold surplus auctions to get rid of old and used equipment that generates some income on a yearly basis. Parks and Recreation Departments can receive the income on the surplus items that are sold from their department or share in the overall city proceeds. These funding sources could easily be implemented by the City of Tulsa Parks and Recreation Department to create additional funding opportunities for capital and operational expenditures. Corporate Sponsorships This revenue-funding source allows corporations to invest in the development or enhancement of new or existing facilities in park systems. Sponsorships are also highly used for programs and events. WaterWorks has utilized corporate sponsorships although it has been a very limited funding source and can be expanded. Grants Tulsa Parks has received a few grants in the past although does not apply for many as there currently is not a staff person dedicated to grant writing. A variety of special grants either currently exist through the Federal and State governmental systems or will be established through the life of current and proposed facilities. See Appendix XI for local and federal grant information. Private Concessionaires The city contracts with a private business to provide and operate desirable recreational activities financed, constructed, and operated by the private sector with additional compensation paid to the City. Capital Improvement Fees These fees are in addition to the set user rate for accessing facilities such as golf, zoos, recreation centers and pools to support capital improvements that benefit the user of the facility. Land Trust Many cities have developed land trusts to help secure and fund the cost for acquiring land that needs to be preserved and protected for greenway purposes. This could be a good source to look to for acquisition of future lands. Naming Rights Many cities have turned to selling the naming rights for new buildings or renovation of existing buildings and parks for the development cost associated with the improvement.
Tulsa, OK Parks and Recreation Master Plan Final Report| 125
Merchandising Sales This revenue source comes from the public or private sector on resale items from gift shops and pro shops for either all of the sales or a set gross percentage. Concession Management Concession management is from retail sales or rentals of soft goods, hard goods, or consumable items. The City either contracts for the service or receives a set of the gross percentage or the full revenue dollars that incorporates a profit after expenses. Advertising Sales This revenue source is for the sale of tasteful and appropriate advertising in or on park and recreation related items such as in the City’s program guide, on scoreboards, ball field fencing and other visible products or services that are consumable or permanent that exposes the product or service to many people. More of this could be done in Tulsa Parks. Irrevocable Remainder Trusts These trusts are set up with individuals who typically have more than a million dollars in wealth. They will leave a portion of their wealth to the City in a trust fund that allows the fund to grow over a period of time and then is available for the City to use a portion of the interest to support specific park and recreation facilities or programs that are designated by the trustee. Parking Fee This fee applies to parking at selected destination facilities such as stadiums and other attractions to help offset capital and operational cost. Special Fundraisers Many park and recreation agencies have special fundraisers on an annual basis to help cover specific programs and capital projects. Ticket Sales/Admissions This revenue source is from fees for accessing facilities for self-directed activities such as pools, zoos, ballparks and entertainment activities. These user fees help offset operational costs. Catering Permits and Services This is a license to allow caterers to work in the park system on a permit basis with a set fee or a percentage of food sales returning to the City. Also many cities have their own catering service. Maintenance Endowments Maintenance Endowments are set up for organizations and individuals to invest in ongoing maintenance improvements and infrastructure needs. Endowments retain money from user fees, individual gifts, impact fees, development rights, partnerships, conservation easements, and for wetland mitigations. Tax on Sporting Goods In some states, the states collect a sales tax on sporting goods equipment as it applies to fishing and boating supplies and recreation equipment. This revenue is redistributed to cities on a population basis and from licenses sold.
126 | Tulsa, OK Parks and Recreation Master Plan Final Report
Fishing License for City-owned Lakes Some cities have their own put-and-take fish operation and enact city-specific fishing regulations and permits for their own lakes for trout and specialty fish. Lighting Fees Some cities charge additional fees for the lighting charges for leagues, special use sites, and signature type facilities that require lighting above a recreational level. This is based on demand. Program Contractor Fees Cities receive a percentage of gross contractor fees for contractor programs held at City facilities. The percentages range from 25% to 40% depending on space, volume, and the amount of marketing the City does for the contractor. Dog Park Fees These fees are attached to kennel clubs for the right for their club to have exclusive use of the park at scheduled times. Fees are on the dogs themselves and on people who take care of other people’s dogs. Patron Cards This provides patrons of a specific recreational facility to purchase a card for a month or a year that allows them special privileges above the general public. These privileges include early tee times, reservations, and special tours, shows, or events. The patron cards range in price from $15.00 a month to $150.00 a year. Hospitality Centers These types of recreation facilities are developed by cities for use by the public for wedding, reunions, and special gatherings. The recreation facilities are not subsidized but operate at a profit. Some facilities are managed by outside caterers. Community Gardens Many city agencies will permit out food plots for community gardens as a small source of income. These funding sources are potential funding opportunities the City of Tulsa Parks and Recreation Department should consider for additional funding of capital and operational expenditures. Industrial Development Bonds Specialized revenue bonds are issued on behalf of publicly owned, self-supporting facilities. Authority or District The City can create a recreation authority or district that might better allow the Department to initiate long-term successes. Many successful park districts exist throughout the country and facilitate creative business approaches to leisure services that some governmental entities cannot provide. Cost Avoidance The Department must take a position of not being everything for everyone. It must be driven by the market and stay with the Department’s core businesses. By shifting its role as direct provider, the City will experience savings by deciding whether or not to provide that facility or program. This is cost avoidance. Savings could be realized through partnering, outsourcing, or deferring to another provider in the provision of a service and/or facility.
Tulsa, OK Parks and Recreation Master Plan Final Report| 127
Designated License Plate for Parks This funding mechanism can be used to finance improvements or programs in the City through a designated license plate. Cell Towers Cell towers are attached to existing light poles in game field complexes through a lease with the city. Private Developers These developers lease City-owned land through a subordinate lease that pays out a set dollar amount plus a percentage of gross dollars for recreation enhancements. These could include a golf course, restaurants, driving ranges, sports complexes, equestrian facilities, and recreation centers. Reallocation of General Fund The city can reallocate additional portions of the existing general fund to the Parks and Recreation Department. This dedicated funding mechanism was supported by 53% in the citizen’s survey. Entertainment Tax This tax is on ticket sales for major entertainment venues such as concert facilities, golf tournaments, and large venues to help pay for traffic control and crowd control. This tax also applies to video game machines. Permits (Special Use Permits) These special permits allow individuals to use specific park property for financial gain. The City receives either a set amount of money or a percentage of the gross service that is being provided. Oil Drilling Fees The city can assess fees for unobtrusive oil drilling in large tracts of undeveloped parkland such as Mohawk Park and utilize the revenue for parks and recreation operations and capital improvements. This funding source was supported by 53% in the citizen’s survey. Sale of Mineral Rights Many cities sell their mineral rights under parks for revenue purposes to include water, oil, natural gas and other by products for revenue purposes. Integrated Financing Act This legislation creates an alternate method for collecting assessments levied under the Landscaping and Lighting Act, the Vehicle Parking District Law and the Park and Playground Act. This act applies to all local agencies. This act can be used to pay the cost of planning, designing, and constructing capital facilities authorized by the applicable financing act, pay for all or part of the principle and interest on debt incurred pursuant to the applicable financing act and to reimburse a private investor in the project. It serves two unique properties: (1) it can levy an assessment which is contingent upon future land development and payable upon approval of a subdivision map or zone change or the receipt of building permits; (2) it allows the local agency to enter into an agreement with a private investor whereby the investor will be reimbursed for funds advanced to the agency for the project being financed.
128 | Tulsa, OK Parks and Recreation Master Plan Final Report
Earnings Fee This fee can apply to communities who have high population of workers who do not live in the City but work in the City. The employees pay 0.5% of their total salary earned to the City to cover safety forces, streets, public works, and park and open space services Leasebacks on Recreational Facilities Can Produce Revenue Many cities do not have capital dollars to build revenue-producing facilities but they will hire a private investor to build the facility according to the specifications they want and the investment company will finance the project and the City will lease it back from them over 20 years. This can be reversed where by the City builds the facility and leases to private management to operate it for a percentage of gross dollars to pay off the construction loans through a subordinate lease. Recreation Surcharge Fees on Sports and Entertainment Tickets, Classes, MasterCard, Visa, etc. This fee is a surcharge on top of the regular program fee or convenience fee for use of MasterCard and Visa. The fee usually is no more than $5.00 and usually is $3.00 on all exchanges. The money earned is used to help pay off the costs of improvement or for operational purposes. Family Tree Program Many cities have worked with local hospitals to provide cash to the parks system to buy and plant a tree in honor of every new born in the City. The hospitals invest $250.00 to $300.00 and receive the credit from the parents of the newborns. The parks system gets new trees of ample size similar to the Up with Trees program. Sell Development Rights Some cities sell their development rights below park ground or along trails to fiber optic companies or utilities. The park agency retains a yearly fee on a linear foot basis. Booth Lease Space Some cities sell booth space to sidewalk type vendors in parks or at special events for a flat rate based on volume received. The booth space can also apply to farmers markets, art schools, antique type fairs, festivals, etc. Reverse Sponsorships This revenue source allows agencies to receive indirect revenue from cross promoting their current sponsors with high profile professional sporting events and significant sports heroes. Indirect sponsorships provide up to 15% of the sponsorship value back to the City for linking their parks and recreation sponsors with professional sports. Signage Fees This revenue source comes from allowing people and businesses to have signs at key locations with high visibility for short-term events. Signage fees range in price from $25.00 per sign up to $100.00 per sign based on the size of the sign and location.
Tulsa, OK Parks and Recreation Master Plan Final Report| 129
Manufacturing Product Testing and Display The city works with specific manufacturers to test their products in parks, recreation facilities, and program services. The city tests the product under normal conditions and reports back to the manufacturer how their product is doing. Examples are in lighting, playgrounds, tires on vehicles, mowers, irrigation systems, seed & fertilizers (etc.). The city gets the product for free but must pay for the costs of installation and for tracking results. Product Sales The city sells specific products for purchases or consumption by the public. This would include art, trees, plants, food, etc. Recycling Centers Some cities operate recycling centers for wood, mulch, and glass as profit centers for their systems. Local Option Income Tax Local option income tax allows cities to levy a quarter to a half cent as income taxes to support parks and recreation services, facilities, and land. This is usually not voted on by the community but is within the home rule charter of the city. If implemented, it needs to coincide with existing city ordinances and codes. These funding sources are potential funding opportunities the City of Tulsa Parks and Recreation Department could consider for additional funding of capital and operational expenditures. These funding sources may not be available currently in the state or an intergovernmental agreement may be necessary for implementation. These funding sources may meet with some resistance and be more difficult to implement. Dedication/Development Fees These fees are assessed for the development of residential and/or commercial properties with the proceeds to be used for parks and recreation purposes, such as open space acquisition, community park site development, neighborhood park development, regional park development, etc. Hotel, Motel and Restaurant Tax The city could levy a tax based on gross receipts from charges and meals services, which may be used to build and operate sports fields, regional parks, golf courses, tennis courts, and other special park and recreation facilities. Annual Appropriation/Leasehold Financing This is a more complex financing structure which requires use of a third party to act as issuer of the bonds, construct the facility and retain title until the bonds are retired. The city enters into a lease agreement with the third party, with annual lease payments equal to the debt service requirements. The bonds issued by the third party are considered less secure than general obligation bonds of the city, and are therefore more costly. Since a separate corporation issues these bonds, they do not impact the city’s debt limitations and do not require a vote. However, they also do not entitle the city to levy property taxes to service the debt. The annual lease payments must be appropriated from existing revenues.
130 | Tulsa, OK Parks and Recreation Master Plan Final Report
Real Estate Transfer Fees As cities expand, the need for infrastructure improvements continues to grow. Since parks add value to neighborhoods and communities, some cities and counties have turned to real estate transfer fees to help pay for needed renovations. Usually transfer fees amount to ¼ to ½ % on the total sale of the property. Rental Car Tax This tax is typically designated for new or improved facilities within the city. Some cities have used a dedicated percentage of rental car taxes to support land acquisition or improvements in parks. Facilities Benefit Assessment (FBA) The FBA ordinance establishes areas of benefit to be assessed for needed improvements in newly developing areas. Each parcel within an area of benefit is apportioned its share of the total assessment for all improvements (including those required for later development phases) which is then recorded on the assessment roll. Assessments are liens on private property as with the state assessment acts. Upon application for a building permit the owner of the parcel must pay the entire assessment (the payment is prorated if only a portion of the parcel is being developed at one time). Payment releases the city's lien on the property. The funds that are collected are placed in separate accounts to be used for the needed improvements and do not exceed the actual cost of the improvements plus incidental administrative costs. Licensing Rights This revenue source allows the department and city to license its name on all resale items that private or public vendors use when they sell clothing or other items with the city’s name on it. The normal licensing fee is 6 to 10% of the cost of the resale item. Food and Beverage Tax The tax is usually associated with convention and tourism bureaus. However, since parks and recreation agencies manage many of the tourism attractions and/or events, they can receive a portion of this funding source for operational or capital expenses. Boulevard Tax Homeowners who live along scenic boulevards pay this tax based on a lineal foot. The City of Kansas City has this tax in place and covers the cost of improvements, fountains and turf and landscape care. Utility Roundup Programs Some park and recreation agencies have worked with their local utilities on a round up program whereby a consumer can volunteer to pay the difference between their bill up to the next even dollar amount and the department receives the difference. Ideally, these monies are used to support utility improvements such as sports lighting, irrigation cost and HVAC costs. Franchise Fee on Cable This allows cities to add a franchise fee on cable to be designated for parks. The normal fee is $1.00 a month or $12.00 a year per household. Fees are usually designated for open space acquisition or capital improvements.
Tulsa, OK Parks and Recreation Master Plan Final Report| 131
Solid Waste Fee Cities are able to add cost for landfills and drop stations that are designated to provide space and facilities for both. Once these fees cover the cost of buildings and landfills they can re-dedicate a percentage to other city services. Several cities have opted to finance park improvements from solid waste fees. Trash Pick-up Fee Cities can add a special assessment to trash pick-up fees paid by homeowners and businesses to help cover the costs of parks and recreation operations. The suggested fee for Tulsa is an additional $2 per month or a percentage of the bill (2 or 3%). Water Utility Fee Cities have added a special assessment to water utility fees paid by homeowners and businesses to cover the costs to water street trees, landscaping, fountains, and pools. The fee is usually a percentage of the bill (2 or 3%). Insurance Tax Cities can tax insurance payments to insurance premiums on homes, cars, inventory and equipment. Parks and Recreation Departments can receive a percentage of the city’s tax collected on insurance premiums. This tax is for Parks and Recreation and is typically used for dedicated purposes to reduce liability in Parks and Recreation facilities although some cities have used it for new capital improvements. Room Overrides on Hotels for Sports Tournaments and Special Events Cities keep a percentage of hotel rooms that are booked when the city hosts a major sports tournament or special event. The overrides are usually $5.00 to $10.00 depending on what type of room. Monies collected help offset operational costs for the city in hosting the events. Hospital – Rehabilitation Contracting Cities contract with hospitals for their rehab patient’s work that can be provided at local recreation centers with their therapists overseeing the work. This provides a steady level of income for the fitness center and encourages patients after rehab to join. Payments are made by health insurance companies. Film Rights Many cities permit out their sites such as old ballparks or unique grounds to film commissions. The film commission pays a daily fee for the site plus the loss of revenue the city will incur by allowing exclusive use of the site.
132 | Tulsa, OK Parks and Recreation Master Plan Final Report
VI. Great Things to Come – Recommendations & Action Plans
A. Recommendations Capital Improvements Tulsa is a city that is spread widely across the landscape. According to www.city-data.com, in 2008 Tulsa had a population of 385,635 and covered 182.6 square miles with an average population density of 2111 persons per square mile. However, this is not unusual in this part of the country. Colorado Springs is a good comparison. It is shown to have a 2008 population of 380,307 and a land area of 185.7 square miles, with a population density of 2047 people per square mile. Other cities with similar densities include Shreveport, Louisiana with 1936 persons per square mile, Corpus Christi, Texas with 1852 per square mile, and Lubbock, Texas with 1920 per square mile. By comparison, Oklahoma City covers 607 square miles and has 909 persons per square mile, and Denver, which is similar in land area at 153.4 square miles, has a density of 3904 persons per square mile. While Tulsa is typical of many mid-sized cities in the United States with relatively low population densities, it nonetheless has a robust park system, with over 6,000 acres of parkland in the inventory, or about 16 acres per 1,000 persons. This is a healthy ratio and a satisfactory one that does not call for any major adjustments. The focus should be on what is offered within this acreage and how it meets the needs of Tulsans. The park acreage currently is a mix of developed and undeveloped sites. These are well distributed throughout the city. Although some gaps may occur on a small scale, overall there are no developed parts of the city that do not have reasonable access to some type of park land. In general, Tulsa’s park system offers an adequate amount of developed parks in suitable locations. A more critical issue is the condition and configuration of those parks. Tulsa has many parks of approximately the same age that are reaching a point in their life cycle where replacement/refurbishment/repurposing/etc. is needed. These parks were well suited to the era in which they were built, but have changed little since, while life in Tulsa has evolved. The demographics, lifestyles, and needs of Tulsans are different today than they were forty or fifty years ago. An organized strategy for dealing with this is needed. Tulsa’s parks need to be looked at closely to determine what things within them are timeless, and what things are no longer relevant. Prioritization is needed to determine if some things should be removed or replaced. One way to start is by identifying all existing components that scored a one or less in the inventory, and deciding for each of these to perform one of the following actions:
Repair: Perform actions needed to maintain the component in a functional condition or return it to such condition. An example would be to repair a damaged piece of equipment, apply a fresh coat of paint to a shelter, etc. This should be done when the component serves a desired function and is capable of continuing to do so for the next five to ten years if repairs are made. Replace: Put in something new that serves the intended function of the original. An example would be to replace an outdated playground with new equipment. This should be done when the function is still important, but the component is inadequate for that function.
Tulsa, OK Parks and Recreation Master Plan Final Report| 133
Repurpose: Reconfigure the existing or put something in its place to accommodate a different function than the original. Putting in a spray park in place of an old swimming pool would be one example. Turning a baseball field into a dog park is another example. This should be done when something no longer serves its function, and the function it serves is no longer needed, or can be addressed better in a different location, and the space it occupies is needed for something of higher importance. Remove: Remove the component and simply refurbish the location to some non-specific function. Filling in and landscaping over an old swimming pool would be one example. This should be done when an existing component no longer serves its function and is a hazard, eyesore, or nuisance, and the space is not currently needed for another specific purpose. See Appendix XII for information on the process of removing nonfunctional or obsolete facilities. Leave as-is: either allow the item to remain in a low-functioning condition or stabilize it until a decision on what to do can be made. Sometimes things are kept because they are unique, historic, or people love them they way they are. Things like art, fountains, etc. are sometimes like this. This could also include something like “mothballing” an old structure until funds can be found to restore it. This should be done when something is acceptable in a low-functioning condition because it has other values (such as historic value), or to preserve it until funds become available, or a new use is found, etc.
A strategy for addressing the repair/refurbishment/replacement or re-purposing of low-functioning components should include the following elements. This should be followed for each individual component in the inventory that is not functioning up to expectations. Determine why the component is functioning below expectations. Was it poorly conceived in the first place? Was it something that was not needed to begin with? Was it the wrong size, type, or configuration? Is it poorly placed, or located in a way that conflicts with other uses or detracts from its use? Have the needs changed in a way that the component is outdated, obsolete, or no longer needed? Has it been damaged? Or, has the maintenance of the component simply been deferred or neglected to the point where it no longer functions as intended? Another possibility is that the component was scored low because it is not available to the public in a way that meets expectations. For example, the BMX course at Carl Smith was rated low because it is leased to a private group and not open to the general public. This may be a perfectly acceptable situation and appropriately scored, because the BMX course provides service to the public – there might not be any BMX course available at all if the group did not provide it and offer people the opportunity to join – but the service is at a lower value because of the limitations on access. Another possibility would be when a component is old, outdated, or otherwise dysfunctional, but has historic or sentimental value. While no such components were identified in the inventory, they might be identified in a future inventory. An example would be something like an old structure in a park such as a stone gatepost, or other artifact that cannot be restored to its original purpose, but which has historic value.
134 | Tulsa, OK Parks and Recreation Master Plan Final Report
Depending on the answers to the first question, a strategy can be selected for addressing the low-functioning component:
If the need for that type of component in its current location still exists, then the component should be repaired or replaced to match its original condition as much as possible. Examples of this would be some of the playgrounds with old, damaged, or outdated equipment, or courts with poor surfacing or missing nets. If the need for that type of component has changed to the point where the original one is no longer suitable, then it should be replaced with a new one that fits the current needs. For example, if a picnic shelter is too small for the amount of use currently demanded, it may be replaced with a new, larger one.
If a component is poorly located, or was poorly designed to start with, consideration should be given to relocating, redesigning, or otherwise modifying it. An example would be the small amphitheater at Hall Center. The noise from the highway nearby makes it undesirable to use for any kind of presentation or performance. If there is a need for this type of facility at this park, then consideration should be given to relocating it or redesigning it to provide screening from traffic and other noise.
If a component is no longer needed because of changing demands, then it should be removed unless it can be maintained in good condition without excessive expense, or unless it has historic or sentimental value. Some of the tennis courts may fall into this category. If a court has been allowed to deteriorate because the surrounding neighborhood has no desire for tennis courts, then the court should be repurposed into some other use such as a basketball court, play-pad for hopscotch and four-square, or skating feature. Maybe it can become a trike-track course. Or it could become the surface for a large group picnic shelter. Another possibility might be to install outdoor fitness stations and make it an “outdoor gym.”
The choice of what to put in the court’s place should be made with input from the neighborhood. This could be done with a simple intercept survey, door-hung questionnaire, or by contacting a neighborhood organization. The point is that it makes no sense to replace something that the neighborhood no longer needs with something else it doesn’t need.
If no appropriate alternative use for the court or the space it occupies is identified, it should be removed to avoid a blighted appearance, and the space should be integrated into the rest of the park with landscaping.
It is possible that through ongoing public input, and as needs and trends evolve; new needs will be identified for existing parks. If there is no room in an existing park for new needs, the decision may be made to remove or re-purpose an existing component, even if it is quite functional. An example of this could be found in some communities a few years ago. As the popularity of tennis declined and demand for courts dropped off, perfectly good courts were sometimes converted into skate parks or inline rinks. In most cases this was an interim use, intended to satisfy a short-term need until a decision could be made to either construct a permanent facility or let the passing fad fade. The need for inline rinks seems to have diminished over time while temporary skate parks on tennis courts have been moved to permanent and more elaborate facilities as skateboarding and other wheel sports have grown in popularity and permanence.
Tulsa, OK Parks and Recreation Master Plan Final Report| 135
Similar actions could occur in Tulsa, and an example of this can be found in the re-purposing of the Newblock ballfield into a dog park. It is likely that in time either this facility will become a permanent facility designed specifically to meet the needs of people recreating with their dogs, or such a facility will be constructed elsewhere to suit that purpose. Or, it could turn out that dog parks fade in popularity like inline hockey rinks, or are replaced with some other facility that dog owners prefer even more than the current dog park model. Meanwhile, the use of Newblock for this purpose is a good interim solution. Trends to keep an eye on as Tulsa decides what to do with low-functioning facilities, or how to make existing parks fit the needs of residents as highly as possible, include things like:
Dog parks continue to grow in popularity. This may have something to do with an aging demographic in America, with more “empty-nesters” transferring the attention they once gave to their children, who are now grown, to their pets. It is also an important form of socializing for people who once socialized with the other parents in their child’s soccer league enjoying the company of other dog owners now that the kids are grown. For singles, it is a good place to meet people as well.
Skating continues to grow in popularity. Making neighborhood parks skateable and distributing skating features throughout the community provides greater access to this activity for younger people who cannot drive to a larger centralized skate park.
A desire for locally grown food and concerns about health, sustainability, and other issues is leading to the development of community food gardens in parks and other public spaces.
Events in parks, from a neighborhood “movie in the park” to large festivals in regional parks, are growing in popularity as a way to build a sense of community. Providing spaces for these could become a trend.
Sprayparks are growing rapidly in popularity, even in cooler climates than Tulsa’s. Tulsa’s parks already have a good number of spray pads, but a wide and growing selection of products for these is raising the bar on expectations. These can become much more interesting, exciting, fun, and memorable than the simple facilities currently found in Tulsa’s parks.
New types of playgrounds are emerging, including discovery play, nature play, and adventure play. Some of these rely upon movable parts, supervised play areas, and other variations that are different from the standard fixed “post and platform” playgrounds found in the typical park across America.
Integrating nature into parks by creating natural areas is a trend for a number of reasons. These include a desire to make parks more sustainable and introduce people of all ages to the natural environment. An educational aspect is an important part of these areas.
Table 27 shows a list of components from the inventory that were given a score of “one” for Neighborhood Service. A program should be initiated to visit each of these in more detail and make a determination for each as described above. A cost should be estimated for the selected action in each case and a budget developed to address all of them in the next three to five years.
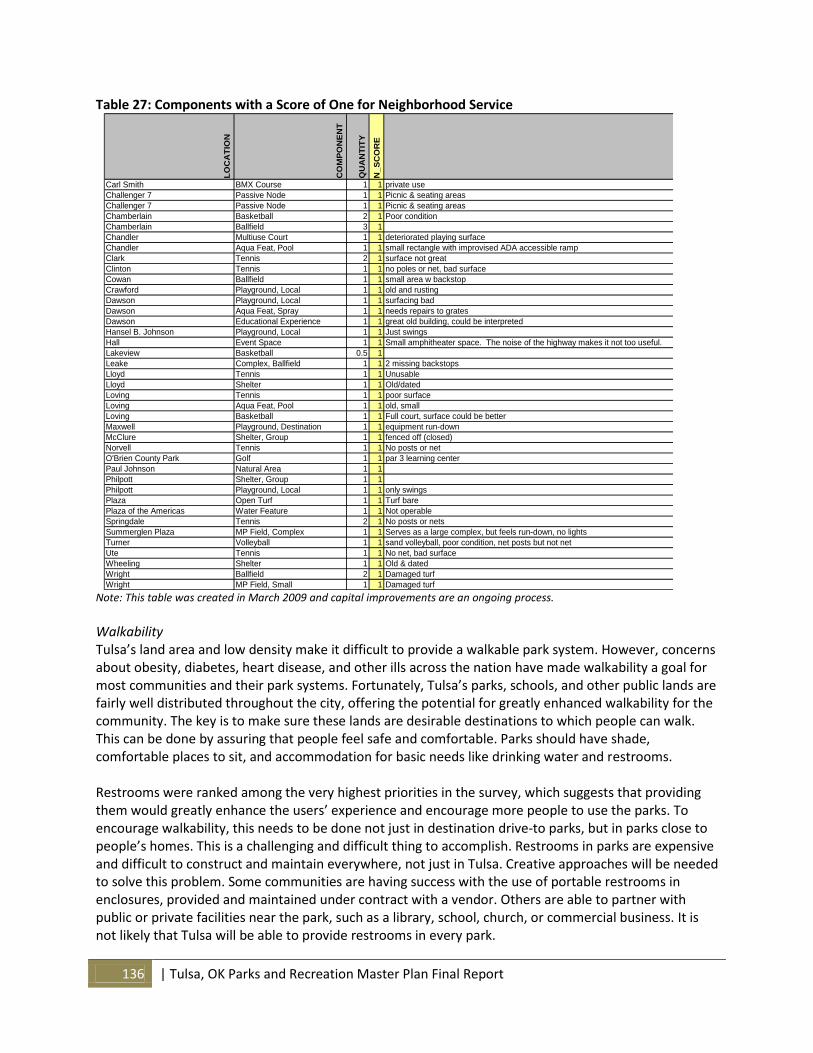
136 | Tulsa, OK Parks and Recreation Master Plan Final Report
Table 27: Components with a Score of One for Neighborhood Service
Note: This table was created in March 2009 and capital improvements are an ongoing process.
Walkability Tulsa’s land area and low density make it difficult to provide a walkable park system. However, concerns about obesity, diabetes, heart disease, and other ills across the nation have made walkability a goal for most communities and their park systems. Fortunately, Tulsa’s parks, schools, and other public lands are fairly well distributed throughout the city, offering the potential for greatly enhanced walkability for the community. The key is to make sure these lands are desirable destinations to which people can walk. This can be done by assuring that people feel safe and comfortable. Parks should have shade, comfortable places to sit, and accommodation for basic needs like drinking water and restrooms. Restrooms were ranked among the very highest priorities in the survey, which suggests that providing them would greatly enhance the users’ experience and encourage more people to use the parks. To encourage walkability, this needs to be done not just in destination drive-to parks, but in parks close to people’s homes. This is a challenging and difficult thing to accomplish. Restrooms in parks are expensive and difficult to construct and maintain everywhere, not just in Tulsa. Creative approaches will be needed to solve this problem. Some communities are having success with the use of portable restrooms in enclosures, provided and maintained under contract with a vendor. Others are able to partner with public or private facilities near the park, such as a library, school, church, or commercial business. It is not likely that Tulsa will be able to provide restrooms in every park.
LO
CA
TIO
N
CO
MP
ON
EN
T
QU
AN
TIT
Y
N_
SC
OR
E
CO
MM
EN
TS
Carl Smith BMX Course 1 1 private use
Challenger 7 Passive Node 1 1 Picnic & seating areas
Challenger 7 Passive Node 1 1 Picnic & seating areas
Chamberlain Basketball 2 1 Poor condition
Chamberlain Ballfield 3 1
Chandler Multiuse Court 1 1 deteriorated playing surface
Chandler Aqua Feat, Pool 1 1 small rectangle with improvised ADA accessible ramp
Clark Tennis 2 1 surface not great
Clinton Tennis 1 1 no poles or net, bad surface
Cowan Ballfield 1 1 small area w backstop
Crawford Playground, Local 1 1 old and rusting
Dawson Playground, Local 1 1 surfacing bad
Dawson Aqua Feat, Spray 1 1 needs repairs to grates
Dawson Educational Experience 1 1 great old building, could be interpreted
Hansel B. Johnson Playground, Local 1 1 Just swings
Hall Event Space 1 1 Small amphitheater space. The noise of the highway makes it not too useful.
Lakeview Basketball 0.5 1
Leake Complex, Ballfield 1 1 2 missing backstops
Lloyd Tennis 1 1 Unusable
Lloyd Shelter 1 1 Old/dated
Loving Tennis 1 1 poor surface
Loving Aqua Feat, Pool 1 1 old, small
Loving Basketball 1 1 Full court, surface could be better
Maxwell Playground, Destination 1 1 equipment run-down
McClure Shelter, Group 1 1 fenced off (closed)
Norvell Tennis 1 1 No posts or net
O'Brien County Park Golf 1 1 par 3 learning center
Paul Johnson Natural Area 1 1
Philpott Shelter, Group 1 1
Philpott Playground, Local 1 1 only swings
Plaza Open Turf 1 1 Turf bare
Plaza of the Americas Water Feature 1 1 Not operable
Springdale Tennis 2 1 No posts or nets
Summerglen Plaza MP Field, Complex 1 1 Serves as a large complex, but feels run-down, no lights
Turner Volleyball 1 1 sand volleyball, poor condition, net posts but not net
Ute Tennis 1 1 No net, bad surface
Wheeling Shelter 1 1 Old & dated
Wright Ballfield 2 1 Damaged turf
Wright MP Field, Small 1 1 Damaged turf
Tulsa, OK Parks and Recreation Master Plan Final Report| 137
A clear policy should be adopted for when and how they are to be provided, and this should be communicated to the public so that they understand the nature of the issue, the costs and other problems associated with it, and how the parks department is addressing it. Restrooms should be a distinct part of any cost recovery philosophy the Department adopts, not as a revenue-generating feature, but certainly as one that has to be consciously subsidized in the service delivery equation. Partnerships with alternative providers can also be capitalized upon to create a well-distributed set of destinations throughout the community. For example, schools can become inviting destinations for the immediate neighborhood with shade, shelter, seating, etc. This is being done successfully in places like Denver, Colorado through the Learning Landscapes Program.10 Other opportunities to add more greenspace can be sought out wherever possible. For example, park amenities can be required in redevelopments of existing areas. Recreational trails should be extended into existing neighborhoods and parks as much as possible. Tulsa also has a number of existing reservoirs that should be considered as possible additions to the parks system. A simple loop trail with interpretive signs, benches, and picnic tables would be sufficient to make the reservoirs into healthy and enjoyable destinations for local residents. Aquatics Pools are an issue in Tulsa from many perspectives. Financial and management challenges aside, there are also functional concerns with some of Tulsa’s existing pools. A detailed assessment of pools was conducted to determine the feasibility of operating each existing pool. Proposed actions for each pool, using the 2007 Pool Assessment Report, should then be made. Some pools would remain active, some pools could be mothballed for future use, others slated for replacement, and some for decommissioning and removal, perhaps to be replaced with a sprayground or other feature. A strategy for upgrading existing spray pads in key locations should be created to provide a draw for the larger neighborhood, especially where no pools are available. This could be done as part of the creation of Destination parks described later in this section. Tennis While tennis ranked lower in priority in the survey results than other items, it is an evolving trend that should be addressed. Tennis enjoyed a very high level of popularity back when many of Tulsa’s parks were built. In the intervening years it declined in popularity, and the quality of Tulsa’s tennis courts declined with it. Many courts in the city are in very poor condition today. However, trends indicate that the popularity of tennis is once again on the increase. This trend should be monitored in Tulsa to determine if courts that are currently underused will be in demand at some point in the future. If so, measures should be taken to return these to functional condition and retain them in the parks. If not, ones that are in disrepair should be removed. These include courts at the following parks which scored a one or less in the inventory:
Lloyd
Springdale
Clinton
Ute
Norvell
Loving
Clark
10
For more information on this program see www.LearningLandscapes.org
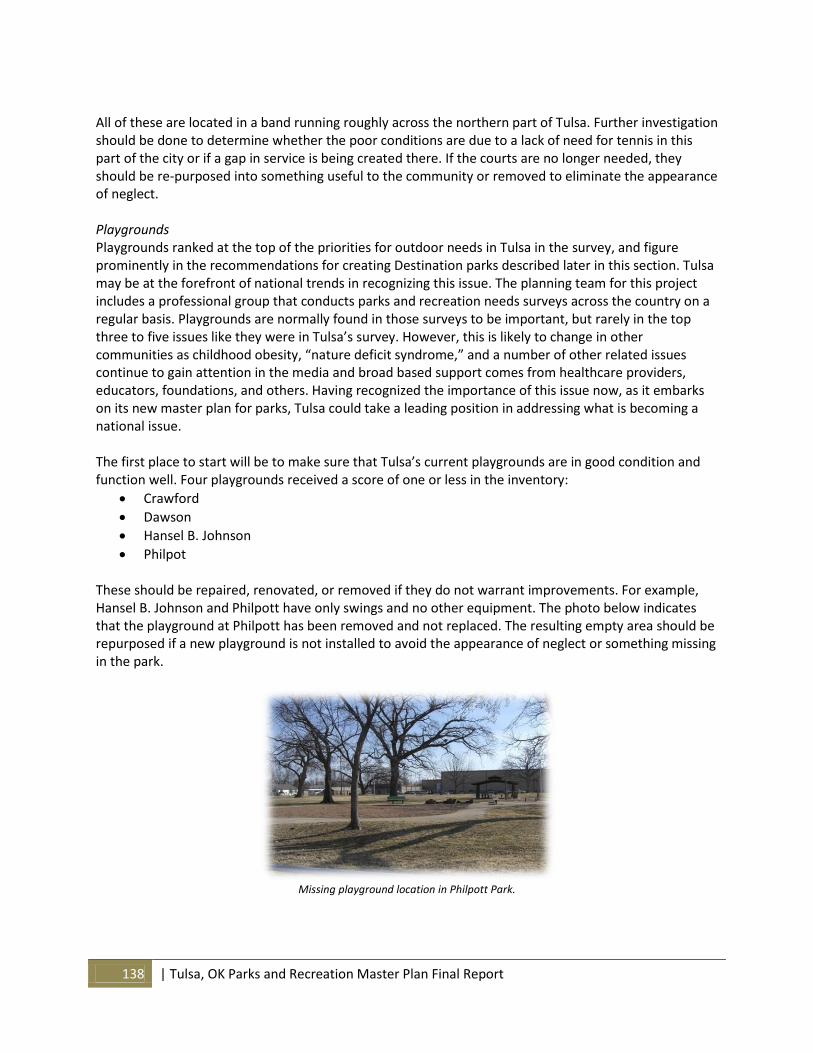
138 | Tulsa, OK Parks and Recreation Master Plan Final Report
All of these are located in a band running roughly across the northern part of Tulsa. Further investigation should be done to determine whether the poor conditions are due to a lack of need for tennis in this part of the city or if a gap in service is being created there. If the courts are no longer needed, they should be re-purposed into something useful to the community or removed to eliminate the appearance of neglect. Playgrounds Playgrounds ranked at the top of the priorities for outdoor needs in Tulsa in the survey, and figure prominently in the recommendations for creating Destination parks described later in this section. Tulsa may be at the forefront of national trends in recognizing this issue. The planning team for this project includes a professional group that conducts parks and recreation needs surveys across the country on a regular basis. Playgrounds are normally found in those surveys to be important, but rarely in the top three to five issues like they were in Tulsa’s survey. However, this is likely to change in other communities as childhood obesity, “nature deficit syndrome,” and a number of other related issues continue to gain attention in the media and broad based support comes from healthcare providers, educators, foundations, and others. Having recognized the importance of this issue now, as it embarks on its new master plan for parks, Tulsa could take a leading position in addressing what is becoming a national issue. The first place to start will be to make sure that Tulsa’s current playgrounds are in good condition and function well. Four playgrounds received a score of one or less in the inventory:
Crawford
Dawson
Hansel B. Johnson
Philpot These should be repaired, renovated, or removed if they do not warrant improvements. For example, Hansel B. Johnson and Philpott have only swings and no other equipment. The photo below indicates that the playground at Philpott has been removed and not replaced. The resulting empty area should be repurposed if a new playground is not installed to avoid the appearance of neglect or something missing in the park.
Missing playground location in Philpott Park.
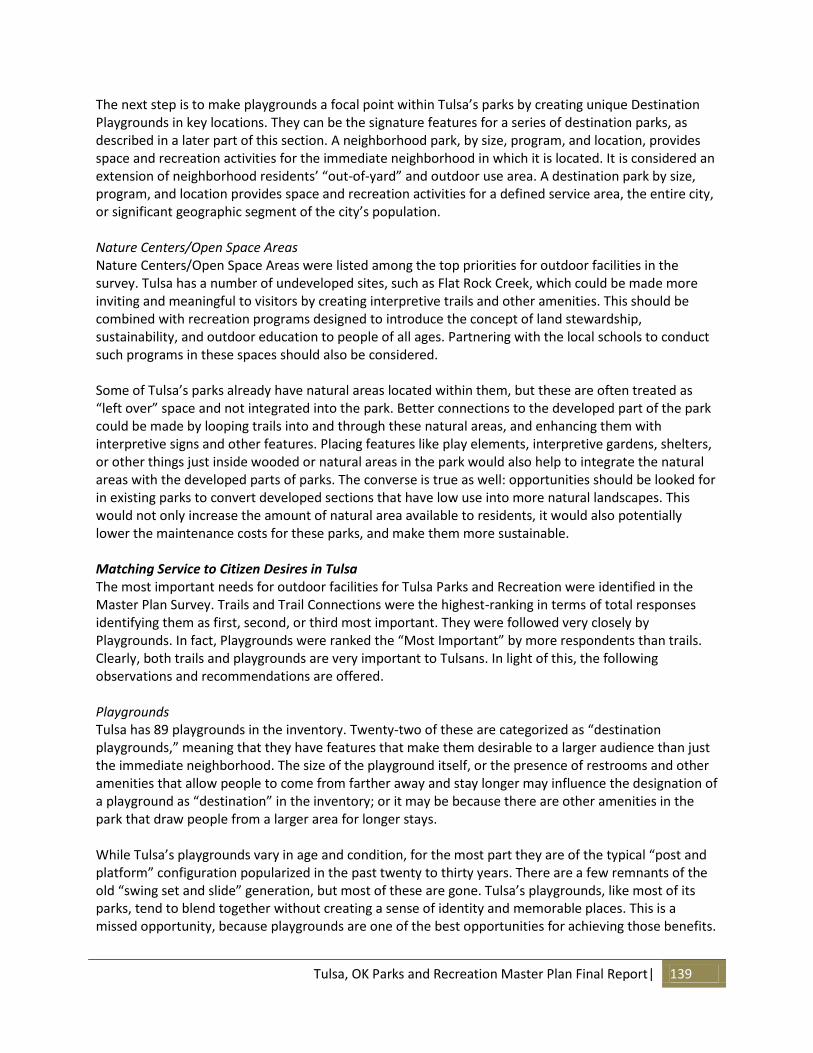
Tulsa, OK Parks and Recreation Master Plan Final Report| 139
The next step is to make playgrounds a focal point within Tulsa’s parks by creating unique Destination Playgrounds in key locations. They can be the signature features for a series of destination parks, as described in a later part of this section. A neighborhood park, by size, program, and location, provides space and recreation activities for the immediate neighborhood in which it is located. It is considered an extension of neighborhood residents’ “out-of-yard” and outdoor use area. A destination park by size, program, and location provides space and recreation activities for a defined service area, the entire city, or significant geographic segment of the city’s population. Nature Centers/Open Space Areas Nature Centers/Open Space Areas were listed among the top priorities for outdoor facilities in the survey. Tulsa has a number of undeveloped sites, such as Flat Rock Creek, which could be made more inviting and meaningful to visitors by creating interpretive trails and other amenities. This should be combined with recreation programs designed to introduce the concept of land stewardship, sustainability, and outdoor education to people of all ages. Partnering with the local schools to conduct such programs in these spaces should also be considered. Some of Tulsa’s parks already have natural areas located within them, but these are often treated as “left over” space and not integrated into the park. Better connections to the developed part of the park could be made by looping trails into and through these natural areas, and enhancing them with interpretive signs and other features. Placing features like play elements, interpretive gardens, shelters, or other things just inside wooded or natural areas in the park would also help to integrate the natural areas with the developed parts of parks. The converse is true as well: opportunities should be looked for in existing parks to convert developed sections that have low use into more natural landscapes. This would not only increase the amount of natural area available to residents, it would also potentially lower the maintenance costs for these parks, and make them more sustainable. Matching Service to Citizen Desires in Tulsa The most important needs for outdoor facilities for Tulsa Parks and Recreation were identified in the Master Plan Survey. Trails and Trail Connections were the highest-ranking in terms of total responses identifying them as first, second, or third most important. They were followed very closely by Playgrounds. In fact, Playgrounds were ranked the “Most Important” by more respondents than trails. Clearly, both trails and playgrounds are very important to Tulsans. In light of this, the following observations and recommendations are offered. Playgrounds Tulsa has 89 playgrounds in the inventory. Twenty-two of these are categorized as “destination playgrounds,” meaning that they have features that make them desirable to a larger audience than just the immediate neighborhood. The size of the playground itself, or the presence of restrooms and other amenities that allow people to come from farther away and stay longer may influence the designation of a playground as “destination” in the inventory; or it may be because there are other amenities in the park that draw people from a larger area for longer stays. While Tulsa’s playgrounds vary in age and condition, for the most part they are of the typical “post and platform” configuration popularized in the past twenty to thirty years. There are a few remnants of the old “swing set and slide” generation, but most of these are gone. Tulsa’s playgrounds, like most of its parks, tend to blend together without creating a sense of identity and memorable places. This is a missed opportunity, because playgrounds are one of the best opportunities for achieving those benefits.
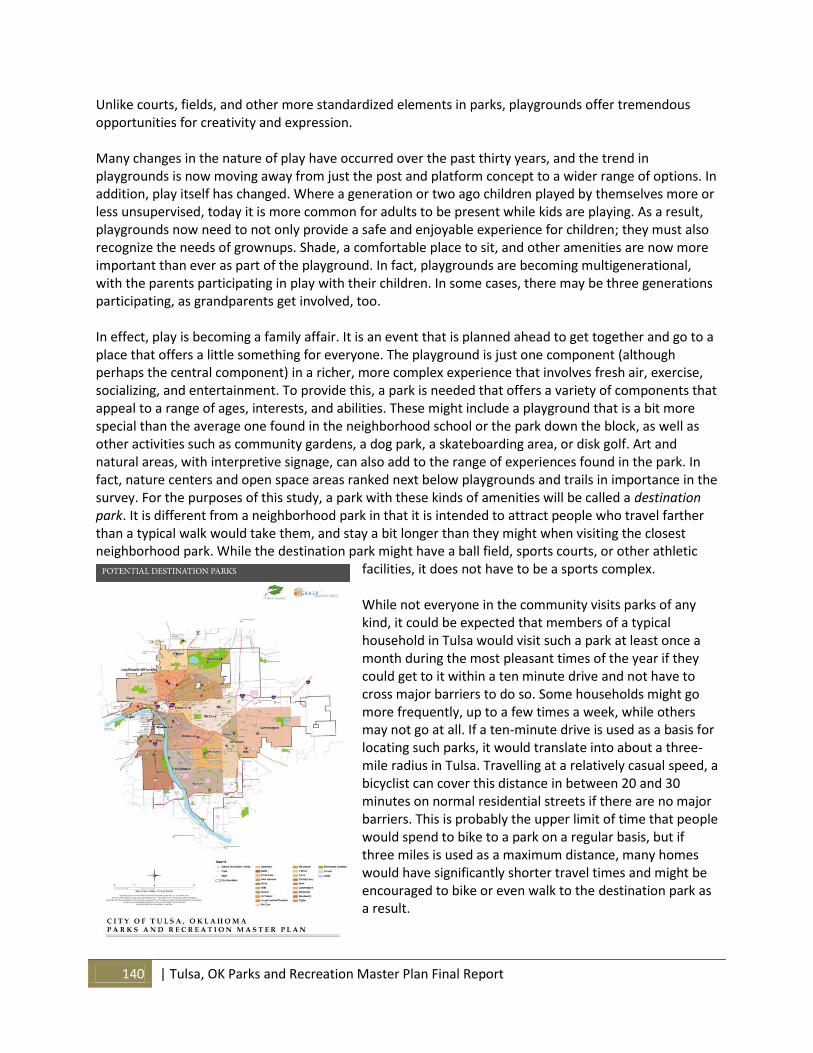
140 | Tulsa, OK Parks and Recreation Master Plan Final Report
Unlike courts, fields, and other more standardized elements in parks, playgrounds offer tremendous opportunities for creativity and expression. Many changes in the nature of play have occurred over the past thirty years, and the trend in playgrounds is now moving away from just the post and platform concept to a wider range of options. In addition, play itself has changed. Where a generation or two ago children played by themselves more or less unsupervised, today it is more common for adults to be present while kids are playing. As a result, playgrounds now need to not only provide a safe and enjoyable experience for children; they must also recognize the needs of grownups. Shade, a comfortable place to sit, and other amenities are now more important than ever as part of the playground. In fact, playgrounds are becoming multigenerational, with the parents participating in play with their children. In some cases, there may be three generations participating, as grandparents get involved, too. In effect, play is becoming a family affair. It is an event that is planned ahead to get together and go to a place that offers a little something for everyone. The playground is just one component (although perhaps the central component) in a richer, more complex experience that involves fresh air, exercise, socializing, and entertainment. To provide this, a park is needed that offers a variety of components that appeal to a range of ages, interests, and abilities. These might include a playground that is a bit more special than the average one found in the neighborhood school or the park down the block, as well as other activities such as community gardens, a dog park, a skateboarding area, or disk golf. Art and natural areas, with interpretive signage, can also add to the range of experiences found in the park. In fact, nature centers and open space areas ranked next below playgrounds and trails in importance in the survey. For the purposes of this study, a park with these kinds of amenities will be called a destination park. It is different from a neighborhood park in that it is intended to attract people who travel farther than a typical walk would take them, and stay a bit longer than they might when visiting the closest neighborhood park. While the destination park might have a ball field, sports courts, or other athletic
facilities, it does not have to be a sports complex. While not everyone in the community visits parks of any kind, it could be expected that members of a typical household in Tulsa would visit such a park at least once a month during the most pleasant times of the year if they could get to it within a ten minute drive and not have to cross major barriers to do so. Some households might go more frequently, up to a few times a week, while others may not go at all. If a ten-minute drive is used as a basis for locating such parks, it would translate into about a three-mile radius in Tulsa. Travelling at a relatively casual speed, a bicyclist can cover this distance in between 20 and 30 minutes on normal residential streets if there are no major barriers. This is probably the upper limit of time that people would spend to bike to a park on a regular basis, but if three miles is used as a maximum distance, many homes would have significantly shorter travel times and might be encouraged to bike or even walk to the destination park as a result.
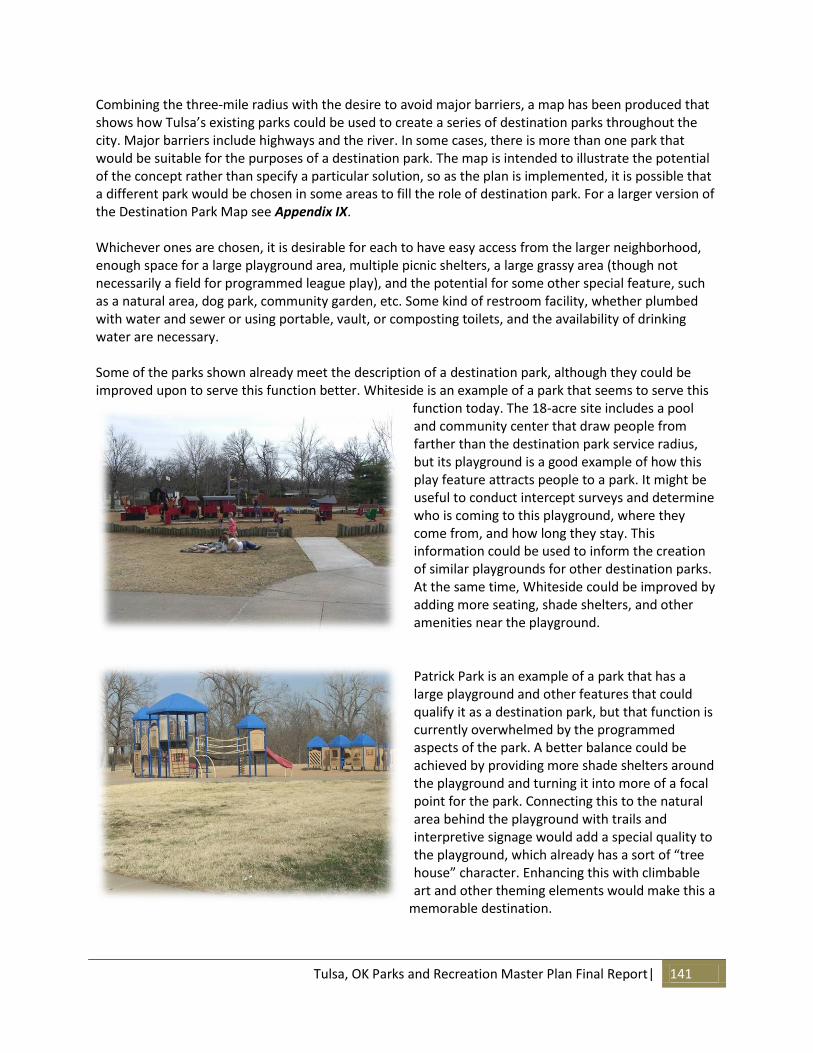
Tulsa, OK Parks and Recreation Master Plan Final Report| 141
Combining the three-mile radius with the desire to avoid major barriers, a map has been produced that shows how Tulsa’s existing parks could be used to create a series of destination parks throughout the city. Major barriers include highways and the river. In some cases, there is more than one park that would be suitable for the purposes of a destination park. The map is intended to illustrate the potential of the concept rather than specify a particular solution, so as the plan is implemented, it is possible that a different park would be chosen in some areas to fill the role of destination park. For a larger version of the Destination Park Map see Appendix IX. Whichever ones are chosen, it is desirable for each to have easy access from the larger neighborhood, enough space for a large playground area, multiple picnic shelters, a large grassy area (though not necessarily a field for programmed league play), and the potential for some other special feature, such as a natural area, dog park, community garden, etc. Some kind of restroom facility, whether plumbed with water and sewer or using portable, vault, or composting toilets, and the availability of drinking water are necessary. Some of the parks shown already meet the description of a destination park, although they could be improved upon to serve this function better. Whiteside is an example of a park that seems to serve this
function today. The 18-acre site includes a pool and community center that draw people from farther than the destination park service radius, but its playground is a good example of how this play feature attracts people to a park. It might be useful to conduct intercept surveys and determine who is coming to this playground, where they come from, and how long they stay. This information could be used to inform the creation of similar playgrounds for other destination parks. At the same time, Whiteside could be improved by adding more seating, shade shelters, and other amenities near the playground.
Patrick Park is an example of a park that has a large playground and other features that could qualify it as a destination park, but that function is currently overwhelmed by the programmed aspects of the park. A better balance could be achieved by providing more shade shelters around the playground and turning it into more of a focal point for the park. Connecting this to the natural area behind the playground with trails and interpretive signage would add a special quality to the playground, which already has a sort of “tree house” character. Enhancing this with climbable art and other theming elements would make this a
memorable destination.
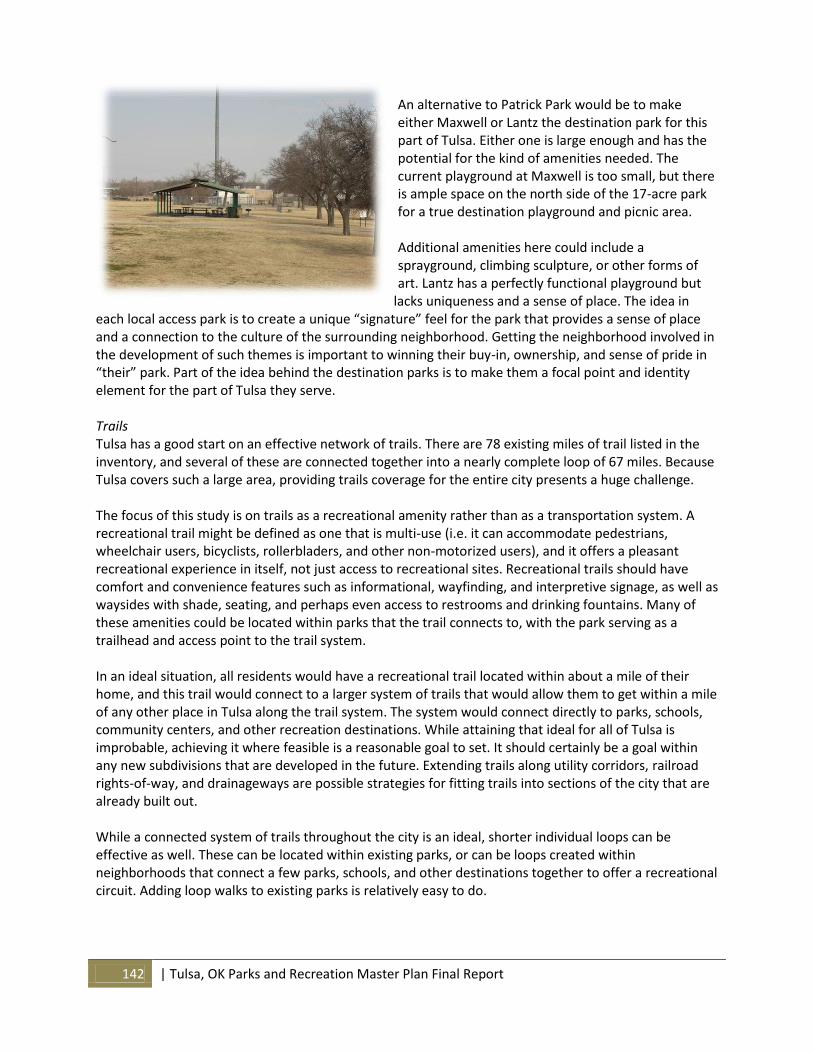
142 | Tulsa, OK Parks and Recreation Master Plan Final Report
An alternative to Patrick Park would be to make either Maxwell or Lantz the destination park for this part of Tulsa. Either one is large enough and has the potential for the kind of amenities needed. The current playground at Maxwell is too small, but there is ample space on the north side of the 17-acre park for a true destination playground and picnic area. Additional amenities here could include a sprayground, climbing sculpture, or other forms of art. Lantz has a perfectly functional playground but
lacks uniqueness and a sense of place. The idea in each local access park is to create a unique “signature” feel for the park that provides a sense of place and a connection to the culture of the surrounding neighborhood. Getting the neighborhood involved in the development of such themes is important to winning their buy-in, ownership, and sense of pride in “their” park. Part of the idea behind the destination parks is to make them a focal point and identity element for the part of Tulsa they serve. Trails Tulsa has a good start on an effective network of trails. There are 78 existing miles of trail listed in the inventory, and several of these are connected together into a nearly complete loop of 67 miles. Because Tulsa covers such a large area, providing trails coverage for the entire city presents a huge challenge. The focus of this study is on trails as a recreational amenity rather than as a transportation system. A recreational trail might be defined as one that is multi-use (i.e. it can accommodate pedestrians, wheelchair users, bicyclists, rollerbladers, and other non-motorized users), and it offers a pleasant recreational experience in itself, not just access to recreational sites. Recreational trails should have comfort and convenience features such as informational, wayfinding, and interpretive signage, as well as waysides with shade, seating, and perhaps even access to restrooms and drinking fountains. Many of these amenities could be located within parks that the trail connects to, with the park serving as a trailhead and access point to the trail system. In an ideal situation, all residents would have a recreational trail located within about a mile of their home, and this trail would connect to a larger system of trails that would allow them to get within a mile of any other place in Tulsa along the trail system. The system would connect directly to parks, schools, community centers, and other recreation destinations. While attaining that ideal for all of Tulsa is improbable, achieving it where feasible is a reasonable goal to set. It should certainly be a goal within any new subdivisions that are developed in the future. Extending trails along utility corridors, railroad rights-of-way, and drainageways are possible strategies for fitting trails into sections of the city that are already built out. While a connected system of trails throughout the city is an ideal, shorter individual loops can be effective as well. These can be located within existing parks, or can be loops created within neighborhoods that connect a few parks, schools, and other destinations together to offer a recreational circuit. Adding loop walks to existing parks is relatively easy to do.
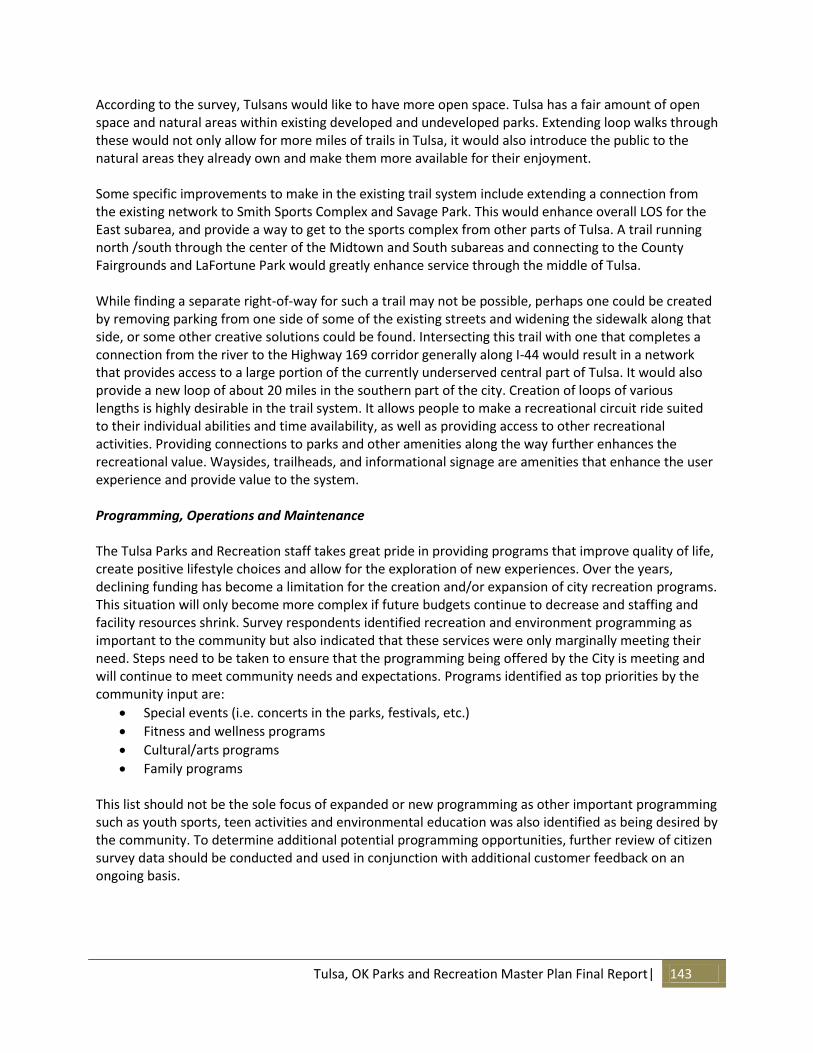
Tulsa, OK Parks and Recreation Master Plan Final Report| 143
According to the survey, Tulsans would like to have more open space. Tulsa has a fair amount of open space and natural areas within existing developed and undeveloped parks. Extending loop walks through these would not only allow for more miles of trails in Tulsa, it would also introduce the public to the natural areas they already own and make them more available for their enjoyment. Some specific improvements to make in the existing trail system include extending a connection from the existing network to Smith Sports Complex and Savage Park. This would enhance overall LOS for the East subarea, and provide a way to get to the sports complex from other parts of Tulsa. A trail running north /south through the center of the Midtown and South subareas and connecting to the County Fairgrounds and LaFortune Park would greatly enhance service through the middle of Tulsa. While finding a separate right-of-way for such a trail may not be possible, perhaps one could be created by removing parking from one side of some of the existing streets and widening the sidewalk along that side, or some other creative solutions could be found. Intersecting this trail with one that completes a connection from the river to the Highway 169 corridor generally along I-44 would result in a network that provides access to a large portion of the currently underserved central part of Tulsa. It would also provide a new loop of about 20 miles in the southern part of the city. Creation of loops of various lengths is highly desirable in the trail system. It allows people to make a recreational circuit ride suited to their individual abilities and time availability, as well as providing access to other recreational activities. Providing connections to parks and other amenities along the way further enhances the recreational value. Waysides, trailheads, and informational signage are amenities that enhance the user experience and provide value to the system. Programming, Operations and Maintenance The Tulsa Parks and Recreation staff takes great pride in providing programs that improve quality of life, create positive lifestyle choices and allow for the exploration of new experiences. Over the years, declining funding has become a limitation for the creation and/or expansion of city recreation programs. This situation will only become more complex if future budgets continue to decrease and staffing and facility resources shrink. Survey respondents identified recreation and environment programming as important to the community but also indicated that these services were only marginally meeting their need. Steps need to be taken to ensure that the programming being offered by the City is meeting and will continue to meet community needs and expectations. Programs identified as top priorities by the community input are:
Special events (i.e. concerts in the parks, festivals, etc.)
Fitness and wellness programs
Cultural/arts programs
Family programs This list should not be the sole focus of expanded or new programming as other important programming such as youth sports, teen activities and environmental education was also identified as being desired by the community. To determine additional potential programming opportunities, further review of citizen survey data should be conducted and used in conjunction with additional customer feedback on an ongoing basis.
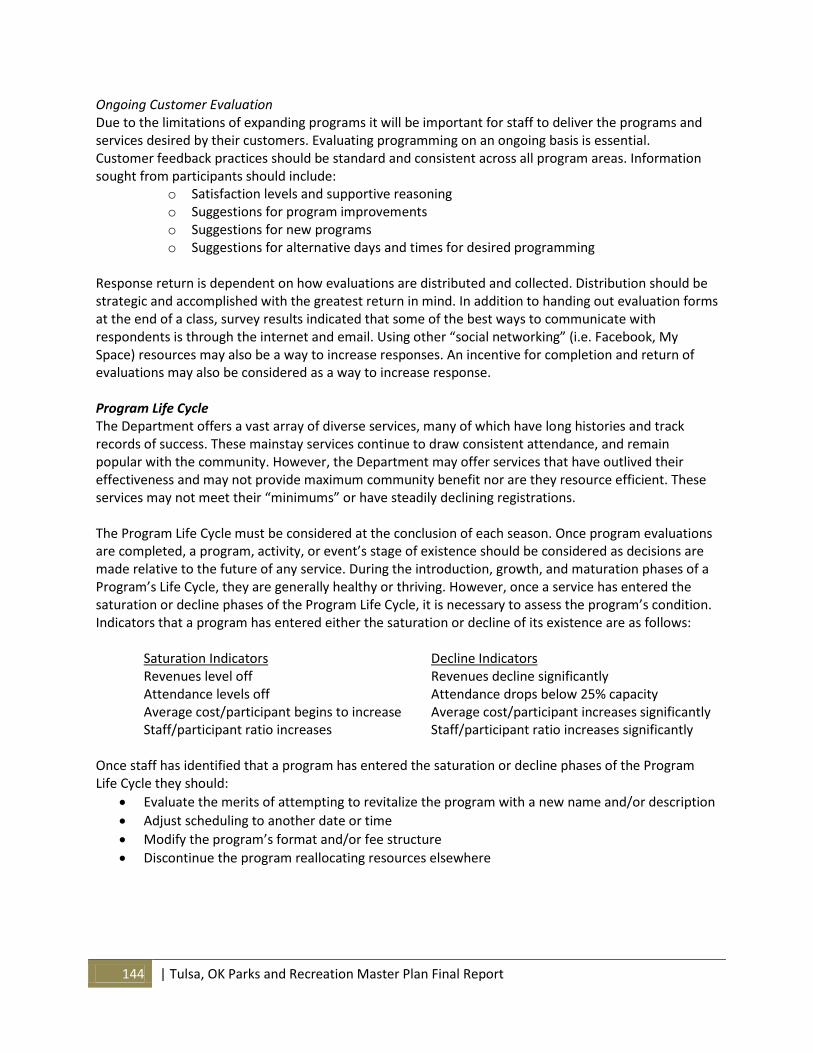
144 | Tulsa, OK Parks and Recreation Master Plan Final Report
Ongoing Customer Evaluation Due to the limitations of expanding programs it will be important for staff to deliver the programs and services desired by their customers. Evaluating programming on an ongoing basis is essential. Customer feedback practices should be standard and consistent across all program areas. Information sought from participants should include:
o Satisfaction levels and supportive reasoning o Suggestions for program improvements o Suggestions for new programs o Suggestions for alternative days and times for desired programming
Response return is dependent on how evaluations are distributed and collected. Distribution should be strategic and accomplished with the greatest return in mind. In addition to handing out evaluation forms at the end of a class, survey results indicated that some of the best ways to communicate with respondents is through the internet and email. Using other “social networking” (i.e. Facebook, My Space) resources may also be a way to increase responses. An incentive for completion and return of evaluations may also be considered as a way to increase response. Program Life Cycle The Department offers a vast array of diverse services, many of which have long histories and track records of success. These mainstay services continue to draw consistent attendance, and remain popular with the community. However, the Department may offer services that have outlived their effectiveness and may not provide maximum community benefit nor are they resource efficient. These services may not meet their “minimums” or have steadily declining registrations. The Program Life Cycle must be considered at the conclusion of each season. Once program evaluations are completed, a program, activity, or event’s stage of existence should be considered as decisions are made relative to the future of any service. During the introduction, growth, and maturation phases of a Program’s Life Cycle, they are generally healthy or thriving. However, once a service has entered the saturation or decline phases of the Program Life Cycle, it is necessary to assess the program’s condition. Indicators that a program has entered either the saturation or decline of its existence are as follows: Saturation Indicators Decline Indicators Revenues level off Revenues decline significantly Attendance levels off Attendance drops below 25% capacity Average cost/participant begins to increase Average cost/participant increases significantly Staff/participant ratio increases Staff/participant ratio increases significantly Once staff has identified that a program has entered the saturation or decline phases of the Program Life Cycle they should:
Evaluate the merits of attempting to revitalize the program with a new name and/or description
Adjust scheduling to another date or time
Modify the program’s format and/or fee structure
Discontinue the program reallocating resources elsewhere
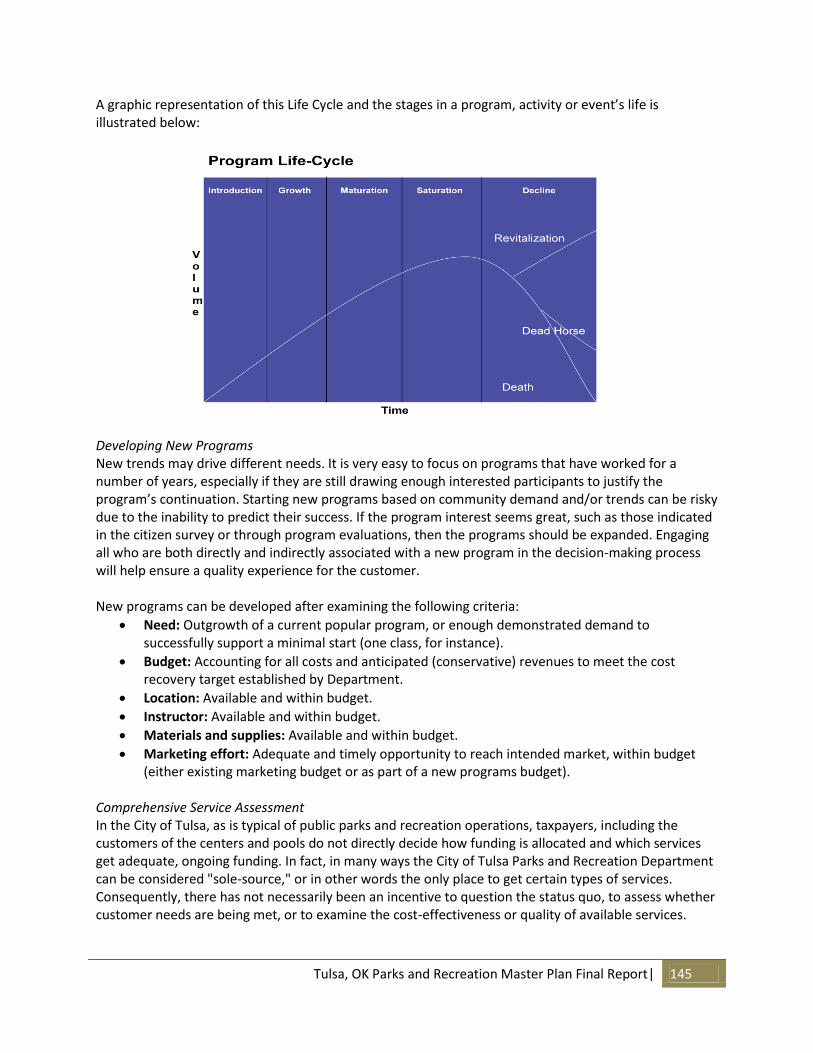
Tulsa, OK Parks and Recreation Master Plan Final Report| 145
A graphic representation of this Life Cycle and the stages in a program, activity or event’s life is illustrated below:
Developing New Programs New trends may drive different needs. It is very easy to focus on programs that have worked for a number of years, especially if they are still drawing enough interested participants to justify the program’s continuation. Starting new programs based on community demand and/or trends can be risky due to the inability to predict their success. If the program interest seems great, such as those indicated in the citizen survey or through program evaluations, then the programs should be expanded. Engaging all who are both directly and indirectly associated with a new program in the decision-making process will help ensure a quality experience for the customer. New programs can be developed after examining the following criteria:
Need: Outgrowth of a current popular program, or enough demonstrated demand to successfully support a minimal start (one class, for instance).
Budget: Accounting for all costs and anticipated (conservative) revenues to meet the cost recovery target established by Department.
Location: Available and within budget.
Instructor: Available and within budget.
Materials and supplies: Available and within budget.
Marketing effort: Adequate and timely opportunity to reach intended market, within budget (either existing marketing budget or as part of a new programs budget).
Comprehensive Service Assessment In the City of Tulsa, as is typical of public parks and recreation operations, taxpayers, including the customers of the centers and pools do not directly decide how funding is allocated and which services get adequate, ongoing funding. In fact, in many ways the City of Tulsa Parks and Recreation Department can be considered "sole-source," or in other words the only place to get certain types of services. Consequently, there has not necessarily been an incentive to question the status quo, to assess whether customer needs are being met, or to examine the cost-effectiveness or quality of available services.
146 | Tulsa, OK Parks and Recreation Master Plan Final Report
Over the years the citizens of Tulsa and market environments have changed, and funders and customers alike are beginning to demand more accountability. Both traditional (taxes and mandatory fees) and alternative funding (grants and contributions) are getting harder to come by, even as needs and demands increase. This increasing demand for a smaller pool of resources will require the Tulsa Parks and Recreation Department to rethink how they do business, to provide services where appropriate, to avoid duplicating existing comparable services, and to increase collaboration when possible. In addition, organizations are leveraging all available resources where collaboration, diversification, and divestment are possible. Current budgetary realities make it impossible for the Department to fulfill all of the desires identified through the public input process. The Department should resist spreading its resources too thin, the result of which would be programs, facilities and services that are not up to current and historical standards. It is important for the Department to focus on delivering quality in a more focused (and perhaps limited) way. Completing a Service Assessment of all facilities, programs, and services will help decide where the focus should be placed. The Service Assessment Analysis utilizes a series of filters to assist in the determination of the organization’s level of responsibility in the provision of each service. Results of the assessment indicate whether the service is “core to the organization’s mission,” or if there is significant duplication of community efforts to provide a service, and therefore, a direction to reallocate resources elsewhere. Current resources, their allocation, and cost recovery/subsidy levels for all organizational services are also analyzed as a part of this step in the process. It is important to note that in some cases level of responsibility may be applied on a citywide basis. However given the fact that the City of Tulsa is made up of diverse neighborhoods the level of responsibility may need to be applied based on access, both geographically and economically, to parks and recreation programs, facilities and services. Using the Service Assessment Matrix will help the Department think about some important questions.
Q: Is the agency the best or most appropriate organization to provide the service? Q: Is market competition good for the citizenry? Q: Is the agency spreading its resources too thin without the capacity to sustain core services and
the system in general? Q: Are there opportunities to work with another organization to provide services in a more
efficient and responsible manner?
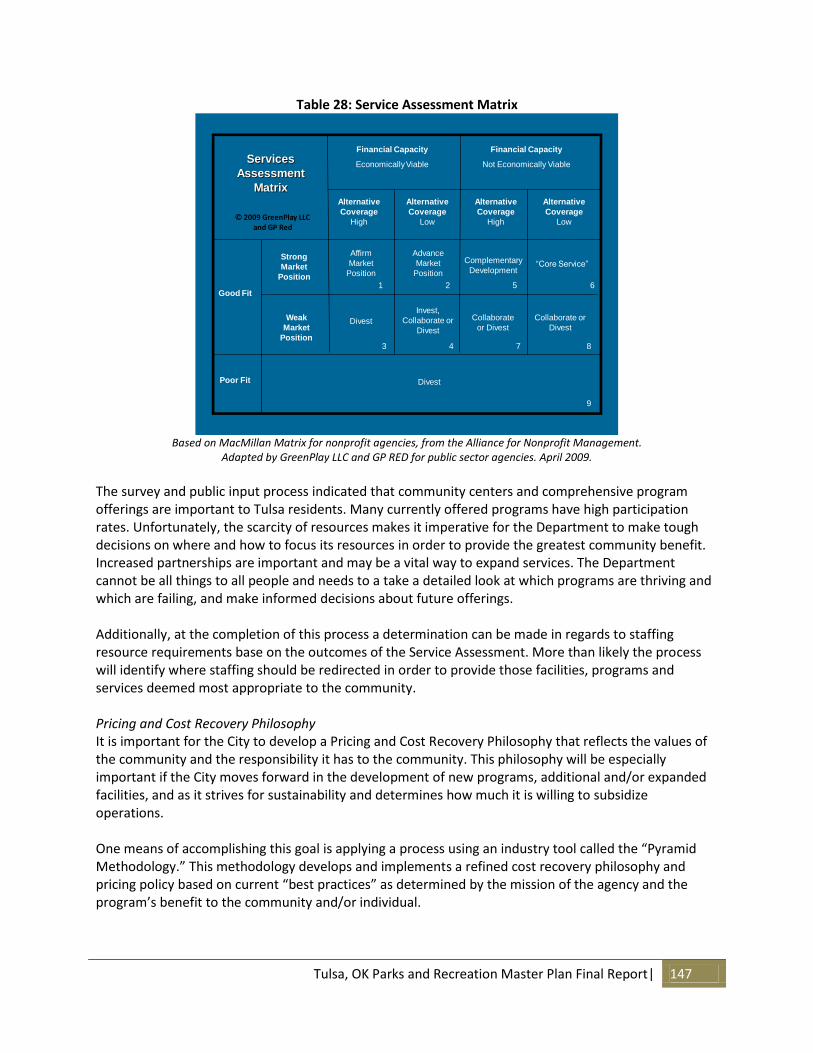
Tulsa, OK Parks and Recreation Master Plan Final Report| 147
Table 28: Service Assessment Matrix
Services
Assessment
Matrix
Financial Capacity
Economically Viable
Financial Capacity
Not Economically Viable
Alternative
Coverage
High
Alternative
Coverage
Low
Alternative
Coverage
High
Alternative
Coverage
Low
Good Fit
Poor Fit
Strong
Market
Position
Weak
Market
Position
Affirm
Market
Position
Advance
Market
Position
Complementary
Development“Core Service”
Divest
Invest,
Collaborate or
Divest
Collaborate
or Divest
Collaborate or
Divest
Divest
1 2
3 4
5 6
7 8
9
2009 GreenPlay LLC and GP Red
Based on MacMillan Matrix for nonprofit agencies, from the Alliance for Nonprofit Management.
Adapted by GreenPlay LLC and GP RED for public sector agencies. April 2009.
The survey and public input process indicated that community centers and comprehensive program offerings are important to Tulsa residents. Many currently offered programs have high participation rates. Unfortunately, the scarcity of resources makes it imperative for the Department to make tough decisions on where and how to focus its resources in order to provide the greatest community benefit. Increased partnerships are important and may be a vital way to expand services. The Department cannot be all things to all people and needs to a take a detailed look at which programs are thriving and which are failing, and make informed decisions about future offerings. Additionally, at the completion of this process a determination can be made in regards to staffing resource requirements base on the outcomes of the Service Assessment. More than likely the process will identify where staffing should be redirected in order to provide those facilities, programs and services deemed most appropriate to the community. Pricing and Cost Recovery Philosophy It is important for the City to develop a Pricing and Cost Recovery Philosophy that reflects the values of the community and the responsibility it has to the community. This philosophy will be especially important if the City moves forward in the development of new programs, additional and/or expanded facilities, and as it strives for sustainability and determines how much it is willing to subsidize operations. One means of accomplishing this goal is applying a process using an industry tool called the “Pyramid Methodology.” This methodology develops and implements a refined cost recovery philosophy and pricing policy based on current “best practices” as determined by the mission of the agency and the program’s benefit to the community and/or individual.
148 | Tulsa, OK Parks and Recreation Master Plan Final Report
Critical to this philosophical undertaking is the support and understanding of elected officials and ultimately, citizens. Whether or not significant changes are called for, the agency wants to be certain that it is philosophically aligned with its residents. The development of the core services and cost recovery philosophy and policy is built on a very logical foundation, using the understanding of who is benefiting from parks, recreation, and natural resources service to determine how the costs for that service should be paid. Developing ongoing systems that help measure cost recovery goals and anticipate potential pitfalls require the following11:
Understanding current revenue streams and their sustainability.
Tracking all expenses and revenues for programs, facilities, and services to understand their contribution to overall department cost recovery.
Analyzing who is benefiting from programs, facilities, and services and to what degree they should be subsidized.
Fees for programs should acknowledge the full cost of each program (those direct and indirect costs associated with program delivery) and where the program fits on the scale of who benefits from the program or service to determine appropriate cost recovery targets.
Program fees should not be based on ability to pay, but an objective program should be in place that allows for easy access for lower income participants, through availability of scholarships and/or discounts. In many instances qualification for scholarships and /or discounts mirror requirements for free or reduced cost for lunch in schools.
Defining direct costs as those that typically exist purely because of the program and change with the program.
Defining indirect costs as those that typically would exist anyway (like full time staff, utilities, administration, debt service, etc.)
Critical to this philosophical undertaking is the support and understanding of elected officials and ultimately citizens. Currently there does not appear to be a formally articulated consensus among decision makers and staff related to cost recovery philosophies, goals, and expectations. Whether or not significant changes are called for, Tulsa needs to be certain that there is philosophically alignment with city council goals and objectives. City Council should be engaged in the discussion to seek consensus about pricing and cost recovery goals. Creating consensus will enable the City to:
Establish a consistent and defendable fee adjustment policy.
Develop a programming pricing philosophy.
Prioritize where subsidies are most needed. The importance of understanding the number people the Department is serving cannot be understated. Additionally, knowing not only the number of people but also the age, gender, and economic conditions of those people who are utilizing Department programs and facilities is equally important. At this time there is an inconsistent method of tracking use and participation which leads to the inability to accurately portray the span of service the Department is providing. Improved participation tracking methods will assist in implementing the Program Life Cycle Analysis, Service Assessment Analysis, and Pricing and Cost Recovery Philosophy. 11
A Core Services and Resource Allocation Pyramid Methodology overview has been provided separately as a staff resource document.
Tulsa, OK Parks and Recreation Master Plan Final Report| 149
Funding Opportunities The City of Tulsa has experienced challenging times in the recent past, with limited funding and staffing levels, and the Department should explore the best means of achieving its funding goals. Alternative funding methods will be instrumental to the operations of the City’s park and recreation facilities and services on an ongoing basis. Allocating resources (assigning staff time, matching funds, etc.) to pursue alternative funding should be considered an investment in the future, with an outlined and expected positive rate of return. Building partnerships within the community is an alternative source of funding, bringing together those with mutual goals to take advantage of existing facilities, share facilities, and provide additional programming and services to the community. The City would retain the ownership of the most valuable asset, the land. A partnership group would pay all costs associated with the facility including but not limited to utilities, HVAC, roof, doors, windows, etc. The following are offered as sources of potential partnerships:
County/city council/mayor/federal government/other city departments
Local businesses
School districts/universities
Chamber of Commerce
Youth sports organizations/special interest groups
Community service organizations
Neighborhood associations/PTA’s
Park Friends
YMCA’s/YWCA’s
Oklahoma tourism organizations
Utility companies
Foundations/nonprofit organizations
Art and Humanities Council
Library/museums
Scouts
Student groups
Churches/faith based organizations
Media (newspapers, TV, radio)
Developers
Native American tribes/casino’s
150 | Tulsa, OK Parks and Recreation Master Plan Final Report
Goals and Strategies GOAL 1: MAXIMIZE THE PLANNING EFFORT Strategy 1.1: Incorporate the action items of this plan into the Department and City goals to achieve the recommendations of this plan and to enhance effectiveness of staff effort. Strategic Step: 1.1.1 Create a citizen involvement structure to address these five areas: facilities, programs, public relations, finance, and trails by Spring 2010 1.1.2 Assign responsibility and time frame, and allocate resources necessary to complete each action identified in annual work plans. Strategy 1.2: Assure that all levels of staff are informed of and are set up to work together to implement the recommendations and strategies of the plan. Strategic Steps:
1.2.1 Inform all levels of staff of the direction of the Plan, allow for staff input, encourage buy-in, and encourage input from all staff members. 1.2.2 Provide external departmental staff teams/team members, as appropriate, with education development opportunities, necessary equipment, and supplies.
Strategy 1.3: Examine existing organizational structure of the Parks and Recreation Department Strategy 1.4: Recommend any needed changes to current organizational structure to ensure efficient plan implementation. GOAL 2: ENHANCE MARKETING AND COMMUNICATIONS Strategy 2.1: Generate awareness and community engagement regarding Tulsa Parks and Recreation offerings and needs as expressed by the public through this planning process and ongoing annual efforts. Strategic Steps:
2.1.1 Hire or contract dedicated staff to coordinate all marketing efforts for the Department. 2.1.2 Formalize an evaluation and annual in-house benchmarking program to solicit participant feedback and drive programming efforts. 2.1.3 Collect feedback data that supports the expressed desire for improvements to programs and activities. 2.1.4 Create a “Mystery Shopper” program where secret shoppers evaluate services anonymously and results are tracked.
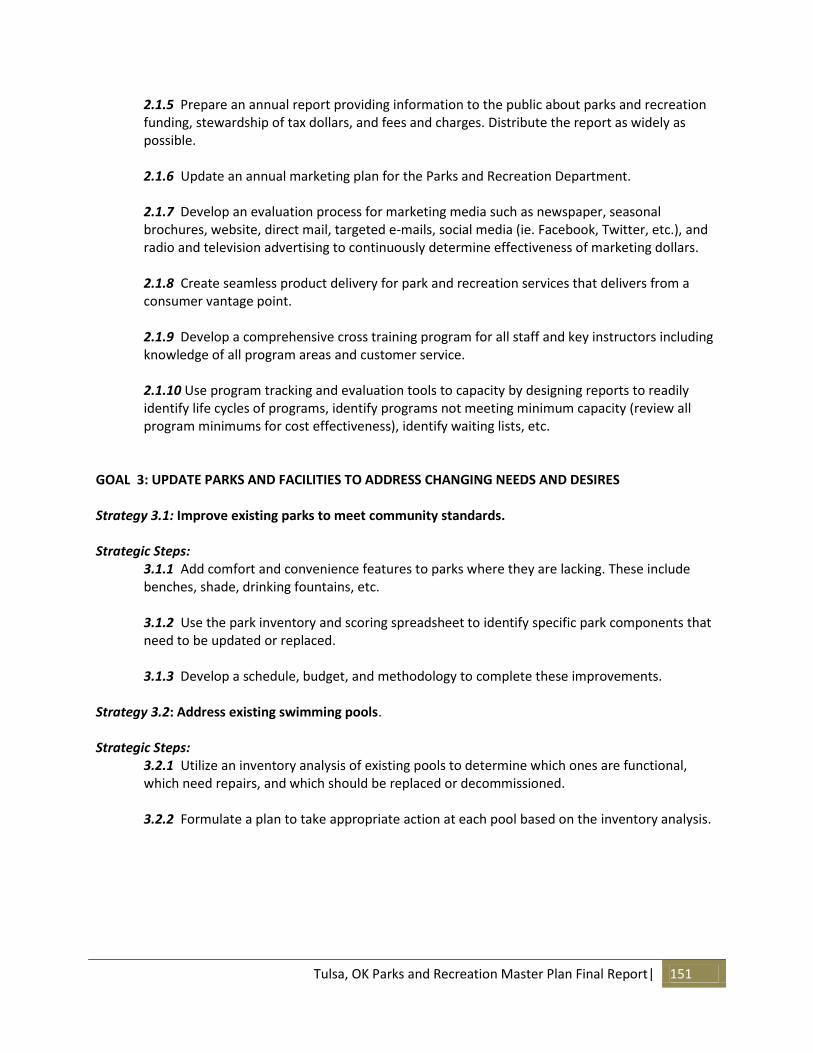
Tulsa, OK Parks and Recreation Master Plan Final Report| 151
2.1.5 Prepare an annual report providing information to the public about parks and recreation funding, stewardship of tax dollars, and fees and charges. Distribute the report as widely as possible. 2.1.6 Update an annual marketing plan for the Parks and Recreation Department. 2.1.7 Develop an evaluation process for marketing media such as newspaper, seasonal brochures, website, direct mail, targeted e-mails, social media (ie. Facebook, Twitter, etc.), and radio and television advertising to continuously determine effectiveness of marketing dollars. 2.1.8 Create seamless product delivery for park and recreation services that delivers from a consumer vantage point. 2.1.9 Develop a comprehensive cross training program for all staff and key instructors including knowledge of all program areas and customer service. 2.1.10 Use program tracking and evaluation tools to capacity by designing reports to readily identify life cycles of programs, identify programs not meeting minimum capacity (review all program minimums for cost effectiveness), identify waiting lists, etc.
GOAL 3: UPDATE PARKS AND FACILITIES TO ADDRESS CHANGING NEEDS AND DESIRES Strategy 3.1: Improve existing parks to meet community standards. Strategic Steps:
3.1.1 Add comfort and convenience features to parks where they are lacking. These include benches, shade, drinking fountains, etc. 3.1.2 Use the park inventory and scoring spreadsheet to identify specific park components that need to be updated or replaced. 3.1.3 Develop a schedule, budget, and methodology to complete these improvements.
Strategy 3.2: Address existing swimming pools. Strategic Steps:
3.2.1 Utilize an inventory analysis of existing pools to determine which ones are functional, which need repairs, and which should be replaced or decommissioned. 3.2.2 Formulate a plan to take appropriate action at each pool based on the inventory analysis.
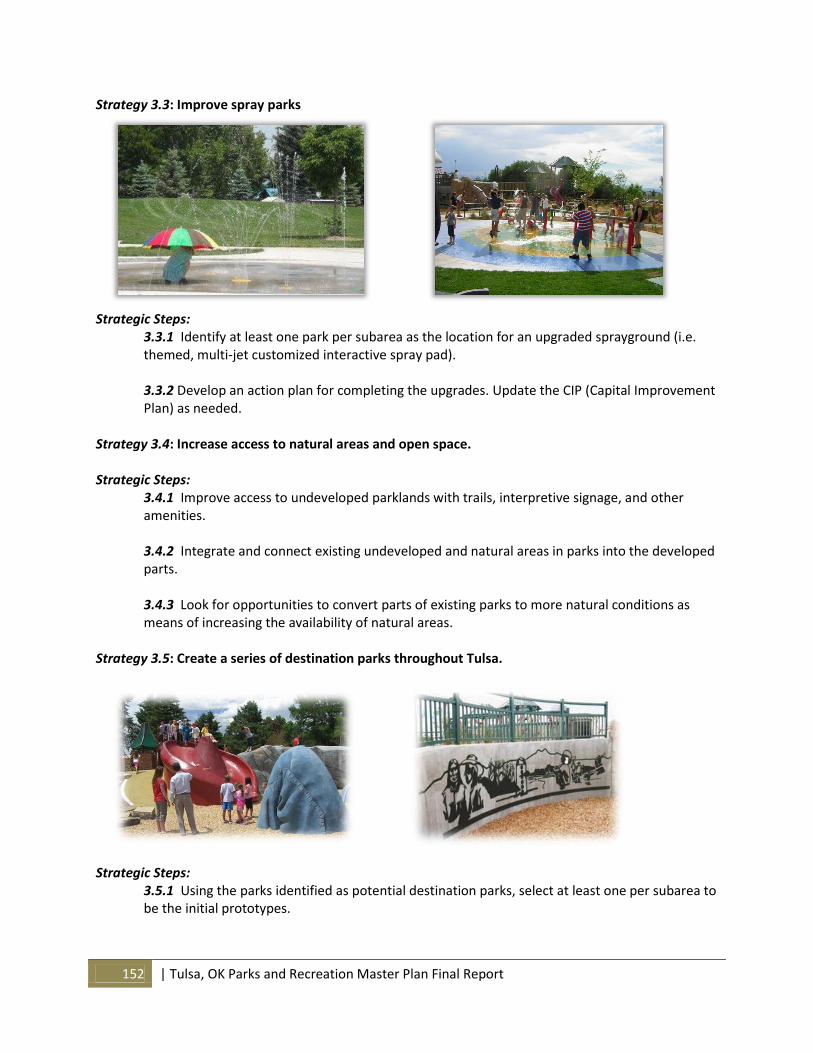
152 | Tulsa, OK Parks and Recreation Master Plan Final Report
Strategy 3.3: Improve spray parks
Strategic Steps: 3.3.1 Identify at least one park per subarea as the location for an upgraded sprayground (i.e. themed, multi-jet customized interactive spray pad). 3.3.2 Develop an action plan for completing the upgrades. Update the CIP (Capital Improvement Plan) as needed. Strategy 3.4: Increase access to natural areas and open space. Strategic Steps: 3.4.1 Improve access to undeveloped parklands with trails, interpretive signage, and other amenities. 3.4.2 Integrate and connect existing undeveloped and natural areas in parks into the developed parts. 3.4.3 Look for opportunities to convert parts of existing parks to more natural conditions as means of increasing the availability of natural areas. Strategy 3.5: Create a series of destination parks throughout Tulsa.
Strategic Steps: 3.5.1 Using the parks identified as potential destination parks, select at least one per subarea to be the initial prototypes.
Tulsa, OK Parks and Recreation Master Plan Final Report| 153
3.5.2 Use design charrettes to develop concepts, guidelines, or strategies for these parks. Each park should have unique and identifiable elements that reflect the character and context of its surrounding neighborhoods. It should also serve a range of ages, interests, and abilities. 3.5.3 Include a strong public process in the development or redevelopment of the destination parks. 3.5.4 Update the CIP (Capital Improvement Plan) as needed. 3.5.5 Look for ways to get the local community involved in the creation of destination parks.
Strategy 3.6: Coordinate Parks and Recreation Department Capital Improvement Program (CIP) existing and future projects with the City Finance and Public Works Departments. Strategic Step: 3.6.1 Work to insure inclusion of parks projects within the City’s CIP at appropriate levels Strategy 3.7: Achieve and maintain appropriate levels of service for all parts of Tulsa. Strategic Steps:
3.7.1 Maintain what you have. Make sure that all components found here function as intended and do not appear to be neglected. 3.7.2 Provide additional components in areas with relatively low LOS for the population found there, particularly in the middle and southern parts of Tulsa. If additional parkland is needed to accomplish this but unavailable, consider partnering with schools and others to provide the additional components. 3.7.3 Provide new parks and additional components in the eastern part of Tulsa to match population growth and changing demographics.
GOAL 4: MAXIMIZE RECREATION PROGRAM MANAGEMENT Strategy 4.1: Enhance recreation program planning methods. Strategic Steps:
4.1.1 Establish service objectives to ensure that a program, activity, or event is needed or desired and that it is measured to determine success and effectiveness. 4.1.2 Conduct standard and consistent formative (mid-term) and summative (post) participant evaluations for each program, activity, and event that addresses participant satisfaction, facility appropriateness, and future interest. 4.1.3 Consider an incentive for completion and return of evaluations as a way to increase response.

154 | Tulsa, OK Parks and Recreation Master Plan Final Report
4.1.4 Conduct staff evaluations that include an objective review and analysis of the program, activity, or event. Analysis should include budget information including revenues and expenditures (consistently applied for each service), participant evaluation data, and future recommendations.
Strategy 4.2: Conduct a program life cycle analysis. Strategic Step:
4.2.1 Measure each program or program area to determine where it is in its program life cycle. For programs in the saturation or decline phases, consider adjustments to, or discontinuation of the program.
Strategy 4.3: Implement new programs based on research and feedback. Strategic Steps:
4.3.1 Develop new programs after examining need/demand/trends, budget requirements for staffing and materials, location and instructor availability, and marketing effort required.
Strategy 4.4: Assess services to determine the City’s responsibility for the provision of each type of service offered. Strategic Step:
4.4.1 Conduct a service assessment using the Service Assessment Tool to provide an intensive review of each program, activity, event, and facility. (See Table 28: Service Assessment Matrix)
Strategy 4.5: Develop procedures and policies to accurately track program participation and drop-in facility use. Strategic Steps:
4.5.1 Institute written policies that provide direction to staff to consistently and accurately track and report program and facility participation, particularly ones that utilize existing Safari ® (Rec-Ware) registration software. 4.5.2 Invest in a program like Safari ® (Rec-Ware) “Attendance Module” to electronically track, through card swipes, and drop in use of facilities. Coordinate with IT Department.
Strategy 4.6: Create and implement a Cost Recovery Philosophy and Policy. Strategic Step:
4.6.1 Use the Core Services and Resource Allocation Pyramid Methodology to develop ongoing systems that help define and set cost recovery goals12:
12
A Core Services and Resource Allocation Pyramid Methodology overview has been provided separately as a staff resource document.
Tulsa, OK Parks and Recreation Master Plan Final Report| 155
Strategy 4.7: Track performance measures for all park and recreation activities and services. Strategic Steps:
4.7.1 Establish service standards for all community services activities addressing staffing, volunteers, programs components, and major maintenance tasks. 4.7.2 Evaluate and develop a scoring system for each task to meet desired and consistent service levels. 4.7.3 Involve staff in the development of the standards and scoring system.
Strategy 4.8: Track performance measures for all park and recreation maintenance services. Strategic Steps: 4.8.1 Set goals with Public Works for maintenance standards training for all staff. 4.8.2 Establish and monitor record keeping procedures to document the actual hours and material costs for each maintenance operation. 4.8.3 Apply appropriate maintenance standards and define setup/tear down requirements for all special events, tournaments, or other activities that currently stress resources. GOAL 5: ENHANCE FINANCIAL STRATEGIES Strategy 5.1: Create a task force for strategic planning, finance, and development. Strategic Step:
5.1.1 Implement by the 2nd Quarter of 2010 or an appropriate timeframe Strategy 5.2: Research potential traditional funding opportunities. Strategic Steps:
5.2.1 Work with residents and partners to establish additional revenue through a combination of funding sources, located in Section IV in this report, to implement the recommendations of the Master Plan. 5.2.2 Investigate support for establishing a dedicated funding source for the Tulsa Park and Recreation Department operations. 5.2.3 Investigate support for establishing a dedicated funding source for capital improvements identified in this Park and Recreation Master Plan.

156 | Tulsa, OK Parks and Recreation Master Plan Final Report
Strategy 5.3: Pursue alternative funding to implement the Master Plan. Strategic Steps:
5.3.1 Identify opportunities to increase community support and revenue opportunities such as grants, partnerships, sponsorships, volunteers and earned income (See Section IV for Alternative Funding Sources). 5.3.2 Develop a “Wish List” to identify philanthropic opportunities that align with these needs. Once identified, aggressively apply for grant funding. 5.3.3 Consider expanding and formalize a volunteer program to include standards, recruiting, training, retaining, and rewarding volunteers in all program areas. 5.3.4 Create an annual “Sponsorship Manual” listing all the opportunities for the year and distribute within the community in a menu format that creates a sense of urgency within the business community.
GOAL 6: STRATEGICALLY INCREASE PARTNERSHIPS Strategy 6.1: Increase partnerships and collaborative efforts. Strategic Steps:
6.1.1 Investigate partnerships with local medical and health organizations to increase fitness and health programming for the aging population within the community. 6.1.2 Strengthen and expand Intergovernmental Agreements (IGAs) with schools for use of fields, gyms, and multipurpose spaces. 6.1.3 Explore the possibility of promoting an adopt-a-park program to help with park maintenance, beautification, and civic pride. 6.1.4 Explore the possibility of promoting a Neighborhood Work Day for each park to give a face-lift to the park in one day. 6.1.5 Explore the possibility of collaborating with local artists and neighborhood groups to paint murals on neighborhood park facilities historically significant to the neighborhood. 6.1.6 Explore the possibility of implementing a WORKREATION program to allow children to complete everyday tasks in park facilities in exchange for “Play Dough” they can use in place of fees. This program can also be used in addition to the scholarship program for those unable to pay. 6.1.7 Support the Backyard Partner Program.
Tulsa, OK Parks and Recreation Master Plan Final Report| 157
Strategy 6.2: Align agency philosophies with City Council goals and objectives. Strategic Step:
6.2.1 Engage City Council in the discussion and seek consensus about pricing and cost recovery goals.
Strategy 6.3: Evaluate and manage existing partnerships to ensure benefit is appropriate to the City and Parks and Recreation Department Strategic Step: 6.3.1 Analyze existing partnerships based upon value to citizens and the Department. Strategy 6.4: Maximize and manage potential partnerships and alliances with public and private schools, neighborhood organizations, foundations, and volunteers. GOAL 7: IMPROVE TRAIL CONNECTIVITY AND WALKABILITY Strategy 7.1: Work with other government agencies and community partners to improve walkable access to parks and recreation opportunities throughout Tulsa. Strategic Steps:
7.1.1 Make parks desirable destinations for walking by providing comfort and convenience facilities, especially drinking fountains, wherever possible. This may be done in partnership with other entities next to the park, such as schools, churches, or businesses. 7.1.2 Partner with schools, libraries, and other public places to provide park and recreation amenities throughout neighborhoods and close to homes. 7.1.3 Consider opportunities for trails in areas that have little or none currently. The long-term goal should be to connect with existing trail network where possible. 7.1.4 Provide additional trails and loop walks within existing parks where feasible, especially in undeveloped and natural areas 7.1.5 Develop partnerships and user agreements with utility companies to develop trail corridors in easement right-of ways where safe and appropriate. 7.1.6 Work with other City departments and community groups to ensure safe pedestrian access across physical barriers to parks and recreation facilities. Incorporate traffic calming strategies at access points to parks, open space, and trail heads. 7.1.7 Create walking /bicycle maps with routes and mileages of park and trails. Make these available online and in printed form. Provide wayfinding signage along trails and walking routes to make them more useful to visitors.
158 | Tulsa, OK Parks and Recreation Master Plan Final Report
7.1.8 Look for opportunities to provide trail links to specific destinations like schools, parks, indoor recreational facilities, and businesses. 7.1.9 Add and improve sidewalks between designated connections.
GOAL 8: CONSIDER COMBINING THE EXISTING CITY PARKS AND RECREATION DEPARTMENT WITH THE RIVER PARKS AUTHORITY AND THE TULSA COUNTY PARKS DEPARTMENT Strategy 8.1: Begin dialogue with the Mayor, City Council, Park Board, Park Director, River Parks Authority Board of Trustees and Executive Director, the Tulsa County Commissioners, Tulsa County Park Board, and the Director of the County Parks to determine potential desirability, feasibility, and benefits of combining the three entities into a single entity, department, or district. 8.1.1 Identify Task Force to examine potential and issue a report by the end of 2010.
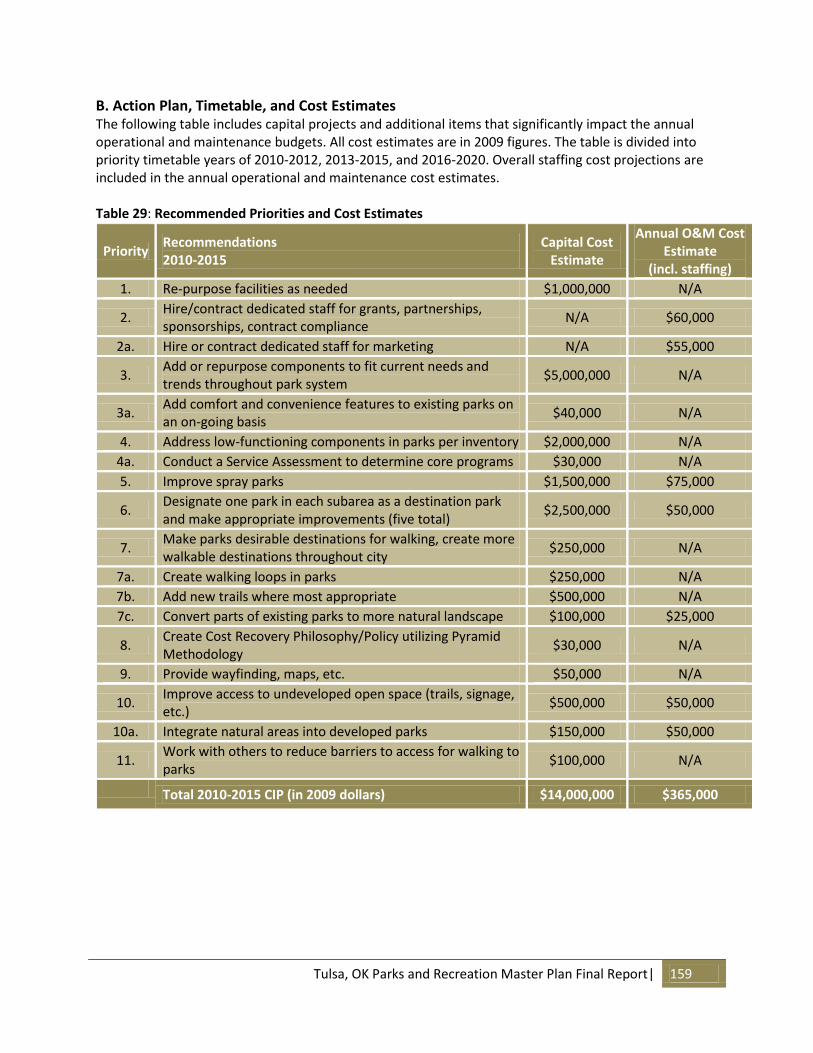
Tulsa, OK Parks and Recreation Master Plan Final Report| 159
B. Action Plan, Timetable, and Cost Estimates The following table includes capital projects and additional items that significantly impact the annual operational and maintenance budgets. All cost estimates are in 2009 figures. The table is divided into priority timetable years of 2010-2012, 2013-2015, and 2016-2020. Overall staffing cost projections are included in the annual operational and maintenance cost estimates. Table 29: Recommended Priorities and Cost Estimates
Priority Recommendations 2010-2015
Capital Cost Estimate
Annual O&M Cost Estimate
(incl. staffing)
1. Re-purpose facilities as needed $1,000,000 N/A
2. Hire/contract dedicated staff for grants, partnerships, sponsorships, contract compliance
N/A $60,000
2a. Hire or contract dedicated staff for marketing N/A $55,000
3. Add or repurpose components to fit current needs and trends throughout park system
$5,000,000 N/A
3a. Add comfort and convenience features to existing parks on an on-going basis
$40,000 N/A
4. Address low-functioning components in parks per inventory $2,000,000 N/A
4a. Conduct a Service Assessment to determine core programs $30,000 N/A
5. Improve spray parks $1,500,000 $75,000
6. Designate one park in each subarea as a destination park and make appropriate improvements (five total)
$2,500,000 $50,000
7. Make parks desirable destinations for walking, create more walkable destinations throughout city
$250,000 N/A
7a. Create walking loops in parks $250,000 N/A
7b. Add new trails where most appropriate $500,000 N/A
7c. Convert parts of existing parks to more natural landscape $100,000 $25,000
8. Create Cost Recovery Philosophy/Policy utilizing Pyramid Methodology
$30,000 N/A
9. Provide wayfinding, maps, etc. $50,000 N/A
10. Improve access to undeveloped open space (trails, signage, etc.)
$500,000 $50,000
10a. Integrate natural areas into developed parks $150,000 $50,000
11. Work with others to reduce barriers to access for walking to parks
$100,000 N/A
Total 2010-2015 CIP (in 2009 dollars) $14,000,000 $365,000
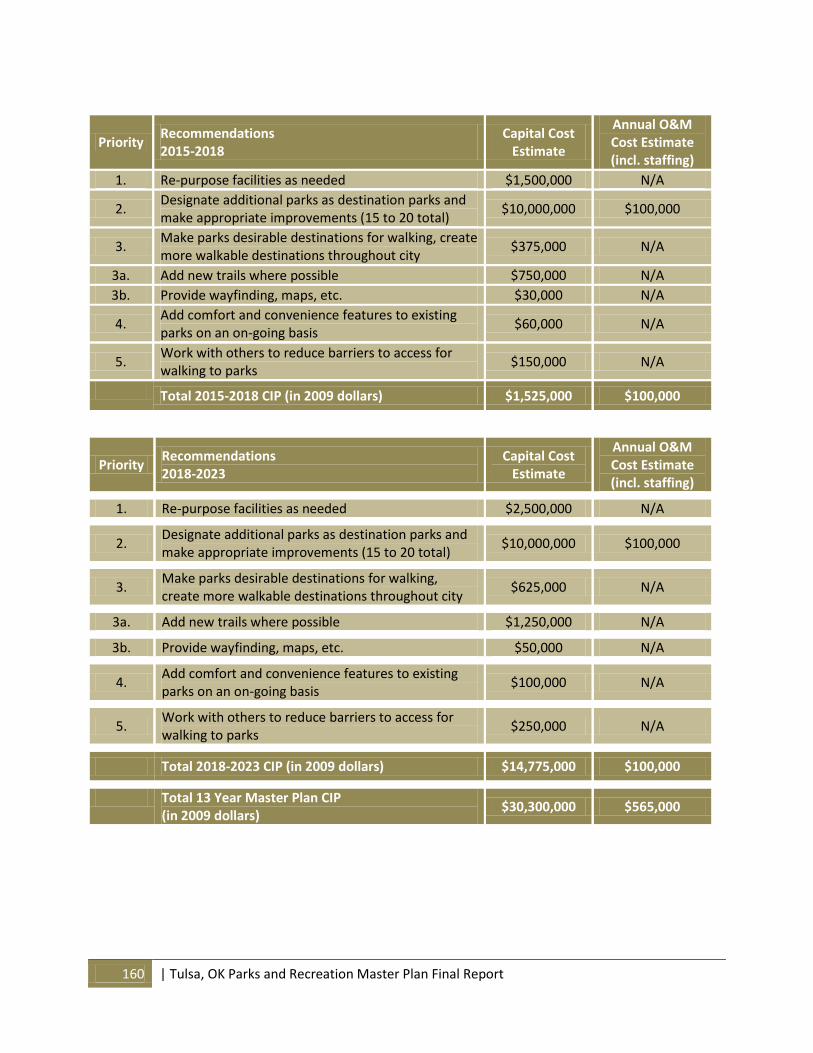
160 | Tulsa, OK Parks and Recreation Master Plan Final Report
Priority Recommendations 2015-2018
Capital Cost Estimate
Annual O&M Cost Estimate (incl. staffing)
1. Re-purpose facilities as needed $1,500,000 N/A
2. Designate additional parks as destination parks and make appropriate improvements (15 to 20 total)
$10,000,000 $100,000
3. Make parks desirable destinations for walking, create more walkable destinations throughout city
$375,000 N/A
3a. Add new trails where possible $750,000 N/A
3b. Provide wayfinding, maps, etc. $30,000 N/A
4. Add comfort and convenience features to existing parks on an on-going basis
$60,000 N/A
5. Work with others to reduce barriers to access for walking to parks
$150,000 N/A
Total 2015-2018 CIP (in 2009 dollars) $1,525,000 $100,000
Priority Recommendations 2018-2023
Capital Cost Estimate
Annual O&M Cost Estimate (incl. staffing)
1. Re-purpose facilities as needed $2,500,000 N/A
2. Designate additional parks as destination parks and make appropriate improvements (15 to 20 total)
$10,000,000 $100,000
3. Make parks desirable destinations for walking, create more walkable destinations throughout city
$625,000 N/A
3a. Add new trails where possible $1,250,000 N/A
3b. Provide wayfinding, maps, etc. $50,000 N/A
4. Add comfort and convenience features to existing parks on an on-going basis
$100,000 N/A
5. Work with others to reduce barriers to access for walking to parks
$250,000 N/A
Total 2018-2023 CIP (in 2009 dollars) $14,775,000 $100,000
Total 13 Year Master Plan CIP (in 2009 dollars)
$30,300,000 $565,000