Embed Size (px)
Citation preview

Regional Fire & Emergency Services Study
August 2019
Tumwater Fire Department Tumwater, WA

Regional Fire & Emergency Services Study City of Tumwater Fire Department
i
TABLE OF CONTENTS
Acknowledgments ........................................................................................................................ v
Executive Summary ..................................................................................................................... vi
Purpose and Approach .............................................................................................................. vi
Summary of Analysis ................................................................................................................ vi
Staffing .................................................................................................................................................. vii
Resource Deployment .......................................................................................................................... viii
Service Delivery ..................................................................................................................................... xi
Findings ................................................................................................................................. xiii
Recommendations ................................................................................................................. xiii
Current Conditions ........................................................................................................................ 1
Organizational Overview............................................................................................................ 1
Tumwater Fire Department .................................................................................................................... 2
Olympia Fire Department ....................................................................................................................... 2
Lacey Fire District 3................................................................................................................................. 3
East Olympia Fire District ....................................................................................................................... 3
West Thurston Regional Fire Authority ................................................................................................... 4
McLane-Black Lake Fire District ............................................................................................................. 4
Management Components ......................................................................................................... 5
Strategic Planning & Regulatory Documents .......................................................................................... 5
Critical Issues .......................................................................................................................................... 6
Communication ...................................................................................................................................... 6
Capital Expenditure Plans ....................................................................................................................... 7
Capital Facilities ........................................................................................................................ 8
Fire Stations & Facilities.......................................................................................................................... 8
Apparatus & Vehicle Inventories ............................................................................................... 10
Tumwater Apparatus & Vehicles ........................................................................................................... 10
Olympia Apparatus & Vehicles ............................................................................................................. 12
Lacey Apparatus & Vehicles .................................................................................................................. 14
East Olympia Apparatus & Vehicles ...................................................................................................... 16
West Thurston Apparatus & Vehicles ..................................................................................................... 17
McLane-Black Lake Apparatus & Vehicles ............................................................................................ 19
Summary of Apparatus & Vehicles........................................................................................................ 20
Staffing & Personnel Management ........................................................................................... 21
Personnel Policies & Processes ............................................................................................................. 21

Regional Fire & Emergency Services Study City of Tumwater Fire Department
ii
Career Firefighter Hiring and Selection Processes ................................................................................ 22
Volunteer & Part-Time Firefighter Selection Process ............................................................................ 24
Union Agreements.................................................................................................................................27
Administrative Support Staffing ........................................................................................................... 28
Emergency Operations Staffing ........................................................................................................... 30
Effective Response Force Analysis ........................................................................................................ 32
Wages & Benefits ................................................................................................................................. 32
Operations Work Schedules ..................................................................................................................35
Service Delivery and Response Performance .............................................................................. 38
Data Sources ........................................................................................................................................ 38
NFPA 1710 and 1720 Standards ............................................................................................................. 38
Service Demand ................................................................................................................................... 39
Resource Distribution ........................................................................................................................... 50
Resource Concentration ....................................................................................................................... 56
Resource Reliability .............................................................................................................................. 60
Performance Summary ......................................................................................................................... 65
Mutual/Automatic Aid Systems ............................................................................................................. 75
Fire Prevention Programs ......................................................................................................... 78
Fire and Life Safety Code Enforcement .................................................................................................78
Fire & Life Safety Public Education Program ........................................................................................ 82
Fire Cause & Origin Investigation .......................................................................................................... 84
Training .................................................................................................................................. 85
Training Administration .........................................................................................................................87
Training Facilities & Resources ............................................................................................................. 89
General Training Competencies ............................................................................................................ 92
Training Methodologies ........................................................................................................................ 94
Current Financial Analysis ........................................................................................................ 97
Economic Setting ................................................................................................................................. 97
Thurston County Medic One ............................................................................................................... 100
East Olympia Fire District .................................................................................................................... 101
City of Tumwater Fire Department ..................................................................................................... 104
City of Olympia .................................................................................................................................... 107
Lacey Fire District 3.............................................................................................................................. 110
West Thurston Regional Fire Authority ................................................................................................ 113
McLane/Black Lake Fire District ........................................................................................................... 116

Regional Fire & Emergency Services Study City of Tumwater Fire Department
iii
Relative Strengths/Weaknesses ........................................................................................................... 119
Overview of Community Risk Factors & Demographics ................................................................ 124
Community Risk Factors ........................................................................................................ 124
Overall Geospatial Characteristics ...................................................................................................... 124
Geographic and Weather-Related Risks ................................................................................... 126
Weather Risks ...................................................................................................................................... 127
Earthquakes......................................................................................................................................... 134
Wildfire Risk ........................................................................................................................................ 136
Transportation Risks ............................................................................................................................ 139
Demographics ....................................................................................................................... 147
Current Population Information ........................................................................................................... 147
Population Density ............................................................................................................................. 149
Population Growth Projections ............................................................................................................ 150
Future Opportunities for Collaboration ........................................................................................ 152
General Partnering Options ..................................................................................................... 152
Status Quo........................................................................................................................................... 152
Contract for Services ........................................................................................................................... 153
Merger ................................................................................................................................................. 155
Annexation .......................................................................................................................................... 156
Regional Fire Authority ........................................................................................................................ 157
Formation of a Municipal Fire District .................................................................................................. 159
Strategies for Shared Services ................................................................................................ 161
Strategy A: Status Quo ........................................................................................................................ 161
Strategy B: Contract for Services ......................................................................................................... 163
Strategy C: Annexation ........................................................................................................................ 174
Strategy D: Regional Fire Authority .................................................................................................... 186
Strategy E: Formation of a Municipal Fire District ................................................................................ 195
Findings ................................................................................................................................ 203
Recommendations ................................................................................................................ 204
Recommendation 1 ............................................................................................................................ 205
Recommendation 2 ............................................................................................................................ 205
Appendix A: Table of Figures ..................................................................................................... 206
Appendix B: Fire Stations .......................................................................................................... 214
Tumwater Fire Stations ...................................................................................................................... 214
East Olympia Fire Stations .................................................................................................................. 216

Regional Fire & Emergency Services Study City of Tumwater Fire Department
iv
Lacey Fire District 3 Stations ............................................................................................................... 220
McLane-Black Lake Fire District Stations ............................................................................................ 225
West Thurston Fire Stations ............................................................................................................... 230
Olympia Fire Stations .......................................................................................................................... 235
Appendix C: NFPA 1720 Response Performance Elements ............................................................ 241
Appendix D: NFPA 1710 Response Performance Elements ............................................................ 243

Regional Fire & Emergency Services Study City of Tumwater Fire Department
v
ACKNOWLEDGMENTS
Emergency Services Consulting International (ESCI) would like to acknowledge that without the active
assistance and support of the leaders of each participating agency, including the fire chiefs and the staffs of
Tumwater Fire Department, Olympia Fire Derpartment, Lacey Fire District #3, East Olympia Fire District,
McLane-Black Lake Fire District, and West Thurston Regional Fire Authority, this project could not have been
completed. The city administrator for Tumwater was the lead client and actively engaged in the process
throughout, communicating directly with the ESCI project manager and often with officials from the other
participating agencies.
Elected and/or appointed officials for each jurisdiction made themselves available for interviews, providing
valuable perspectives into the process. The fire chiefs made themselves and their staffs available to provide
data, review drafts, and discuss context that was important to understand going forward. In short, this report
reflects the efforts of many personnel from all six agencies who invested significant time and effort in the
process. Key individuals are specifically acknowledged as follows:
City of Tumwater
John Doan, City Administrator
Tumwater Fire Department Scott LaVielle, Fire Chief
Olympia Fire Department
Greg Wright, Fire Chief
Lacey Fire District #3 Steve Brooks, Fire Chief
McLane-Black Lake Fire District
Steve North, Fire Chief
West Thurston Regional Fire Authority Russ Kaleiwahea, Fire Chief
Finally, ESCI would like to acknowledge and once again offer its condolences to the loved ones of John Ostergard, Battalion Chief (posthumously) of East Olympia Fire District, who died while serving his community. ESCI had the honor of meeting and interviewing Chief Ostergard two weeks before his passing and found him to be a man of integrity, honor, and dedication to his avocation. His passion for his fire district, the men and women he served with, and the fire service was obvious in the interview. He will be sorely missed.

Regional Fire & Emergency Services Study City of Tumwater Fire Department
vi
EXECUTIVE SUMMARY
The City of Tumwater engaged Emergency Services Consulting International (ESCI) on behalf of the
Tumwater Fire Department (TFD), Olympia Fire Department (OFD), Lacey Fire District 3 (LFD3), East
Olympia Fire District (EOFD), West Thurston Regional Fire Authority (WTRFA), and McLane-Black Lake Fire
District (MBLFD) to conduct a Regional Fire & Emergency Services Study. After the departments gathered
the information and data requested by ESCI in preparation for the study, the project team arrived in Thurston
County to conduct a site visit to validate information and interview stakeholders. The site visit by four ESCI
team members occurred alternately between November 11 and December 4, 2018. Two additional ESCI
consultants conducted work remotely (GIS work and Fiscal Analysis).
Purpose and Approach The purpose of a Regional Fire & Emergency Services Study is to evaluate the agencies in relation to each
other, the risk profile for each community, anticipated community growth (and therefore associated risk),
and where there might be inefficient duplication of service (and therefore potential efficiencies through
integration or partnership). In short, a Regional Fire & Emergency Services Study focuses on the potential for
economies of scale, leveraging strengths, shoring up weaknesses, and generally identifying strong
partnership opportunities. It identifies for the policy-makers of each agency which options and which
partners are most advantageous as well.
The first phase of this study was to gather agency baseline data for each of the six agencies through an
extensive data request, and conduct a lengthy site assessment to validate the data provided. The second
phase was to conduct a baseline assessment of the current conditions and current service performance of
each participating fire department or fire district (or regional fire authority). The purpose of this phase was
to assess each agency’s infrastructure, operations, and service delivery in comparison to each other and to
industry standards and best practices where available, as well as to create a benchmark against which the
options for integration can be measured. Areas reviewed for this phase included:
• Organization Overview • Service Delivery and Performance
• Management Components • Training Program
• Fiscal Analysis • Fire Prevention & Risk Reduction
• Capital Assets • Staffing & Personnel Management
The third phase was to assess the Future Opportunities for Cooperative Service between the various
agencies, the Efficiencies & Risks available/posed by various approaches, and Finances and Governance
Opportunities. It concludes with a Findings and Recommendations section based on all the previous analyses.
Summary of Analysis Each fire department, fire district, or fire authority provides the highest quality service available within their
individually constrained means. There are numerous approaches to service delivery, which include staffing
configurations, deployment of resources, and response performance.

Regional Fire & Emergency Services Study City of Tumwater Fire Department
vii
Staffing
All six agencies have career staff to provide at least a base level of response capability. Five of the six
participating agencies also utilize volunteer personnel to varying degrees. Some are primarily career staffed
with a volunteer support system (LFD3 and TFD), while others rely much more heavily on volunteers to
augment the career staffing (EOFD, WTRFA, and MBLFD). OFD is the lone agency that does not rely on
volunteer personnel to augment its staffing. The following table reflects the relative staffing reliance upon
volunteer personnel. It does not connote a qualitative assessment, but implies a level of financial
commitment each community invests in its fire service. ESCI acknowledges that communities providing
volunteer personnel are making a different type, but just as important of an investment in its fire service.
Operational Staff Positions TFD OFD LFD3 EOFD* WTRFA MBLFD
Career Personnel (Firefighter thru Battalion Chief)
42 85 100 15 31 12
Volunteer Firefighters (Including Officers & Resident FFs)
11 0 20 26 47 50
Total Operations Positions 53 85 120 41 78 62
% of Operational Volunteer Staff to Total Operational Staff
20.75% 0.00% 16.67% 63.41% 60.26% 80.65%
*EOFD is the only participating agency that uses part-time personnel (included in the career staffing numbers)
Opportunity for efficiency is often sought in the administrative and support positions in integrating fire
agencies. It has been ESCI’s experience that while there may be some, it is not a simple as eliminating five of
the six fire chiefs, since a larger agency depends significantly on subordinate chief officers to focus on major
portions of the department in support of the Fire Chief. The following table reflects the staffing levels by
position in all six agencies.

Regional Fire & Emergency Services Study City of Tumwater Fire Department
viii
Staff Positions TFD OFD LFD3 EOFD WTRFA MBLFD
Fire Chief 1 1 1 1 1 1
Deputy Chiefs 1 Vacant 2
Assistant Chiefs 1 2 1 1 1 Vacant
Administrative Battalion Chiefs 1
Prevention & Public Education Positions1 1 4 1
Training Officer (Capt. Or Lt.) 1 1 2
EMS Officer 1 1 1
Other: (Describe) 1 Project Captain
Total Uniformed Administrative/Staff positions
5 12 6 2 3 2
% of Admin staff to total FD personnel
10% 19% 10% 9% 6% 6%
Resource Deployment
Resource deployment for each agency essentially reflects three elements: the response time standard the
agency is trying to achieve; the areas with the highest level of risk the fire agency is trying to protect; and the
areas of highest probable demand for services, which is predominantly driven by population density. The
following map depicts the location of response stations and the population density for the region.
The spacing of fire stations in MBLFD and WTRFA reflects large swaths of their service areas with little or no
demand (likely little population and/or geographically land-locked). The stations they do have are somewhat
clustered where call volume is expected to be higher for their jurisdictions. This phenomenon is less
pronounced in EOFD and even less so in LFD3. The following map reflects the response station spacing, and
whether the station is career staffed or volunteer staffed (which typically reflect response time differences).

Regional Fire & Emergency Services Study City of Tumwater Fire Department
ix
OFD, TFD, and the western half of LFD3 have their fire stations clustered more tightly in the predominantly
urban areas. This reflects a more aggressive deployment strategy in an effort to meet the more frequent
needs of the urban core and meet a more aggressive response time. Note that the eastern half of LFD3 is
spaced further apart, designed to handle lower population density, which equates to lower response demand
in these areas. It likely also reflects geographical barriers or lacking a transportation grid that facilitates a
faster response. The following map overlays population density throughout the study area.

Regional Fire & Emergency Services Study City of Tumwater Fire Department
x
The following map depicts the location of the response stations for each agency and the number of calls for
service per square mile for the period 2015-2017, according to the Computer-Aided Dispatch data from
TCOMM. Note how closely the demand for service in the following map follows the population density in the
previous map. Also note that there is a small spill-over of higher demand in the northern portion of EOFD and
the far eastern edge of MBLFD. This likely reflects some population growth and expansion from the more
urban core of the study area, which does not always respect jurisdictional boundaries.
These differences can be indicators of partnership opportunities where organizations have similar
deployment strategies and challenges. To state it inelegantly, the urban core obtains the water for
firefighting once they get there (fire hydrants). Their more rural colleagues tend to bring their water with
them (water tenders and pumper-tenders). The strategies and staffing levels needed to address the
difference between the two approaches are widely disparate.

Regional Fire & Emergency Services Study City of Tumwater Fire Department
xi
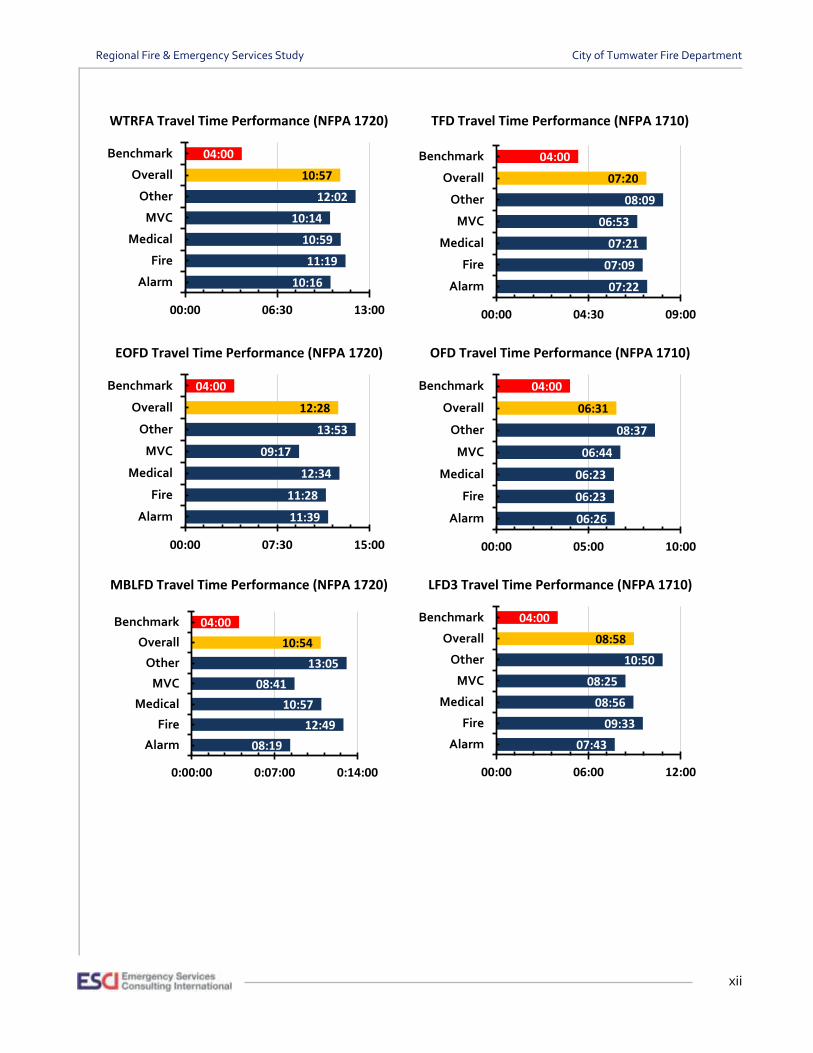
Service Delivery
In the study area, there are two relevant national standards related to service delivery (specifically, response
performance): NFPA 1710, which is applicable to organizations that are, “… substantially all career fire
departments,” and NFPA 1720, which applies to, “… volunteer and combination fire departments.” Both of
these are consensus standards, and are not mandated or codified. ESCI believes that NFPA 1710 currently
applies to Olympia Fire Department, Lacey Fire District 3, and Tumwater Fire Department, while NFPA 1720
is applicable to East Olympia Fire District, West Thurston Fire Authority, and McLane Black Lake Fire District.
Indeed, these agencies also cite these applicable standards to guide their response performance goals and
efforts. NFPA 1710 calls for a more aggressive staffing level and a faster response time than does NFPA 1720,
which accounts for the challenge of relying on volunteer personnel for initial response (if applicable), and to
augment staffing levels for career personnel who provide initial response. These two standards are effective
factors when considering integration partners. The following tables illustrate the difference in travel time
performance.
Regional Fire & Emergency Services Study City of Tumwater Fire Department
xii
WTRFA Travel Time Performance (NFPA 1720)
TFD Travel Time Performance (NFPA 1710)
EOFD Travel Time Performance (NFPA 1720)
OFD Travel Time Performance (NFPA 1710)
MBLFD Travel Time Performance (NFPA 1720)
LFD3 Travel Time Performance (NFPA 1710)
10:16
11:19
10:59
10:14
12:02
10:57
04:00
00:00 06:30 13:00
Alarm
Fire
Medical
MVC
Other
Overall
Benchmark
07:22
07:09
07:21
06:53
08:09
07:20
04:00
00:00 04:30 09:00
Alarm
Fire
Medical
MVC
Other
Overall
Benchmark
11:39
11:28
12:34
09:17
13:53
12:28
04:00
00:00 07:30 15:00
Alarm
Fire
Medical
MVC
Other
Overall
Benchmark
06:26
06:23
06:23
06:44
08:37
06:31
04:00
00:00 05:00 10:00
Alarm
Fire
Medical
MVC
Other
Overall
Benchmark
08:19
12:49
10:57
08:41
13:05
10:54
04:00
0:00:00 0:07:00 0:14:00
Alarm
Fire
Medical
MVC
Other
Overall
Benchmark
07:43
09:33
08:56
08:25
10:50
08:58
04:00
00:00 06:00 12:00
Alarm
Fire
Medical
MVC
Other
Overall
Benchmark

Regional Fire & Emergency Services Study City of Tumwater Fire Department
xiii
Findings All of the participating agencies work well together and cooperate when mutually beneficial. Numerous
strategic partnerships already exist between the agencies. These include:
• OFD—Vehicle Repair and Maintenance Services (serving all agencies)
• OFD—Training Services (serving TFD and LFD3)
• LFD3—Vehicle Repair Facility (leased to OFD)
• West Thurston Regional Fire Consortium (WTRFA, MBLFD, and EOFD)
• Special Operations Rescue Team (all agencies)
• Medic One (all agencies)
• Mutual Aid (all agencies)
Regardless of the path(s) chosen by the agencies as it pertains to this report, the participants should continue
these and other regional efforts for cost effectiveness, efficiency, and for the benefit of their respective
citizens. Other potential regional efforts could include:
• Regional Fire Investigation Team (FIT)
• Regional Recruit Academy
• Regional Volunteer Recruitment & Retention Program
• Regional Training Division
• Regional Dedicated Training Relief Engine Company
• Regional Peak Demand Response Unit (Dropped Boundary)
• Regional Logistics Division
▪ Joint Purchasing & Supply Standardization
▪ Warehousing of Replenishable Supplies
▪ Just-in-Time Inventory Management & Delivery
• Regional Command Officer Response (Dropped Boundary)
Recommendations Five options were considered and analyzed for potential integration strategies. These include:
• Strategy A (Status Quo)
• Strategy B (Contract for Services)
• Strategy C (Annexation)
• Strategy D (Regional Fire Authority)
• Strategy E (Municipal Fire District)

Regional Fire & Emergency Services Study City of Tumwater Fire Department
xiv
Discussion for each of the strategies evaluated is included in this report. ESCI recommends two partnership
configurations as follows:
1. TFD, OFD, LFD3, and EOFD should pursue Strategy D (RFA), starting with establishing an RFA
Planning Committee and following the steps included in this report and within statute.
2. WTRFA and MBLFD should consider pursuing integration, but only after financial circumstances
make it beneficial and balanced to do so. Joint planning sessions between elected officials to create
a glide path for each agency to align finances over time will facilitate integration.
Detailed rationale is provided within this report for these two strategies.
Regional Fire & Emergency Services Study City of Tumwater Fire Department
1
CURRENT CONDITIONS
This section of the report provides an overview of the current conditions within Tumwater Fire Department
(TFD), Olympia Fire Department (OFD), Lacey Fire District 3 (LFD3), East Olympia Fire District (EOFD), West
Thurston Regional Fire Authority (WTRFA), and McLane-Black Lake Fire District (MBLFD). The current
conditions include a summary of each agency’s organization; management structure; fiscal condition;
staffing and personnel; service delivery and performance; support programs (training, fire prevention, and
emergency communications); and finally, capital facilities and equipment.
Organizational Overview Data provided by the participating fire agencies was combined with information collected in the course of
ESCI’s field work and used to develop an overview of the organizations. The purpose of the following
organizational overview is two-fold. First, it verifies the accuracy of the baseline information and ESCI’s
understanding of each agency’s composition—the foundation from which the feasibility analysis is
developed. Second, the overview serves as a reference for the reader who may not be familiar with the details
of each agency’s operations.
Thurston County Medic One is not a party to this study, but is a key stakeholder in that they provide advanced
life support response and transportation services to the region and all of the agencies participating in this
study. Some of the participating agencies in this study are contractors to Thurston County Medic One,
providing paramedic firefighters to Medic One transport units. These units may be deployed within an
employer’s jurisdiction or elsewhere in the system, but are mostly or completely funded by Thurston County
Medic One’s EMS levy revenue.
These paramedics are employed by some of the fire departments and fire districts in this study (namely,
Lacey Fire District #3, Tumwater, and Olympia) and are reflected in the staffing counts and the budgets for
those agencies. They were not factored into the response times, effective response force or other response
time elements included in this study unless they were first due units in the first due areas of their employer
jurisdiction. From a budgetary standpoint, they are generally revenue – expense neutral (Medic One
payments equal the costs of supplies, salaries and benefits) for each agency. Agencies receive between 80%
and 100% of the total cost, depending on how they are staffed. Tumwater’s Medic 14, which is deployed fully
outside of Tumwater’s service area in Rochester, is also funded at 100%. Please see the “Thurston County
Medic One” section under the Current Financial Analysis for more detail.

Regional Fire & Emergency Services Study City of Tumwater Fire Department
2
Tumwater Fire Department
TFD is a municipal fire department formed in 1893. The department’s jurisdiction encompasses
approximately 18 square miles in the city limits and is home to an estimated 23,830 people. The service area
is predominantly characterized as suburban. The City of Tumwater is a non-charter code city with a Mayor-
Council form of government (RCW 35A.12). The seven-member City Council has legislative and policy-
making powers, while the administrative authority, including veto power, is vested in the Mayor. The City
Administrator is appointed by the Mayor and performs tasks within the statutory authority of the Mayor. The
City Administrator oversees the day-to-day operation of the City, including budget implementation and staff
supervision.
The Fire Chief reports to the City Administrator. The Fire Chief administers the daily operations of the fire
department. The Fire Chief’s authority is outlined in the Tumwater Municipal Code (TMC) 2.10.050 and in an
employment agreement, while subordinate personnel are hired pursuant to the civil service testing and
promotional regulations. TFD responds to requests for assistance from the public from two fire stations, both
career-staffed and augmented by a small core of volunteers. Additional information about the facilities and
staffing are contained in this report. In any organization there is a path along which information and direction
flows. This chain of command is the recognized conduit of communication for organizational business and
authority. As is the case with most fire departments, TFD uses a hierarchy to ensure that necessary
information transmission is orderly and timely. With a span of control of one-to-five, the ratio of supervisors
to subordinates is within industry norms.
Olympia Fire Department
Olympia Fire Department has evidence of volunteer fire companies in Olympia as early as 1859, but official
records indicate the department was formed in 1882. The OFD responds to requests for assistance from the
public from four fire stations, all of which are career-staffed. OFD is the only participating agency with no
volunteer personnel. Olympia covers approximately 20 square miles with approximately 52,000 constituents.
The city is urban in its make-up. Additional information about the facilities and staffing are contained in this
report. As with the other participating agencies, OFD has a chain of command reflected in its organization
chart. With a span of control of one-to-four, the ratio of supervisors to subordinates is well situated within
industry norms.
The City is a Council-Manager form of government, with seven City Council members elected at large. The
Mayor is elected as one of the seven Council members but is specifically elected as the Mayor by the citizens
and presides over Council meetings. The Council adopts the City budget, sets City policy, and supervises the
City Manager, who in turn supervises departments heads, including the Fire Chief.
As with fire districts and municipalities, the Fire Chief administers the organization by managing the budget,
enforcing policy, and supervising subordinate personnel. The City Council adopts the budget, sets policy, and
supervises the City Manager. The City Manager supervises the Fire Chief and all other department heads of
the City.

Regional Fire & Emergency Services Study City of Tumwater Fire Department
3
Lacey Fire District 3
LFD3 was formed in 1949 as a special purpose district as established by authority of Title 52 of the Revised
Code of Washington (RCW). The district originally mostly surrounded the City of Lacey and provided
contracted services for fire protection, but in 2010, the district annexed the City of Lacey into its service area.
The district serves approximately 98,000 citizens in a 70 square mile area. It is led by a five-member board of
fire commissioners who adopt the budget, set district policy, and supervise the Fire Chief. The Fire Chief
operates within the budget approved by the board, manages the expenditures, enforces the policies of the
district, and supervises subordinate personnel.
The district provides emergency services to its constituents from five fire stations, four with full-time career
staffing supplemented by a volunteer force and one resident volunteer station. The district is the largest of
the participating agencies in this study by population served and with number of employees. Additional
information and discussion about the facilities and staffing are contained in this report. As with the other
agencies participating in this study, the information and direction provided in the organization follows an
organizational chart which reflects the chain of command. As is the case with most fire departments, LFD3
uses a hierarchy that reflects this communication and decision-making flow. The highest span of control is
one-to-six, which is on the high side of industry norms.
East Olympia Fire District
EOFD was formed first as a volunteer fire department in 1951, by the East Olympia community. On June 1,
1953, the citizens passed Resolution 1970, forming Thurston County Fire Protection District #6, also referred
to as East Olympia Fire Department. The current service area is 30 square miles and is home to an estimated
11,750 people. The service area is predominantly characterized as rural. The district is governed by Title 52
RCW, Fire Protection Districts. The district is governed by three elected fire commissioners and the daily
operations are managed by a full-time Fire Chief.
The district responds to requests for assistance from the public from four fire stations, two of which are
staffed. One of the staffed stations has career and volunteer personnel assigned 24-hours per day, seven days
per week. According to EOFD’s fire chief, the other staffed station has assigned personnel approximately
90% of the time with a combination of career, part-time, and volunteers. Station 61 responds to all types of
incidents with a priority to maintain EMS response at a minimum. The remaining stations do not have
personnel assigned to them and essentially house fire apparatus. With a span of control is one-to-seven, the
ratio of supervisors to subordinates is at the outer limit of industry norms.

Regional Fire & Emergency Services Study City of Tumwater Fire Department
4
West Thurston Regional Fire Authority
WTRFA was formed in 2011 as a regional fire authority, integrating two separate fire districts, Thurston
County Fire District #1 (formed in 1947) and Thurston County Fire District #11 (formed in 1957). Regional fire
authorities are authorized by RCW 52.26; however, the two original fire districts continue to operate legally
as fire districts, levying taxes and providing elected officials to the Governing Board of the RFA. The RFA is
made up of six Governing Board members, which are the three Fire Commissioners from the two fire districts.
An additional benefit of keeping the two fire districts intact is that they can set a Maintenance & Operations
(M&O) levy for multiple years, whereas an RFA cannot. The current service area is approximately 158 square
miles and is home to an estimated 22,980 people. The service area is rural in nature.
As with fire districts and municipalities, the Fire Chief administers the organization by managing the budget,
enforcing policy, and supervising subordinate personnel. The governing board adopts the budget, sets policy,
and supervises the Fire Chief.
WTRFA serves its citizens from six fire stations. One of the stations, Michigan Hill, is an old three bay station
that stores apparatus and equipment. No personnel are assigned there. Some of the stations are staffed with
career personnel and others with volunteers. Additional information and discussion about the facilities and
staffing are contained in this report. As with most fire departments, the information and direction provided
in the organization follows an organizational chart which reflects the chain of command. The highest span of
control in the department is one-to-six, which is on the high side of the industry norms.
McLane-Black Lake Fire District
MBLFD was formed in 1950. Two separate fire districts merged recently, combining McLane Fire District and
Black Lake Fire District. A citizen approved ballot measure in August 2017 authorized a five-member Board.
Like the other fire districts, McLane-Black Lake is a special purpose district as established by authority of Title
52 of the Revised Code of Washington (RCW). Also similar to the other fire districts participating in this study,
the Fire Commissioners adopt the budget, set policy, and supervise the Fire Chief. The Fire Chief manages
the budget, enforces the policies, and supervises subordinate personnel.
The district provides emergency services to its constituents from five stations. Two stations are career staffed
and the others are staffed by the 52 volunteer personnel and live-in station Resident Firefighters. The district
has a unique program that partners with the South Puget Sound Community College to administer the Fire
and Emergency Services Technology (FEST) program. The college has had a fire science program since 1991,
with students required to obtain fire-related experience, which McLane-Black Lake Fire District has utilized
as part of its regular staffing for emergency responses. Unfortunately, this program has been cut, so the fire
district has the difficult task of addressing the loss of FEST firefighters and address staffing issues with a
smaller base from which to work.

Regional Fire & Emergency Services Study City of Tumwater Fire Department
5
The participating agencies to this study vary greatly in their internal structure, their statutory authority, their
community make-up, and their approach to service delivery. Olympia Fire Department is the only fully
career-staffed fire department among the study agencies, with three-person engine crews. On the other end
of the spectrum, East Olympia Fire District is heavily reliant upon volunteer and part-time firefighters for
their emergency responses. Demand for emergency responses also vary significantly, as reflected in the
following figure.
Figure 1: Response Data, 2017
Type/Dept. TFD OFD LFD3 EOFD WTRFA MBLFD
EMS/Rescue 3,310 8,262 10,645 875 2,247 1,157
Good Intent 325 687 950 219 327 477
Service 279 189 1,233 59 134 54
False 227 554 567 48 127 126
Fire 100 272 258 85 137 83
Other 84 1610 207 46 59 70
Totals: 4,325 11,574 13,860 1,332 3,031 1,967
The total number of responses for all types is an accurate reflection of the demand for services each agency
faced in 2017. This is discussed in greater detail in the Service Delivery & Performance section of this report.
Management Components Effective fire department management is a common challenge for fire service leaders. Today’s fire
department must address management complexities that include an effective organizational structure,
adequacy of response, maintenance of competencies, a qualified workforce, and financial sustainability for
the future.
To be effective, the management of a fire department needs to be based on several components. In the
following report section, ESCI examines the client agencies’ current efforts to manage their organizations
and identify measures and best practices recommended for the future.
Strategic Planning & Regulatory Documents
There are three core elements to any fire department (or organization for that matter); a mission statement,
a vision, and organizational values (or guiding principles). A mission statement expresses the core reason for
an agency’s existence. A vision statement expresses where the organization wants to go in the near-term
future. The values express how the members of the organization are going to treat each other on the journey
to achieve the vision. These three core elements are all contained in a strategic plan. All six agencies have a
strategic plan, which is typically a five-year workplan for the organization with goals and objectives. All six
agencies have contemporary strategic plans in place; however, EOFD’s plan expires this year.

Regional Fire & Emergency Services Study City of Tumwater Fire Department
6
Regulatory documents are also in place for each of the six participating agencies of this study. Rules,
regulations, standard operating procedures or guidelines, and department policies are all in place. Some are
in various states of review and updating. OFD and TFD have contracted with Lexipol, a subscription service
for these regulatory documents. The company customizes these documents to fit the agency and reviews
them annually, updating them as necessary to reflect contemporary case law. The service provided is
considered an industry best practice.
Critical Issues
The Fire Chiefs from each of the six participating agencies were asked to identify the top three most critical
issues facing their departments from their perspectives. All the participating agencies except Olympia Fire
Department identified some form of funding concern as their top one or two critical issues. Olympia’s
concern regarding staffing for growing call volume can be construed to be funding-related as well. The
following figure reflects feedback concerning critical issues.
Figure 2: Critical Issues in Priority Order
Priority TFD OFD LFD3
1 Service demand—continual response increase.
Homelessness (number one City issue).
Rapid growth in population and service demand.
2 Funding sustainability for future.
Staffing for growing call volume.
Funding limitations based on state statutes.
3 Implementing a diverse workforce.
Recent turnover of senior staff. Sustainable funding for tribal service delivery.
Priority EOFD WTRFA MBLFD
1 Potential for lost revenue due to municipal annexation.
Insufficient funding to sustain response objectives (legislative solutions).
Loss of FEST program
2 Consistent staffing to minimize response times—geographical barriers.
Sustaining voter support for Maintenance & Operations Levy.
Funding for career personnel
3 Retention of volunteers—rapid success in career advancement.
Lack of EMS funding versus volume.
Volunteer recruitment and retention.
Communication
Internal communication occurs frequently enough for each of the agencies, influenced by the size and
complexity of the agency. Of course, content of the communication and whether the communication is one-
way or two-way is not able to be determined by ESCI. Communication is frequently the most identified area
cited as needing improvement within organizations. Anecdotal evidence gained by interviews indicate that
communication is mostly effective in each of the organizations, with some expressing a desire for timelier or
more forthcoming communication by the Fire Chief. Surprisingly, the line personnel in the larger agencies
(OFD and LFD3) appear to have trustworthy, frequent two-way communication, whereas the smaller
agencies (EOFD and WTRFA) tend to express a level of dissatisfaction with the amount of communication or
a sense that not all of the pertinent information is shared.

Regional Fire & Emergency Services Study City of Tumwater Fire Department
7
Externally, OFD and TFD communicate with the community more passively than the other agencies, relying
more upon the broader City mechanisms to convey fire service information pertinent to the community. This
is a common trait for municipal fire departments. Often, broader City interests trump fire department
communication needs when information is shared with the community through flyers, forums, or other
communication efforts. Fire districts and fire authorities tend to communicate much more often with their
constituents than their municipal counterparts as it relates to fire services. This is primarily due to the singular
focus of a Fire District or Fire Authority, and the heavy reliance upon voters to approve funding measures
that are more often relied upon than a municipal fire department.
Capital Expenditure Plans
Capital expenditure planning often determines whether an agency must bond certain improvements or have
set aside adequate funding to absorb the expense from a reserve fund. Often, the existence of capital
expenditure planning reflects the philosophy of the agency, typically falling into one of two schools of
thought.
• Regular tax revenues should pay for ongoing expenses, whereas capital expenses should be funded
through a separate initiative.
• Regular tax revenues should pay for anticipatable expenditures and ongoing expenses, and most
capital expenses can be planned for and funds set aside in reserve for that purpose.
All six agencies have a plan to cover capital expenses, whether by bond issue, voter approved levy, or by
accumulation of reserves set-aside. Each of the agencies has a capital expense plan, addressing such things
as major facilities repair or remodel, apparatus replacement, and high value equipment, such as breathing
apparatus, defibrillators, and portable radios. Regardless of the funding mechanism, all six agencies have a
plan, review and update the plan annually, and stay ahead of the anticipated expenditures. Additional
information regarding this type of expenditure can be found in the Current Financial Analysis and the Capital
Assets portions of this report.

Regional Fire & Emergency Services Study City of Tumwater Fire Department
8
Capital Facilities Three basic resources are required to successfully carry out the mission of a fire department―trained
personnel, firefighting equipment, and fire stations. No matter how competent or numerous the firefighters,
if appropriate capital equipment is not available for use by responders, it is impossible for a fire department
to deliver services effectively. Among the most essential capital assets for use in emergency operations are
fire stations and other facilities (e.g., training centers, apparatus maintenance facilities, etc.). Of course, each
fire department’s financing ability will determine the level of capital facilities it can acquire and make
available for use by emergency personnel. This section of the report is an assessment of each of the capital
facilities throughout the study area.
Fire Stations & Facilities
Fire stations play an integral role in the delivery of emergency services for a number of reasons. A station’s
location will dictate, to a large degree, response times to emergencies. A poorly located station can mean
the difference between confining a fire to a single room and losing the structure, or survival from sudden
illness or injury. Fire stations also need to be designed to adequately house sufficient personnel, equipment,
and apparatus; as well as meet other needs of the organization and its personnel. It is important to research
needs based on service-demand, response times, types of emergencies, and projected growth prior to
making a station placement commitment.
Consideration should be given to a fire station’s ability to support each department’s mission as it exists
today, and into the future. The activities that take place within a fire station should be closely examined to
ensure the structure is adequate in both size and function. Examples of these functions may include:
• The housing and cleaning of apparatus and equipment.
• Residential living space for on-duty personnel (male and female).
• Administrative and management offices with computer stations and office facilities for personnel.
• Training, classroom, and library areas.
• Firefighter fitness area.
• Public meeting space.
ESCI toured each of the stations operated by Tumwater Fire Department, Olympia Fire Department, Lacey
Fire District 3, East Olympia Fire District, West Thurston Regional Fire Authority, and McLane-Black Lake Fire
District. The following section and figures list and describe the results of the cursory observations made by
ESCI. A more detailed inventory of each station is included in Appendix C.
The age and condition of the fire stations throughout the study area tend to vary widely—as do a number of
other features (e.g., seismic protection; sprinklers and smoke detection; security; and mixed gender
facilities).
The following figure lists the number of functional fire stations and their respective capacities by each of the
fire departments participating in this study. The figure does not include other facilities such as training
centers or maintenance facilities.
Regional Fire & Emergency Services Study City of Tumwater Fire Department
9
Figure 3: Summary of Fire Station Capacities in the Study Area
Fire Department
Fully Staffed Fire Stations
Maximum Staffing Capability
Maximum Apparatus Capacity (Bays)
Storage Only or Unstaffed StationsA
TFD 2 14 9 0
OFD 4 29 13–15 0
LFD3 4 37–39 18 1
EOFD 2 14 19 2
WTRFA 4 34 16 2
MBLFD 2 35–37 18 4
Totals: 18 163–167 91–93 10
ARefers to stations used for storage only, or stations staffed with resident firefighters.
The previous figure shows that, combined, there are a total of 18 currently staffed fire stations distributed
throughout the study area, capable of housing approximately 163–167 personnel, and about 91–93 apparatus
(depending on size and type). Another 10 stations are unstaffed, staffed with part-time residents, or used for
storage and housing of reserve apparatus.
For those stations that may not be utilized for deployment of personnel and apparatus in the future,
consideration should be given for possible use as reserve apparatus storage, training, and office facilities for
administrative and other support staff.
Apparatus Maintenance Facilities
Several of the fire departments in this study maintain their own apparatus and equipment maintenance
facilities. The East Olympia Fire Department maintains a storage and maintenance facility adjacent to
Station 61, as shown in the following figure.
Figure 4: East Olympia Storage & Maintenance Facility (adjacent to Station 61)

Regional Fire & Emergency Services Study City of Tumwater Fire Department
10
Lacey Fire District 3 owns an apparatus maintenance facility adjacent to its Station 34, which OFD leases and
does fire equipment maintenance for a bulk of the Thurston County Fire agencies and Thurston County Medic
One.
Apparatus & Vehicle Inventories Fire apparatus and medic units (ambulances) are unique and expensive pieces of equipment customized to
operate for a specific community and defined mission. Other than its firefighters, officers, and support staff,
emergency apparatus and vehicles are likely the next most important resource of a fire department.
Apparatus must be sufficiently reliable to transport firefighters and equipment rapidly and safely to an
incident scene. Such vehicles must be properly equipped and function appropriately, so as to ensure that the
delivery of emergency services is not compromised. For this reason, they are very expensive and offer little
flexibility in use and reassignment to other missions.
Modern medic units are complex and sophisticated vehicles which not only must be sufficiently maintained
to ensure firefighters and EMS providers arrive in a timely manner, but also must be in a condition to ensure
patients are transported safely to the hospital or clinical facility.
Tumwater Apparatus & Vehicles
The next two figures list the apparatus and vehicle assignments at each of the Tumwater fire stations. The
following figure lists those units assigned to Tumwater Station T-1.
Figure 5: Lacey Fire District 3 Shared Maintenance Facility

Regional Fire & Emergency Services Study City of Tumwater Fire Department
11
Figure 6: Apparatus & Vehicle Assignments—Tumwater Station T-1
Unit Designation Unit Type Year Condition Minimum Staffing
Pump Capacity
Tank Capacity
Engine T-1 1 2012 Good 3 1500 gpm 640 gal.
Engine T-13 1 2000 Fair Reserve 1500 gpm 750 gal.
Medic-5 Type III 2018 Excellent 2 N/A N/A
Medic-8 Type III 2014 Good Reserve N/A N/A
Battalion T-1 Command 2014 Excellent 1 N/A N/A
UV Training T-1 Staff 2014 Excellent 1 N/A N/A
Chief T-1 Staff 2018 Excellent 1 N/A N/A
Chief T-2 Staff 2014 Excellent 1 N/A N/A
MSO T-1 Staff 2011 Excellent 1 N/A N/A
Inspector T-1 Staff 2000 Fair 1 N/A N/A
Aid Unit T-1 Aid 1988 Fair Events N/A N/A
The next figure lists those units assigned to Station T-2.
Figure 7: Apparatus & Vehicle Assignments—Tumwater Station T-2
Unit Designation Unit Type Year Condition Minimum Staffing
Pump Capacity
Tank Capacity
Engine T-2 1 2018 Excellent 3 1500 gpm 500 gal.
Engine T-14 1 2000 Fair Reserve 1500 gpm 750 gal.
Engine 26 N/A 1947 Fair Events N/A N/A
Through a contractual arrangement with Thurston County Medic One, the Tumwater Fire Department also
staffs a medic unit, with another in reserve, at West Thurston RFA Station 1-1 (will be shown in the West
Thurston apparatus inventory).

Regional Fire & Emergency Services Study City of Tumwater Fire Department
12
Olympia Apparatus & Vehicles
The next four figures list the apparatus and vehicle assignments at each of the Olympia Fire Department fire
stations. The following figure lists those units assigned to Station 1.
Figure 8: Apparatus & Vehicle Assignments—Olympia Station 1
Unit Designation Unit Type Year Condition Minimum Staffing
Pump Capacity
Tank Capacity
Engine 1 Type 1 2016 Good 3 1500 gpm 500 gal.
Truck 1 Aerial (100’) 2010 Good 3 N/A N/A
Aid 1 Aid unit 2003 Fair 2 N/A N/A
Engine 371 Type 1 1998 Good Reserve 1500 gpm 500 gal.
Truck 4 Aerial (105’) 1995 Good CS N/A N/A
Battalion 1 Command 2018 New 1 N/A N/A
Battalion 2 Command 2014 Good Reserve N/A N/A
Rescue 3215 Rescue 2002 Fair 0 N/A N/A
Rescue Boat 308 Boat/trailer 1992 Fair 0 N/A N/A
Training BC Command 2016 Good 1 N/A N/A
MSO 331 Command 2018 New 1 N/A N/A
The following figure lists those units assigned to Station 2.
Figure 9: Apparatus & Vehicle Assignments—Olympia Station 2
Unit Designation Unit Type Year Condition Minimum Staffing
Pump Capacity
Tank Capacity
Engine 2 Type 1 2010 Good 3 1500 gpm 500 gal.
Engine 372 Type 1 1998 Good Reserve 1500 gpm 500 gal.
Medic 10 ALS Medic 2018 New 2 N/A N/A
Medic 368 ALS Medic 2011 Fair Reserve N/A N/A

Regional Fire & Emergency Services Study City of Tumwater Fire Department
13
The following figure lists those units assigned to Station 3.
Figure 10: Apparatus & Vehicle Assignments—Olympia Station 3
Unit Designation Unit Type Year Condition Minimum Staffing
Pump Capacity
Tank Capacity
Engine 3 Type 1 2008 Good 3 1500 gpm 500 gal.
Engine 370 Type 1 1995 Good Reserve 1500 gpm 500 gal.
The following figure lists those units assigned to Station 4.
Figure 11: Apparatus & Vehicle Assignments—Olympia Station 4
Unit Designation Unit Type Year Condition Minimum Staffing
Pump Capacity
Tank Capacity
Engine 4 Type 1 2010 Good 3 1500 gpm 500 gal.
Engine 306 Type 1 1990 Fair Reserve 1500 gpm 500 gal.
Medic 4 ALS Medic 2018 New 2 N/A N/A
Medic 367 ALS Medic 2011 Fair Reserve N/A N/A
Command Van 393 Support 2000 Fair N/A N/A N/A
Then next figure lists various command and staff vehicles assigned to various individuals and located at either
the Olympia Fire Department’s Training Center or Fire Station 1.
Figure 12: OFD Command & Staff Vehicles (Station 1 & Training Center)
Unit Designation Unit Type Year Condition
Training Lieutenant Support 1999 Fair
Fire Marshal Command 2016 Good
Operations Chief Command 2016 Good
Fire Chief Command 2018 New
Assistant Fire Marshal Command 2018 New
Inspector (387) Inspector 2004 Fair
Inspector (326) Inspector 2018 New
Inspector (327) Inspector 2018 New
Staff Car Pool Car 2005 Good
In addition to the vehicles listed in the preceding figure, the Olympia Fire Department maintains two new
service trucks and three staff cars at their apparatus maintenance facility.

Regional Fire & Emergency Services Study City of Tumwater Fire Department
14
Lacey Apparatus & Vehicles
The next five figures list the apparatus and vehicle assignments at each of the Lacey Fire District 3 fire
stations. The following figure lists those units assigned to Station 31.
Figure 13: Apparatus & Vehicle Assignments—Lacey Station 31
Unit Designation Unit Type Year Condition Minimum Staffing
Pump Capacity
Tank Capacity
Engine 31 Type 1 2016 Good 3 1500 gpm 500 gal.
Truck 31 Aerial (105’) 2006 Good 3 N/A N/A
Tender 31 Tender 2013 Excellent 2 (CS) 750 gpm 2500 gal.
Medic 3 Ambulance 2017 Excellent 2 N/A N/A
Aid 31 Aid 2009 Good Reserve N/A N/A
Battalion 31 Command 2015 Good 1 N/A N/A
Engine 312 Type 1 2001 Average Reserve 1500 gpm 500 gal.
Incident Support 31 Support 1994 Average 1 (on call) N/A N/A
Utility 31 Utility/Tow 2015 Good 2–3 (CS) N/A N/A
Boat & Watercraft Varies Varies Good 2–3 (CS) N/A N/A
Support 31 Tech
Rescue 2005 Average 2–3 (CS) N/A N/A
Battalion 39 Command 2007 Good Reserve N/A N/A
Medic 12 Ambulance 2013 Good Reserve N/A N/A
The following figure lists those units assigned to Station 32.
Figure 14: Apparatus & Vehicle Assignments—Lacey Station 32
Unit Designation Unit Type Year Condition Minimum Staffing
Pump Capacity
Tank Capacity
Engine 32 Type 1 2004 Good 2 1250 gpm 1000 gal.
Type 1 1994 Average Reserve 1500 gpm 500 gal.
The following figure lists those units assigned to Station 33.
Figure 15: Apparatus & Vehicle Assignments—Lacey Station 33
Unit Designation Unit Type Year Condition Minimum Staffing
Pump Capacity
Tank Capacity
Engine 33 Type 1 2012 Good 3 1500 gpm 500 gal.
Aid 33 BLS Transport 2018 New 2A N/A N/A
AStaffed as a peak-demand unit
The following figure lists those units assigned to Station 34.

Regional Fire & Emergency Services Study City of Tumwater Fire Department
15
Figure 16: Apparatus & Vehicle Assignments—Lacey Station 34
Unit Designation Unit Type Year Condition Minimum Staffing
Pump Capacity
Tank Capacity
Engine 34 1 2012 Good 3 1500 gpm 500 gal.
Medic 6 ALS
Ambulance 2017 Excellent 2 N/A N/A
Brush 34 6 2018 Excellent 2 (CS) 80 CAFS 300 gal.
Tender 34 Tender 2012 Excellent 2 (CS) 750 gpm 2500 gal.
The following figure lists those units assigned to Station 35.
Figure 17: Apparatus & Vehicle Assignments—Lacey Station 35
Unit Designation Unit Type Year Condition Minimum Staffing
Pump Capacity
Tank Capacity
Engine 35 1 2001 Average 3 1500 gpm 500 gal.
Brush 35 6 2002 Average 2 (CS) 80 CAFS 300 gal.
Figure 18: LFD3 Command & Staff Vehicles
Unit Designation Type Year Make and Model Condition Minimum Staffing
CH31 Command Staff 2012 Ford Interceptor Good 1
BN32 Command Staff 2018 Ford Interceptor Excellent 1
BN33 Command Staff 2017 Ford Interceptor Excellent 1
BN34 Command Staff 2017 Ford Interceptor Excellent 1
BN35 Command Staff 2018 Ford Interceptor Excellent 1
Facilities Staff 2015 Ford F150 Excellent 1
Staff 1 Staff Pool 2012 Ford Escape Good Pool
Staff 2 Staff Pool 2018 Ford Escape Excellent Pool

Regional Fire & Emergency Services Study City of Tumwater Fire Department
16
East Olympia Apparatus & Vehicles
The next four figures list the apparatus and vehicle assignments at each of the East Olympia (District #6) fire
stations. The following figure lists those units assigned to Station 61 (headquarters).
Figure 19: Apparatus & Vehicle Assignments—East Olympia Station 61
Unit Designation Unit Type Year Condition Minimum Staffing
Pump Capacity
Tank Capacity
Engine 61 Type 1 2007 Good 2 (CS) 1500 gpm 650 gal.
Tender 61 Tender 2005 Excellent 1 (CS) 500 gpm 2500 gal.
Aid 61 BLS Aid 2006 Good 2 (CS) N/A N/A
Brush 61 Wildland 2017 Excellent 2 (CS) 400 gpm 300 gal.
Incident Support 6 Other 2000 Good 1 (CS) Cascade system
CS = Cross staffed
The next figure lists those units assigned to Station 62 and Station 63. Both stations are unstaffed, and
Station 63 has no apparatus assigned to it.
Figure 20: Apparatus & Vehicle Assignments—East Olympia Stations 62
Unit Designation Unit Type Year Condition Minimum Staffing
Pump Capacity
Tank Capacity
Station 62
Engine 62 Type 1 1998 Good Unstaffed 1250 gpm 750 gal.
The following figure lists those units assigned to Station 64.
Figure 21: Apparatus & Vehicle Assignments—East Olympia Station 64
Unit Designation Unit Type Year Condition Minimum Staffing
Pump Capacity
Tank Capacity
Engine 64 Type 1 1999 Fair 3 1250 gpm 750 gal.
Aid 64 BLS Aid 2006 Good 2 (CS) N/A N/A
Tender 64 Tender 2005 Very Good 1 (CS) 500 gpm 2500 gal.
Brush 64 Wildland 2018 New 2 (CS)
Engine 64 (new) Type 1 2018 New 3 1500 gpm 500 gal.
CS = Cross staffed
The following figure lists those units assigned to Station 65.
Regional Fire & Emergency Services Study City of Tumwater Fire Department
17
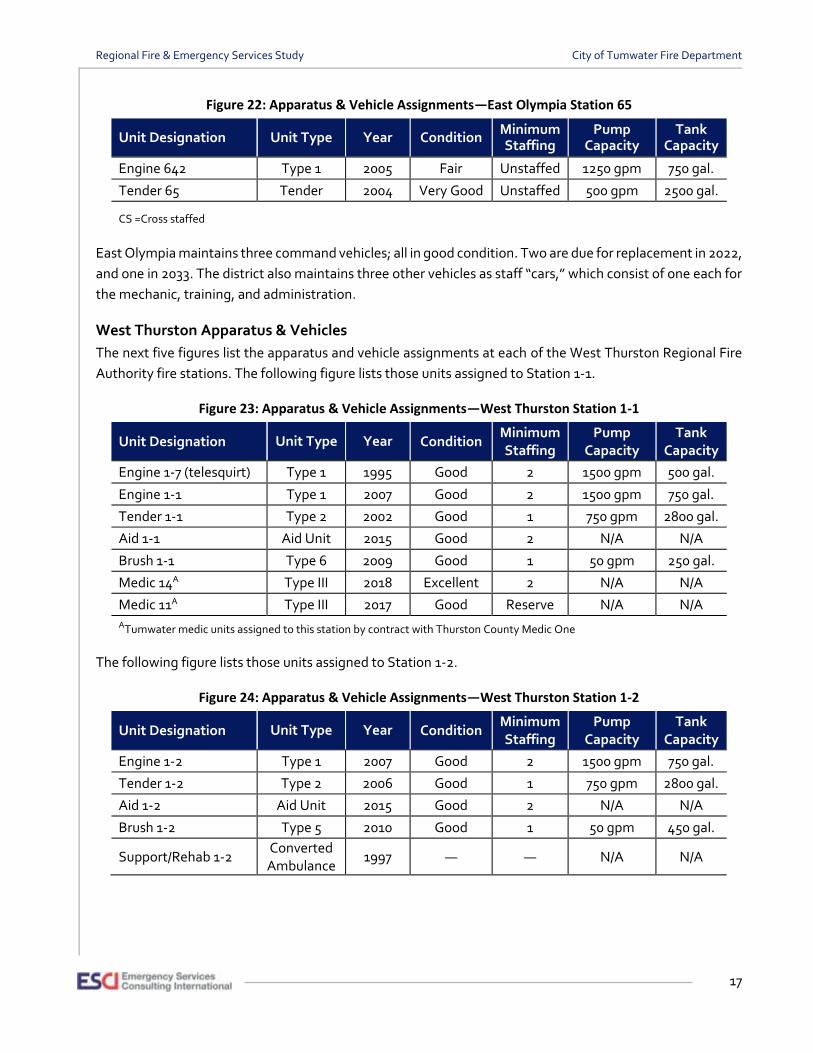
Figure 22: Apparatus & Vehicle Assignments—East Olympia Station 65
Unit Designation Unit Type Year Condition Minimum Staffing
Pump Capacity
Tank Capacity
Engine 642 Type 1 2005 Fair Unstaffed 1250 gpm 750 gal.
Tender 65 Tender 2004 Very Good Unstaffed 500 gpm 2500 gal.
CS =Cross staffed
East Olympia maintains three command vehicles; all in good condition. Two are due for replacement in 2022,
and one in 2033. The district also maintains three other vehicles as staff “cars,” which consist of one each for
the mechanic, training, and administration.
West Thurston Apparatus & Vehicles
The next five figures list the apparatus and vehicle assignments at each of the West Thurston Regional Fire
Authority fire stations. The following figure lists those units assigned to Station 1-1.
Figure 23: Apparatus & Vehicle Assignments—West Thurston Station 1-1
Unit Designation Unit Type Year Condition Minimum Staffing
Pump Capacity
Tank Capacity
Engine 1-7 (telesquirt) Type 1 1995 Good 2 1500 gpm 500 gal.
Engine 1-1 Type 1 2007 Good 2 1500 gpm 750 gal.
Tender 1-1 Type 2 2002 Good 1 750 gpm 2800 gal.
Aid 1-1 Aid Unit 2015 Good 2 N/A N/A
Brush 1-1 Type 6 2009 Good 1 50 gpm 250 gal.
Medic 14A Type III 2018 Excellent 2 N/A N/A
Medic 11A Type III 2017 Good Reserve N/A N/A
ATumwater medic units assigned to this station by contract with Thurston County Medic One
The following figure lists those units assigned to Station 1-2.
Figure 24: Apparatus & Vehicle Assignments—West Thurston Station 1-2
Unit Designation Unit Type Year Condition Minimum Staffing
Pump Capacity
Tank Capacity
Engine 1-2 Type 1 2007 Good 2 1500 gpm 750 gal.
Tender 1-2 Type 2 2006 Good 1 750 gpm 2800 gal.
Aid 1-2 Aid Unit 2015 Good 2 N/A N/A
Brush 1-2 Type 5 2010 Good 1 50 gpm 450 gal.
Support/Rehab 1-2 Converted Ambulance
1997 — — N/A N/A

Regional Fire & Emergency Services Study City of Tumwater Fire Department
18
The following figure lists those units assigned to Station 1-3.
Figure 25: Apparatus & Vehicle Assignments—West Thurston Station 1-3
Unit Designation Unit Type Year Condition Minimum Staffing
Pump Capacity
Tank Capacity
Engine 1-3 Type 1 2016 Good 2 1500 gpm 500 gal.
Aid 1-3 Aid Unit 2010 Good 2 N/A N/A
Brush 1-2 Type 6 2001 Good 1 50 gpm 300 gal.
The following figure lists those units assigned to Station 1-4.
Figure 26: Apparatus & Vehicle Assignments—West Thurston Station 1-4
Unit Designation Unit Type Year Condition Minimum Staffing
Pump Capacity
Tank Capacity
Engine 1-4 Type 1 1995 Good 2 1500 gpm 500 gal.
Aid 1-4 Aid Unit 2010 Good 2 N/A N/A
The following figure lists those units assigned to Station 1-6.
Figure 27: Apparatus & Vehicle Assignments—West Thurston Station 1-6
Unit Designation Unit Type Year Condition Minimum Staffing
Pump Capacity
Tank Capacity
Engine 1-6 Type 1 1995 Good 2 1250 gpm 500 gal.
Aid 1-6 Aid Unit 2010 Good 2 N/A N/A
Brush 1-6 Type 6 2002 Good 1 50 gpm 300 gal.

Regional Fire & Emergency Services Study City of Tumwater Fire Department
19
McLane-Black Lake Apparatus & Vehicles
The following five figures list the apparatus and vehicle assignments at each of the McLane-Black Lake Fire
Department (District #9) fire stations. The following figure lists those units assigned to Station 91.
Figure 28: Apparatus & Vehicle Assignments—McLane Station 91
Unit Designation Unit Type Year Condition Minimum Staffing
Pump Capacity
Tank Capacity
Engine 91 Type 1 2019 Excellent 2 1500 gpm 750 gal.
Engine 912 Type 1 2005 Fair Reserve 2000 gpm 750 gal.
Aid 91 Ambulance 2009 Good 2 N/A N/A
Tender 91 Tender 2005 Excellent 1 2000 gpm 2500 gal.
Brush 91 Type 6 2008 Good 2 120 gpm 300 gal.
Brush 912 Type 3 2016 Excellent 2 220 gpm 650 gal.
Rescue 91 Rescue 1996 Good 2 N/A N/A
Battalion 91 Command 2004 Fair 1 N/A N/A
Utility 91 Support 2005 Good 1 N/A N/A
ORV 91 Off-Road 2006 Fair 2 N/A N/A
The following figure lists those units assigned to Station 92.
Figure 29: Apparatus & Vehicle Assignments—McLane Station 92
Unit Designation Unit Type Year Condition Minimum Staffing
Pump Capacity
Tank Capacity
Engine 92 Type 2 2005 Excellent 2 750 gpm 550 gal.
Aid 92 Ambulance 2003 Good 2 N/A N/A
The following figure lists those units assigned to Station 93.
Figure 30: Apparatus & Vehicle Assignments—McLane Station 93
Unit Designation Unit Type Year Condition Minimum Staffing
Pump Capacity
Tank Capacity
Engine 93 Type 1 1994 Good 2 1250 gpm 1000 gal.
Engine 932 Type 2 1991 Good 2 1000 gpm 750 gal.
Aid 93 Ambulance 2002 Fair 2 N/A N/A
The following figure lists those units assigned to Station 94.

Regional Fire & Emergency Services Study City of Tumwater Fire Department
20
Figure 31: Apparatus & Vehicle Assignments—McLane Station 94
Unit Designation Unit Type Year Condition Minimum Staffing
Pump Capacity
Tank Capacity
Engine 94 Type 1 1994 Good 2 2000 gpm 750 gal.
The following figure lists those units assigned to Station 95.
Figure 32: Apparatus & Vehicle Assignments—McLane Station 95
Unit Designation Unit Type Year Condition Minimum Staffing
Pump Capacity
Tank Capacity
Engine 95 Type 1 2019 Excellent 2 1500 gpm 750 gal.
Engine 952 Type 1 2005 Fair Reserve 2000 gpm 750 gal.
Aid Unit 95 Ambulance 1998 Fair 2 N/A N/A
Tender 95 Type 2 2017 Excellent 1 2500 gpm 2500 gal.
Brush 95 Type 6 2012 Excellent 2 140 gpm 150 gal.
Boat 95 Watercraft 1982 Fair 2 N/A N/A
ORV 95 Off-Road 2002 Fair 3 N/A N/A
Summary of Apparatus & Vehicles
The following figure is a combined inventory—as reported by each of the agencies—of the various frontline
apparatus and vehicles among the fire departments participating in the regional feasibility study (reserve
apparatus have been excluded).
Figure 33: Inventory of Frontline Apparatus & Vehicles in the Study Area (2018)
Unit Type TFD EOFD LFD3 MBLFD WTRFA OFD TOTALS
Engines 2 5 5 7 6 4 29
Aerials 0 0 1 0 0 1 2
Medic & Aid Units 1 3 3 4 6 3 20
Tender 0 3 2 2 2 0 9
Command Vehicles 3 3 1 1 4 1 13
Wildland (Brush) 0 2 2 3 4 0 11
Watercraft 0 0 3 1 0 1 5
Support/Rehab Units 0 1 1 1 1 1 5
Other Vehicles1 3 3 1 3 3 2 15
1Staff vehicles and other specialty vehicles
As shown in the preceding figure, the quantity and types of apparatus and vehicles tend to vary among each
of the jurisdictions. This is to be expected, as the types of potential risks and incident-types within each
service area tend to be different. For example, a fire district with large areas of wildland and limited water
supplies may have a larger fleet of brush trucks and water tenders than a city fire department.

Regional Fire & Emergency Services Study City of Tumwater Fire Department
21
Staffing & Personnel Management Many emergency services organizations consider their employees as their most valuable asset. Managing
personnel to achieve maximum efficiency, professionalism, and personal satisfaction is an art as much as
science. Consistency, fairness, safety, and opportunities for personal and professional growth are key values
in a healthy management culture. These values are even more important when the organization relies on the
participation and support of a “volunteer” workforce. Volunteer personnel may leave if they do not feel
valued and/or experience personal satisfaction from their participation.
Several national organizations recommend standards to address staffing issues. The Occupational Health &
Safety Administration (OSHA) Respiratory Protection Standard, and the National Fire Protection Association
(NFPA) Standard 1710 or 1720 (whichever is applicable), are frequently cited as authoritative documents.1,2,3
In addition, the Center for Public Safety Excellence (CPSE) publishes benchmarks for the number of
personnel recommended on the emergency scene for various levels of risk.
An appropriate balance of administration and support staff, compared to operational resources and service
levels, is an important consideration to achieving organizational success. It is important to remember that
key administrative and logistical support positions are critical in maintaining an efficient and effective fire
department. With that said, comparing these positions across the five departments may reveal opportunities
for sharing and/or combining positions to improve overall efficiencies for the departments.
ESCI evaluated the job descriptions, work schedules, compensation packages, and use of personnel to
identify areas of excellence, areas for improved efficiency in personnel management, and opportunities to
share resources among the six departments.
Personnel Policies & Processes
The departments were surveyed to determine the administrative components used in managing their
employees. All departments have contemporary personnel policy manuals, provide training on these policies
to new employees, and archive copies of outdated policies. OFD and TFD use the Lexipol® web-based policy
management service. All six departments maintain and securely archive personnel records, including injury
and accident reports and medical/exposure records. TFD and OFD personnel records, including discipline,
medical, and City administrative records are maintained within their Human Resource Departments.
1 Respiratory Protection Standard 29 CFR 1910.134; Occupational Health & Safety Administration.
2 NFPA 1710: Standard for the Organization and Deployment of Fire Suppression Operations, Emergency Medical Operations, to the
Public by Career Fire Departments; National Fire Protection Association (NFPA).
3 NFPA 1720: Standard for the Organization and Deployment of Fire Suppression Operations, Emergency Medical Operations, and Special
Operations to the Public by Volunteer Fire Departments; NFPA.

Regional Fire & Emergency Services Study City of Tumwater Fire Department
22
Ensuring the health and safety of employees should be a high priority in any business or government
organization. Many fire service organizations offer proactive health wellness programs designed to promote
and support healthy lifestyles in an attempt to ward off illness and injury. Many of these programs also
support mental health wellness, which is even more important for those working in emergency services. The
following figure summarizes health and wellness services.
Figure 34: Health, Safety & Counseling Services
Health, Safety & Counseling Services
TFD OFD LFD3 EOFD WTRFA MBLFD
Medical Standards Established
Yes IAFC/IAFF Wellness Program
Yes Yes NFPA 1582
DOT Exam for
volunteers, IAFC/IAFF Wellness
Program for career staff
Medical Exam Frequency
Semi-Annual
Annual Annual Semi-
Annual Annual Annual
Safety Committee Established
City only Yes Yes Yes Yes Yes
Critical Incident Stress Debriefing
Yes Yes Yes Yes Yes Yes
Employee Assistance Program
Yes Yes Yes Yes Yes Yes
Intervention Program No Yes Yes No In progress No
Ensuring firefighters are medically fit to meet the strenuous duties associated with emergency response and
fireground tasks is paramount. In addition, state and federal law mandates respiratory medical assessment,
clearance and fit testing for anyone required to wear a respirator. CFR 1910.134(e)(1) requires employees
obtain a medical clearance from a physician or other licensed health care professional before they can wear
a respirator (including N95, N100, P100, and HEPA respirators), and must be annually fit-tested.
Career Firefighter Hiring and Selection Processes
Recruiting, selecting, and retaining firefighters takes considerable investment of time, effort, and money to
ensure high quality employees work in the organization. While becoming a firefighter is one of the most
sought-after careers in the nation, selecting the best candidates that fit within the department and its culture
requires deliberate and comprehensive evaluation. The following figure summarizes the hiring process
components used by the six departments.

Regional Fire & Emergency Services Study City of Tumwater Fire Department
23
Figure 35: Hiring Process Components
Hiring Process Components
TFD OFD LFD3 EOFD WTRFA MBLFD
Recruitment Program Yes Yes Yes Yes Yes Yes
Qualifications Check Yes Yes Yes Yes Yes Yes
Reference Check Yes Yes Yes Yes Yes Yes
Background Check Yes Yes Yes Yes Yes Yes
Physical Agility Standards Established
CPAT CPAT CPAT CPAT CPAT CPAT
Knowledge Testing Yes Yes Yes Yes Yes Yes
Interview Yes Yes Yes Yes Yes Yes
Medical Exam Required
Yes Yes Yes Yes Yes Yes
Psychological Exam Required
Yes Yes Yes No No Yes,
Career only
Hiring Process Discussion
All six departments use a standardized and thorough hiring process for new full-time employees. All six
departments—TFD, OFD, LFD3, EOFD, WTRFA, and MBLFD—use an outside vendor (either Public Safety
Testing® or National Testing Network®) for some or all of the following services:
• Recruiting services
• Accepting and screening applications
• Background checks
• Administering the Candidate Physical Agility Test (CPAT)
• Administering a written examination
• Administering a psychological/suitability examination
EOFD accepts applicants who have a current (within a year) CPAT card. If an applicant does not have a current
card, the department administers their own physical agility assessment that is very similar to the CPAT. Many
fire departments in the Puget Sound area use PST or NTN for managing and administering initial fire
department employee screening and testing. These services are an attractive option for departments, as they
reduce the amount of staff time and resources necessary for initial testing, and reduce potential perception
of bias. The service is also attractive for applicants, as their application and test results can be accessed by
any or all of the participating departments, depending on the departments initially selected by the applicant.

Regional Fire & Emergency Services Study City of Tumwater Fire Department
24
Over the past few years, the hiring practices in fire departments across the country have been challenged by
allegations of bias and discrimination. For example, the New York City and Los Angeles fire departments’
new hire testing practices were questioned, resulting in the suspension of the hiring process and revocation
of some conditional job offers. Outside experts were brought in to analyze historical hiring outcomes, current
hiring administrative procedures, and make recommendations for improvement.4 As a result, significant
changes were made, at great expense to ensure fair and impartial hiring processes.
A 10-year review (1994–2004) of firefighter line of duty death statistics revealed that 45 percent were the
result of heart disease.5 In 2010, the National Institute for Occupational Safety and Health (NISOH)
conducted a study of the prevalence of cancer in 30,000 firefighters.6 The study concluded firefighters have
a 14 percent greater risk of contracting cancer compared to the general population. Lastly, the NFPA
Standard 1582: Standard on Comprehensive Occupational Medical Program for Fire Departments, defines the
necessary components of an occupational medical program to ensure the safety and health of firefighters.7
Ensuring employees are medically cleared to perform rigorous fireground tasks, along with identifying any
pre-existing medical condition which may place an employee in jeopardy, is an important screening
component in the hiring process and beyond. All six departments have established medical standards, and
require a comprehensive medical examination after being conditionally hired. However, the frequency and
exam parameters of these medical examinations varies between departments.
RECOMMENDATIONS:
• Consolidate new hire candidate processing and initial testing through either PST or NTN.
• Adopt the CPAT as the standard physical agility testing program.
• Require annual wellness physicals for all employees.
▪ Adopt comprehensive screening parameters that evaluate cardiovascular health, cancer
screening, behavioral health, and musculoskeletal fitness.
Volunteer & Part-Time Firefighter Selection Process
In today’s progressive fire departments, recruitment, selection and training of volunteer and part-time
firefighters often mirrors career firefighter hiring practices, including written examinations, interviews, and
physical agility testing. With the exception of OFD, all of the departments employ either volunteers and/or
part-time employees. The following chart summarizes the vetting process for onboarding volunteer and
part-time firefighters.
4 Recommendations for Improving the Recruiting and Hiring of Los Angeles Firefighters, Rand Corporation, 2015,
https://www.rand.org/content/dam/rand/pubs/research_reports/RR600/RR687/RAND_RR687.pdf.
5 Emergency Duties and Deaths from Heart Disease among Firefighters in the United States, New England Journal of Medicine, March
2007; 356:1207–1215.
6 Findings from a study of cancer among U.S. Firefighters, National Institute of Occupational Safety & Health, July 2016.
https://www.cdc.gov/niosh/pgms/worknotify/pdfs/ff-cancer-factsheet-final.pdf.
7 NFPA 1582: Standard on Comprehensive Occupational Medical Program for Fire Departments; NFPA.

Regional Fire & Emergency Services Study City of Tumwater Fire Department
25
Figure 36: Volunteer Selection Components
Selection Process Elements TFD LFD3 EOFD WTRFA MBLFD
Reference Check No Yes Yes Yes Yes
Background Check No Yes Yes Yes Yes
Physical Agility Standards Established
No CPAT CPAT or
PAT CPAT-like CPAT
Knowledge Testing No Yes Yes Yes Yes
Chief Interview Yes Yes Yes Yes No
Medical Exam Required Yes Yes Yes Yes Yes
Psychological Exam Required No Yes No No No
Pre-Academy Class Yes Yes Yes Yes Yes
ESCI noted a unique resource available to WTRFA, a SAFER Grant funded position responsible for recruiting
and supporting volunteer firefighters. This outreach position is constantly communicating and educating the
community about the need for volunteers, and implementing various public education programs and
advertisement strategies to attract service from amongst the community.
Volunteer Selection Discussion
With the exception of OFD (which does not use volunteers or part-time personnel), the departments
administer a basic written test, oral interview, and physical agility assessment to all prospective volunteer
candidates. In addition, MBLFD, WTRFA, and EOFD require completion of several fire and EMS related
knowledge and skills objectives prior to sending candidates through a formal recruit academy. This is done
to ensure the prospective firefighters fully understand the tasks required of firefighters, the time
commitment required, and demonstrate a strong desire to serve their community.
Nationally, volunteer fire departments comprised the majority of the fire service. With that said, today’s fire
service is finding it more difficult to recruit, hire, and retain volunteer firefighters.
The number of volunteer firefighters in the U.S. reached a low in 2011. While there has
been a slow increase since then, the growth isn’t enough to meet the steady increase in
call volume, which has tripled in the last 30 years due in large part to the increase in
emergency medical calls. Major factors contributing to recruitment challenges include
increased time demands, more rigorous training requirements, and the proliferation of
two-income families whose members do not have time to volunteer. Fire departments
today are also expected to provide a wide range of services and multi-hazard response,
creating further challenges for resource-constrained departments.

Regional Fire & Emergency Services Study City of Tumwater Fire Department
26
For the past 21 years, MBLFD has had an invaluable resource for volunteers through the South Puget Sound
Community College’s, Fire and Emergency Services Technology Program, which supplied a steady stream of
motivated students who earn college credits for fire related experience gained by spending duty time in the
District’s fire stations. However, the college recently announced termination of the program, effective
August 2019. MBLFD, who rely on these students to meet minimum staffing requirements on apparatus, is
legitimately concerned about the sustainability of its deployment model given this pending change.
Departments who wish to continue to rely on volunteers/resident firefighters to meet minimum staffing
levels will need to place renewed emphasis on recruiting new volunteers from their local communities,
including increased public relations and involvement in local high schools and colleges. There are several
resources and techniques available that can be leveraged to increase firefighting recruitment. The National
Volunteer Fire Council (NVFC) has resources available to assist departments in recruiting and retaining
volunteers. Most of these resources involve increased marketing of the department, including strategies to
motivate and inspire prospective volunteers. Marketing strategies to consider include, but are not limited to:
• Creating or modifying the department website, providing detailed information on the job of a
firefighter and the benefits of belonging to the organization. It should also be designed to allow those
interested to easily express interest and submit their contact information.
• Leveraging social media tools, such as Facebook®, Instagram®, and LinkedIn®, keeping content fresh
and relevant.
• Apply for SAFER grants that can be used for recruitment and retention programs, including hiring
employees and/or services for marketing and recruitment.
• Set up a department Google account through their Non-Profit Program (if the department and/or
firefighters association is eligible for 501(c)(3) status. Participation in this program may allow access
to $10,000 per month of in-kind advertising through Google, along with access to various Google
tools and groups that can increase community interest and engagement.
Of course, consolidation of two or more of the departments who rely on volunteer/resident firefighters may
be able to use their combined resources to maintain staffing levels, or hire part-time/full-time firefighters
instead. Careful financial forecasting will be required to determine if this approach is financially feasible and
sustainable.
RECOMMENDATIONS:
• Develop and engage in a comprehensive marketing strategy to recruit volunteer and
resident firefighters.
• Continue use of third-party testing services for newly selected members.
• Adopt a CPAT-like physical agility testing program for all combat personnel.
• Require annual wellness physicals for all volunteers.
▪ Adopt comprehensive screening parameters that evaluate cardiovascular health, cancer
screening, behavioral health, and musculoskeletal fitness.

Regional Fire & Emergency Services Study City of Tumwater Fire Department
27
Union Agreements
Operations personnel from the six departments are represented by International Association of Firefighters
(IAFF) local bargaining units as summarized in the following figure, which also notes the effective dates of
their respective bargaining agreements. All six locals are within the jurisdiction of IAFF District 7.
Figure 37: Current IAFF Bargaining Unit Agreement Periods
Department Agreement Period
TFD/Local 2409 2017–2019
OFD/Local 468 2017–2019
LFD3/Local 2903 2016–20188
EOFD/Local 3825 2017–20189
WTRFA/Local 3825 2018–2019
MBLFD/Local 3825 2017–2019
Union Agreement Discussion
The success of any type of consolidation of the six departments will hinge in large part on Union participation,
compromise, and agreement. The variation in work schedules, benefits, and other conditions currently
outlined in the bargaining unit agreements of the four local union affiliates will need to be carefully addressed
and homogenized for an effective and efficient consolidation. This can take the form of one affiliate
absorbing the membership and obligations of other affiliates, commonly called a “merger,” or by legally
dissolving the current IAFF affiliates and forming an entirely new bargaining unit, commonly called an
“amalgamation.”
Merger or amalgamation of local union affiliates is encouraged by the IAFF where it makes sense. In 2012,
the IAFF Legal Department published a manual to guide union leaders in merger/amalgamation efforts. The
manual reviews the applicable sections in the IAFF Constitution and Bylaws and defines the reporting
requirements, legal requirements, and specific duties of merged and amalgamated affiliates. In the manual
they state:
The Executive Board recommends that when the consolidation, unification, or merger of two or
more counties, cities, or townships is anticipated, all locals involved should merge as soon as
possible. If a merger of locals is not immediately possible, a joint committee should be established
to work with the department administration to negotiate the benefits for all members. Every effort
should be made to conclude the bargaining prior to the merger.
8 A new collective bargaining agreement has been ratified.
9 Ibid.

Regional Fire & Emergency Services Study City of Tumwater Fire Department
28
Given the number of significant labor implications related to an identified new consolidated fire agency,
including internal union governance issues, the involved local affiliates would likely benefit from the
participation of the IAFF District Vice President and other legal resources available through the IAFF. Also,
given the complexity and variation of wages and benefits between the affiliates, if consolidation is actively
pursued by two or more of the departments, they should engage in internal union planning as soon as
practical to reach agreement on how the affiliates would be organized in the new fire agency organization.
Administrative Support Staffing
Each of the six departments have varying levels of administrative support positions due primarily to their
size, and because the city fire departments can rely on other city departments for administrative support
services—Information Technology and Human Resource services, for example—which are typically not
available to county fire districts. However, as the following figure shows, OFD has the largest number of
administrative positions, compared to the other departments.
The following figure illustrates the various uniformed and non-uniformed administrative positions.
Figure 38: Administrative & Support Uniformed Staff Positions
Staff Positions TFD OFD LFD3 EOFD WTRFA MBLFD
Fire Chief 1 1 1 1 1 1
Deputy Chiefs Currently
Vacant 2
Assistant Chiefs 1 2 1 1 1
Currently Vacant
Administrative Battalion Chiefs 1
Prevention & Public Education Positions1 1 4 1
Training Officer (Capt. Or Lt.) 1 1 2
EMS Officer 1 1 1
Other: (Describe) 1 Project Captain
Total Uniformed Administrative/Staff positions
5 12 6 2 3 2
% of Admin staff to total FD personnel
10% 19% 10% 9% 6% 6%
1 These members have 3 functions: Fire Investigation, Fire Inspections, and Education
OFD clearly has the most uniformed administrative support positions among the six agencies, especially as
it relates to fire/life safety prevention and education functions. The following figure shows who provides
administrative support functions among the six agencies.

Regional Fire & Emergency Services Study City of Tumwater Fire Department
29
Figure 39: Non-Uniformed Administrative Positions
Non-Uniformed Administrative Positions
TFD OFD LFD3 EOFD WTRFA MBLFD
Management Analyst
IT Technician 1
Office Manager 1 1 1 1 1
Finance Director 1
Human Resources Director 1
Accounting Specialist 1
Payroll Administrator 1
Facilities/Technology Director 1
Administrative Assistant 1 2 3 1 .75 1
Emergency Management 1
Chief Mechanic 1
Mechanic 31 1
Other: (Describe) 1 Inventory
Control Specialist II
1 – .75 FTE Volunteer Grant
Coordinator 1 – .25 Admin. Asst.
3 – Share .6 FTE Position
Total Positions: 2 10 9 3 3.4 2
1An additional Mechanic started 04/16/19.
Administrative Staffing Discussion
Analyzing the ratio of administrative and support positions to the total operational positions of the
department facilitates an understanding of the relative number of resources committed to this important
function. The ratios between administrative positions and total number of department positions in each
department does not appear excessive. OFD appears to have the highest number of uniformed and civilian
administrative support positions compared to the other five departments. However, it should be noted that
OFD’s administrative head count includes five Apparatus Mechanic Positions, who provide apparatus repair
services to eight local fire departments and Thurston County Medic One.
During the site visit, ESCI learned the OFD Fire Chief is planning on retiring in approximately one year, and
at least two other Chiefs in other departments are also contemplating retirement. In addition, MBLFD is
planning on not filling a vacant Assistant Chief position until after the findings and recommendations of this
study are released, and potential consolidation planning steps identified. EOFD has a vacant battalion chief
position, which they plan to fill (or underfill) this year.
RECOMMENDATION (IF CONSOLIDATIONS OCCUR):
• Leave current/planned administrative uniformed personnel vacancies unfilled until
subsequent consolidation planning/implementation strategies are agreed upon.

Regional Fire & Emergency Services Study City of Tumwater Fire Department
30
Emergency Operations Staffing
Next, we evaluated the type and number of operations staff positions. The following figure summarizes the
number of operations positions in each department.
Figure 40: Operations Staff Positions
Staff Positions TFD OFD LFD3 EOFD WTRFA MBLFD
Battalion Chiefs N/A 3 4 Vacant 1 N/A
Captains 3 N/A 2 N/Aa 3 3
Lieutenants (Including Paramedic)
9 25 24 4 6 6
Firefighter/Paramedics 14 14 22 N/A N/A N/A
Firefighters-Full-time 16 43* 50 2 21 3
Firefighters-Part-time N/A N/A N/A 9 N/A N/A
Volunteer Firefighters (Including Officers & Resident FFs)
11 0 20 26 47 50
Total Operations Positions 53 85 120 41 78 62
% of Operations Officers to Firefighters
20% 32% 16% 8% 11% 14%
*Includes six “project” funded positions. aVacant B/C position may be underfilled as Captain this year
OFD’s six “project” positions are Firefighter/EMTs who staff a BLS unit part-time to respond to incidents in
the downtown area where there is a significant indigent/homeless population. These positions are
temporarily funded through a SAFER Grant.
ESCI also calculated the theoretical total number of full-time employees required to meet the various
average leave hours used by employees in 2017 in each department, and compared the results to the current
minimum number of operations employees assigned to each shift. This calculation compared the average
available scheduled weekly work hours per employee, subtracted the average various leave types—based on
2017 historical leave use data—and calculated sick and vacation relief factors. ESCI then multiplied the
number of personnel needed to cover a single position at 24-hours per day with the relief factor to determine
the total number of employees required to meet daily minimum staffing, without taking into account the use
of volunteers or part-time employees to backfill vacancies. The following figure summarizes the results of
these calculations:

Regional Fire & Emergency Services Study City of Tumwater Fire Department
31
Figure 41: Theoretical Relief Factor Calculation (2017)
Relief Factor TFD OFD LFD3 EOFD WTRFA MBLFD
Sick Leave 1.22 1.11 1.17 1.22 1.09 1.10
Vacation Leave 1.16 1.19 1.20 1.07 1.18 1.12
Total Relief Factor:1 1.27 1.21 1.27 1.27 1.18 1.15 1Includes Holiday leave, Personal leave, FMLA, bereavement, short-term disability, military leaves, etc.
The total leave factors were multiplied by the number of personnel needed to cover one 24-hour position.
The following figure compares the theoretical number of positions needed with the current number of
employees assigned to the work schedules.
Figure 42: Calculated Operational Staff Overage (Shortage)
Department Number of Positions
Required 24/7 Total Number of Operations FTEs
Theoretical Number of FTEs
Overage (Shortage)
TFD 10 42 45 (-3)
OFD 20 85 82 3
LFD3 22 100 102 (-2)
EOFD 1.5 6 6 0
WTRFA 7 31 30 3
MBLFD1 4 12 12 0
Total: 65 275 324 +1
Emergency Staffing Discussion
As shown in the preceding figure, each department’s staffing levels are close to the theoretical number of
personnel needed to cover scheduled and unscheduled leaves for each agency. Reconciling the results of this
staffing resource analysis with current staffing levels and resource allocation strategies among the six
departments should be approached carefully. In ESCI’s experience, theoretical analysis does not necessarily
take into account an organization’s inherent flexibility and resources that can be potentially leveraged to
reduce workload and personnel costs—nor does it take into account the ongoing costs of providing the
various benefits to full-time employees. Full-time employee benefit expenses must be considered when
analyzing the cost of adding full-time employees versus using overtime or part-time employees who do not
receive benefits.
Lastly, as a result of collective bargaining, consolidation of two or more of the departments may result in
changes to the employee average workweek hours, leave time, and work schedules. Each, or all of these
factors, may have an impact on the total number of employees required to ensure minimum daily staffing
levels.

Regional Fire & Emergency Services Study City of Tumwater Fire Department
32
Effective Response Force Analysis
In addition to reviewing the total number of operations staff available, ESCI also reviewed daily staffing levels
in each department, and compared them to national consensus standards related to providing sufficient
personnel and resources to quickly mitigate emergency incidents—specifically, structure fires and critical
EMS situations. Given there is a large number of paramedics among the three ALS career departments,
including medics who provide medical first response (MFR), ESCI focused on each department’s ability to
marshal an Effective Response Force (ERF) to mitigate structure fires or other complex and dynamic
emergencies. Effective Response Force and Critical Task Analysis are both discussed in detail in the Service
Delivery & Performance section of this report.
The fire service assesses the relative risk of properties and occurrences based on a number of factors.
Properties with high fire risk often require greater numbers of personnel and apparatus to effectively
mitigate the fire emergency. Staffing and deployment decisions should be made with consideration of the
level of risk involved.
The level of risk categories used by CFAI relate as follows:
• Low Risk: Areas and properties used for agricultural purposes, open space, low-density residential
and other low intensity uses.
• Moderate Risk: Areas and properties used for medium density single family residences, small
commercial and offices uses, low intensity retail sales and equivalently-sized business activities.
• High Risk: Higher density business districts and structures, mixed-use areas, high density residential,
industrial, warehousing, and large mercantile structures.
Each department’s minimal daily staffing resources, as noted in Figure 42: Calculated Operational Staff
Overage (Shortage), was compared to the NFPA and CFAI criteria previously noted. Not surprisingly, this
comparison shows OFD and LFD3 are the only departments currently able to independently meet the staffing
standard for up to a Moderate Risk incident. It must also be noted that this comparison assumes all on-duty
personnel and response units are available to respond to the incident in any one department. Concurrent calls
can severely impact any single department’s ability to safely and effectively mitigate a Moderate to High Risk
incident.
Wages & Benefits
Depending on the depth and breadth of future consolidation efforts, the wages and benefits paid to the
employees of the six departments will need to be taken into consideration. ESCI analyzed the average wages
of the various administrative and operational positions between the departments, and the various benefit
packages to identify significant similarities and differences that would need to be incorporated into future
consolidation planning efforts.
In evaluating the salary tables provided by each department and/or listed in the six bargaining unit
agreements, ESCI noted variations in position titles and associated pays between departments. The
following figure summarizes the various salary pays by position in each department.

Regional Fire & Emergency Services Study City of Tumwater Fire Department
33
Figure 43: Operations Pay Classifications By Department
Career Operations Positions TFD OFD LFD3 EOFD WTRFA MBLFD
Battalion Chief X X X
Fire Captain/EMT X X X X X
Fire Captain/Paramedic X X
Fire Lieutenant/Paramedic X X X
Fire Lieutenant/EMT X X X X X X
Firefighter/EMT X X X X X X
Firefighter/Paramedic X X X
Volunteer & Part-Time Positions TFD OFD LFD3 EOFD WTRFA MBLFD
Volunteer Deputy Chief X
Volunteer Battalion Chief X X1 X X
Volunteer Fire Captain X X
Volunteer Fire Lieutenant X X X X
Volunteer Firefighter X X X X
Volunteer EMT only X X X
Resident Firefighter X X X
Part-Time Fire Captain
Part-Time Firefighter X 1The Volunteer Battalion Chief passed away during this report compilation and position will not be filled in the near term.
As noted in the preceding figure, the most common career positions across the six career departments were
Fire Lieutenant/EMT and Firefighter/EMT, and Firefighter was the most common volunteer position. OFD is
the only department that does not use volunteer firefighters. EOFD is the only department utilizing part-time
firefighters.
The salary data submitted from the six departments revealed significant variations in pay among the various
positions. Some departments submitted current salaries for personnel in the positions, and others provided
data that included all pay steps. For comparison purposes, the top step pay was used in comparing to those
departments that reported only one pay. The following figure summarizes the salary comparisons between
the annual average salaries between the career departments for the basic full-time uniformed positions:

Regional Fire & Emergency Services Study City of Tumwater Fire Department
34
Figure 44: Uniformed Staff Average Salary Comparisons, 20181
Operations Positions Lowest Pay Highest Pay % Difference
Fire Chief $110,580 $170,832 35%
Assistant Chief $101,142 $142,662 29%
Deputy Chief $142,641 $144,666 1.4%
Battalion Chief (Operations) $93,600 $120,319 22%
Fire Captain/EMT $89,288 $109,056 18%
Fire Lieutenant/EMT $75,563 $107,158 29%
Firefighter/EMT $61,619 $93,999 34%
Firefighter/Paramedic $96,744 $103,399 6% 1 EOFD and LFD3 ratified new CBAs after compilation of this report, which will change compensation rates.
None of the operations position salaries listed include regularly scheduled FLSA overtime pay. The pay
disparity is greatest at the Fire Chief position (35%). With the exception of the Firefighter/Paramedic pay, the
pay disparity in the remaining positions is significant.
With the exception of TFD and EOFD, the departments have various levels of longevity pay included in their
bargaining unit agreements.
Next, we analyzed the various benefits provided by each of the career departments, which are summarized
in the following figure:
Figure 45: Employee Benefits Provided by Career Departments
Benefits Provided TFD OFD LFD3 EOFD WTRFA MBLFD
Uniform Allowance Uniforms provided
$500 $450 Uniforms provided
$250 No
Educational Incentives Yes Yes Yes Yes No No
Social Security No No No Yes No Yes
Workers Compensation Yes Yes Yes Yes Yes Yes
Pension Yes Yes Yes Yes Yes Yes
Deferred Compensation Yes Yes Yes Yes Yes Yes, no match
Medical Yes Yes Yes Yes Yes Yes
Dental Yes Yes Yes Yes Yes Yes
Short-term Disability Yes Yes, self
pay Yes Yes Yes Yes
Vision Yes Yes Yes Yes Yes Yes
Life Insurance Yes Yes Yes Yes Yes Yes

Regional Fire & Emergency Services Study City of Tumwater Fire Department
35
Analysis of the benefits packages among the six departments revealed significant similarities, with all
providing comprehensive medical, dental, vision, and life insurance packages. Additional life insurance is
available to employees in all departments, and is paid for by the employees. There is significant variation in
the uniform allowance pay. Educational incentive pay is included for all but WTRFA and MBLFD. All full-time
firefighters are enrolled in the Washington State Law Enforcement and Firefighters (LEOFF) Plan 2 Retirement
System. EOFD part-time firefighters are enrolled in the Washington State Public Employees Retirement
System (PERS).
Salary & Benefits Discussion
The pay disparity is greatest in the Fire Chief and Battalion Chief positions, and the least disparity is in the
Firefighter/EMT position. All of the other positions have pay differences in the 13–15 percent range. While
the difference in the Fire Chief pay is significant, given the relatively small number of positions, and potential
attrition, it seems reasonable to expect the financial impact and reconfiguration of these positions would be
very feasible in an administrative consolidation, compared to the much larger impact of reconciling the
different pays in the operations staff positions.
In the planning and negotiation process resulting from integration of two or more agencies, those issues
effecting wages, hours and working conditions are required to be negotiated with the bargaining unit(s).
Certain other changes may require impact bargaining. The Washington Public Employees Relations
Commission (PERC) oversees collective bargaining between public agencies and employees, and assists in
the resolution of contract disputes between the parties, including administering the Binding Interest
Arbitration (BIA) process. Salary and benefits decisions in BIA cases involving fire departments and districts
in Washington have typically been made considering the salary and benefits provided by other comparable
fire departments or districts with similar assessed values and populations. If two or more departments
functionally consolidate, merge, or otherwise integrate, it is likely that these comparable fire departments
or fire districts will be used to guide the establishment of new salaries, benefits, and certain working
conditions in the new agency.
Operations Work Schedules
The six departments deploy three different shift schedules for full-time employees. The following figure
summarizes the shift schedules, FLSA work periods, and average scheduled hours for full-time and part-time
operations employees:

Regional Fire & Emergency Services Study City of Tumwater Fire Department
36
Figure 46: Operations Staff Work Schedule
Schedule Components TFD OFD LFD3 EOFD WTRFA MBLFD
Shift Rotation 24-on, 48-off
24-on, 48-off
24-on, 48-off, 24-on, 96-off
24-on, 24-off, 24-on, 24-off, 24-on, 96-off
24-on, 48- off
24-on, 48-off
Average Workweek Hours 49.8 49.8 46.7 531 49.8 48
FLSA Work Period 27 days 27 days 24 days 27 days 27 days 28 days
Total Annual Hours 2590 2596 2526 27462 2596 2502
Shift Start Time 0730 0730 0730 0800 0730 0700
Kelly/Debit Days in work cycle? Kelly Kelly Debit Kelly Kelly Kelly 1 EOFD modified its workweek in latest CBA to phase in a 49.8 workweek over three-year period. 2 EOFD phasing in workweek reduction to 2596 over three years in latest CBA.
In addition, EOFD employs part-time firefighters, who are scheduled to one of three shifts and work
approximately 33 hours per week. These firefighters work six 24-hour shifts and one 12-hour shift per month.
Resident and volunteer firefighters in the departments that use volunteers are assigned to a shift for
scheduling and continuity purposes.
Work Schedule & Staffing Discussion
The average hours worked between the six departments is 49.5 hours per week, and with the exception of
EOFD, the annual hours worked are comparable.10
The 24-hour shift remains the predominant schedule for fire departments, including the six departments
studied. However, some departments have transitioned to a 48-hour shift. This is an especially attractive shift
schedule if employees must commute from long distances due to high housing costs, low housing inventory,
or other demographic factors. However, the 48-hour schedule has been questioned due to concerns about
sleep deprivation and safety impacts during the latter portion of the 48-hour shift.
The federal government aggressively regulates and monitors commercial transportation workers, including
commercial pilots, railroad workers, long-haul truck drivers, and ship workers due to fatigue concerns. With
regard to long-haul truck and passenger carrying drivers, there are very restrictive rules in place to address
potential driver fatigue. ESCI highlights these specific requirements because Fire/EMS employees routinely
drive emergency vehicles in all types of weather conditions—often for extended periods (long-distance
interfacility transfers, for example). The following figure is a summary of the rules for truck drivers. This is
presented to provide context on the level of the federal government’s concern on driver fatigue.11
10 EOFD’s new collective bargaining agreement brings EOFD into a comparable workweek as the other five agencies.
11 349 Code of Federal Register 395.1-5.

Regional Fire & Emergency Services Study City of Tumwater Fire Department
37
Figure 47: Commercial Driver Rules for Work Hours
Property Carrying Drivers Passenger Carrying Drivers
11-Hour Driving Limit
May drive a maximum of 11 hours after
10 consecutive hours off-duty.
10-Hour Driving Limit
May drive a maximum of 10 hours after
8 consecutive hours off-duty.
14-Hour Limit
May not drive beyond the 14th consecutive
hour after coming on duty, following
10 consecutive hours off-duty. Off-duty time
does not extend the 14-hour period.
15-Hour Limit
May not drive after having been on duty for
15 hours, following 8 consecutive hours off-
duty. Off-duty time is not included in the
15-hour period.
Rest Breaks
May drive only if 8 hours or less have passed
since end of the driver’s last off-duty or
sleeper berth period of at least 30 minutes.
60/70-Hour Limit
May not drive after 60/70 hours on duty in
7/8 consecutive days.
As noted in the preceding figure, the focus is not only on the length of the work periods, but also the length
of the off-duty/rest periods. This is an important distinction relative to EOFD’s use of hourly employees—many
of whom have other full-time jobs, including working for private ambulance companies. However, there is no
policy requiring a minimum number of off-duty/rest hours between work shifts. This produces potential
liability and safety issues, and may also increase the risk of injury on the fireground or patient-care errors.
In ESCI’s experience, a functional and operationally efficient consolidation will require a homogenized shift
schedule. While each department has slightly different work schedules and annual hours for full-time
operations personnel, they are likely close enough that it should not present a significant obstacle in
operational consolidation efforts. However, as with any proposed change to working conditions, especially
resulting from a planned consolidation, it likely would require focused collaboration between the various
bargaining units and with department leadership to identify an acceptable and cost-effective enterprise-wide
solution.

Regional Fire & Emergency Services Study City of Tumwater Fire Department
38
Service Delivery and Response Performance In this section of the Regional Feasibility Study, a review of current service delivery and performance within
the study area was conducted. Observations were made concerning service delivery for the study area as a
whole and for the individual departments where appropriate, depending on the available data. In the Service
Delivery and Response Performance section, ESCI reviewed current and historical service demand by incident
type and temporal variation for the study area and the participating jurisdictions. GIS software is used to
provide a geographic display of demand within the overall study area.
Data Sources
The data used in this section is derived from both CAD data provided by the Thurston County
Communications Center (TCOMM) and National Fire Incident Reporting System (NFIRS) totals submitted by
the departments.
The CAD data that was submitted included a total of 188,409 records from the period 2015 through 2017 and
from all study departments the TCOMM dispatched. Specifically included were 2015 records totaling 59,558,
2016 included 62,412, and 66,439 from 2017. These total records included multiple records for each incident
when more than one unit responded.
The first step in the analysis was to just pull the records for departments in the study area. At the completion
of this step, 181,212 records remained. Next, when multiple records existed, these had to have the best
performance calculated and duplicates removed.
The NFIRS data was provided by each department as part of ESCI’s data request and was reported on the
table provided. Each department provided total incidents for the 2017 calendar year.
Data is selected depending on which source is best suited for the analysis.
NFPA 1710 and 1720 Standards
In the study area, there are two relevant national standards: NFPA 1710, which is applicable to organizations
that are, “… substantially all career fire departments,” and NFPA 1720, which applies to, “… volunteer and
combination fire departments.”12 Both of these are consensus standards, and are not mandated or codified.
ESCI believes that NFPA 1710 currently applies to Olympia Fire Department, Lacey Fire District 3, and
Tumwater Fire Department, while NFPA 1720 is applicable to East Olympia Fire District, West Thurston Fire
Authority, and McLane Black Lake Fire District.
12 NFPA 1710, Standard for the Organization and Deployment of Fire Suppression Operations, Emergency Medical Operations & Special Operations to the Public by Career Fire Departments; NFPA 1720, Standard for the Organization and Deployment of Fire Suppression Operations, Emergency Medical Operations & Special Operations to the Public by Volunteer Fire Departments.

Regional Fire & Emergency Services Study City of Tumwater Fire Department
39
Wherever possible in this section, ESCI will distinguish which standard applies to those particular agencies.
However, to conduct a direct comparison between agencies, all response performance elements codified in
NFPA 1710 (the most rigorous of the two standards) will be listed for all agencies. Those agencies which NFPA
1720 currently applies to will also be discussed in the context of 1720 throughout this section. It is important
to note that integration of fire departments and fire district that are defined by the application of 1710 and
1720 introduces a level of complexity that must be seriously weighed. It is not impossible but does require
the agencies to consider how to integrate given the significantly different performance standards each
agency independently applies to.
The specific and pertinent response performance elements in NFPA 1720 and 1710 are provided in this report
in Appendix D and E respectively.
Service Demand
The next figure shows historical service demand for the departments in the study area. These results are
based on CAD data inclusive of the years 2015 through 2017.
Figure 48: Study Area Historical Service Demand CAD, 2015–2017
Demand for fire department services varies throughout the study area. LFD3 experienced the greatest
demand while EOFD experienced the least demand during the 36-month study period. Except for the EOFD
in 2016—when they had a small decrease in demand—each department’s demand increased each year.
WTRFA LFD3 EOFD MBLFD OFD TFD
2015 2,607 11,116 830 1,308 10,170 3,541
2016 2,654 11,305 791 1,310 10,632 3,927
2017 2,900 12,249 939 1,417 11,635 4,259
-
2,000
4,000
6,000
8,000
10,000
12,000
14,000

Regional Fire & Emergency Services Study City of Tumwater Fire Department
40
The next figure displays the change in service demand over the last three years, summarized by agency.
Figure 49: Percent Change in Service Demand CAD, 2015–2017
The previous figure demonstrates that all the departments in the study area had an increase in service
demand from 2015 to 2017. Overall, the service demand increased by 13 percent within the study area. TFD
experienced the greatest change—a 20 percent increase; while MBLFD experienced the smallest percentage
increase at 8 percent.
WTRFA LFD3 EOFD MBLFD OFD TFD
2015 2,607 11,116 830 1,308 10,170 3,541
2016 2,654 11,305 791 1,310 10,632 3,927
2017 2,900 12,249 939 1,417 11,635 4,259
Percentage Increase 11% 10% 13% 8% 14% 20%
0%
5%
10%
15%
20%
25%
-
2,000
4,000
6,000
8,000
10,000
12,000
14,000

Regional Fire & Emergency Services Study City of Tumwater Fire Department
41
Incident Type and Frequency
The next figure illustrates the service demand by type of incident based on the NFIRS data.
Figure 50: Agency Service Demand by Incident Type NFIRS, 2017
Although there is a variation in numbers of incidents throughout the study area, EMS incidents constitute
the greatest workload for all the participating departments. The EMS/Rescue category includes all calls for
medical service including motor vehicle accidents (MVAs) and rescue incidents. The Good Intent category
includes cancelled calls and incidents in which an emergency was not found. The Other category not only
includes those incidents coded as other but also includes incidents such as hazardous conditions, explosions,
and weather-related incidents. The category of service calls are public service calls such as lockouts or
assisting the police. Fire Alarms include manual and automatic fire alarms and the final category—Fires refer
to all types of fires (structure, wildland, vehicle, etc.).
The percentages displayed in the next figure are comparable to similar fire jurisdictions that provide EMS
services.
OFD LFD3 TFD WTRFA MBLFD EOFD
EMS/Rescue 8,262 10,645 3,310 2,247 1,157 875
Good intent call 687 950 325 327 477 219
Service call 189 1,233 279 134 54 59
False call 554 567 227 127 126 48
Fires 272 258 100 137 83 85
Other 1671 207 84 59 70 46
Total 11,635 13,860 4,325 3,031 1,967 1,332
0
2,000
4,000
6,000
8,000
10,000
12,000
14,000
16,000
0
2,000
4,000
6,000
8,000
10,000
12,000

Regional Fire & Emergency Services Study City of Tumwater Fire Department
42
Figure 51: Agency Service Demand by Incident Type Percentages NFIRS, 2017
The highest service demand of EMS incidents ranges from a low of 59 percent at the MBLFD, to a high of
77 percent in Lacey and Tumwater. For departments that provide EMS, it is generally expected that EMS
incidents result in 70 to 80 percent of a department’s service demand. While four of the study area
departments are within this range, two—MBLFD and EOFD—fall below the percentage that might be
expected.
The next figure displays service demand by type of incident for the entire study area.
OFD LFD3 TFD WTRFA MBLFD EOFD
EMS/Rescue 71% 77% 77% 74% 59% 66%
Good intent call 6% 7% 8% 11% 24% 16%
Service call 2% 9% 6% 4% 3% 4%
False call 5% 4% 5% 4% 6% 4%
Fires 2% 2% 2% 5% 4% 6%
Other 14% 1% 2% 2% 4% 3%
0%
10%
20%
30%
40%
50%
60%
70%
80%
90%
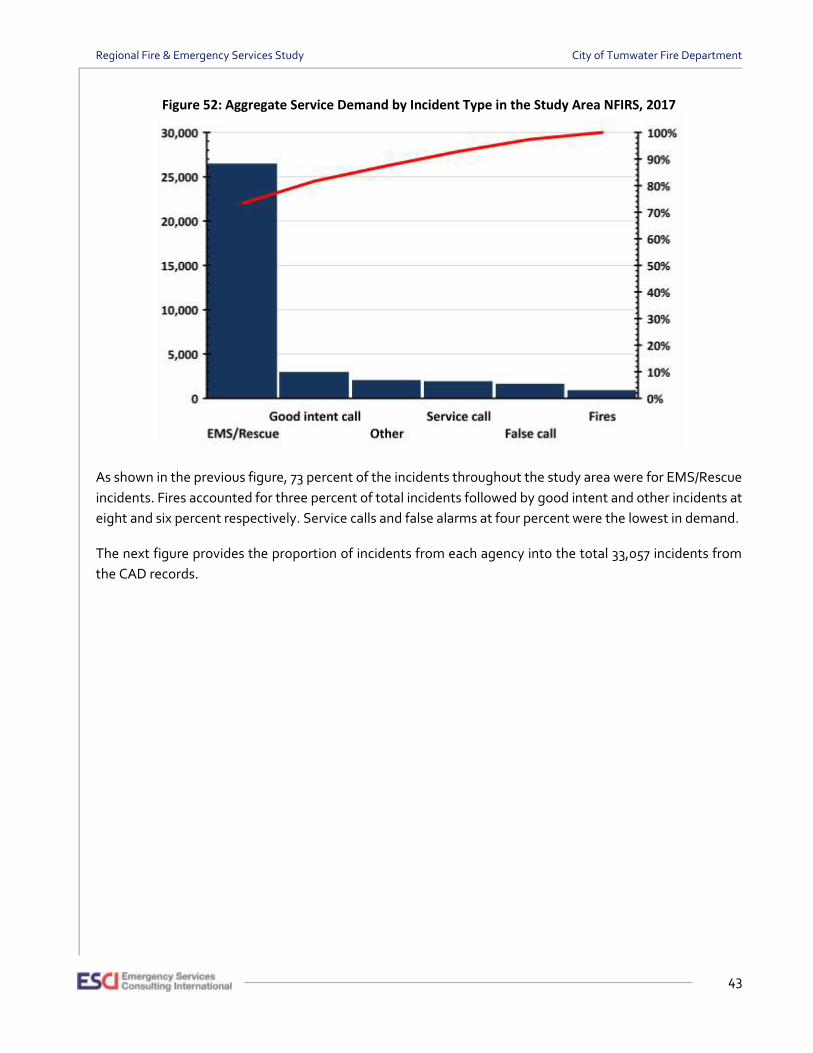
Regional Fire & Emergency Services Study City of Tumwater Fire Department
43
Figure 52: Aggregate Service Demand by Incident Type in the Study Area NFIRS, 2017
As shown in the previous figure, 73 percent of the incidents throughout the study area were for EMS/Rescue
incidents. Fires accounted for three percent of total incidents followed by good intent and other incidents at
eight and six percent respectively. Service calls and false alarms at four percent were the lowest in demand.
The next figure provides the proportion of incidents from each agency into the total 33,057 incidents from
the CAD records.

Regional Fire & Emergency Services Study City of Tumwater Fire Department
44
Figure 53: Proportion of Total Service Demand in the Study Area from Each Department CAD, 2017
According to CAD data, the LFD3 and OFD account for over 70 percent of the incidents in the study area.
Adding TFD to LFD3 and OFD’s total shows that nearly 85 percent of the incidents are handled by three
departments. As will be shown in this section these departments cover the most populated sections of the
study area.
OFD, 11,293 , 34%
LFD3, 12,249 , 37%
TFD, 4,259 , 13%
WTRFA, 2,900 , 9%
MBLFD, 1,417 , 4% EOFD, 939 , 3%

Regional Fire & Emergency Services Study City of Tumwater Fire Department
45
Temporal Variation
A temporal analysis of incidents reveals when the greatest response demand occurs. The following figures
illustrate how activity and demand changed for the study area and individual fire departments based on
various time measurements. The data used is 2015 through 2017 CAD data for each participating agency.
Figure 54: Study Area Service Demand by Month CAD, 2015–2017
Service demand across the study area is fairly consistent throughout the year. One exception is the EOFD
during the month of May in which the EOFD has nearly 1.25 percent higher demand than the average for
May. On average the busiest month in the study area is August at almost 9.5 percent. The slowest month on
average is February—the shortest month—with 7.3 percent of the incidents occurring. If February as a short
month is not considered, then March and April are the slowest months with 7.8 percent of the demand.
Overall, average service demand varies. The range between the average busiest month and slowest month
is 2 percent. The next figure is a summary of the demand by month for each department.
Figure 55: Study Area Service Demand by Month Summary CAD, 2015–2017
Fire Department/District Busiest Month Slowest Month Slowest Month1
Tumwater Fire Department August (9.0%) February (7.4%) March (7.7%)
Olympia Fire Department December (8.9%) February (7.6%) April (7.9%)
Lacey Fire District August (9.03%) February (7.5%) November (8.0%)
East Olympia District May (10.0%) March (6.7%) March (6.7%)
West Thurston Regional Fire Authority August (9.7%) February (7.3%) September (7.8%)
McLane/Black Lake District August (9.9%) February (7.4%) April (7.7%) 1 Excluding February
The next figure analyzes service demand by day of the week.
0%
2%
4%
6%
8%
10%
12%
WTRFA LFD3 EOFD MBLFD OFD TFD Average

Regional Fire & Emergency Services Study City of Tumwater Fire Department
46
Figure 56: Study Area Service Demand by Day of the Week CAD, 2015–2017
Service demand by day of the week does not vary much across the study area. The MBLFD demand on
Sundays is above average. The average busiest day in the study area is Fridays with nearly 15 percent of the
weekly demand. Overall, the average service demand throughout the week varies within a range of
approximately 1 percent between the lowest and the highest average demand. The next figure is a summary
of daily demand for each department.
Figure 57: Study Area Service Demand by Day of Week Summary CAD, 2015–2017
Fire Department/District Busiest Day Slowest Day
Tumwater Fire Department Monday (15.0%) Sunday (13.1%)
Olympia Fire Department Friday (15%) Sunday (13.6%)
Lacey Fire District Friday (14.8%) Tuesday (13.7%)
East Olympia District Friday (14.9%) Sunday (13.6%)
West Thurston Regional Fire Authority Saturday (15.0%) Monday (13.6%)
McLane/Black Lake District Sunday (15.6%) Monday (13.3%)
The final temporal analysis of service demand examines demand summarized by hour of the day and is
illustrated in the next figure.
0%
2%
4%
6%
8%
10%
12%
14%
16%
18%
WTRFA LFD3 EOFD MBLFD OFD TFD Average
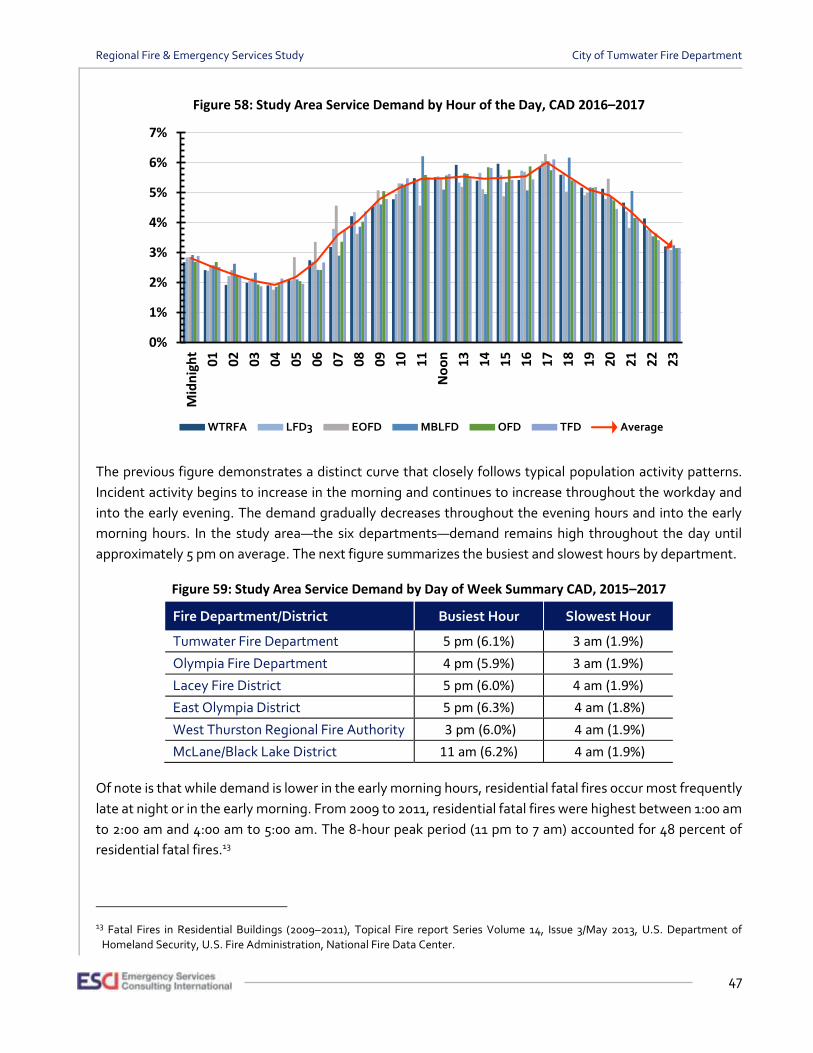
Regional Fire & Emergency Services Study City of Tumwater Fire Department
47
Figure 58: Study Area Service Demand by Hour of the Day, CAD 2016–2017
The previous figure demonstrates a distinct curve that closely follows typical population activity patterns.
Incident activity begins to increase in the morning and continues to increase throughout the workday and
into the early evening. The demand gradually decreases throughout the evening hours and into the early
morning hours. In the study area—the six departments—demand remains high throughout the day until
approximately 5 pm on average. The next figure summarizes the busiest and slowest hours by department.
Figure 59: Study Area Service Demand by Day of Week Summary CAD, 2015–2017
Fire Department/District Busiest Hour Slowest Hour
Tumwater Fire Department 5 pm (6.1%) 3 am (1.9%)
Olympia Fire Department 4 pm (5.9%) 3 am (1.9%)
Lacey Fire District 5 pm (6.0%) 4 am (1.9%)
East Olympia District 5 pm (6.3%) 4 am (1.8%)
West Thurston Regional Fire Authority 3 pm (6.0%) 4 am (1.9%)
McLane/Black Lake District 11 am (6.2%) 4 am (1.9%)
Of note is that while demand is lower in the early morning hours, residential fatal fires occur most frequently
late at night or in the early morning. From 2009 to 2011, residential fatal fires were highest between 1:00 am
to 2:00 am and 4:00 am to 5:00 am. The 8-hour peak period (11 pm to 7 am) accounted for 48 percent of
residential fatal fires.13
13 Fatal Fires in Residential Buildings (2009–2011), Topical Fire report Series Volume 14, Issue 3/May 2013, U.S. Department of
Homeland Security, U.S. Fire Administration, National Fire Data Center.
0%
1%
2%
3%
4%
5%
6%
7%
Mid
nig
ht
01 02 03 04 05 06 07 08 09 10 11
No
on 13 14 15 16 17 18 19 20 21 22 23
WTRFA LFD3 EOFD MBLFD OFD TFD Average

Regional Fire & Emergency Services Study City of Tumwater Fire Department
48
Geographic Distribution
In addition to the temporal analysis of service demand, it is useful to examine the geographic distribution of
service demand. Utilizing the CAD data, ESCI calculated the mathematical density of incidents from 2015
through 2017 throughout the study area. The next figure shows the result of this calculation.
Figure 60: Incident Density CAD, 2015–2017
In this analysis, the relative proximity of incident locations is compared using GIS software and a relative scale
of incident rate per square mile calculated. Also referred to as a Hot Spot analysis, this figure displays where
the highest density of incidents occurred relative to each other and provides areas of frequent activity.
Service demand is spread throughout the study area. As expected, the high incident density areas tend to be
in the areas of higher population.

Regional Fire & Emergency Services Study City of Tumwater Fire Department
49
Figure 61: Census Estimate Population Density, 2014
The previous figure displays the population density from the 2014 census estimation showing people per
square mile. The highest population density is in the northeastern end of the study area. This is in the area of
the Olympia Fire Department, Tumwater Fire Department, and Lacey Fire District 3; although there are very
small pockets in WTRFA, EOFD, and MBLFD that have urban densities. Note that the areas with the highest
population density correspond with the areas of highest incident density displayed in the demand analysis.

Regional Fire & Emergency Services Study City of Tumwater Fire Department
50
Resource Distribution
In the distribution analysis, ESCI presents an overview of the current distribution of fire agency resources in
the study area. The following figure displays the study area and the participating fire jurisdictions.
Figure 62: Regional Fire Service Study Area
The study area encompasses a total of approximately 384 square miles of Thurston County. The next figure
illustrates a summary of resource distribution across the area.

Regional Fire & Emergency Services Study City of Tumwater Fire Department
51
Figure 63: Resource Distribution in the Study Area
Fire Department/District Area in Sq. Mi.
No. of Stations
Tumwater Fire Department 18 2
Olympia Fire Department 20 4
Lacey Fire District 70 5
East Olympia District 30 4
West Thurston Regional Fire Authority 158 5
McLane/Black Lake District 84 5
Total: 384 25
Washington Surveying and Rating Bureau Criteria
The Washington Surveying and Rating Bureau (WSRB) is a national insurance industry organization that
evaluates fire protection for communities across the country. A jurisdiction’s WSRB rating is an important
factor when considering fire station and apparatus distribution as it can affect the cost of fire insurance for
individuals and businesses. The rating is awarded by the WSRB based on a point scale after analysis of the
various components contained in the Public Protection Classification (PPC). An agency receiving a PPC rating
of one is considered to have exemplary fire protection capabilities, the highest score possible. A score of ten
is considered to have insufficient capabilities to receive insurance credit. The following figure reflects the PPC
ratings for each of the participating agencies.
Figure 64: Washington Surveying & Rating Bureau Public Protection Classifications by Agency
Fire Department/District PPC Rating Year Rated
Tumwater Fire Department 4 Rerate in process
Olympia Fire Department 2 2016
Lacey Fire District 3/5 Rerate in process
East Olympia District 5/9 2017
West Thurston Regional Fire Authority 4 2018
McLane/Black Lake District 4 2018
To receive maximum credit for station and apparatus distribution, WSRB recommends that all “built upon”
areas in a community, be within 1.5 road miles of an engine company. Additionally, a structure should be
within five miles of a fire station and have an adequate water supply to receive any fire protection rating for
insurance purposes. In the following figures, ESCI examined fire facility distribution by distance over the
existing road network.

Regional Fire & Emergency Services Study City of Tumwater Fire Department
52
Figure 65: Study Area Station Distribution, 5 Mile Travel Service Area
Depicted in the previous figure is the WSRB five-mile travel requirement to receive a fire protection rating.
Overall most of the populated portions of the study area are within the five-mile requirement. The areas
outside the five-mile travel areas are generally areas that have a population density of less than 500 people
per square mile.

Regional Fire & Emergency Services Study City of Tumwater Fire Department
53
Figure 66: Study Area Station Distribution, 1.5 Mile WSRB Criterion Engine Company
The current fire station locations within the study area meet the WSRB requirements of 1.5 miles in the built-
up and higher population density areas. The rural areas are outside the 1.5-mile travel distance.
Like the 1.5-mile engine company criteria, WSRB recommends that truck companies (aerial apparatus) be
placed at 2.5-mile intervals in areas with at least five buildings over three stories in height.
The fire departments in the study area deploy ladder companies from two locations—Lacey District 3
Headquarters and Olympia Station 1. The next figure demonstrates the 2.5-mile service area for the aerial
apparatus.

Regional Fire & Emergency Services Study City of Tumwater Fire Department
54
Figure 67: Study Area Station Distribution, 2.5 Mile WSRB Criterion Ladder Company
The aerial apparatus—as deployed—provides coverage in the urban areas. Departments within the study
area should evaluate the location of buildings over three stories in relationship to the 2.5-mile travel distance
The ability of a fire department to arrive on scene of a fire within a given time or distance, represents only
part of the WSRB classification. Other elements include the ability to assemble personnel, resources, and
water sufficient to extinguish the fire.
The next figure illustrates the areas that are 1,000 feet from a fire hydrant.

Regional Fire & Emergency Services Study City of Tumwater Fire Department
55
Figure 68: WSRB Hydrant Distribution
Those structures outside of the 1,000-foot radius are subject to receive an WSRB Class 10 rating, signifying
that no fire protection capabilities exist, unless the fire department can demonstrate a suitable tender shuttle
operation and transport a sufficient volume of water to a fire for suppression activities within a specified
period. All of the participating agencies needing to rely on tender shuttle operations for inadequate hydrant
distribution have received tender shuttle credit from WSRB.
Again, the urbanized areas are within the required distance for water supply. Departments also operate
tenders for those areas where water supply is a challenge.
In closing, it bears mentioning that the addition of fire stations or changes to type of apparatus deployed can
have negative impacts to the overall WSRB rating if personnel are insufficient to staff those locations based
on WSRB minimum criteria. Prior to implementing new deployment strategies, the WSRB regional
representative should be consulted to assess the potential impacts of changes to the deployment strategy.
While WSRB criteria is focused on fire suppression activities exclusively, NFPA standards establish
benchmarks for all areas of responsibility for a fire department.

Regional Fire & Emergency Services Study City of Tumwater Fire Department
56
Utilizing current GIS data, the figures on the following pages demonstrate potential travel times from the fire
stations in the study area over the existing road network. Illustrated travel time is calculated using the posted
speed limit and adjusted for negotiating one-way streets, turn delays, and intersection elevations. The
following analysis demonstrates the predicted four and eight-minute travel time, which is a standard within
NFPA 1710, specifically applicable to OFD, TFD, and LFD3.
Figure 69: 4- and 8-Minute Travel Time
The geography and nature of the road network presents challenges to the fire jurisdictions within the study
area. However, it is apparent in the figure above that the majority of the study area is within eight minutes
of a fire station, with travel times over eight minutes in areas of low population density.
Resource Concentration
The ability for fire departments to assemble resources from multiple areas to initiate safe and effective fire
suppression and rescue operations is critical to the overall success of the department. The following figure
presents a resource concentration analysis using NFPA 1710 standards for the assembly of an Effective
Response Force (ERF) for the study area. In the figure, fire resources within eight minutes of travel from their
respective stations to the incident are displayed. Again, this is specifically applicable to OFD, TFD, and LFD3.

Regional Fire & Emergency Services Study City of Tumwater Fire Department
57
Figure 70: Assembly of an Effective Response Force; 8-minute Travel
The fire service assesses the relative risk of properties and occurrences based on several factors. Properties
with high fire risk often require greater numbers of personnel and apparatus to effectively mitigate the fire
emergency; properties with lower risk may require fewer people, apparatus, and equipment. Staffing and
deployment decisions should be made with consideration of the level of risk involved. The Commission for
Public Safety Excellence (CPSE) uses the following levels of risk categories:
• Low Risk: Areas and properties used for agricultural purposes, open space, low-density residential and other low intensity uses.
• Moderate Risk: Areas and properties used for medium density single family residences, small commercial and office uses, low intensity retail sales and equivalently-sized business activities.
• High or maximum Risk: Higher density businesses and structures, mixed-use areas, high density residential, industrial, warehousing, and large mercantile structures.
The following figure shows one example of critical task resource requirements and recommended number of
personnel for fires, irrespective of volunteer or paid status. This is for illustration purposes only and does not
necessarily reflect the critical tasks or number of personnel recommended for structure fires.

Regional Fire & Emergency Services Study City of Tumwater Fire Department
58
Figure 71: Example of Critical Task Staffing Analysis Based on Risk14
Firefighter Personnel Needed Based on Level of Risk
Structure Maximum
Risk
Structure High Risk
Structure Moderate
Risk
Non- Structure Low Risk
Attack Line 4 4 2 2
Back-up Line 2 2 (2)
Support for Hose Lines/Water Supply 3 2#
Ventilation 4 2 2
Search and Rescue 4 2 2
Forcible Entry/Support 2 2
Standby/Rapid Intervention Team 4 2 2
Driver/Pump Operator 1 1 1 1
2nd Apparatus/Ladder Operator 1
Command 2 1 1 1#
Communications/Safety 1 1 1
Accountability 1
Salvage
Rehabilitation 2
Building Fire Pump Monitor (1)
Attack Line – Floor Above the Fire 2
Evacuation Management Teams 4
Elevator Operations Manager 1
Lobby Operations 1
Transport Equipment to Staging 2
EMS Crews 4
Division/Group Supervisors 4
Total 40–41 28 16–17 3–6
( ) indicates tasks may not be required at all incidents. # indicates task may be completed concurrently with others.
This methodology may be used to determine the number and type of resources required for any incident
type. Four scenarios of commonly encountered emergencies are a non-structural fire, hazardous materials
incident, a traffic collision with trapped victim, and a medical emergency. These critical tasks specifically
relate to NFPA 1710 applicable agencies (OFD, TFD, and LFD3). While NFPA 1720 is silent on these types of
risks, it is an industry best practice to identify critical tasks by risk type.
The next figures illustrate an example for each.
14 Adapted from "Community Risk Assessment and Standards of Cover," 6th edition; Center for Public Safety Excellence.

Regional Fire & Emergency Services Study City of Tumwater Fire Department
59
Figure 72: Sample Non-Structure Fire Critical Tasking
Task Personnel
Command 1
Pump Operator 1
Primary Attack Line 2
Total 4
Figure 73: Sample EMS Incident Critical Tasking
Task Personnel
Command 1
Patient Care 2
Total 3
Figure 74: Sample Motor Vehicle Collision with Entrapment Critical Tasking
Task Personnel
Command 1
Pump Operator 1
Primary Attack Line 2
Extrication 3
Patient Care 2
Total 9
Figure 75: Sample Hazardous Materials Incident Critical Tasking
Task Personnel
Command 1
Pump Operator 1
Primary Attack Line 2
Back-Up Line 2
Support Personnel 7
Total 13
The previous figures are provided as an example for these types of incidents, although ESCI recommends the
departments conduct their own field validation exercises with their crews, including automatic aid resources,
to verify the critical tasking analysis provided. After field validation is complete, the departments may find
that the critical tasking can be adjusted appropriately upward or downward for each incident type. However,
critical tasks are specifically identified for 2,000 square foot single family homes, garden-style apartments,
strip malls, and high rises within NFPA 1710.
The previously mentioned minimum staffing criteria can be used as a planning tool in setting specific service
level objectives for each of the incident types.
In summary, critical tasks are those activities that must be conducted in a timely manner by firefighters at
emergency incidents to control the situation, stop loss, and to perform necessary tasks required for a medical
emergency. The six departments in the study area are responsible for assuring that responding companies
can perform all the described tasks in a prompt, efficient, and safe manner.

Regional Fire & Emergency Services Study City of Tumwater Fire Department
60
Resource Reliability
The workload of emergency response units can be a factor in response time performance. Concurrent
incidents and the amount of time individual units are committed to an incident can affect a jurisdiction’s
ability to muster enough resources to respond to additional emergencies.
In the following figure, ESCI examined 2015 through 2017 incidents for each agency and the overall study
area to find the frequency that the jurisdictions are handling multiple calls. This is important because, the
more calls occurring at one time, the more stretched available resources become leading to extended
response times from more distant responding available apparatus.
Figure 76: Study Area Concurrent Incidents CAD, 2015–2017
District Single
Incident 2 Incidents 3 Incidents 4 Incidents 5 Incidents
6 or More Incidents
TFD 75% 22% 3% < 1% < 1% -
OFD 49% 34% 13% 3% 1% < 1%
LFD3 41% 35% 16% 5% 1% < 1%
EOFD 90% 9% < 1% < 1% < 1% -
WTRFA 72% 23% 4% 1% < 1% -
MBLFD 86% 12% 1% < 1% < 1% -
Overall 11% 21% 23% 19% 12% 13%
In the study area overall, three concurrent incidents occurred 23 percent of the time—the most frequent.
Single incidents occurred 70 or more percent of the time in EOFD, MBLFD, WTRFA, and TFD. Concurrent
incidents were most likely to occur in OFD (51% of the time) and LFD3 (59% if the time). When considering
the study area overall—three or less incidents are occurring concurrently 56 percent of the time. On May 4,
2017, a storm effected the study area causing a high number of concurrent calls—many for storm related
issues. This influenced the percentage of six or more incidents.
Unit hour utilization (UHU) describes the amount of time that a unit is not available for response because it
is already committed to another incident. The larger the number, the greater its utilization and the less
available it is for assignment to subsequent calls for service. UHU rates are expressed as a percentage of the
total hours in a year. The following figures display the amount of time response units were committed to an
incident in 2015 through 2017 according to the CAD records provided. While all units were analyzed, only
those with a UHU of greater than one percent are included in the following figure.

Regional Fire & Emergency Services Study City of Tumwater Fire Department
61
Figure 77: UHU Rates by Department CAD, 2015–2017
Department Unit Total Incidents Total Time Average Time UHU
WTRFA
A11 2,927 2635:27:32 0:54:01 10.03%
A12 2,467 2539:28:06 1:01:46 9.66%
A13 2,513 2497:37:15 0:59:38 9.50%
A16 689 678:03:13 0:59:03 2.58%
B12 189 302:34:48 1:36:03 1.15%
BN16 1,959 1789:12:26 0:54:48 6.81%
CH11 291 460:25:15 1:34:56 1.75%
E11 1,710 1520:02:13 0:53:20 5.78%
E12 1,177 1142:17:56 0:58:14 4.35%
E13 1,053 1028:49:59 0:58:37 3.91%
E16 523 575:52:01 1:06:04 2.19%
SU18 104 316:07:37 3:02:23 1.20%
T11 305 469:14:06 1:32:19 1.79%
T12 326 650:24:35 1:59:42 2.47%
Averages of WTRFA Units: 1:19:21 4.51%
LFD3
A331 989 746:44:45 0:45:18 17.95%
BN31 3,130 2438:38:09 0:46:45 9.28%
E31 11,460 6979:36:57 0:36:33 26.56%
E33 10,157 7278:50:42 0:43:00 27.70%
E34 9,561 6539:26:26 0:41:02 24.88%
E35 3,465 2653:07:14 0:45:56 10.10%
M3 5,987 5262:14:28 0:52:44 20.02%
M6 4,704 4295:27:20 0:54:47 16.34%
TK31 6,055 4847:53:52 0:48:02 18.45%
Averages of LFD3 Units: 0:46:01 19.03%
EOFD
A61 1,120 1091:26:50 0:58:28 4.15%
A64 1,362 1194:02:04 0:52:36 4.54%
E61 1,396 1268:25:43 0:54:31 4.83%
E64 1,977 1765:03:34 0:53:34 6.72%
ISU6 76 366:21:38 4:49:14 1.39%
T61 186 325:51:38 1:45:07 1.24%
T64 242 489:53:15 2:01:28 1.86%
Averages of EOFD Units: 1:45:00 3.53%

Regional Fire & Emergency Services Study City of Tumwater Fire Department
62
Department Unit Total Incidents Total Time Average Time UHU
MBLFD
A91 2,620 2073:25:18 0:47:29 7.89%
A93 418 369:07:27 0:52:59 1.40%
B91 105 261:35:38 2:29:29 1.00%
CH91 112 277:00:03 2:28:24 1.05%
E91 3,898 2955:17:51 0:45:29 11.25%
E95 1,947 1628:33:02 0:50:11 6.20%
T91 291 567:24:00 1:56:59 2.16%
T95 206 467:16:51 2:16:06 1.78%
WTB 416 675:41:41 1:37:27 2.57%
Averages of MBLFD Units: 1:33:50 3.92%
OFD
AO1 1,081 578:21:09 0:32:06 2.20%
BNO1 3,811 2122:50:42 0:33:25 8.08%
EO1 9,773 5291:54:31 0:32:29 20.14%
EO2 10,606 6135:39:32 0:34:43 23.35%
EO3 5,277 3372:53:26 0:38:21 12.83%
EO4 7,903 4697:26:09 0:35:40 17.87%
M10 6,084 4621:39:11 0:45:35 17.59%
M4 6,295 4945:54:51 0:47:08 18.82%
TKO1 4,701 3066:11:41 0:39:08 11.67%
Averages of OFD Units: 0:37:37 14.73%
TFD
BNT1 2,802 1521:44:39 0:32:35 5.79%
ET1 8,762 5257:37:59 0:36:00 20.0%
ET13 467 328:18:12 0:42:11 1.25%
ET2 3,779 2430:09:19 0:38:35 9.25%
M14 1,741 2048:26:57 1:10:36 7.79%
M5 4,306 4066:02:45 0:56:39 15.47%
PGRT2 597 366:50:23 0:36:52 1.40%
Averages of TFD Units: 0:44:47 8.71%
Averages of all Units Combined: 1:08:18 8.87%
1 A33-Peaktime Unit operating 40 hours per week in 2017–2018
The UHU varies among the departments and the units in each department. The lowest average is found in
the EOFD—3.53 percent—while the highest average is in the OFD at 14.73 percent. Overall for the entire study
area the average UHU is 8.36 percent.

Regional Fire & Emergency Services Study City of Tumwater Fire Department
63
Further, ESCI has found that fire-based EMS transport services typically try to keep UHU for their units at or
below 30 percent. UHU rates higher than 30 percent tend to cause system failure in other areas, such as
response time performance and fire effective response force (ERF) delivery degradation. When UHUs
approach and exceed 30 percent, that implies that units are not available at least 70 percent of the time in
their first due areas.
In May 2016, Henrico County (VA) Division of Fire published an article after they studied their department’s
EMS workload.15 The commitment factors discussed were calculated as ESCI has calculated UHU for the
study agencies.
As a result of the study, they developed a general commitment factor scale for their department. The next
figure is a summary of those findings as they relate to commitment factors.
Figure 78: Commitment Factors as Developed by Henrico County (VA) Division, 2016
Factor Indication Description
0.16–0.24 Ideal
Commitment Range
Personnel can maintain training requirements and physical fitness and can consistently achieve response time benchmarks. Units are available to the community more than 75 percent of the day.
0.25 System Stress
Community availability and unit sustainability are not questioned. First-due units are responding to their assigned community 75 percent of the time, and response benchmarks are rarely missed.
0.26–0.29 Evaluation
Range
The community served will experience delayed incident responses. Just under 30 percent of the day, first-due ambulances are unavailable; thus, neighboring responders will likely exceed goals.
0.30 “Line in the
Sand”
Not Sustainable: Commitment Threshold— community has less than a 70 percent chance of timely emergency service and immediate relief is vital. Personnel assigned to units at or exceeding 0.3 may show signs of fatigue and burnout and may be at increased risk of errors. Required training and physical fitness sessions are not consistently completed.
Units in the study area departments that are at or approaching 25 percent utilization should be monitored
and evaluated for consequences of the workload and the potential need for additional resources. These
include LFD3 E31 and 33 (currently exceed 25%), while LFD3 E34 and OFD EO2 are close to that threshold.
The next figure examines the frequency of multiple unit utilization for incidents occurring in 2015 through
2017. Only included are units that had an on-scene timestamp.
15 How Busy Is Busy?; Retrieved from https://www.fireengineering.com/articles/print/volume-169/issue-5/departments/fireems/how-
busy-is-busy.html

Regional Fire & Emergency Services Study City of Tumwater Fire Department
64
Figure 79: Percentage of Incidents by Number of Units Utilized CAD, 2015–2017
Number of Units
WTRFA LFD3 EOFD MBLFD OFD TFD Overall
1 48.4% 60.3% 23.3% 41.0% 62.1% 61.0% 57.4%
2 22.0% 25.9% 43.5% 32.3% 26.4% 27.7% 26.8%
3 13.1% 7.4% 20.0% 16.2% 6.6% 6.7% 8.6%
4 7.4% 2.8% 7.2% 6.3% 2.2% 2.2% 3.3%
5 3.1% 1.2% 3.0% 2.1% 0.8% 0.8% 1.3%
6 or more 5.9% 2.3% 3.0% 2.2% 2.0% 1.7% 2.5%
Based on the data provided—over the entire study area—over ninety percent of the incidents were handled
with three or less units. Across the departments, the need for multiple units was varied. Over 60 percent of
the time incidents in the LFD3, OFD, and TFD area were handled by one unit. While incidents in WTRFA,
EOFD, and MBLFD used one unit under 50 percent of the time.
Finally, response performance for order of arrival for the first five units arriving to structure fires was analyzed
for incidents occurring in 2015 through 2017. For this analysis, only residential and commercial structure fires
as listed in the CAD data and only using Engines, Trucks, Medic and Aid units; command officers were not
included. To be measured, the unit had to have an on-scene timestamp in CAD. Response time, a
combination of turnout time and travel time, was used as the measurement. The analysis was performed on
all calls within the study area regardless of jurisdiction or the agency responding. This is an NFPA 1710
element. While NFPA 1720 has an arrival time element for structure fires, the criteria is different, and will be
discussed separately later in this section.
Figure 80: Response Performance at 90th Percentile for Structure Fires by Order on Scene CAD, 2015–2017
The performance illustrated in this figure was calculated at the 90th percentile as recommended in NFPA 1710.
In this case, the first unit arrived in just under 10 minutes. Followed by units at 11:06, 13.52, 15:40, and 15:54.
The overall performance for structural fires in the study area was 12 minutes, 26 seconds.
1st Unit 2nd Unit 3rd Unit 4th Unit 5th Unit All
90th Percentile 09:48 11:06 13:52 15:40 15:54 12:26
0:00:00
0:02:00
0:04:00
0:06:00
0:08:00
0:10:00
0:12:00
0:14:00
0:16:00
0:18:00

Regional Fire & Emergency Services Study City of Tumwater Fire Department
65
Performance Summary
In the performance summary, ESCI examined emergency incident response time performance for the study
area and for the individual departments. The data for this analysis is the 2015 through 2017 CAD data
provided by TCOMM. Mutual aid incidents outside the study area, data outliers, and invalid data were
removed from the data set whenever possible. Response performance is measured from when fire apparatus
are dispatched to when the first fire department unit arrives on scene.
NFPA 1710 Criteria
In this section of the analysis, a four- and eight-minute travel time will be applied to each fire station. A four-
minute standard (NFPA 1710 – 4.1.2.1(3), 4.1.2.4, 4.1.2.1(6)) was used for travel times for arrival of the 1st
Engine Company of 1st responder unit. The eight-minute standard (NFPA 1710 – 4.1.2.1(4), 4.1.2.4, 5.2.4.1,
5.2.4.2, 5.2.4.3, 5.2.4.4, and 4.1.2.1(7)) was used for travel times for arrival of an ALS unit supporting a fire-
based BLS unit, and the travel times for deployment of an initial full alarm for a residential fire, an open-air
strip mall, a garden-style apartment building, and a high-rise building fire. Use of NFPA 1710 helps determine
the service delivery potential should all agencies apply themselves to NFPA 1710 as a result of integration.
Agencies currently applying themselves to NFPA 1720 will also be discussed in that context within this section
of the report.
Percentile measurements are an industry best practice and has been incorporated into NFPA 1710 and 1720.
It is a higher standard of performance since it shows that the vast majority of the data set has achieved a
particular level of performance. The 90th percentile means that 10 percent of the values are greater than the
value stated, and all other data is at or below this level. This can be compared to the desired performance
objective to determine the degree of success in achieving the goal. Tracking the individual components of
total response time helps identify discrete deficiencies and areas for improvement.
As this report progresses through the performance analysis, it is important to keep in mind that each
component of response performance is not cumulative. Each is analyzed as an individual component and the
fractile is data point unto itself.
The response time continuum, the time between when the caller dials 911 and when assistance arrives, is
comprised of several components:
• Call Processing Time—The amount of time between when a dispatcher answers the 911 call and resources are dispatched.
• Turnout Time—The amount of time between when units are notified of the incident and when they are responding.
• Travel Time—The amount of time the responding unit spends on the road to the incident.
• Response Time—A combination of turnout time and travel time and the most commonly used measure of fire department response performance.
• Total Response Time—The time from when the 911 call is answered until the dispatched unit arrives on the scene and initiates mitigating action.

Regional Fire & Emergency Services Study City of Tumwater Fire Department
66
Total response time is the amount of time a resident or business waits for resources to arrive at the scene of
an emergency and begins mitigating action once their 911 call is answered. The NFPA standard for call
processing is derived from NFPA 1221: Standard for the Installation, Maintenance, and Use of Emergency
Services Communications Systems (referenced by NFPA 1710), and provides for communication centers to have
alarm time processing of not more than 60 seconds, 90 percent of the time for high acuity incidents
Similarly, NFPA 1710 requires the alarm handling (call processing) time to be 60 seconds or less 90 percent of
the time.
Figure 81: NFPA 1710 Standards for Fire/EMS Responses
Response Interval NFPA Standard
Alarm Processing (NFPA 1221) 60 seconds or less at 90% for High Acuity Calls
Turnout Time 60 seconds or less at 90% for EMS 80 Seconds or less at 90% for Fire and Special Operations
Travel Time 240 seconds for the first arriving unit
Call Processing
As described previously—in the study area—emergency call taking, and dispatch is handled by TCOMM.
Therefore, the fire departments have little control (but some influence) over the performance of the alarm
handling time. The analysis is provided here primarily to allow for a comparison between the current
performance and best practices. As all of the departments use TCOMM, the analysis below includes overall
performance regardless of department. The benchmark reflects NFPA 1710 standards. NFPA 1720 is silent on
alarm processing time.
Figure 82: Study Area Alarm Handling Performance CAD, 2015–2017
00:29
00:34
00:23
01:22
00:59
00:28
01:00
0:00:00 0:01:00 0:02:00
Alarm
Fire
Medical
MVC
Other
Overall
Benchmark
Alarm Fire Medical MVC Other Overall Benchmark
90th Percentile 00:29 00:34 00:23 01:22 00:59 00:28 01:00

Regional Fire & Emergency Services Study City of Tumwater Fire Department
67
As seen in the previous figure, call processing times are less than those recommended in the standards except
for those for motor vehicle crashes (MVCs). ESCI has seen lengthened call processing times as they relate to
MVCs when the dispatch center does both law enforcement and fire rescue as TCOMM does. There are times
when law enforcement is dispatched to an MVC and later into the incident a request for EMS resources is
made. The original incident creation time does not change resulting in an artificially increased call processing
time for MVCs as related to EMS resources.
Additionally, the CAD software does not record the response mode to incidents. Therefore, the performance
described in this section includes both emergency and non-emergency incidents.
RECOMMENDATION:
• If possible, with the existing CAD software—add a field in the CAD to track response mode
emergency versus non-emergency.
It should be noted that many of the incidents included in the category of other are likely incidents that would
have a non-emergency response.
Turnout
Turnout time is the period that begins when emergency personnel are notified to respond and ends when an
apparatus begins to respond. Turnout time is an important piece of total response performance and can be
influenced by factors such as station design, apparatus staffing and the performance of the assigned
personnel. The following figure looks at turnout time performance for each agency in the study area. This
element of response performance is specifically defined in NFPA 1710. Although 1720 also addresses turnout
time, it is only for staffed stations (which is defined by the authority having jurisdiction). However, NFPA 1720
defines turnout time as ten seconds slower for fires and special operations responses than is called for in
NFPA 1710. EMS turnout time is the same for both 1710 and 1720 (60 seconds, 90% of the time).

Regional Fire & Emergency Services Study City of Tumwater Fire Department
68
Figure 83: WTRFA Turnout Time Performance CAD, 2015–2017
Figure 84: EOFD Turnout Time Performance CAD, 2015–2017
Figure 85: TFD Turnout Time Performance CAD, 2015–2017
Figure 86: OFD Turnout Time Performance CAD, 2015–2017
Figure 87: MBLFD Turnout Time Performance CAD, 2015–2017
Figure 88: LFD3 Turnout Time Performance CAD, 2015–2017
03:12
03:11
02:22
02:43
03:22
02:39
01:00 00:20
00:00 01:00 02:00 03:00 04:00
Alarm
Fire
Medical
MVC
Other
Overall
Benchmark
02:56
03:19
02:49
03:00
03:12
02:54
01:00 00:20
00:00 01:00 02:00 03:00 04:00
Alarm
Fire
Medical
MVC
Other
Overall
Benchmark
02:17
02:05
02:09
02:00
02:10
02:09
01:00 00:20
00:00 01:00 02:00 03:00
Alarm
Fire
Medical
MVC
Other
Overall
Benchmark
02:10
01:59
01:58
02:04
02:12
02:00
01:00 00:20
00:00 01:00 02:00 03:00
Alarm
Fire
Medical
MVC
Other
Overall
Benchmark
02:13
02:28
01:55
01:58
02:16
02:03
01:00 00:20
0:00:00 0:01:00 0:02:00 0:03:00
Alarm
Fire
Medical
MVC
Other
Overall
Benchmark
02:10
02:08
02:03
02:11
02:11
02:05
01:00 00:20
00:00 01:00 02:00 03:00
Alarm
Fire
Medical
MVC
Other
Overall
Benchmark

Regional Fire & Emergency Services Study City of Tumwater Fire Department
69
The next figure is the turnout time performance for all departments combined. As illustrated, for each type
of incidents and overall, the performance is over twice the benchmark of 60 seconds required in NFPA 1710.
EOFD and WTRFA likely skew the turnout time performance since they have numerous unstaffed stations
that necessitate slower turnout times. MBLFD performs surprisingly consistent with the NFPA 1710 applied
agencies (OFD, TFD, and LFD3).
Figure 89: Study Area Departments Turnout Time Performance CAD, 2015–2017
Travel Time
Travel time is the time from when an apparatus leaves the station to when the apparatus reaches the scene
of the emergency. The existing road network, traffic congestion, geographic barriers, and the size of the
service area all affect travel time performance. The following figure examines travel time performance for
each agency in the study area. Travel time is a uniquely NFPA 1710 data point.
02:14
02:21
02:04
02:15
02:20
02:07
01:00 00:20
0:00:00 0:01:00 0:02:00 0:03:00
Alarm
Fire
Medical
MVC
Other
Overall
Benchmark

Regional Fire & Emergency Services Study City of Tumwater Fire Department
70
Figure 90: WTRFA Travel Time Performance CAD, 2015–2017
Figure 91: EOFD Travel Time Performance CAD, 2015–2017
Figure 92: TFD Travel Time Performance CAD, 2015–2017
Figure 93: OFD Travel Time Performance CAD, 2015–2017
Figure 94: MBLFD Travel Time Performance CAD, 2015–2017
Figure 95: LFD3 Travel Time Performance CAD, 2015–2017
10:16
11:19
10:59
10:14
12:02
10:57
04:00
00:00 06:30 13:00
Alarm
Fire
Medical
MVC
Other
Overall
Benchmark
11:39
11:28
12:34
09:17
13:53
12:28
04:00
00:00 07:30 15:00
Alarm
Fire
Medical
MVC
Other
Overall
Benchmark
07:22
07:09
07:21
06:53
08:09
07:20
04:00
00:00 04:30 09:00
Alarm
Fire
Medical
MVC
Other
Overall
Benchmark
06:26
06:23
06:23
06:44
08:37
06:31
04:00
00:00 05:00 10:00
Alarm
Fire
Medical
MVC
Other
Overall
Benchmark
08:19
12:49
10:57
08:41
13:05
10:54
04:00
0:00:00 0:07:00 0:14:00
Alarm
Fire
Medical
MVC
Other
Overall
Benchmark
07:43
09:33
08:56
08:25
10:50
08:58
04:00
00:00 06:00 12:00
Alarm
Fire
Medical
MVC
Other
Overall
Benchmark

Regional Fire & Emergency Services Study City of Tumwater Fire Department
71
Figure 96: Study Area Departments Travel Time Performance CAD, 2015–2017
The previous figure illustrates the travel time performance for the study area overall using the NFPA 1710
benchmark. All the departments individually and collectively exceed the NFPA 1710 recommendation of four
minutes.
Response Time
The most commonly used measure of fire department response performance is a combination of turnout
time and travel time. That is, the time from when fire personnel are notified of an emergency to when the
first apparatus arrives on scene. The following figure illustrates emergency response performance for the
departments in the study area from 2015 through 2017. While the benchmark is shown at 5 minutes and
additional 20 seconds is permitted for fire and special operations incidents.
07:25
09:00
08:19
08:03
10:31
08:24
04:00
00:00 01:00 02:00 03:00 04:00 05:00 06:00 07:00 08:00 09:00 10:00 11:00 12:00
Alarm
Fire
Medical
MVC
Other
Overall
Benchmark

Regional Fire & Emergency Services Study City of Tumwater Fire Department
72
Figure 97: WTRFA Response Time Performance CAD, 2015–2017
Figure 98: EOFD Response Time Performance CAD, 2015–2017
Figure 99: TFD Response Time Performance CAD, 2015–2017
Figure 100: OFD Response Time Performance CAD, 2015–2017
Figure 101: MBLFD Response Time Performance CAD, 2015–2017
Figure 102: LFD3 Response Time Performance CAD, 2015–2017
11:45
12:21
12:01
10:57
13:37
12:01
05:00
00:00 07:00 14:00
Alarm
Fire
Medical
MVC
Other
Overall
Benchmark
12:49
12:21
13:23
11:00
15:01
13:26
05:00
00:00 07:30 15:00
Alarm
Fire
Medical
MVC
Other
Overall
Benchmark
08:50
08:27
08:35
08:21
09:15
08:37
05:00
00:00 05:00 10:00
Alarm
Fire
Medical
MVC
Other
Overall
Benchmark
07:49
07:43
07:40
07:51
09:41
07:47
05:00
00:00 05:00 10:00
Alarm
Fire
Medical
MVC
Other
Overall
Benchmark
09:44
13:43
12:08
10:09
14:16
12:10
05:00
0:00:00 0:07:00 0:14:00
Alarm
Fire
Medical
MVC
Other
Overall
Benchmark
09:12
10:53
10:08
09:46
11:51
10:11
05:00
00:00 06:00 12:00
Alarm
Fire
Medical
MVC
Other
Overall
Benchmark

Regional Fire & Emergency Services Study City of Tumwater Fire Department
73
The next figure is the response time performance for all departments.
Figure 103: Study Area Departments Response Time (Turnout + Travel Time) Performance CAD, 2015–2017
The NFPA recommendation of 60 seconds turnout (for EMS incidents) or 80 seconds turnout (for fire and
special operations) plus four minutes response time equals five minutes (EMS) or 5 minutes, 20 seconds (Fire
& Special Operations) for response time. Again, each department exceeds the recommended time by various
amounts.
NFPA 1720 does not define or measure travel time as a separate data point. Rather, it combines turnout time
and travel time based on population density characteristics, which the following figure illustrates.
Figure 104: NFPA 1720 Response Time (Turnout + Travel Time) Standard by Population Density
Population Density Standard
Urban (> 1,000 people/mi2) 15 FFs delivered within 9 min/90%
Suburban (500–1,000 people/mi2) 10 FFs delivered within 10 min/80%
Rural (< 500 people/mi2) 6 FFs within 14 min/80%
Remote (travel distance > 8 miles) 4 FFs within timeframe dependent on travel distance/90%
Special Risk (determined by AHJ) Number of FFs and response time determined by AHJ
08:55
10:26
09:34
09:25
11:41
09:40
05:00 00:20
00:00 01:00 02:00 03:00 04:00 05:00 06:00 07:00 08:00 09:00 10:00 11:00 12:00
Alarm
Fire
Medical
MVC
Other
Overall
Benchmark

Regional Fire & Emergency Services Study City of Tumwater Fire Department
74
Total Response Time
Although not completely consistent with the NFPA definition of total response time—since initiating action
is not timestamped—the next figures show the total response time defined in this report as the time from
when the 911 call is answered until the dispatched unit arrives on the scene. Using the total response time
continuum from NFPA 1710, the recommendation for total response time at the 90th percentile is 6 minutes
for EMS (or 6 minutes, 20 seconds for fires and special operations). Each district’s performance, as well as the
performance overall, exceeds this benchmark.
Figure 105: Study Area Departments Total Response Time Performance by Incident Type CAD, 2015–2017
The next figure illustrates the total response time for all incident types by department. While by varied
amounts, each departments performance is greater than the NFPA 1710 requirement of six minutes.
10:06
12:42
11:07
12:01
14:20
11:23
06:00 00:20
00:00 05:00 10:00 15:00
Alarm
Fire
Medical
MVC
Other
Overall
Benchmark

Regional Fire & Emergency Services Study City of Tumwater Fire Department
75
Figure 106: Study Area Departments Total Response Time Performance by Department CAD, 2015–2017
Monitoring and reporting performance for each of the components of the response continuum allows fire
department leaders to identify and correct deficiencies. ESCI encourages all the study area departments to
develop a report on response performance and utilize response time goals that match the needs of the
constituents and the capabilities of the jurisdictions.
Mutual/Automatic Aid Systems
There are mutual and automatic aid agreements in place between the six departments. The agencies
frequently assist each other, and other Thurston County fire jurisdictions.
Mutual aid is typically employed on an as needed basis where units are called for and specified through an
Incident Commander. Automatic aid differs from mutual aid in that under certain mutually agreed upon
criteria, resources from the assisting agency are automatically dispatched as part of the initial response.
These agreements facilitate the necessary number of personnel and the right number of appropriate
apparatus responding to specific incidents. Automatic aid response resources are defined in the dispatch
runcards for all the participating departments.
The following figure shows the other fire departments in the county which are all potential requesters or
providers of mutual aid.
14:32
15:50
10:03
09:19
13:49
11:41
11:23
06:00 00:20
00:00 05:00 10:00 15:00
WTRFA
EOFD
TFD
OFD
MBLFD
LFD3
Overall
Benchmark

Regional Fire & Emergency Services Study City of Tumwater Fire Department
76
Figure 107: Thurston County Fire Departments
For this analysis, ESCI focused on mutual and automatic aid between the six jurisdictions in the study area.
The following figure illustrates the number of times a department in the study area responded under mutual
or automatic aid to a grid belonging to another department.
Figure 108: Study Area Agency’s Response to Another’s Jurisdiction, 2017
Type of Aid TFD OFD LFD3 EOFD WTRFA MBLFD
Given 39 235 154 205 119 527
Received 77 72 65 19 26 83
Mutual and automatic aid operations are an integral part of emergency operations within the study area. The
study area jurisdictions effectively incorporate mutual or automatic aid between each other and with the
surrounding fire jurisdiction. This increases the concentration of resources available to mitigate incidents
throughout the study area.

Regional Fire & Emergency Services Study City of Tumwater Fire Department
77
The best use of mutual and automatic aid is dependent on the departments working well together. To be
most effective, the following should be considered:
• Fireground operations must be conducted in a similar manner and should be based on common Standard Operating Guidelines.
• Firefighters must know how to work in concert with personnel for another agency, based on common training programs and procedures.
• Dispatch procedures should be in place that clearly define which response types and locations are to receive Automatic Aid response.
• Procedures for the request of and provision of mutual aid should be clearly established in the Mutual Aid Agreement.
• Personnel should be fully trained on mutual and automatic aid practices and remain informed on changes.

Regional Fire & Emergency Services Study City of Tumwater Fire Department
78
Fire Prevention Programs An aggressive risk management program, through proactive fire and life safety services, is a fire
department’s best opportunity to minimize the losses and human trauma associated with fires and other
community risks.
The National Fire Protection Association recommends a multifaceted, coordinated risk
reduction process at the community level to address local risks. This requires engaging all
segments of the community, identifying the highest priority risks, and then developing
and implementing strategies designed to mitigate the risks.16
A fire department needs to review and understand the importance of fire prevention and public education,
appreciating their role in the planning process of a community with diversified zoning including residential,
commercial, and industrial properties. This is particularly important in Thurston County, given its robust
commercial and residential urban growth. The fundamental components of an effective fire prevention
program are listed in the following figure, accompanied by the elements needed to address each component.
Figure 109: Fire Prevention Program Components
Fire Prevention Program Components Elements Needed to Address Program Components
Fire Code Enforcement
Proposed construction and plans review New construction inspections
Existing structure/occupancy inspections Internal protection systems design review
Storage and handling of hazardous materials
Public Fire and Life Safety Education
Public education Specialized education
Juvenile fire setter intervention Prevention information dissemination
Fire Cause Investigation Fire cause and origin determination
Fire death investigation Arson investigation and prosecution
Fire and Life Safety Code Enforcement
The most effective way to combat fires is to prevent them. A strong fire prevention program, based on locally
identified risks and relevant codes and ordinances, reduces loss of property, life, and the often-crippling
impact on a community’s economy. With the exception of TFD, OFD, and LFD3, all fire code inspections and
new construction fire code plan reviews are the responsibility of the Thurston County Fire Marshal’s Office
(TCFMO). The following figure summarizes the new construction and fire protection system plan review
programs, and ancillary programs among the six departments.
16 NFPA Standard 1730: Organizing and Deployment of Fire Prevention Inspection and Code Enforcement, Plan Review, Investigation,
and Public Education Operations, 2019 Edition.

Regional Fire & Emergency Services Study City of Tumwater Fire Department
79
Figure 110: New Construction Plan Review and Inspection
Code Enforcement TFD OFD LFD3 EOFD WTRFA MBLFD
New Construction Inspections & Involvement
FD consulted in proposed new construction?
Yes Yes, City Yes Yes Yes Yes
FD consulted on proposed occupancy changes/tenant improvements?
Yes Yes Yes Yes Yes Yes
Perform fire & life-safety plan reviews?
Performed by City
Building Official
City & OFD performs
City and County
performs
County performs
County performs
County performs
Charges for inspections or reviews?
Yes, City Yes, City Yes, City
and County Yes, County Yes, County Yes, County
Special risk inspections?
Yes, City Yes, City Yes, City &
County staff
Count performs
County performs
County performs
Storage tank inspections?
Yes, City Yes, City Yes, City &
County staff
County performs
County performs
County performs
Key-box entry program in place?
Yes Yes Yes Yes Yes Yes
Hydrant flow records maintained?
Yes, FD&PW
Yes, PW
Yes, by water
purveyor & county
Yes, by water
purveyor & county
Yes, by water
purveyor & county
Yes, FD, water
purveyor & county
The following sections provide detail on the qualifications and resources dedicated to fire and life safety code
enforcement provided by each of the departments and Thurston County.
Thurston County Fire Marshal
The TCFMO is part of the Thurston County Development Services Department, and is responsible for the
inspection and fire code compliance of approximately 17,000 structures in the unincorporated areas of
Thurston County. It uses the Washington State Building Code Chapter 51-54A2014, and the 2015 edition of
the International Fire Code (IFC), with 2017 amendments enacted through the Thurston County Title 14
Building Code. All inspections, fire protection system acceptance testing, and new construction fire code plan
reviews in the unincorporated county area are conducted by the TCFMO.

Regional Fire & Emergency Services Study City of Tumwater Fire Department
80
Tumwater Fire Department
TFD employs one ICC certified Fire Inspector, who performs commercial building fire inspections. The Fire
Inspector has a goal of inspecting all commercial structures within 18 months, with the exception of
Washington State owned buildings, which are inspected annually. The Fire Chief is credentialed as a Fire
Marshal through the Center for Public Safety Excellence and assists the Fire Inspector and the Tumwater
Community Development with regard to access, water supply and built in fire protection evaluation and
location. TFD uses the 2018 edition of the IFC, and OFD uses the 2015 version of the IFC and most recent
NFPA standards. TFD previously had a very close working relationship with the Tumwater Building
Department on new commercial construction plan reviews and fire protection systems. Due to recent
leadership changes in the Building Department, TFD is working on improving their collaboration. New
construction fire code and fire protection system plan reviews are conducted by the Tumwater Community
Development Department.
TFD charges a fee for inspection of commercial occupancies. The minimum fee is $40 per inspection, and
increases from there based on a formula that factors square footage and inspection complexity.
Olympia Fire Department
Fire Inspections and new construction fire code plan reviews are performed by OFD’s Fire Prevention
Division, which consists of five personnel, including an Assistant Chief/Fire Marshal, Fire Captain/Assistant
Fire Marshal, and three Fire Prevention Officers. These positions are all tested promotions and members
typically have a long tenure providing consistency and quality. All are IFC Fire Inspector I certified, and two
are IFC Fire Inspector II certified. The department performs fire code plan reviews, but none of the reviewers
are IFC or ICC certified. The department plans on having certified plan reviewers by the end of 2019. OFD has
a contract with Washington State to inspect all State Capital campus buildings twice a year. All inspections,
fire protection system acceptance testing, and new construction fire code plan reviews in the unincorporated
county area are conducted by the OFD Fire Prevention Division.
OFD charges a fee for inspection of commercial occupancies and plan reviews and acceptance testing for
installation of fire protection systems. The minimum inspection fee is $43.48 per inspection, and increases
from there based on a formula that factors square footage and inspection complexity. Fire code plan review
fees are based on the estimated value of the project. The fee-based inspection program is 19 years old and
may be the link to the low amount of commercial structure fires.
OFD includes public education and fire investigation within the role of the members assigned to Fire
Prevention. This linkage allows the department to connect the data for most common issues found during
inspections and fire cause investigation with education efforts.

Regional Fire & Emergency Services Study City of Tumwater Fire Department
81
Lacey Fire District 3
Fire inspections and new construction fire code plan reviews within the Lacey city limits are performed
primarily by the Fire Code Specialist (FCC), a civilian position supervised by the Building Official/Fire Marshal.
Engine companies in the city perform bi-annual inspections of multi-family residential buildings. The FCC is
ICC Fire Inspector certified, and is pursuing ICC Plans Reviewer certification. Fire code enforcement within
the city limits is assigned to the Lacey Community and Economic Development Department.
LFD3 does not charge a fee for annual fire inspections, but the City of Lacey does charge for plan reviews and
acceptance testing for installation of fire protection systems. Fire sprinkler fee amounts are based on the
value of the system. Fire alarm fees are based on the square footage of the building and the 2017 Washington
State Labor and Industries Electrical Fees Worksheet.
Discussion
During the site visit, ESCI noted the City of Olympia’s residential sprinkler ordinance, which mandates
installation of fire sprinklers in new Group R occupancies, including single family homes. A similar ordinance
has yet to be adopted by Thurston County.
Mandating installation of fire sprinkler systems in new and remodeled residential construction is a
controversial issue in many jurisdictions. The 2009 International Residential Code (IRC) mandates the
installation of fire sprinkler systems in all single and multi-family residential structures and dwellings.
However, state and local jurisdictions regularly amend building codes to meet local needs. Developers,
building industry associations, and lobbyists have strongly lobbied state and local governments against
requiring residential fire sprinklers in new construction—asserting cost-prohibitive installation; ongoing
maintenance costs; and an overall negative cost versus benefit. Conversely, life-safety advocates, fire service
associations, and insurance groups continue to push for formal adoption of residential fire sprinkler
installations. They cite scientific evidence; advances in cost-effective sprinkler system technology; and real-
world experience in which fire-sprinkler activations saved lives and property.
Evidence-based research and experience has proven the effectiveness and speed of fixed fire-sprinkler
systems in containing and/or extinguishing incipient fires in commercial and residential structures. As more
residential systems are installed, the number of fire incidents involving residential sprinkler installations
should bring clarity and consensus as to their cost-effectiveness and safety.
ESCI also noted that LFD3 uses on duty fire suppression personnel to conduct routine fire inspections, while
the other agencies utilize Fire Inspectors in the municipalities, or the TCFMO in unincorporated areas, to
ensure fire code and life safety compliance on an ongoing basis. Utilizing fire suppression personnel who are
adequately trained in basic fire inspection practices can be an effective practice in some instances and doing
so has the benefit of increasing inspection capabilities and frequency. Furthermore, it provides excellent
opportunities for engine crew building familiarization and pre-incident planning, and affords opportunities
to update pre-incident plans when new hazards are identified in the field.

Regional Fire & Emergency Services Study City of Tumwater Fire Department
82
Community Risk Reduction Program
Lately, U.S. fire departments have begun to recognize the value of Community Risk Reduction (CRR)
programs that go beyond traditional fire prevention activities. Some have gone so far as to re-name their
“fire prevention” divisions to “Community Risk
Reduction Divisions.”
Regardless of the name, fire departments should be
able to accurately identify the various potential
community risks before developing prevention
programs. This is not meant to imply diminishing the
focus and importance of addressing the fire problem in
a community, rather it affords an opportunity to
identify and mitigate additional community risks
through targeted prevention activities.
The first step in developing an effective CRR plan is identifying risks unique to a particular community by
conducting a community risk assessment. A key component of the assessment process is the collection and
analysis of incident data. However, firefighters, officers, and inspectors can also provide substantial
anecdotal information on the various risks found within their respective response-areas.
As noted earlier, except for TFD, OFD, and LFD3’s formal fire code and life safety code compliance efforts
within their respective municipal jurisdictions, there does not appear to have been any comprehensive
community risk assessment and resulting formal CRR planning conducted for the unincorporated areas. The
county and respective communities would likely benefit from adopting a CRR plan. The process does not
have to be complex and could consist of simply identifying the most prevalent risks and developing strategies
to mitigate those risks.
Fire & Life Safety Public Education Program
Providing fire and life safety education to the public to minimize the number of emergencies while training
the community to take appropriate actions when an emergency occurs is essential to a fire and life safety
program. Life and fire safety education provides the best chance for minimizing the effects of fire, injury, and
illness to the community.
Public education and outreach are conducted in various ways in each department. The following is a summary
of the programs offered by each department.
Figure 111: Six Steps of CRR Planning

Regional Fire & Emergency Services Study City of Tumwater Fire Department
83
Figure 112: Life Safety & Public Education Services
Life Safety &
Public Education TFD OFD LFD3 EOFD WTRFA MBLFD
PIO/Public Educator Assigned?
Fire Chief Fire Chief No No Yes Yes
911 Education Program Yes Yes Yes Yes Yes Yes
Exit Drills In Home (EDITH) Yes Yes Yes Yes Yes Yes
Smoke Alarm Installation Yes Yes Yes Yes Yes Yes
Carbon Monoxide Alarm Installation
Yes Yes Yes Yes, On request
Yes, On request
Yes
Bike Helmet Program Yes Yes Yes Yes Yes Yes
Elder Safety/Fall prevention/Safe Driving
Yes Yes No No Yes (Safe Driving)
Yes
Home Safety Inspections Yes, Upon
Request Yes, Upon
Request No Yes Yes No
Babysitting Classes Yes No No No No No
Address Sign Program Yes No Yes Yes Yes Yes
CPR/First Aid Classes Yes Yes No No Yes Yes
BP Checks Yes Yes Yes Yes Yes Yes
Car Seat Safety Inspections Yes No Yes No Yes Yes
Fire Extinguisher Classes Yes Yes Yes, on request
Yes Yes Yes
Map Your Neighborhood Program
Yes, In coordination with County
EM
Yes, In coordination with County
EM
No Yes
Yes, In coordination with County
EM
No
K–12 Fire Prevention curriculum delivery in schools
Yes Yes Yes Yes Yes Yes
Wildfire Defensible Space Education
Yes, upon request
Yes, upon request
No No Yes Yes
Water Safety Program Yes, upon
request Yes, upon
request Yes No No Yes
Smart 911 Training No No No No Yes No
Safety Fairs Yes Yes Yes No Yes Yes
There were some additional specialty safety training programs delivered occasionally by various
departments as well, and they are not reflected in the preceding figure.
Discussion
All six departments engage in similar public education activities and life safety programs, including;
distributing bike helmets, blood pressure screening, car seat inspections, smoke alarm installations, and
basic fire safety education. Coordination and delivery of these programs varies between the departments,
with WTRFA, OFD, and MBLFD having dedicated Public Information Officers and/or Public Educators.

Regional Fire & Emergency Services Study City of Tumwater Fire Department
84
In today’s fire service, public fire and injury prevention education is much more important than in the past.
This is likely the result of evolving community expectations, coupled with the realization by fire departments
that community engagement and safety education outreach can build tremendous community support.
If consolidation is pursued, consideration should be given to conducting a formal Community Risk
Assessment, with the goal of coalescing and focusing public education efforts on the significant risks
identified in the assessment process. The U.S. Fire Administration identified a five-step assessment process
for improving public safety education:17
1. Conduct a community analysis.
2. Develop community partnerships.
3. Create an Implementation strategy.
4. Implement the strategy.
5. Evaluate the results.
They also emphasized the need for this pragmatic approach, noting:
The temptation to “just get something implemented” is hard to resist. Unfortunately, this is a trap. Yes,
it’s easy to schedule some presentations at a school; pass out brochures, stickers, and plastic helmets; and
do some media interviews. But do those presentations address the community’s worst fire or injury
problems? Do the solutions being promoted really work? Is the appropriate target audience even being
reached? Are community groups working together? Is the program being implemented in the best way?
A “ready, fire, aim” approach will not hit the target. It can give the impression that the department is out
there educating the public, but may achieve little else. Successfully reducing fires and preventable injuries
involves effective community planning. Notable public education programs around the country always
prove this to be true.
Fire Cause & Origin Investigation
Accurately determining the cause of a fire is an essential element of a fire prevention program. When fires
are intentionally set, identification and/or prosecution of the responsible offender is critical in preventing
additional fires, injuries and fatalities, and catastrophic economic impact. Further, identifying cause and
potential trends enables the department to provide specific public information and fire prevention education
to prevent reoccurrence.
All six departments have personnel trained in basic fire investigation techniques, and have established
procedures and excellent partnerships with their respective law enforcement agencies, including maintaining
evidence chain of custody. Trained personnel include line Firefighters and Officers, and Fire Inspectors. OFD
has Fire Prevention Team members (above company officer) that conduct most investigations.
17 Ibid.

Regional Fire & Emergency Services Study City of Tumwater Fire Department
85
The results of professional and thorough fire investigations can be extremely powerful in:
• Prosecuting arsonists
• Identifying product safety issues
• Educating the public about the outcomes of unsafe behaviors and conditions
• Assisting insurance companies and property owners with insurance claims
• Providing solid evidence criminal and civil court proceedings
• Identifying necessary life safety code changes
The study agencies have established sound practices for the determination of fire cause and origin and
investigation of suspicious fires. During the OFD site visit, ESCI learned that after a recent, large commercial
fire with suspicious circumstances, outside agency fire investigation personnel were requested from the
Region 4 Fire Investigation Council to assist in analyzing the scene and collect evidence. This Council is
comprised of Fire Investigators from Snohomish, King, and Pierce counties. No such regional organization
has been formed for Thurston, Mason, Grays Harbor, or Lewis Counties.
The six departments should consider creating a formal regional Fire Investigation Team, which could enhance
sharing of information related to fire trends, improve the quality and efficiency in fire investigations, and
provide back-up investigation capability for large scale/complex fire incidents.
Training Providing safe and effective fire protection, EMS, and other emergency services requires a well-trained
workforce. Initial, ongoing, and high-quality training and education is critical for fire department
effectiveness and the safety of its personnel. A comprehensive training program is necessary to achieve this
goal; this is true in all-career or combination fire departments that provide a broad range of services
throughout the community.
To ensure maximum effectiveness and safety in complex environments, firefighters and officers must acquire
and maintain sufficient initial training, ongoing training, and continuing medical education (CME). Failure to
provide necessary training endangers firefighters and citizens, and exposes fire departments to liability. In
addition, a well-trained workforce substantially contributes to better emergency incident outcomes and
community services.
Newly hired firefighters must participate in a structured recruit training and testing process. The Washington
State Fire Marshal’s Office (WSFMO) has adopted the National Fire Protection Association’s NFPA 1001
(Firefighter I and II) standard—which identifies the minimum training requirements that serves as the basis
for entry-level firefighters. The NFPA recommends other standards that address initial and ongoing training
for firefighters and officers in a variety of specific topics. In addition, new recruits must complete, or
previously completed, basic emergency medical training.
Regional Fire & Emergency Services Study City of Tumwater Fire Department
86
Following initial training, firefighters (i.e., all emergency services personnel) must actively participate in
ongoing training that includes testing as well as ensuring practical skills and knowledge are maintained. In its
Fire & Emergency Service Self-Assessment Manual (8th edition), the Commission on Fire Accreditation
International (CFAI) addresses “Training and Competency,” and lists a number of performance indicators
under the headings of training and education program requirements, performance, and resources.
To accomplish this, fire departments must have access to qualified instructors and training resources—either
within the organization, externally with regional partners, or both.
Training programs must go beyond simply fulfilling mandatory hours. Emergency services training
administrators and instructors must ensure that firefighters, EMS personnel, and officers are not only
competent, but also self-confident in the variety of skills necessary to perform effectively in high-stress
situations. Industry standards outline specific areas that are considered integral to effective training
programs. The program should include the following:
• Training administration
• Recordkeeping (records management systems)
• Training facilities and resources
• General training competencies
• Training methodologies
In the following section, ESCI has reviewed the various training practices and resources of each of the fire
departments involved in this study.

Regional Fire & Emergency Services Study City of Tumwater Fire Department
87
Training Administration
In this section, ESCI examines administrative and other resources devoted to fire, EMS, and other training
topics among the fire departments. The following two figures list the various components for each
department in the study.
Figure 113: Training Administration & Budget (TFD, EOFD, LFD3)
Survey Component TFD EOFD LFD3
Director of training program Lieutenant Assistant Chief Captain
Training goals & objectives identified Yes Yes Yes
Certified instructors used Instructor 1 Instructor 1 Instructor 1
Training manual developed/used Task books Task books No
Annual training report produced Yes No No
Priority by management toward training Yes Yes Yes
Condition of training admin. facilities Use MNRFTC1 Good; expanding Use MNRFTC
Adequate office space, equip., supplies Yes Yes Yes
Budget allocated to training $124,7502 $54,5002 $243,0002
Clerical staff assigned to training None None Shared
1Mark Noble Regional Fire Training Center; owned & operated by the Olympia Fire Department 2Excludes training staff wages and benefits
Figure 114: Training Administration & Budget (WTRFA, OFD, MBLFD)
Survey Component WTRFA OFD MBLFD
Director of training program Captain Battalion Chief Captain
Training goals & objectives identified Yes Yes Yes
Certified instructors used Instructor 1 Instructor 1 & 2 Instructor 1
Training manual developed/used Task books Multiple manuals In process
Annual training report produced Monthly No No
Priority by management toward training Yes Yes Yes
Condition of training admin. facilities Good Excellent1 Good
Adequate office space, equip., supplies Yes Yes Yes
Budget allocated to training $112,6162 $389,1632 $82,6002
Clerical staff assigned to training Shared Shared Shared
1Mark Noble Regional Fire Training Center 2Excludes training staff wages and benefits

Regional Fire & Emergency Services Study City of Tumwater Fire Department
88
Tumwater assigns a Lieutenant the responsibility for managing and delivering fire training, while Lacey Fire
District 3, West Thurston, and McLane-Black Lake assigns a Captain. East Olympia has assigned an assistant
chief to this task. A Battalion Chief is responsible for fire training at the Olympia Fire Department. None of
the departments has administrative support staff specifically assigned to their training divisions. Most share
support staff when necessary.
Each of the fire departments develops annual training goals and objectives. At a minimum, each utilizes
instructors certified as an Instructor I. The Olympia Fire Department utilizes Instructor IIs when training
Captains and Battalion Chiefs. When conducting live-fire training, OFD uses Live Fire Instructors certified by
the International Society of Fire Service Instructors (ISFSI).
Most of the departments utilize training manuals and task books, with the exception of McLane-Black Lake
(which is in progress). With the exception of Tumwater and West Thurston (who does a monthly report), none
of the department publishes an annual training report.
Training Priority by Management
It was evident during ESCI’s site visit and interviews with the various Training Officers that the leadership
among each of the fire departments participating in this study recognizes the importance and value of
training, and has tended to devote the necessary time and resources to accomplish the necessary goals.
Training Budgets
Each of the fire departments in this study is allocated funding specifically for training. The following figure
shows the 2018 budgeted amounts among each of the fire departments. It is important to note that these
figures do not include salaries, benefits, or overtime costs of personnel assigned to manage and/or conduct
training sessions.
Figure 115: Combined 2018 Training Budgets
Fire Department 2018 Budget
Tumwater Fire Department $124,750
East Olympia Fire Department $54,500
Lacey Fire District 3 $243,000
West Thurston Fire Department $112,616
Olympia Fire Department $389,163
McLane-Black Lake Fire Department $82,600
Total of Training Budgets: $1,006,629
As shown in the preceding figure, the combined funds allocated for training among all the study participants
exceeds $1.1 million annually. Excluding Olympia and McLane-Black Lake, who each maintain regional
training centers, the average amount allocated to training among the other four departments was $164,654.

Regional Fire & Emergency Services Study City of Tumwater Fire Department
89
Thurston County Training Officers
Under the auspices of the Thurston County Fire Chiefs Association, Training Officers from the fire departments
meet regularly to develop and share resources, as well as promote fire training locally.
Training Facilities & Resources
The next section describes the various training facilities and resources among the fire departments
participating in this study. The next two figures list these by individual organization.
Figure 116: Training Facilities & Resources (TFD, EOFD, LFD3)
Description TFD EOFD LFD3
Adequate training ground space/equipment Minimal Yes Yes
Live fire props At MNRFTC Vent, car, live fire, etc.
At MNRFTC
Fire & driving grounds Yes Yes Yes
Training facility maintenance adequate N/A Yes Yes
Classroom facilities adequate Yes Yes Yes
Video & computer simulations available Yes Yes Yes
Instructional materials available Yes Yes Yes
Figure 117: Training Facilities & Resources (WTRFA, OFD, MBLFD)
Description WTRFA OFD MBLFD
Adequate training ground space/equipment Shared ownership with MBLFD
Yes Yes
Live fire props None on site Numerous props At MNRFTC
Fire & driving grounds Yes Yes Yes
Training facility maintenance adequate Remodel pending Yes Yes
Classroom facilities adequate Yes Yes Yes
Video & computer simulations available Yes Yes Yes
Instructional materials available Yes Yes Yes
Each of the fire departments maintain, or have access to, adequate regional training facilities, as well as a
broad range of props for roof ventilation, vehicle fires, LPG fires, towers, and much more. One of the features
of Olympia’s Mark Noble Regional Fire Training Center is a state-of-the-art Command Training Center.
Training Facilities in Thurston County
The Olympia Fire Department has a separate state-of-the-art training center which is utilized by a number of
departments in Thurston County. The training center is equipped with a wide variety of equipment, props,
and other facilities, as shown in the next figure.

Regional Fire & Emergency Services Study City of Tumwater Fire Department
90
Figure 118: Mark Noble Regional Training Center (OFD)
Address/Physical Location: 1305 Fones Rd, Olympia, WA 98501
General Description:
The Olympia Fire Department owns and operates the Mark Noble Regional Training Center (MNRTC). The center consists of several buildings. Two towers with smoke and one with a burn room, classroom, computer lab, storage, and restrooms. They maintain numerous props and a standalone Command Training Center.
Structure
Construction Type Multiple facilities; mostly masonry
Date of Construction 2012
Seismic Protection Yes
Auxiliary Power Yes
General Condition Excellent
Special considerations (ADA, etc.) N/A
Square Footage N/A
Facilities Available
Exercise/Workout Facilities No
Kitchen/Dormitory Kitchenette for day staff
Shower Facilities One
Safety & Security
Sprinklers and/or Smoke Detection Yes/Yes (fire alarm)
Security Yes
Apparatus Exhaust System N/A
Figure 119: OFD Command Training Facility Figure 120: Roof Props at the OFD Training Center

Regional Fire & Emergency Services Study City of Tumwater Fire Department
91
The McLane-Black Lake Fire Department maintains a training tower and drill yard, which is considered a
shared training center with several other fire districts. The other participating departments contributed funds
towards the construction of the facility, although the majority of costs were absorbed by MBLFD. The
training center is located adjacent to its headquarters station.
West Thurston maintains a three-story training tower with multiple props at Station 1-1. The East Olympia
Fire Department has a small connect cluster which it uses for training, and are rebuilding a new drill complex
of connection boxes that will include a Class A burn room and drill yard sometime in 2019. Funding for this
project has already been allocated.
Washington State Fire Training Academy
Another resource available to the fire departments is the Washington State Fire Training Academy (FTA)
located in North Bend. The WSFTA has a substantial inventory of training props and facilities that include:
• Burn buildings
• ARFF building, field area, and prop
• Marine shipboard prop
• Forcible entry prop
• Hazmat building and outside props
• Flammable liquid pads
• Classrooms, dormitory, and dining facility
• Ventilation props
Figure 121: McLane-Black Lake Regional Training Center

Regional Fire & Emergency Services Study City of Tumwater Fire Department
92
Training Records Maintenance
The following two figures describe the methods by which each of the fire departments maintain and track
individual and organizational training records.
Figure 122: Training Records Maintenance (TFD, EOFD, LFD3)
Description TFD EOFD LFD3
Individual training files maintained TargetSolutions Yes Yes
Records & files computerized Yes Yes Yes
Daily training records kept Yes Yes Yes
Annual training hours tracked Yes Yes Yes
Company training records kept Yes Yes Yes
Responsibility for records Training Division Assistant Chief Training Division
Training equipment inventoried No No No
Figure 123: Training Records Maintenance (WTRFA, OFD, MBLFD)
Description WTRFA OFD MBLFD
Individual training files maintained Yes TargetSolutions Yes
Records & files computerized Yes Yes Yes
Daily training records kept Yes Yes Yes
Annual training hours tracked Yes Yes Yes
Company training records kept Yes Yes Yes
Responsibility for records TO & Admin. Staff Training Division Training Division
Training equipment inventoried Annually Annually No
General Training Competencies
For training to be fully effective, it should be based on established standards. The following two figures list
the general training competencies regularly delivered to the members of each of the fire departments
participating in the study. As will be shown, each of the departments has adequately addressed basic, general
training competencies.

Regional Fire & Emergency Services Study City of Tumwater Fire Department
93
Figure 124: General Training Competencies (TFD, EOFD, LFD3)
Description TFD EOFD LFD3
Incident command system Yes Yes Yes
Accountability procedures in place Yes Yes Yes
Policy & procedures on training Yes Yes Yes
Safety procedures in place Yes Yes Yes
Recruit academy Bates1 & County2 County2 Bates1
Special rescue SORT training3 SORT training3 SORT training3
Hazmat certification Operations level Operations level Operations level
Wildland firefighter Wildland interface 50% Red Card 40% Red Card
Vehicle extrication Yes Yes Yes
Defensive driving EVIP EVIP EVIP
Use, safety, & care of small tools Yes Yes Yes
Use & care of power equipment Yes Yes Yes
Radio communications & dispatch Yes Yes Yes
EMS skills & protocols OTEP/TCMO OTEP/TCMO OTEP/TCMO
1Bates Technical College 2Refers to Thurston County recruit academy 3Special Operations Response Team
Figure 125: General Training Competencies (WTRFA, OFD, MBLFD)
Description WTRFA OFD MBLFD
Incident command system Yes (Policy 1.4000) Yes Yes
Accountability procedures in place Yes (Policy 1.4003) Yes Yes
Policy & procedures on training Yes Yes Yes
Safety procedures in place Yes Yes Yes
Recruit academy County; biannually2 Bates1 & Internally County2
Special rescue SORT training3 SORT training3 SORT training3
Hazmat certification Operations level Operations level Operations level
Wildland firefighter 90% Red Card+ No; developing 90% Red Card
Vehicle extrication Yes Yes Yes
Defensive driving EVIP IAPD Yes
Use, safety, & care of small tools Yes Yes Yes
Use & care of power equipment Yes Yes Yes
Radio communications & dispatch Yes With TCOMM Yes
EMS skills & protocols OTEP/TCMO OTEP/TCMO OTEP/TCMO
1Bates Technical College 2Refers to Thurston County recruit academy 3Special Operations Response Team
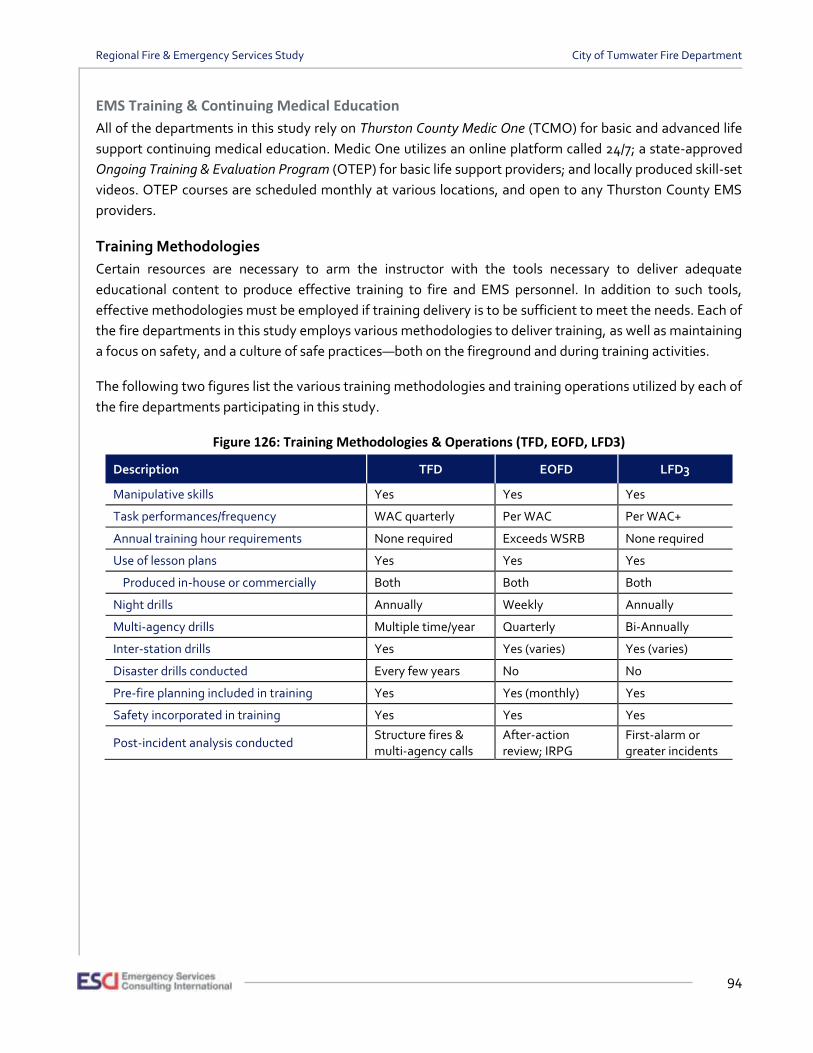
Regional Fire & Emergency Services Study City of Tumwater Fire Department
94
EMS Training & Continuing Medical Education
All of the departments in this study rely on Thurston County Medic One (TCMO) for basic and advanced life
support continuing medical education. Medic One utilizes an online platform called 24/7; a state-approved
Ongoing Training & Evaluation Program (OTEP) for basic life support providers; and locally produced skill-set
videos. OTEP courses are scheduled monthly at various locations, and open to any Thurston County EMS
providers.
Training Methodologies
Certain resources are necessary to arm the instructor with the tools necessary to deliver adequate
educational content to produce effective training to fire and EMS personnel. In addition to such tools,
effective methodologies must be employed if training delivery is to be sufficient to meet the needs. Each of
the fire departments in this study employs various methodologies to deliver training, as well as maintaining
a focus on safety, and a culture of safe practices—both on the fireground and during training activities.
The following two figures list the various training methodologies and training operations utilized by each of
the fire departments participating in this study.
Figure 126: Training Methodologies & Operations (TFD, EOFD, LFD3)
Description TFD EOFD LFD3
Manipulative skills Yes Yes Yes
Task performances/frequency WAC quarterly Per WAC Per WAC+
Annual training hour requirements None required Exceeds WSRB None required
Use of lesson plans Yes Yes Yes
Produced in-house or commercially Both Both Both
Night drills Annually Weekly Annually
Multi-agency drills Multiple time/year Quarterly Bi-Annually
Inter-station drills Yes Yes (varies) Yes (varies)
Disaster drills conducted Every few years No No
Pre-fire planning included in training Yes Yes (monthly) Yes
Safety incorporated in training Yes Yes Yes
Post-incident analysis conducted Structure fires & multi-agency calls
After-action review; IRPG
First-alarm or greater incidents

Regional Fire & Emergency Services Study City of Tumwater Fire Department
95
Figure 127: 2017 Training Methodologies & Operations (WTRFA, OFD, MBLFD)
Description WTRFA OFD MBLFD
Manipulative skills Yes Yes Yes
Task performances/frequency Varies Weekly Varies
Annual training hour requirements Per WSRB & WAC 144 hours Per WSRB & WAC
Use of lesson plans Yes Yes Yes
Produced in-house or commercially Both Both Both
Night drills Bi-Annually Annually Bi-Annually
Multi-agency drills Quarterly Frequently Bi-Annually
Inter-station drills Yes (quarterly) Yes (weekly) Yes (quarterly)
Disaster drills conducted Annually City EM Varies
Pre-fire planning included in training Yes Yes Yes
Safety incorporated in training Yes Yes Yes
Post-incident analysis conducted Structure fires & multi-alarm calls
Most fires First-alarm or greater incidents
All of the fire departments conduct training on a monthly and/or weekly basis, and meet their annual training
requirements. Multi-agency, night, and inter-station drills are conducted regularly by each of the
departments.
The following two figures list the most current training activities among the six departments.
Figure 128: 2017 Fire Department Training Activities (TFD, EOFD, LFD3)
Description TFD EOFD LFD3
Number of personnel trained 50 45 115
Fire-related training hours 5,763 3,726 9,200
EMS-related training hours 1,661 446 3,300
Other training hours — 200 (recruits) —
Total Training Hours Delivered: 7,424 4,372 12,500
Figure 129: 2017 Fire Department Training Activities (WTRFA, OFD, MBLFD)
Description WTRFA OFD MBLFD
Number of personnel trained 85 107 70
Fire-related training hours 4,873 9,454 5,960
EMS-related training hours 600 3,366 509
Other training hours 2,240A 2,494 688
Total Training Hours Delivered: 7,713 15,314 7,157 ARepresents 1,440 hours in recruit academy; 100 hours for technical rescue; and 900 hours for EMT training

Regional Fire & Emergency Services Study City of Tumwater Fire Department
96
The next figure represents the combined training activities of the six fire departments and fire districts
participating in this study. As shown, fire-related training comprised approximately 72 percent of the total
training hours; EMS-related training just over 18 percent; with all other training topics making up just over
10 percent of the total training hours.
Figure 130: Combined Training Activities Summary
Description Totals
Number of personnel trained 472
Fire-related training hours 38,976
EMS-related training hours 9,882
Other training hours 5,622
Total Training Hours Delivered: 54,480
Training Discussion
It was evident from ESCI’s site visit that each of the fire departments in this study considers training as a high
priority. If consolidated or even partially consolidated, they would have a large amount of resources and
qualified personnel to provide ongoing fire-related and other training. Assuming Thurston County Medic One
would continue the provision of continuing medical education and initial EMT-Basic training, EMS training
should not be an issue in the event of consolidation. If not, it would be necessary for a consolidated
department to assign and/or employ qualified instructors and management staff to deliver mandatory EMS
continuing medical education.
RECOMMENDATIONS:
• As described earlier, fire training is a critical element of a successful fire department, and requires substantial skills, knowledge, and experience to manage effectively. Tumwater & Lacey should assign (or promote) their Training Lieutenants to manage and deliver fire training.
• Each department should consider publishing an annual training report—either independently or incorporated within their department’s annual report. The reports should be shared with all members.
• Tumwater, Lacey, and McLane-Black Lake should annually inventory all of their training equipment and props, and maintain regular maintenance records.

Regional Fire & Emergency Services Study City of Tumwater Fire Department
97
Current Financial Analysis
Economic Setting
The national economy, which sets the stage for the local economy, continues its nine-year trend of modest
growth. The current economic expansion is the second longest on record, and appears likely to break the
record in July 2019 (the previous record was 120 months from 1991–2001). Even though there are concerns
regarding the stock market and regarding the implications of certain national and international policies, the
consensus is that the current growth trends can be expected to continue at least through 2019.
Washington’s economy has been growing at a faster pace than the nation as a whole since 2012, in terms of
GDP. Washington State’s unemployment rate of 4.5 percent is at historic low, and job growth is expected to
continue growing at 1.8 percent through 2020. The state’s retail sales tax collections are up 33 percent
between 2014 and 2018. These are both indicators of a strong economy and key drivers of government
payrolls, which bodes well for Thurston County.
Dominated by the state capital in Olympia and state department offices in Tumwater, Thurston County is
heavily dependent on government employment—Employment Security data shows 32.5 percent of all
nonfarm employment in the county can be attributed to federal, state, and local government jobs. As of
October 2018, the area enjoyed a low 4.2 percent unemployment rate on a civilian labor force of 139,037. The
County’s strong economic position is further indicated by its 7 percent growth in assessed value (AV), from
$30 billion in 2016 to $32.2 billion in 2017, which included $488 million in new construction (itself up 10.6%
from 2016).
The six subject fire departments cover much of Thurston County, including the bulk of metropolitan areas
(excluding the small cities of Yelm, Rainier and Tenino), with a population of 236,000 out of a county total of
277,000 (85% of total) and 381 square miles out of 774 square miles (49%). Their combined assessed value
(AV) is $25.7 billion out of $32.2 billion (80%). Since the subject area accounts for a majority of the economic
activity of the county, we can confidently assume that published County-wide trends closely match subject
area trends.
The local economy is also augmented by large public construction projects (though the fire departments
receive no direct tax benefit from them). Olympia, Tumwater, and North Thurston school districts continue
to build and renovate schools thanks to recent voter-approved bonds. Olympia voters approved $160 million
in 2016. North Thurston, working off its 2014 bond package, has capital construction plans of over $104
million between 2017 and 2023 ($35 million was approved for the 2018/19 school year). Tumwater is
completing projects from its 2014 bond package and is contemplating $124 million in projects in its 2018–24
capital facilities plan.

Regional Fire & Emergency Services Study City of Tumwater Fire Department
98
The area is also growing in population (Figure 131). Thurston County has been one of the fastest growing
counties in Washington for the last thirty years. In the last 10 years, the county has grown roughly 10 percent
from about 249,000 in 2009, to 282,000 in 2018. Within the cities of Lacey, Olympia, and Tumwater, the
average growth rate was 2.4 percent each year, and almost 21 percent over the 10-year period. From 2015 to
2018, the average was 2.9 percent per year, and 8.7 percent overall. Per a 2011 Thurston County Regional
Planning Council study, Thurston County will need to add 55,000 new residential units between 2010 and
2030.
Figure 131: Fire Agency Population Projections
While the strong economy provides confidence for the six fire departments’ budgets, this confidence is
somewhat offset by strong population growth; and with it, growing expenses. Most of the departments’
property tax revenue has recently grown faster than the population; over all they increased their levies by
almost 26 percent from 2015 to 2018 (see Figure 132). WTRFA and the Medic 1 regular levies are the
exceptions, with WTRFA regular levy shrinking by 11 percent over the four-year period (excluding its M&O
levy), and Medic 1 only increasing by 8 percent. However, when WTRFA’s M&O levy is included its total levy
increases are in line with those of other departments. Medic 1 remains a more concerning funding source.
Along with the economic setting described above, we note that one of the main challenges facing fire
agencies (and other local government agencies) are various property tax constraints. The two that are most
difficult are the 1 percent limit on growth and the $5.90 limit on total property tax rates. The impact of the 1
percent limit is that it prohibits revenues from rising as quickly as inflation (which often exceeds 1%), unless
voters approve larger increases. This leads to a structural imbalance in funding for all local governments in
Washington State. The impact of the $5.90 limit is that it restricts how much tax voters can approve. While a
thorough explanation of these issues is beyond the scope of this document, an excellent overview can be
found online.18
18 See: http://mrsc.org/Home/Explore-Topics/Finance/Revenues/The-Property-Tax-in-Washington-State.aspx.
10,000
30,000
50,000
70,000
90,000
110,000
130,000
2010 2013 2014 2015 2016 2017 2018 2020 2025 2030 2035 2040
OFD TFD LFD3 EOFD MBLFA WTRFA

Regional Fire & Emergency Services Study City of Tumwater Fire Department
99
Figure 132: Summary of Levies
Levies Increase from
Taxing District 2015 2016 2017 2018 15–16 16–17 17–18 15–18
Tumwater $ 7,477,416 $ 7,806,532 $9,267,533 $9,493,468 4.4% 18.7% 2.4% 27.0%
Olympia $14,789,950 $15,139,775 $15,591,403 $18,597,989 2.4% 3.0% 19.3% 25.7%
EOFD $ 2,004,648 $ 2,090,533 $ 2,297,825 $ 2,457,039 4.3% 9.9% 6.9% 22.6%
LFD3 $12,895,122 $13,515,914 $14,525,783 $16,091,971 4.8% 7.5% 10.8% 24.8%
WTRFA $ 3,156,659 $ 2,605,709 $ 2,730,045 $ 2,795,429 -17.5% 4.8% 2.4% -11.4%
M&O $ - $ - $ 1,194,017 $ 1,202,146 0.0% 0.0% 0.7% 0.7%
Total $ 3,156,659 $ 2,605,709 $ 3,924,062 $ 3,997,575 -17.5% 50.6% 1.9% 26.6%
MBLFD $ 3,440,667 $ 3,940,408 $ 4,142,931 $ 4,404,587 14.5% 5.1% 6.3% 28.0%
M&O $ - $ 373,650 $ 404,524 $ 430,906 0.0% 8.3% 6.5% 15.3%
Total $ 3,440,667 $ 4,314,058 $ 4,547,455 $ 4,835,493 25.4% 5.4% 6.3% 12.1%
Totals: $43,764,463 $45,472,521 $50,154,061
$55,473,535 3.9% 10.3% 10.6% 26.8%
Medic One $ 9,958,158 $10,225,254 $10,514,594 $10,758,206 2.7% 2.8% 2.3% 8.0%
With a strong economy, solid financials, and significant levels of cross-connection, now is a good time to look
at consolidation options. Making such transitions will be eased by the over-all strong financial position.
Interconnectedness
The agencies all lie within Thurston County, which has a county-wide Medic One EMS levy of $0.33 (2018)
totaling $10,758,206. We discuss the Medic One system as a separate issue below, but it is worth noting that
the studied agencies already work together through it. TFD, OFD, and LFD3 provide advanced life support
and ambulance services through Medic One within their own areas and to the rest of the county. There is
additionally a significant level of interconnectedness among the six departments in this study, with interlocal
contracts for a variety of services. A summary of these contracts follows:
• OFD—Vehicle Repair and Maintenance Services (serving all agencies)
• OFD—Training Services (serving TFD and LFD3)
• LFD3—Vehicle Repair Facility (leased to OFD)
• West Thurston Regional Fire Consortium (WTRFA, MBLFD and EOFD)
• Special Operations Rescue Team (all agencies)
• Medic One (all agencies)
• Mutual Aid (all agencies)
Loss of any of these contracts due to a merger or other cooperative arrangement will have no net impact to
the system. For instance, if LFD3 and OFD were to merge, the resulting combined agency would lose the
$62,500 lease income from LFD3, but gain the $62,500 savings from OFD.

Regional Fire & Emergency Services Study City of Tumwater Fire Department
100
Thurston County Medic One
Authorized by voters in 1999 at a rate of $0.50 per $1,000 AV, the Medic One/EMS Levy’s mission is to
“Provide efficient and effective pre-hospital emergency medical services (EMS) throughout Thurston County
(Washington State).” Services are coordinated through County staff with the support of the Thurston County
Emergency Medical Services Council.
In 2018, the Medic One EMS Levy totaled $10,758,206 at a rate of $.33 per $1,000 AV. Approximately 90
percent of the levy pays for Advanced Life Support and Basic Life Support, and about 5 percent is used for
medic unit repair and replacement (units are owned by Medic One). The remainder covers administrative
overhead, medical direction, financial, and technical support to the County's 14 fire agencies.
Advanced Life Support (ALS) response and transportation services are provided via contracts with the
Olympia Fire Department (OFD); Tumwater Fire Department (TFD); and Lacey Fire District 3 (LFD3). The ALS
funding from Medic One is intended to cover 100 percent of ALS costs including salaries, equipment, and
supplies for a 7-medic unit. Funding is provided at 90 percent should an agency decide to staff its medic units
with 8 medics, or 80 percent when staffed at 9 medics. Currently staffing is at 9 paramedics across the three
contracted departments, and is expected to remain the same with the exception of Medic 14 which is located
at the WTRFA Rochester Station. Medic 14 is staffed by 8 Tumwater paramedics and is funded at 100 percent.
Medic One funding totaled $9,194,602 in 2017, or about 17 percent of the total budgets of $52,771,580 across
all departments.
Basic Life Support (BLS) first response service, EMS training, and supplies are supported at each fire agency
in the county with a $27,025 pass-through from the levy (this amount falls short of actual BLS supply costs).
Additional funding totaling $719,459 in 2018 is divided among the 12 BLS agencies by call volume.
Beyond Medic One funding, agencies may charge a transportation fee for BLS. Currently MBLFD and WTRFA
charge BLS transportation fees. WTRFA charges a single fee to all customers while MBLFD charges a
separate, higher fee for nonresidents. WTRFA enjoyed $339,780 in revenues in 2017 (6% of total revenues),
while MBLFD brought in $84,443 (about 1% of total revenue). They compete against private ambulance
companies, AMR, and Olympic Ambulance, who charge higher rates for this service.
ESCI notes that largely because property tax increases in Washington State are limited to 1 percent growth,
the Medic One levy rate has decreased from its original $0.50 millage to its present $0.32 millage. As in other
agencies, this growth limitation leads to a structural deficit—with inflation growing at an average of about
2.5 percent, the revenue cannot keep pace. As noted above, the Medic One levy grew by 8 percent in the
four-year period from 2015 to 2018, largely thanks to new construction (which is not limited by the 1% growth
cap).

Regional Fire & Emergency Services Study City of Tumwater Fire Department
101
The structural deficit was made apparent in a 2013 study by the Thurston Regional Planning Council which
found that expenditures were exceeding revenues as of 2011. The authors of the study recommended asking
voters for a levy lid lift in 2017 to support Medic One programs. This project has not yet been attempted,
however, and the current planning window for doing so is circa 2020. If/when they successfully complete this
project, the levy rate would go from its current $0.33 millage to $0.50, or an annual increase of about
$5,350,000.
Regionalization will likely have modest impacts on the BLS side of the Medic One system. Without a change
to the funding model, a newly formed fire authority would lose the $27,025 pass-through for each
consolidated fire department. The remainder of the BLS funding would remain the same since it is
apportioned according to call volume. If all six agencies were to consolidate the loss would be $135,125, about
0.35 percent of the consolidated revenues of $38,365,672. There would be no financial impact to the ALS
services or funding.
East Olympia Fire District
East Olympia Fire District is the smallest of the six studied agencies, with a 2018 operating budget of just
over $2 million, a population of about 12,000 and a geographic area of 30 square miles (larger than the two
cities, but smaller than the other three departments). Currently, the district is staffed by 20 career and 30
volunteer firefighters.
Like all of the agencies under study, EOFD is taking full advantage of its taxing authority, with a levy rate of
$1.50 per millage. It does not have an M&O levy. It has one outstanding voter-approved bond.
As a good initial assessment of the district’s health, we note a growing End-of-Year General Fund balance
(see Figure 1335). Fund Balances can vary day-by-day, but End-of-Year balances, which coincide with most
budgets, provide a common measuring stick of financial health. While it may be acceptable to see an
occasional decline in General Fund balance, a healthy financial situation will generally only show such drops
due to one-time issues, such as a major capital expenditure or a temporary funding issue.

Regional Fire & Emergency Services Study City of Tumwater Fire Department
102
Figure 133: EOFD General Fund Balances
EOFD also maintains a healthy reserve account that totaled $1,368,290 at the end of 2017—this represents
over half a year’s operating expenses. As a rule, agencies need to maintain fund balances of at least three or
four months of operating expenses. EOFD’s financial policy #86-04 requires a three-month financial reserve,
as well as a two-month rainy-day reserve.
Interlocal Agreements
EOFD contracts with Southeast Thurston Fire Authority to share costs of a Training Officer, a Mechanic, and
a Facilities Maintenance employee. They have an additional agreement with OFD to provide vehicle
maintenance beyond that provided by their in-house staff.
Capital Improvements and Debt
As can be noted by the non-operating expenditure line in the following figure, EOFD is actively maintaining
its capital assets, with $351,007 in upgrades to its training facilities planned for 2019, and $998,500 in
purchases of two new engines, a command vehicle, and SCBA equipment planned for 2018. These and other
current improvements are financed by a 2016 bond issuance of $2 million. Bond payments are covered by a
$0.26 voter-approved levy, and the bond will be retired in 2022.
In addition to the bond, we note pension fund liabilities totaling $249,913 (10.3% of 2018 budget) and
compensated absences totaling $76,235. Neither of these liabilities present a significant risk to the
department.
Budgetary Review
EOFD maintains three budgetary funds—General, Capital Project, and Debt Service. The General Fund is
used for regular operating activities, the Capital Project Fund is used for the acquisition or construction of
capital assets, and the Debt Service Fund accounts for resources and expenditures related to long-term debt
(which is used to finance the Capital Project Fund).
$1,891,546
$2,015,535
$2,133,784
$2,441,273
$2,641,139
$2,539,273
$1,500,000
$2,000,000
$2,500,000
$3,000,000
2013 Actual 2014 Actual 2015 Actual 2016 Actual 2017 Actual 2018 Budget

Regional Fire & Emergency Services Study City of Tumwater Fire Department
103
While all of the studied agencies are heavily dependent on property tax revenues, EOFD is the most reliant
with property taxes covering 92 percent of operating expenses in 2017. Though property tax revenues are
generally stable and reliable, there are a couple of consequences to be aware of. First, fire districts are
secondary taxing authorities. This means that if the total property tax rate for an area exceeds the statutory
maximum, as happened in 2008, fire district’s levies may be reduced to bring levy rates down. Second, the
majority of property tax revenues are received in May and November. If an agency has a low general fund
cash balance, this can lead to difficulty making payments in the early spring and late summer. Through
prudent financial stewardship, EOFD has an adequate cash balance.
While EOFD’s fund balance trends (Figure 133) are positive, it is important to also make sure that operating
(or recurring) revenues are regularly greater than operating expenditures, that capital expenditures are well
planned and covered, and that debt payments have an adequate and consistent funding source. One should
not over-focus on any single data point, but should instead take in the totality of the various aspects of an
agency’s financial condition.
Operating revenues and expenses are those that are generated through the agency’s regular activities.
Revenue examples include taxes, fees and charges, and interest, while example expenditures include debt
payments, personnel costs, and equipment repair. Non-operating (or one-time) revenues and expenses are
those that happen irregularly or are not guaranteed. Revenue examples include grants, property sales,
donations, and fund balances, while expenditure examples include major capital purchases. Generally,
operating revenues should not be used for non-operating expenses and non-operating revenues should not
be used for operating expenses. For example, funding from bonds should be used for new apparatus rather
than supporting on-going pay increases.
As seen in the next figure, EOFD’s operating revenues generally line up with the operating expenditures as
do its nonoperating revenues/expenditures (net over time).
Figure 134: EOFD Net Revenues (Deficits)
Net Revenues (Deficits) 2013
Actual 2014
Actual 2015
Actual 2016
Actual 2017
Actual 2018
Budget
Operating Revenues $1,879,981 $2,009,808 $2,180,778 $2,173,624 $2,101,513 $2,216,066
Operating Expenditures $1,749,853 $1,885,134 $1,863,799 $1,922,414 $1,971,475 $2,234,806
Net Revenue (deficit) $130,128 $124,674 $316,979 $251,210 $130,038 $(18,740)
Non-Operating Revenues $7,744 $1,124 $447 $2,000,251 $379,225 $390,494
Non-Operating Expenditures $32,839 $15,150 $109,824 $76,417 $542,313 $1,701,212
Net Revenue (deficit) $(25,095) $(14,026) $(109,377) $1,923,834 $(163,088) $(1,310,718)

Regional Fire & Emergency Services Study City of Tumwater Fire Department
104
Forecast
ESCI forecasted EOFD’s expenditures using a linear formula based on the last four years, and its property tax
revenues based on average increases over six years. Its property tax revenue forecast assumes 1 percent
annual growth plus $1.5 per $1,000 AV on new construction (except 2020, where construction is held to $0 in
anticipation of a mild recession). Contract revenue was forecast on a simple 2.5 percent inflationary increase.
Based on this fairly simple model, EOFD could see increasing deficits in the coming years.
Of course, with controls over EOFD’s expenditure increases there is no reason why our forecasts will
necessarily come to fruition. The forecasts do, however, point to a need for inflationary controls. They also
reflect the continued problem of a structural imbalance in Washington State where revenue growth is more
tightly controlled than inflationary pressures on expenses. The district intends to submit a levy lid lift to help
alleviate inflationary pressures.
Figure 135: EOFD Financial Forecast
2019 Forecast
2020 Forecast
2021 Forecast
2022 Forecast
2023 Forecast
2024 Forecast
Operating Revenues $2,286,127 $2,310,327 $2,377,677 $2,449,944 $2,527,178 $2,609,429
Operating Expenditures $2,288,644 $2,404,852 $2,521,060 $2,637,269 $2,753,477 $2,869,685
Net Revenue (deficit) $(2,517) $(94,525) $(143,383) $(187,325) $(226,299) $(260,256)
Beginning Fund Balance $2,520,533 $2,401,808 $2,191,074 $1,931,483 $1,627,950 $1,285,442
City of Tumwater Fire Department
The City of Tumwater’s Fire Department has an operating budget of $6.7 million and serves a population of
almost 24,000 people in an area of about 18 square miles. This makes TFD the smallest of the studied
agencies in terms of land area, but mid-sized in terms of budget and population. Currently, the department
is staffed by 49 career and 12 volunteers, including four new positions added in 2017 due to the east
annexation of approximately 15 percent of EOFD and FD 15 in 2016.
TFD provided fire and medic services through an intergovernmental contract with the Munn Lake Fire District
15 (FD15) until it was annexed into City boundaries in 2016 as previously mentioned. In addition to fire
suppression and basic life support services, TFD is a contract provider within the Thurston County Medic One
System through which it provides advanced life support services within the city and to the Rochester/Grand
Mound areas. While the contract would pay 100 percent of costs for 7 paramedics per station, all 3 agencies
have elected to staff their stations with 9 paramedics and receive 80 percent cost recovery from Medic One
with the exception of Medic 14 located in Rochester. Medic 14 staffs 8 paramedics per contract at 100
percent. The remaining expenses are absorbed by the agencies. The department also provides fire
suppression services to the Port of Olympia Regional Airport.
Since it is a city department, there is no direct connection between the property tax levy or other tax revenues
and the fire department’s services. That said, if a $1.50 levy rate were applied to the City’s assessed value, it
would accrue $4.886 million. With the additional $2.372 million Medic One payments the department
receives and $17,000 in fire inspection fees, it would conceivably have a total revenue of about $7.275 million.

Regional Fire & Emergency Services Study City of Tumwater Fire Department
105
The City does not allocate overhead expenses within its general fund, so the department’s 2018 budgeted
operating costs of $7.310 million appear lower than they would if it were a separate agency, making it more
difficult to compare. There are a variety of valid ways to estimate how much of the overhead costs are
attributable to the fire department, and each would likely produce a different result. A simple way is to simply
take the total General Fund costs for the City that are administrative in nature (Legislative, Executive,
Finance, HR, IT, Attorney) as a percent of the total General Fund expenses (about 10.45%) and apply that
percentage to the fire department. This would add an estimated $764,000 to the figure, for a total of $8.074
million, resulting in an operating deficit of $799,000. Even though the 2018 estimated expenses were
somewhat less at $7.134 million and the overhead figure is a very rough estimate, it is unlikely that a stand-
alone agency would break even without changes to one or both sides of the revenue-expenditure equation.
Over the past 5 years, the department’s budget has increased on average 7 percent per year, and 35 percent
overall (see Figure 136). Much of this growth can likely be attributed in part to the annexation of FD15 in 2016,
and an average population growth of 6 percent per year (30% overall). The growth was at least partly enabled
by the levy lid lift and by property taxes on new construction (which are not included in the 1% property tax
limitation).
Figure 136: Tumwater Budget Compared to AV Growth
Capital Improvements and Debt
TFD is actively maintaining its capital assets via debt issuances. Having paid off a bond in 2018, the
department is left with $188,656 in debt on an engine that will be paid off in 2021 (payments are roughly
$67,700 per year). They plan to issue an additional $750,000 in debt over the next 8 years for a new fire engine
through the Washington Treasurer’s LOCAL program (essentially piggy-backing on state-issued bonds),
paying for it with money provided by the levy lid lift (see below). Debt service is anticipated to be about
$109,740 for eight years beginning in 2019. The City has also recently completed facility improvement on its
Fire Station T2 and Headquarters Fire Station, and continues to make repairs and improvements.
$1,000
$2,000
$3,000
$4,000
$5,000
$6,000
$7,000
$8,000
$1,000
$1,500
$2,000
$2,500
$3,000
$3,500
2013 2014 2015 2016 2017 2018
Tho
usa
nd
s
Mill
ion
s
AV Budget

Regional Fire & Emergency Services Study City of Tumwater Fire Department
106
Additionally, the City has liabilities for compensated leave, pension liability, and other post-employment
benefits—the amounts attributable to the fire department are unknown. Pension liability has increased on
average 23 percent ($306,489) each year over the past 9 years (2009–2017). While the rate of increase seems
to be tapering off (22% over the last 5 years, and 15% in 2017), the numerical increase remains high ($383,831
5-year average, and $391,618 in 2017). Pension liabilities are a common issue among Washington State
government agencies, though the Law Enforcement Officers’ and Fire Fighters’ pensions are adequately
funded.
Budgetary Review
The City of Tumwater operates under GAAP accounting rules (accrual versus cash) and budgets on a 2-year
cycle, while the stand-alone districts are all operated on a cash basis and use one-year budget cycles. TFD is
operated primarily as a department within the City’s General Fund. Repair and replacement for all vehicles
except fire engines are handled in a separate Equipment Rental and Reserve Fund. Debt repayments and
capital projects are also handled under separate funds, as is typical.
The City passed a six-year permanent levy lid lift in 2011 for public safety purposes (fire and police) that
expired in 2018. As a result, the City enjoyed more revenue growth between 2012 and 2018 than it would
have under the I-747 1 percent property tax limitation. Since it was a “permanent” lift, the city will continue
receiving the additional revenues in the future, thus protecting the FTEs that were enabled by this lift. Over
time however, property tax increases will not keep up with inflationary pressures on salaries and expenses.
The money generated by the levy lid lift has been accounted for via a separate “Public Safety Reserve” fund,
which receives the money and transfers it out to other fund departments (General Fund, Debt Service Fund,
Capital Facilities Fund, and Equipment Rental and Replacement Fund) for expenditures. With this revenue,
TFD has hired three firefighters, replaced SCBA gear, renovated two reserve engines, purchased small
equipment, and purchased two new fire engines via the state LOCAL program.
The next figure shows a generally healthy operating surplus, though it must be noted again that overhead
costs are not included in the operating expenditures.
Figure 137: TFD Net Revenues (Deficits)
Net Revenues (Deficits) 2013
Actual 2014
Actual 2015
Actual 2016
Actual 2017
Actual 2018
Budget
Operating Revenues $5,629,004 $6,211,091 $6,096,905 $6,512,165 $7,090,866 $7,276,116
Operating Expenditures $5,414,232 $5,755,213 $6,175,548 $6,214,465 $6,704,078 $7,273,251
Net Revenue (deficit) $214,772 $455,878 $(78,643) $297,700 $386,788 $2,865
Non-Operating Revenues N/A N/A N/A N/A N/A N/A
Non-Op. Expenditures N/A N/A N/A N/A N/A $37,000
Net Revenue (deficit) N/A N/A N/A N/A N/A N/A

Regional Fire & Emergency Services Study City of Tumwater Fire Department
107
Note that Operating Revenues in the above figure assume a $1.50 levy and include SAFER grants, since
associated expenses are included in operating expenses. Non-Operating Expenditures are limited to Capital
Project Fund expenditures. Non-Operating Expenditures for 2018 are estimated.
Forecast
ESCI forecasted TFD’s wages, benefits, and professional services expenditures using a linear growth model,
using six years of data on wages/benefits, and four years for professional services. Supplies, apparatus
maintenance, and interfund expenses are forecast on simple 2.5 percent inflationary growth. Capital
expenses are assumed to be zero, but we did include the $109,740 debt payments for a new engine. On the
revenue side, Medic One revenue forecasts use a linear formula based off the last six years of growth, while
fire inspection fees are assumed to be the average of the past four years. Property tax revenues assume $1.5
per $1,000 AV with 1 percent annual growth plus new construction (except 2020, where construction is held
to $0 in anticipation of a mild recession). Based on this fairly simple model, TFD could see very moderate
deficits in the coming years.
As mentioned, this forecast treats the department as if it were a stand-alone agency; we are making no
forecasts about Tumwater’s actual general fund. The forecast deficits are modest enough to be relatively
easy to manage, and indicate a fairly healthy department going forward. Dangers include capital expenses
that are not forecast in this model, and the potential for inflationary pressures on wage and benefit growth.
Figure 138: TFD Financial Forecast
2019 Projected
2020 Projected
2021 Projected
2022 Projected
2023 Projected
2024 Projected
Operating Revenues $7,623,546 $7,644,713 $7,994,771 $8,344,828 $8,694,886 $9,044,944
Operating Expenditures $7,537,564 $7,865,066 $8,192,775 $8,520,698 $8,848,840 $9,177,205
Net Revenue (deficit) $85,982 $(220,353) $(198,005) $(175,870) $(153,953) $(132,261)
City of Olympia
The City of Olympia’s Fire Department is more than twice the size of TFD, the other city department in our
study, in terms of budget ($16,945,712 in 2017), personnel (101 career), population served (52,170), and land
area served (18.9 square miles). Like TFD, OFD provides fire inspection and ALS services in addition to those
services provided by other agencies.
As indicated in the discussion about interconnections among the studied agencies, Olympia is perhaps the
most connected with other agencies. It provides vehicle repair and maintenance services to all of the studied
agencies via a facility it leases from LFD3, and provides training services to TFD and LFD3. It is additionally
one of three agencies providing ALS via Medic One.

Regional Fire & Emergency Services Study City of Tumwater Fire Department
108
As a city department, OFD does not have a direct connection to its tax revenues. The agency is a department
within the City’s General Fund, as opposed to fire districts wherein the entire General Fund is devoted to the
fire department. Nevertheless, if a $1.50 levy rate were applied to the City’s assessed value, it would accrue
$10.036 million. With the additional $2.709 million Medic One payments the department receives and $2.009
million in other revenues (mostly contract fees), it would conceivably have a total revenue of about $14.754
million.
The City does not allocate overhead expenses within its General Fund, so the department’s operating costs
appear lower than they would if it were a separate agency, making it more difficult to compare. There are a
variety of valid ways to estimate how much of the overhead costs are attributable to the fire department,
and each would likely produce a different result. A simple way is to simply take the total General Fund costs
for the City that are administrative in nature (Legislative, Executive, Finance, HR, IT, Attorney) as a percent
of the total General Fund expenses (about 13.86%) and apply that percentage to the fire department actuals
of $16,945,712 in 2017. This would add an estimated $2,348,000 to the figure, for a total of $19.295 million,
resulting in an operating deficit of $4.5 million. While these are only very rough estimates, the numbers
indicate that changes would need to be made in order for the department to break even as a stand-alone
agency.
It is worth noting that while the overhead estimate is substantial, the amount and quality of financial planning
in OFD is admirable. Also, OFD’s benefits package is more generous than some other fire departments,
including an education benefit (4% additional pay for Bachelor’s degree), longevity (6% for over 25 years),
uniform allowance, deferred compensation (3%), medical, vision, dental, EAP, VEBA, and life.
Over the past five years, the department’s budget has increased on average 5.8 percent per year (32.6%
overall). Some of this growth can be attributed to an average population growth of 1.4 percent per year (7%
overall). The remainder of this growth can be attributed to normal inflationary pressures, particularly in
compensation and benefits.
The City’s fund balances have been growing over the past five years, from $16.8 million in 2013, to $21.1
million in 2017. The City also has a policy to maintain a 10 percent expenditure reserve. In all, the City seems
to be in a robust financial position.
Capital Improvements and Debt
The citizens of Olympia authorized the City to issue general obligation bonds in 2008, which were used to
construct a fourth fire station, a fire training center, and the acquisition of two fully equipped fire engines and
a ladder truck. Annual principal and interest payments are funded by voter approved property tax collections
equal to the current year debt service obligation. Those bonds will expire in 2029, and the outstanding
principal at the end of 2017 came to $10,400,000. Other debt includes $6,372,971 in other post-employment
benefits, and $2,061,048 in pension fund liabilities.

Regional Fire & Emergency Services Study City of Tumwater Fire Department
109
Budgetary Review
The City of Olympia uses GAAP accounting procedures rather than cash-basis accounting like the fire
districts. OFD is operated primarily as a department within the City’s General Fund, but the City has a
separate Fire Equipment Replacement Fund for its apparatuses. Debt repayments and capital projects are
also handled under separate funds, as is typical. Insurance is also handled through a separate fund.
OFD covers about 28 percent of its expenses through contract revenue and other non-tax sources including
grants and fire inspection fees. This is close to the average of all the studied departments (27%), despite its
many interlocal contracts. This may indicate that the interlocal contracts are structured to cover expenses
without generating significant additional revenue.
As noted previously, the next figure shows that as a stand-alone agency, OFD would need to make changes
to operate within its probable resources.
Figure 139: OFD Net Revenues (Deficits)
Net Revenues (Deficits) 2013
Actual 2014
Actual 2015
Actual 2016
Actual 2017
Actual 2018
Budget
Operating Revenues $10,755,165 $11,482,646 $12,293,803 $12,693,304 $14,261,152 $14,891,359
Operating Expenditures $13,358,669 $14,191,563 $14,566,263 $15,582,752 $16,940,712 $17,291,120
Net Revenue (deficit) $(2,603,504) $(2,708,917) $(2,272,460) $(2,889,448) $(2,679,560) $(2,399,761)
Non-Operating Revenues N/A N/A N/A N/A N/A N/A
Non-Op. Expenditures $126,040 $74,508 $689,166 $162,502 $5,000 $590,016
Net Revenue (deficit) N/A N/A N/A N/A N/A N/A
Note that Operating Revenues in the figure assume a $1.50 levy, and include grants since the bulk consists of
SAFER grants, which are used for operating expenses. Non-Operating Expenditures are limited to General
Fund expenditures.
Forecast
ESCI forecasted OFD’s compensation and benefits using a linear growth model, using six years of data.
Supplies and professional services forecasts are based on six-year’s average growth, while fleet costs and
interfund services plus use simple inflation factors. Capital expenditures are maintained at the six-year
average with no growth. On the revenue side, its Medic One forecast uses a linear forecast model while
inspection fee revenue forecasts use six-year average growth (2.3%). Its property tax revenues assume $1.5
per $1,000 AV with 1 percent annual growth plus new construction (except 2020, where construction is held
to $0 in anticipation of a mild recession). Based on this fairly simple model, OFD could see large, but fairly
stable deficits (as a percentage of expenses) in the coming years.
As mentioned, this forecast treats the department as if it were a stand-alone agency; we are making no
forecasts about Olympia’s actual General Fund. The forecasts highlight OFD’s relatively high fire expenses
compared to potential revenues, while also highlighting the fact that the effective deficit is not growing
significantly as a percentage of the operating budget.

Regional Fire & Emergency Services Study City of Tumwater Fire Department
110
Figure 140: OFD Financial Forecast
2019 Projected
2020 Projected
2021 Projected
2022 Projected
2023 Projected
2024 Projected
Operating Revenues $14,776,512 $14,942,455 $15,520,511 $16,211,140 $16,909,119 $17,614,758
Operating Expenditures $18,068,810 $18,932,244 $19,853,745 $20,619,413 $21,423,529 $22,193,196
Net Revenue (deficit) $(3,292,298) $(3,989,789) $(4,333,234) $(4,408,273) $(4,514,410) $(4,578,438)
Lacey Fire District 3
LFD3 is the largest of the studied agencies in terms of population (98,040), assessed value ($10 billion), and
budget ($17.7 million in 2017 actual expenditures), though WTRFA and MBLFD both serve larger geographic
areas. As stated, LFD3 is also slated to see the greatest population growth. Currently, the department is
staffed by 115 career and 28 volunteer firefighters, making it the largest department in terms of staffing as
well.
The district’s $1.50 regular levy provides 77 percent of its revenue ($14 million in 2017), with the bulk of the
remaining revenue coming from its Medic One contract. It does not have an M&O levy. A 2014 six-year
permanent levy lid lift will allow the district to maintain its $1.50 levy through 2021. After this time, we expect
to see the levy rate slowly erode due to the state’s 1 percent maximum levy growth rate. With on-going
expected growth and construction, however, we can expect the district’s property tax revenue to remain
robust for the foreseeable future.
As a basic assessment of the department’s health (see Figure 141), ESCI notes an increasing General Fund
balance that keeps pace as a percent of operating expenses. While it may be acceptable to see an occasional
decline in General Fund balance, a healthy financial situation will generally only show such drops due to one-
time issues such as a major capital expenditure or a temporary funding issue. In this case, fund balance has
generally been increasing. While the 2018 and 2019 budgets show a decrease as a percent of the operating
budget, the level is nevertheless adequate and meets the department’s policy goal to establish and maintain
an adequate Fund Balance of at least 12 percent of the General Fund and supported operating funds.
Figure 141: LFD3 General Fund Balances
2014 Actual
2015 Actual
2016 Actual
2017 Actual
2018 Budget
2019 Budget
Fund Balance $ 2,494,771 $ 2,580,776 $ 3,607,360 $ 3,992,055 $ 3,333,325 $ 3,485,743
Balance as % of Expenses 16% 17% 22% 23% 17% 16%
The department has a history of taking advantage of a variety of grant opportunities, notably staffing for
adequate fire and emergency response (SAFER) grants in past years, though it has no significant grant
sources currently.
As seen in the following figure, the LFD3’s general fund costs have remained consistent over the past seven
years, with the bulk of costs going toward operations.

Regional Fire & Emergency Services Study City of Tumwater Fire Department
111
Figure 142: LFD3 Budget Ratios
2013 Actual
2014 Actual
2015 Actual
2016 Actual
2017 Actual
2018 Budget
2019 Budget
Support Services 9% 8% 8% 8% 8% 10% 10%
Operations 86% 85% 85% 86% 86% 84% 85%
Facilities and Equipment 4% 3% 3% 3% 3% 3% 3%
Executive 1% 2% 1% 2% 2% 1% 2%
Capital Improvements and Debt
LFD3 had four outstanding bonds totaling $11,390,000 at the end of 2017. A $0.119 bond levy supports about
92 percent of the principal and interest payments on this debt; the remainder must be transferred from
General Fund sources. The district carried an additional $1,314,805 in compensated absences (accumulated
sick and vacation leave) and $551,133 in pension liabilities at the end of 2017, with a total debt of $13,255,938.
At the end of 2017, the district’s voters approved an additional $19,115,000 bond for capital equipment and
facilities.
While LFD3’s debt is substantial, the majority is supported by dedicated property tax levies and therefore
does not present a concern. Rather, the district’s voters’ willingness to pay for capital improvements is
encouraging, as is the fact that the district is able to pursue its capital facilities plans.
Budgetary Review
LFD3 operates primarily out of a general fund, but also maintains two bond funds, a donations fund, a reserve
fund, and an equipment repair and replacement fund. The additional funds, while good accounting and
budgeting practice, are inconsequential for our review.
As previously mentioned, the bulk of LFD3’s non-tax revenue comes through its Medic One contract—in 2017,
this amounted to $3.7 million which was 20 percent of total revenues and 88 percent of non-tax revenues.
While the trend line for this revenue source is distinctly positive (up 34% from 2013–2017), it is highly variable
with 2015 and 2017 revenues lower than previous that of 2014 and 2016, respectively.
In reviewing the budget history, we noted no peculiarities or ballooning costs that would attract special
attention. While most expense categories show significant increases, we recognize that the department has
also grown.
The next figure indicates the district is budgeting within its means on both an operating and capital level.

Regional Fire & Emergency Services Study City of Tumwater Fire Department
112
Figure 143: LFD3 Net Revenues (Deficits)
Net Revenues (Deficits)
2014 Actual
2015 Actual
2016 Actual
2017 Actual
2018 Budget
2019 Budget
Operating Revenues $15,651,437 $16,522,807 $17,185,948 $18,184,725 $20,328,408 $22,056,821
Op. Expenditures $15,114,849 $15,503,767 $16,490,151 $ 7,655,453 $20,062,762 $22,002,695
Net Revenue (deficit) $ 536,587 $ 1,019,040 $ 695,797 $ 529,273 $ 265,646 $54,126
Non-Operating Sources $ 1,394,884 $ 1,421,756 $ 1,297,516 $ 916,481 $11,434,928 $ 8,804,781
Non-Operating Uses $ 1,076,255 $ 1,035,520 $ 1,165,525 $ 779,452 $ 4,136,913 $ 8,169,898
Net Revenue (deficit) $ 318,629 $ 386,236 $ 131,991 $ 137,029 $ 7,298,015 $ 634,883
Note that Operating Revenues in the above figure include grants since the bulk consists of SAFER grants,
which are used for operating expenses.
Forecast
ESCI forecasted LFD3’s compensation, benefits, professional services, and fleet costs using a linear growth
model, using seven years of data. Supplies were forecast using a three-year average in 2020, then a linear
model. Capital and interfund transfers were forecast using a five-year average without growth. On the
revenue side, its Medic One and other contract revenue forecasts use a linear growth formula based on five-
years data (2013–2017). Its property tax revenues assume $1.5 per $1,000 AV with 1 percent annual growth
plus new construction (except 2020, where construction is held to $0 in anticipation of a mild recession).
Based on this fairly simple model, LFD3 could see increasing and substantial deficits in the coming years.
It is important to note that the manner of the property tax forecasts is a key component, and that a linear
growth model results in substantially higher tax revenues and much more moderate deficits in 2022, 2023,
and 2024 ($91,000, $345,000, and $445,000). ESCI chose the lower forecast to be conservative and consistent
with other forecasts. The results highlight LFD3’s dependence on property tax revenues and also reflect the
continued problem of a structural imbalance in Washington State where revenue growth is more tightly
controlled than inflationary pressures on expenses. They also point to a potential need to curtail the growth
of expenditures.
Figure 144: LFD3 Expenditure Forecast
Net Revenues (Deficits) 2019
Budget 2020
Projected 2021
Projected 2022
Projected 2023
Projected 2024
Projected
Operating Revenues $22,056,821 $22,389,847 $23,244,371 $24,153,464 $25,118,572 $26,141,403
Operating Expenditures $22,002,695 $22,419,591 $23,976,985 $25,675,109 $27,270,080 $28,716,756
Net Revenue (deficit) $54,126 $(29,745) $(732,614) $(1,521,645) $(2,151,508) $(2,575,354)
Beginning Fund Balance $4,069,618 $3,768,744 $3,423,400 $2,375,187 $537,944 ($1,929,163)

Regional Fire & Emergency Services Study City of Tumwater Fire Department
113
West Thurston Regional Fire Authority
Incorporated in 2010 as a combination of two rural districts (#1 and #11), WTRFA is by far the largest of the
studied agencies in terms of size—at 168 square miles it is twice the size of the next largest, MBLFD. At the
same time, it is the second smallest in terms of population. Like MBLFD, the other regional agency in this
study, WTRFA is dependent on volunteer firefighters to provide its services. Currently, the department is
staffed by 42 career and 57 volunteer firefighters.
WTRFA suffered the Great Recession perhaps more than some of its fellow agencies in that its property tax
revenues did not recover to their 2009 numerical levels until the voters approved a one-year M&O levy in
2015. As pointed out by the authority, during the 2013–2017 period the cost of goods and services rose sharply
and the demand for services increased 16 percent.
Like other agencies, WTRFA operates primarily off property taxes, which totaled $3.9 million and made up
73 percent of its 2017 revenues. The downturn in tax revenues was therefore particularly difficult for the
authority. In 2016, the authority again asked for M&O levies, only this time for three years (2017–2019). This
additional revenue has helped to bolster their finances, and has enabled them to hire additional firefighters.
Still, if they are not able to renew their levies in 2020 as planned they will again face budget shortfalls.
Alternatively, it is possible that they may succeed in passing a levy in one district, but not the other. This
would also result in budget shortfalls, and most likely would result in lop-sided service. WTRFA has the ability
to run three-year levies under the old districts, but only a one-year levy as a regional fire authority.
Together, the regular levy ($1.50), M&O levies (combined about $0.67), and bond levies (combined about
$0.39) made a total levy rate of about $2.56 in 2017. This is a relatively high tax burden for a fire agency; it
was 28 percent higher than that of MBLFD, which had the next highest rate among the studied agencies at
$2.00. While we focus on 2017 for the purposes of this study, it is worth noting that the 2018 combined levy
rates have decreased to $2.41 due to increasing property values.
These property tax challenges, especially the fact that they had no M&O levy in 2016, help explain the
performance of the WTRFA’s fund balances (see Figure 145). This figure shows large changes in fund
balance—usually indicators of an institution facing serious financial challenges. In this case these concerns
are resolved by the fact that the M&O levy will continue through 2019, likely continuing the positive trend in
the fund balance. Given past voter support and continued operational successes, it seems likely that WTRFA
will maintain a healthy financial situation for the foreseeable future.
In 2004, Fire Districts #1 and #11 (which today comprise WTRFA) and Fire Districts #5 and #9 (which today
comprise MBLFD) formed the West Thurston Fire & Life Safety Consortium to “improve service, efficiency
and economy by cooperating in the provision of emergency services in western Thurston County.” The
consortium is an independent agency and charges WTRFA and MBLFD fees to cover its costs.

Regional Fire & Emergency Services Study City of Tumwater Fire Department
114
Figure 145: WTRFA General Fund Balances
Capital Improvements and Debt
The authority has two outstanding bonds (one each for Districts #1 and #11) totaling $3,725,000. Both are
supported by levies, which together support about 85 percent of the debt payments. The remainder of the
payments (about $128,000 in 2017) must be supported by the General Fund. The District #1 bond liability was
$1,450,000 at the end of 2017 and will expire at the end of 2020. The District #11 bond liability was $2,275,000
at the end of 2017 and will expire at the end of 2025. Additionally, WTRFA had a pension fund liability of
$86,892 and compensated absences totaling $122,513 (2016 figure). These debts are well within norms and
do not present a concern. In 2016, the authority purchased capital equipment totaling $348,078 using General
Fund sources (this also helps explain the decrease in fund balance that year), and in 2017, WTFRA purchased
an additional $225,672 through the General Fund.
Budgetary Review
WTRFA maintains a General Fund, Bond Debt Service Fund, and a Capital Projects fund. Additionally, they
have two management funds subsidiary to the General Fund: A Volunteer Recruitment and Retention Fund
used to track FEMA grants, and an Emergency Reserve Fund. The Capital Projects fund has recently been
dormant as they have made their capital purchases through the General Fund. The existence of the
Emergency Reserve Fund is a particularly good financial strategy.
As previously discussed, the bulk of WTRFA’s funding is based on property tax revenue. The authority actively
seeks to bolster its tax revenue with grants, contracts, BLS transportation services, and facility leases.
WTFRA brought in roughly $669,000 from tribal contracts for service and BLS transportation in 2017, or
about 12 percent of their total revenue. They also recovered almost $162,000 in mobilization fees in 2017,
and in 2018 they expected a $191,000 SAFER grant.
$3,600,026 $3,587,122 $3,539,596
$4,713,635
$3,820,992
$4,231,048
$1,500,000
$2,000,000
$2,500,000
$3,000,000
$3,500,000
$4,000,000
$4,500,000
$5,000,000
2013Actual
2014Actual
2015Actual
2016Actual
2017Actual
2018Budget

Regional Fire & Emergency Services Study City of Tumwater Fire Department
115
In reviewing the budget history, we noted no peculiarities or ballooning costs that would attract special
attention. Aside from capital purchases, almost all of the expense growth can be attributed to compensation
and benefits. This matches a planned increase in staffing that coincided with the passage of the O&M levies.
The next figure indicates the authority is budgeting within its means on both an operating and capital level.
Figure 146: WTRFA Net Revenues (Deficits)
Net Revenues (Deficits) 2013
Actual 2014
Actual 2015
Actual 2016
Actual 2017
Actual 2018
Budget
Operating Revenues $3,221,953 $3,538,467 $4,250,493 $4,054,935 $5,532,020 $5,309,383
Operating Expenditures $3,216,401 $3,509,297 $3,605,436 $3,883,340 $4,491,789 $5,609,918
Net Revenue (deficit) $ 5,553 $ 29,170 $ 645,057 $ 171,595 $1,040,232 $(300,535)
Non-Operating Sources $1,490,163 $5,517,605 $1,638,940 $1,115,446 $1,251,150 $1,348,476
Non-Operating Expenditures $ 615,020 $4,656,091 $1,401,382 $1,171,521 $1,466,959 $1,073,028
Net Revenue (deficit) $ 875,143 $ 861,514 $ 237,558 $ (56,074) $(215,810) $ 275,449
Note that Operating Revenues in the figure include grants since the bulk consists of SAFER grants, which are
used for operating expenses.
Forecast
ESCI forecasted WTRFA’s compensation, benefits, and supplies using six-year average growth, while
professional services and fleet costs used a linear growth model on six years of data. Capital and interfund
transfers were forecast using a six- and three-year averages, respectively, without growth. On the revenue
side, its Medic One and other contract revenue forecasts use a linear growth formula based on six-years data.
Its property tax revenues assume $2.51 per $1,000 AV (includes $0.0569 combined M&O levies) with 1
percent annual growth plus new construction (except 2020, where construction is held to $0 in anticipation
of a mild recession). Based on this fairly simple model, WTRFA could see increasing and substantial deficits
in the coming years.
It is important to note that the manner of the property tax forecasts is a key component, and that a linear
growth model results substantially higher tax revenues and more moderate deficits (growing from $745,000
in 2019, to $2.6 million in 2024). ESCI chose the lower forecast to be conservative and consistent with other
forecasts. The results highlight WTFRA’s dependence on property tax revenues and also reflect the continued
problem of a structural imbalance in Washington State where revenue growth is more tightly controlled than
inflationary pressures on expenses. They also point to a potential need to curtail the growth of expenditures.

Regional Fire & Emergency Services Study City of Tumwater Fire Department
116
Figure 147: WTFRA Financial Forecast
2019
Projected 2020
Projected 2021
Projected 2022
Projected 2023
Projected 2024
Projected
Operating Revenues $5,235,828 $5,261,602 $5,369,702 $5,463,268 $5,597,793 $5,750,370
Operating Expenditures $6,183,521 $6,834,850 $7,499,527 $8,189,089 $8,897,607 $9,808,403
Net Revenue (deficit) $(947,693) $(1,573,248) $(2,129,825) $(2,725,821) $(3,299,815) $(4,058,033)
Beginning Balance $4,404,282 $3,837,728 $2,615,564 $826,894 $(1,537,679) $(4,486,365)
McLane/Black Lake Fire District
In January 2008, McLane Fire and Life Safety (District #9) entered into a contractual consolidation with Black
Lake Fire Department (District #5). The consolidation provided the opportunity to reduce administrative
positions and enjoy economies of scale for purchasing.
While MBLFD covers about one-half the geographic area as WTRFA and has about 71 percent of the
population (16,190 versus 22,710), the assessed value is slightly higher. This gives them more ability to raise
funds if needed, though their total 2017 property tax was 12 percent less. Their 2017 General Fund budget of
$4.9 million is about 18 percent less than that of WTRFA. Currently, the department is staffed by 15 career
and 52 volunteer firefighters.
MBLFD is the most dependent on volunteer firefighters to provide service of the studied agencies; 78 percent
of its firefighters are volunteer, while 58 percent of those in WTRFA are volunteer, and 60 percent of those in
EOFD are volunteer.
MBLFD is also among the most dependent on property taxes, which support 82 percent of its expenditures;
only EOFD is higher, with property taxes supporting 86 percent of expenditures. As discussed elsewhere,
property taxes are generally stable and reliable except in extreme situations such as the Great Recession.
One major down-side to this situation is that it can be difficult to raise additional funds if needed since
anything beyond the 1 percent annual increase requires a public vote.
Perhaps to disprove the previous comment, in 2015 Fire Districts #5 and #9 each passed four-year M&O
levies, effective from 2016 through 2019. The purpose of the levies is to “provide sufficient funds to maintain
essential staffing from 2016–2019, to pay regular maintenance and operation costs and provide for future
Capital equipment, maintenance, and operation needs.” Together, in 2017, they added an additional
$404,524 to the consolidated district’s revenue stream.
Another way they supplement their property tax income is through BLS transportation revenue. Both MBLFD
and WTRFA use the company “Systems Design” for their billing services. This costs MBLFD on average 6.5
percent of their gross revenue. While there is wide variation in revenues on a given year from this service, as
low as $119,000 in 2016, and as high as $217,000 in 2014, the 10-year and 5-year average revenue is almost
the same at about $183,000. This should hopefully increase in the future since the board raised the rate by 36
percent in 2018. These revenues are dedicated to the EMS and Apparatus Replacement Fund.

Regional Fire & Emergency Services Study City of Tumwater Fire Department
117
MBLFD also charges for public safety or emergency incidents via Resolution 16-492, defined as false alarms,
hazmat incidents, illegal fires, rescue emergencies, utility line failures, motor vehicle accidents, and
emergency medical responses. Billing via E&F Recovery, the district recovered $16,374 in 2017.
As a basic measure of financial health, MBLFD has a somewhat erratic combined general fund and reserve
balance (see Figure 148). While mildly concerning, this is bolstered by a policy of maintaining a cash reserve
equal to 75 percent of its potential annual revenue. As with WTRFA, failure to renew its M&O levy could cause
significant strain on the District’s budget.
Figure 148: MBLFD General Fund and Reserve Balances
The main concern for MBLFD is the loss of its South Puget Sound Community College Fire and Emergency
Services Technology (FEST) program in late 2019. This program currently provides MBLFD with many of its
volunteer staff, and its loss will result in staffing challenges. The district foresees the necessity of an increase
in its M&O Levy to provide an additional eight career personnel. While there is room in their levy capacity
(the current rate is $0.20), there is no guarantee that the voters will approve the increase.
Capital Improvements and Debt
The consolidated district has four outstanding bonds, two voted and two non-voted, as follows (Figure 149).
Figure 149: MBLFD Outstanding Bonds
2017 Outstanding Bonds
Remaining Principal Bond Levy Rates Expiration
Voted Non-
Voted Voted
Non-Voted
Voted Non-
Voted
District 9 $3,745,000 $1,170,000 0.305 0.097 2024 2026
District 5 $1,000,000 $190,000 0.265 0.029 2022 2026
$2,385,370
$2,542,058
$2,435,215
$2,487,512
$2,214,654
$2,000,000
$2,100,000
$2,200,000
$2,300,000
$2,400,000
$2,500,000
$2,600,000
2014Actual
2015Actual
2016Actual
2017Actual
2018Budget
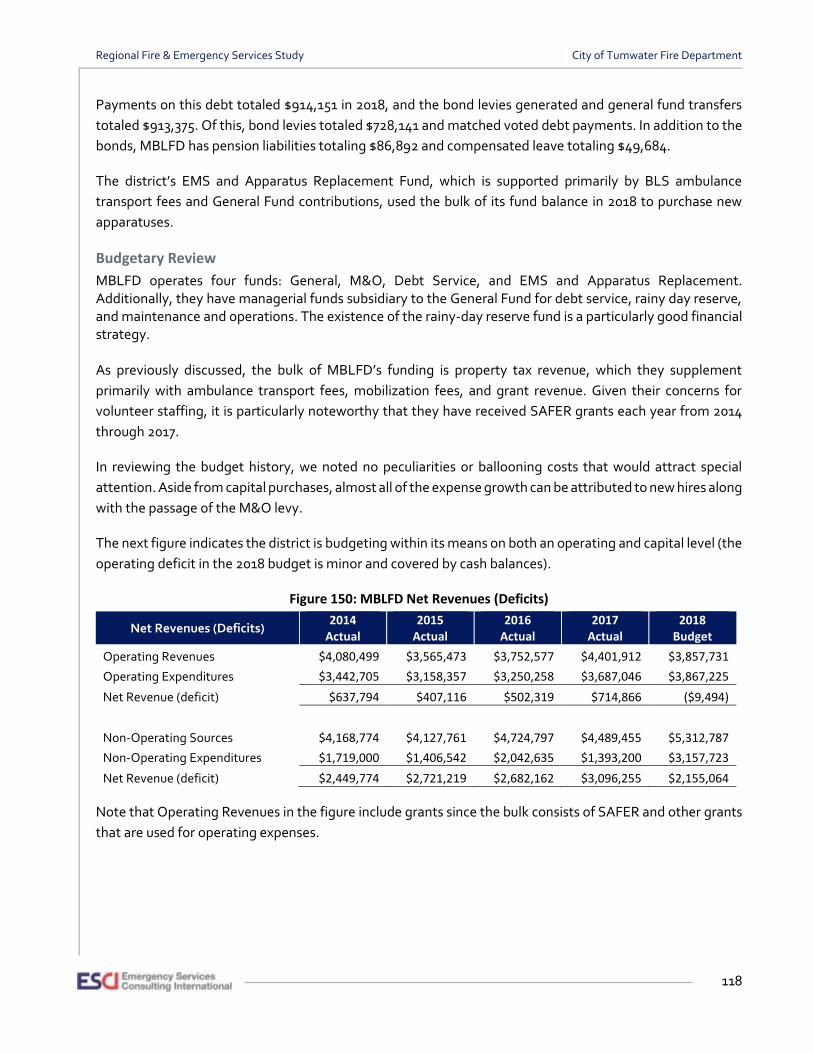
Regional Fire & Emergency Services Study City of Tumwater Fire Department
118
Payments on this debt totaled $914,151 in 2018, and the bond levies generated and general fund transfers
totaled $913,375. Of this, bond levies totaled $728,141 and matched voted debt payments. In addition to the
bonds, MBLFD has pension liabilities totaling $86,892 and compensated leave totaling $49,684.
The district’s EMS and Apparatus Replacement Fund, which is supported primarily by BLS ambulance
transport fees and General Fund contributions, used the bulk of its fund balance in 2018 to purchase new
apparatuses.
Budgetary Review
MBLFD operates four funds: General, M&O, Debt Service, and EMS and Apparatus Replacement. Additionally, they have managerial funds subsidiary to the General Fund for debt service, rainy day reserve, and maintenance and operations. The existence of the rainy-day reserve fund is a particularly good financial strategy. As previously discussed, the bulk of MBLFD’s funding is property tax revenue, which they supplement
primarily with ambulance transport fees, mobilization fees, and grant revenue. Given their concerns for
volunteer staffing, it is particularly noteworthy that they have received SAFER grants each year from 2014
through 2017.
In reviewing the budget history, we noted no peculiarities or ballooning costs that would attract special
attention. Aside from capital purchases, almost all of the expense growth can be attributed to new hires along
with the passage of the M&O levy.
The next figure indicates the district is budgeting within its means on both an operating and capital level (the
operating deficit in the 2018 budget is minor and covered by cash balances).
Figure 150: MBLFD Net Revenues (Deficits)
Net Revenues (Deficits) 2014
Actual 2015
Actual 2016
Actual 2017
Actual 2018
Budget
Operating Revenues $4,080,499 $3,565,473 $3,752,577 $4,401,912 $3,857,731
Operating Expenditures $3,442,705 $3,158,357 $3,250,258 $3,687,046 $3,867,225
Net Revenue (deficit) $637,794 $407,116 $502,319 $714,866 ($9,494)
Non-Operating Sources $4,168,774 $4,127,761 $4,724,797 $4,489,455 $5,312,787
Non-Operating Expenditures $1,719,000 $1,406,542 $2,042,635 $1,393,200 $3,157,723
Net Revenue (deficit) $2,449,774 $2,721,219 $2,682,162 $3,096,255 $2,155,064
Note that Operating Revenues in the figure include grants since the bulk consists of SAFER and other grants
that are used for operating expenses.
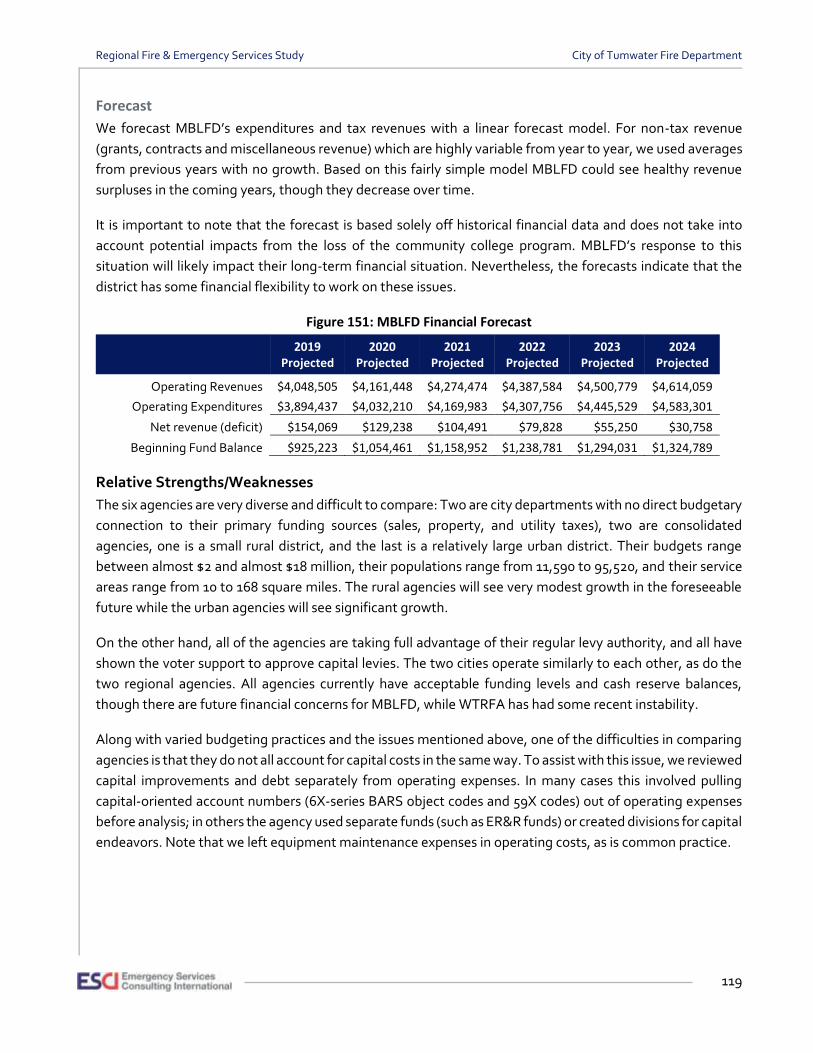
Regional Fire & Emergency Services Study City of Tumwater Fire Department
119
Forecast
We forecast MBLFD’s expenditures and tax revenues with a linear forecast model. For non-tax revenue
(grants, contracts and miscellaneous revenue) which are highly variable from year to year, we used averages
from previous years with no growth. Based on this fairly simple model MBLFD could see healthy revenue
surpluses in the coming years, though they decrease over time.
It is important to note that the forecast is based solely off historical financial data and does not take into
account potential impacts from the loss of the community college program. MBLFD’s response to this
situation will likely impact their long-term financial situation. Nevertheless, the forecasts indicate that the
district has some financial flexibility to work on these issues.
Figure 151: MBLFD Financial Forecast
2019 Projected
2020 Projected
2021 Projected
2022 Projected
2023 Projected
2024 Projected
Operating Revenues $4,048,505 $4,161,448 $4,274,474 $4,387,584 $4,500,779 $4,614,059
Operating Expenditures $3,894,437 $4,032,210 $4,169,983 $4,307,756 $4,445,529 $4,583,301
Net revenue (deficit) $154,069 $129,238 $104,491 $79,828 $55,250 $30,758
Beginning Fund Balance $925,223 $1,054,461 $1,158,952 $1,238,781 $1,294,031 $1,324,789
Relative Strengths/Weaknesses
The six agencies are very diverse and difficult to compare: Two are city departments with no direct budgetary
connection to their primary funding sources (sales, property, and utility taxes), two are consolidated
agencies, one is a small rural district, and the last is a relatively large urban district. Their budgets range
between almost $2 and almost $18 million, their populations range from 11,590 to 95,520, and their service
areas range from 10 to 168 square miles. The rural agencies will see very modest growth in the foreseeable
future while the urban agencies will see significant growth.
On the other hand, all of the agencies are taking full advantage of their regular levy authority, and all have
shown the voter support to approve capital levies. The two cities operate similarly to each other, as do the
two regional agencies. All agencies currently have acceptable funding levels and cash reserve balances,
though there are future financial concerns for MBLFD, while WTRFA has had some recent instability.
Along with varied budgeting practices and the issues mentioned above, one of the difficulties in comparing
agencies is that they do not all account for capital costs in the same way. To assist with this issue, we reviewed
capital improvements and debt separately from operating expenses. In many cases this involved pulling
capital-oriented account numbers (6X-series BARS object codes and 59X codes) out of operating expenses
before analysis; in others the agency used separate funds (such as ER&R funds) or created divisions for capital
endeavors. Note that we left equipment maintenance expenses in operating costs, as is common practice.

Regional Fire & Emergency Services Study City of Tumwater Fire Department
120
One of the more striking differences among the agencies is the prospect of growth (Figure 153). The
Washington State Growth Management Act (GMA) works to concentrate development within urban areas –
the Cities of Lacey, Olympia, and Tumwater. Of those cities, Lacey and Olympia have the most land capacity
for residential growth and are projected to grow their employment base the most. Lacey in particular has
seen significant residential growth over the past 30 years. Those two fire departments will likewise face the
greatest growth pressures, with rising operational expenses and need for new capital facilities and
equipment. Since property tax revenues generated by new construction generally keep pace with the
associated increased operational expenses, this should not be a concern for combined departments.
Conversely, capital costs usually exceed regular tax levy income and are instead normally funded through
bonds. The issue with this is that bonds would be assessed across an enlarged agency and borne by all
taxpayers, regardless of their proximity to the growth. The two figures which follow (Figure 152 and Figure
153) exemplify the commercial and population growth differences among the agencies.
Figure 152: Cost per Person and Firefighters/1,000 Population
0.00
0.50
1.00
1.50
2.00
2.50
3.00
3.50
4.00
4.50
5.00
$0
$50
$100
$150
$200
$250
$300
$350
Average TFD OFD LFD3 EOFD WTRFA MBLFD

Regional Fire & Emergency Services Study City of Tumwater Fire Department
121
Figure 153: Fire Agency Population Projections
Figure 154: Commercial Permits (Net Sq. Ft.), 2013–2017
Another striking set of differences are cost comparisons against the size of populations (Figure 153). It is not
surprising to see higher costs in the two cities, since cities are traditionally better funded. LFD3 has by far the
lowest cost per person, but they also have by far the fewest firefighters per 1,000 residents. LFD3 is also more
reliant on volunteers than the other two urban departments (TFD and OFD).
10,000
30,000
50,000
70,000
90,000
110,000
130,000
2010 2013 2014 2015 2016 2017 2018 2020 2025 2030 2035 2040
OFD TFD LFD3 EOFD MBLFA WTRFA
0
200,000
400,000
600,000
800,000
1,000,000
1,200,000
1,400,000
1,600,000
EOFD LFD3 MBLFD OFD TFD WTRFA

Regional Fire & Emergency Services Study City of Tumwater Fire Department
122
Average compensation and benefits (Figure 155) helps explain differences in the cost per person (Figure 152)
and gives an indication of potential culture or budgets difficulties when agencies merge. For example, by
looking at Figure 155, one might assume that firefighters in Olympia may be hesitant to transfer to another
agency with lower compensation and benefit packages. The large differences among the agencies in average
compensation and benefits is not surprising since half are staffed primarily by volunteers and half primarily
by career firefighters. Note that this figure only shows gross averages and does not indicate whether the data
swings on the pay and benefits of certain classes of employees.
A final figure that gives an indication of the department’s relative ability to fund their services is tax revenue
per person, since population has the greatest impact on a department’s expenses. That said, other factors
such as geographic size can have a significant impact as well, so this figure should not be over-emphasized.
The two municipal departments are shaded green to highlight the fact that they are estimated as if they were
independent districts levying a $1.50 assessment.
Figure 155: Average Compensation and Benefits
In recent years, each agency has successfully petitioned voters for several tax increases:
• WTRFA—Districts #1 and #11 passed a 3-year M&O levy in 2016.
• MBLFD—both Districts #5 and #9 passed 4-year M&O levies in 2015.
• LFD3—passed a $20 million bond in 2017, and a permanent levy lid lift in 2014.
• TFD—the City of Tumwater passed a permanent levy lid lift in 2011.
• EOFD—passed a $2 million bond in 2016.
• OFD—passed a $10.4 million bond in 2008.
$0
$20,000
$40,000
$60,000
$80,000
$100,000
$120,000
$140,000
$160,000
Average TFD OFD LFD3 EOFD WTRFA MBLFD

Regional Fire & Emergency Services Study City of Tumwater Fire Department
123
Figure 156: Tax Revenue Per Person
These successful initiatives indicate a broad level of voter support for the needs of local fire/EMS agencies.
Such good will should make consolidations easier and should hopefully even be strengthened by
administrations’ continued efforts to find efficiencies and opportunities for service improvement.
$0.00
$50.00
$100.00
$150.00
$200.00
$250.00
Average TFD OFD LFD3 EOFD WTRFA MBLFD

Regional Fire & Emergency Services Study City of Tumwater Fire Department
124
OVERVIEW OF COMMUNITY RISK FACTORS & DEMOGRAPHICS
Community Risk Factors This section analyzes risks that are present within the study area that potentially threaten people and
property. These risks are identified to assist the study area agencies in planning where to locate response
resources in the types and numbers necessary to effectively respond to likely emergencies. While not all
hazards of individual occupancies can be considered—that is beyond the scope of the study—there are risks
that seem to be relevant to the area. It is recommended that the departments be aware of and rate the hazard
and risks in terms of frequency and severity within the jurisdiction.
The following figure is one sample method of identifying and analyzing risks within a community.
Figure 157: Risk Identification and Analysis Process1
Step Action
Hazard Identification Identify hazards.
What is the probability this hazard will occur?
Is this hazard a significant threat to your jurisdiction?
Approximately how often does this hazard occur in your jurisdiction?
Vulnerability Assessment For each hazard identified in the hazard identification process, consider each of the five factors.
Factor 1: Danger/Destruction/Personal harm Factor 2: Economic Impacts Factor 3: Environmental impacts Factor 4: Social Impacts Factor 5: Political considerations
Score the vulnerability from this hazard.
Reconsider priority of each hazard based on vulnerability.
Risk Rating Score Risk Rating = Probability2 X Vulnerability2 1 Adapted from the Community Risk Reduction Model, United States Fire Administration, National Fire Academy 2 Probability and Vulnerability are rated as 3 = High, 2 = Moderate, 1 = Low
The fire service assesses the relative risk of properties based on several factors: the service area population
and population density, the demographics of the population, local land use and development, and the
geography and natural risks present within the community. These factors affect the number and type of
resources (both personnel and apparatus) necessary to mitigate an emergency. Properties with high fire and
life risk often require greater numbers of personnel and apparatus. Therefore, staffing and deployment
decisions should be made with consideration to the level of risk within geographic sub-areas of a community.
Overall Geospatial Characteristics
The following community risk assessment has been developed based on intended land uses as described in
the zoning designations of the respective jurisdictions. The following figure translates zoning to categories
of relative fire and life risk.

Regional Fire & Emergency Services Study City of Tumwater Fire Department
125
Figure 158: Translation of Zoning to Relative Risk Categories
Relative Risk Category Zoning
Low Risk Areas zoned and used for agricultural purposes, open space, and very low-density residential use.
Moderate Risk Areas zoned for medium-density single family properties, small commercial and office uses, low-intensity retail sales, and equivalently sized business activities.
High Risk Areas zoned for Higher-intensity business districts, mixed use areas, high-density residential, industrial, warehousing, and large mercantile centers.
The following figure illustrates the zoning for the departments in the study area.
Figure 159: Fire and Life Safety Risk Based on Zoning, Study Area

Regional Fire & Emergency Services Study City of Tumwater Fire Department
126
Geographic and Weather-Related Risks The number and frequency of federal disaster declarations affecting Thurston County paints a picture of the
risks that natural hazards pose to the region. The following statistics highlight the frequency of major natural
disaster in Thurston County:19
• Between 1965 and 2016, Thurston County has received 22 federal disaster declarations.
• Only 147 counties or U.S. Census designated places have received 20 or more federal disaster
declarations; only four percent of counties or U.S. places share this distinction.
• As of 2016, eight counties in Washington State have experienced 20 or more disaster declarations.
Thurston County and Wahkiakum County are tied for having the 5th highest rate of declarations in
the state.
The next figure is a summary of federal disaster declarations.
Figure 160: Summary of Federal Disaster Declarations in Thurston County by Type, 1965 to 2016
From a planning perspective, there are several weather-related risks of concern to the study area as noted in
the previous figure. Severe storms can include lighting strikes and tornadoes.
19 Retrieved from https://www.trpc.org/DocumentCenter/View/4170/HazMit_Ch-4_RiskAssessment?bidId=.

Regional Fire & Emergency Services Study City of Tumwater Fire Department
127
Weather Risks
The climate for Thurston County is like that found across the state of Washington. Thurston County gets 49
inches of rain, on average, per year. The U.S. average is 39 inches of rain per year. Thurston County averages
9 inches of snow per year—the U.S. average is 26 inches of snow per year. The average annual temperatures
range from a high of 76°F in July to a low of 35°F in January—with the average temperature being 71°F.20
Flood Risk
There are various risks associated with flooding. It is essential therefore that the community in the area of
flood zones and areas prone should be informed of the risks. Before the flood and as part of the planning
process, the departments in the study area must consider station location and relocations as they relate to
flood zones. Further this should be a part of the public education process to ensure that residents are aware
of the risks associated with flooding and the actions they should take to ensure readiness.
During a flooding event, the fire department will be called upon to assist in evacuations and rescues. These
evacuations may include facilities with large numbers of people requiring EMS resources. Rescue and
emergency evacuations may involve moving water requiring the specialty trained technical rescue team to
intervene.
After a flood as the residents begin recovery, EMS-related incidents will increase as injuries and medical
conditions occur. Public education can help the community prepare for the recovery process.
The Thurston County hazards mitigation plan addresses four principal sources floods. These four sources are
summarized and defined in the next figure.
20 Retrieved from https://www.bestplaces.net/climate/county/washington/thurston

Regional Fire & Emergency Services Study City of Tumwater Fire Department
128
Figure 161: Sources of Flooding Thurston County21
Source of Flood Description
Riverine (river and stream)
Riverine flooding occurs when excess flow and volume of water crests a river channel’s normal capacity. Floodwaters consequently inundate areas within the river’s floodway, flood plain, and other low-lying areas that may not be mapped as flood hazard areas.
Groundwater Groundwater flooding occurs when there is a high-water table and persistent heavy rains in an area where an upper, thin layer of permeable soils overlays an impermeable layer of hard pan.
Tidal
Spring tides, the highest tides during any month, occur with each full and new moon. When these coincide with a northerly wind piling water in south Puget Sound, tidal flooding can occur. Tidal flooding can also occur without the effect of storm surge.
Urban
Urban flooding occurs when excess precipitation is not readily absorbed by the ground and stormwater runoff exceeds the ability of stormwater facilities’ capacity to safely convey and divert water within suburban and urban environments. As a result, streets, parking lots, homes, and businesses may experience localized flooding.
The next figure illustrates the Flood Zones in Thurston County. There are areas with the risk of flooding in
each district. For the most part, the areas that are flood prone have a one-percent increase of annual flooding.
There are small portions of the study area that include a 0.2 percent annual chance of flooding.
21 Retrieved from https://www.trpc.org/DocumentCenter/View/4170/HazMit_Ch-4_RiskAssessment?bidId=

Regional Fire & Emergency Services Study City of Tumwater Fire Department
129
Figure 162: Flood Zones in The Study Area
The next figure is a summary of potential flooding risk within the study area.

Regional Fire & Emergency Services Study City of Tumwater Fire Department
130
Figure 163: Flood Hazard Areas by Jurisdiction22
Fire Department/District Total Acres
1% Flood Chance in
Hazard Area
0.2% Flood Chance in
Hazard Area
High Ground
Water in Hazard
Area
Any Flood Hazard in
Hazard Area
Olympia Fire Department1 15,976 7.8% 0.1% 7.5% 13.4%
Tumwater Fire Department1 14,229 7.5% 2.3% 16.8% 23.5%
West Thurston Regional Fire Authority
100,131 11.5% 1.1% 9.6% 20.0%
Lacey Fire District 36,820 12.5% 3.0% 6.1% 19.7%
McLane/Black Lake District 51,828 5.3 % 0.2% 1.6% 6.8%
East Olympia District 19,677 12.3% 0.8% 11.1% 20.6% 1 Includes Urban Growth Area
Tornados
Tornadoes can have winds of over 300 mph which—at the higher ranges—will cause a significant threat to
life and damage to property. The intensity of tornados is measured on the Fujita Tornado Damage Scale. This
scale has an intensity range for tornadoes from F0 to F5 including wind estimates. The next figure is a
summary of the damage associated at the various levels.
22 Retrieved from https://www.trpc.org/DocumentCenter/View/4170/HazMit_Ch-4_RiskAssessment?bidId=.

Regional Fire & Emergency Services Study City of Tumwater Fire Department
131
Figure 164: Tornado Intensity, Enhanced Fujita Scale
Designation Wind Speed, mph Typical Damage23
EF-0 65–85
Minor or no damage. Peels surface off some roofs; some damage to gutters or siding; branches broken off trees; shallow-rooted trees pushed over. Confirmed tornadoes with no reported damage (i.e., those that remain in open fields) are always rated EF0.
EF-1 86–110 Moderate damage. Roofs severely stripped; mobile homes overturned or badly damaged; loss of exterior doors; windows and other glass broken.
EF-2 111–135 Considerable damage. Roofs torn off well-constructed houses; foundations of frame homes shifted; mobile homes completely destroyed; large trees snapped or uprooted; light-object missiles generated; cars lifted off ground.
EF-3 136–165
Severe damage. Entire stories of well-constructed houses destroyed; severe damage to large buildings such as shopping malls; trains overturned; trees debarked; heavy cars lifted off the ground and thrown; structures with weak foundations are badly damaged.
EF-4 166–200 Devastating damage. Well-constructed and whole frame houses completely leveled; cars and other large objects thrown and small missiles generated.
EF-5 > 200
Extreme damage. Strong-framed, well-built houses leveled off foundations are swept away; steel-reinforced concrete structures are critically damaged; tall buildings collapse or have severe structural deformations; some cars, trucks, and train cars can be thrown approximately 1 mile (1.6 km).
While ranges of winds are listed on the scale, the wind estimate is not exact—nor have they been verified in
science or engineering. Different wind speeds may cause similar-looking damage from place to place—even
from building to building.
While preventing tornadoes is not possible, being prepared for the potential of tornado should be considered
as a high priority. Tornadoes can occur with little or no warning and can result in devastating damage,
departments must consider that as part of their planning for disaster readiness.
Additional Weather-Related Hazards
Severe weather hazards also pose a threat to the study area departments and the County. Aside from the
weather-related the hazards described in the preceding section several other weather-related events have
been analyzed as part of the hazard mitigation plan. The next figure—while applicable to the whole County—
is a summary of these events including the definitions, severities and impacts.
23 Wikipedia. Retrieved from: https://en.wikipedia.org/wiki/Enhanced_Fujita_scale

Regional Fire & Emergency Services Study City of Tumwater Fire Department
132
Figure 165: Other Weather-Related Hazards in Thurston County24
Event Description
Definition Severity Impacts
High Winds
The National Weather Service defines high winds as “sustained wind speeds of 40 mph or greater lasting for one hour or longer, or winds of 58 mph or greater for any duration.”
The entire county is directly or indirectly susceptible to the effects of high-speed winds. Trees are susceptible to blowing over and causing damage to surrounding property. All communities can suffer extended power outages.
Widespread power outages.
Mass of downed debris on the transportation network impedes the response of emergency personnel and utility crews.
Electrical blackouts force the closure of government offices, businesses, and schools.
Power outages can disrupt transportation, generating traffic snarls resulting in thousands of motorists seeking few available alternate routes on local arterials and collectors, complicated by blocked roads.
When power outages occur simultaneously with heavy stormwater flows, public works crews may struggle to provide auxiliary power to sewer lift stations to prevent backups or flooding in suburban and urbanized areas.
Heavy Rain
Heavy rainfall is any amount of rain produced in a relatively short time period that exceeds the capacity of natural systems’ or stormwater infrastructures’ ability to effectively and safely convey the flow of stormwater.
Prolonged heavy rains directly or indirectly affect the entire region and typically occur from November through February. Properties at greater risk include those in flood plains, with high ground water, with stormwater drainage problems, or those closely adjacent to steep slopes. The region overall is moderately vulnerable to flood.
Rivers to rise
Flooding downstream
Landslides
Local rainfall also swells local creeks and streams, exacerbating local flood potential.
24 Retrieved from https://www.trpc.org/DocumentCenter/View/4172/HazMit_Ch4-2_Storm?bidId=

Regional Fire & Emergency Services Study City of Tumwater Fire Department
133
Event Description
Definition Severity Impacts
Freezing Rain Freezing rain occurs when rain descends through a cold air mass, cools, and then subsequently freezes on contact with cold surfaces.
Ice can accumulate on nearly every surface including tree branches, power lines, roof tops, motor vehicles, streets, sidewalks, and traffic signals and signs. Transportation networks are especially vulnerable to freezing rain as it coats nearly every exposed paved surface.
Thick ice accumulations can stress structures, causing trees tops and branches and power lines to snap.
Downed live power lines.
Heavy Snow
The Washington State Hazard Mitigation Plan defines heavy snow as four inches of snowfall in 12 hours or six inches in 24 hours for non-mountainous areas.
Light snow, less than four inches deep, can temporarily disrupt normal traffic operations on roads and streets until public works departments clear priority routes.
In general, snow hazards and road clearing abilities become more problematic with decreasing temperatures, increasing snow depth, and length of time that snow remains on the ground. Even when priority routes are clear, numerous neighborhood streets and local collectors can remain impassable for many motorists when snow depths exceed one foot.
Heavy snowfall and blizzard like conditions drastically reduce motorists’ visibility, especially in the dark, increasing the risk for motor vehicle accidents
Heavy snow affects all modes of transportation.
Snow, even in windless conditions, presents serious hazards.
Icy road conditions are a major cause of vehicle accidents resulting in property damage, traumatic injuries, and fatalities.
Significant snowfall can disrupt surface transportation networks for several days and overwhelm the snow removal capabilities of public works departments, delay public transit services, as well as delay response times of emergency responders.
Delayed freight distribution can also occur, with possible shortages of goods such as fuel. Deep snow and sustained freezing temperatures can force the suspension or closure of both public and private sector services for several days.
Excessive snow loads on structures can cause roofs and utility lines to collapse. Structural collapses are more likely when snow loads gain additional weight.

Regional Fire & Emergency Services Study City of Tumwater Fire Department
134
Earthquakes
Areas of the Pacific Northwest can be impacted by earthquakes. Thurston County and the departments in
the study area are no different. Thurston Regional Planning Council (TRPC) rates the hazard profile of
earthquakes with a high probability, high vulnerability, and high risk. Earthquakes can cause widespread
damage and disrupt many services across the area.
As described in the TRPC’s hazard mitigation plan there are four effects of earthquakes.25 These effects are
described in the next figure.
Figure 166: Effects of Earthquakes
Effect Description
Ground Motion When a fault ruptures, seismic waves radiate, causing the ground to vibrate. This wave movement causes the ground to shake during an earthquake.
Ground Failures Earthquakes can cause surface faulting, landslides, subsidence, and uplifting. Surface faulting is the differential movement of two sides of a fracture.
Liquefaction Liquefaction is the phenomenon that occurs when ground shaking causes loose soils to lose strength and act like viscous fluid. Liquefaction causes two types of ground failure: lateral spread and loss of bearing strength.
Tsunamis Tsunamis are large ocean waves generated by sudden changes in the sea floor elevation which displace a significant volume of water.
The next figure is a summary of the estimated population residing in the liquefaction hazard area in 2015.
Figure 167: Estimations in the Liquefaction Hazard Area by Jurisdiction, 2015
Land Area Population Residential Dwellings
Fire Department/District Total Acres Percent in the Hazard
Area Total
Percent in the Hazard
Area Total
Percent in the Hazard
Area Olympia Fire Department1
15,976 53.4% 62,940 53.7% 29,020 53.2%
Tumwater Fire Department1
14,229 74.6% 25,640 72.8% 11,390 71.8%
West Thurston Regional Fire Authority
100,131 19.6% 22,010 21.3% 8,480 22.3%
Lacey Fire District 36,820 42.7% 91,660 43.1% 38,120 44.3%
McLane/Black Lake District
51,828 5.2% 15,890 12.3% 6,490 13.1%
East Olympia District 19,677 44.2% 11,140 47.5% 4,510 46.8 1 Includes Urban Growth Area
25 Retrieved from https://www.trpc.org/DocumentCenter/View/4171/HazMit_Ch4-1_Earthquake?bidId=

Regional Fire & Emergency Services Study City of Tumwater Fire Department
135
The next figure is a map of the liquefaction hazards in Thurston County including the study area.
Figure 168: Liquefaction Hazards in Thurston County26
26 https://www.trpc.org/DocumentCenter/View/4171/HazMit_Ch4-1_Earthquake?bidId=

Regional Fire & Emergency Services Study City of Tumwater Fire Department
136
Wildfire Risk
Like many areas of Thurston County there is a wildfire risk in the study area. The level of risk associated with
wildfires in any given area of a community is dependent upon several factors including climate, vegetation,
and topography. Also, a factor, the number of homes that are built within the Wildland Urban Interface.
According to Thurston County Hazards Mitigation Plan the summary assessment on wildfire reads:
Wildland fires have a high probability of occurrence. The vulnerability of the county to
this hazard is also believed to be of a moderate level. Despite the relatively diminutive
size of wildland fires in the county, they have great potential to destroy multiple homes or
businesses. Past fires have threatened to damage or quite possibly destroy 10 to 20 or
more homes in a single event. A moderate vulnerability rating is assigned because even
small fires have the potential to impact multiple properties with devastating results in a
very short time. Finally, the subjective estimate of the probability of occurrence and
vulnerability threat are combined to classify the wildland fire hazard as a moderate risk.27
In the next figure a summary of the historical wildfire occurrences and impacts is illustrated.
Figure 169: Study Area Historical Wildfire Occurrences and Impacts, 1972–201528
Fire Department/District Total Fires Fire/Year Total Acres
Burned Max Size
Acres Average
Acres
Tumwater Fire Department 54 1.3 35.5 4 0.7
Olympia Fire Department 26 0.6 8.3 0.5 0.3
Lacey Fire District 3 758 17.6 6 431.3 54 0.6
East Olympia District 209 4.9 147.1 13 0.7
West Thurston Regional Fire Authority 494 11.5 581.7 50 1.2
McLane/Black Lake District 204 4.7 128.3 14 0.6
Total 1,745 23 1,332.2 135.5 4.1
The next figure is a graphic representation of the historical wildfires in Thurston County.
27 https://www.trpc.org/DocumentCenter/View/4180/WEB_DRAFT_HazardsMitigationPlan_March2017_v2?bidId=
28 https://www.trpc.org/DocumentCenter/View/4180/WEB_DRAFT_HazardsMitigationPlan_March2017_v2?bidId=;

Regional Fire & Emergency Services Study City of Tumwater Fire Department
137
Figure 170: Wildfires in Thurston County, 1972–201529
As noted, the number of homes in the Wildland Urban Interface is also a contributing factor in assessing the
wildfire risk. The next figure illustrates the high-risk Wildland Urban Interface areas.
29 https://www.trpc.org/DocumentCenter/View/4180/WEB_DRAFT_HazardsMitigationPlan_March2017_v2?bidId=; Retrieved 5-29-
2019:

Regional Fire & Emergency Services Study City of Tumwater Fire Department
138
Figure 171: High-Risk Wildland Urban Interface Areas in Thurston County30
The next figure shows the estimated land area, population, and dwellings that are in the Wildland Urban
Interface areas. These vary widely by fire district from a high for land area in the McLane/Black Lake District
of over forty percent to a low of zero percent in the hazard area in East Olympia.
30 https://www.trpc.org/DocumentCenter/View/4180/WEB_DRAFT_HazardsMitigationPlan_March2017_v2?bidId=; Retrieved 5-29-
2019:

Regional Fire & Emergency Services Study City of Tumwater Fire Department
139
Figure 172: Study Area Current Estimates as they relate to the Urban Interface 2015
Land Area Population Residential Dwellings
Fire Department/District Total Acres Percent in the Hazard
Area Total
Percent in the Hazard
Area Total
Percent in the Hazard
Area Olympia Fire Department1
15,976 7.4% 52,490 4.9% 29,020 4.2%
Tumwater Fire Department1
14,229 0.2% 25,640 0.0% 11,390 0.0%
West Thurston Regional Fire Authority
100,131 26.2% 22,010 17.9% 8,480 18.0%
Lacey Fire District 36,820 0.0% 91,660 0.0% 38,120 0.0%
McLane/Black Lake District
51,828 41.2% 15,890 73.2% 6,490 71.8%
East Olympia District 19,677 0.0% 11,140 0.0% 4,510 0.0% 1 Includes Urban Growth Area
Transportation Risks
Highways
There are several transportation corridors and various modes of transportation that fall within the study area
for which the departments are responsible. Beginning with major roadways, Interstate 5 goes through the
middle of Thurston County, including through four of the six districts in the study area. Additionally, there
are several major local roads within the county. Regardless of the size of the roadway or the speed limit, any
roadway has the potential for motor vehicle crashes, vehicle fires, medical emergencies, brush fires, or
hazardous material spills/leaks. Each of these are not only a risk to the community but the responders are
also at risk of being struck by vehicles while operating near moving traffic.

Regional Fire & Emergency Services Study City of Tumwater Fire Department
140
Figure 173: Major Highways in the Study Area
RECOMMENDATION:
• Ensure that when fire and EMS units respond to incidents along highways that an SOP is in
place to protect scene from traffic flow.
Airports
Olympia Regional Airport is a public use airport located four nautical miles south of the central business
district of Olympia. It is owned by the Port of Olympia but is in the Tumwater Fire Department area.
Additionally, there are smaller airfields and heliports in the study area. Regardless of type of airport, each
pose the risks associated with aircraft landing and departing, as well as, aircraft and fuel storage at the airport
itself.
The next figure shows the location of airports and heliports in the study area.

Regional Fire & Emergency Services Study City of Tumwater Fire Department
141
Figure 174: Airports and Heliport Locations in the Study Area
Railroads
The following figure shows several operating railway lines through the study area. Apart from the
McLane/Black Lake Fire District, each of the study area departments have some railway tracks in their
district. McLane/Black Lake has tracks just outside their eastern district line as well.
In EOFD, the Burlington Northern-Santa Fe (BNSF) north south mainline bisects the district with two at-
grade crossings of major arterials necessitating staffing at Stations 61 and 64.

Regional Fire & Emergency Services Study City of Tumwater Fire Department
142
Figure 175: Railway Tracks in the Study Area
Although a comparatively safe mode of transport, railway operations do come with hazards. Some of the
hazards associated with railway operations are described in the next figure.
Figure 176: Potential Rail Incident Types and Effect
Type of Incident Description/Hazard
Train Collisions Collisions can be between two or more trains or between trains and infrastructure.
Derailments Derailments occur when one or more cars of a train leaves the tracks; generally involves just one train.
Grade Crossings Crashes There are various scenarios in which accidents occur at railroad crossings.
Railroad Staff Injuries Railroad staff may get injured while working on or near the tracks. In some cases, accessibility will be a problem.
Dangerous Goods Release As the railroads carry dangerous goods, there is always the potential for product release.

Regional Fire & Emergency Services Study City of Tumwater Fire Department
143
The effects from these incidents can require large numbers of fire and EMS resources. In review of the
previous figure, several of these incidents could require the response of a Haz-Mat team, Technical Rescue,
and EMS. Many times, the complexity of the incidents will require multiple operational periods. Risk analysis
and planning for these types of incidents must consider the need for higher than usual personnel and
equipment resources. When incidents occur at grade crossing, fire and EMS personnel will have to operate
near the tracks. Training in the proper precautions is essential.
Buildings
Many buildings in the county are used for purposes that create more significant risk than others during an
emergency. High occupancy buildings, facilities providing care to vulnerable populations, and others may
require greater numbers of emergency response and resources during an emergency.
Numerous buildings lie within the study area in which large numbers of people gather for entertainment,
worship, and other similar events. A variety of nightclubs, theaters, and other entertainment venues also
exist.
Of course, as the capital city, Olympia is home to the State Capitol. These very large buildings drive a
significant need for resources due to the special nature of the facilities, such as historical, political, and large
areas of assembly.
Colleges and Schools
The next figure shows the locations of the educational facilities within the study area. These facilities present
additional risk, primarily for mass casualty incidents. Fire, criminal mischief, and potentially terrorism could
cause a major medical emergency requiring significant emergency service resources.

Regional Fire & Emergency Services Study City of Tumwater Fire Department
144
Figure 177: Colleges and Schools in the Study Area
Medical and Congregate Care Facilities
Medical and congregate care facilities, particularly hospitals and nursing homes, house vulnerable occupants.
Although these facilities have regular fire safety inspections and are generally built of fire resistive
construction with built-in fire suppression, emergencies still can occur that require the quick movement of
patients away from the hazard. Incidents at these facilities will require high resources levels.
Other Critical Infrastructure
One concern to fire departments is the water and fire hydrant system. Providing enough storage,
distribution, and access to this valuable firefighting resource is very important. The next figure illustrates the
hydrant system in the study area. As expected, in the more populated urbanized areas, fire hydrants coverage
is very good. The rural areas of the county depend on water delivered by tenders. From a risk assessment
standpoint, planning consideration must be given to situations when the water system could fail.

Regional Fire & Emergency Services Study City of Tumwater Fire Department
145
Figure 178: Fire Hydrant Distribution in the Study Area
Emergency communication centers and the associated transmitting and receiving equipment are essential
facilities for emergency response. The TCOMM dispatch center provides call receipt (PSAP) and dispatch
service not only to the departments in the study area but to all fire, EMS, and law enforcement agencies in
Thurston County. This center provides for the answering of 911 calls, dispatching of fire and other emergency
responders, and important support to the on-scene incident management function. Back-up center or other
process should be considered in case of a system failure or other emergency at TCOMM the could interrupt
services.
There are other communication facilities and equipment that are equally important to the community and
government operations within the study area. These are the telephone company central offices and the
transmission lines of local telephone service providers. Internet service providers, along with wireless cellular
communication providers, provide essential communication capabilities for the community as well as
emergency personnel through their facilities and equipment. Failures in any of these systems can influence
emergency services.

Regional Fire & Emergency Services Study City of Tumwater Fire Department
146
Energy
The loss of electrical power is also a risk to the community. Community services, from communications to
traffic signals to normal operation of supermarkets, require the use of energy. Whether it is electricity
generation and transmission systems, fuel distribution and storage tanks, or natural gas pipelines and
regulator stations, the community is dependent upon energy sources. The loss of energy is a planning
consideration for response and readiness.
Structural Risks
Certain buildings, contents, functions, and size present a greater firefighting challenge and require special
equipment, operations, and training.
The Insurance Services Office calls for a ladder truck within 2.5 miles of developed areas containing buildings
three or more stories in height. Accessing the upper floors and roofs of buildings this tall, typically requires
ladder truck capability as ground ladders may not provide access.
Large buildings such as warehouses, malls, and large “box” stores require greater volumes of water for
firefighting and require more firefighters to advance hose lines long distances into the building.
Terrorism
Thurston County—as is anywhere—a potential target for terrorism. Most of the previous categorized risks in
the community are targets for such activity. The State Capital is located within the study area. In addition,
the public gathering events during the year can also be targets. The fire rescue departments need to be
vigilant in their training and preparedness in the event one or more coordinated acts of terror occur in the
region. Coordination and unified command with law enforcement partners is critical.

Regional Fire & Emergency Services Study City of Tumwater Fire Department
147
Demographics
Current Population Information
The study area includes six departments across central Thurston County. The next figure is a summary of
service area and population according to information provided by the fire departments and retrieved from
the Thurston Regional Planning Council (TRPC).31
Figure 179: Study Area Size and Population Estimates
Fire Department/District 2018
Population Estimate
Area in Sq. Miles
Population Density
Tumwater Fire Department 23,830 18 1,324/mi2
Olympia Fire Department 52,490 20 2,625/mi2
Lacey Fire District 3 97,990 70 1,400/mi2
East Olympia District 11,750 30 392/mi2
West Thurston Regional Fire Authority 22,850 162 141/mi2
McLane/Black Lake District 16,280 84 194/mi2
Total 225,190 384 586/mi2
An NFPA report has identified the groups that face a higher risk of being injured or killed in a fire as:32
• Children under 5 years of age;
• Older adults over 65 years of age;
• People with disabilities;
• Those with a language barrier; and
• People in low-income communities.
The following charts were created to provide an overview of the demographics related to these identified
groups. Age and sex demographics are provided in the following figure to the extent that the data was
available.
31 Retrieved from https://www.trpc.org/480/Population-Housing-Employment-Data
32 National Fire Protection Association, 2007; Urban Fire Safety Project, Emmitsburg, MD; retrieved from
http://www.nfpa.org/public-education/by-topic/people-at-risk/urban-fire-safety/reports-and-presentations

Regional Fire & Emergency Services Study City of Tumwater Fire Department
148
Figure 180: Age and Sex Percentage Comparisons1
Age/Sex Tumwater Olympia Lacey East
Olympia West
Thurston McLane-
Black Lake
Persons under 5 years 5.3% 4.9% — — — —
Persons under 18 years 21.6% 18.1% — — — —
Persons 65 years and over 14.3% 15.8% — — — —
Female persons 52.2% 52.3% — — — — 1 U.S. Census Bureau
Based on the preceding figure, the percent of the population over 65 years of age ranges from just over 14
percent in Tumwater to nearly 16 percent in Olympia. Approximately five percent of the population is under
five years of age. This place a total of approximately 20 percent of the populations in the two cities within the
age groups that are at highest risk in residential fire incidents and account for some of the highest use of
emergency medical services. Senior citizens can have difficulty escaping from fire due to physical limitations.
Seniors also tend to use emergency medical services more frequently than younger persons. As the
population ages, this will create an increase in service demand for emergency medical services.
As noted, the very young also represent a vulnerable population, both regarding their ability to escape a
structure fire as well as their susceptibility to serious medical ailments such as asthma, traumatic events,
choking, or injury from vehicular accidents.
Figure 181: Other Demographic Comparisons1
Subject Tumwater Olympia Lacey East
Olympia West
Thurston McLane-
Black Lake
Persons without health insurance, under age 65 years
5.9% 9.5% — — — —
Person with a disability, under age 65 years
7.6% 9.3% — — — —
Owner Occupied Housing Rate, 2012–2016
55.2% 45.2% — — — —
Median household income (in 2017 dollars), 2012–2017
$64,786 $55,539 — — — —
Persons in Poverty 9.7% 18.4% — — — — 1 U.S. Census Bureau
The demographics displayed in Figure 181 are factors which indicate a population that is more likely to use
fire department services than other populations. Individuals with no health insurance are more likely to use
local EMS resources compared to individuals with health insurance and a personal physician. The percentage
of people where data was available—Tumwater and Olympia—without health insurance is 5.9 percent and
9.5 percent respectively. The percentage of owner-occupied houses is 55 percent in Tumwater and 45 percent
in Olympia. A high percentage of owner-occupied homes may indicate a more stable community and
residents willing to invest in their community and community services.
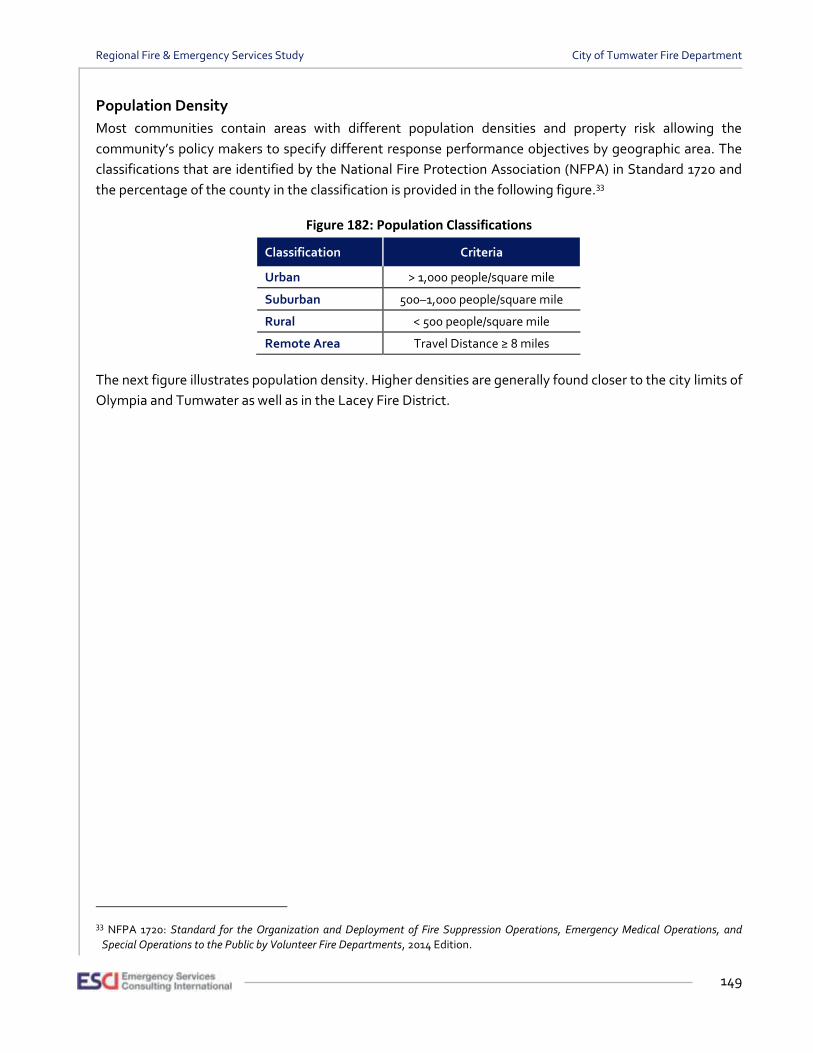
Regional Fire & Emergency Services Study City of Tumwater Fire Department
149
Population Density
Most communities contain areas with different population densities and property risk allowing the
community’s policy makers to specify different response performance objectives by geographic area. The
classifications that are identified by the National Fire Protection Association (NFPA) in Standard 1720 and
the percentage of the county in the classification is provided in the following figure.33
Figure 182: Population Classifications
Classification Criteria
Urban > 1,000 people/square mile
Suburban 500–1,000 people/square mile
Rural < 500 people/square mile
Remote Area Travel Distance ≥ 8 miles
The next figure illustrates population density. Higher densities are generally found closer to the city limits of
Olympia and Tumwater as well as in the Lacey Fire District.
33 NFPA 1720: Standard for the Organization and Deployment of Fire Suppression Operations, Emergency Medical Operations, and
Special Operations to the Public by Volunteer Fire Departments, 2014 Edition.

Regional Fire & Emergency Services Study City of Tumwater Fire Department
150
Figure 183: Study Area Population Density
Population Growth Projections
The population in Thurston County has grown over the last 35 years. The population countywide in 1980 was
124,264—in 2015, the population had grown to 267,410.34 This is an overall increase of 115 percent. For the
fire departments in the study area, in 2015 the population was 213,940. The 2018 estimated total is 225,190—
an increase of just over five percent.
The following figure illustrates the estimated population from the 2015 base year to 2018 as estimated by
the TPRC. The figure also shows population projections through 2040—one using the TRPC estimates and a
second an average based on the past values.
34 Retrieved from https://www.trpc.org/480/Population-Housing-Employment-Data

Regional Fire & Emergency Services Study City of Tumwater Fire Department
151
Figure 184: Population Growth Projections in the Study Area
These results estimated by the TRPC predicts a population of 303,160 in the year 2040. Using the average
based on past growth 302,366 persons is predicted.
With population growth there comes increases in service demand. More people mean not only more
incidents generated it also means a need for expanded geographical coverage. Resource additions will need
to be planned to provide service delivery and performance at acceptable levels.
Expansion and growth will not only effect delivery of fire rescue service but also other fire department
functions, such as code enforcement and community risk reduction. The department must maintain
awareness and be involved in monitoring the relationship between population and demand.
213,940 218,120 221,400 225,190
237,032 246,126 266,304
286,240 302,366
233,830 253,000
271,940 287,260
303,160
-
50,000
100,000
150,000
200,000
250,000
300,000
350,000
2015 2016 2017 2018 2020 2025 2030 2035 2040
Actual Estimate TRPC Prediction From Average Estimated Projection from TRPC

Regional Fire & Emergency Services Study City of Tumwater Fire Department
152
FUTURE OPPORTUNITIES FOR COLLABORATION
Having completed the evaluation of current conditions process, ESCI is now armed with the information
necessary to effectively evaluate the opportunities that exist in the region for shared service delivery
opportunities between the study agencies. There are many ways that fire departments can work together,
ranging from very fundamental sharing of resources and programs, up to and including legal assimilation of
multiple agencies into one in the form of a merger or consolidation, where feasible.
ESCI identified the following alternatives as those that are most feasible for application to these study
agencies:
• Maintain Status Quo
• Contract for Services
▪ Administrative
▪ Functional
▪ Operational (Full Service)
• Merger
• Annexation
• Regional Fire Authority
• Formation of a Municipal Fire District
The balance of this report examines the multiple options that are available to the study agencies and provides
insight and guidance where appropriate.
General Partnering Options It is often assumed that legal merger of agencies is the only alternative that is available. However, in general
terms, a number of different strategies are available to the client agencies when considering consolidation
of services. This begins with a do-nothing approach and ends with complete unification of the organizations
into what is, essentially, a new emergency service provider. A summary of the available methodologies is
found below, followed by identification of specific options that are considered feasible in these study
agencies.
Status Quo
In some instances, changing nothing, or little, compared to current practice is the most desirable approach.
The client fire organizations can decide to continue as separate entities and not undertake any further
partnering opportunities. Remaining separate may be advantageous in that it provides each agency with the
most organizational control because, under this strategy, the agencies continue to make decisions
considering only unilateral issues. The strategy represents a perpetuation of the status quo, and it is useful
as a comparison by which to measure the other strategies.

Regional Fire & Emergency Services Study City of Tumwater Fire Department
153
The disadvantages of this approach are that the current challenges facing the agencies are not changed, the
opportunities for efficiency (either financial or service level) through greater collaboration are not realized,
and some duplication and overlap continue. In today’s environment, taxpayers typically hold their elected
officials accountable for delivering a quality level of service at an affordable rate, and expect creative thinking
to solve problems or achieve those ends. While “maintaining the status quo” is easy and involves the least
amount of impact to the agencies, it may well be one of the riskier decisions to make politically.
Contract for Services
There are three main types of contracts for service; administrative, functional, or operational consolidation.
Each of these is discussed in greater detail in the following sections.
Administrative Consolidation
An administrative consolidation occurs when two or more agencies maintain their separate legal status and
separate operational elements, but combine some or all of their administrative functions. Examples include
combining clerical, HR, IT, and/or financial functions while maintaining separate operational activities, or
even combining agency administration and management under one Fire Chief. An administrative
consolidation is accomplished legally through an Interlocal Cooperation Agreement between the agencies.35
There are no limitations regarding crossing city or county boundaries.
The advantages of such a model include reduced overhead costs by eliminating administrative duplication; a
gradual alignment of otherwise separate operations under a single administrative head; less resistance to
change by the rank and file in the operational elements than other consolidation options; and singularity of
purpose, focus, and direction at the top of the participating organizations. This option lends itself well to a
gradual move toward a single, consolidated agency where differences in attitude, culture, and/or operation
are otherwise too great to overcome in a single move to combine.
The disadvantages include potential conflicts in policy direction from the various boards and councils;
potentially untenable working conditions for the Fire Chief (“one person, multiple bosses”); and increased
potential for personnel conflict as separate employee groups vie for dominance/supremacy.
Functional Consolidation
Functional consolidation, as the term is used here, would enable the client agencies to work together while
remaining as separate organizations. Under the Washington statutes, governmental entities may elect to
cooperate or contract for any lawful purpose, allowing individual organizations to share resources, improve
service, and save money at the program level. Most commonly, fire departments enter partnering
agreements for programs such as firefighter training, fire prevention, closest force response, and
administrative/support services. As has been recommended throughout this report, ESCI has identified a
number of program level activities that can, and should, be undertaken collaboratively between the client
agencies, regardless of future decisions surrounding a higher level of integration.
35 RCW 39.34.030.

Regional Fire & Emergency Services Study City of Tumwater Fire Department
154
In many cases, functional consolidation is sufficient to accomplish the cooperative goals of the agencies
without considering operational agreements or mergers. It is common in the industry to functionally join such
activities as purchasing, firefighter training, fire prevention, public education, apparatus maintenance, and
command response assistance. The keys to success of a functional consolidation strategy lie in a trusting
relationship between partner agencies, the completeness of the agreement that sets up the program, and a
cooperative approach to the management of the program.
For a functional consolidation, the advantages are greater opportunities for efficiency; an opportunity to
reinvest redundant resources into those areas lacking in resources and a closer working relationship between
members of the agencies in the consolidated function(s) that can spill over to other unrelated activities in the
otherwise separate agencies. This type of collaboration may segue to greater levels of cooperation. Barriers
can be broken down as members of each agency realize that the other agencies’ members “aren’t so different
after all.”
A disadvantage is that interaction by and between line personnel of different agencies increases the potential
for friction. Numerous details must be worked out in advance of such a contract, including but not limited to:
work rules, employee assignments, volunteer opportunities, office location, logos, asset allocation,
authority, and even the name of the consolidated function. Further, independence and autonomy are lost in
the consolidated areas, spilling into other seemingly unaffected areas.
Operational (Full Service) Consolidation
This partnering option takes the next step in the continuum of closer collaboration. In this case, all operations
are consolidated under a single organization that serves all participating agencies. The agencies remain
independent organizations from a legal/political/taxing standpoint; but from a service level standpoint, the
organization operates as one agency. Like other strategies listed, an operational consolidation is
accomplished legally through an Interlocal Cooperation Agreement.36
Under an operational consolidation, governance of the client agencies would remain as it is at the City Council
and Board level. However, this strategy largely joins the entities, operationally, through the execution of a
more comprehensive interlocal cooperation agreement. The resulting organization features a single
organizational structure and chain of command.
Depending on the form of the agreement(s) establishing the organization, employees and members of each
organization may remain with the original agency or, alternatively, they may be transferred to one of the
other agencies.
36 Ibid.

Regional Fire & Emergency Services Study City of Tumwater Fire Department
155
Operational consolidation means that, regardless of their overarching governance structure, the agencies
become one in terms of how day to day operations are performed. One Fire Chief oversees a blended
organization. This option requires a significant commitment toward a full consolidation and is usually done
as a last sequential step toward full consolidation as the administrations and policy-making bodies work out
the last details.
For an operational consolidation, the advantages are that the greatest opportunity for efficiency (not
necessarily cost reduction) is typically in the operational element where service is delivered to the
communities; and the level of trust and cooperation required to make implementation of this option
successful implies a near-readiness to take the next step to full integration.
The disadvantage is that administrators and policymakers must share power and gain consensus where they
once had unilateral authority to control and implement. If there are multiple bargaining unit agreements,
they would have to be aligned. Further, it becomes difficult to determine which agency would be the
contractor.
In all three versions of the foregoing types of interlocal agreement, the participating agencies can establish
an oversight board made up of appointees of the governing bodies involved in the interlocal agreement. The
joint board can be established with their scope of authority granted to them by the separate governing bodies
involved in the interlocal agreement.37
Merger
A merger is a complete combining of the participating fire districts (cities are not able to merge with districts)
agencies into one agency. A city can be brought into a fire district through annexation or can form a fire
district “with boundaries that are the same as the corporate boundaries of the city,” which is described
following the discussion of this option.38 There are no limitations regarding crossing county lines. One or
more fire districts may be absorbed into and become part of the surviving district. Fire districts merging into
a surviving district are referred to as the merging agency(s) and the surviving district is referred to as the
merger agency. The employees of the merging agency(s) are transferred to the merger agency, and the
elected officials are brought into the merger district and are reduced over the next three regular elections
until the board of fire commissioners is down to three or five depending on the structure of the merger district
board. If a fire district has a $10 million budget or more, a seven-member board can be created.39 The merging
fire districts must be located within a reasonable proximity to each other.
A merger would require a decision on which agency will be the merger district and which agency(s) will be
the merging district(s). The merger is subject to review by the Boundary Review Board if jurisdiction is
invoked by an affected governmental agency, if a petition is submitted by five percent of the affected
population requesting review, or if three members of the Boundary Review Board request review.40
37 RCW 39.34 38 RCW 52.02.160 39 RCW 52.14.020 40 RCW 36.93.100
Regional Fire & Emergency Services Study City of Tumwater Fire Department
156
Once a decision to merge is made by the merging district board(s), a merging district(s) must submit a
petition to merge to the merger district. If the merger district accepts the petition and terms of the proposed
merger, it adopts a resolution accordingly and sends the resolution, along with the original petition, back to
the merging district board(s). The merging district board(s) then adopts a resolution requesting the county
auditor to call a special election in the merging district(s). A simple majority determines the outcome of the
election. If the majority vote yes, the respective district boards adopt concurrent resolutions declaring the
districts merged under the name of the merger district.
The board of fire commissioners of the merged district shall consist of all of the fire commissioners of the
merging district(s). The combined board will then be reduced by one whenever a fire commissioner resigns
from office or a vacancy otherwise occurs on the board, or during regular elections until the board reaches
three or five (or seven) members, whichever structure the merger district has. The election for merger may
also establish commissioner districts if unanimously approved by the boards prior to the merger vote and is
included in the ballot language for merger. In this case, the same process of board member reductions occurs
as if no commissioner districts were formed until the merged board is reduced to the three or five members.41
At that point, the commissioner districts shall be drawn and used for the election of the successor fire
commissioners.
Annexation
A city may be annexed into a fire district for the purposes of receiving fire protection services. An annexation
into a fire district expands the boundaries of the fire district to include the current and future boundaries of
the city. The city boundaries do not change as a result of annexation into a fire district. There is no reserved
authority for a city to be represented on the governing board absent the formation of commissioner districts.
However, once annexation occurs, city residents are eligible to run for office as a fire commissioner at large.
Commissioner districts can also be created, guaranteeing representation from within the city if the district
were created accordingly, as long as each commissioner district was approximately equal in population.
Annexation does not affect any other authority of the city. The city simply transfers its responsibility for fire
protection and EMS services to the fire district. The city’s maximum allowed tax levy rate is reduced by the
actual tax levy rate of the fire district. Although the city’s tax capacity may be reduced by the amount of the
district’s tax levy, depending on the city’s tax rate, this may or may not decrease the city’s actual tax levy.
See the following generic example:
Current Property Tax Levy Rates (Example):
City $1.89 Maximum allowed $3.60
Fire District $1.00 Maximum allowed $1.50
City Annexes into District (Example):
Fire District Levy $1.00
City Tax Capacity $2.60 ($3.60 - $1.00)
41 RCW 52.14.017

Regional Fire & Emergency Services Study City of Tumwater Fire Department
157
There are no statutory requirements that a city being annexed by a fire district must transfer its fire
department assets. The city may retain its fire stations, for example, and lease them to the district at a
nominal rate. RCW 52.04.111 through .131 provide for the transfer of city firefighters to the district in the
event of the annexation of the city by the district. The district is not obligated to transfer all employees,
therefore, these statutory provisions should be reviewed in detail prior to the initiation of annexation
proceedings to ensure that the interests of all parties will be addressed and ensure statutory compliance.
Regional Fire Authority
Unique to Washington and only a few other states, an alternative to a merger is the formation of a Regional
Fire Authority (RFA). An RFA is a new entity whereby fire agencies, whether districts, cities or a combination,
fall under this new structure with a new tax base, a new operational plan, and a new legal framework.
If agencies contemplate forming an RFA, it is usually wise to begin meeting informally to discuss and address
issues in advance of initiating the first formal step in the process. Most successful efforts start with
establishing exploratory or steering committees composed of a wide variety of stakeholders to determine
the feasibility of creating an RFA far in advance of forming the actual Planning Committee. This study may
also serve that purpose. Should the decision be made to move forward with RFA formation, the first legal
step is the formation of a Planning Committee, considered to be the most important component of the
process. The Planning Committee is charged with establishing the RFA plan, which specifies how the RFA
will be funded, operated, and governed. The RFA plan should be considered the “charter” or “constitution”
of the new agency.
The Planning Committee is comprised of three elected officials appointed from each of the participating
agencies, assuring an equal voice in the decision-making process for everyone involved. Moving forward with
the formation of an RFA also requires approval by all of the affected governing bodies prior to the initiative
being put before the voters.
Funding Mechanisms
A key consideration of the RFA formation decision is funding. The RFA plan will identify funding sources that
may include some or all of the following:
• Fire levies
• EMS levies
• Excess levies
• Benefit charges
• Bonds for capital purchases
Facilities and Equipment
The ownership or transfer of ownership of capital assets is not prescribed by law and will be determined by
the Planning Committee. Although ownership of facilities and equipment will most likely be transferred to
the newly formed RFA, the responsibility for bonded indebtedness for capital assets will remain with the
originating agency until the debt is satisfied.

Regional Fire & Emergency Services Study City of Tumwater Fire Department
158
Staffing and Personnel
Under an RFA configuration, employees and members of the agencies joining forces in the RFA become
employees and members of the new organization, including career and volunteer personnel. Unless an
agreement for different terms of transfer is reached between the collective bargaining representatives of the
transferring employees and the participating fire protection jurisdictions, employees will retain the rights,
benefits, and privileges that they had under their pre-existing collective bargaining agreements.42
Roles and responsibilities assigned to agency personnel may change in a newly formed RFA when
modifications are necessary in the interest of service delivery requirements. For this reason, involvement of
labor and volunteer organization representatives from the onset of the process is essential.
Governance and Administration
A Regional Fire Authority is governed by a single governance board. The number of board members and the
length of their service terms are determined by the Planning Committee consistent with applicable statutes.
The statute authorizing the formation of an RFA does not place limitations on the number of members
serving on the board, leaving that decision to the Planning Committee and, ultimately, the voters. ESCI is
familiar with one RFA in Washington State that initially had nine board members.
Administration of the new RFA, once established, becomes the responsibility of the newly established
governing board. The Planning Committee, however, will include in its body of work identification of the
composition of the RFA’s administrative staff. The Fire Chief and his/her command staff, as agreed to by the
Planning Committee, will subsequently report to the governing board.
42 RCW 52.26.100 (6)

Regional Fire & Emergency Services Study City of Tumwater Fire Department
159
Legal Considerations
A number of important legal considerations must be taken into account in the formation of a Regional Fire
Authority. They are summarized below:
• Regional Fire Protection Service Authority Plan—Planning committees are tasked with forming the
RFA plan. The RFA plan outlines the plan for governance, financing, operations, asset transfers, and
other considerations and is the plan that the voters are asked to approve when voting on the
formation of the RFA.
• Formation Procedures—Like any other type of significant consolidation, the formation of RFA
requires careful planning. Because the RFA creates a new entity, there is an added layer of complexity
to the planning. The new entity will need to register with the Internal Revenue Service (IRS), establish
new accounts with the County and vendors, contracts will need to be assigned and negotiated, labor
agreements need to be negotiated, payroll systems may need to be established, and so on. In other
words the formation of a new entity can be incredibly time intensive and attention to detail is critical.
The formation of an RFA is not subject to review by a Boundary Review Board or a county legislative
authority. The formation of an RFA is, however, likely subject to compliance with the State
Environmental Policy Act (SEPA). Legal counsel familiar with RFAs should be obtained to guide
policymakers in the process.
The advantages of this option are that it allows agencies to retain the strengths they bring to the new agency,
minimizes the weaknesses of each agency, and may allow for establishing new “best practices” not currently
provided by any of the participating agencies alone. It facilitates a contemporary look at services, resources,
and costs, finding the right balance for the community. It retains (or has the potential to retain) the
policymakers of the participating agencies in a governing board (including participating cities), thus utilizing
the vision and commitment that initiated the implementation of this option. Finally, it creates an opportunity
to “right-size” the revenue with the cost of operation, and it provides an active role for the citizens being
served in setting their service level and costs.
The disadvantages of pursuing this option are the loss of autonomy for each participating agency; the loss of
a familiar structure (although RFAs operate almost identically to a fire district); the investment of time and
effort to develop an RFA plan can be rendered moot by the voters; and funding options are not significantly
better for RFAs than they are for fire districts.
Formation of a Municipal Fire District
Municipalities can form an independent fire district with the same boundaries as the city that initiated the
formation. The process requires introducing a resolution by the City Council establishing the ballot measure
proposing formation of the fire district and any other provisions determined by the council as authorized by
the statute. The formation is voted upon by city voters and a simple majority authorizes the creation (unless
the funding mechanism includes a benefit charge, in which case, a sixty percent favorable vote is required).

Regional Fire & Emergency Services Study City of Tumwater Fire Department
160
The City Council acts as ex officio board members until or unless the fire district elects its own, which can be
provided for by City Council action in the formation of the initial resolution, or at any time after formation,
by action of a majority of the City Council. In the latter case, the City Council can relinquish governance
authority to an appointed board until such time as independently elected board members can be voted into
office.
The amount of property tax levy rate to fund the fire district is intended to be deducted from the city’s
maximum statutory property tax levy rate. The assets of the municipality dedicated to provide fire and EMS
services to the city must be transferred or credited to the fire district, including all employees. The intent of
the statutory provisions is to provide transparency, prevent double taxation, avoid duplication of investment
(i.e., asset transfers), and provide for a governance structure that focuses exclusively upon fire and EMS
service delivery within the city separate and distinct from other municipal services.
The advantages of pursuing this option are that fire and EMS service delivery becomes a separate,
independent governing structure with a separate, dedicated funding stream. It maximizes the use of already
spent infrastructure in the city for this service by transferring those assets to the district. Employees are not
put at risk and are kept whole in the transition.
The disadvantage of pursuing this option is that it is a brand-new statute and there is no track record of any
community implementing it. In this case, the city pursuing this will find any flaws in the statute, which may
not be beneficial to either entity. If the fire district does not levy its full statutorily authorized property tax
levy rate initially, but does so at a later date, the city will be required to reduce its maximum authority for
property taxes at that time, which may preclude planning for the economic impact.

Regional Fire & Emergency Services Study City of Tumwater Fire Department
161
Strategies for Shared Services In the following section, the strategies for shared services identified previously are further detailed and their
feasibility is evaluated.
The decision to establish a single regional agency can be a daunting task. When those agencies include fire
districts, cities, and a regional fire authority, the process becomes even more complex and challenging to
accomplish. The following regional strategies presented are analyzed for their impact on sustainability
and/or service delivery while identifying opportunities for increased efficiency wherever possible. ESCI
recognizes that service delivery and its future sustainability must be viewed with equal importance.
Strategy A: Status Quo
As described previously, this is essentially a do-nothing option. However, all participating agencies have likely
made temporary decisions or deferred decisions awaiting the result of this study, such as delaying the filling
of vacant administrative and support positions. If the agencies ultimately decide to maintain a status-quo
approach, there will be future decisions that will have to be made to position the agencies to move forward
effectively.
Given the amount of interaction and inter-agency collaboration that is already in place between the client
organizations, a status-quo approach would most likely be configured in a manner that would continue that
level of cooperation. However, the organizations could decide to lessen or withdraw from current shared
practices. Doing so is viewed as a step backwards and would waste the valuable efforts that have been
undertaken in recent years between the agencies.
Each agency will need to take a careful look at their future and where their organizations are headed if they
continue operations as currently in place. In some cases, aspects of their operations may not be sustainable
in the near future; therefore, the organizations are encouraged to closely scrutinize and evaluate current
conditions in this context. Particular focus on financial projections, referencing the fiscal analysis in this
report along with other sources, is recommended.
Level of Cooperation
The level of cooperation currently in place is expected to continue, such as mutual and automatic aid
agreements, as well as any current sharing of training and other resources.
Estimated Timeline for Completion
Implementation is immediate, once the decision is made, since this is a status quo strategy. The issues
identified in the introduction of this strategy will need to be addressed, but should not hinder maintenance
of the status quo.
Affected Stakeholders
All client agencies’ members and their constituents will retain their current services at their current costs.

Regional Fire & Emergency Services Study City of Tumwater Fire Department
162
Summary/Objective of Strategy
With a decision to maintain status quo, the agencies will have made a decision to maintain the value derived
from existing shared services. There may be small, specific enhancements to existing collaboration, but no
major new shared services are anticipated under this approach.
ESCI Guidance
Elected officials and administrative staffs should ensure that discussions and decisions related to this
strategy focus on the desired outcomes and best interests of the communities served. A decision to maintain
status quo does not necessarily mean future collaborative efforts are off the table. Efficiency and
enhancement of services should continue to drive decision-making.
Special Considerations
This strategy continues to afford the elected officials with a high level of control. However, as described in
the previous section, key decisions must be made by each of the agencies if this strategy is adopted.
Needs identified in the current conditions section of this report list areas in which the study agencies can, and
should, make improvements. Those areas should be carefully evaluated as a part of the process of
determining future needs under a status-quo approach.
Policy Actions
Other than the issues identified previously under special considerations, no other policy decisions must be
made related to implementation of this strategy.
Fiscal Analysis
The status quo represents no shift in cost or change in efficiency.
Issues & Impacts
The implementation of this strategy creates no additional issues or impacts other than those listed in special
considerations.

Regional Fire & Emergency Services Study City of Tumwater Fire Department
163
Strategy B: Contract for Services
Level of Cooperation
A contracted services approach is most often applicable when agencies want to work more closely together
but are either not ready, or are unable to unify or merge entirely. This strategy may be applied to
administrative functions as listed earlier and/or to exercise a functional consolidation for identified support
services, while the participating agencies maintain autonomy with separate governance and separate taxing
authority. Finally, it may be applied to a contract for full services. Depending on the selected application, a
single fire chief may provide the administrative services for the contractually combined agencies as an
example.
The district boards and city councils continue to govern the separate agencies independently, levying their
own taxes at their own levy rates. This integration may be limited to the Fire Chief, or may include all
administrative functions (and the personnel serving those functions) as well as support functions, such as
facilities/fleet maintenance, fire prevention, and/or training.
At its highest level, contracted service approaches may be expanded to include operational service delivery.
That is, one entity contracts for the entirety of its fire protection, EMS, and related services, delivered
exclusively by the provider agency. The contracting agency places full responsibility for all services, based on
identified performance measures, on the provider and retains no service delivery function of its own.
Success of an administrative, functional, or operational contract for services (interlocal cooperation
agreement) strategy is built upon 1) an essential trust relationship between the partner agencies; 2) the
thoroughness of the program agreement; 3) a collaborative approach to the management of the program(s);
and 4) community understanding and support. Since the agencies already have a great deal of collaborative
history, the foundation to build from has been created.
The approach requires in-depth, multi-level, and multi-functional planning, review, external and internal
discussions, collaboration, and agreement among the city council, district boards, and the administrative
staff members of all participating agencies. This strategy does not require public approval at the ballot box,
but is negotiated between the agencies.
ESCI notes that existing governing bodies are preserved, although the level of unilateral control is decreased.
Also, the management team of the contractually unified sections should report to the individual board and
councils on the performance of these new agreements.
Estimated Timeline for Completion
This timeline can take six months to negotiate and be prepared to execute, or can take as long as a year,
depending on the number of agencies participating, the level of complexity of the contract for services, and
bargaining unit implications that require separate negotiation. New issues may arise from the planning
process, so the planning should not be short-cut due to presumed familiarity with the other party(s).

Regional Fire & Emergency Services Study City of Tumwater Fire Department
164
Affected Sections
Depending on the type of contract for services, the affected sections may include administration, training,
and operations.
Affected Stakeholders
While all agency members and the citizens served are affected in some manner, the commissioners, council
members, and agency staff members within the affected sections will realize the most significant impacts.
Summary/Objective of Strategy
The objective should be seamless integration of the identified functions across the jurisdictions by means of
an Interlocal Cooperation Agreement, as provided for under RCW 39.34.
ESCI Guidance
The client organizations face similar financial challenges given current conditions, some more severe than
others, depending on tax base. While the listed areas for partnering are found to be duplicative in many
instances, how those areas operate in each agency may vary significantly with the other agencies due to
differing demographics, geography, and community culture.
In preparation for such a direction, the fire chiefs must establish and conduct regular joint meetings for the
purpose of establishing the parameters of an administrative, functional, or full service contract. This includes
workload analysis to ensure greatest effectiveness while maintaining proper balance. If this option is
pursued, ESCI recommends that the fire chiefs convene an ad hoc steering committee for the purpose of
developing proposed common policies, performance standards, and functional plans.
Should the concept of contracted services be expanded into operational areas, the degree of collaboration
between the chiefs is escalated substantially. Operational guidelines, response procedures, and many
additional factors will need to be compared and brought under a single, fully integrated operational strategy.
Special Considerations
Commissioners and council members should understand that pursuing any of the contractual options is
complex, labor-intensive, and challenging; as such, it is often a precursor to a more formal consolidation.
The process of developing an administrative or functional contract can expose administrative rigidity
resulting from political complexities of the arrangement. Given accountability to multiple political bodies,
administrative leaders can be pulled in multiple directions; they may also be limited by contractual
requirements in their ability to adjust to environmental changes. Consequently, conflicting policy directives
may sometimes be troublesome. These challenges underscore the importance of the foundational political
relationships, the contractual agreement and the skills of management to ensure success.
Internal staff in the affected sections will likely require some time to adjust to new processes and reporting
relationships. The community may notice changes in who they deal with and different processes likely
employed from this strategy.

Regional Fire & Emergency Services Study City of Tumwater Fire Department
165
Policy Actions
The boards of fire commissioners and city councils will need to develop, approve, and implement an interlocal
cooperation agreement.
Fiscal Analysis
Depending on the selected approaches, the initiatives described above may result in actual cost reduction
(economies of scale with volume purchasing, for example) or cost avoidance at the very least (eliminating the
need to purchase what another participating agency already has, for example), allowing those funds to be
redirected toward other agency needs. The same may apply if the needed number of support staff positions
decreases.
The costs for the combined functions, to the extent they are equal across all agencies, should be split equally
between the agencies. This includes any fiscal windfall and any net new costs. To the extent there are
weighted distribution of costs (and benefits) due to disproportionate cost or benefit, such distribution should
be based on weight factors directly tied to the function shared and should follow guidance provided in the
cost allocation discussion, which follows.
Cost Allocation Options
What follows is a listing of system variables that can be used (singly or in combination) to allocate cost
between allied fire departments. Each option is summarized by the concept, its advantages and
disadvantages, and other factors that should be considered. Regardless of the option(s) chosen to share the
cost of service, the resulting interlocal cooperation agreement needs to address the formula chosen and the
rationale behind it, as well as any exclusion, such as grant funded expenditures. In addition, service contracts
often must reconcile the exchange of in-kind services between the participating agencies.
Area
The cost of emergency service can be apportioned based on the geographic area served relative to the whole.
For instance, the jurisdictional boundaries of the agencies represent about 384 square miles. The following
figure displays the service areas in square miles and the percentage for each jurisdiction, which represents
the percentage of total cost share.
Figure 185: Cost Allocation by Service Area (2017)
Jurisdiction Service Area
in Square Miles % of Total
Olympia FD 20 5.2%
Tumwater FD 18 4.7%
West Thurston RFA 162 42.2%
Lacey Fire District 3 70 18.2%
McLane/Black Lake Fire District 84 21.9%
East Olympia Fire District 30 7.8%
Total 384 100.00%

Regional Fire & Emergency Services Study City of Tumwater Fire Department
166
Apportionment founded on service area alone may work best in areas that are geographically and
developmentally homogeneous. The client agencies in this case are not considered homogenous.
Pro: Service area is easily calculable from a variety of sources. Size of service area generally remains constant with few if any changes.
Con: Service area does not necessarily equate to greater risk or to greater workload. Indeed, density is the greater driver of workload.
Consider: Service area may be combined with other variables (such as resources, assessed value, and number of emergencies) to express a compound variable.
Assessed Value
The assessed value (AV) of agencies is established by tax assessors under laws of the state. Usually, higher-
valued structures and complexes carry a greater risk to the community from loss by fire; consequently,
assessed value also tends to approximate the property at risk within an area. Fire departments are charged
with being sufficiently prepared to prevent property loss by fire. Therefore, the cost of contracted fire
protection may be apportioned relative to the assessed value of the allied jurisdictions. In this case, high
valued buildings may pose a low risk to the community or to the fire department due to built-in fire protection
features. Typically, AV is used to apportion cost of shared service by applying the percentage of each
partner’s AV to the whole.43 The following table illustrates the allocation of cost by the assessed value of the
agencies, which represents the percentage of total cost share.
Figure 186: Cost Allocation by Assessed Value (2017)
Jurisdiction Assessed Value % of Total
Olympia FD $6,690,364,182 26%
Tumwater FD $3,257,477,653 13%
West Thurston RFA $1,993,328765 8%
Lacey Fire District 3 $10,200,777,243 40%
McLane/Black Lake Fire District $2,158,317,423 8%
East Olympia Fire District $1,396,487,595 5%
Total $25,696,752,861.00 100.0%
Pro: AV is updated regularly, helping to assure that adjustments for changes relative to new construction, annexation, and inflation are included. Because a third party (the assessor) establishes AV in accordance with state law, it is generally viewed as an impartial and fair measurement for cost apportionment. Fire protection is typically considered a property-related service; thus, allocation tied to property value has merit.
43 AV used is the total assessed value of the service area.

Regional Fire & Emergency Services Study City of Tumwater Fire Department
167
Con: AV may not reflect the risk associated with certain properties. Some high value properties present low risk. Some comparatively lower value properties may not fully represent the life risk, such as nursing homes or places of assembly, which might dictate more significant use of resources. In addition, some large facilities may seek economic development incentives through AV exemptions or reductions. Adjustments may need to be made to AV if such large tracts of exempt property in one jurisdiction cause an imbalance in the calculation. Last, AV typically includes the value of land, which is not usually at risk of loss by fire.
Consider: Discount AV by factoring it into a multi-variable allocation formula. As an additional consideration, assessors usually establish the AV in accord with the property tax cycle, which can lag somewhat behind the budget cycle of local agencies and the time when service contracts are reviewed or negotiated.
Deployment
The cost for service is based on the cost of meeting specific deployment goals. Deployment goals may be
tied to the physical location of fire stations, equipment, and personnel (strategic deployment) or by stating
the desired outcome of deployment (such as is contained in a standards of cover). A strategic (input) goal
could specify the location of stations, engines, ladder trucks, and number of active volunteer firefighters on
the roster, for example. A standards of cover might state the desired outcome (output) as three engine
companies, one ladder company, a battalion chief, an aid unit, and fifteen emergency workers on the scene
of all structure fire emergencies within 8 minutes, 90 percent of the time. While both strategic and outcome
goals can be used effectively to assist in allocating cost, ESCI views outcome goals to be more specifically
linked to the quality of service. This alternative however, is highly variable due to the independent desires of
each community in regard to outcome goals.
This type of scoring system for each agency allows the ranking of each area based on the assigned apparatus
and facilities required to deliver the staffing and required fire flow. The following illustrates the allocation of
cost by the number of resources deployed to serve each jurisdiction, including fire stations, frontline engines,
and ladder trucks (not including reserve apparatus).
Figure 187: Cost Allocation by Resource Deployment (2017)
Jurisdiction Facilities Engines
& Aerials Total
% of Total
Olympia FD 4 5 9 17.6%
Tumwater FD 2 2 4 7.8%
West Thurston RFA 5 6 11 21.6%
Lacey Fire District 3 5 6 11 21.6%
McLane/Black Lake Fire District 5 5 10 19.6%
East Olympia Fire District 4 2 6 11.8%
Total 25 26 51 100.00%
Pro: Deployment is intuitively linked to the level of service. The outcome of deployment based on a standards of cover can be monitored continuously to assure compliance. Such deployment can be adjusted if standards are not met. This assures the continuous quality of emergency response throughout the life of a service contract.

Regional Fire & Emergency Services Study City of Tumwater Fire Department
168
Con: Deployment may not equate to better service because such goals are prone to be used for political reasons and may not be used for quality of service reasons. Outcome goals require common reporting points and the automatic time capture of dispatch and response activities to assure accuracy. Record keeping needs to be meticulous to assure the accurate interpretation of emergency response outcomes.
Consider: Contracts for deployment-based fire protection should recognize that there is required infrastructure, such as administrative or overhead costs, as well as capital asset cost, depreciation, rent, and liability insurance. Thus, this allocation strategy is best used as part of a multi-variable allocation formula.
Service Demand
Service demand may be used as an expression of the workload of a fire department or geographical area.
Cost allocation based on emergencies would consider the total emergency response of the service area and
apportion system cost relative to the percentage of emergencies occurring in the jurisdictions.
Figure 188: Cost Allocation by Service Demand (2017)
Jurisdiction Service Demand % of Total
Olympia FD 11,293 34.2%
Tumwater FD 4,259 12.8%
West Thurston RFA 2,900 8.8%
Lacey Fire District 3 12,249 37.1%
McLane/Black Lake Fire District 1,417 4.3%
East Olympia Fire District 939 2.8%
Total 33,057 100.00%
Pro: Easily expressed and understood. Changes in the workload over the long term tend to mirror the amount of human activity (such as commerce, transportation, and recreation) in the corresponding area.
Con: Emergency response fluctuates from year to year depending on environmental and other factors not directly related to risk, which can cause dependent allocation to fluctuate as well. Further, the number of alarms may not be representative of actual workload; for example, one large emergency event requiring many emergency workers and lasting many hours or days versus another response lasting only minutes and resulting in no actual work. Finally, emergency response is open to (intentional and/or unintentional) manipulation by selectively downgrading minor responses, by responding off the air, or by the use of mutual aid. Unintentional skewing of response is most often found in fire systems where dispatch and radio procedures are imprecisely followed.
Consider: Using a rolling average of alarms over several years can help to suppress the normal tendency for the year-to-year fluctuation of emergencies. Combining the number of emergencies with the number of emergency units and/or personnel required may help to align alarms with actual workload more closely; however, doing so adds to the complexity of documentation. In a similar manner (and if accurate documentation is maintained), the agencies could consider using the total time required on emergencies as an aid to establish the comparative workload represented by each jurisdictional area.

Regional Fire & Emergency Services Study City of Tumwater Fire Department
169
Fixed Rate
The use of fixed fees or rates (such as a percentage) to calculate allocation of shared cost is more common
between municipalities and independent fire districts. Occasionally, fixed-rate contracts involve the
exchange of in-kind services.
Pro: The concept is simple and straightforward. A menu of service options and the fees corresponding to those alternatives can be developed by the contractor agency. The contracting agencies can tailor a desired level of service based on risk and community expectation by choosing from the various menu items.
Con: Partnering communities may change (i.e., population, jobs, commerce, structures, and risk) at divergent rates, causing a disconnect between the rationales used to establish the fee and the benefit received. A fixed-rate contract may be difficult to coherently link to the services provided and/or received, which can lead to a lack of support by officials and the community.
Consider: Partnering agencies need to assure that provision for rate adjustment is included in the agreement, including inflation. The inclusion of administrative and/or overhead cost also requires statement, as does the reconciliation of in-kind service exchange. The ownership and/or depreciation of capital assets should be addressed, as should rent, utilities, and liability insurance. In the case of a fixed fee, the agreement should establish how the participation of other public agencies in the partnership would affect cost.
Population
Payment for service can be based on the proportion of residential population to a given service area. The
following figure lists the population by jurisdiction and the percentage of the total number of individuals
living in each service area.
Figure 189: Cost Allocation by Population, (2018-TRPC)
Jurisdiction Population % of Total
Olympia FD 52,000 23.2%
Tumwater FD 23,210 10.4%
West Thurston RFA 22,980 10.2%
Lacey Fire District 3 98,000 43.7%
McLane/Black Lake Fire District 16,280 7.3%
East Olympia Fire District 11,750 5.2%
Total 224,220 100.00%
Pro: Residential population is frequently used by governmental agencies to measure and evaluate programs. The U.S. Census Bureau maintains an easily accessible database of the population and demographics of cities, counties, and states. The Thurston Regional Planning Council provides annually updated population numbers by jurisdiction and population projections.

Regional Fire & Emergency Services Study City of Tumwater Fire Department
170
Con: Residential population does not include the daily and seasonal movement of a transient population caused by commerce, industry, transport, and recreation. Depending on the local situation, the transient populations coming in (or going out) of an area can vary significantly, which can tend to skew community risk. Residential population does not statistically link with emergency workload; rather, human activities tend to be the linchpin that connects people to requests for emergency assistance.
For example, if residential population actually determined emergency workload, emergencies would peak when population was highest within a geographic area. However, in many communities where the residential population is highest from about midnight to about 6:00 am (bedroom communities), that time is exactly when the demand for emergency response is lowest. It turns out that emergency demand is highest when people are involved in the activities of daily life—traveling, working, shopping, and recreating. Often, the persons involved in such activities do not reside in the same area. Additionally, simply relying on population will not account for the effects that socio-economic conditions have on emergency service response activity.
Consider: Transient populations can be estimated by referring to traffic counts, jobs data, hotel/motel occupancy rates, and, in some cases, park visitor statistics. Residential population plus transient population is referred to as functional population. Service agreements based on population should be adjusted to account for instances when functional population is significantly different from residential population.
Multiple-Variable Allocation
Frequently, even though everyone may agree on the benefit of allied fire protection, officials find it difficult
to reach an accord on the cost. The differences between community demographics and/or development,
along with changes that occur within the system over the long term, can cause the perception of winners and
losers. This can be especially prevalent when a single variable is used to apportion cost. A service contract
based on more than one allocation determinate may help solve these problems.
For example, ESCI is familiar with a 911 dispatch center that serves more than 20 fire agencies of all sizes and
types—large, small, metropolitan, and rural; on-duty career and on-call volunteer. Here, the service contract
includes three determinates applied to each agency.
Base charge—10 percent of the dispatch center’s budget is divided equally between all agencies. This
charge is based on the acknowledgement that each agency is equally responsible to maintain the
dispatch center on continuous stand-by, irrespective of size of the agency or its use of the dispatch
services.
Usage charge—45 percent of the dispatch center’s budget is divided between the agencies in
accordance with the number of emergency dispatches made for each during the preceding year. The
member agencies determined that this charge fairly assesses the overall use of the 911 dispatch
system by each.
Risk charge—45 percent of the dispatch center’s budget is divided between the agencies in
accordance with the relative percentage of each department’s AV. The member agencies
determined that this charge is relational to each department’s community risk and that it is closely
associated with the overall ability to pay.

Regional Fire & Emergency Services Study City of Tumwater Fire Department
171
By apportioning the dispatch center cost over three variables, the members of this alliance have been able to
reach a long-term agreement that fits the diversity of the partnering agencies. Other partnerships in other
geographical areas may require a different solution involving different combinations of variables. In
summary, when choosing a cost-sharing strategy for partnered fire protection, it is important to keep any
apportionment formula fair, simple, and intuitively logical to assure that the public accepts and supports the
endeavor.
Allocation Summary
The information provided previously serves as a detail of cost allocation factors. Given the lengthy discussion
provided with each option, ESCI has compiled the information into a summary table illustrating the
distribution of factors between the agencies. These examples are for illustrative purposes and may be used
as part of a check for fairness of assigning the cost for service.
Figure 190: Summary of Cost Allocation Factors by Percentage (2017)
Jurisdiction Area Assessed
Value Resources
Service Demand
Population
Olympia FD 5.2% 26% 17.6% 34.2% 23.2%
Tumwater FD 4.7% 12.7% 7.8% 12.8% 10.4%
West Thurston RFA 42.2% 7.8% 21.6% 8.8% 10.2%
Lacey Fire District 3 18.2% 39.7% 21.6% 37.1% 43.7%
McLane/Black Lake Fire District 21.9% 8.4% 19.6% 4.3% 7.3%
East Olympia Fire District 7.8% 5.4% 11.8% 2.8% 5.2%
Total 100.00% 100.00% 100.00% 100.00% 100.00%
ESCI extrapolated the cost of emergency services using the most recent fiscal year budgeted amounts for
fire and EMS using a multiple variable formula. In addition to the individual funding alternatives, multiple-
variable scenarios are also provided as examples of how this type of methodology can be modified and
applied. The following figures show three multiple cost allocations by variable and the weighted
apportionment by percentage. The first allocates costs on the basis of assessed value (50 percent) and service
demand (50 percent).

Regional Fire & Emergency Services Study City of Tumwater Fire Department
172
Figure 191: 50% Assessed Value and 50% Service Demand (2017)
Jurisdiction Assessed
Value Service
Demand Allocation
Olympia FD 26% 34.2% 30.1%
Tumwater FD 12.7% 12.8% 12.8%
West Thurston RFA 7.8% 8.8% 8.3%
Lacey Fire District 3 39.7% 37.1% 38.4%
McLane/Black Lake Fire District 8.4% 4.3% 6.4%
East Olympia Fire District 5.4% 2.8% 4.1%
Total 100.00% 100.00% 100.00%
The second example allocates the cost based on service demand (50 percent), resources (25 percent), and
assessed value (25 percent).
Figure 192: 50% Service Demand, 25% Resources, 25% Assessed Value (2017)
Jurisdiction Service
Demand Resources
Assessed Value
Allocation
Olympia FD 34.2% 17.6% 26% 28.0%
Tumwater FD 12.8% 7.8% 12.7% 11.5%
West Thurston RFA 8.8% 21.6% 7.8% 11.7%
Lacey Fire District 3 37.1% 21.6% 39.7% 33.9%
McLane/Black Lake Fire District 4.3% 19.6% 8.4% 9.2%
East Olympia Fire District 2.8% 11.8% 5.4% 5.7%
Total 100.00% 100.00% 100.00% 100.00%
Any or all of the variables can be used to develop the cost allocation formula, and the weights can be adjusted
to emphasize or de-emphasize each variable. Figure 193 lists all of the variables as equally weighted and
results in the following multiple variable formulas:
Figure 193: All Variables at Equal Weights of 20% Each (2017)
Jurisdiction Area Assessed
Value Resources
Service Demand
Population Allocation
Olympia FD 5.2% 26% 17.6% 34.2% 23.2% 21.2%
Tumwater FD 4.7% 12.7% 7.8% 12.8% 10.4% 9.6%
West Thurston RFA 42.2% 7.8% 21.6% 8.8% 10.2% 18.0%
Lacey Fire District 3 18.2% 39.7% 21.6% 37.1% 43.7% 32.0%
McLane/Black Lake Fire District 21.9% 8.4% 19.6% 4.3% 7.3% 12.2%
East Olympia Fire District 7.8% 5.4% 11.8% 2.8% 5.2% 6.9%
Total 100.00% 100.00% 100.00% 100.00% 100.00% 100.00%
Whatever formula is used, care should be taken to avoid identifying a cost and then developing a formula to
achieve the desired cost. While affordability is an important factor, the developed formula should reflect an
appropriately balanced approach to addressing the service needs of participating agencies and allocating
costs based on the factors driving service decisions.

Regional Fire & Emergency Services Study City of Tumwater Fire Department
173
Issues & Impacts
• No permanent organizational commitment is made since this is a contract.
• All final decision-making power remains with individual organizations.
• Requires a collaborative approach to the management of the program(s) between the participating
administrations.
• Does not require public approval at the ballot box.
• Existing governing boards and council are preserved.
• Administrative leaders can be pulled in multiple directions serving multiple masters.
▪ A joint powers board may be formed to minimize this effect
• Requires blending rules, regulations, and operating procedures.
• Efficiency in administration by eliminating duplication or reassigning duplicate resources.
• Efficiencies may be gained in fleet maintenance and training.

Regional Fire & Emergency Services Study City of Tumwater Fire Department
174
Strategy C: Annexation
A city cannot merge with a fire district. It can, however, be annexed by a fire district. Thus, this option is
aimed at absorbing a city for fire protection purposes through an annexation. Annexation must come from
an adjacent fire district.
Level of Cooperation
Annexation of a city by a fire district is essentially an integration between those agencies. However, a city
annexed into a fire district may, after three years from the date of annexation, submit to their voters the
option to withdraw from the fire district. From the time an annexation is approved, the fire district will have
responsibility for the provision of fire and EMS services to the city. Annexation of the city requires separate
but concurrent special elections in each jurisdiction with a simple majority required in each jurisdiction for
approval.
By contrast, contractual consolidations, while providing a great deal of flexibility, can be terminated or
reversed by the joint action of the parties, by the expiration of the term of the contract or by the unilateral
action of one of the parties to the contract if the contract so provides.44
Annexation must be coordinated between the agencies and requires and begins with city council approval of
an ordinance indicating the intent of the city to join the district. The issue then goes to the district board of
fire commissioners for their concurrence. Upon approval by the board of fire commissioners, the issue is
submitted to the boundary review board for approval.
Prior to annexation being submitted to the voters for approval, a contract may need to be negotiated
between the fire district and the city that addresses payment to the district from the city for fire and EMS
services until such time as the district is collecting taxes for fire protection in the city. The contract is intended
to address the revenue gap, since immediately upon annexation approval by the voters, the district is
obligated to provide services, but would not otherwise receive payment for those services from the city until
the tax rolls are updated in the next revenue cycle. Once the tax rolls are changed, the fire district would
receive taxes from within the city as it does for all other district taxpayers and the city has no further
obligation for fire and EMS services or for financing these services.
Estimated Timeline for Completion
The timeline for this process varies depending upon the initiation of the process in relation to special election
cycles. However, this process can be completed in six months without difficulty. A contract to address the
revenue gap can be accomplished in a very short period of time if the parties are motivated to execute said
contract.
44 Snure, Brian K. Fire Service Consolidations. Snure Law Office: Des Moines, WA, 2011.

Regional Fire & Emergency Services Study City of Tumwater Fire Department
175
Affected Stakeholders
The citizens of each agency are affected by this strategy. City councils are impacted in that they no longer
have direct control over their fire and EMS services, deferring to the elected board of fire commissioners of
the merger district. Employees of the city fire department (used in this report to describe all personnel,
whether compensated or volunteer) are impacted as their employer changes and their employment status
may change depending on agreements between the city, the fire district, and employee representatives.
Summary/Objective of Strategy
This strategy combines a city and a fire district under fire district control and taxation. From an operational
standpoint, the entire jurisdiction would be served by the merger district with all transferred resources from
the city brought to bear on providing services to the expanded fire district. From a governance standpoint,
the board make-up remains the same unless, concurrently, the ballot measure provides for expansion of its
board membership to five members (or seven if the district budget is $10 million or higher). The district may
also decide to create commissioner districts as part of the annexation issue to provide the annexed city to
have elected representation on the board.
ESCI Guidance
Informal discussion between the participating agencies is necessary to determine the level of willingness to
consider implementation of this strategy. Assuming the parties agree to pursue this strategy, it would be
wise to obtain legal counsel to develop an annexation checklist of actions and activities needed to bring the
issue of annexation before the voters. It will also be necessary to communicate with existing constituencies,
both internal and external, on the value and benefits of pursuing this option.
Transfer of personnel from a city to an annexing district is outlined in statute.45 These statutory provisions
should be reviewed in detail by the district prior to the initiation of annexation proceedings to ensure that
the rights of all parties will be protected. Buy-off by employees (whether compensated or volunteer)
regarding the transfers, wages, benefits, and working conditions are critical to a successful integration,
whether statutorily required or not. This can be a key element to obtaining support by the larger communities
in the case of annexation.
Special Considerations
RCW 52.04.101 allows a city, having been annexed into a fire district, to call for an election to withdraw from
the fire district at least three years after annexation. This requires the city council to pass a resolution calling
for a vote by the city voters on annexation withdrawal. If the voters of the city approve the withdrawal, the
city will have withdrawn from the fire district without the consent or approval of the district. To date, no city
in Washington State has withdrawn from a fire district it annexed into.
45 RCW 52.04.111 through .131

Regional Fire & Emergency Services Study City of Tumwater Fire Department
176
Issues of reconciling district investment into the city service area during the intervening period, as well as
remedies for other unforeseen and perhaps unintended consequences of annexation withdrawal, are silent
in the statute. It is also silent regarding the changing boundaries of the district and whether a special review
committee appointed by the county commissioners must review such withdrawal. Legal counsel is
recommended in these cases.
Policy Actions
Annexation of a city into a fire district is subject to limited State Environmental Policy Act (SEPA) compliance.
This requires that either party designate itself as lead agency, prepare an environmental checklist, and issue
a Determination of Non-significance (DNS). The Environmental Checklist form is provided in WAC 197-11-
960.
ESCI’s review and discussion of Washington State Law on this topic has been necessarily brief; only sufficient
to ensure that basic provisions for annexation exist. As always, we emphasize that we are not qualified to
give legal advice. We recommend that all of the participating agencies consult with legal counsel experienced
in such matters before undertaking this strategy.
Fiscal Analysis
The purpose of this fiscal analysis is to provide a high-level assessment of the financial feasibility of Strategy
C: Annexation. The estimates and analysis presented are dependent on the outlined assumptions and subject
to change depending on actual factors that influence revenues and expenses. Key assumptions used in the
assessment are followed by high level estimates of revenues over five years. Specific implications of the
annexation strategy on the City of Tumwater’s property tax levy and the tax rates in all jurisdictions are
presented next. This section concludes with a summary of financial considerations associated with the
annexation strategy.
Key Assumptions
Revenues
Key assumptions used in developing the revenue estimates under the annexation are the same as the
assumptions used in the Fiscal Analysis section presented earlier in the report. Property taxes represent the
largest source of revenue for the combined operations. Property tax revenue assumptions specific to the
annexation strategy include:
• An effective date of the annexation prior to August 1, 2019. Note that property annexed prior to
August 1 is included in the property taxes levied for collection in the following year. Property annexed
after August 1 is included in the property taxes levied in the second year following the year of the
annexation. Note also that while the most recent reports of actual financial results for all agencies
date to 2017, we made forecasts for each agency to 2020 to concur with the assumed annexation
date.
Regional Fire & Emergency Services Study City of Tumwater Fire Department
177
• The county-wide EMS levy remains as it is. The current 2019 rate is $0.32 and in 2017 it was $0.35.
While it is possible to put an additional EMS levy before voters up to the maximum of $0.50 per $1,000
AV, we do not recommend this approach. Such an additional levy would be at risk to any increases in
the county levy, and in any case would not suffice to balance the budget.
• A levy lid lift to the statutory maximum levy rate of $1.50 per $1,000 assessed value is collected in all
annexed areas beginning in 2020.
• Continuation of the existing bond levies collected from property owners in the appropriate areas
where the bond levies were approved.
• Voter approval of a six-year excess levy in August 2019 for collection beginning in 2020 with amounts
equal to the estimated amount needed to balance projected revenue with projected expenses.
▪ The new excess levy overrides the existent excess levies in McLane Black Lake and West Thurston
Regional Fire Authorities.
Expenses
Expenses under the annexation strategy are assumed to be the same as the combined expenses of the
predecessor organizations. Note that this assumes the fire district also provides the ambulance services
currently provided by Tumwater. Actual expenses under an annexation approach are likely to be different
than these combined expenses. However, in ESCI’s evaluation of existing staffing, equipment, facility, and
operational conditions, we did not find excess capacity that would suggest significant cost savings. While
some expenses are likely to be higher others are likely to be lower. Using the combined expense projection
is considered reasonable for purposes of this analysis.
Forecast Results
The revenue forecast under the annexation strategy, using the assumptions identified above, results in
annual revenue that is approximately equal to the consolidated revenue forecast presented earlier in this
report. The forecasts are the same because both forecasts use the excess levy to balance revenues with
expenses. A summary of the annexation strategy revenue projection is shown in the following figures (shown
for annexations of Tumwater separately by EOFD, MLBFD, WTRFA, and LFD3).

Regional Fire & Emergency Services Study City of Tumwater Fire Department
178
Figure 194: Annexation of Tumwater by East Olympia Fire District
Assumed Revenue Sources
2020 2021 2022 2023 2024 2020–24
% Chg
Regular Property Tax Levy $ 7,356,971 $ 7,559,270 $ 7,772,948 $ 7,998,120 $ 8,234,900 11.9%
EMS Property Tax Levy $ - $ - $ - $ - $ - N/A
Other Taxes (M&O Levy) $ 374,758 $ 385,063 $ 395,948 $ 407,418 $ 419,479 11.9%
Ambulance Fees $ 2,428,654 $ 2,449,821 $ 2,470,988 $ 2,492,155 $ 2,513,323 3.5%
Other Revenue $ 952 $ 952 $ 952 $ 952 $ 952 0.0%
Subtotal Operations $ 10,161,335 $ 10,395,106 $ 10,640,836 $ 10,898,645 $ 11,168,653 9.9%
Annual Percent Increase 2.3% 2.4% 2.4% 2.5%
Bond Levy $ 354,252 $ 350,224 $ 346,196 $ - $ -
Total Revenue $ 10,515,587 $10,745,330 $10,987,032 $10,898,645 $ 11,168,653
The regular and excess levies decrease 7.1 percent over the five-year forecast period (and the total operating
levies decrease 8.6 percent) due to the 1 percent cap on increases during a time when assessed values are
forecast to increase more quickly (20.4%). The resulting levy rates are shown in the following figure.
Figure 195: Levy Rates for Annexation by East Olympia Fire District
Assumed Levy Rates 2020 2021 2022 2023 2024
Total Assessed Value $4,904,647,089 $5,155,328,930 $5,406,010,771 $5,656,692,612 $5,907,374,453
Total Regular Levy $ 1.5000 $ 1.4571 $ 1.4207 $ 1.3887 $ 1.3604
Total EMS Levy $ 0.3105 $ 0.2978 $ 0.2850 $ 0.2722 $ 0.2594
Total Excess Levy $ 0.0764 $ 0.0747 $ 0.0732 $ 0.0720 $ 0.0710
Total Operating Levy Rate $ 1.9533 $ 1.8935 $ 1.8409 $ 1.7930 $ 1.7493
Figure 196: Annexation of Tumwater by McLane Black Lake Fire Department
Assumed Revenue Sources
2020 2021 2022 2023 2024 2020–24
% Chg
Regular Property Tax Levy $ 8,212,480 $ 8,392,723 $ 8,579,064 $ 8,772,899 $ 8,973,663 9.3%
EMS Property Tax Levy $ - $ - $ - $ - $ - N/A
Other Taxes (M&O Levy) $ 1,336,088 $ 1,365,412 $ 1,395,728 $ 1,427,263 $ 1,459,925 9.3%
Ambulance Fees $ 2,552,868 $ 2,574,035 $ 2,595,202 $ 2,616,369 $ 2,637,536 3.3%
Other Revenue $ 528,910 $ 528,910 $ 528,910 $ 528,910 $ 528,910 0.0%
Subtotal Operations $ 12,630,347 $ 12,861,080 $ 13,098,904 $ 13,345,440 $ 13,600,034 7.7%
Annual Percent Increase 1.8% 1.8% 1.9% 1.9%
Bond Levy $ 936,185 $ 953,433 $ 970,681 $ 774,005 $ 791,741
Total Revenue $13,566,531 $13,814,513 $14,069,584 $14,119,446 $14,391,775
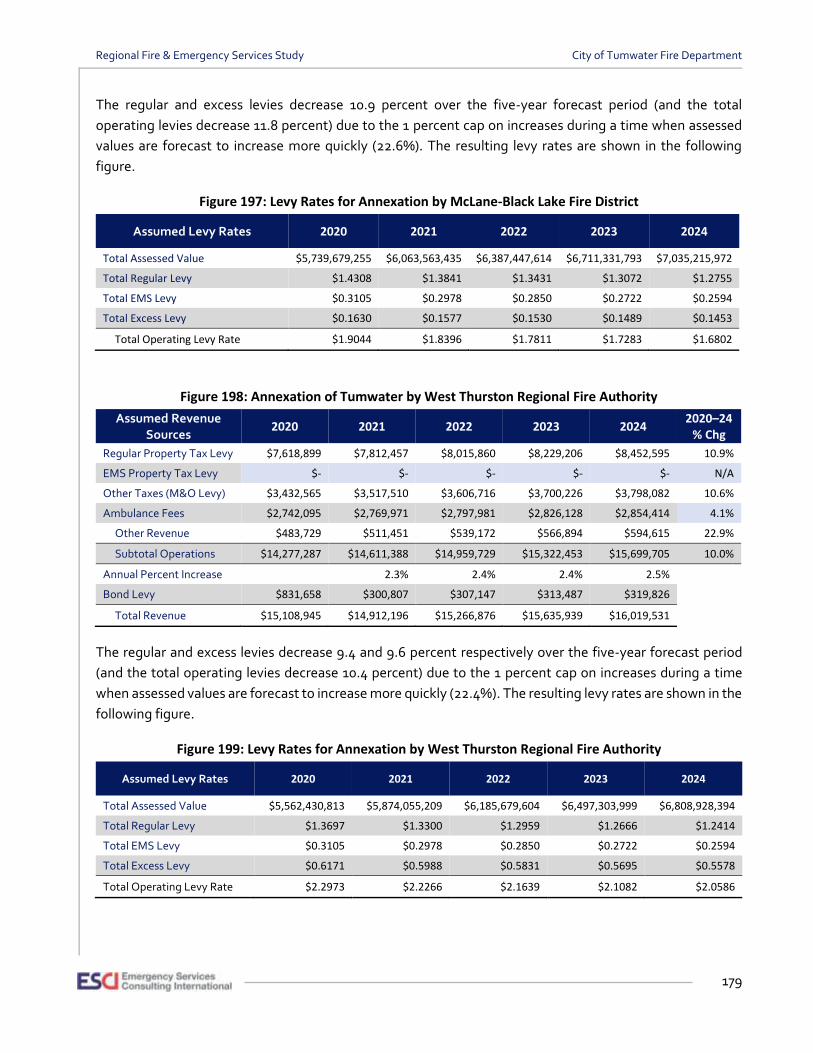
Regional Fire & Emergency Services Study City of Tumwater Fire Department
179
The regular and excess levies decrease 10.9 percent over the five-year forecast period (and the total
operating levies decrease 11.8 percent) due to the 1 percent cap on increases during a time when assessed
values are forecast to increase more quickly (22.6%). The resulting levy rates are shown in the following
figure.
Figure 197: Levy Rates for Annexation by McLane-Black Lake Fire District
Assumed Levy Rates 2020 2021 2022 2023 2024
Total Assessed Value $5,739,679,255 $6,063,563,435 $6,387,447,614 $6,711,331,793 $7,035,215,972
Total Regular Levy $1.4308 $1.3841 $1.3431 $1.3072 $1.2755
Total EMS Levy $0.3105 $0.2978 $0.2850 $0.2722 $0.2594
Total Excess Levy $0.1630 $0.1577 $0.1530 $0.1489 $0.1453
Total Operating Levy Rate $1.9044 $1.8396 $1.7811 $1.7283 $1.6802
Figure 198: Annexation of Tumwater by West Thurston Regional Fire Authority
Assumed Revenue Sources
2020 2021 2022 2023 2024 2020–24
% Chg
Regular Property Tax Levy $7,618,899 $7,812,457 $8,015,860 $8,229,206 $8,452,595 10.9%
EMS Property Tax Levy $- $- $- $- $- N/A
Other Taxes (M&O Levy) $3,432,565 $3,517,510 $3,606,716 $3,700,226 $3,798,082 10.6%
Ambulance Fees $2,742,095 $2,769,971 $2,797,981 $2,826,128 $2,854,414 4.1%
Other Revenue $483,729 $511,451 $539,172 $566,894 $594,615 22.9%
Subtotal Operations $14,277,287 $14,611,388 $14,959,729 $15,322,453 $15,699,705 10.0%
Annual Percent Increase 2.3% 2.4% 2.4% 2.5%
Bond Levy $831,658 $300,807 $307,147 $313,487 $319,826
Total Revenue $15,108,945 $14,912,196 $15,266,876 $15,635,939 $16,019,531
The regular and excess levies decrease 9.4 and 9.6 percent respectively over the five-year forecast period
(and the total operating levies decrease 10.4 percent) due to the 1 percent cap on increases during a time
when assessed values are forecast to increase more quickly (22.4%). The resulting levy rates are shown in the
following figure.
Figure 199: Levy Rates for Annexation by West Thurston Regional Fire Authority
Assumed Levy Rates 2020 2021 2022 2023 2024
Total Assessed Value $5,562,430,813 $5,874,055,209 $6,185,679,604 $6,497,303,999 $6,808,928,394
Total Regular Levy $1.3697 $1.3300 $1.2959 $1.2666 $1.2414
Total EMS Levy $0.3105 $0.2978 $0.2850 $0.2722 $0.2594
Total Excess Levy $0.6171 $0.5988 $0.5831 $0.5695 $0.5578
Total Operating Levy Rate $2.2973 $2.2266 $2.1639 $2.1082 $2.0586

Regional Fire & Emergency Services Study City of Tumwater Fire Department
180
Figure 200: Annexation of Tumwater by Lacey Fire District 3
Assumed Revenue Sources
2020 2021 2022 2023 2024 2020–24
% Chg
Regular Property Tax Levy $ 21,433,887 $ 22,168,982 $ 22,962,120 $ 23,813,881 $ 24,724,852 15.4%
EMS Property Tax Levy $ - $ - $ - $ - $ - N/A
Other Taxes (M&O Levy) $2,193,431 $2,268,657 $2,349,823 $2,436,988 $2,530,212 15.4%
Ambulance Fees $ 6,572,942 $ 6,744,903 $ 6,916,863 $ 7,088,824 $ 7,260,784 10.5%
Other Revenue $ 399,995 $ 410,008 $ 423,470 $ 441,318 $ 464,742 16.2%
Subtotal Operations $30,600,256 $31,592,550 $32,652,277 $33,781,011 $34,980,590 14.3%
Annual Percent Increase 3.2% 3.4% 3.5% 3.6%
Bond Levy $832,796 $841,192 $849,623 $858,090 $866,592
Total Revenue $31,433,052 $32,433,742 $33,501,900 $34,639,100 $35,847,182
The regular and excess levies decrease 6.4 percent over the five-year forecast period (and the total operating
levies decrease 8 percent) due to the 1 percent cap on increases during a time when assessed values are
forecast to increase more quickly (23.3%). The resulting levy rates are shown in the following figure.
Figure 201: Levy Rates for Annexation by Lacey Fire District 3
Assumed Levy Rates 2020 2021 2022 2023 2024
Total Assessed Value $14,289,257,991 $15,120,261,085 $15,951,264,180 $16,782,267,274 $17,613,270,369
Total Regular Levy $ 1.5000 $ 1.4662 $ 1.4395 $ 1.4190 $ 1.4038
Total EMS Levy $ 0.3105 $ 0.2978 $ 0.2850 $ 0.2722 $ 0.2594
Total Excess Levy $ 0.1535 $ 0.1500 $ 0.1473 $ 0.1452 $ 0.1437
Total Operating Levy Rate $ 1.9640 $ 1.9140 $ 1.8718 $ 1.8364 $ 1.8068
Impact on City of Tumwater Regular Property Tax Levy
Annexation of the City of Tumwater Fire Department by a fire district will impact the City’s property tax levy
by resulting in a net reduction in effective property tax.
• Statutory Maximum Property Tax Levy Rate. If the city is annexed by a fire district its statutory
maximum property tax levy rate will decrease from $3.10 per $1,000 of assessed value to $1.60 per
$1,000 of assessed value. The decrease is due to subtracting the annexing fire district’s statutory
maximum levy rate of $1.50 from the City’s statutory maximum levy rate. The City’s 2020 regular levy
rate is estimated to be $2.8917. After subtracting the general fund tax revenue allocated to fund the
fire department ($1.6806)—revenue that would no longer be needed to pay for fire department
expenses—the City’s 2020 levy rate would be $1.2111 or $0.3889 below the statutory maximum rate
under the annexation strategy. Without any changes the City’s 2020 estimated levy rate will be
$0.2083 below the City’s current statutory maximum levy rate.

Regional Fire & Emergency Services Study City of Tumwater Fire Department
181
Figure 202: Impact on City of Tumwater Regular Property Tax Levy
Levy Rate: Annexation Strategy Levy Rate
City Statutory Maximum Levy Rate $ 3.60
Less: Timberland Library District Levy* $ (0.50)
Adjusted Maximum Levy Rate—Current $ 3.10
Less: Municipal Fire District Levy* $ (1.50)
Maximum Levy Rate—With Annexation $ 1.60
*Actual levy rate is less - maximum levy rate shown.
Impact on Levy Rates in All Jurisdictions
Under the annexation strategy the same regular, EMS, and excess levy rates will apply to all jurisdictions. The
net impact on the tax rates—and taxes paid—in the predecessor jurisdictions will depend on the excess levy
rates needed to fund services under the current structure. A comparison of the forecasted 2020 status quo
levy rates and the 2020 levy rates under the various annexation scenarios are provided in the following
figures.
Figure 203: Tax Rate Changes Under East Olympia Fire District Annexation of Tumwater
2020 Levy Rate Taxes Paid
Status Quo Annexation Difference Difference % of Total Taxes Paid
Tumwater FD
Regular (2.8917 estimated) $1.5700 $1.5000 $(0.0700)
EMS $0.3501 $0.3501 $ -
Excess $ - $0.0764 $0.0764
Total $1.9201 $1.9265 $0.0064 $22,349 0.33%
East Olympia Fire District
Regular $1.5000 $1.5000 $ -
EMS $0.3501 $0.3501 $ -
Excess $ - $0.0764 $0.0764
Total $1.8501 $1.9265 $0.0764 $109,105 4.1%

Regional Fire & Emergency Services Study City of Tumwater Fire Department
182
Figure 204: Tax Rate Changes Under McLane-Black Lake Fire District Annexation of Tumwater
2020 Levy Rate Taxes Paid
Status Quo Annexation Difference Difference % of Total Taxes Paid
Tumwater FD
Regular (2.8917 estimated) $1.5700 $1.5000 $(0.0700)
EMS $0.3501 $0.3501 $ -
Excess $ - $0.1630 $0.1630
Total $1.9201 $2.0131 $0.0930 $323,436 4.8%
McLane/Black Lake Fire District
Regular (Dist. 5 & 9 combined) $1.4308 $1.5000 $0.0692
EMS $0.3501 $0.3501 $ -
Excess (Dist. 5 & 9 combined) $0.2089 $0.1630 $(0.0459)
Total $1.9898 $2.0131 $0.0233 $52,657 1.2%
Figure 205: Tax Rate Changes Under West Thurston Regional Fire Authority Annexation of Tumwater
2020 Levy Rate Taxes Paid
Status Quo Annexation Difference Difference % of Total Taxes Paid
Tumwater FD
Regular (2.8917 estimated) $1.5700 $1.5000 $(0.0700)
EMS $0.3501 $0.3501 $ -
Excess $ - $0.6171 $0.6171
Total $1.9201 $2.4672 $0.5471 $1,902,184 28.5%
West Thurston RFA
Regular $1.3209 $1.5000 $0.1791
EMS $0.3501 $0.3501 $ -
Excess (Dist. 1 & 11 combined) $0.5069 $0.6171 $0.1102
Total $2.1779 $2.4672 $0.2893 $603,320 13.3%

Regional Fire & Emergency Services Study City of Tumwater Fire Department
183
Figure 206: Tax Changes Under Lacey Fire District 3 Annexation of Tumwater
2020 Levy Rate Taxes Paid
Status Quo Annexation Difference Difference % of Total Taxes Paid
Tumwater FD
Regular (2.8917 estimated) $1.5700 $1.5000 $(0.0700)
EMS $0.3501 $0.3501 $ -
Excess $ - $0.1535 $0.1535
Total $1.9201 $2.0036 $0.0835 $290,382 4.3%
Lacey Fire District 3
Regular $1.5000 $1.5000 $ -
EMS $0.3501 $0.3501 $ -
Excess $ - $0.1535 $0.1535
Total $1.8501 $2.0036 $0.1535 $1,659,745 8.3%
As shown, levy rates and property taxes are projected to increase for both Tumwater and the annexing
district under each scenario. The net change for the entire area would be an increase in each scenario as well.
An annexation of Tumwater by the East Olympia Fire District would come the closest to a cost-neutral
scenario.
The expense forecast under the annexation strategy is the same expense forecast presented previously in
the report for the consolidated operation of all six jurisdictions.
Summary of Financial Considerations
Implementation of the annexation strategy will have financial implications that the agencies will need to
consider and potentially address. Those implications are summarized in the following:
• Reserve Funding Requirement. A newly constituted fire district would need to have adequate
reserves to fund ongoing operations and support equipment replacement. The next figure shows that
any annexation of Tumwater would likely require a transfer of some reserves from the City to the fire
district. Further, additional reserves may be required for the replacement of apparatus or other
equipment. To the extent additional reserves are needed, they will need to be factored into the
excess levy rate submitted to voters for approval.
Figure 207: Reserve Needs by Annexation Scenario
City Reserves District Reserves Joint Expenses Needed Reserves
Annexation by EOFD $6,864,000 $2,539,000 $10,270,000 $5,135,000
Annexation by WTRFA $6,864,000 $4,231,000 $15,002,000 $7,501,000
Annexation by MBLFD $6,864,000 $3,061,000 $12,630,000 $6,315,000
Annexation by LFD3 $6,864,000 $3,452,680 $30,600,000 $15,300,000

Regional Fire & Emergency Services Study City of Tumwater Fire Department
184
• City of Tumwater Revenue Capacity/Surplus. Upon annexation the City of Tumwater will no longer
be responsible for directly funding fire and EMS services. Using 2020 forecasted amounts, the City
will allocate approximately $7,865,000 in City General Fund revenue to pay for these services. These
funds could be available for other City purposes. The City’s plan for any surplus— reduction in taxes,
expansion of other services, investment in capital projects, etc.—is likely to be an important
consideration when the City’s voters assess the merits of the ballot measure to approve the
annexation. ESCI recommends that any savings from annexation be used to reduce taxes. Otherwise
the change would increase total taxes to the residents of Tumwater.
• Levy Lid Lift Vote/Excess Levy Vote Amount and Timing. This analysis assumes a regular property
tax levy of $1.50 per $1,000 assessed value, a continuing EMS levy of $0.3501 per $1,000 of assessed
value, and an additional excess levy in each scenario for the fully annexed and merged service area.
These will require that voters approve a levy lid lift (50 percent approval required) and the imposition
of a new excess levy, either in conjunction with an annexation vote or after the annexation and
merger are finalized. Any delay or failure of the lid lift or excess levy by voters would result in a need
for supplemental revenue or decreased expenditures. Having more revenue included in a regular levy
is desired since voter approval is not required to continue the levy from year to year and a regular
levy lid lift requires 50 percent approval.
• Tax Burden Shifts. As outlined above, the annexation strategy shifts some of the tax burden for
funding fire, EMS, and ambulance services away from the City and to the fire district. The City will
need to consider whether this impact needs to be mitigated and, if so, the strategies to deal with it
prior to the annexation. As stated above, ESCI recommends using City savings to reduce the tax
burden as one strategy.
• Funding for Additional Expenses. Elsewhere in this report ESCI identifies potential investments in
personnel, equipment, and information systems. If the collective agencies desire to make those
investments, any additional expenses will need to be factored into the revenue required from the
excess levy.
Issues & Impacts
• The City of Tumwater will have no direct control over fire services.
• The expanded district’s tax levy would extend over Tumwater, reducing the City tax capacity (though
actually increasing the capacity for a levy lid lift—see Figure 208).
Figure 208: Tumwater Lid Lift Potential—Annexation Scenario
City Levy Reduction Scenario Levy Rate
City Projected 2020 Rate $ 2.8917
City Maximum Rate $ 3.1000
Lid Lift Potential $ 0.2083
City Projected Rate After Annexation $ 1.3217
City Maximum Rate After Annexation $ 1.6000
Lid Lift Potential $ 0.2783

Regional Fire & Emergency Services Study City of Tumwater Fire Department
185
• Outstanding bonds remain with originating properties.
• All personnel are transferred to the fire district.
• TFD asset transfers are not required by statute, but is usually negotiated and agreed upon prior to
submission of the annexation initiative to the voters.
• Unresolved claims, litigation, or threatened actions in each separate agency must be identified and
coordinated to safeguard against any gaps in insurance coverage inadvertently created.
• Debt capacity will expand for the fire district after annexing the City.
• Expansion of the board from three to five is a consideration, as is formation of commissioner districts
to ensure city elected representation.
• Legal analysis and review prior to implementation are highly advised.

Regional Fire & Emergency Services Study City of Tumwater Fire Department
186
Strategy D: Regional Fire Authority
As stated previously in this report, a city cannot merge with a fire district. Regional Fire Authorities (RFAs)
are authorized by statute to create a relatively new governance model for the fire services of both cities and
fire districts.46 Essentially, an RFA operates in a very similar manner as a contract for services, but with shared
governance, voter approval, and the creation of an independent municipal corporation with its own taxing
authority and statutory framework.47 All of the participating agencies to this study are eligible to be included
in an RFA as they are all within “reasonable proximity” of each other.48
Level of Cooperation
This strategy requires the highest degree of cooperation between agencies of any of the integration options.
Statutorily, it starts with the formation of a Planning Committee.49 The Planning Committee is required to
have three elected representatives from each participating agency. The RFA plan serves as the charter for
the newly formed entity and outlines the services, service level standards, budget, funding mechanism(s),
governance, and any other considerations deemed appropriate by the committee. It becomes the plan voters
are asked to approve when voting on the formation of the RFA.
Estimated Timeline for Completion
While RFAs could technically be formed in as little as ninety days, it is more likely that the forming of an RFA
Planning Committee, the forming of an RFA plan, educating the constituents of the affected agencies,
holding an election, and transitioning from the current governance structure to the new governance structure
can take up to two years or longer.
Affected Sections
All sections of each fire department or fire district are affected in this strategy. Implementation of this
strategy creates a single fire agency.
Affected Stakeholders
Citizens currently served by the separate agencies will see their service provided by a new agency, and may
see their services change as a result. Employees of currently separate agencies will have their employer
change, and will need to engage in discussions with their current employers and the RFA planning committee
to establish provisional employment agreements in the event an RFA is formed.
46 RCW 52.26 47 Snure, Brian K. Fire Service Consolidations. Snure Law Office: Des Moines, WA, 2011. 48 RCW 52.26.020 (5) 49 RCW 52.26.030

Regional Fire & Emergency Services Study City of Tumwater Fire Department
187
The elected officials from participating cities, existing RFAs, and fire districts are also affected. Since the
governing statutes do not require a specific number of governing board members to serve on an RFA, the
RFA plan can call for as many or as few as the Planning Committee deems appropriate. The RFA can either
select from their existing elected membership, or they can call for RFA commissioner districts, who will be
elected from their respective districts by the RFA voters. This may impact the existing elected officials of
each agency.
While conventional wisdom calls for an uneven number of governing board members to make up the
governing board to avoid tie votes, ESCI is aware of two RFAs that were formed with an even number of
members; one with six and one with twelve members.
Personnel from all participating agencies are likely impacted since the fire agency will be redesigned to take
advantage of efficiencies, develop a more effective deployment model, and the pooled resources are likely
to modify the dynamics of each of the separate agencies.
Summary/Objective of Strategy
As in the annexation and merger strategy, this strategy combines all participating agencies into one. The
objectives should be the same:
• A smooth transition from multiple organizations into a single, cohesive organization;
• Obtaining balanced representation from the currently separate agencies; and
• To provide depth of resources, strength of service, financial sustainability, and resiliency.
This strategy combines all participating agencies into a single regional fire authority. Services would be
provided by the existing resources of all participating agencies, pooled and reconfigured to provide optimum
services, and governed by policymakers representing each participating agency. Once the RFA is formed, the
policymakers come together from the currently separate agencies as determined by the RFA plan, or from
commissioner districts to ensure balanced representation, again as determined by the RFA plan.
ESCI Guidance
If the parties agree to pursue this strategy, it requires the Planning Committee to form and adopt an RFA
plan for action first by the elected officials of each participating agency, then by the voters served by those
agencies as a homogenous group. It would also be prudent to obtain legal counsel as the Planning Committee
formulates the RFA plan before submitting the finished product to the voters. It will also be necessary to
communicate with existing constituencies, both internal and external, to educate them on the value and
benefits of pursuing this option.

Regional Fire & Emergency Services Study City of Tumwater Fire Department
188
Transfer of personnel from a city to an RFA is outlined in RCW 52.26. Under an RFA configuration, personnel
from the agencies joining forces become employees and members of the new organization (again, the term
“employees” is used here to identify both compensated and volunteer personnel). Unless an agreement for
different terms of transfer is reached between the collective bargaining representatives of the transferring
employees and the participating fire protection jurisdictions, employees will retain the rights, benefits, and
privileges that they had under their pre-existing collective bargaining agreements.50 While silent in the same
statute, this requirement likely also pertains to non-represented employees.
Special Considerations
It is a requirement of the statute to establish an RFA plan which addresses all of the various services, service
levels, governance, funding mechanisms, asset transfers, debt liabilities, and structure. The RFA Planning
Committee must determine whether all future changes to the plan are required to be submitted to the voters
for approval, no changes require voter approval, or some sections require voter approval and some only
require majority vote by the governing board. The difficulty is adopting a plan which makes clear the intent
of the parties without tying the hands of future elected officials if circumstances change which necessitate
modification. If those modifications are regarding the substance of the plan, it will require voter approval to
make the changes. In no circumstance can the plan exceed statutory authority.
ESCI recommends that dynamic components of the plan, such as service levels and performance, be
addressed in detail in a separate document by referral. In this way, the RFA plan addresses the specifics of
service level by reference to the separate document, noting that it is periodically reviewed and modified as
necessary by the governing board. Alternatively, the plan should state that these service levels and
performance elements are able to be modified by majority vote of the then existing governing board.
Policy Actions
RFAs do not change the boundaries of the participating jurisdictions. The participating jurisdictions may
continue to exist after the formation of the RFA (in the case of Tumwater and Olympia, they certainly
continue to exist as cities, but without their own fire departments). The fire districts would continue to exist
for the sole purpose of providing elected officials for the governing board. RCW 52.26.120 provides a
mechanism for dissolving the fire districts if RFA commissioner districts are created to serve on the governing
board. In the latter case, commissioners are directly elected by the voters within the RFA and may be one or
all of the governing board positions.51
ESCI’s review and discussion of Washington State Law on this topic has been necessarily brief; only sufficient
to ensure that basic provisions for RFA formation exist. As always, we emphasize that we are not qualified to
give legal advice. We recommend the participating agencies consult with legal counsel experienced in such
matters before undertaking this strategy.
50 RCW 52.26.100 (6) 51 RCW 52.26.080 (3)
Regional Fire & Emergency Services Study City of Tumwater Fire Department
189
Fiscal Analysis
The purpose of this fiscal analysis is to provide a high-level assessment of the financial feasibility of the
formation of an RFA. The estimates and analysis presented are dependent on the outlined assumptions and
subject to change depending on actual factors that influence revenues and expenses. Key assumptions used
in the assessment are followed by high level estimates of revenues over five years. Specific implications of
the RFA strategy on the property tax levies for the Cities of Tumwater and Olympia, as well as the tax rates
for each fire district and RFA are presented next. This section concludes with a summary of financial
considerations associated with the RFA strategy.
Key Assumptions
Revenues
The revenue assumptions used in the analysis of Strategy D: RFA for each potential participating agency
follow. Property taxes represent the largest source of revenue for the combined operations. Property tax
revenue assumptions specific to the RFA strategy include:
• An effective date of the RFA formation prior to August 1, 2019. Note that property tax collections are
fixed after August 1 each year. If the RFA is formed after August 1, property taxes would be allocated
to the RFA in its second year, and arrangements would need to be made with prior jurisdictions to
obtain revenues in the first year. Note also that while the most recent reports of actual financial
results for all agencies date to 2017, we made forecasts for each agency to 2020 to concur with the
assumed effective date.
• The county-wide EMS levy remains as it is. The current 2019 rate is $0.32 and in 2017 it was $0.35.
While it is possible to put an additional EMS levy before voters up to the maximum of $0.50 per $1,000
AV, we do not recommend this approach. Such an additional levy would be at risk to any increases in
the county levy, and in any case would not suffice to balance the budget.
• A levy lid lift to the statutory maximum levy rate of $1.50 per $1,000 assessed value is collected in all
integrated areas beginning in 2020.
• Continuation of the existing bond levies collected from property owners in the appropriate areas
where the bond levies were approved.
• Voter approval of a six-year excess levy in August 2019 for collection beginning in 2020 with amounts
equal to the estimated amount needed to balance projected revenue with projected expenses.
▪ The new excess levy overrides the existing excess levies in McLane Black Lake and Western
Thurston Regional Fire Authorities if these agencies are included.

Regional Fire & Emergency Services Study City of Tumwater Fire Department
190
Expenses
Expenses under the RFA strategy are assumed to be the same as the combined expenses of the predecessor
organizations. Actual expenses under an RFA approach are likely to be different than these combined
expenses. However, in ESCI’s evaluation of existing staffing, equipment, facility and operational conditions,
we did not find substantial excess capacity that would suggest significant cost savings. While some expenses
are likely to be higher others are likely to be lower. Using the combined expense projection is considered
reasonable for purposes of this analysis.
Forecast Results
The revenue forecast under the RFA strategy, using the assumptions identified above, results in annual
revenue that is approximately $68,358,000 in 2020 if all agencies are included, or about $52,429,000 if
WTRFA and MBLFD are not included. A summary of the RFA strategy revenue projections is shown in the
following figure.
Figure 209: RFA Revenue Projections, All Agencies
RFA Assumed Revenue
Sources, All Agencies 2020 2021 2022 2023 2024
2020–24 % Chg
Regular Property Tax Levy $40,650,631 $41,478,070 $42,383,929 $43,323,400 $44,298,048 9.0%
EMS Property Tax Levy $ - $ - $ - $ - $ - N/A
Other Taxes (M&O Levy) $12,305,353 $12,555,827 $12,830,040 $13,114,428 $13,409,463 9.0%
Ambulance Fees $9,850,902 $10,085,602 $10,318,751 $10,551,901 $10,785,050 9.5%
Other Revenue $1,405,618 $1,423,029 $1,468,229 $1,513,499 $1,558,841 10.9%
Subtotal Operations $64,212,504 $65,542,528 $67,000,950 $68,503,228 $70,051,402 9.1%
Annual Percent Increase 2.1% 2.2% 2.2% 2.3%
Bond Levy $4,145,310 $3,622,809 $3,655,599 $3,117,845 $3,151,643
Total Revenue $68,357,814 $69,165,337 $70,656,548 $71,621,073 $73,203,045
Figure 210: RFA Revenue Projections, OFD, TFD, LFD3, & EOFD
RFA Assumed Revenue Sources without WTRFA
and MBLFD 2020 2021 2022 2023 2024
2020–24 % Chg
Regular Property Tax Levy $34,127,680 $ 35,176,106 $36,296,712 $37,490,221 $ 38,757,361 13.6%
EMS Property Tax Levy $ - $ - $ - $ - $ - N/A
Other Taxes (M&O Levy) $ 6,138,175 $ 6,326,744 $ 6,528,295 $ 6,742,958 $ 6,970,865 13.6%
Ambulance Fees $ 9,370,799 $ 9,605,499 $ 9,840,199 $10,074,900 $ 10,309,600 10.0%
Other Revenue $ 407,568 $ 424,938 $ 442,377 $ 459,885 $ 477,464 17.1%
Subtotal Operations $ 50,044,221 $ 51,533,287 $ 53,107,583 $54,767,964 $56,515,291 12.9%
Annual Percent Increase 3.0% 3.1% 3.1% 3.2%
Bond Levy $2,384,700 $2,402,237 $2,401,457 $2,419,064 $2,056,046
Total Revenue $ 52,428,921 $ 53,935,524 $ 55,509,040 $ 57,187,027 $ 58,571,337

Regional Fire & Emergency Services Study City of Tumwater Fire Department
191
When all agencies are included, the regular and excess levies decrease 6.7 percent over the five-year forecast
period (and the total operating levies decrease 8%) due to the 1 percent cap on increases during a time when
assessed values are forecast to increase more quickly (20.7%). The resulting levy rates are shown in the
following figure.
Figure 211: RFA Levy Rate Projections, All Agencies
RFA Assumed Levy Rates
All Agencies 2020 2021 2022 2023 2024
Total Assessed Value $27,100,420,800 $28,504,088,739 $29,907,756,677 $31,311,424,616 $32,715,092,555
Total Regular Levy $1.5000 $1.4671 $1.4398 $1.4175 $1.3995
Total EMS Levy $0.3105 $0.2978 $0.2850 $0.2722 $0.2594
Total Excess Levy $0.4504 $0.4406 $0.4324 $0.4257 $0.4203
Total Operating Levy Rate $2.2610 $2.2054 $2.1572 $2.1153 $2.0791
When WTRFA and MBLFD are not included, the regular and excess levies decrease 6.3 percent over the five-
year forecast period (and the total operating levies decrease 7.8%) due to the 1 percent cap on increases
during a time when assessed values are forecast to increase more quickly (21.2%). The resulting levy rates
are shown in the following figure.
Figure 212: RFA Levy Rate Projections, OFD, TFD, LFD3, & EOFD
RFA Assumed Levy Rates
without WTRFA and MBLFD 2020 2021 2022 2023 2024
Total Assessed Value $22,751,786,910 $23,958,467,147 $25,165,147,383 $26,371,827,620 $27,578,507,857
Total Regular Levy $ 1.5000 $ 1.4682 $ 1.4423 $ 1.4216 $ 1.4053
Total EMS Levy $ 0.3105 $ 0.2978 $ 0.2850 $ 0.2722 $ 0.2594
Total Excess Levy $ 0.2698 $ 0.2641 $ 0.2594 $ 0.2557 $ 0.2528
Total Operating Levy Rate $ 2.0803 $ 2.0300 $ 1.9867 $ 1.9495 $ 1.9175
Impact on City of Tumwater Regular Property Tax Levy
Formation of an RFA will impact the City’s property tax levy by resulting in a net reduction in effective
property tax.
• Statutory Maximum Property Tax Levy Rate. If the City joins in the formation of an RFA its statutory
maximum property tax levy rate will decrease from $3.10 per $1,000 of assessed value (after
accounting for the library district) to $1.60 per $1,000 of assessed value (see following figure). The
decrease is due to subtracting the annexing fire district’s statutory maximum levy rate of $1.50 from
the City’s statutory maximum levy rate. The City’s 2020 regular levy rate is estimated to be $2.8917.
After subtracting the General Fund tax revenue allocated to fund the fire department ($1.6806)—
revenue that would no longer be needed to pay for fire department expenses—the City’s 2020 levy
rate would be $1.2111 or $0.3889 below the statutory maximum rate under the annexation strategy.
Without any changes the City’s 2020 estimated levy rate will be $0.2083 below the City’s current
statutory maximum levy rate.

Regional Fire & Emergency Services Study City of Tumwater Fire Department
192
Impact on Levy Rates in All Jurisdictions
Under the RFA strategy the same regular, EMS, and excess levy rates will apply to all jurisdictions. The net
impact on the tax rates—and taxes paid—in the predecessor jurisdictions will depend on the excess levy rates
needed to fund services under the current structure. A comparison of the forecasted 2020 status quo levy
rates and the 2020 levy rates under the various RFA scenarios are provided in the following figures.
Figure 213: Status Quo vs. RFA Levy Rates, All Agencies
All Agencies Included 2020 Levy Rate Taxes Paid
Status Quo RFA Difference Difference % of Total Taxes Paid
Olympia FD
Regular – 2.5353 estimated* $2.1669 $1.5000 $(0.6669)
EMS $0.3105 $0.3105 $ -
Excess $ - $0.4504 $0.4504
Total $2.4775 $2.2610 $(0.2165) $(1,522,888) -8.7%
Tumwater FD
Regular – 2.8917 estimated* $1.5700 $1.5000 $(0.0700)
EMS $0.3105 $0.3105 $ -
Excess $ - $0.4504 $0.4504
Total $1.8805 $2.2610 $0.3805 $1,322,763 20.2%
West Thurston RFA
Regular $1.3209 $1.5000 $0.1791
EMS $0.3105 $0.3105 $ -
Excess (Dist. 1 & 11 combined) $0.5069 $0.4504 $(0.0565)
Total $2.1384 $2.2610 $0.1226 $255,726 5.7%
Lacey Fire District 3
Regular $1.5000 $1.5000 $ -
EMS $0.3105 $0.3105 $ -
Excess $ - $0.4504 $0.4504
Total $1.8105 $2.2610 $0.4504 $4,870,408 24.9%
McLane/Black Lake Fire District
Regular (Dist. 5 & 9 combined) $1.4308 $1.5000 $0.0692
EMS $0.3105 $0.3105 $ -
Excess (Dist. 5 & 9 combined) $0.2089 $0.4504 $0.2415
Total $1.9503 $2.2610 $0.3107 $703,099 15.9%
East Olympia Fire District
Regular $1.5000 $1.5000 $ -
EMS $0.3105 $0.3105 $ -
Excess $ - $0.4504 $0.4504
Total $1.8105 $2.2610 $0.4504 $643,189 24.9%
* These figures denote the total forecasted regular levy rate for the two cities. The figures used in the chart represents the effective levy rate of the forecasted cities’ fire expenses.

Regional Fire & Emergency Services Study City of Tumwater Fire Department
193
As shown in the previous figure, when all agencies are included levy rates and property taxes are projected
to decrease over all for Olympia, but increase for all the other jurisdictions. The net change for the entire area
would be an increase in each scenario as well. The expense forecast under the RFA strategy is the same
expense forecast presented earlier in the report for the consolidated operation of all six jurisdictions.
When WTRFA and MBLFD are not included (next figure), levy rates and property taxes are projected to act
similarly to the above scenario, but the over-all increase is significantly smaller. The net change for the entire
area would be an increase in each scenario as well.
Figure 214: Status Quo vs. RFA Levy Rates, OFD, TFD, LFD3, & EOFD
2020 Levy Rate Taxes Paid
Status Quo RFA Difference Difference % of Total Taxes Paid
Olympia FD
Regular – 2.5353 estimated* $ 2.1669 $ 1.5000 $ (0.6669)
EMS $ 0.3105 $ 0.3105 $ -
Excess $ - $ 0.2698 $ 0.2698
Total $ 2.4775 $ 2.0803 $ (0.3971) $ (2,793,711) -16.0%
Tumwater FD
Regular – 2.8917 estimated* $ 1.5700 $ 1.5000 $ (0.0700)
EMS $ 0.3105 $ 0.3105 $ -
Excess $ - $ 0.2698 $ 0.2698
Total $ 1.8805 $ 2.0803 $ 0.1998 $ 694,680 10.6%
Lacey Fire District 3
Regular $ 1.5000 $ 1.5000 $ -
EMS $ 0.3105 $ 0.3105 $ -
Excess $ - $ 0.2698 $ 0.2698
Total $ 1.8105 $ 2.0803 $ 0.2698 $ 2,917,096 14.9%
East Olympia Fire District
Regular $ 1.5000 $ 1.5000 $ -
EMS $ 0.3105 $ 0.3105 $ -
Excess $ - $ 0.2698 $ 0.2698
Total $ 1.8105 $ 2.0803 $ 0.2698 $ 385,234 14.9%

Regional Fire & Emergency Services Study City of Tumwater Fire Department
194
Summary of Financial Considerations
Implementation of the RFA strategy will have financial implications that the agencies will need to consider
and potentially address. Those implications are summarized as follows:
• Reserve Funding Requirement. The newly formed RFA will need to have adequate reserves to fund
ongoing operations and support equipment replacement. The total unrestricted reserves of the
agencies as of the end of 2017 was an estimated $26,143,000 (the two cities account for $15,645,000
of this—not earmarked specifically for fire). The amount of reserves transferred from each city to an
RFA (if any) would need to be negotiated. The reserves of the fire districts would provide 35% of the
2017 consolidated operating costs—enough for a 4-month reserve fund, which could be minimally
adequate (6 months would be preferable). In addition, further reserves may be required for the
replacement of apparatus or other equipment. To the extent additional reserves are needed they will
need to be factored into the excess levy rate developed in the RFA plan and submitted to voters for
approval.
• Revenue Capacity/Surplus for Cities. Upon formation of an RFA the two Cities would no longer be
responsible for directly funding fire and EMS services. Using 2020 forecasted amounts, the cities
allocated approximately $16,523,000 in city general tax fund revenue to pay for these services. ESCI
recommends that savings from the formation of an RFA be used to reduce taxes. Otherwise the
change would increase total taxes to the taxpayers in the cities.
• Tax Burden Shifts. As outlined above, the RFA strategy shifts some of the tax burden for funding
fire, EMS, and ambulance services away from the cities and to the RFA.
• Funding for Additional Expenses. Elsewhere in this report ESCI identifies potential investments in
personnel, equipment, and information systems. If the collective agencies desire to make those
investments any additional expenses will need to be factored into the revenue required from the
excess levy.
Issues & Impacts
• The cities will share in the governance of fire services by the city councils appointing representatives
to the RFA Governing Board as identified in the RFA plan, unless commissioner districts are formed.
If districts are formed, council members would likely still be appointed until commission seats are
elected and seated on the RFA Governing Board.
• The RFA’s tax levy would extend over Tumwater, reducing the city tax capacity (though actually
increasing the capacity for a levy lid lift—see following figure).

Regional Fire & Emergency Services Study City of Tumwater Fire Department
195
Figure 215: Tumwater Lid Lift Potential, RFA Scenario
City Levy Reduction Scenario Levy Rate
City Projected 2020 Rate $ 2.8917
City Maximum Rate $ 3.1000
Lid Lift Potential $ 0.2083
City Projected Rate After RFA Formation $ 1.3217
City Maximum Rate After RFA Formation $ 1.6000
Lid Lift Potential $ 0.2783
• Outstanding voted bonds will continue to be paid from taxes on the original properties unless
restructured as per the RFA plan.
• All personnel are transferred to the RFA.
• City asset transfers are not required by statute, but are usually addressed in the RFA plan.
• District assets are transferred to the RFA since there is no need for the assets to be retained by the
district.
• Unresolved claims, litigation, or threatened actions in each separate agency must be identified and
coordinated to safeguard against any inadvertently created gaps in insurance coverage.
• Make-up of the governing board should represent interests of the parties and ensure balance, such
as formation of commissioner districts to ensure balanced representation.
• Legal analysis and review prior to implementation are highly advised.
Strategy E: Formation of a Municipal Fire District
New (2017) enabling legislation has created the opportunity for a city to form a new fire district that is
identical to the existing boundaries of the city.52 The city council may take action to establish a fire district by
passing a resolution, which must at least contain the following:
• A financing plan for the fire district, including the imposition of revenue sources, such as property
taxes or benefit charges, and
▪ the dollar amount the fire protection district will levy in the first year in which the fire protection
district imposes any regular property taxes;
▪ the city's highest lawful levy, reduced by the fire district’s levy amount, which is the city’s new
lawful levy limit since 1986;
▪ the estimated aggregate net dollar amount impact on property owners within the city based on
the changes;
• Set a date for a public hearing on the resolution.
52 RCW 52.02.160

Regional Fire & Emergency Services Study City of Tumwater Fire Department
196
The plan must be approved by the voters of the city at a general election by simple majority, unless a benefit
charge is imposed, which requires sixty percent approval by voters.
If a resolution forming a fire district provides that the Municipal Fire District will be governed by a board of
fire commissioners, then the initial fire commissioners must be elected at the same election where the
resolution is submitted to the voters authorizing the creation of the fire district.
Level of Cooperation
This strategy requires no cooperation with any neighboring agencies or other parties to this study. It does,
however, require coordination with the county elections office and county assessor’s office. The process
ultimately requires assent by the voters for formation.
Estimated Timeline for Completion
ESCI predicts that the process could take less than one year from creation of the resolution, development of
the financing plan, conducting of a public hearing, submission to the electorate, and effective date of
formation.
Affected Sections
All sections of the fire department are affected in this strategy, but only marginally in that only the employer
and form of government changes. Implementation of this strategy simply transfers the fire department to a
new fire district with the same service area, same resources, same personnel, and a different governance
structure (fire district commissioners instead of a city council).
Affected Stakeholders
Citizens currently served by the city fire department will see their service provided by a new agency.
Employees of the city fire department will have their employer change, but are to be kept whole by statute
unless a different negotiated agreement is made between the employer and the collective bargaining
representatives currently in place.53
The elected officials from the city may also be affected. Since the governing statutes do not require a
separate board of fire commissioners to be created, the current elected city council (or an appointed subset)
serves in that capacity ex officio, or may relinquish governance authority of the fire district to an
independently elected board of commissioners that is established within the resolution and election forming
the fire district, or may relinquish governance authority of the fire district to an appointed board of three fire
commissioners at any time after formation. Each appointed commissioner serves until successors are elected
at the next qualified election.
53 RCW 52.02.180 (6)(a)

Regional Fire & Emergency Services Study City of Tumwater Fire Department
197
Summary/Objective of Strategy
The formation of a fire district with boundaries identical to the current boundaries of the city provides
autonomy within the city while also detaching the fire protection services from the municipal government.
The city lowers its maximum property taxing authority by the amount of property taxation the fire district
assesses, making the tax implications potentially neutral to the taxpayers.
All resources and personnel currently employed by the city for the delivery of fire and emergency medical
services are transferred or credited to the fire district. All funds, credits or other assets held by the city for fire
and EMS services are transferred to the fire district.
ESCI Guidance
As a new statute, ESCI is unaware of any agencies in the State of Washington to implement this statute. New
territory is being explored. Thus, it would be prudent to acquire legal counsel guidance as the resolution is
drafted and the financing plan crafted. While this would be a first, the process is entirely within the control of
the city forming the fire district. ESCI advises proceeding slowly and thoroughly if this option is pursued.
Special Considerations
Careful analysis of comingled equipment reserve funds set aside for fire apparatus replacement, along with
other municipal equipment unrelated to fire apparatus will be an important consideration. So too are legacy
costs, such as pension liabilities or other post-employment benefits (OPEB) provided for in statute or in
current collective bargaining agreements, for example.
Policy Actions
A city contemplating the establishment of a municipal fire district must ensure the fire district starts off on
the right foot. Establishing a weak fire district may ultimately cause a drain on municipal finances if, for
example, the fire district starts off with a property tax levy below its maximum authority and insufficient to
provide similar services to what the city fire department had provided historically. In this case, the fire district
would have to levy its maximum property tax levy, requiring the city to reduce its maximum lawful tax rate
to compensate.
In ESCI’s opinion, establishing an independent board of fire commissioners, whether initially or not long after
the district is formed, is key to the fire district’s success. It avoids the appearance of conflicts of interest or
the very real dilemma that may be faced by a city council member acting as an ex officio board member and
having to decide between what is best for the city and what is best for the fire district if the issue is mutually
exclusive.
ESCI’s review and discussion of Washington State Law on this topic has been necessarily brief; only sufficient
to ensure that basic provisions for RFA formation exist. As always, we emphasize that we are not qualified to
give legal advice. We recommend the participating agencies consult with legal counsel experienced in such
matters before undertaking this strategy.
Regional Fire & Emergency Services Study City of Tumwater Fire Department
198
Fiscal Analysis
When forming a municipal fire district, a city must reduce its general fund regular property tax levy by the
total combined levy of the fire protection district as proposed by the district. The reduced levy amount of the
city must occur in the first year in which the fire district imposes any of the property taxes authorized in RCW
52.16.130, 52.16.140, or 52.16.160. If the fire district does not impose all three levies under RCW 52.16.130,
52.16.140, and 52.16.160 when it begins operations, the city must further reduce its general fund regular
property tax levy if the district initially imposes any of the levies in subsequent years, by the amount of such
levy or levies initially imposed in a subsequent year.
Key Assumptions
Revenues The following revenue assumptions used in the analysis of Strategy E: Formation of a Municipal Fire District
are the same in as previous scenarios. Property taxes represent the largest source of revenue for the
combined operations.
• An effective date of district formation prior to August 1, 2019. Note that this allows for properties to
be included in the property taxes levied for collection in the following year. Formation after August 1
would result in property taxes levied in the second year following the year of district formation. Note
also that while the most recent reports of actual financial results for all agencies date to 2017, we
made forecasts for each agency to 2020 to concur with the assumed annexation date.
• The county-wide EMS levy remains as it is. In 2017 the rate was $0.35 and the current 2019 rate is
$0.32—our forecast for 2020 is $0.3105. While it is possible to put an additional EMS levy before
voters up to the maximum of $0.50 per $1,000 AV, we do not recommend this approach. Such an
additional levy would be at risk to any increases in the county levy.
• A levy of the statutory maximum levy rate of $1.50 per $1,000 assessed value is collected for the
municipal district beginning in 2020.
• Assumption of all debt attributable to the Fire Department by the Municipal Fire District.
• Fire inspections and permitting (and associated revenues) remain within the city. These services
could be performed via contract with the new Municipal Fire District, but they would nevertheless
likely be contracted in a cost-neutral manner.
• Voter approval of a six-year excess levy in August 2019 for collection beginning in 2020 with amounts
equal to the estimated amount needed to balance projected revenue with projected expenses.
Expenses Expenses under the Municipal District strategy are assumed to be the same as those of the city’s department.
Actual expenses under a Municipal District approach are likely to be different than these combined expenses.
However, in ESCI’s evaluation of existing staffing, equipment, facility and operational conditions, we did not
find significant excess capacity that would suggest significant cost savings. While some expenses are likely
to be higher others are likely to be lower. Using the combined expense projection is considered reasonable
for purposes of this analysis.

Regional Fire & Emergency Services Study City of Tumwater Fire Department
199
Forecast Results The revenue forecast under the Municipal District strategy, using the assumptions identified above, results
in annual revenue of $8,171,670 in 2020. A summary of the Municipal District strategy revenue/expense
projection is shown in the following figure. Since expenses are projected to grow more quickly than revenues,
the excess levy is initially set to create a surplus. The sum of the resulting surpluses and deficits is set to equal
out over the five-year forecast period.
Figure 216: Tumwater Fire Department Revenue Sources, Municipal Fire District Scenario
Municipal District Assumed
Revenue Sources, TFD 2020 2021 2022 2023 2024
2020–24 % Chg
Regular Property Tax Levy $5,215,107 $5,347,966 $5,487,307 $5,633,195 $5,785,696 10.9%
EMS Property Tax Levy $ - $ - $ - $ - $ - N/A
Other Taxes (M&O Levy) $526,957 $540,381 $554,461 $569,202 $584,611 10.9%
Ambulance Fees $2,406,654 $2,427,821 $2,448,988 $2,470,155 $2,491,323 3.5%
Other Revenue $22,952 $22,952 $22,952 $22,952 $22,952 0.0%
Subtotal Operations $8,171,670 $8,339,120 $8,513,708 $8,695,504 $8,884,582 8.7%
Annual Percent Increase 2.0% 2.1% 2.1% 2.2%
Bond Levy $ - $ - $ - $ - $ -
Total Revenue $8,171,670 $8,339,120 $8,513,708 $8,695,504 $8,884,582
Total Expenses $7,865,066 $8,192,775 $8,520,698 $8,848,840 $9,177,205
Net Revenue (Deficit) $306,604 $146,345 $(6,990) $(153,335) $(292,623)
The excess levy increases 8.7 percent over the five-year forecast period with annual increases of about 2
percent from 2020 through 2024. The resulting levy rates are shown in the following figure.
Figure 217: Tumwater Fire Department Levy Rate, Municipal Fire District Scenario
Assumed Levy Rates TFD Municipal District
2020 2021 2022 2023 2024
Total Assessed Value $3,476,738,089 $3,695,998,526 $3,915,258,962 $4,134,519,398 $4,353,779,834
Total Regular Levy $ 1.5000 $ 1.4470 $ 1.4015 $ 1.3625 $ 1.3289
Total EMS Levy $ 0.3105 $ 0.2978 $ 0.2850 $ 0.2722 $ 0.2594
Total Excess Levy $ 0.1516 $ 0.1462 $ 0.1416 $ 0.1377 $ 0.1343
Total Operating Levy Rate $ 1.9621 $ 1.8909 $ 1.8281 $ 1.7723 $ 1.7226
With new construction and property valuations increasing faster than the 1 percent cap on levy growth, all
levy rates are assumed to decrease over time. This may help enable levy lid lifts in the future, which will be
necessary to help revenues keep pace with inflation.
Impact on City of Tumwater Regular Property Tax Levy Formation of a Municipal Fire District will impact the City of Tumwater’s property tax levy in two ways. First,
it will reduce the City’s statutory maximum levy rate. Second, it will create “banked” levy capacity that the
City can access to fund other services.

Regional Fire & Emergency Services Study City of Tumwater Fire Department
200
• Statutory Maximum Property Tax Levy Rate. If the City forms a Municipal District, its statutory
maximum property tax levy rate will decrease from $3.10 per $1,000 of assessed value (after
accounting for the library district) to $1.60 per $1,000 of assessed value. The decrease is due to
subtracting the District’s statutory maximum levy rate of $1.50 from the City’s statutory maximum
levy rate. The City’s 2020 estimated regular levy rate is $2.8917, which is $0.2083 below the statutory
maximum rate. After subtracting the general fund tax revenue allocated to fund the fire department
—revenue that would no longer be needed to pay for department expenses—the City’s 2020 levy rate
would be $1.3217 or $0.2783 below the statutory maximum rate under the Municipal District strategy.
Thus, the City’s levy lid lift capacity would grow $0.07 from $0.2083 to $0.2783.
• Banked Levy Capacity. As indicated above, under the Municipal Fire District strategy the City of
Tumwater’s property tax levy would be limited to $1.60 per $1,000 assessed value. This would
normally leave the City with a high banked capacity, however, the enabling legislation includes
specific language that calls for a city to reduce its highest lawful levy—which is the basis for the 1
percent maximum annual increase.54 The legislature took away the potential for a windfall and made
a city exercising this option reduce its levy by the full amount of the fire district levy and made that
new city levy its new cap or “highest lawful levy since 1986.”
Impact on Levy Rates in All Jurisdictions Under the Municipal Fire District strategy the same regular, EMS, and excess levy rates will apply to all
jurisdictions. The net impact on the tax rates—and taxes paid—in the predecessor jurisdictions will depend
on the tax rates needed to fund services under the current structure. A comparison of the forecasted 2020
status quo levy rates and the 2020 levy rates under the Municipal Fire District strategy are provided in the
following figure.
Figure 218: Tumwater Fire Department, Status Quo vs. Municipal Fire District
2020 Levy Rate Taxes Paid
TFD Municipal Fire District Impact on Levies
Status Quo Fire District
Formed Difference Difference
% of Total Taxes Paid
Tumwater FD
Regular (2.8917 estimated) $ 1.5700 $ 1.5000 $ (0.0700)
EMS $ 0.3501 $ 0.3501 $ -
Excess $ - $ 0.1516 $ 0.1516
Total $ 1.9201 $ 2.0016 $ 0.0816 $ 283,652 4.25%
As shown, levy rates and property taxes are projected to increase modestly with a Municipal Fire District. This
is due to the assumption that the excess levy rate would be set to provide sufficient revenues for the first 5
years. If it were set simply to cover 2020 expenses, there would be no difference in total levies. The expense
forecast under the RFA strategy is the same expense forecast presented previously in this report for the
consolidated operation of all six jurisdictions.
54 RCW 52.02.160(1)(ii)

Regional Fire & Emergency Services Study City of Tumwater Fire Department
201
Summary of Financial Considerations Implementation of the Municipal Fire District strategy will have financial implications that the agencies will
need to consider and potentially address. Those implications are summarized as follows:
• Reserve Funding Requirement. The newly formed Municipal Fire District will need to have adequate
reserves to fund ongoing operations and support equipment replacement. The total unrestricted
reserves of the City as of the end of 2017 was $6,864,000. A three-month minimal operating reserve
would be $1,676,020—this is considered minimally sufficient for an agency dependent on property
tax revenue that it receives twice per year. Additional reserves may be required for the replacement
of apparatus or other equipment. To the extent additional reserves are needed they will need to be
factored into the excess levy rate developed in the District plan and submitted to voters for approval.
• Tumwater Revenue Capacity/Surplus. Upon formation of a Municipal Fire District the City of
Tumwater will no longer be responsible for funding fire and EMS services. Using 2017 figures, the City
allocated approximately $4,296,000 in City General Fund tax revenue to pay for these services. ESCI
recommends that savings from the formation of an RFA be used to reduce taxes. Otherwise the
change would increase total taxes to the residents of Tumwater.
• Tax Burden Shifts. As outlined above, the formation of a Municipal Fire District shifts the tax burden
for funding fire, EMS, and ambulance services away from the City to the new district.
• Funding for Additional Expenses. Elsewhere in this report ESCI identified potential investments in
personnel, equipment, and information systems. If the collective agencies desire to make those
investments any additional expenses will need to be factored into the revenue required from the
excess levy.
Issues & Impacts • The City of Tumwater will have no direct control over fire services.
• The new district’s tax levy would reduce the City’s tax capacity from $3.10/$1,000 to $1.60/$1,000
while simultaneously increasing the City’s capacity for a levy lid lift (see next figure).
Figure 219: Tumwater Lid Lift Potential, Municipal Fire District Scenario
City Levy Reduction Scenario Levy Rate
City Projected 2020 Rate $ 2.8917
City Maximum Rate $ 3.1000
Lid Lift Potential $ 0.2083
City Projected Rate After District Formation $ 1.3217
City Maximum Rate After District Formation $ 1.6000
Lid Lift Potential $ 0.2783

Regional Fire & Emergency Services Study City of Tumwater Fire Department
202
• Outstanding bonds remain with originating properties.
• All personnel are transferred to the fire district.
• TFD asset transfers would need to be negotiated and agreed upon prior to submission of the district
formation initiative to the voters.
• Unresolved claims, litigation, or threatened actions in each separate agency must be identified and
coordinated to safeguard against any gaps in insurance coverage inadvertently created.
• Legal analysis and review prior to implementation are highly advised.

Regional Fire & Emergency Services Study City of Tumwater Fire Department
203
Findings ESCI found the six study agencies to be fully engaged and willing participants in this study. The amount of
data requested by ESCI from the agencies was daunting, but all provided the data and made themselves
available for interviews, draft reviews, and remained dedicated to the quality and accuracy of this report.
The six fire agencies participating in this study are of various sizes, complexities, and structures. However,
they broadly fit into two general groups: Predominantly Urban—Olympia, Tumwater and Lacey Fire District
3; and Predominantly Rural—East Olympia, West Thurston and McLane-Black Lake.
Thurston County Medic One is not a party to this study, but plays a significant role in the service level and
financial viability of the advanced life support transport services offered to the entire county. Whatever
results from the agencies’ deliberations of the integration options included in this report, Thurston County
Medic One will be an important consideration.
Numerous strategic partnerships already exist between the agencies. These include:
• OFD—Vehicle Repair and Maintenance Services (serving all agencies)
• OFD—Training Services (serving TFD and LFD3)
• LFD3—Vehicle Repair Facility (leased to OFD)
• West Thurston Regional Fire Consortium (WTRFA, MBLFD, and EOFD)
• Special Operations Rescue Team (all agencies)
• Medic One (all agencies)
• Mutual Aid (all agencies)
Regardless of the path(s) chosen by the agencies as it pertains to this report, the participants should continue
these and other regional efforts for cost effectiveness, efficiency, and for the benefit of their respective
citizens. Other potential regional efforts could include:
• Regional Fire Investigation Team (FIT)
• Regional Recruit Academy
• Regional Volunteer Recruitment & Retention Program
• Regional Training Division
• Regional Dedicated Training Relief Engine Company
• Regional Peak Demand Response Unit (Dropped Boundary)
• Regional Logistics Division
▪ Joint Purchasing & Supply Standardization
▪ Warehousing of Replenishable Supplies
▪ Just-in-Time Inventory Management & Delivery
• Regional Command Officer Response (Dropped Boundary)

Regional Fire & Emergency Services Study City of Tumwater Fire Department
204
Generally, integration between agencies should be between similarly situated agencies to avoid the expense
and challenges associated with providing service to two different community characteristics and risk profiles
(e.g., urban versus rural). Specific circumstances may make inclusion of some predominantly rural agencies
into the urban grouping more advantageous. An example of this is East Olympia, which provides some
benefit to Tumwater with its station in close proximity to Tumwater’s southern border. EOFD also provides
some benefit to Lacey Fire District 3 with its station in close proximity to Lacey Fire District 3’s southwestern
boundary.
Recommendations Strategy A (Status Quo) provides no net improvement as it represents no change over the current
conditions, but it is always an option. It is not recommended. Strategy B (Contract for Services) may provide
for streamlining organizations, but only in certain circumstances, such as administrative services or some
support services. It also adds a level of complexity in that each organization retains its individual taxing
authority but most often operates as a single entity as it relates to those service areas being contracted. Cost
allocation becomes a complex challenge. Following the cost allocation formulas included in this report or
using a variation of the approach can assist the agencies in determining the best option for each of the
participants if this option is chosen. ESCI considers this a potential intermediate step toward a more
permanent integration, but not the preferred strategy.
Strategy C (Annexation) is a simple process that allows for a city to be annexed into an existing fire district,
reducing its taxing authority by the same amount as the fire district charges in taxes. This process does not
automatically provide for direct representation from the city being annexed, and does allow for the city to
withdraw from the annexation after three years; two distinct disadvantages. ESCI does not recommend this
strategy.
Strategy D (Regional Fire Authority) provides the greatest flexibility among the so-called “permanent”
integration strategies, and has the potential to control costs and enhance service to the participants.
Strategy E (Municipal Fire District) is simply converting a city fire department into a fire district, transferring
the fiscal burden from the city to the fire district. The city council can act as the board of fire commissioners
(not recommended) or can temporarily fill those positions until fire commissioners are elected to fill the seats
(preferred). While a relatively straightforward process, this is a new concept with new enabling legislation. It
hasn’t been tried in Washington State and therefore has the inherent risks associated with “going first.” It
also has the net effect of swapping governance structure with little else changed.
ESCI does not recommend that all six agencies fully integrate at this time. The agencies collectively have
widely disparate financial circumstances, dissimilar community risk profiles, different approaches to staffing
configurations, and different infrastructures. However, there are groupings that ESCI does recommend
pursuing.

Regional Fire & Emergency Services Study City of Tumwater Fire Department
205
Recommendation 1
ESCI recommends that TFD, OFD, LFD3, and EOFD pursue Strategy D – RFA. The first step is for the four
agencies to read and understand this report, understand what an RFA is and does, and engage in initial joint
discussions. If the parties agree to further consider formation of an RFA, ESCI recommends establishing an
RFA Planning Committee. The makeup and purpose of the RFA Planning Committee is outlined in this report
and is spelled out in statute. It is imperative that the elected officials have a deeper understanding of an RFA.
Only then can they fully engage in possibilities thinking and develop what is effectively a new charter for fire
services within the RFA service area.
Actual legwork occurs between RFA Planning Committee meetings, usually delegated to the staff of the
participating agencies. Additional consideration should be given as follows:
• An ongoing, meaningful role for labor should be woven into the process.
• An ongoing, meaningful role for volunteer associations should be woven into the process.
• Thurston County Medic One should be brought into the process and discussion to examine overall
operational efficiencies and funding options.
• Cultural differences between existing agencies should be addressed in a meaningful way. Outside
expertise may be brought in to identify cultural distinctions and develop strategies to bridge any gaps
or form a new, healthy and inclusive culture.
If any initially participating agency in the RFA Planning Committee ultimately decides to withdraw from the
pursuit of an RFA, an intermediate step should be considered for that agency instead of complete withdrawal.
This may include contracting or otherwise partnering with the eventual RFA until such time as circumstances
evolve to the point where joining the RFA becomes a serious consideration.
Recommendation 2
A second-tier regionalization option is consideration of WTRFA and MBLFD integrating, but only after
financial circumstances make it beneficial and balanced to do so. That process could start as a contract for
service, finding the efficiencies through that process while jointly planning for a glide path financially that
makes full integration more feasible.
If an integration strategy is chosen between WTRFA and MBLFD, it should be done as the result of a joint
planning process, addressing the restructuring of the agencies as they integrate at the policy level, as well as
at the operational, administrative, and support levels. Greater efficiency can be achieved if the collaboration
is permanent, with one methodology, one set of work rules, one standardized level of service to the
community, and one organizational structure to administer it.
The process of considering and implementing any of these recommendations starts first with a shared vision
by the policymakers of the participating agencies. From the vision, goals and objectives can be identified
which, if accomplished, propel the agencies toward the vision. This process, in essence, is the framework of
a strategic plan for integration.

Regional Fire & Emergency Services Study City of Tumwater Fire Department
206
APPENDIX A: TABLE OF FIGURES
Figure 1: Response Data, 2017 ....................................................................................................................... 5
Figure 2: Critical Issues in Priority Order ........................................................................................................ 6
Figure 3: Summary of Fire Station Capacities in the Study Area .................................................................... 9
Figure 4: East Olympia Storage & Maintenance Facility (adjacent to Station 61) .......................................... 9
Figure 5: Lacey Fire District 3 Shared Maintenance Facility ......................................................................... 10
Figure 6: Apparatus & Vehicle Assignments—Tumwater Station T-1 ........................................................... 11
Figure 7: Apparatus & Vehicle Assignments—Tumwater Station T-2 ........................................................... 11
Figure 8: Apparatus & Vehicle Assignments—Olympia Station 1 ................................................................ 12
Figure 9: Apparatus & Vehicle Assignments—Olympia Station 2 ................................................................ 12
Figure 10: Apparatus & Vehicle Assignments—Olympia Station 3 ................................................................ 13
Figure 11: Apparatus & Vehicle Assignments—Olympia Station 4 ................................................................ 13
Figure 12: OFD Command & Staff Vehicles (Station 1 & Training Center) .................................................... 13
Figure 13: Apparatus & Vehicle Assignments—Lacey Station 31 ................................................................. 14
Figure 14: Apparatus & Vehicle Assignments—Lacey Station 32 ................................................................. 14
Figure 15: Apparatus & Vehicle Assignments—Lacey Station 33 ................................................................. 14
Figure 16: Apparatus & Vehicle Assignments—Lacey Station 34 .................................................................. 15
Figure 17: Apparatus & Vehicle Assignments—Lacey Station 35 .................................................................. 15
Figure 18: LFD3 Command & Staff Vehicles ................................................................................................. 15
Figure 19: Apparatus & Vehicle Assignments—East Olympia Station 61 ..................................................... 16
Figure 20: Apparatus & Vehicle Assignments—East Olympia Stations 62 ................................................... 16
Figure 21: Apparatus & Vehicle Assignments—East Olympia Station 64 ..................................................... 16
Figure 22: Apparatus & Vehicle Assignments—East Olympia Station 65 ...................................................... 17
Figure 23: Apparatus & Vehicle Assignments—West Thurston Station 1-1 ................................................... 17
Figure 24: Apparatus & Vehicle Assignments—West Thurston Station 1-2 .................................................. 17
Figure 25: Apparatus & Vehicle Assignments—West Thurston Station 1-3 .................................................. 18
Figure 26: Apparatus & Vehicle Assignments—West Thurston Station 1-4 ................................................. 18
Figure 27: Apparatus & Vehicle Assignments—West Thurston Station 1-6 .................................................. 18
Figure 28: Apparatus & Vehicle Assignments—McLane Station 91 ............................................................. 19
Figure 29: Apparatus & Vehicle Assignments—McLane Station 92 ............................................................. 19
Figure 30: Apparatus & Vehicle Assignments—McLane Station 93.............................................................. 19
Figure 31: Apparatus & Vehicle Assignments—McLane Station 94 .............................................................. 20

Regional Fire & Emergency Services Study City of Tumwater Fire Department
207
Figure 32: Apparatus & Vehicle Assignments—McLane Station 95 ............................................................. 20
Figure 33: Inventory of Frontline Apparatus & Vehicles in the Study Area (2018) ........................................ 20
Figure 34: Health, Safety & Counseling Services ......................................................................................... 22
Figure 35: Hiring Process Components ........................................................................................................ 23
Figure 36: Volunteer Selection Components ............................................................................................... 25
Figure 37: Current IAFF Bargaining Unit Agreement Periods ........................................................................27
Figure 38: Administrative & Support Uniformed Staff Positions.................................................................. 28
Figure 39: Non-Uniformed Administrative Positions ................................................................................... 29
Figure 40: Operations Staff Positions .......................................................................................................... 30
Figure 41: Theoretical Relief Factor Calculation (2017) ................................................................................. 31
Figure 42: Calculated Operational Staff Overage (Shortage) ....................................................................... 31
Figure 43: Operations Pay Classifications By Department ............................................................................ 33
Figure 44: Uniformed Staff Average Salary Comparisons, 20181 ................................................................. 34
Figure 45: Employee Benefits Provided by Career Departments ................................................................. 34
Figure 46: Operations Staff Work Schedule ................................................................................................ 36
Figure 47: Commercial Driver Rules for Work Hours ..................................................................................... 37
Figure 48: Study Area Historical Service Demand CAD, 2015–2017 ............................................................. 39
Figure 49: Percent Change in Service Demand CAD, 2015–2017 ................................................................. 40
Figure 50: Agency Service Demand by Incident Type NFIRS, 2017 .............................................................. 41
Figure 51: Agency Service Demand by Incident Type Percentages NFIRS, 2017 .......................................... 42
Figure 52: Aggregate Service Demand by Incident Type in the Study Area NFIRS, 2017 ............................. 43
Figure 53: Proportion of Total Service Demand in the Study Area from Each Department CAD, 2017 ......... 44
Figure 54: Study Area Service Demand by Month CAD, 2015–2017 ............................................................. 45
Figure 55: Study Area Service Demand by Month Summary CAD, 2015–2017 ............................................. 45
Figure 56: Study Area Service Demand by Day of the Week CAD, 2015–2017 ............................................. 46
Figure 57: Study Area Service Demand by Day of Week Summary CAD, 2015–2017 ................................... 46
Figure 58: Study Area Service Demand by Hour of the Day, CAD 2016–2017 .............................................. 47
Figure 59: Study Area Service Demand by Day of Week Summary CAD, 2015–2017 ................................... 47
Figure 60: Incident Density CAD, 2015–2017 ............................................................................................... 48
Figure 61: Census Estimate Population Density, 2014 ................................................................................. 49
Figure 62: Regional Fire Service Study Area ................................................................................................ 50
Figure 63: Resource Distribution in the Study Area ...................................................................................... 51
Figure 64: Washington Surveying & Rating Bureau Public Protection Classifications by Agency .................. 51
Regional Fire & Emergency Services Study City of Tumwater Fire Department
208
Figure 65: Study Area Station Distribution, 5 Mile Travel Service Area ....................................................... 52
Figure 66: Study Area Station Distribution, 1.5 Mile WSRB Criterion Engine Company ................................53
Figure 67: Study Area Station Distribution, 2.5 Mile WSRB Criterion Ladder Company............................... 54
Figure 68: WSRB Hydrant Distribution ........................................................................................................ 55
Figure 69: 4- and 8-Minute Travel Time ...................................................................................................... 56
Figure 70: Assembly of an Effective Response Force; 8-minute Travel ......................................................... 57
Figure 71: Example of Critical Task Staffing Analysis Based on Risk ............................................................ 58
Figure 72: Sample Non-Structure Fire Critical Tasking ............................................................................... 59
Figure 73: Sample EMS Incident Critical Tasking ........................................................................................ 59
Figure 74: Sample Motor Vehicle Collision with Entrapment Critical Tasking .............................................. 59
Figure 75: Sample Hazardous Materials Incident Critical Tasking ................................................................ 59
Figure 76: Study Area Concurrent Incidents CAD, 2015–2017 ...................................................................... 60
Figure 77: UHU Rates by Department CAD, 2015–2017 ............................................................................... 61
Figure 78: Commitment Factors as Developed by Henrico County (VA) Division, 2016 ............................... 63
Figure 79: Percentage of Incidents by Number of Units Utilized CAD, 2015–2017 ....................................... 64
Figure 80: Response Performance at 90th Percentile for Structure Fires by Order on Scene CAD, 2015–2017 ............................................................................................................................................................ 64
Figure 81: NFPA 1710 Standards for Fire/EMS Responses ........................................................................... 66
Figure 82: Study Area Alarm Handling Performance CAD, 2015–2017 ........................................................ 66
Figure 83: WTRFA Turnout Time Performance CAD, 2015–2017 ................................................................. 68
Figure 84: EOFD Turnout Time Performance CAD, 2015–2017 .................................................................... 68
Figure 85: TFD Turnout Time Performance CAD, 2015–2017 ...................................................................... 68
Figure 86: OFD Turnout Time Performance CAD, 2015–2017 ...................................................................... 68
Figure 87: MBLFD Turnout Time Performance CAD, 2015–2017.................................................................. 68
Figure 88: LFD3 Turnout Time Performance CAD, 2015–2017 ..................................................................... 68
Figure 89: Study Area Departments Turnout Time Performance CAD, 2015–2017 ...................................... 69
Figure 90: WTRFA Travel Time Performance CAD, 2015–2017 .....................................................................70
Figure 91: EOFD Travel Time Performance CAD, 2015–2017 ........................................................................70
Figure 92: TFD Travel Time Performance CAD, 2015–2017 ..........................................................................70
Figure 93: OFD Travel Time Performance CAD, 2015–2017 ..........................................................................70
Figure 94: MBLFD Travel Time Performance CAD, 2015–2017 .....................................................................70
Figure 95: LFD3 Travel Time Performance CAD, 2015–2017 .........................................................................70
Figure 96: Study Area Departments Travel Time Performance CAD, 2015–2017 .......................................... 71

Regional Fire & Emergency Services Study City of Tumwater Fire Department
209
Figure 97: WTRFA Response Time Performance CAD, 2015–2017 ................................................................72
Figure 98: EOFD Response Time Performance CAD, 2015–2017 ..................................................................72
Figure 99: TFD Response Time Performance CAD, 2015–2017 ....................................................................72
Figure 100: OFD Response Time Performance CAD, 2015–2017 ...................................................................72
Figure 101: MBLFD Response Time Performance CAD, 2015–2017 ..............................................................72
Figure 102: LFD3 Response Time Performance CAD, 2015–2017 ..................................................................72
Figure 103: Study Area Departments Response Time (Turnout + Travel Time) Performance CAD, 2015–2017 ............................................................................................................................................................. 73
Figure 104: NFPA 1720 Response Time (Turnout + Travel Time) Standard by Population Density ................ 73
Figure 105: Study Area Departments Total Response Time Performance by Incident Type CAD, 2015–2017 ............................................................................................................................................................ 74
Figure 106: Study Area Departments Total Response Time Performance by Department CAD, 2015–2017 . 75
Figure 107: Thurston County Fire Departments ........................................................................................... 76
Figure 108: Study Area Agency’s Response to Another’s Jurisdiction, 2017 ................................................. 76
Figure 109: Fire Prevention Program Components .......................................................................................78
Figure 110: New Construction Plan Review and Inspection ......................................................................... 79
Figure 111: Six Steps of CRR Planning ......................................................................................................... 82
Figure 112: Life Safety & Public Education Services .................................................................................... 83
Figure 113: Training Administration & Budget (TFD, EOFD, LFD3) ...............................................................87
Figure 114: Training Administration & Budget (WTRFA, OFD, MBLFD)........................................................87
Figure 115: Combined 2018 Training Budgets ............................................................................................. 88
Figure 116: Training Facilities & Resources (TFD, EOFD, LFD3) ................................................................... 89
Figure 117: Training Facilities & Resources (WTRFA, OFD, MBLFD) ............................................................ 89
Figure 118: Mark Noble Regional Training Center (OFD) ............................................................................. 90
Figure 119: OFD Command Training Facility ............................................................................................... 90
Figure 120: Roof Props at the OFD Training Center ..................................................................................... 90
Figure 121: McLane-Black Lake Regional Training Center ........................................................................... 91
Figure 122: Training Records Maintenance (TFD, EOFD, LFD3) ................................................................... 92
Figure 123: Training Records Maintenance (WTRFA, OFD, MBLFD) ............................................................ 92
Figure 124: General Training Competencies (TFD, EOFD, LFD3) ................................................................. 93
Figure 125: General Training Competencies (WTRFA, OFD, MBLFD) .......................................................... 93
Figure 126: Training Methodologies & Operations (TFD, EOFD, LFD3) ....................................................... 94
Figure 127: 2017 Training Methodologies & Operations (WTRFA, OFD, MBLFD) ........................................ 95
Figure 128: 2017 Fire Department Training Activities (TFD, EOFD, LFD3) ................................................... 95

Regional Fire & Emergency Services Study City of Tumwater Fire Department
210
Figure 129: 2017 Fire Department Training Activities (WTRFA, OFD, MBLFD) ............................................ 95
Figure 130: Combined Training Activities Summary .................................................................................... 96
Figure 131: Fire Agency Population Projections ........................................................................................... 98
Figure 132: Summary of Levies ................................................................................................................... 99
Figure 133: EOFD General Fund Balances .................................................................................................. 102
Figure 134: EOFD Net Revenues (Deficits) ................................................................................................. 103
Figure 135: EOFD Financial Forecast ......................................................................................................... 104
Figure 136: Tumwater Budget Compared to AV Growth ............................................................................ 105
Figure 137: TFD Net Revenues (Deficits) .................................................................................................... 106
Figure 138: TFD Financial Forecast ............................................................................................................. 107
Figure 139: OFD Net Revenues (Deficits) ................................................................................................... 109
Figure 140: OFD Financial Forecast ............................................................................................................ 110
Figure 141: LFD3 General Fund Balances .................................................................................................... 110
Figure 142: LFD3 Budget Ratios ................................................................................................................. 111
Figure 143: LFD3 Net Revenues (Deficits) ................................................................................................... 112
Figure 144: LFD3 Expenditure Forecast ...................................................................................................... 112
Figure 145: WTRFA General Fund Balances ................................................................................................ 114
Figure 146: WTRFA Net Revenues (Deficits) .............................................................................................. 115
Figure 147: WTFRA Financial Forecast ....................................................................................................... 116
Figure 148: MBLFD General Fund and Reserve Balances ............................................................................ 117
Figure 149: MBLFD Outstanding Bonds ..................................................................................................... 117
Figure 150: MBLFD Net Revenues (Deficits) ............................................................................................... 118
Figure 151: MBLFD Financial Forecast ........................................................................................................ 119
Figure 152: Cost per Person and Firefighters/1,000 Population ................................................................. 120
Figure 153: Fire Agency Population Projections.......................................................................................... 121
Figure 154: Commercial Permits (Net Sq. Ft.), 2013–2017 .......................................................................... 121
Figure 155: Average Compensation and Benefits ...................................................................................... 122
Figure 156: Tax Revenue Per Person .......................................................................................................... 123
Figure 157: Risk Identification and Analysis Process1 ................................................................................. 124
Figure 158: Translation of Zoning to Relative Risk Categories .................................................................... 125
Figure 159: Fire and Life Safety Risk Based on Zoning, Study Area ............................................................ 125
Figure 160: Summary of Federal Disaster Declarations in Thurston County by Type, 1965 to 2016 ........... 126
Figure 161: Sources of Flooding Thurston County ..................................................................................... 128

Regional Fire & Emergency Services Study City of Tumwater Fire Department
211
Figure 162: Flood Zones in The Study Area ............................................................................................... 129
Figure 163: Flood Hazard Areas by Jurisdiction .......................................................................................... 130
Figure 164: Tornado Intensity, Enhanced Fujita Scale ................................................................................ 131
Figure 165: Other Weather-Related Hazards in Thurston County ............................................................... 132
Figure 166: Effects of Earthquakes ............................................................................................................. 134
Figure 167: Estimations in the Liquefaction Hazard Area by Jurisdiction, 2015 ........................................... 134
Figure 168: Liquefaction Hazards in Thurston County ................................................................................ 135
Figure 169: Study Area Historical Wildfire Occurrences and Impacts, 1972–2015 ....................................... 136
Figure 170: Wildfires in Thurston County, 1972–2015 ................................................................................. 137
Figure 171: High-Risk Wildland Urban Interface Areas in Thurston County ................................................. 138
Figure 172: Study Area Current Estimates as they relate to the Urban Interface 2015 ................................ 139
Figure 173: Major Highways in the Study Area .......................................................................................... 140
Figure 174: Airports and Heliport Locations in the Study Area ................................................................... 141
Figure 175: Railway Tracks in the Study Area ............................................................................................ 142
Figure 176: Potential Rail Incident Types and Effect .................................................................................. 142
Figure 177: Colleges and Schools in the Study Area ................................................................................... 144
Figure 178: Fire Hydrant Distribution in the Study Area ............................................................................. 145
Figure 179: Study Area Size and Population Estimates ............................................................................... 147
Figure 180: Age and Sex Percentage Comparisons1 .................................................................................. 148
Figure 181: Other Demographic Comparisons1.......................................................................................... 148
Figure 182: Population Classifications ....................................................................................................... 149
Figure 183: Study Area Population Density ................................................................................................ 150
Figure 184: Population Growth Projections in the Study Area .................................................................... 151
Figure 185: Cost Allocation by Service Area (2017) ..................................................................................... 165
Figure 186: Cost Allocation by Assessed Value (2017) ............................................................................... 166
Figure 187: Cost Allocation by Resource Deployment (2017) ...................................................................... 167
Figure 188: Cost Allocation by Service Demand (2017) .............................................................................. 168
Figure 189: Cost Allocation by Population, (2018-TRPC) ........................................................................... 169
Figure 190: Summary of Cost Allocation Factors by Percentage (2017) ...................................................... 171
Figure 191: 50% Assessed Value and 50% Service Demand (2017).............................................................. 172
Figure 192: 50% Service Demand, 25% Resources, 25% Assessed Value (2017) ......................................... 172
Figure 193: All Variables at Equal Weights of 20% Each (2017) ................................................................... 172
Figure 194: Annexation of Tumwater by East Olympia Fire District ........................................................... 178

Regional Fire & Emergency Services Study City of Tumwater Fire Department
212
Figure 195: Levy Rates for Annexation by East Olympia Fire District.......................................................... 178
Figure 196: Annexation of Tumwater by McLane Black Lake Fire Department .......................................... 178
Figure 197: Levy Rates for Annexation by McLane-Black Lake Fire District ................................................ 179
Figure 198: Annexation of Tumwater by West Thurston Regional Fire Authority ....................................... 179
Figure 199: Levy Rates for Annexation by West Thurston Regional Fire Authority ..................................... 179
Figure 200: Annexation of Tumwater by Lacey Fire District 3 .................................................................... 180
Figure 201: Levy Rates for Annexation by Lacey Fire District 3 .................................................................. 180
Figure 202: Impact on City of Tumwater Regular Property Tax Levy .......................................................... 181
Figure 203: Tax Rate Changes Under East Olympia Fire District Annexation of Tumwater......................... 181
Figure 204: Tax Rate Changes Under McLane-Black Lake Fire District Annexation of Tumwater .............. 182
Figure 205: Tax Rate Changes Under West Thurston Regional Fire Authority Annexation of Tumwater ... 182
Figure 207: Reserve Needs by Annexation Scenario ................................................................................... 183
Figure 208: Tumwater Lid Lift Potential—Annexation Scenario ................................................................ 184
Figure 209: RFA Revenue Projections, All Agencies .................................................................................. 190
Figure 210: RFA Revenue Projections, OFD, TFD, LFD3, & EOFD .............................................................. 190
Figure 211: RFA Levy Rate Projections, All Agencies .................................................................................. 191
Figure 212: RFA Levy Rate Projections, OFD, TFD, LFD3, & EOFD ............................................................. 191
Figure 213: Status Quo vs. RFA Levy Rates, All Agencies .......................................................................... 192
Figure 214: Status Quo vs. RFA Levy Rates, OFD, TFD, LFD3, & EOFD ...................................................... 193
Figure 215: Tumwater Lid Lift Potential, RFA Scenario .............................................................................. 195
Figure 216: Tumwater Fire Department Revenue Sources, Municipal Fire District Scenario ...................... 199
Figure 217: Tumwater Fire Department Levy Rate, Municipal Fire District Scenario ................................. 199
Figure 218: Tumwater Fire Department, Status Quo vs. Municipal Fire District ........................................ 200
Figure 219: Tumwater Lid Lift Potential, Municipal Fire District Scenario ................................................. 201
Figure 220: Tumwater Headquarters Station (T-1) .................................................................................... 214
Figure 221: Tumwater North End Station (T-2) .......................................................................................... 215
Figure 222: East Olympia Station 61 (Headquarters) ................................................................................. 216
Figure 223: East Olympia Station 62 .......................................................................................................... 217
Figure 224: East Olympia Station 64 ......................................................................................................... 218
Figure 225: East Olympia Station 65 ......................................................................................................... 219
Figure 226: Lacey Station 31 (Headquarters) ............................................................................................. 220
Figure 227: Lacey Station 32 ..................................................................................................................... 221
Figure 228: Lacey Station 33 ..................................................................................................................... 222

Regional Fire & Emergency Services Study City of Tumwater Fire Department
213
Figure 229: Lacey Station 34 ..................................................................................................................... 223
Figure 230: Lacey Station 35 ..................................................................................................................... 224
Figure 231: McLane-Black Lake Station 91 (Headquarters) ....................................................................... 225
Figure 232: McLane-Black Lake Station 92................................................................................................ 226
Figure 233: McLane-Black Lake Station 93 ................................................................................................. 227
Figure 234: McLane-Black Lake Station 94 ............................................................................................... 228
Figure 235: McLane-Black Lake Station 95 ................................................................................................ 229
Figure 236: West Thurston RFA Station 1-1 ............................................................................................... 230
Figure 237: West Thurston RFA Station 1-2 ................................................................................................ 231
Figure 238: West Thurston RFA Station 1-3 ............................................................................................... 232
Figure 239: West Thurston RFA Station 1-4 ................................................................................................ 233
Figure 240: West Thurston RFA Station 1-6 (Scott Lake)........................................................................... 234
Figure 241: Olympia Station 1 (Headquarters) ........................................................................................... 235
Figure 242: Olympia Station 2 ................................................................................................................... 236
Figure 243: Olympia Station 3 .................................................................................................................... 237
Figure 244: Olympia Station 4 ................................................................................................................... 238
Figure 245: East Olympia Storage & Maintenance Facility (adjacent to Station 61) .................................. 239
Figure 246: Lacey Fire District 3 Shared Maintenance Facility ................................................................... 239
Figure 247: Details of Lacey District #3 Shared Apparatus Maintenance Facility ....................................... 240

Regional Fire & Emergency Services Study City of Tumwater Fire Department
214
APPENDIX B: FIRE STATIONS
Tumwater Fire Stations
Figure 220: Tumwater Headquarters Station (T-1)
Address/Physical Location: 311 Israel Road SW Tumwater, WA 98501
General Description: Built in 2000, this station serves as the Tumwater Fire Department’s headquarters. It also functions as the Emergency Operations Center (EOC).
Structure
Construction Type Type 5
Date of Construction 2000
Seismic Protection No known seismic upgrades
Auxiliary Power Yes; automatic
General Condition Good
Apparatus Bays 0 Drive-through bays 5 back-in bays (4 are 2 deep)
Special considerations (ADA, etc.) None
Square Footage 19,135
Facilities Available
Separate Rooms/Dormitory/Other 9 Bedrooms 9 Beds N/A Beds in dormitory
Maximum Station Staffing Capability 9
Exercise/Workout Facilities Yes
Kitchen/Dormitory Yes
Individual Lockers/Storage Assigned Yes
Shower Facilities Yes
Training/Meeting Rooms Yes
Washer/Dryer Yes (commercial for turnout gear)
Safety & Security
Sprinklers and/or Smoke Detection Yes/Yes
Decontamination/Biohazard Disposal Yes
Security Electronic locks on some exterior doors
Apparatus Exhaust System Negative pressure system (scheduled to be replaced)

Regional Fire & Emergency Services Study City of Tumwater Fire Department
215
Figure 221: Tumwater North End Station (T-2)
Address/Physical Location: 405 Linwood Avenue SW, Tumwater, WA 98502
General Description: Tumwater’s other station, which is somewhat smaller than its other station. It has two apparatus bays that are two-deep. Exercise equipment located in one of the apparatus bays.
Structure
Construction Type V-N
Date of Construction 1993
Seismic Protection No
Auxiliary Power Yes
General Condition Good
Apparatus Bays 0 Drive-through bays 2 back-in bays (2 deep)
Special considerations (ADA, etc.) None
Square Footage 4,000
Facilities Available
Separate Rooms/Dormitory/Other 2 Bedrooms 2 Beds 2 Beds in dormitory
Maximum Station Staffing Capability 5
Exercise/Workout Facilities Yes
Kitchen/Dormitory Yes
Individual Lockers/Storage Assigned Yes
Shower Facilities 2 male showers and 1 female shower
Training/Meeting Rooms No
Washer/Dryer Standard (not usable for turnout gear)
Safety & Security
Sprinklers and/or Smoke Detection Yes
Decontamination/Biohazard Disposal Yes
Security No
Apparatus Exhaust System Pending upgrade

Regional Fire & Emergency Services Study City of Tumwater Fire Department
216
East Olympia Fire Stations
Figure 222: East Olympia Station 61 (Headquarters)
Address/Physical Location: 8047 Normandy St SE, Olympia, WA 98501
General Description: Headquarters campus; administration offices, crew quarters, separate two-bay mechanic shop, separate three-bay storage annex.
Structure
Construction Type Wood Frame Type V
Date of Construction 1996
Seismic Protection Met seismic standards at time of construction; not upgraded
Auxiliary Power Yes
General Condition Excellent
Apparatus Bays 0 Drive-through bays 4 back-in bays
Special considerations (ADA, etc.) None
Square Footage 9,668
Facilities Available
Separate Rooms/Dormitory/Other 5 Bedrooms 6 Beds N/A Beds in dormitory
Maximum Station Staffing Capability 6
Exercise/Workout Facilities Yes
Kitchen/Dormitory Yes (two)
Individual Lockers/Storage Assigned Three locations
Shower Facilities Yes
Training/Meeting Rooms Large meeting room
Washer/Dryer Regular & large commercial extractor
Safety & Security
Sprinklers and/or Smoke Detection Yes
Decontamination/Biohazard Disposal Yes, deep sink, floor drain, diked area in truck bay
Security No
Apparatus Exhaust System Yes

Regional Fire & Emergency Services Study City of Tumwater Fire Department
217
Figure 223: East Olympia Station 62
Address/Physical Location: 5944 Offut Lake Rd SE, Tenino, WA 98589
General Description: Unstaffed station. Just truck bays, office, and bathroom. Very old facility built in 1954.
Structure
Construction Type Wood Frame Type V
Date of Construction 1954
Seismic Protection No
Auxiliary Power No
General Condition Fair
Apparatus Bays 0 Drive-through bays 4 back-in bays
Special considerations (ADA, etc.) None; Property not owned by District
Square Footage 2,340
Facilities Available
Separate Rooms/Dormitory/Other 0 Bedrooms 0 Beds 0 Beds in dormitory
Maximum Station Staffing Capability Unstaffed (no facilities)
Exercise/Workout Facilities No
Kitchen/Dormitory No
Individual Lockers/Storage Assigned No
Shower Facilities No
Training/Meeting Rooms No
Washer/Dryer No
Safety & Security
Sprinklers and/or Smoke Detection No/No
Decontamination/Biohazard Disposal No
Security Yes
Apparatus Exhaust System No

Regional Fire & Emergency Services Study City of Tumwater Fire Department
218
Figure 224: East Olympia Station 64
Address/Physical Location: 9530 Old Highway 99 SE, Olympia, WA 98501
General Description: Fire department training site. Approved, funded, and permitted to expand training area to include a Connex Class A combustible training prop on a large concrete pad.
Structure
Construction Type Wood Frame Type V
Date of Construction 1986
Seismic Protection Yes
Auxiliary Power Yes
General Condition Excellent
Apparatus Bays 0 Drive-through bays 4 back-in bays
Special considerations (ADA, etc.) None
Square Footage 6,894
Facilities Available
Separate Rooms/Dormitory/Other 7 Bedrooms 8 Beds N/A Beds in dormitory
Maximum Station Staffing Capability 8 (1 bedroom has double-bunks; 3 are for residents)
Exercise/Workout Facilities Limited
Kitchen/Dormitory Yes
Individual Lockers/Storage Assigned Yes
Shower Facilities Yes
Training/Meeting Rooms Yes
Washer/Dryer Yes
Safety & Security
Sprinklers and/or Smoke Detection No/Yes
Decontamination/Biohazard Disposal Deep sink
Security No
Apparatus Exhaust System Yes

Regional Fire & Emergency Services Study City of Tumwater Fire Department
219
Figure 225: East Olympia Station 65
Address/Physical Location: 8212 80th Ave SE, Olympia, WA 98513
General Description: Unstaffed fire station. Property size is very limited. Apparatus stored here, but no personnel assigned.
Structure
Construction Type Wood Frame Type V
Date of Construction 1997
Seismic Protection Possibly
Auxiliary Power No
General Condition Excellent
Apparatus Bays 0 Drive-through bays 3 back-in bays
Special considerations (ADA, etc.) None
Square Footage 2,300
Facilities Available
Separate Rooms/Dormitory/Other 0 Bedrooms 0 Beds 0 Beds in dormitory
Maximum Station Staffing Capability None
Exercise/Workout Facilities No
Kitchen/Dormitory No
Individual Lockers/Storage Assigned Gear Lockers
Shower Facilities No
Training/Meeting Rooms No
Washer/Dryer No
Safety & Security
Sprinklers and/or Smoke Detection No/No
Decontamination/Biohazard Disposal No
Security Yes
Apparatus Exhaust System No

Regional Fire & Emergency Services Study City of Tumwater Fire Department
220
Lacey Fire District 3 Stations
Figure 226: Lacey Station 31 (Headquarters)
Address/Physical Location: 1231 Franz Street SE, Lacey, WA 98503-2412
General Description: Large, modern fire station containing both administration and operations personnel. Substantial office facilities on first and second floors of the administration area. Significant capacity for apparatus and operations personnel. There are eight bays varying in size and depth.
Structure
Construction Type Type 5
Date of Construction 2004
Seismic Protection None; Building code
Auxiliary Power Yes
General Condition Good
Apparatus Bays 0 Drive-through bays 8 back-in bays
Special considerations (ADA, etc.) Accessible including elevator & mixed gender appropriate
Square Footage 32,000
Facilities Available
Separate Rooms/Dormitory/Other 14 Bedrooms 14 Beds 0 Beds in dormitory
Maximum Station Staffing Capability 14
Exercise/Workout Facilities Yes
Kitchen/Dormitory Yes (14 separate bedrooms)
Individual Lockers/Storage Assigned Yes
Shower Facilities Six private shower & bath combinations
Training/Meeting Rooms Large training room (40); 3 conference rooms for 6–8
Washer/Dryer 2 each & 1 commercial extractor & dryer
Safety & Security
Sprinklers and/or Smoke Detection Yes/Yes (central alarm)
Decontamination/Biohazard Disposal Yes
Security Perimeter Pass access control system
Apparatus Exhaust System Air turnover system

Regional Fire & Emergency Services Study City of Tumwater Fire Department
221
Figure 227: Lacey Station 32
Address/Physical Location: 10910 Yelm Hwy SE, Olympia, WA 98513
General Description: Rural fire station that is staffed with resident volunteers. Crew quarters are relatively new, and were added in 2012. The apparatus bays were built in the late 1970s. Little room available for expansion. Currently houses a Type 1 engine and a reserve engine.
Structure
Construction Type Type 5 (crew quarters) & Type 3 block (apparatus bays)
Date of Construction Crew quarters 2012; apparatus bay late 1970s
Seismic Protection High-efficiency rated manufactured for quarters
Auxiliary Power Crew quarters; None for apparatus bay
General Condition Good
Apparatus Bays 0 Drive-through bays 2 back-in bays
Special considerations (ADA, etc.) One accessible restroom
Square Footage 1,800 (quarters); 1,000 (apparatus bay)
Facilities Available
Separate Rooms/Dormitory/Other 4 Bedrooms 5 Beds N/A Beds in dormitory
Maximum Station Staffing Capability 5
Exercise/Workout Facilities Limited
Kitchen/Dormitory Yes
Individual Lockers/Storage Assigned Yes
Shower Facilities Two
Training/Meeting Rooms None
Washer/Dryer One each
Safety & Security
Sprinklers and/or Smoke Detection No sprinkler system/smoke alarms present in resident areas
Decontamination/Biohazard Disposal No
Security Punch keypad into bay and residence
Apparatus Exhaust System None

Regional Fire & Emergency Services Study City of Tumwater Fire Department
222
Figure 228: Lacey Station 33
Address/Physical Location: 6500 Mullen Road SE, Olympia, WA 98513
General Description: Station is located on a large lot with room for expansion. Substantial office space and computer resources. Houses an engine and BLS aid unit. Moderate supply & equipment storage capacity.
Structure
Construction Type Type 5
Date of Construction 2003
Seismic Protection None; building code
Auxiliary Power Yes
General Condition Good
Apparatus Bays 0 Drive-through bays 2 back-in bays
Special considerations (ADA, etc.) Fully accessible; mixed-gender appropriate
Square Footage 8,100
Facilities Available
Separate Rooms/Dormitory/Other 6 Bedrooms 6 Beds N/A Beds in dormitory
Maximum Station Staffing Capability 6
Exercise/Workout Facilities Yes
Kitchen/Dormitory Yes
Individual Lockers/Storage Assigned Yes
Shower Facilities Shower & bathroom combinations (4)
Training/Meeting Rooms Training room for up to 30 persons
Washer/Dryer One each
Safety & Security
Sprinklers and/or Smoke Detection Yes/Yes; central alarm
Decontamination/Biohazard Disposal Yes
Security Perimeter Pass access control system
Apparatus Exhaust System Air turnover system

Regional Fire & Emergency Services Study City of Tumwater Fire Department
223
Figure 229: Lacey Station 34
Address/Physical Location: 8407 Steilacoom Road SE, Olympia, WA 98513
General Description: Large office space. Small kitchen. Locker room. Moderate supply and equipment storage. Dormitory at opposite end of apparatus bays. This station houses an engine, ALS medic unit, a brush unit, and a tender. Station is located adjacent to Medic One maintenance facility. Due to be replaced and renovated as a training facility in 2019–2020.
Structure
Construction Type Type 2
Date of Construction 1990
Seismic Protection Building Code/None
Auxiliary Power Yes
General Condition Average (planned for replacement as training facility)
Apparatus Bays 4 Drive-through bays 0 back-in bays
Special considerations (ADA, etc.) None
Square Footage 11,300
Facilities Available
Separate Rooms/Dormitory/Other 2 Bedrooms 2 Beds 6 Beds in dormitory
Maximum Station Staffing Capability 8–10
Exercise/Workout Facilities Yes
Kitchen/Dormitory Yes
Individual Lockers/Storage Assigned Yes
Shower Facilities One bathroom/shower combination; two separate showers
Training/Meeting Rooms One for up to 30 persons
Washer/Dryer Two each
Safety & Security
Sprinklers and/or Smoke Detection Yes/Yes; central alarm
Decontamination/Biohazard Disposal Yes
Security Perimeter Pass access control system
Apparatus Exhaust System No

Regional Fire & Emergency Services Study City of Tumwater Fire Department
224
Figure 230: Lacey Station 35
Address/Physical Location: 3701 Willamette Drive, Lacey, WA 98516
General Description: Relatively new station in good condition, located in a suburban area. The station is designed for the addition of one apparatus bay and two dorms if needed. Also have adjacent 5 acre parcel that could be used for expansion if needed although no current plans exist. Substantial office space and computer access.
Structure
Construction Type Type 5
Date of Construction 2005
Seismic Protection Building Code
Auxiliary Power Yes
General Condition Good
Apparatus Bays 0 Drive-through bays 2 back-in bays
Special considerations (ADA, etc.) Fully accessible; mixed-gender appropriate
Square Footage 8,100
Facilities Available
Separate Rooms/Dormitory/Other 6 Bedrooms 6 Beds N/A Beds in dormitory
Maximum Station Staffing Capability 6
Exercise/Workout Facilities Yes
Kitchen/Dormitory Yes
Individual Lockers/Storage Assigned Yes
Shower Facilities Four shower & bathroom combinations
Training/Meeting Rooms Small classroom
Washer/Dryer One each
Safety & Security
Sprinklers and/or Smoke Detection Central alarm
Decontamination/Biohazard Disposal Yes
Security Perimeter Pass access control system
Apparatus Exhaust System Air turnover system

Regional Fire & Emergency Services Study City of Tumwater Fire Department
225
McLane-Black Lake Fire District Stations
Figure 231: McLane-Black Lake Station 91 (Headquarters)
Address/Physical Location: 125 Delphi Rd., NW, Olympia, WA 98502
General Description: A large, modern, well-designed facility capable of housing ten personnel. The external design of the fire station presents a positive image to the community. The four drive-through bays are each two-deep. The department’s regional training center is adjacent to this station.
Structure
Construction Type Wood Frame
Date of Construction 2008
Seismic Protection Yes
Auxiliary Power Yes
General Condition Excellent
Apparatus Bays 4 Drive-through bays (double-deep bays)
Special considerations (ADA, etc.) ADA compliant
Square Footage 17,800
Facilities Available
Separate Rooms/Dormitory/Other 8 Bedrooms 8 Beds N/A Beds in dormitory
Maximum Station Staffing Capability 10
Exercise/Workout Facilities Yes
Kitchen/Dormitory Yes
Individual Lockers/Storage Assigned Yes
Shower Facilities Yes
Training/Meeting Rooms Yes
Washer/Dryer Yes
Safety & Security
Sprinklers and/or Smoke Detection Yes/Yes
Decontamination/Biohazard Disposal Yes
Security No
Apparatus Exhaust System Whole house system; pressurized louvered bay doors

Regional Fire & Emergency Services Study City of Tumwater Fire Department
226
Figure 232: McLane-Black Lake Station 92
Address/Physical Location: 3204 36th Ave. NW, Olympia, WA 98502
General Description: Old station originally built in 1964 and remodeled in 1977. Station is in fair condition, and likely should be replaced in the near future. Staffed with residents. Small kitchen. Houses a single engine and BLS aid unit.
Structure
Construction Type Non-combustible; Metal building on slab
Date of Construction 1964; Remodeled in 1977
Seismic Protection No
Auxiliary Power Yes
General Condition Fair
Apparatus Bays 0 Drive-through bays 2 back-in bays
Special considerations (ADA, etc.) None
Square Footage 2,396
Facilities Available
Separate Rooms/Dormitory/Other 3 Bedrooms 3 Beds N/A Beds in dormitory
Maximum Station Staffing Capability 3
Exercise/Workout Facilities No
Kitchen/Dormitory Yes
Individual Lockers/Storage Assigned Yes
Shower Facilities Two full-baths with a shower in each
Training/Meeting Rooms No
Washer/Dryer Yes
Safety & Security
Sprinklers and/or Smoke Detection No/Yes
Decontamination/Biohazard Disposal No (done at headquarters station)
Security No
Apparatus Exhaust System Yes

Regional Fire & Emergency Services Study City of Tumwater Fire Department
227
Figure 233: McLane-Black Lake Station 93
Address/Physical Location: 2815 Summit Lake Shore Rd, Olympia, WA 98502
General Description: Modern, well-designed fire station staffed with residents only. Includes a watch office, and weight room and storage on the second floor. Contains an engine, BLS aid unit, and reserve engine.
Structure
Construction Type Wood Frame
Date of Construction 2012
Seismic Protection Yes
Auxiliary Power Yes
General Condition Excellent
Apparatus Bays 0 Drive-through bays 4 back-in bays (1 deep)
Special considerations (ADA, etc.) Yes
Square Footage 6,800
Facilities Available
Separate Rooms/Dormitory/Other 6 Bedrooms 6 Beds N/A Beds in dormitory
Maximum Station Staffing Capability 6
Exercise/Workout Facilities Yes
Kitchen/Dormitory Yes
Individual Lockers/Storage Assigned Yes
Shower Facilities Yes
Training/Meeting Rooms No
Washer/Dryer Commercial washer & dryer
Safety & Security
Sprinklers and/or Smoke Detection Yes/Yes
Decontamination/Biohazard Disposal Yes
Security No
Apparatus Exhaust System Yes

Regional Fire & Emergency Services Study City of Tumwater Fire Department
228
Figure 234: McLane-Black Lake Station 94
Address/Physical Location: 6005 Cooper Point Rd. NW, Olympia, WA 98502
General Description: An older station built in 1974 and remodeled in 1986. This station is very small and unstaffed. The single bay has room for only one engine.
Structure
Construction Type Masonry
Date of Construction 1974; remodeled in 1986
Seismic Protection No
Auxiliary Power Yes
General Condition Good
Apparatus Bays 0 Drive-through bays 1 back-in bays
Special considerations (ADA, etc.) None
Square Footage 2,132
Facilities Available
Separate Rooms/Dormitory/Other 2 Bedrooms 2 Beds N/A Beds in dormitory
Maximum Station Staffing Capability 2–4
Exercise/Workout Facilities No
Kitchen/Dormitory Yes
Individual Lockers/Storage Assigned Yes
Shower Facilities Yes. Half-bath behind bay; one full-bath with shower
Training/Meeting Rooms No
Washer/Dryer Yes
Safety & Security
Sprinklers and/or Smoke Detection No/Yes
Decontamination/Biohazard Disposal Yes
Security No
Apparatus Exhaust System Yes

Regional Fire & Emergency Services Study City of Tumwater Fire Department
229
Figure 235: McLane-Black Lake Station 95
Address/Physical Location: 5911 Black Lake Blvd SW, Olympia, WA 98512
General Description: This is a very large and modern fire station. There is substantial capacity for apparatus, personnel, and office/computer facilities. Station has a conference room and very large classroom. McLane-Black Lake provides office space for the Western Regional EMS & Trauma Care Council.
Structure
Construction Type Wood Frame
Date of Construction 2005
Seismic Protection Yes
Auxiliary Power Yes
General Condition Very good
Apparatus Bays 3 Drive-through bays 0 back-in bays
Special considerations (ADA, etc.) ADA Compliant
Square Footage 15,983
Facilities Available
Separate Rooms/Dormitory/Other 7 Bedrooms 10 Beds 6 Beds in dormitory
Maximum Station Staffing Capability 14
Exercise/Workout Facilities Yes
Kitchen/Dormitory Yes
Individual Lockers/Storage Assigned Yes
Shower Facilities Yes
Training/Meeting Rooms Yes
Washer/Dryer Yes
Safety & Security
Sprinklers and/or Smoke Detection Yes/Yes
Decontamination/Biohazard Disposal Yes
Security No
Apparatus Exhaust System Yes

Regional Fire & Emergency Services Study City of Tumwater Fire Department
230
West Thurston Fire Stations
Figure 236: West Thurston RFA Station 1-1
Address/Physical Location: 10828 Littlerock Rd. SW, Olympia, WA 98512
General Description: This is relatively large and modern fire station capable of housing up to 14 personnel. There are five drive-through bays capable of housing a number of apparatus. Storage is limited. Mixed gender facilities.
Structure
Construction Type Type 3
Date of Construction 1997
Seismic Protection Yes (per code)
Auxiliary Power Yes
General Condition Good
Apparatus Bays 5 Drive-through bays 0 back-in bays
Special considerations (ADA, etc.) ADA compliant; mixed-gender appropriate
Square Footage 11,995
Facilities Available
Separate Rooms/Dormitory/Other 12 Bedrooms 14 Beds N/A Beds in dormitory
Maximum Station Staffing Capability 14
Exercise/Workout Facilities Yes
Kitchen/Dormitory Yes
Individual Lockers/Storage Assigned One male & one female locker rooms
Shower Facilities Two male & two female showers
Training/Meeting Rooms One large; one small
Washer/Dryer One commercial washer/extractor; one standard washer
Safety & Security
Sprinklers and/or Smoke Detection Yes/Yes
Decontamination/Biohazard Disposal Yes
Security Yes (limited access; video surveillance)
Apparatus Exhaust System Plymovent system

Regional Fire & Emergency Services Study City of Tumwater Fire Department
231
Figure 237: West Thurston RFA Station 1-2
Address/Physical Location: 18720 Sargent Rd. SW Rochester, WA 98579
General Description: Another relatively large and modern fire station with three drive-through bays capable of housing a number of apparatus. The station has ample room to house at least 12 personnel, and has ample mixed-gender facilities.
Structure
Construction Type Type 5
Date of Construction 2007
Seismic Protection Yes (per code)
Auxiliary Power Yes
General Condition Good
Apparatus Bays 3 Drive-through bays 0 back-in bays
Special considerations (ADA, etc.) ADA compliant; mixed-gender appropriate
Square Footage 15,000
Facilities Available
Separate Rooms/Dormitory/Other 7 Bedrooms 9 Beds Bunks in two rooms
Maximum Station Staffing Capability 12
Exercise/Workout Facilities Yes
Kitchen/Dormitory Two kitchens
Individual Lockers/Storage Assigned One male & one female locker rooms
Shower Facilities Two male & two female showers
Training/Meeting Rooms One large; one small
Washer/Dryer One commercial washer/extractor; one standard washer
Safety & Security
Sprinklers and/or Smoke Detection Yes/Yes
Decontamination/Biohazard Disposal Yes; includes shower
Security Video surveillance
Apparatus Exhaust System Yes

Regional Fire & Emergency Services Study City of Tumwater Fire Department
232
Figure 238: West Thurston RFA Station 1-3
Address/Physical Location: 18346 Albany SW, Rochester, WA 98579
General Description: This is an older station built in 1976, but remodeled in 2012. It is located in a relatively rural area in Rochester. It has the capacity to house at least four personnel.
Structure
Construction Type Type 3
Date of Construction 1976 (remodeled 2012)
Seismic Protection Per code/Yes
Auxiliary Power Yes
General Condition Good
Apparatus Bays 0 Drive-through bays 4 back-in bays
Special considerations (ADA, etc.) ADA compliant; mixed-gender appropriate
Square Footage 5,060
Facilities Available
Separate Rooms/Dormitory/Other 4 Bedrooms 4 Beds N/A Beds in dormitory
Maximum Station Staffing Capability 4
Exercise/Workout Facilities Yes
Kitchen/Dormitory Yes
Individual Lockers/Storage Assigned None
Shower Facilities Two bathroom/shower combinations
Training/Meeting Rooms No
Washer/Dryer Standard type
Safety & Security
Sprinklers and/or Smoke Detection Yes/Yes
Decontamination/Biohazard Disposal Sink only
Security Video surveillance
Apparatus Exhaust System Yes
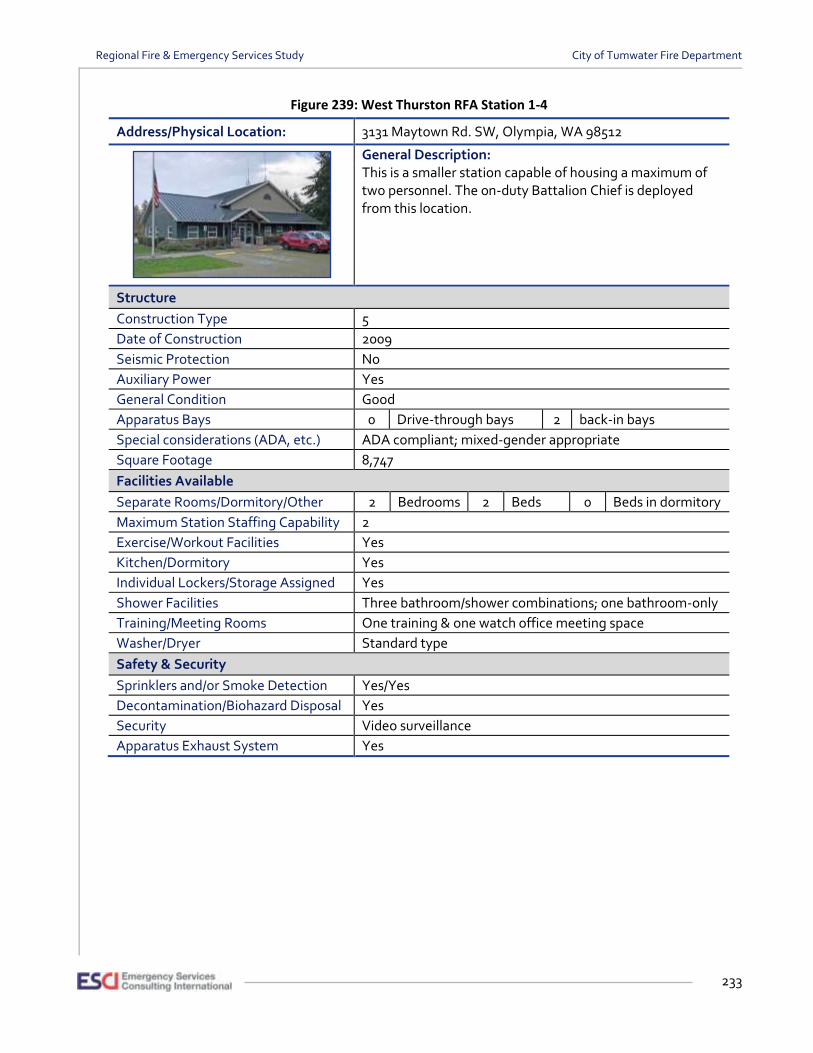
Regional Fire & Emergency Services Study City of Tumwater Fire Department
233
Figure 239: West Thurston RFA Station 1-4
Address/Physical Location: 3131 Maytown Rd. SW, Olympia, WA 98512
General Description: This is a smaller station capable of housing a maximum of two personnel. The on-duty Battalion Chief is deployed from this location.
Structure
Construction Type 5
Date of Construction 2009
Seismic Protection No
Auxiliary Power Yes
General Condition Good
Apparatus Bays 0 Drive-through bays 2 back-in bays
Special considerations (ADA, etc.) ADA compliant; mixed-gender appropriate
Square Footage 8,747
Facilities Available
Separate Rooms/Dormitory/Other 2 Bedrooms 2 Beds 0 Beds in dormitory
Maximum Station Staffing Capability 2
Exercise/Workout Facilities Yes
Kitchen/Dormitory Yes
Individual Lockers/Storage Assigned Yes
Shower Facilities Three bathroom/shower combinations; one bathroom-only
Training/Meeting Rooms One training & one watch office meeting space
Washer/Dryer Standard type
Safety & Security
Sprinklers and/or Smoke Detection Yes/Yes
Decontamination/Biohazard Disposal Yes
Security Video surveillance
Apparatus Exhaust System Yes
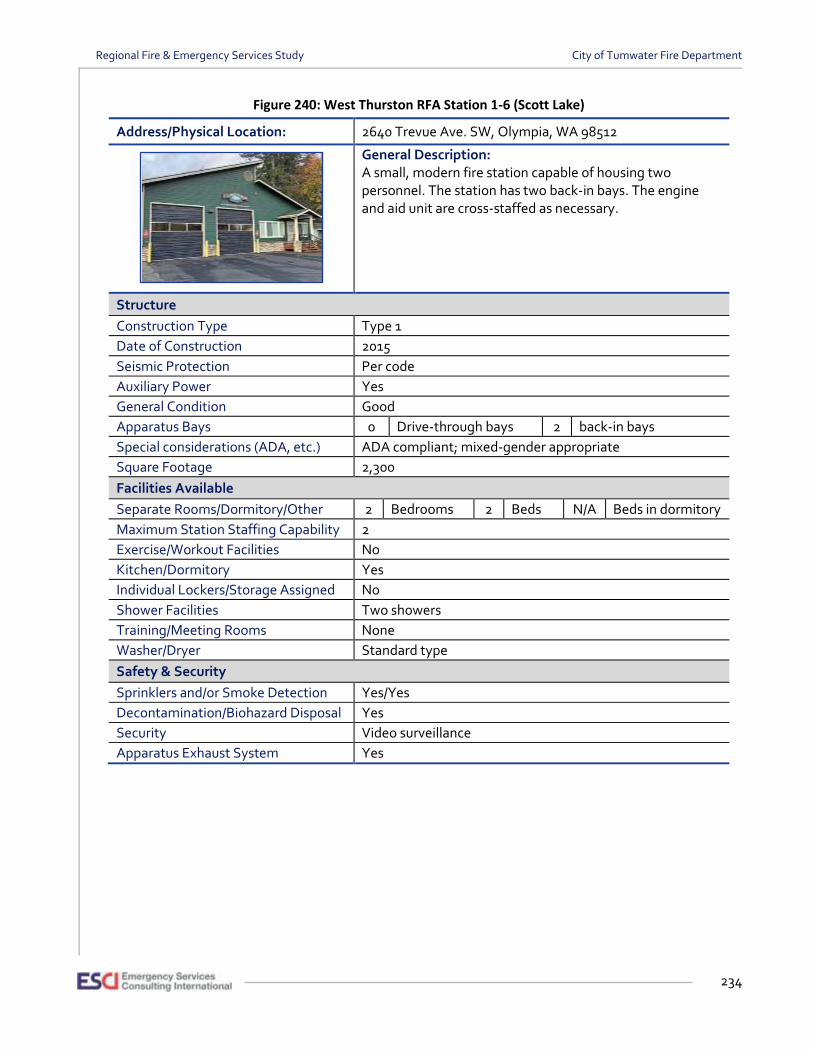
Regional Fire & Emergency Services Study City of Tumwater Fire Department
234
Figure 240: West Thurston RFA Station 1-6 (Scott Lake)
Address/Physical Location: 2640 Trevue Ave. SW, Olympia, WA 98512
General Description: A small, modern fire station capable of housing two personnel. The station has two back-in bays. The engine and aid unit are cross-staffed as necessary.
Structure
Construction Type Type 1
Date of Construction 2015
Seismic Protection Per code
Auxiliary Power Yes
General Condition Good
Apparatus Bays 0 Drive-through bays 2 back-in bays
Special considerations (ADA, etc.) ADA compliant; mixed-gender appropriate
Square Footage 2,300
Facilities Available
Separate Rooms/Dormitory/Other 2 Bedrooms 2 Beds N/A Beds in dormitory
Maximum Station Staffing Capability 2
Exercise/Workout Facilities No
Kitchen/Dormitory Yes
Individual Lockers/Storage Assigned No
Shower Facilities Two showers
Training/Meeting Rooms None
Washer/Dryer Standard type
Safety & Security
Sprinklers and/or Smoke Detection Yes/Yes
Decontamination/Biohazard Disposal Yes
Security Video surveillance
Apparatus Exhaust System Yes

Regional Fire & Emergency Services Study City of Tumwater Fire Department
235
Olympia Fire Stations
Figure 241: Olympia Station 1 (Headquarters)
Address/Physical Location: 100 Eastside Street NE, Olympia, WA 98506
General Description: Large-capacity facility housing the fire department administration along with multiple apparatus and fire crews. Ample room for personnel with excellent kitchen facility and dayroom. All bays are back-in and two-deep, depending on the apparatus.
Structure
Construction Type Ordinary, brick facade, steel studs
Date of Construction 1992
Seismic Protection Energy audits by City of Olympia
Auxiliary Power Yes
General Condition Good
Apparatus Bays 0 Drive-through bays 6 back-in bays
Special considerations (ADA, etc.) Mixed-gender appropriate; male & female restrooms
Square Footage 22,525
Facilities Available
Separate Rooms/Dormitory/Other 10 Bedrooms 10 Beds N/A Beds in dormitory
Maximum Station Staffing Capability 10
Exercise/Workout Facilities Yes
Kitchen/Dormitory Yes
Individual Lockers/Storage Assigned Yes
Shower Facilities Two
Training/Meeting Rooms Three rooms
Washer/Dryer Standard and commercial for turnout gear
Safety & Security
Sprinklers and/or Smoke Detection Yes/Yes (fire alarm)
Decontamination/Biohazard Disposal Yes
Security Video cameras
Apparatus Exhaust System Nederman exhaust system

Regional Fire & Emergency Services Study City of Tumwater Fire Department
236
Figure 242: Olympia Station 2
Address/Physical Location: 330 Kenyon Street NW, Olympia, WA 98502
General Description: Olympia Fire Station 2 houses the busiest engine company in the City. It has double back-in bays that are two-deep. An ALS medic unit is deployed from this station.
Structure
Construction Type Brick
Date of Construction 1992
Seismic Protection Energy audits by City hall
Auxiliary Power Yes
General Condition Fair
Apparatus Bays 0 Drive-through bays 2 back-in bays (2 deep)
Special considerations (ADA, etc.) Mixed-gender appropriate; male & female restrooms
Square Footage 6,070
Facilities Available
Separate Rooms/Dormitory/Other 5 Bedrooms 5 Beds N/A Beds in dormitory
Maximum Station Staffing Capability 6
Exercise/Workout Facilities Yes
Kitchen/Dormitory Yes
Individual Lockers/Storage Assigned Yes
Shower Facilities Two
Training/Meeting Rooms One
Washer/Dryer Standard and commercial for turnout gear
Safety & Security
Sprinklers and/or Smoke Detection Yes/Yes (fire alarm)
Decontamination/Biohazard Disposal Yes
Security Video cameras
Apparatus Exhaust System Nederman exhaust system

Regional Fire & Emergency Services Study City of Tumwater Fire Department
237
Figure 243: Olympia Station 3
Address/Physical Location: 2525 22nd Avenue SE, Olympia, WA 98501
General Description: Olympia Station 3 is a two-story facility located in a predominantly residential area. The crew quarters are located on second floor, making access to the apparatus bays down a stairway.
Structure
Construction Type Ordinary/residential wood
Date of Construction 1993 with later add-on exercise room
Seismic Protection Energy by City hall
Auxiliary Power Yes
General Condition Good
Apparatus Bays 0 Drive-through bays 2 back-in bays
Special considerations (ADA, etc.) Mixed-gender appropriate
Square Footage 4,750
Facilities Available
Separate Rooms/Dormitory/Other 4 Bedrooms 4 Beds 0 Beds in dormitory
Maximum Station Staffing Capability 5 (if fifth bed added)
Exercise/Workout Facilities Yes
Kitchen/Dormitory Yes
Individual Lockers/Storage Assigned Yes
Shower Facilities Yes
Training/Meeting Rooms Yes
Washer/Dryer Standard and commercial for turnout gear
Safety & Security
Sprinklers and/or Smoke Detection No/Yes (fire alarm)
Decontamination/Biohazard Disposal Yes
Security No
Apparatus Exhaust System Nederman exhaust system

Regional Fire & Emergency Services Study City of Tumwater Fire Department
238
Figure 244: Olympia Station 4
Address/Physical Location: 3525 Stoll Rd SE, Olympia, WA 98501
General Description: Station 4 is a large, modern and well-designed and equipped station. Substantial capacity for apparatus and personnel. Attractive exterior that presents a positive community image.
Structure
Construction Type Ordinary, wood stud, metal siding and roof
Date of Construction 2010
Seismic Protection Yes and audits by City
Auxiliary Power Yes
General Condition Excellent
Apparatus Bays 0 Drive-through bays 3 back-in bays (1-2 deep)
Special considerations (ADA, etc.) Separate dorms & individual restrooms
Square Footage 13,000
Facilities Available
Separate Rooms/Dormitory/Other 6 Bedrooms 6 Beds N/A Beds in dormitory
Maximum Station Staffing Capability 8
Exercise/Workout Facilities Yes
Kitchen/Dormitory Yes
Individual Lockers/Storage Assigned Yes
Shower Facilities Yes
Training/Meeting Rooms Yes, and small library room
Washer/Dryer Standard and commercial for turnout gear
Safety & Security
Sprinklers and/or Smoke Detection Yes/Yes (fire alarm)
Decontamination/Biohazard Disposal Yes; extractor
Security No
Apparatus Exhaust System Nederman exhaust system

Regional Fire & Emergency Services Study City of Tumwater Fire Department
239
Apparatus Maintenance Facilities
Several of the fire departments in this study maintain their own apparatus and equipment maintenance
facilities. The East Olympia Fire Department maintains a storage and maintenance facility adjacent to
Station 61, as shown in the following figure.
Lacey Fire District 3 has an apparatus maintenance facility adjacent to its Station 34, which is shared by the
Olympia Fire Department and other agencies, including Thurston County Medic One.
Figure 245: East Olympia Storage & Maintenance Facility (adjacent to Station 61)
Figure 246: Lacey Fire District 3 Shared Maintenance Facility

Regional Fire & Emergency Services Study City of Tumwater Fire Department
240
Figure 247: Details of Lacey District #3 Shared Apparatus Maintenance Facility
Address/Physical Location: 8407 Steilacoom Rd SE, Lacey, WA (leased)
Structure
Construction Type Metal frame
Date of Construction 2004
Seismic Protection Unknown
Auxiliary Power No
General Condition Good
Special considerations (ADA, etc.) N/A
Square Footage 7,676
Facilities Available
Exercise/Workout Facilities No
Kitchen/Dormitory Refrigerator and sink
Shower Facilities No
Safety & Security
Sprinklers and/or Smoke Detection Yes/Yes
Security Yes
Apparatus Exhaust System Yes

Regional Fire & Emergency Services Study City of Tumwater Fire Department
241
APPENDIX C: NFPA 1720 RESPONSE PERFORMANCE ELEMENTS
Term Ref. # Definition Performance Standard
Alarm Answering Time
4.1.2.3.1 9-1-1 call time from first ring to answer. Not defined or measured in this
standard
Alarm Transfer Time
4.1.2.3.2 Time from receipt of emergency alarm at
PSAP until alarm receipt at communication center.
Not defined or measured in this standard
Alarm Processing Time
4.1.2.3.3 Call process time from acknowledged at the dispatch center until notification of
response units.
Not defined or measured in this standard
Alarm Processing Time –
Exceptions 4.1.2.3.3.1
1. Calls requiring EMD questioning & pre-arrival medical instructions
Not defined or measured in this standard
2. Calls requiring language translation
3. Calls requiring the use of a TTY/TDD device or audio/video relay services
4. Calls of criminal activity that require information vital to emergency responder safety prior to dispatching units
5. Hazardous material incidents
6. Technical rescue
7. Calls that require determining the location of the alarm due to insufficient information
8. Calls received by text message
Turnout Time 4.1.2.1(2)
4.1.2.4
Time from notification of response personnel until the initiation of movement
towards the incident.
Where staffed stations are provided as defined by the AHJ: Within 90
seconds for fire & special operations, 90% of the time
Within 60 seconds for EMS, 90% of the time
Travel Time – Fire
4.1.2.1(3) 4.1.2.4
Time that begins when an engine company is en route to the emergency
incident and ends when the unit arrives at the scene.
Not defined or measured in this standard
Travel Time –EMS
4.1.2.1(6) 4.1.2.4
Time that begins when unit with 1st responder AED or higher level
capability at an EMS Incident and ends when the unit arrives at the scene.
Not defined or measured in this standard
Travel Time – ALS
(when FD based)
4.1.2.1(7) 4.1.2.4
Time that begins when unit with advanced life support capability at an EMS Incident and ends when the unit arrives at
the scene.
Not defined or measured in this standard
Travel Time – Full Alarm
Assignment (Residential Fire)
4.1.2.1(4) 4.1.2.4 5.2.4.1
The initial full alarm assignment to a structure fire in a typical 2000 ft2 (186 m2),
two-story single-family dwelling without basement and with no exposures
Not defined or measured in this standard

Regional Fire & Emergency Services Study City of Tumwater Fire Department
242
Term Ref. # Definition Performance Standard
Travel Time – Full Alarm
Assignment (Open Air Strip
Mall Fire)
4.1.2.1(4) 4.1.2.4 5.2.4.2
The initial full alarm assignment to a structure fire in an Open-Air Strip
Shopping Center ranging from 13,000 ft2 to 196,000 ft2 (1,203 m2 to
18,209 m2) in size
Not defined or measured in this standard
Travel Time – Full Alarm
Assignment (Apartment Fire)
4.1.2.1(4) 4.1.2.4 5.2.4.3
The initial full alarm assignment to a structure fire in a typical 1,200 ft2 (111 m2)
apartment within a three-story, garden style apartment building
Not defined or measured in this standard
Travel Time – Full Alarm
Assignment (High-rise Fire)
4.1.2.1(4) 4.1.2.4 5.2.4.4
The Initial full alarm assignment to a fire in a building with the highest floor greater
than 75 ft (23 m) above the lowest level of fire department vehicle
access
Not defined or measured in this standard
Response Time – Fire & Special
Operations (Effective
Response Force)
Table 4.3.2 (footnote c)
Accumulation of Turnout Time
and Travel Time
Fire and special operations incidents
Urban area > 1,000 people/mi2 15 FFs are delivered within 9
minutes, 90% of the time
Suburban area 500–1,000 people/mi2
10 FFs are delivered within 10 minutes, 80% of the time
Rural area < 500 people/mi2 6 FFs within 14 minutes, 80% of the time
Remote area Travel distance ≥ 8 miles, 4 FFs within timeframe
dependent on travel distance, 90% of the time
Special risks determined by AHJ, Minimum FFs determined by
AHJ based on risk, Response time determined by
AHJ, 90% of the time
Response Time –EMS
Accumulation of Turnout Time
and Travel Time Emergency medical incidents
EMS operations shall be organized to ensure the fire department’s emergency medical capability
includes personnel, equipment, and resources to deploy
the initial arriving company and additional alarm assignments. (no
specific standard)
Initiation of Fire Attack
4.3.4
Upon assembling the necessary resources at the emergency scene, the fire
department shall have the capability to safely commence an initial attack
(determined by population density, or AHJ for special risks)
Within 2 minutes, 90% of the time.

Regional Fire & Emergency Services Study City of Tumwater Fire Department
243
APPENDIX D: NFPA 1710 RESPONSE PERFORMANCE ELEMENTS
Term Ref. # Definition Performance Standard Min Staff
Alarm Answering Time
4.1.2.3.1 9-1-1 call time from first ring
to answer.
Within 15 seconds, 95% of the time
Within 40 seconds, 99% of the time
N/A
Alarm Transfer Time
4.1.2.3.2
Time from receipt of emergency alarm at PSAP
until alarm receipt at communication center.
Within 30 seconds, 95% of the time
N/A
Alarm Processing Time
4.1.2.3.3
Call process time from acknowledged at the dispatch center until
notification of response units.
Within 64 seconds, 90% of the alarms and within 106 seconds,
95% of the alarms N/A
Alarm Processing Time –
Exceptions 4.1.2.3.3.1
1. Calls requiring EMD questioning & pre-arrival medical instructions
Within 90 seconds, 90% of the time
Within 120 seconds 99% of the time
N/A
2. Calls requiring language translation
3. Calls requiring use of a TTY/TDD device or audio/video relay services
4. Calls of criminal activity that require information vital to emergency responder safety prior to dispatching units
5. Hazardous material incidents
6. Technical rescue
7. Calls that require determining location of alarm due to insufficient information
8. Calls received by text message
Turnout Time 4.1.2.1(2)
4.1.2.4
Time from notification of response personnel until the
initiation of movement towards the incident.
Within 80 seconds for fire & special operations response, 90%
of the time Within 60 seconds for EMS response, 90% of the time
N/A
Travel Time – Fire
4.1.2.1(3) 4.1.2.4
Time that begins when an engine company is en route to the emergency incident
and ends when the unit arrives at the scene.
Within 4 minutes travel time for the arrival of the first arriving
engine company, 90% of the time N/A

Regional Fire & Emergency Services Study City of Tumwater Fire Department
244
Term Ref. # Definition Performance Standard Min Staff
Travel Time – EMS
4.1.2.1(6) 4.1.2.4
Time that begins when unit with
1st responder with AED or higher level capability at an
EMS Incident and ends when the unit arrives at the scene.
Within 4 minutes travel time for arrival of a unit with 1st
responder with AED or higher level capability at an EMS Incident, 90% of the time
N/A
Travel Time – ALS (when FD based)
4.1.2.1(7) 4.1.2.4
Time that begins when unit with
advanced life support capability at an emergency medical Incident and ends
when the unit arrives at the scene.
Within 8 minutes travel time for arrival of an advanced life support
(ALS) unit at an EMS incident, provided a first responder with
AED or basic life support (BLS) unit arrived in 4 minutes or less travel
time, 90% of the time
N/A
Travel Time – Full Alarm
Assignment (Residential Fire)
4.1.2.1(4) 4.1.2.4 5.2.4.1
The initial full alarm assignment to a structure fire in a typical 2,000 ft2 (186 m2),
two-story single-family dwelling without basement
and with no exposures
Within 8 minutes travel time for the deployment of an initial full alarm assignment at a fire
suppression incident, 90% of the time
14 FFs, or 15 w/aerial (5.2.4.1.1)
Travel Time – Full Alarm
Assignment (Open Air Strip
Mall Fire)
4.1.2.1(4) 4.1.2.4 5.2.4.2
The initial full alarm assignment to a structure fire in an Open-Air Strip Shopping Center ranging from 13,000
ft2 to 196,000 ft2 (1203 m2 to 18,209 m2) in size
Within 8 minutes travel time for the deployment of an initial full alarm assignment at a fire
suppression incident, 90% of the time
27 FFs, or 28 w/aerial (5.2.4.2.1)
Travel Time – Full Alarm
Assignment (Apartment Fire)
4.1.2.1(4) 4.1.2.4 5.2.4.3
The initial full alarm assignment to a structure fire in a typical 1,200 ft2 (111 m2)
apartment within a three-story, garden style apartment
building
Within 8 minutes travel time for the deployment of an initial full
alarm assignment at a fire suppression incident, 90% of the
time
27 FFs, or 28 w/aerial (5.2.4.3.1)
Travel Time – Full Alarm
Assignment (High-rise Fire)
4.1.2.1(4) 4.1.2.4 5.2.4.4
The Initial full alarm assignment to a fire in a building with the highest
floor greater than 75 ft (23 m) above the lowest level of
fire department vehicle access
Within 8 minutes travel time for the deployment of an initial full
alarm assignment at a fire suppression incident, 90% of the
time
46 FFs (5.2.4.4.1)
Total Response Time
3.3.53.6
Time from receipt of alarm at the primary PSAP to first
emergency response unit is initiating action or
intervening to control incident.
Too many variables—depends on call type—no standard for
initiation action or intervening to control incident
Depends on call type
Response Time – Fire & Special
Operations (Effective
Response Force)
Accumulation of Turnout Time
and Travel Time
The initial full alarm assignment arrives
Within 9 minutes, 20 seconds, 90% of the time
Depends on call type
1st Unit Response Time – Fire &
Special Operations
Accumulation of Turnout Time
and Travel Time
Fire and special operations incidents
Within 5 minutes, 20 seconds, 90% of the time
4 FFs (5.2.3.1.1)

Regional Fire & Emergency Services Study City of Tumwater Fire Department
245
Term Ref. # Definition Performance Standard Min Staff
1st Unit Response Time – BLS EMS
Accumulation of Turnout Time
and Travel Time Emergency medical incidents Within 5 minutes, 90% of the time
Typically 2 BLS certified
personnel 5.3.3.2.1
ALS Unit Response Time –
ALS EMS
Accumulation of Turnout Time
and Travel Time
Advanced life support emergency medical incidents
where FD provides BLS 1st response
Within 9 minutes, 90% of the time (provided a first responder with
AED or basic life support unit arrived in 4 minutes or less travel
time)
Typically 2 5.3.3.2.1