Embed Size (px)
Citation preview

Tuna Price in Relation to Economic Factors and Sea
Surface Temperature
Minling Pan, Ph.D.Minling Pan, Ph.D.Samuel G. Pooley, Ph.D.Samuel G. Pooley, Ph.D.
Pacific Islands Fisheries Science Center, NMFSPacific Islands Fisheries Science Center, NMFS

Acknowledgments
This project was funded by cooperative This project was funded by cooperative agreement #658848 between JIMAR and agreement #658848 between JIMAR and NOAANOAA
Kurt Kawamoto and other PIFSC staffKurt Kawamoto and other PIFSC staff
Previous Studies on Tuna Price in Hawaii Market
McConnell, et. al. 1998McConnell, et. al. 1998Fish quality (grade) vs. price Fish quality (grade) vs. price Evaluate price on the basis of the grade of fish, Evaluate price on the basis of the grade of fish,
not on a species basisnot on a species basis
Bartram, et. al. 1996Bartram, et. al. 1996Fish grading vs. pricingFish grading vs. pricingGraded based on species, size, body defects,Graded based on species, size, body defects,& muscle quality& muscle qualityPrice varied by species and gradePrice varied by species and grade
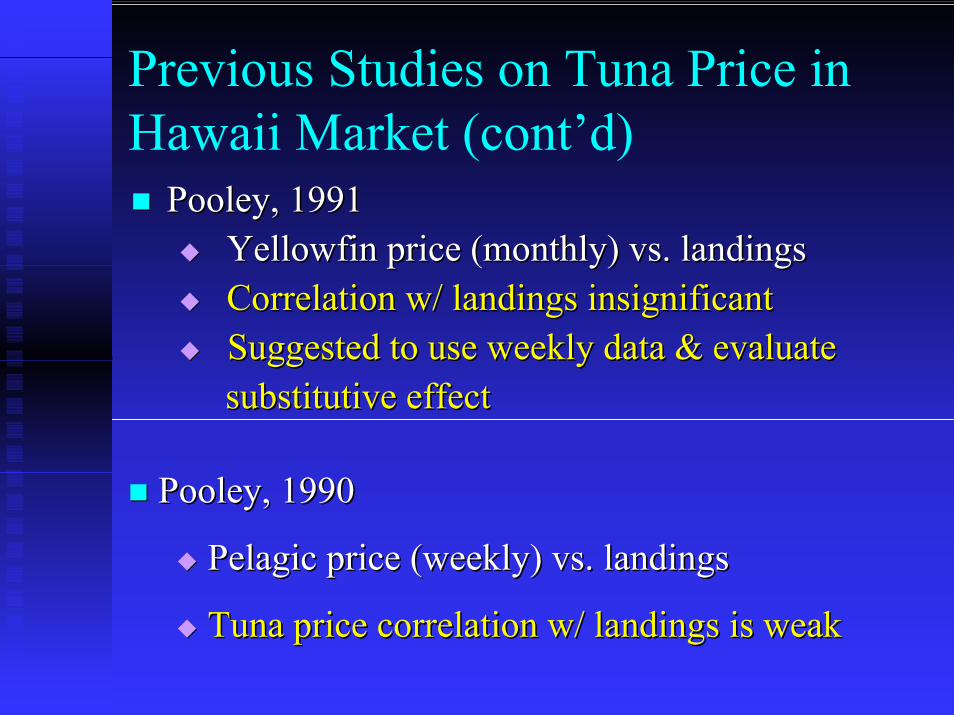
Previous Studies on Tuna Price in Hawaii Market (cont’d)
Pooley, 1991Pooley, 1991Yellowfin price (monthly) vs. landingsYellowfin price (monthly) vs. landingsCorrelation w/ landings insignificantCorrelation w/ landings insignificantSuggested to use weekly dataSuggested to use weekly data & evaluate & evaluate substitutive effectsubstitutive effect
Pooley, 1990Pooley, 1990
Pelagic price (weekly) vs. landingsPelagic price (weekly) vs. landings
Tuna price correlation w/ landings is weakTuna price correlation w/ landings is weak
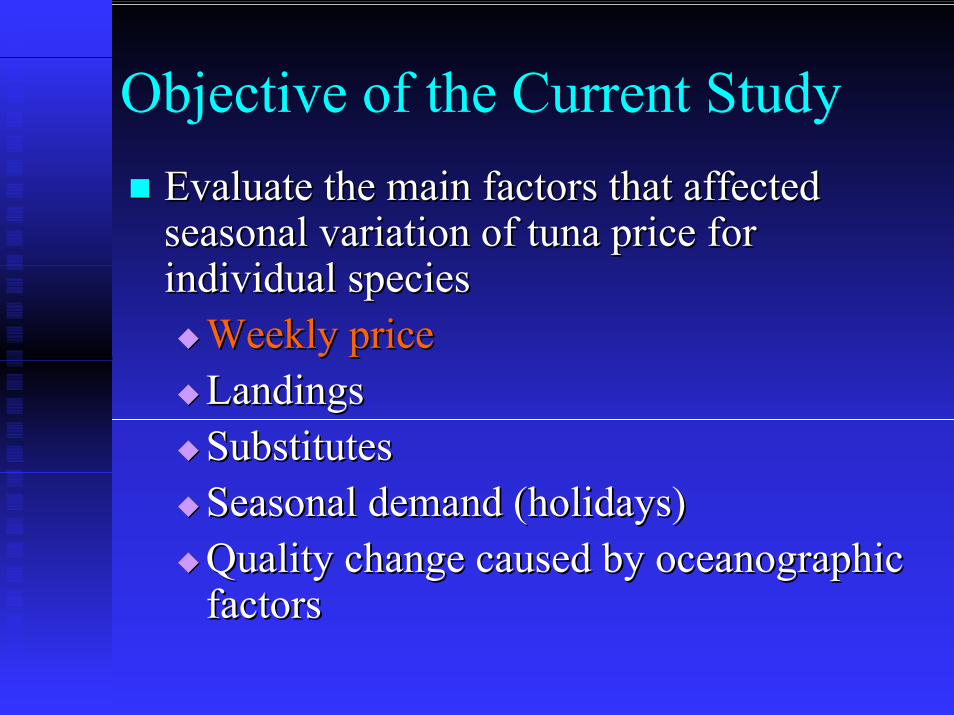
Objective of the Current StudyEvaluate the main factors that affected Evaluate the main factors that affected seasonal variation of tuna price for seasonal variation of tuna price for individual speciesindividual species
Weekly priceWeekly priceLandingsLandingsSubstitutesSubstitutesSeasonal demand (holidays)Seasonal demand (holidays)Quality change caused by oceanographic Quality change caused by oceanographic factorsfactors
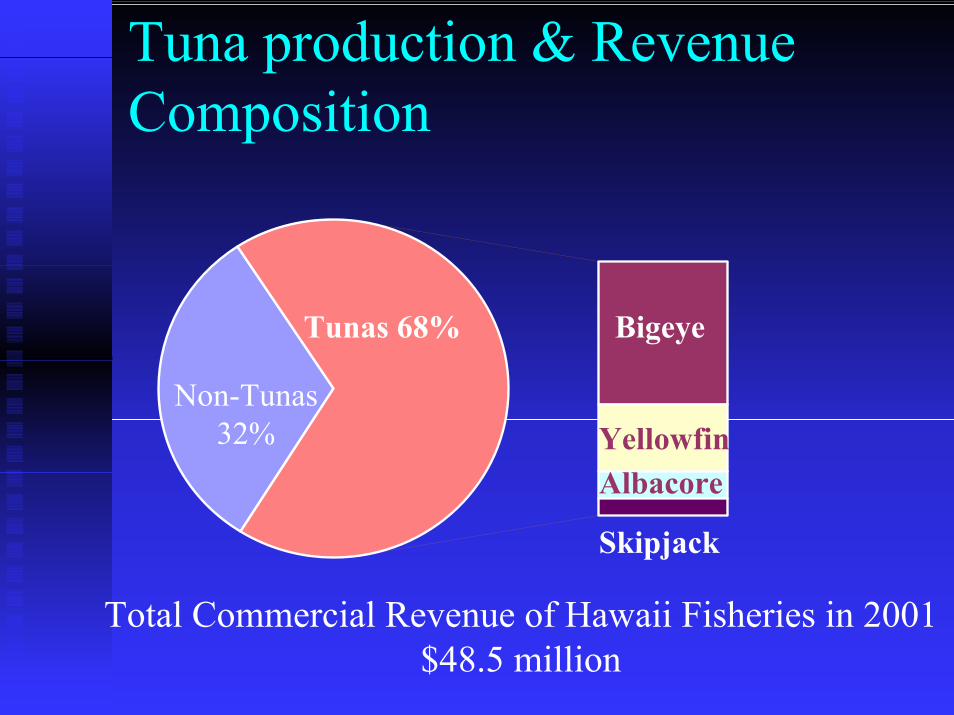
Tuna production & Revenue Composition
Tunas 68%
Total Commercial Revenue of Hawaii Fisheries in 2001$48.5 million
Non-Tunas32%
Bigeye
YellowfinAlbacore
Skipjack
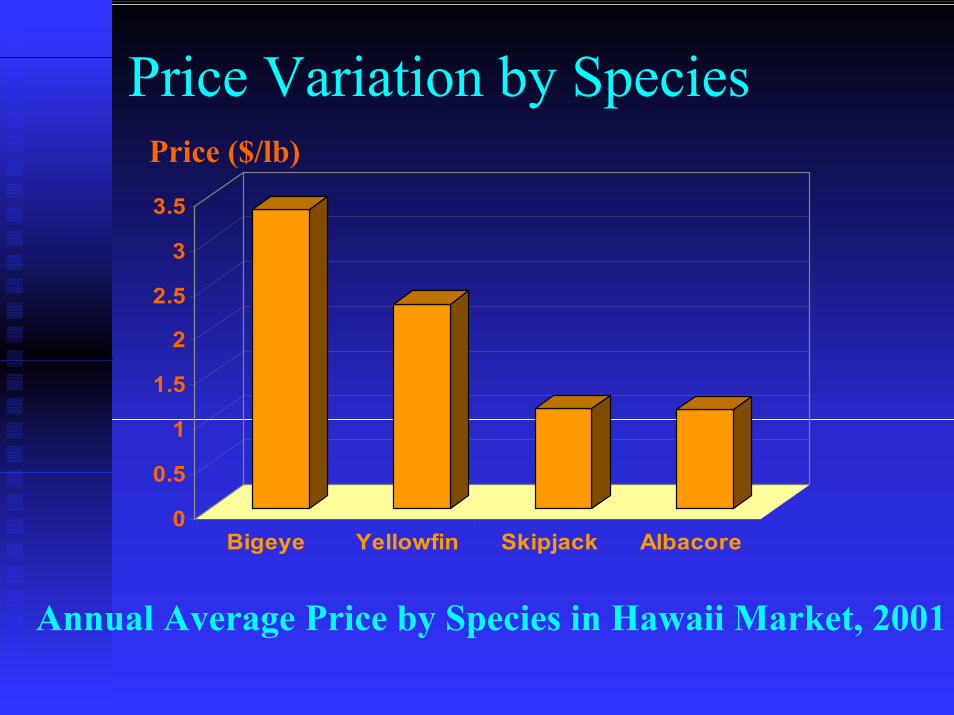
Price Variation by Species
0
0.5
1
1.5
2
2.5
3
3.5
Bigeye Yellowfin Skipjack Albacore
Price ($/lb)
Annual Average Price by Species in Hawaii Market, 2001
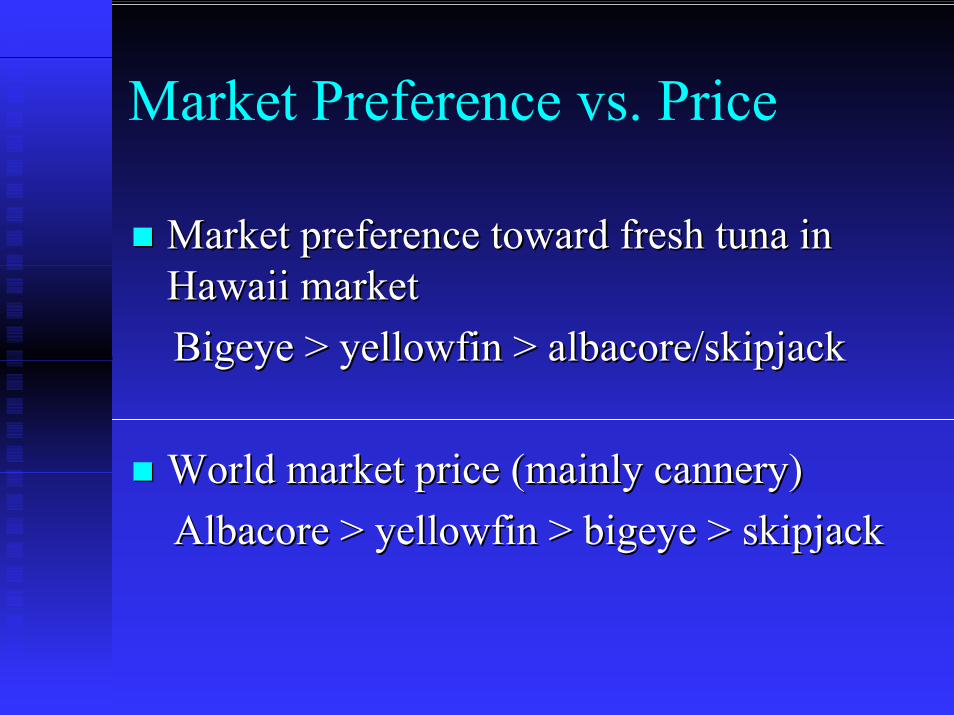
Market Preference vs. Price
Market preference toward fresh tuna in Market preference toward fresh tuna in Hawaii marketHawaii marketBigeye > yellowfin > albacore/skipjackBigeye > yellowfin > albacore/skipjack
World market price (mainly cannery) World market price (mainly cannery) Albacore > yellowfin > bigeye > skipjackAlbacore > yellowfin > bigeye > skipjack
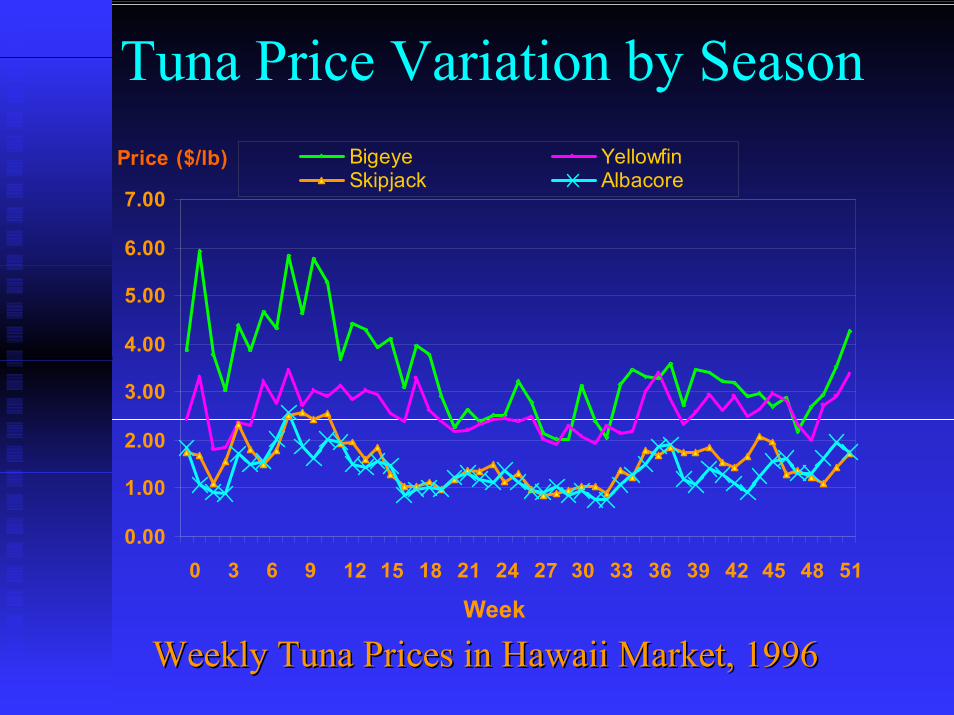
Tuna Price Variation by Season
Weekly Tuna Prices in Hawaii Market, 1996Weekly Tuna Prices in Hawaii Market, 1996
0.00
1.00
2.00
3.00
4.00
5.00
6.00
7.00
0 3 6 9 12 15 18 21 24 27 30 33 36 39 42 45 48 51
Bigeye YellowfinSkipjack Albacore
Price ($/lb)
Week
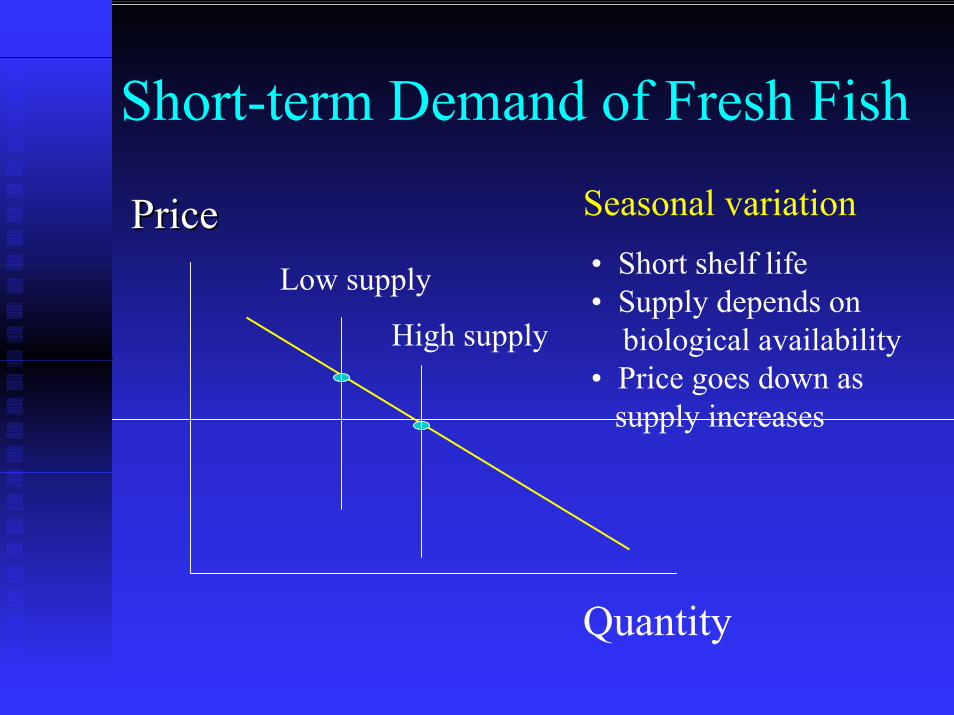
Short-term Demand of Fresh FishSeasonal variationPricePrice
Low supply
High supply
• Short shelf life• Supply depends on
biological availability• Price goes down as
supply increases
Quantity
Price-dependent Equation
Commonly used in estimating demand of Commonly used in estimating demand of agricultural products where price and agricultural products where price and quantity is determined recursivelyquantity is determined recursivelyFishermen may not be able to change Fishermen may not be able to change supply in response to price change in shortsupply in response to price change in short--termtermPrice is dependent variablePrice is dependent variable
PricePrice = = ff (Supply, Substitutes, Lagged price, Seasonal demand)(Supply, Substitutes, Lagged price, Seasonal demand)
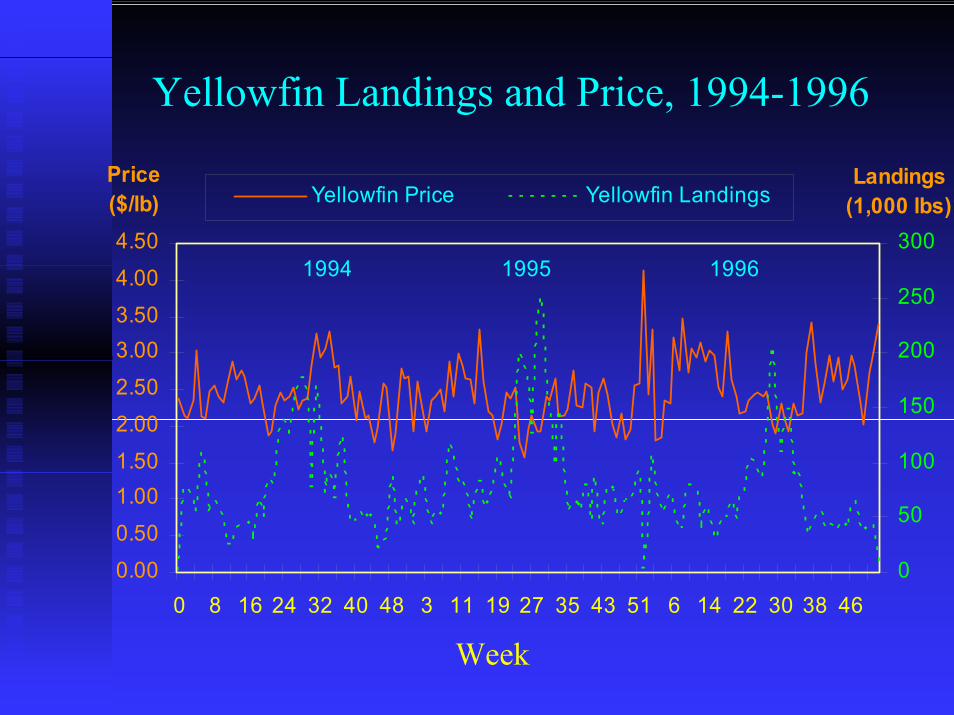
Yellowfin Landings and Price, 1994-1996
0.00
0.50
1.001.50
2.00
2.50
3.003.50
4.00
4.50
0 8 16 24 32 40 48 3 11 19 27 35 43 51 6 14 22 30 38 46
Price ($/lb)
0
50
100
150
200
250
300
Landings (1,000 lbs)Yellowfin Price Yellowfin Landings
1994 1995 1996
Week
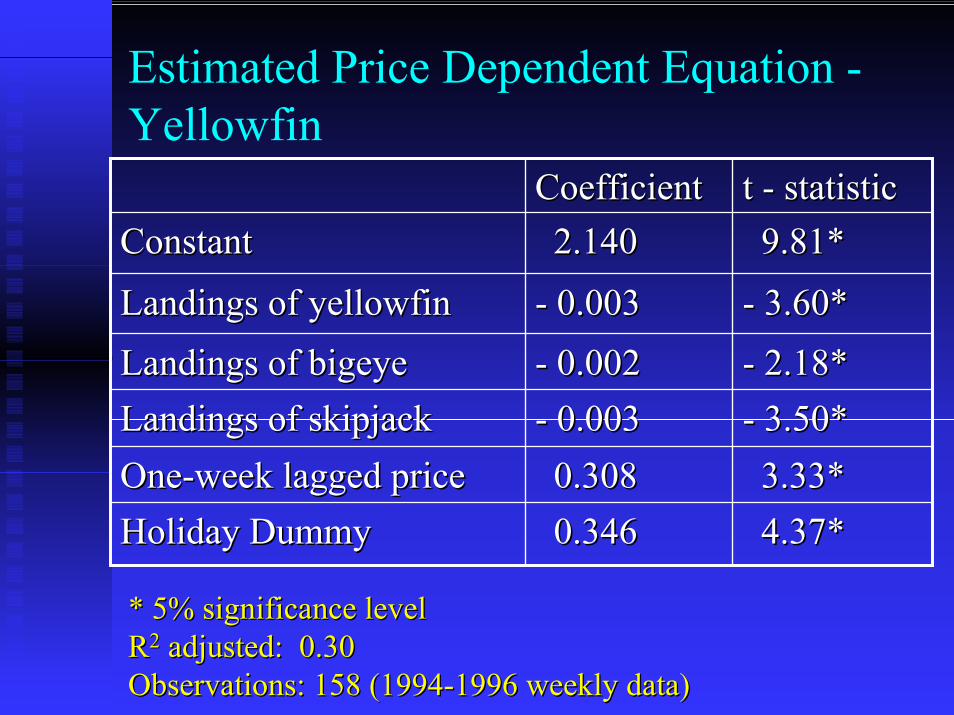
Estimated Price Dependent Equation -Yellowfin
4.37*4.37*0.3460.346Holiday DummyHoliday Dummy3.33*3.33*0.3080.308OneOne--week lagged priceweek lagged price
-- 3.50*3.50*-- 0.0030.003Landings of skipjackLandings of skipjack-- 2.18*2.18*-- 0.0020.002Landings of bigeyeLandings of bigeye-- 3.60*3.60*-- 0.0030.003Landings of yellowfinLandings of yellowfin
9.81*9.81*2.1402.140ConstantConstantt t -- statisticstatisticCoefficientCoefficient
* 5% significance level* 5% significance levelRR22 adjusted: 0.30adjusted: 0.30Observations: 158 (1994Observations: 158 (1994--1996 weekly data)1996 weekly data)
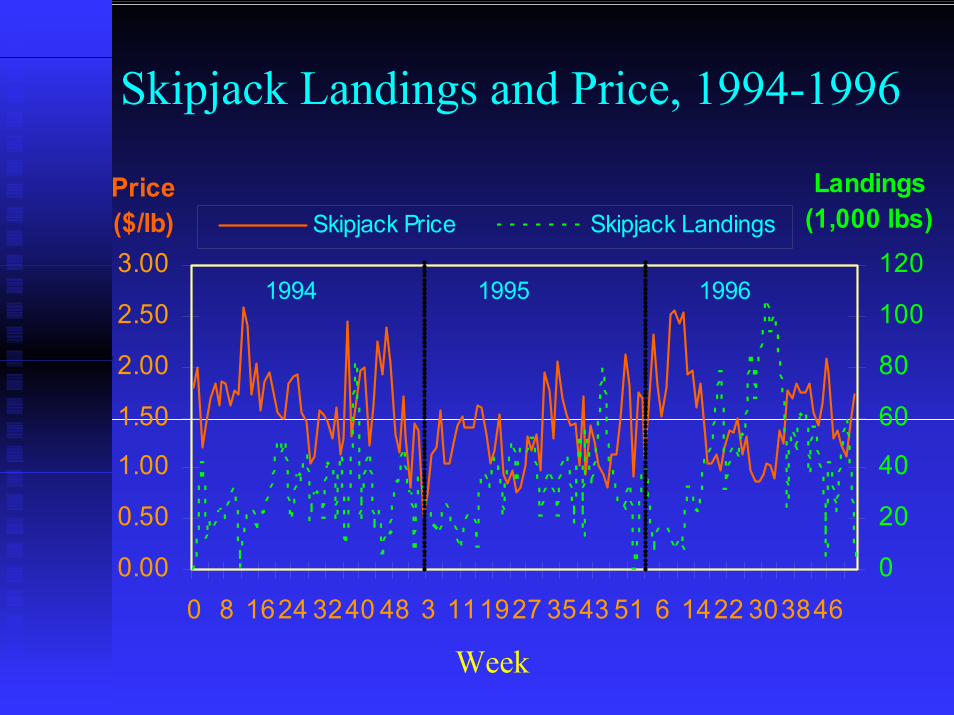
Skipjack Landings and Price, 1994-1996
0.00
0.50
1.00
1.50
2.00
2.50
3.00
0 8 1624 3240 48 3 111927 3543 51 6 1422 303846
Price ($/lb)
0
20
40
60
80
100
120
Landings (1,000 lbs)Skipjack Price Skipjack Landings
1994 1995 1996
Week
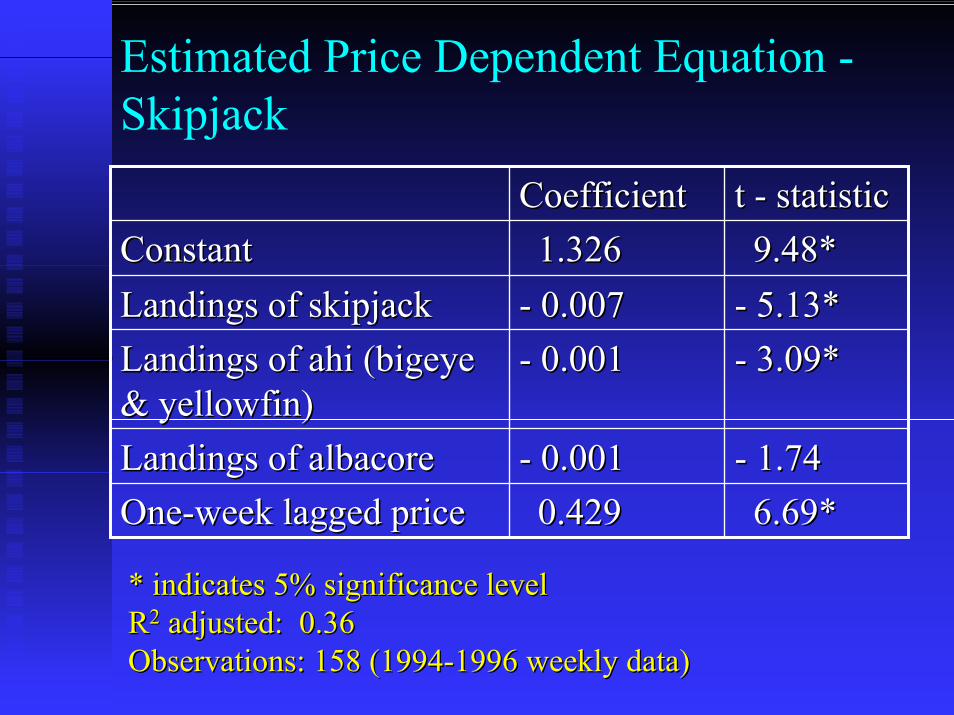
Estimated Price Dependent Equation -Skipjack
6.69*6.69*0.4290.429OneOne--week lagged priceweek lagged price-- 1.741.74-- 0.0010.001Landings of albacoreLandings of albacore
-- 3.09*3.09*-- 0.0010.001Landings of Landings of ahiahi (bigeye (bigeye & yellowfin)& yellowfin)
-- 5.13*5.13*-- 0.0070.007Landings of skipjackLandings of skipjack9.48*9.48*1.3261.326ConstantConstant
t t -- statisticstatisticCoefficientCoefficient
* indicates 5% significance level* indicates 5% significance levelRR22 adjusted: 0.36adjusted: 0.36Observations: 158 (1994Observations: 158 (1994--1996 weekly data)1996 weekly data)
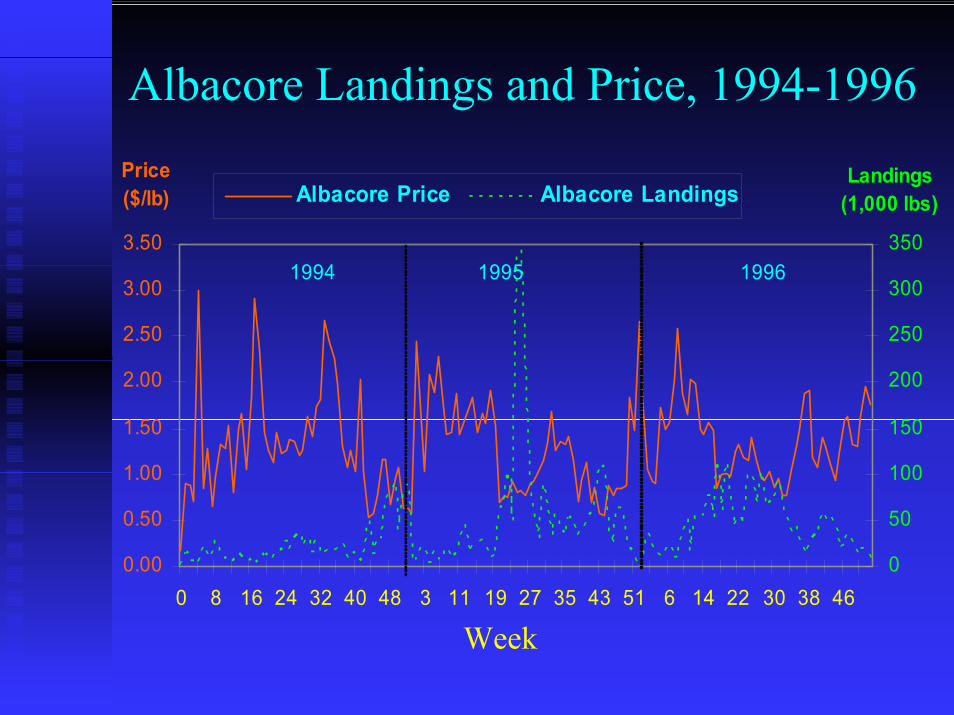
Albacore Landings and Price, 1994-1996
0.00
0.50
1.00
1.50
2.00
2.50
3.00
3.50
0 8 16 24 32 40 48 3 11 19 27 35 43 51 6 14 22 30 38 46
Price ($/lb)
0
50
100
150
200
250
300
350
Landings (1,000 lbs)Albacore Price Albacore Landings
1994 1995 1996
Week
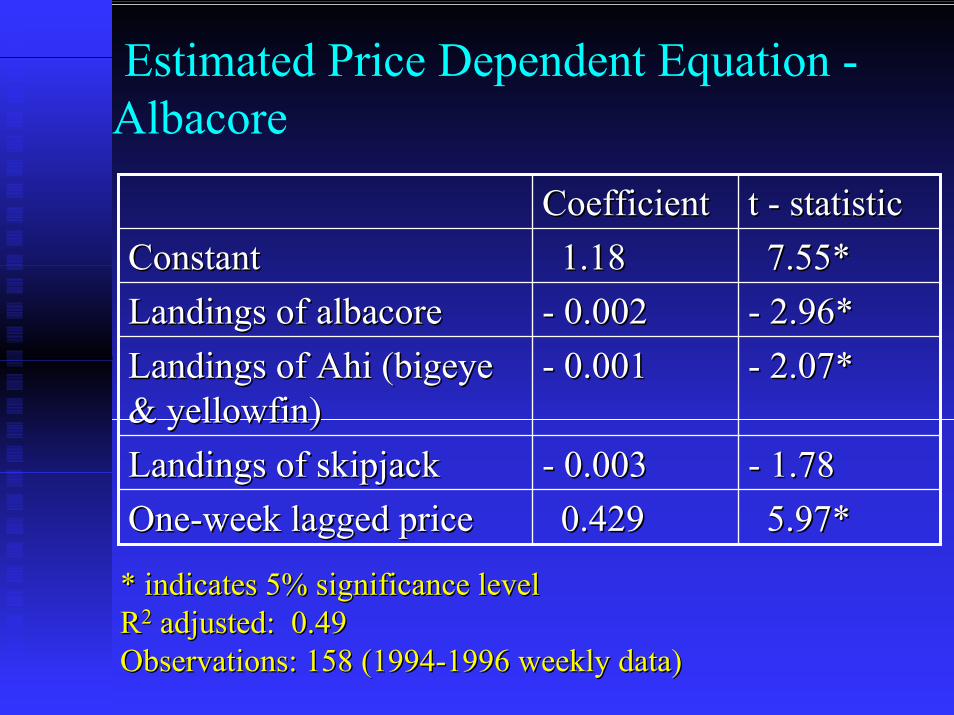
Estimated Price Dependent Equation -Albacore
5.97*5.97*0.4290.429OneOne--week lagged priceweek lagged price-- 1.781.78-- 0.0030.003Landings of skipjackLandings of skipjack
-- 2.07*2.07*-- 0.0010.001Landings of Landings of AhiAhi (bigeye (bigeye & yellowfin)& yellowfin)
-- 2.96*2.96*-- 0.0020.002Landings of albacoreLandings of albacore7.55*7.55*1.181.18ConstantConstant
t t -- statisticstatisticCoefficientCoefficient
* indicates 5% significance level* indicates 5% significance levelRR22 adjusted: 0.49adjusted: 0.49Observations: 158 (1994Observations: 158 (1994--1996 weekly data)1996 weekly data)
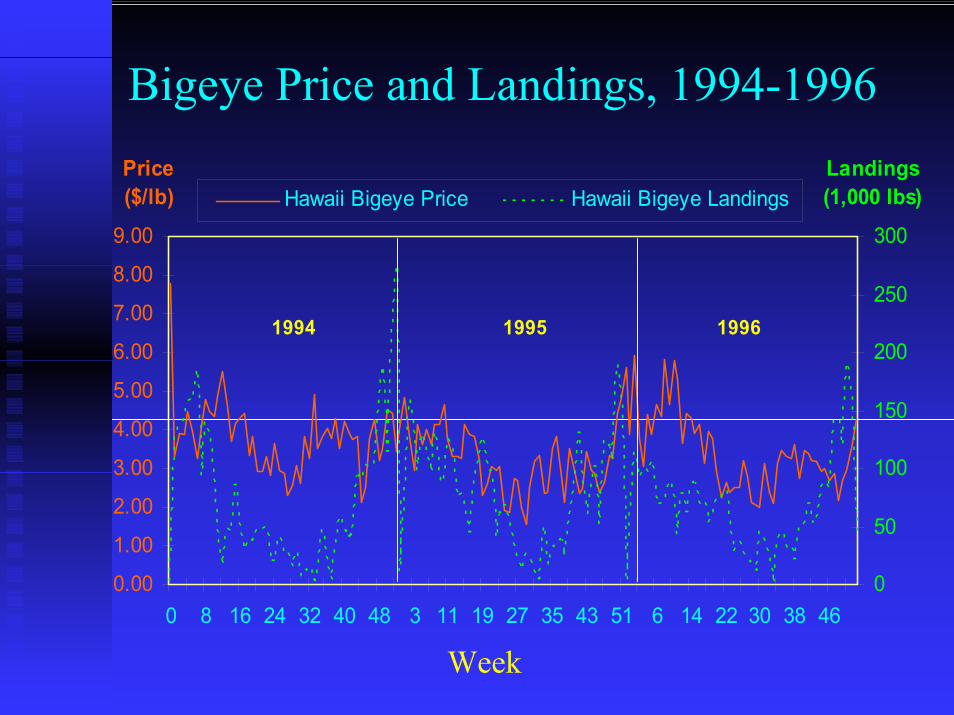
Bigeye Price and Landings, 1994-1996
0.00
1.00
2.00
3.00
4.00
5.00
6.00
7.00
8.00
9.00
0 8 16 24 32 40 48 3 11 19 27 35 43 51 6 14 22 30 38 46
Price ($/lb)
0
50
100
150
200
250
300
Landings (1,000 lbs)Hawaii Bigeye Price Hawaii Bigeye Landings
1994 1995 1996
Week
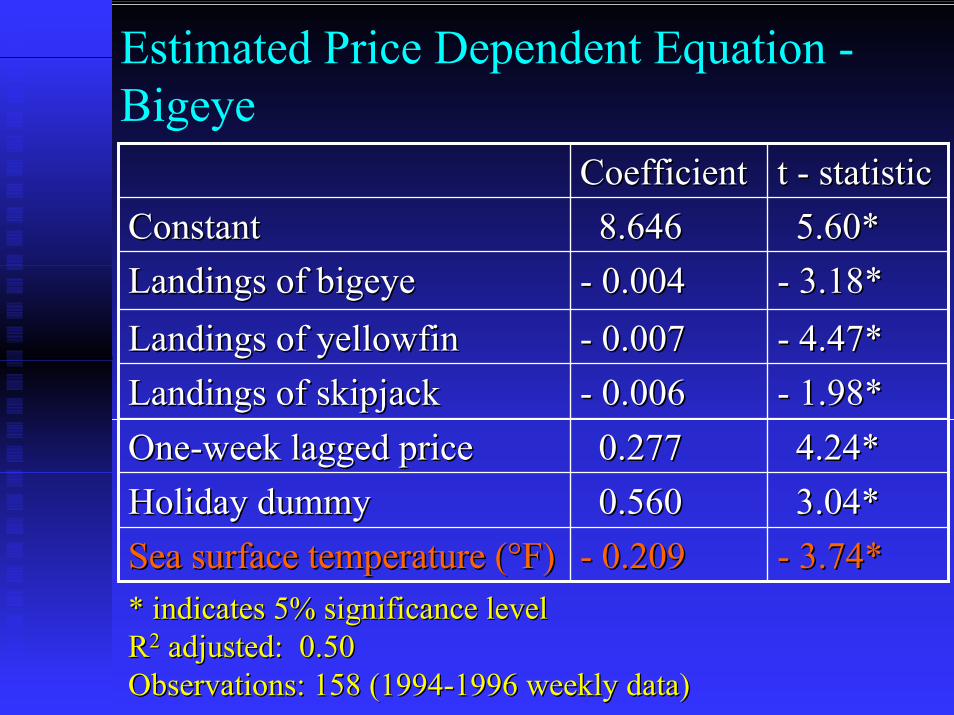
Estimated Price Dependent Equation -Bigeye
3.04*3.04*0.5600.560Holiday dummyHoliday dummy4.24*4.24*0.2770.277OneOne--week lagged priceweek lagged price
-- 3.74*3.74*-- 0.2090.209Sea surface temperature (Sea surface temperature (°°F)F)
-- 1.98*1.98*-- 0.0060.006Landings of skipjackLandings of skipjack-- 4.47*4.47*-- 0.0070.007Landings of yellowfinLandings of yellowfin-- 3.18*3.18*-- 0.0040.004Landings of bigeyeLandings of bigeye
5.60*5.60*8.6468.646ConstantConstantt t -- statisticstatisticCoefficientCoefficient
* indicates 5% significance level* indicates 5% significance levelRR22 adjusted: 0.50adjusted: 0.50Observations: 158 (1994Observations: 158 (1994--1996 weekly data)1996 weekly data)
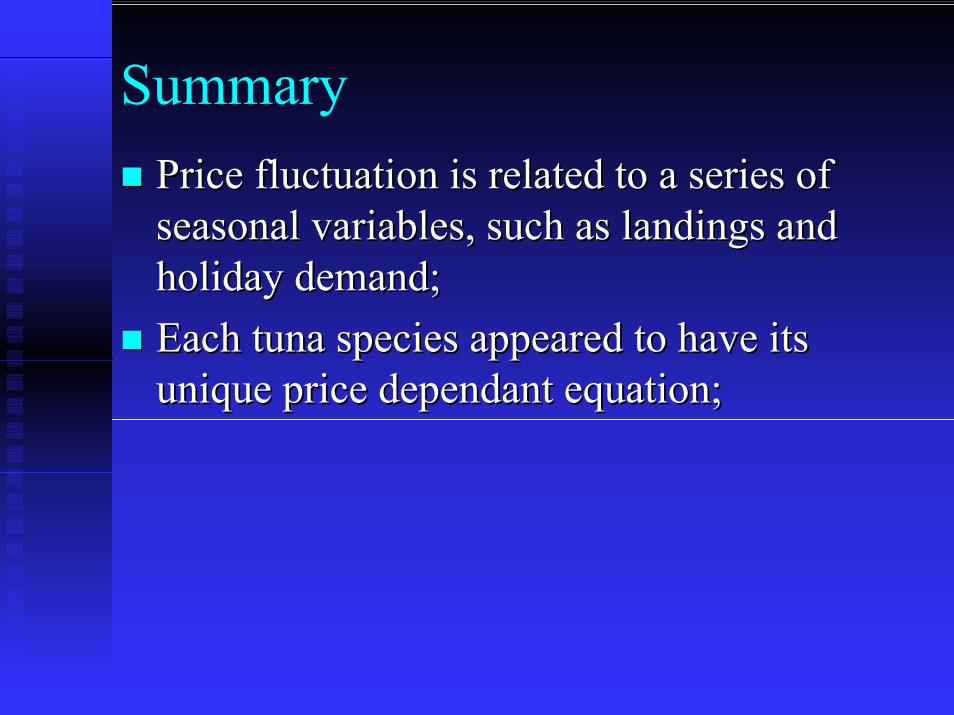
SummaryPrice fluctuation is related to a series of Price fluctuation is related to a series of seasonal variables, such as landings and seasonal variables, such as landings and holiday demand;holiday demand;Each tuna species appeared to have its Each tuna species appeared to have its unique price dependant equation;unique price dependant equation;
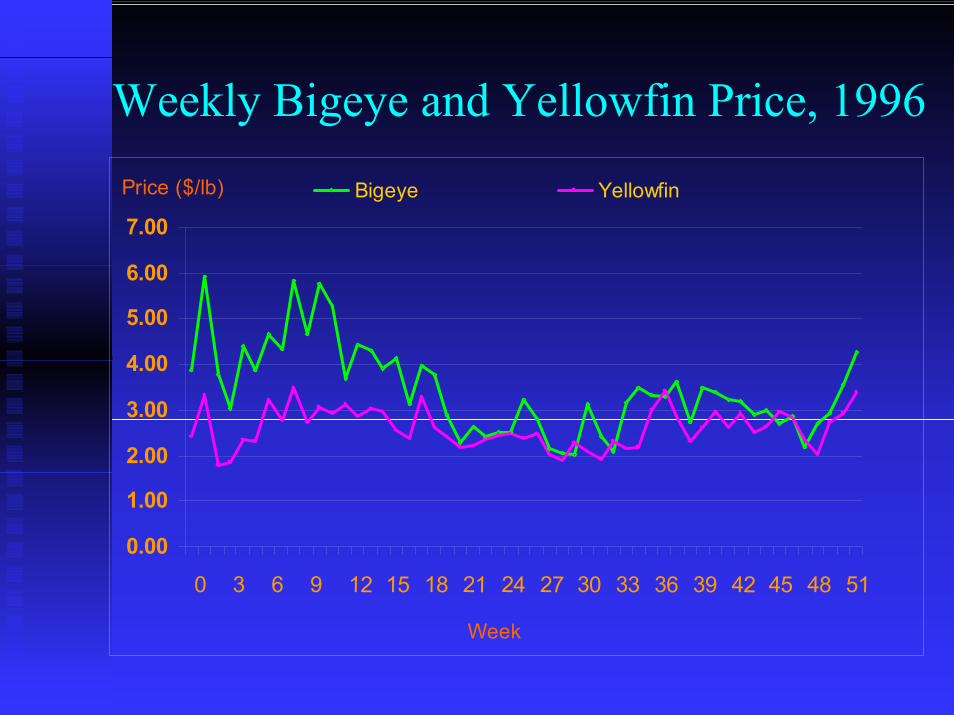
Weekly Bigeye and Yellowfin Price, 1996
0.00
1.00
2.00
3.00
4.00
5.00
6.00
7.00
0 3 6 9 12 15 18 21 24 27 30 33 36 39 42 45 48 51
Bigeye YellowfinPrice ($/lb)
Week
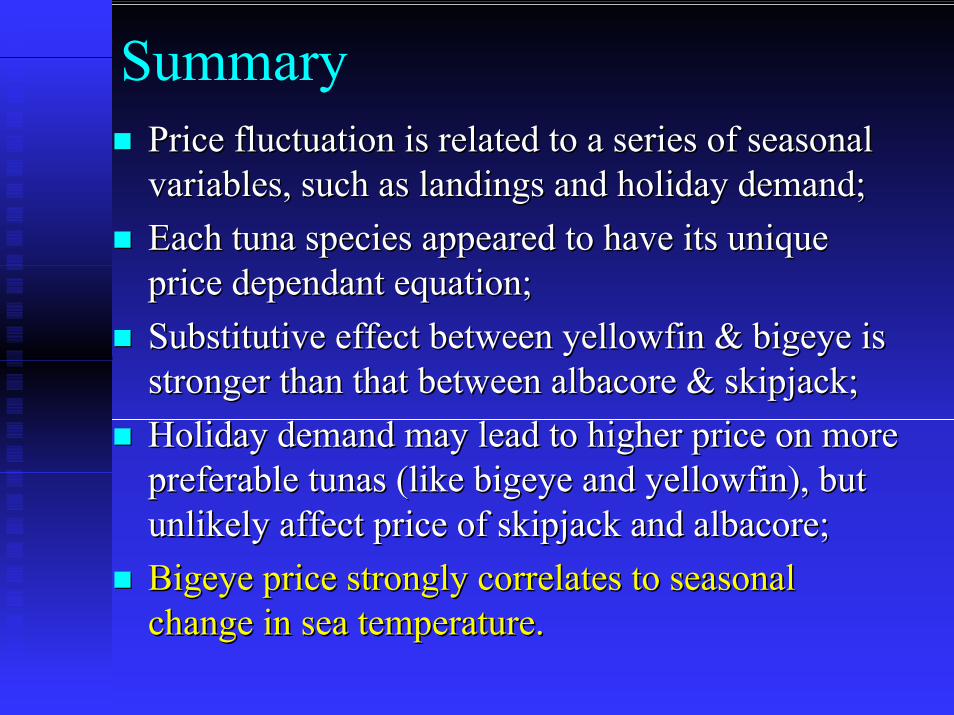
SummaryPrice fluctuation is related to a series of seasonal Price fluctuation is related to a series of seasonal variables, such as landings and holiday demand;variables, such as landings and holiday demand;Each tuna species appeared to have its unique Each tuna species appeared to have its unique price dependant equation;price dependant equation;Substitutive effect between yellowfin & bigeye is Substitutive effect between yellowfin & bigeye is stronger than that between albacore & skipjack; stronger than that between albacore & skipjack; Holiday demand may lead to higher price on more Holiday demand may lead to higher price on more preferable tunas (like bigeye and yellowfin), but preferable tunas (like bigeye and yellowfin), but unlikely affect price of skipjack and albacore;unlikely affect price of skipjack and albacore;Bigeye price strongly correlates to seasonal Bigeye price strongly correlates to seasonal change in sea temperature.change in sea temperature.
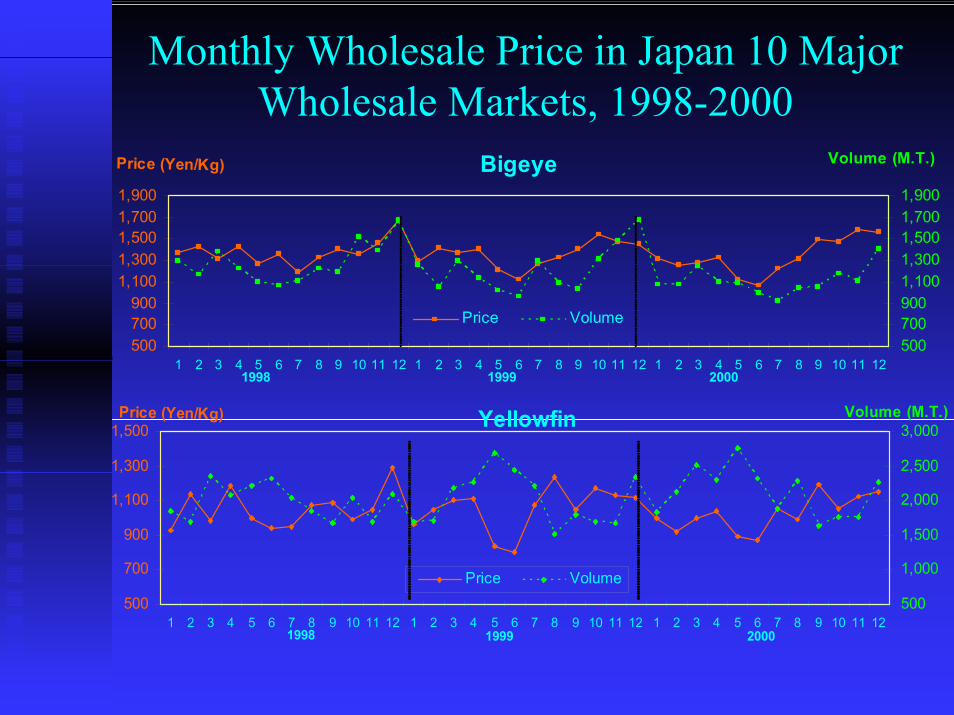
Monthly Wholesale Price in Japan 10 Major Wholesale Markets, 1998-2000
Bigeye
500700900
1,1001,3001,5001,7001,900
1 2 3 4 5 6 7 8 9 10 11 12 1 2 3 4 5 6 7 8 9 10 11 12 1 2 3 4 5 6 7 8 9 10 11 12
Price (Yen/Kg)
5007009001,1001,3001,5001,7001,900
Volume (M.T.)
Price Volume
1998 1999 2000
Yellowfin
500
700
900
1,100
1,300
1,500
1 2 3 4 5 6 7 8 9 10 11 12 1 2 3 4 5 6 7 8 9 10 11 12 1 2 3 4 5 6 7 8 9 10 11 12
Price (Yen/Kg)
500
1,000
1,500
2,000
2,500
3,000Volume (M.T.)
Price Volume
1998 1999 2000

Question……
Further researchFurther research