Embed Size (px)
Citation preview
HAL Id: hal-01567664https://hal.archives-ouvertes.fr/hal-01567664v3
Submitted on 17 Nov 2019
HAL is a multi-disciplinary open accessarchive for the deposit and dissemination of sci-entific research documents, whether they are pub-lished or not. The documents may come fromteaching and research institutions in France orabroad, or from public or private research centers.
L’archive ouverte pluridisciplinaire HAL, estdestinée au dépôt et à la diffusion de documentsscientifiques de niveau recherche, publiés ou non,émanant des établissements d’enseignement et derecherche français ou étrangers, des laboratoirespublics ou privés.
Distributed under a Creative Commons Attribution - NonCommercial - NoDerivatives| 4.0International License
Tuning Sizes, Morphologies, and Magnetic Properties ofMonocore Versus Multicore Iron Oxide Nanoparticles
through the Controlled Addition of Water in the PolyolSynthesis
Gauvin Hémery, Anthony C. Keyes Jr, Eneko Garaio, Irati Rodrigo, JoseAngel Garcia, Fernando Plazaola, Elisabeth Garanger, Olivier Sandre
To cite this version:Gauvin Hémery, Anthony C. Keyes Jr, Eneko Garaio, Irati Rodrigo, Jose Angel Garcia, et al.. TuningSizes, Morphologies, and Magnetic Properties of Monocore Versus Multicore Iron Oxide Nanoparticlesthrough the Controlled Addition of Water in the Polyol Synthesis. Inorganic Chemistry, AmericanChemical Society, 2017, 56 (14), pp.8232-8243. �10.1021/acs.inorgchem.7b00956�. �hal-01567664v3�
This document is the author manuscript version of published paper Inorganic Chemistry, 2017, 56(14), 8232−8243, after peer review and technical editing by the publisher. Final version visible on DOI:10.1021/acs.inorgchem.7b00956
1
Tuning Sizes, Morphologies, and Magnetic
Properties of Monocore Versus Multicore Iron
Oxide Nanoparticles through the Controlled
Addition of Water in the Polyol Synthesis
Gauvin Hemerya, Anthony C. Keyes Jr.a, Eneko Garaiob*, Irati Rodrigob,c, Jose Angel Garciac,d,
Fernando Plazaolab, Elisabeth Garangera, Olivier Sandrea*
a LCPO, CNRS UMR 5629/ Univ. Bordeaux/ Bordeaux-INP, ENSCBP 16 avenue Pey Berland,
33607 Pessac, France
b Elektrizitatea eta Elektronika Saila, UPV/EHU, 48940 Leioa, Spain
c BCMaterials, Parque Tecnológico de Bizkaia, Ed. 50, 48160 Derio, Spain
d Fisika Aplikatua II Saila, UPV/EHU, 48940 Leioa, Spain
KEYWORDS Polyol synthesis, iron oxide, nanoparticles, magnetic hyperthermia, MRI contrast
agent, nanoflowers, multi-core, mono-core
ABSTRACT The polyol route is a versatile and up-scalable method to produce large batches of
iron oxide nanoparticles with well-defined structures and magnetic properties. Importance of
This document is the author manuscript version of published paper Inorganic Chemistry, 2017, 56(14), 8232−8243, after peer review and technical editing by the publisher. Final version visible on DOI:10.1021/acs.inorgchem.7b00956
2
parameters such as temperature and reaction time, heating profile, nature of polyol solvent or of
organometallic precursors on nanostructure and properties has already been described in the
literature. Yet, the crucial role of water in the forced hydrolysis pathway has never been reported
despite its mandatory presence for nanoparticle production. This communication investigates the
influence of the water amount and temperature at which it is injected in the reflux system for
either a pure polyol solvent system or a mixture with poly(hydroxy)amine. Distinct
morphologies of nanoparticles were thereby obtained, from ultra-ultra-small smooth spheres
down to 4 nm in diameter to larger ones up to 37 nm. Well-defined multi-core assemblies with
narrow grain size dispersity termed nanoflowers were also synthesized. A diverse and large
library of samples was obtained by playing with the nature of solvents and amount of added
water while keeping all other parameters constant. The different morphologies lead to magnetic
nanoparticles suitable for important biomedical applications such as magnetic hyperthermia,
MRI contrast agent, or both.
INTRODUCTION
Magnetic iron oxide nanoparticles (IONPs) find applications in the biomedical field as
diagnostic tools and innovative therapies as they provide contrasting properties in magnetic
resonance imaging (MRI) and also serve as heat mediators in magnetic fluid hyperthermia
(MFH) and for triggered drug delivery.1 As IONPs are biocompatible, they are among the best
candidates over alternative magnetic nanomaterials for health applications. Various synthetic
pathways have been explored for their production,2 the most common ones being the alkaline co-
precipitation,3 the polyol process,4 the thermal degradation of organometallic precursors,5 and the
hydrothermal treatment.6 The polyol route is an interesting compromise when taking into
account the ease of synthesis, scalability, cost-efficiency, and control over the morphology. This
This document is the author manuscript version of published paper Inorganic Chemistry, 2017, 56(14), 8232−8243, after peer review and technical editing by the publisher. Final version visible on DOI:10.1021/acs.inorgchem.7b00956
3
process leads to nanoparticles with morphologies ranging from smooth spheres to more complex
structures such as the so-called “nanoflowers”. Other strategies were reported to directly produce
flower-like structures in water such as the co-precipitation performed in presence of excess
polysaccharide,7 or in a microwave reactor.8 The polyol synthesis of multi-core IONPs was
introduced by Caruntu et al..4 In this reaction pathway, the solvent acts simultaneously as a
complexing agent for iron chloride precursors and as high boiling point solvent, with reflux
temperatures usually in the order of 220 °C. Nanoflowers are to date amongst the best IONPs in
terms of efficiency for heating under an applied alternating magnetic field (AMF) and as
negative (transverse T2) MRI contrast agents, as previously reported.9 At equivalent
concentrations of iron, the outstanding heating properties of these assemblies of small grains into
larger raspberry-like structures were related to a frustrated super-spin glass state.10 Regarding
mechanistic pathway of the synthesis, tentative descriptions of the intermediary states of reaction
were proposed,11 together with the role of the polyol solvent in orienting the morphology.12
Different reaction conditions were studied in the literature, with variable parameters such as the
choice of the polyol solvent,12 temperature and pressure,13 reaction time and heating ramp
slope,14 alkaline pH,15 and presence of adsorbed capping agents.16 The main applications
envisioned for nanoflowers are as nanoheaters for MFH and efficient negative (T2) contrast
agents for MRI, as ascribed to their large magnetic moment and large intrinsic magnetization Md
(magnetic mono-domain moment divided by the particle volume). The main challenge to
overcome for utilizing these superior magnetic properties in biological media is to prevent
particle aggregation that can be evidenced by a non-reversible magnetization curve in static
magnetic field. With large magnetic moments, nanoflowers experiment strong magnetic dipolar
interactions. Moreover, the coating of their surface by a residual organic layer can render them
This document is the author manuscript version of published paper Inorganic Chemistry, 2017, 56(14), 8232−8243, after peer review and technical editing by the publisher. Final version visible on DOI:10.1021/acs.inorgchem.7b00956
4
difficult to peptize as stable aqueous colloidal suspensions, especially in physiological media.
However, we found that all nanoparticles synthesized in our study, even the largest nanoflowers,
show superparamagnetic behavior at room temperature with no hysteresis of their magnetization
curve under DC field at room temperature, which is a prerequisite for their use in biological
applications (yet still necessitating further coating to reach stealthiness in blood circulation).
In the course of our studies, we evidenced the crucial role of water in the polyol synthesis of
IONPs. We report thereafter an extensive study describing how the amount and way of adding
water in the synthesis influence the final nanoparticle (NP) morphology. A library of water-
dispersible IONPs was therefore successfully synthesized, with tunable diameters from ∼4 to ∼37
nm and superior magnetic properties for MFH and MRI.
EXPERIMENTAL SECTION
Materials
Nitric acid (HNO3, 70%) was from Fisher, ethyl acetate (>99.5%) was from Sigma Aldrich,
acetone (technical grade), ethanol (96%), and diethyl ether (100%) were from VWR. N-
methyldiethanolamine (NMDEA, 99%) was from Acros Organics, diethylene glycol (DEG,
99%), sodium hydroxide microprills (NaOH, 98%), iron(III) nitrate nonahydrate
(Fe(NO3)3⋅9H2O, >98%), and iron(II) chloride tetrahydrate (FeCl2⋅4H2O, 98%) were from Alfa
Aesar. Iron(III) chloride hexahydrate (FeCl3⋅6H2O, >97%) was from Panreac.
Synthesis of iron oxide nanoparticles
Nanoparticles were produced by adapting reaction conditions reported by Caruntu et al.:4 80
mL of either pure DEG or a mixture of DEG and NMDEA with volume ratios 1:1 v/v were
This document is the author manuscript version of published paper Inorganic Chemistry, 2017, 56(14), 8232−8243, after peer review and technical editing by the publisher. Final version visible on DOI:10.1021/acs.inorgchem.7b00956
5
introduced in a three-neck round bottom flask flushed with nitrogen and stirred with a magnetic
stir bar for one hour under inert atmosphere. 1.08 g (4 mmol) of FeCl3⋅6H2O and 0.40 g (2
mmol) of FeCl2⋅4H2O were then dissolved overnight. In the meantime, 0.64 g (16 mmol) of
NaOH was dissolved under magnetic stirring in 40 mL of either pure DEG or a 1:1 v/v mixture
of DEG and NMDEA in a separate three-neck round bottom flask. The NaOH solution was
flushed by bubbling nitrogen for one hour before mixing with the mixed iron(II,III) chloride
solution. The color quickly turned from yellow to deep green. The mixture was then heated up to
220 °C (temperature ramp in around 30 min) with an electronically controlled Digi-Mantle™
heating mantle (OMCA0250, Electrothermal™) set at full power, before letting the reaction to
occur for a determined period of time, either with or without agitation at 500 rpm by a
mechanical stirring Teflon shaft inserted through the condenser aperture. Nanoparticles were
then separated over a strong permanent ferrite magnet (152×101×25.4 mm3, Calamit Magneti™,
Milano-Barcelona-Paris), washed three times with a mixture of ethanol and ethyl acetate (1:1
v/v), once with 10 % nitric acid, twice with acetone, and twice with diethyl ether. NPs were then
readily redispersed in water by stirring in open air to remove volatile solvents. At this stage, a
black monophasic dispersion of IONPs was obtained. 8.6 g of iron(III) nitrate was then added as
a strong oxidant by heating at 80 °C for 45 min while mechanically stirring.17 The colloidal
solution then turned from clear black to clear brown-orange. The IONPs were flocculated by
addition of 10 % nitric acid and finally washed twice with acetone and twice again with diethyl
ether. At this stage a deep orange-black dispersion of IONPs was obtained. The fluid was
attracted by permanent magnets while staying in a single liquid phase, confirming that a true
“ferrofluid” was obtained.
This document is the author manuscript version of published paper Inorganic Chemistry, 2017, 56(14), 8232−8243, after peer review and technical editing by the publisher. Final version visible on DOI:10.1021/acs.inorgchem.7b00956
6
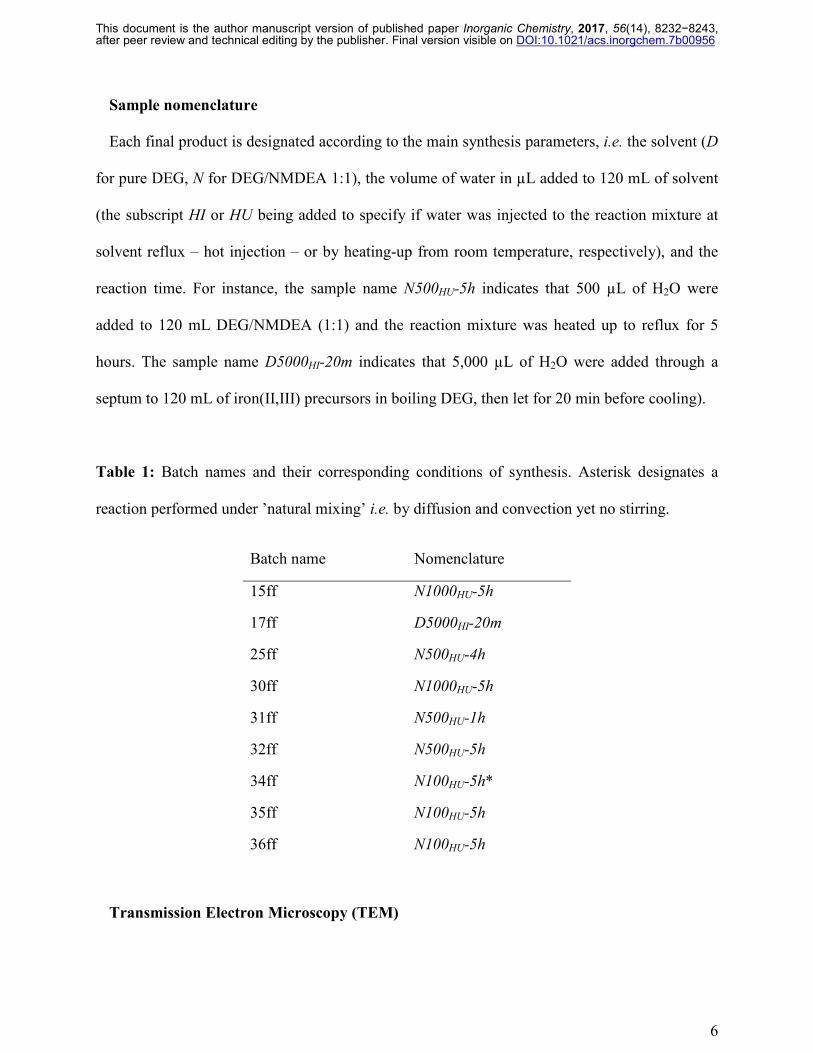
Sample nomenclature
Each final product is designated according to the main synthesis parameters, i.e. the solvent (D
for pure DEG, N for DEG/NMDEA 1:1), the volume of water in µL added to 120 mL of solvent
(the subscript HI or HU being added to specify if water was injected to the reaction mixture at
solvent reflux – hot injection – or by heating-up from room temperature, respectively), and the
reaction time. For instance, the sample name N500HU-5h indicates that 500 µL of H2O were
added to 120 mL DEG/NMDEA (1:1) and the reaction mixture was heated up to reflux for 5
hours. The sample name D5000HI-20m indicates that 5,000 µL of H2O were added through a
septum to 120 mL of iron(II,III) precursors in boiling DEG, then let for 20 min before cooling).
Table 1: Batch names and their corresponding conditions of synthesis. Asterisk designates a
reaction performed under ’natural mixing’ i.e. by diffusion and convection yet no stirring.
Batch name Nomenclature
15ff N1000HU-5h
17ff D5000HI-20m
25ff N500HU-4h
30ff N1000HU-5h
31ff N500HU-1h
32ff N500HU-5h
34ff N100HU-5h*
35ff N100HU-5h
36ff N100HU-5h
Transmission Electron Microscopy (TEM)
This document is the author manuscript version of published paper Inorganic Chemistry, 2017, 56(14), 8232−8243, after peer review and technical editing by the publisher. Final version visible on DOI:10.1021/acs.inorgchem.7b00956
7
TEM was performed on a Hitachi™ H7650 microscope with an acceleration voltage of 80 kV.
TEM images were acquired with an ORIUS™ SC1000 large format (11 MPx) camera. Samples
were prepared by nebulizing NP dispersions at 1 g∙L-1 concentration on Formvar™ carbon-coated
200 mesh copper grids from Agar Scientific™ and leaving them to dry at room temperature. NP
size distributions were obtained by measuring more than 100 NPs with the ImageJ freeware
(https://imagej.nih.gov/ij/). Size-histograms were fitted to a log-normal distribution law of
diameters P(d) with optimized values of median diameter α and non-dimensioned width β:
−−⋅
⋅= 2
2
2))ln()(ln(exp
21)(
βα
pβd
ddP
In addition, the mean sizes d0 = <d> (number-averages) and standard deviations σ = <(d-
<d>)2>1/2 were calculated using the classical Gaussian statistics formulas.
Dynamic Light Scattering (DLS) and Zetametry
A Nanosizer™ Nano ZS90 from Malvern™, UK, was used to measure ζ potentials, Z-average
hydrodynamic diameters (Dh), and polydispersity indexes (PDI). The 2nd order Cumulant fit was
used for analysing DLS data into a size distribution (the PDI being defined as the ratio of the 2nd
order coefficient to the square of the 1st order one in the series18). The Smoluchowski equation
was used to convert the measured electrophoretic mobility into a ζ potential value in mV.
Attenuated total reflection infrared spectroscopy
ATR-IR spectroscopy was carried on a GladiATR™ device from Pike Technologies mounted
on a Bruker Vertex™ 70 FT-IR spectrometer. Typically a drop of sample was dried on the
This document is the author manuscript version of published paper Inorganic Chemistry, 2017, 56(14), 8232−8243, after peer review and technical editing by the publisher. Final version visible on DOI:10.1021/acs.inorgchem.7b00956
8
diamond prism using a hair blower followed by a 64 scans measurement. Spectra were analyzed
with the Opus™ software.
Proton relaxometry
Samples were prepared at concentrations of 6 mMFe. NMR tubes (7.5 mm outer diameter) were
filled with 1 mL of each sample, and inserted in a Bruker™ mq60 relaxometer equipped with a
60 MHz / 1.41 Tesla magnet. The samples were left to thermalize to 37 °C using a Julabo™ f25
ED circulation bath. Following recommended protocols in proton relaxometry,19 longitudinal T1
relaxation times were measured using an inversion-recovery sequence of first duration of
∼0.1×T1 and final duration of ∼3×T1 with a recycling delay (RD) of ∼5×T1 between two of the 4
acquisitions, 10 data points per scan, and an automatic RF receiver gain. Transverse T2 relaxation
times were measured using Car-Purcell-Meiboom-Gill (CPMG) sequence, with delay time τ of
0.04 ms between the 90° rotation to transverse plane and the 180° focusing pulse, a duration time
of 3×T2, RD of 5×T1, and automatic receiver gain. The number of acquisition points was set by
dividing the duration time by the delay time τ.
Magnetic fluid hyperthermia
NPs were dispersed at concentrations of 3 g⋅L-1 in diluted HNO3 (at pH∼2) to preserve their
colloidal stability. The samples were placed in 500 µL plastic cuvettes, whose caps were pierced
with a needle to introduce a fiber optics temperature probe of 420 µm outer diameter (medical
range OTG-M420 fiber, Opsens™, Québec, QC, Canada) and measure temperature profiles
versus time. Samples were thermalized at 37 °C using a glass-water jacket connected to a
temperature bath until reaching equilibrium. The heat generation by magnetic NPs was triggered
This document is the author manuscript version of published paper Inorganic Chemistry, 2017, 56(14), 8232−8243, after peer review and technical editing by the publisher. Final version visible on DOI:10.1021/acs.inorgchem.7b00956
9
using an induction coil (4-turn of 3.5 mm diameter hollow – 0.4 mm wall – copper tubing, 55
mm outer diameter, 48 mm inner diameter, 34.5 mm height) fed by a Minimax Junior™ 1TS 3.5
kW generator (Seit Elettronica™, Italy) applying an alternating magnetic field (AMF) at
maximum amplitude Happ of 10.2 kA.m-1 and at a frequency f of 755 kHz as determined by finite
element modelling.20 The amplitude and frequency of the magnetic field were corroborated by
measuring the electromotive force in a scout coil (made of a single turn of 17.5 mm diameter)
and an oscilloscope (Agilent™ 54641 A). The AMF was applied for 5 min while recording the
elevation of temperature and measuring its slope at early times (within first 5 s).
Static (DC) magnetization
DC magnetization curves of the NP aqueous dispersions were obtained up to 1.79 Tesla on a
homemade vibrating sample magnetometer (VSM) at the SGIker facility (UPV/EHU). The
magnetic field was measured by a gaussmeter whereas the signal was conditioned by a
Stanford™ SR810DSP lock-in amplifier controlled by a PC under a LabVIEW™ program. All
VSM measurements were performed at room temperature, the applied field Happ being cycled
from 1.43×10⁶ A⋅m-1 to -1.43×10⁶ A⋅m-1 and then back to 1.43×10⁶ A⋅m-1.
Zero field cooling – field cooling (ZFC-FC) magnetometry
ZFC-FC experiments were conducted on a magnetic property measurement system (MPMS™
7T from Quantum Design™, San Diego, CA, USA). This ultrasensitive magnetometer was
previously calibrated by Y3Fe5O12 garnet 1 mm diameter sphere (standard reference materials
2853) and reset after each measurement. Estimates of the blocking temperature were made
according to a previously published protocol.21, 22
This document is the author manuscript version of published paper Inorganic Chemistry, 2017, 56(14), 8232−8243, after peer review and technical editing by the publisher. Final version visible on DOI:10.1021/acs.inorgchem.7b00956
10
Equivalent iron titration in IONP suspensions
The equivalent iron molarity [Fe] was measured by a disruptive photometric assay, using the
characteristic absorption peak at 350 nm of the [Fe(Cl)6]3- complex when an aliquot of the
suspension was dissolved in concentrated hydrochloric acid (HCl 5 M), according to previous
calibration law OD350nm, 2mm=0.5043 ×[Fe]mM+0.0172. Then [Fe] was converted into iron oxide
weight assuming pure γ-Fe2O3 composition (∼80 g per mol of iron).
Small angle neutron scattering (SANS)
SANS curves were acquired on the PACE spectrometer of the LLB-CEA Saclay, France,
equipped with an isotropic BF3 detector made of 30 concentric rings of 1 cm width each. Three
configurations were used to cover overlapping q ranges of 3.1×10⁻³ – 3.3×10⁻², 1.4×10⁻² –
1.5×10⁻¹, and 4.7×10⁻² – 0.48 Å-1, with the following values of sample-to-detector distance D and
neutron wavelength λ: D=4.57 m and λ=13 Å, D=2.85 m and λ=4.6 Å, D=0.87 m and λ=4.6 Å.
After dividing scattered intensity by the transmission factor, subtracting the incoherent
background, and normalizing by the flat signal of a cuvette filled with light water to correct the
detector efficiency, the absolute intensity in cm-1 was obtained.23 Curve fitting by a polydisperse
sphere form factor gave the RSANS radius and its standard deviation, and Porod’s law at high q
knowing volume fraction φ gave an estimate of the specific area Aspe (Figure S1).
RESULTS AND DISCUSSIONS
In the course of our work, we postulated that water traces are incorporated in the highly
hygroscopic polyol solvent and that this initial water content in the mixture before reaction is a
This document is the author manuscript version of published paper Inorganic Chemistry, 2017, 56(14), 8232−8243, after peer review and technical editing by the publisher. Final version visible on DOI:10.1021/acs.inorgchem.7b00956
11
key parameter to produce well-defined magnetic IONPs. This led us to carry out an extensive
study on the role of controlled additions of water in the synthesis of iron oxide nanoparticles in a
mixture of polyols (DEG, NMDEA). Different batches of IONPs were thereby produced by
varying reaction parameters such as reaction time, solvent system, amount and timing of
injections of water amounts, i.e. hot injection at solvent reflux vs. heating-up of the reaction
mixture including water. Since the two major biomedical applications of IONPs are for MFH and
as MRI contrast agents, we have dedicated our efforts to produce well-defined IONPs suitable
for these two applications. Large (several tens of nm) IONPs were produced for MFH, while
ultra-ultra-small superparamagnetic iron oxide NPs (UUSPIO) of just a few nm were synthesized
for use as positive MRI contrast agents with T1-weighted sequences.24-27
Study and optimization of the forced hydrolysis pathway in polyol
The main reaction parameter to control IONP morphology (and therefore magnetic properties)
was the solvent composition. A mixture of DEG and NMDEA (1:1 volume ratio) was used to
yield large IONPs, while UUSPIO NPs were produced in pure DEG. In both cases, the same
quantity and stoichiometric ratio of iron(II,III) chlorides and hydroxides were used
(Fe3+/Fe2+/OH- 2:1:8, i.e. one hydroxide anion per chloride).
This document is the author manuscript version of published paper Inorganic Chemistry, 2017, 56(14), 8232−8243, after peer review and technical editing by the publisher. Final version visible on DOI:10.1021/acs.inorgchem.7b00956
12
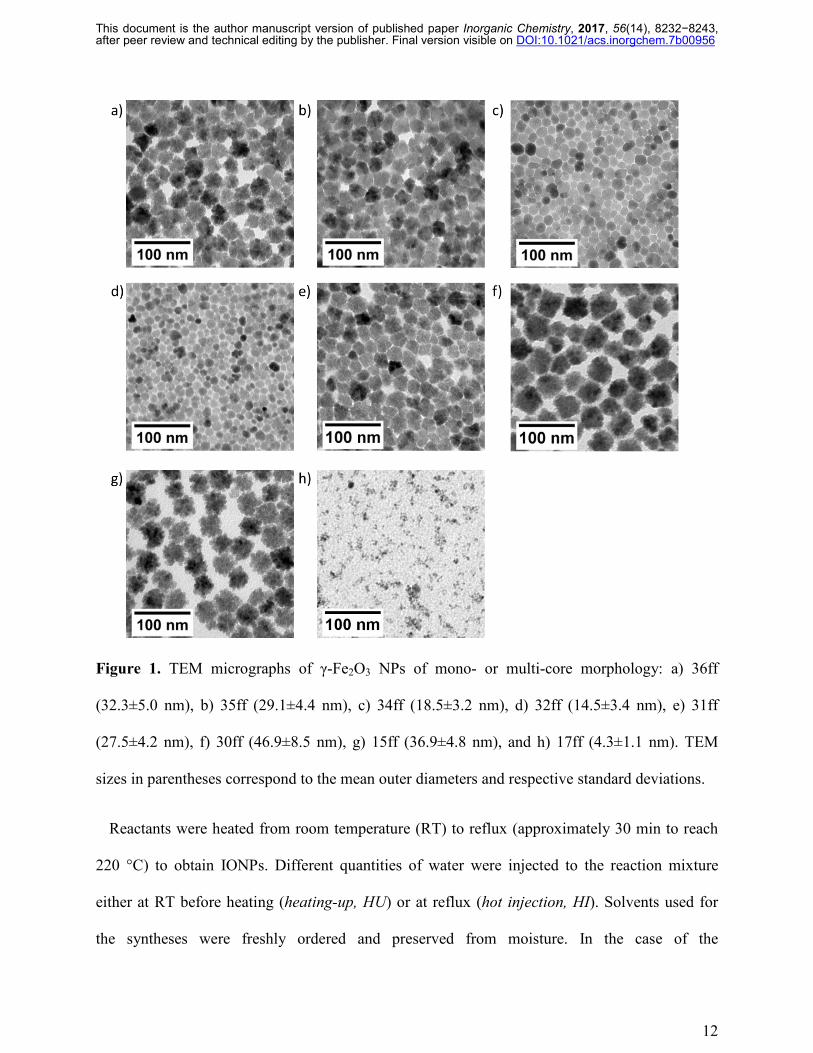
Figure 1. TEM micrographs of γ-Fe2O3 NPs of mono- or multi-core morphology: a) 36ff
(32.3±5.0 nm), b) 35ff (29.1±4.4 nm), c) 34ff (18.5±3.2 nm), d) 32ff (14.5±3.4 nm), e) 31ff
(27.5±4.2 nm), f) 30ff (46.9±8.5 nm), g) 15ff (36.9±4.8 nm), and h) 17ff (4.3±1.1 nm). TEM
sizes in parentheses correspond to the mean outer diameters and respective standard deviations.
Reactants were heated from room temperature (RT) to reflux (approximately 30 min to reach
220 °C) to obtain IONPs. Different quantities of water were injected to the reaction mixture
either at RT before heating (heating-up, HU) or at reflux (hot injection, HI). Solvents used for
the syntheses were freshly ordered and preserved from moisture. In the case of the
This document is the author manuscript version of published paper Inorganic Chemistry, 2017, 56(14), 8232−8243, after peer review and technical editing by the publisher. Final version visible on DOI:10.1021/acs.inorgchem.7b00956
13
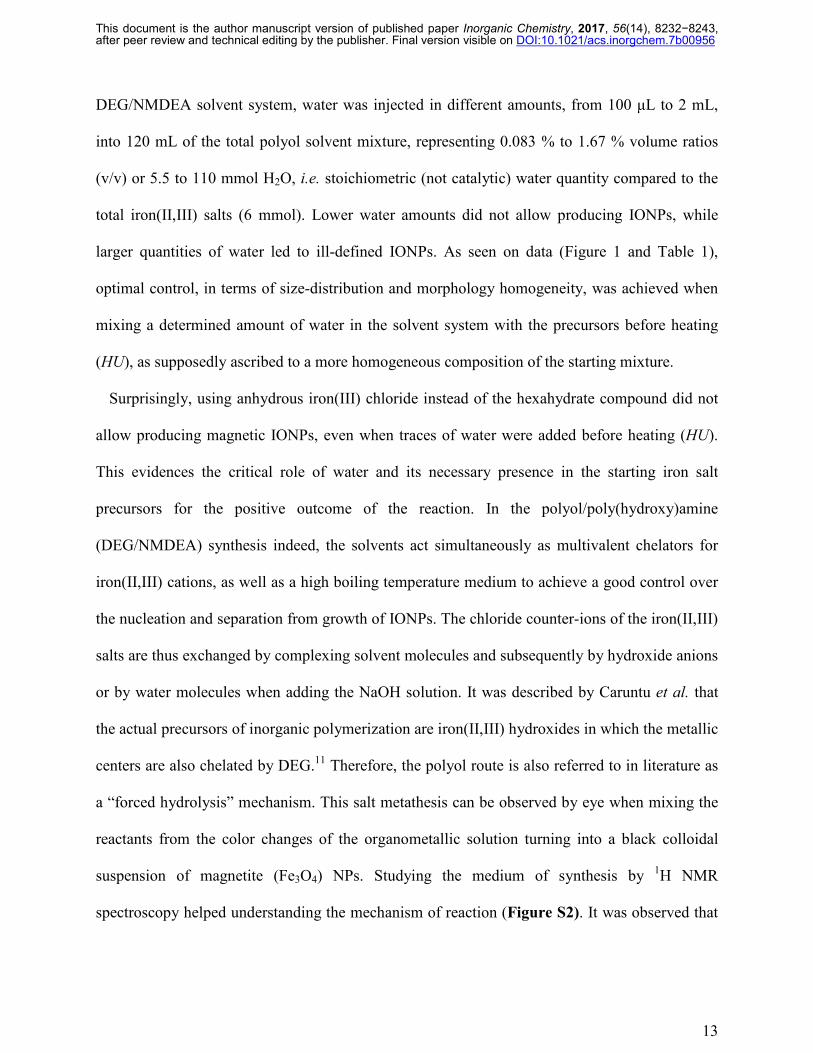
DEG/NMDEA solvent system, water was injected in different amounts, from 100 μL to 2 mL,
into 120 mL of the total polyol solvent mixture, representing 0.083 % to 1.67 % volume ratios
(v/v) or 5.5 to 110 mmol H2O, i.e. stoichiometric (not catalytic) water quantity compared to the
total iron(II,III) salts (6 mmol). Lower water amounts did not allow producing IONPs, while
larger quantities of water led to ill-defined IONPs. As seen on data (Figure 1 and Table 1),
optimal control, in terms of size-distribution and morphology homogeneity, was achieved when
mixing a determined amount of water in the solvent system with the precursors before heating
(HU), as supposedly ascribed to a more homogeneous composition of the starting mixture.
Surprisingly, using anhydrous iron(III) chloride instead of the hexahydrate compound did not
allow producing magnetic IONPs, even when traces of water were added before heating (HU).
This evidences the critical role of water and its necessary presence in the starting iron salt
precursors for the positive outcome of the reaction. In the polyol/poly(hydroxy)amine
(DEG/NMDEA) synthesis indeed, the solvents act simultaneously as multivalent chelators for
iron(II,III) cations, as well as a high boiling temperature medium to achieve a good control over
the nucleation and separation from growth of IONPs. The chloride counter-ions of the iron(II,III)
salts are thus exchanged by complexing solvent molecules and subsequently by hydroxide anions
or by water molecules when adding the NaOH solution. It was described by Caruntu et al. that
the actual precursors of inorganic polymerization are iron(II,III) hydroxides in which the metallic
centers are also chelated by DEG.11 Therefore, the polyol route is also referred to in literature as
a “forced hydrolysis” mechanism. This salt metathesis can be observed by eye when mixing the
reactants from the color changes of the organometallic solution turning into a black colloidal
suspension of magnetite (Fe3O4) NPs. Studying the medium of synthesis by 1H NMR
spectroscopy helped understanding the mechanism of reaction (Figure S2). It was observed that
This document is the author manuscript version of published paper Inorganic Chemistry, 2017, 56(14), 8232−8243, after peer review and technical editing by the publisher. Final version visible on DOI:10.1021/acs.inorgchem.7b00956
14
controlled water addition shifts the broad peak attributed to the labile protons of hydroxyl groups
in DEG and NMDEA (at respectively 3.43 and 3.07 ppm). Apart from further shifting of this
labile protons peak ascribed to pH variation occurring during the synthesis (hydroxyl groups
being converted into oxides), the NMR spectrum does not show any evidence of polyol
molecules degradation. It is worth noting that the IONPs are, in most cases, covered by a layer of
chelating solvent molecules even after several washing steps using a mixture of ethanol and
ethylacetate.14 This affects the colloidal stability of the samples, and their ability to be oxidized
by the boiling Fe(NO3)3 addition.17 During the oxidation step, the sample color is expected to
turn from black to dark red as IONPs are oxidized from magnetite to maghemite. In some cases,
especially for nanoflowers, the color of the colloidal solution remained black. This protective
layer of DEG and NMDEA at the surface of IONPs was also evidenced by ζ potential
measurement at varying pH (Figure S3). The isoelectric point (IEP) of maghemite is expected at
around pH=7, while the IEP of IONPs still covered by a layer of solvent ligands was shifted to
about pH=9, which is consistent with the expected pKa value of the tertiary amine in NMDEA.
Washing IONPs by a precipitation-redispersion process in aqueous alkaline media revealed to be
an efficient means to completely remove the remainder of chelated solvents as evidenced by the
shift of the curve of ζ vs. pH after extensive washing and by the ATR-IR spectrum on Figure S3.
Structure and properties of the synthesized IONPs
In the case of the sole DEG solvent, amounts of water as large as 5 mL, representing 4.2 % of
the total solvent volume or 275 mmol H2O molecules, were injected at reflux temperature with a
syringe needle through a septum (hot injection, HI), generating much smaller IONPs, with
diameters typically in the order of 3-5 nm. The fast introduction of a water excess at high
This document is the author manuscript version of published paper Inorganic Chemistry, 2017, 56(14), 8232−8243, after peer review and technical editing by the publisher. Final version visible on DOI:10.1021/acs.inorgchem.7b00956
15
temperature immediately generated a sudden nuclei burst, with a solution turning from deep
green to black. This hot injection method lead to ’ultra-ultra-small’ IONPs (UUSPIOs) as there is
a limited quantity of precursors in solution available for crystal growth. The time-scale of
reaction was usually much shorter than when synthesizing larger IONPs in DEG/NMDEA.
Typically, reactions in sole DEG were completed after only 15-20 min. When letting an aliquot
of the reaction mixture at rest over a strong permanent magnet, the supernatant became colorless,
evidencing the total conversion of the colored iron(II,III) organometallic precursors into a
colloidal magnetite phase.
The final products of all the different batches greatly differed in sizes and shapes according to
the solvent composition: only DEG or DEG/NMDEA, or amount and timing of water addition.
Smooth spheres as well as more complex structures previously reported as “nanoflowers” were
obtained. TEM images enabled to determine both the overall diameters and the individual grain
sizes for these multi-core IONPs. These estimates can be compared to other available techniques
for particle sizing, namely the fit of the magnetization curve by the Langevin function convolved
with a distribution law of diameters, or of the SANS curve by a polydisperse sphere form factor,
these two methods being shown in supporting information (Figures S1 and S4). Smooth spheres
were produced with adjustable sizes from ∼4 nm to ∼20 nm when the mixture was left at rest
during all the reaction (under ‘natural convection’), while nanoflowers were obtained when the
mixture was continuously homogenized with a stirring shaft, with sizes from ∼27 to ∼37 nm
(Figure 1). The size-histograms could be well-fitted using a log-normal distribution law of
parameters α and β (Figure 2). In order to express diameters as d0 ± σ, the mean values d0 along
with standard deviations σ were calculated according to the following formulas:
20
2βαedd == and ( ) ( )122
02
02 −=−= βσ eddd
This document is the author manuscript version of published paper Inorganic Chemistry, 2017, 56(14), 8232−8243, after peer review and technical editing by the publisher. Final version visible on DOI:10.1021/acs.inorgchem.7b00956
16
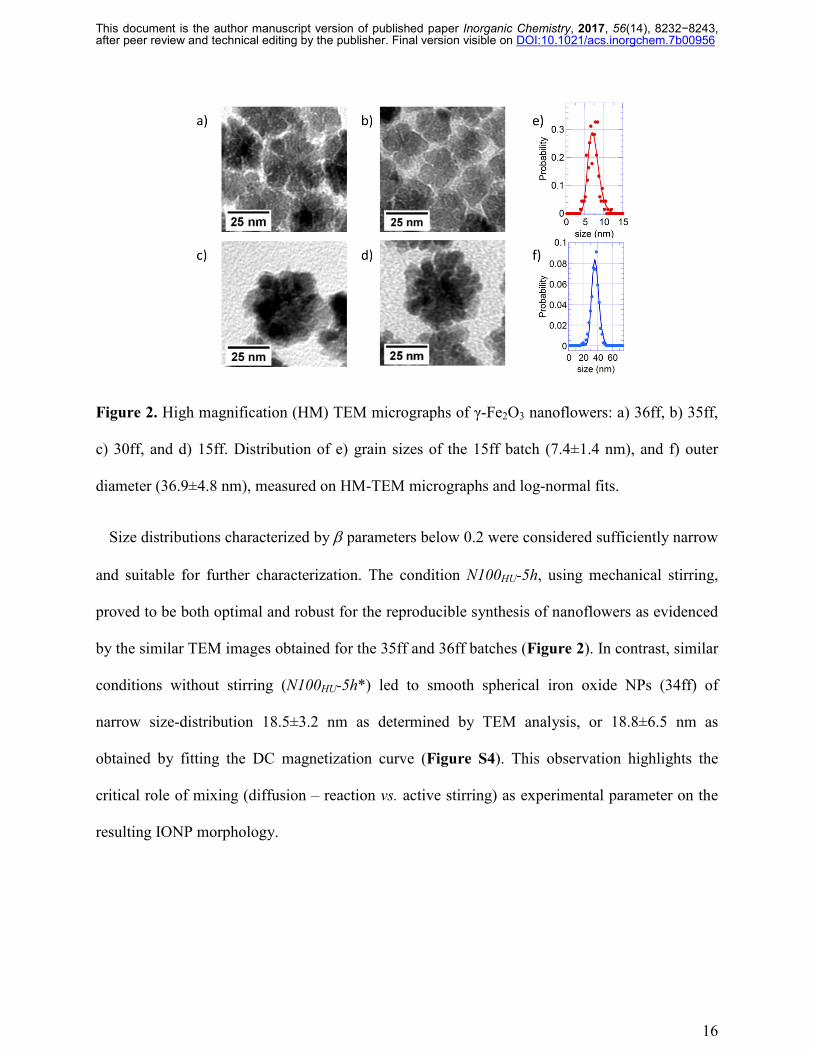
Figure 2. High magnification (HM) TEM micrographs of γ-Fe2O3 nanoflowers: a) 36ff, b) 35ff,
c) 30ff, and d) 15ff. Distribution of e) grain sizes of the 15ff batch (7.4±1.4 nm), and f) outer
diameter (36.9±4.8 nm), measured on HM-TEM micrographs and log-normal fits.
Size distributions characterized by β parameters below 0.2 were considered sufficiently narrow
and suitable for further characterization. The condition N100HU-5h, using mechanical stirring,
proved to be both optimal and robust for the reproducible synthesis of nanoflowers as evidenced
by the similar TEM images obtained for the 35ff and 36ff batches (Figure 2). In contrast, similar
conditions without stirring (N100HU-5h*) led to smooth spherical iron oxide NPs (34ff) of
narrow size-distribution 18.5±3.2 nm as determined by TEM analysis, or 18.8±6.5 nm as
obtained by fitting the DC magnetization curve (Figure S4). This observation highlights the
critical role of mixing (diffusion – reaction vs. active stirring) as experimental parameter on the
resulting IONP morphology.
This document is the author manuscript version of published paper Inorganic Chemistry, 2017, 56(14), 8232−8243, after peer review and technical editing by the publisher. Final version visible on DOI:10.1021/acs.inorgchem.7b00956
17
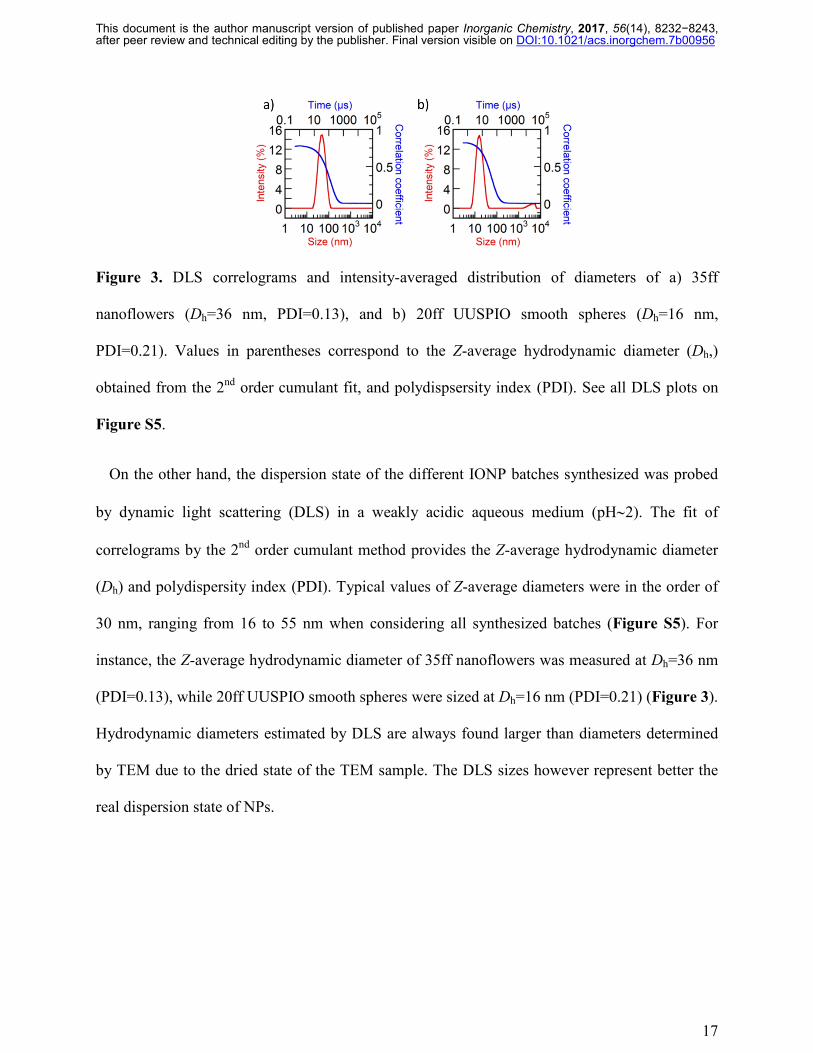
Figure 3. DLS correlograms and intensity-averaged distribution of diameters of a) 35ff
nanoflowers (Dh=36 nm, PDI=0.13), and b) 20ff UUSPIO smooth spheres (Dh=16 nm,
PDI=0.21). Values in parentheses correspond to the Z-average hydrodynamic diameter (Dh,)
obtained from the 2nd order cumulant fit, and polydispsersity index (PDI). See all DLS plots on
Figure S5.
On the other hand, the dispersion state of the different IONP batches synthesized was probed
by dynamic light scattering (DLS) in a weakly acidic aqueous medium (pH∼2). The fit of
correlograms by the 2nd order cumulant method provides the Z-average hydrodynamic diameter
(Dh) and polydispersity index (PDI). Typical values of Z-average diameters were in the order of
30 nm, ranging from 16 to 55 nm when considering all synthesized batches (Figure S5). For
instance, the Z-average hydrodynamic diameter of 35ff nanoflowers was measured at Dh=36 nm
(PDI=0.13), while 20ff UUSPIO smooth spheres were sized at Dh=16 nm (PDI=0.21) (Figure 3).
Hydrodynamic diameters estimated by DLS are always found larger than diameters determined
by TEM due to the dried state of the TEM sample. The DLS sizes however represent better the
real dispersion state of NPs.
This document is the author manuscript version of published paper Inorganic Chemistry, 2017, 56(14), 8232−8243, after peer review and technical editing by the publisher. Final version visible on DOI:10.1021/acs.inorgchem.7b00956
18
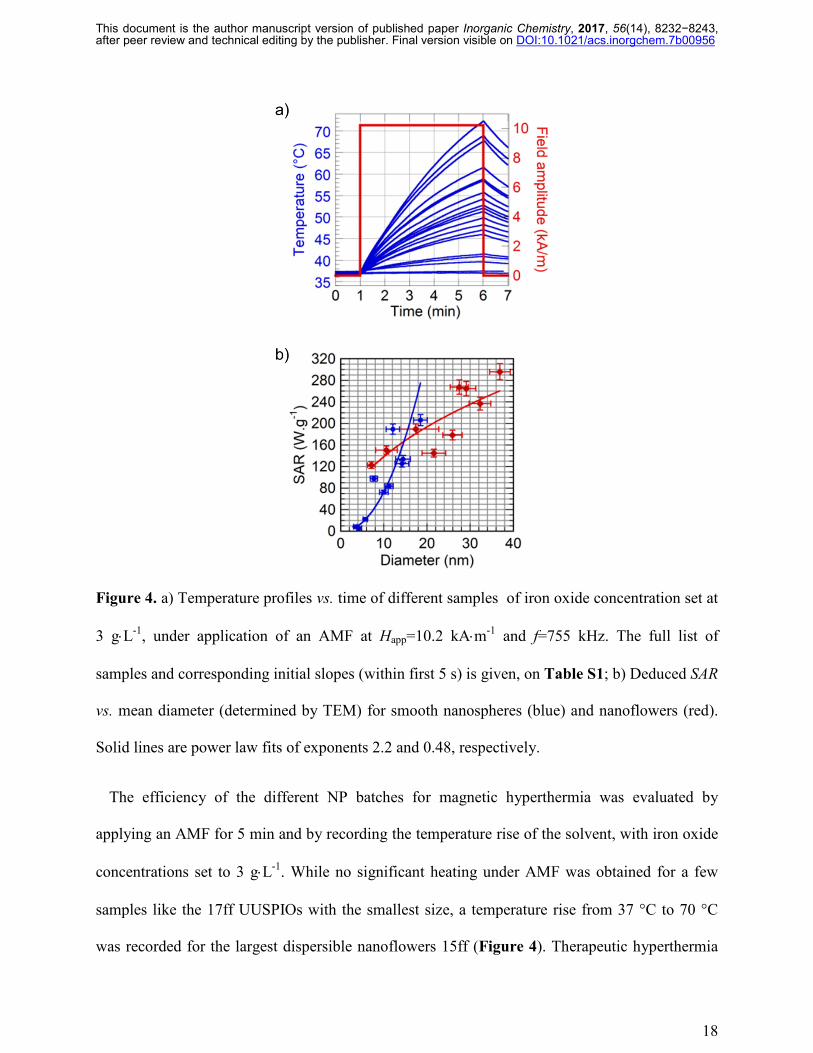
Figure 4. a) Temperature profiles vs. time of different samples of iron oxide concentration set at
3 g⋅L-1, under application of an AMF at Happ=10.2 kA⋅m-1 and f=755 kHz. The full list of
samples and corresponding initial slopes (within first 5 s) is given, on Table S1; b) Deduced SAR
vs. mean diameter (determined by TEM) for smooth nanospheres (blue) and nanoflowers (red).
Solid lines are power law fits of exponents 2.2 and 0.48, respectively.
The efficiency of the different NP batches for magnetic hyperthermia was evaluated by
applying an AMF for 5 min and by recording the temperature rise of the solvent, with iron oxide
concentrations set to 3 g⋅L-1. While no significant heating under AMF was obtained for a few
samples like the 17ff UUSPIOs with the smallest size, a temperature rise from 37 °C to 70 °C
was recorded for the largest dispersible nanoflowers 15ff (Figure 4). Therapeutic hyperthermia
This document is the author manuscript version of published paper Inorganic Chemistry, 2017, 56(14), 8232−8243, after peer review and technical editing by the publisher. Final version visible on DOI:10.1021/acs.inorgchem.7b00956
19
requires that IONPs heat cancerous tissues up to 43–44 °C to deposit a suitable “thermal dose”,
usually by IONP intratumoral injection.28 This temperature may potentially be reached in vivo
with the best heating samples after few minutes, even at a concentration as low as the one used in
our study (3 g⋅L-1), assuming that their heating properties are preserved in physiological
intracellular conditions.29 The heating properties of our sample library were thus quantified using
the specific absorption rate (SAR) determined experimentally using the commonly used formula:
( ) mCtTSAR Pt 0→∆∆=
where (∆T/∆t)t→0 is the temperature raise slope at early times of AMF application (first 5 s) to
simulate adiabatic conditions,30 m is the mass of nanoparticles in 1 mL of suspension and CP is
approximated by the specific heat of pure water.2
We have used the SAR to evaluate the heating properties of our nanoparticles instead of the
intrinsic loss power (ILP)31, because the SAR variation with field intensity can depart
significantly from a quadratic law. The plot of SAR at given field amplitude (Happ=10.2 kA⋅m-1)
and frequency (f=755 kHz) vs. diameter measured by TEM clearly evidences a correlation
between the SAR and IONP outer diameter measured by TEM. (Figure 4b) Nanospheres
experimentally follow a quadratic law with diameter while nanoflowers follow a lower exponent
(nearly square-root). This is qualitatively in agreement with the most advanced models on the
optimal size of magnetic NPs for MFH at given values of their other physical properties (specific
magnetization and magnetic anisotropy).32 Results compiled in Table S1 evidence that all
nanoflowers and smooth spheres larger than 12-14 nm are efficient nanoheaters, while UUSPIOs
smaller than 5-6 nm do not generate sufficient heat but are likely useable as positive (T1-
weighted) MRI contrast agents, as shown later in this article. Smooth spheres of intermediate
diameters (10-14 nm) are ideal to be used both as nanoheaters for MFH and as negative (T2-
This document is the author manuscript version of published paper Inorganic Chemistry, 2017, 56(14), 8232−8243, after peer review and technical editing by the publisher. Final version visible on DOI:10.1021/acs.inorgchem.7b00956
20
weighted) MRI contrast agents (vide infra), once coated with appropriate ligands, while larger
ones might be more difficult to stabilise in physiological media.
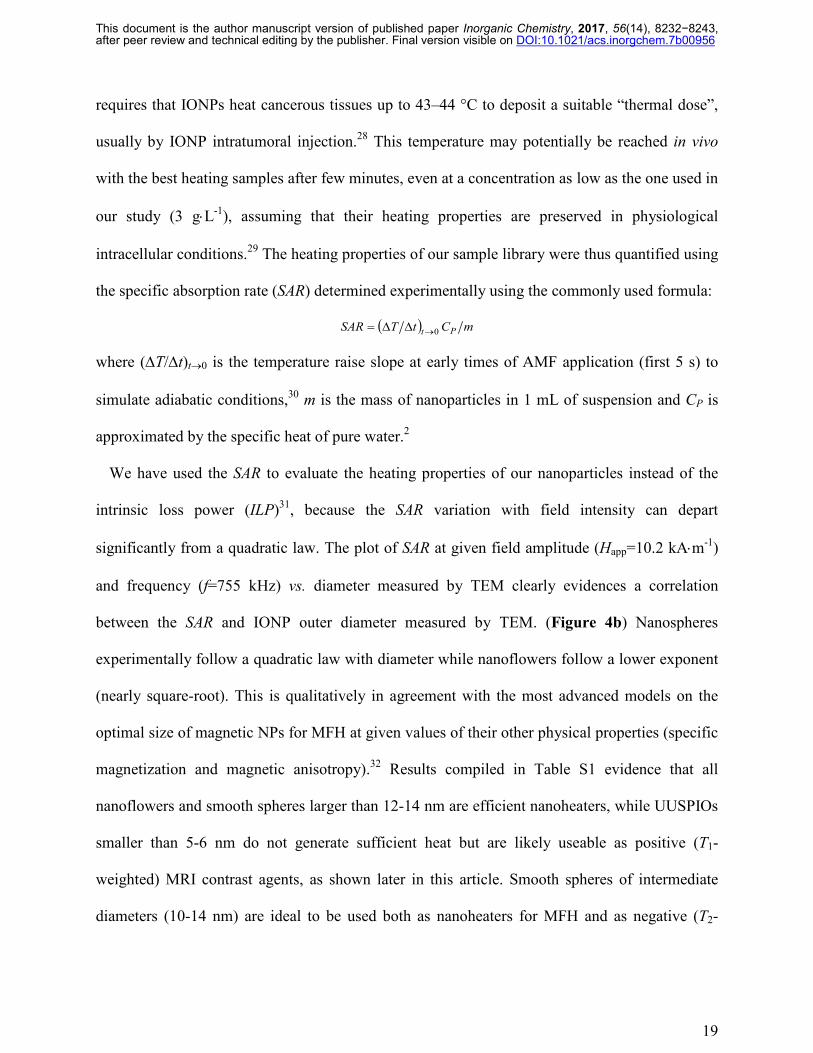
An in-depth characterization of magnetic heating properties was carried out on selected IONP
samples with interesting morphologies and core size in 20-40 nm range as evidenced by TEM,
with outstanding heating efficiency (SAR>200 W⋅g-1 at Happ=10.2 kA⋅m-1 and f=755 kHz). Large
smooth spheres (34ff) and nanoflowers of different grain size and increasing outer diameters
(31ff, 35ff, and 15ff) were thus selected to be further examined with an in-house developed pick-
up coil set-up, allowing SAR measurement on a broad range of AMF frequencies and
amplitudes.33 AC magnetization curves of NPs are plotted on Figure 5a versus amplitude Happ
up to 21 kA.m-1 at fixed frequency (f=1030 kHz). Similar curves at different frequencies are
provided as supporting information accompanying this manuscript (Figures S6, S7, S8 and S9).
This document is the author manuscript version of published paper Inorganic Chemistry, 2017, 56(14), 8232−8243, after peer review and technical editing by the publisher. Final version visible on DOI:10.1021/acs.inorgchem.7b00956
21
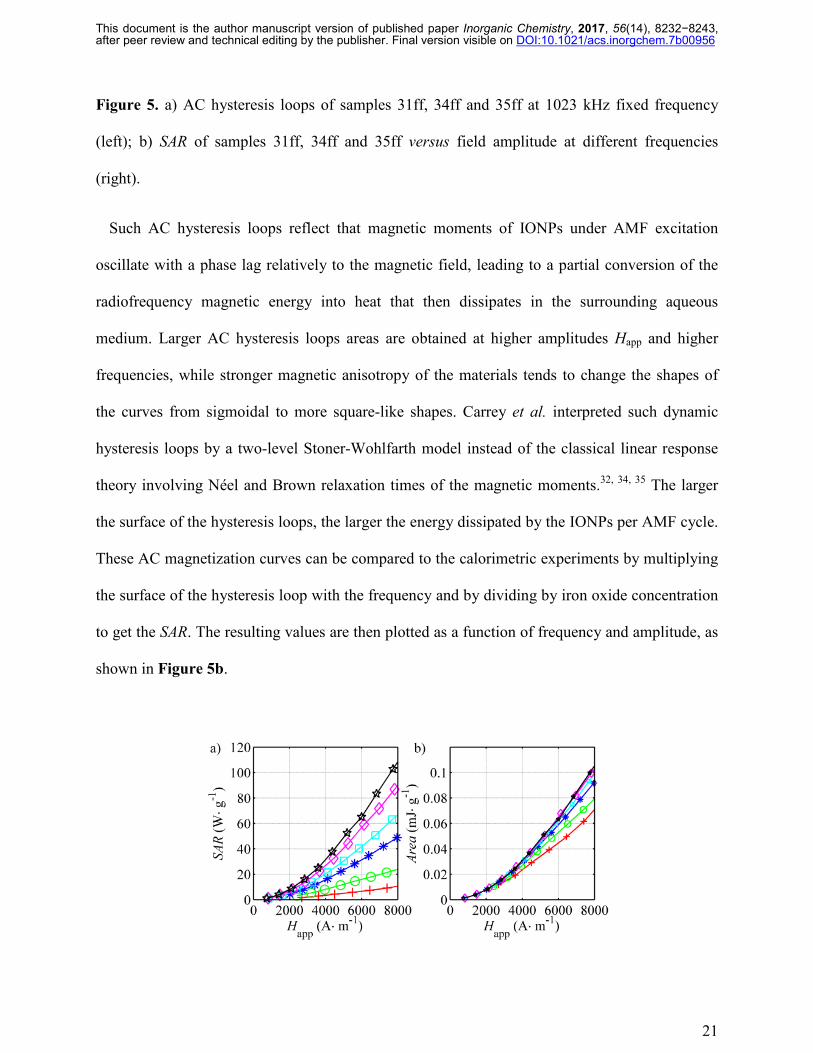
Figure 5. a) AC hysteresis loops of samples 31ff, 34ff and 35ff at 1023 kHz fixed frequency
(left); b) SAR of samples 31ff, 34ff and 35ff versus field amplitude at different frequencies
(right).
Such AC hysteresis loops reflect that magnetic moments of IONPs under AMF excitation
oscillate with a phase lag relatively to the magnetic field, leading to a partial conversion of the
radiofrequency magnetic energy into heat that then dissipates in the surrounding aqueous
medium. Larger AC hysteresis loops areas are obtained at higher amplitudes Happ and higher
frequencies, while stronger magnetic anisotropy of the materials tends to change the shapes of
the curves from sigmoidal to more square-like shapes. Carrey et al. interpreted such dynamic
hysteresis loops by a two-level Stoner-Wohlfarth model instead of the classical linear response
theory involving Néel and Brown relaxation times of the magnetic moments.32, 34, 35 The larger
the surface of the hysteresis loops, the larger the energy dissipated by the IONPs per AMF cycle.
These AC magnetization curves can be compared to the calorimetric experiments by multiplying
the surface of the hysteresis loop with the frequency and by dividing by iron oxide concentration
to get the SAR. The resulting values are then plotted as a function of frequency and amplitude, as
shown in Figure 5b.
This document is the author manuscript version of published paper Inorganic Chemistry, 2017, 56(14), 8232−8243, after peer review and technical editing by the publisher. Final version visible on DOI:10.1021/acs.inorgchem.7b00956
22
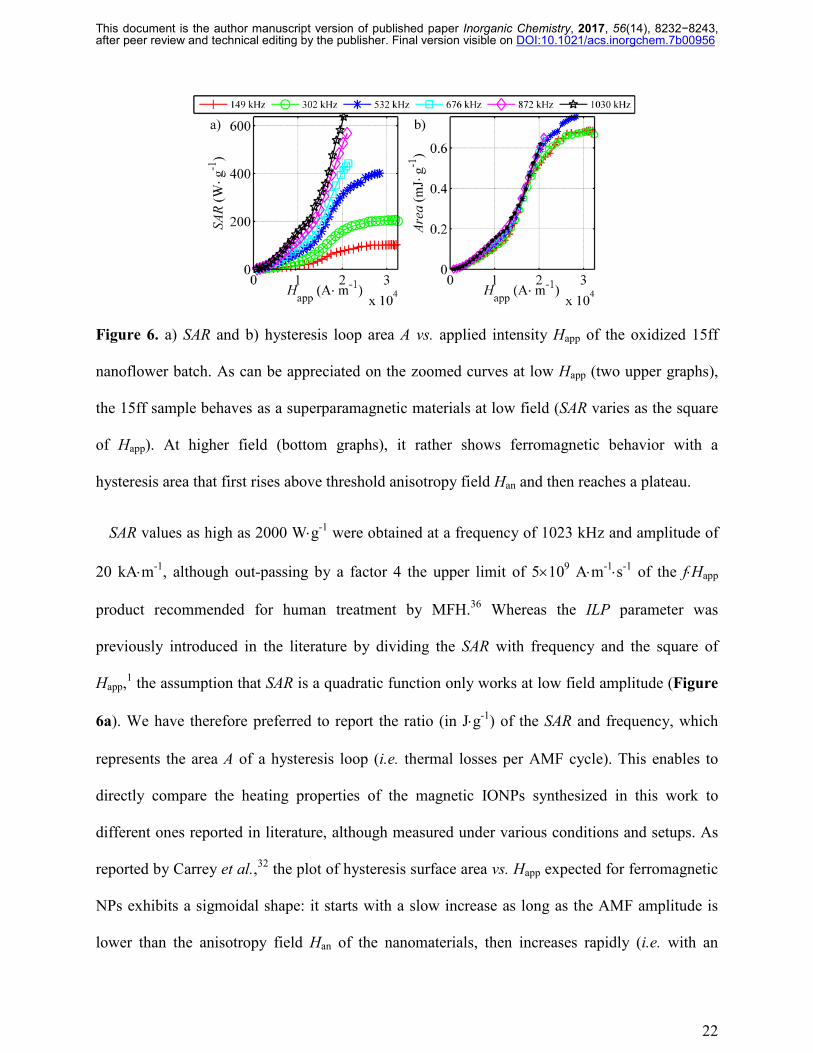
Figure 6. a) SAR and b) hysteresis loop area A vs. applied intensity Happ of the oxidized 15ff
nanoflower batch. As can be appreciated on the zoomed curves at low Happ (two upper graphs),
the 15ff sample behaves as a superparamagnetic materials at low field (SAR varies as the square
of Happ). At higher field (bottom graphs), it rather shows ferromagnetic behavior with a
hysteresis area that first rises above threshold anisotropy field Han and then reaches a plateau.
SAR values as high as 2000 W⋅g-1 were obtained at a frequency of 1023 kHz and amplitude of
20 kA⋅m-1, although out-passing by a factor 4 the upper limit of 5×10⁹ A⋅m-1⋅s-1 of the f⋅Happ
product recommended for human treatment by MFH.36 Whereas the ILP parameter was
previously introduced in the literature by dividing the SAR with frequency and the square of
Happ,1 the assumption that SAR is a quadratic function only works at low field amplitude (Figure
6a). We have therefore preferred to report the ratio (in J⋅g-1) of the SAR and frequency, which
represents the area A of a hysteresis loop (i.e. thermal losses per AMF cycle). This enables to
directly compare the heating properties of the magnetic IONPs synthesized in this work to
different ones reported in literature, although measured under various conditions and setups. As
reported by Carrey et al.,32 the plot of hysteresis surface area vs. Happ expected for ferromagnetic
NPs exhibits a sigmoidal shape: it starts with a slow increase as long as the AMF amplitude is
lower than the anisotropy field Han of the nanomaterials, then increases rapidly (i.e. with an
This document is the author manuscript version of published paper Inorganic Chemistry, 2017, 56(14), 8232−8243, after peer review and technical editing by the publisher. Final version visible on DOI:10.1021/acs.inorgchem.7b00956
23
exponent larger than two, value expected for superparamagnetic NPs), and finally plateaus in the
high-field limit. The plot of A vs. Happ for the 15ff sample perfectly fits this description (Figure
6b), with a threshold anisotropy field Han∼104 A⋅m-1. The plateau value around 0.7 mJ⋅g-1 for the
oxidized 15ff sample is not particularly outstanding as a maximal value of 1.8 mJ⋅g-1 was
previously reported for IONPs obtained by coprecipitation followed by hydrothermal
treatment.37 The oxidized 15ff sample however illustrates the complex magnetic behaviour of
nanoflowers reflected in the dependence of their hysteresis loss area A with the amplitude Happ of
the AMF: For the six probed frequencies, the plots of the hysteresis area A vs. Happ collapse
almost perfectly on a unique master curve. The field dependence remains quadratic up to a
threshold Happ ascribed to the anisotropy field Han of the multi-core structure, characteristic of
collective dynamics of sintered grains as in a multiple-domain magnet. For any applied AMF
strength below Han, nanoflowers exhibit pure superparamagnetic response as evidenced by the
quadratic variation of their SAR vs. Happ plot, each of their magnetic mono-domains being
excited individually by the AMF. Other IONP batches of lower outer sizes (below 30 nm) exhibit
even superior plateau values of the hysteresis area per cycle vs. Happ (which exact value slightly
varies with frequency), from ∼1.6 mJ⋅g-1 for 31ff nanoflowers (Figure S10) and 34ff smooth
nanospheres (Figure S11) to ∼2.5 mJ⋅g-1 for 35ff nanoflowers (Figure S12) or a bit lower (2
mJ⋅g-1) at the lowest frequency of 149 kHz. To the best of our knowledge, these are the highest
hysteresis area values reported so far for synthetic magnetic IONPs, excluding the case of
needle-like submicron γ-Fe2O3 particles commercialized for magnetic recording applications,
that can reach hysteresis areas up to 8 mJ⋅g-1, but necessitate to apply an AMF stronger than a
thrice higher threshold field, Han∼30 kA⋅m-1.38
This document is the author manuscript version of published paper Inorganic Chemistry, 2017, 56(14), 8232−8243, after peer review and technical editing by the publisher. Final version visible on DOI:10.1021/acs.inorgchem.7b00956
24
a) b)
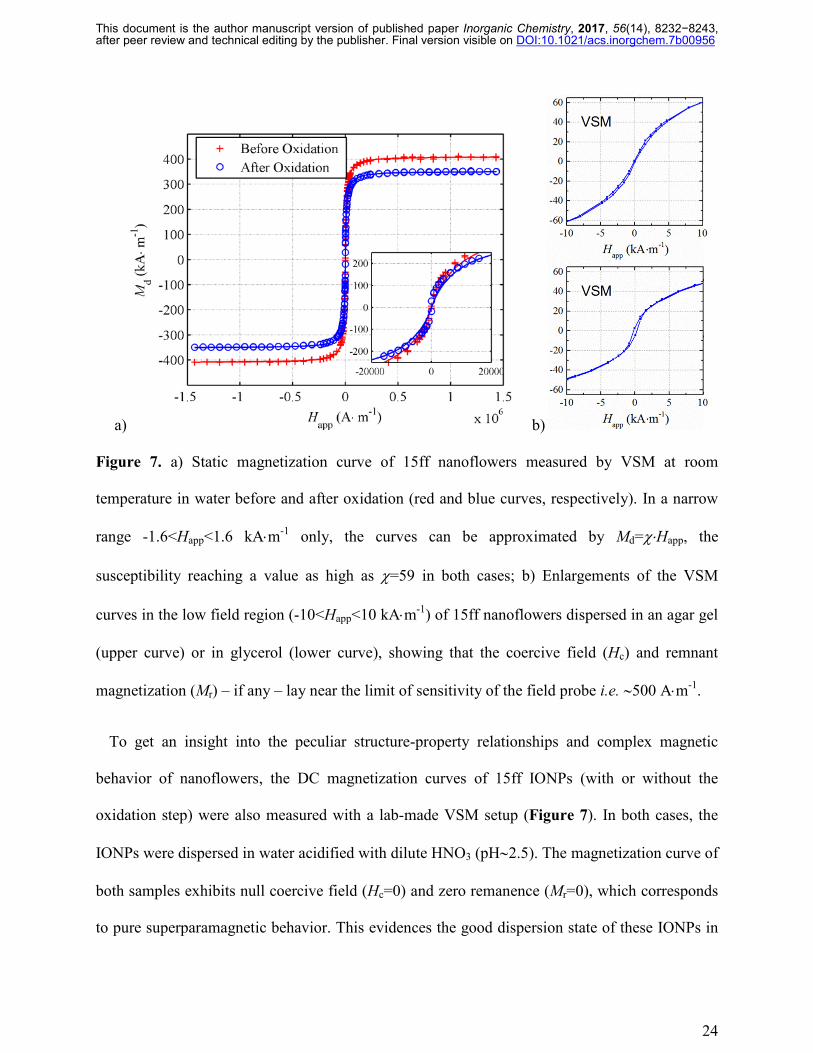
Figure 7. a) Static magnetization curve of 15ff nanoflowers measured by VSM at room
temperature in water before and after oxidation (red and blue curves, respectively). In a narrow
range -1.6<Happ<1.6 kA⋅m-1 only, the curves can be approximated by Md=χ⋅Happ, the
susceptibility reaching a value as high as χ=59 in both cases; b) Enlargements of the VSM
curves in the low field region (-10<Happ<10 kA⋅m-1) of 15ff nanoflowers dispersed in an agar gel
(upper curve) or in glycerol (lower curve), showing that the coercive field (Hc) and remnant
magnetization (Mr) – if any – lay near the limit of sensitivity of the field probe i.e. ∼500 A⋅m-1.
To get an insight into the peculiar structure-property relationships and complex magnetic
behavior of nanoflowers, the DC magnetization curves of 15ff IONPs (with or without the
oxidation step) were also measured with a lab-made VSM setup (Figure 7). In both cases, the
IONPs were dispersed in water acidified with dilute HNO3 (pH∼2.5). The magnetization curve of
both samples exhibits null coercive field (Hc=0) and zero remanence (Mr=0), which corresponds
to pure superparamagnetic behavior. This evidences the good dispersion state of these IONPs in
This document is the author manuscript version of published paper Inorganic Chemistry, 2017, 56(14), 8232−8243, after peer review and technical editing by the publisher. Final version visible on DOI:10.1021/acs.inorgchem.7b00956
25
water, as a remnant magnetization would have been expected in case of an aggregated sample.
The saturation magnetization of the non-oxidized sample obtained after synthesis and washings
is 350 kA⋅m-1, below the value of bulk magnetite (Fe3O4) (500 kA⋅m-1), as ascribed to spin-
canting defects at the NP surface,39 or to partial oxidation already starting during the purification
steps, as no particular precautions were taken to prevent it. In contrast, total oxidation of sample
15ff obtained by heating with iron(III) nitrate, led to a magnetization at saturation of 300 kA⋅m-1,
which is again below the expected value of 400 kA m-1 for bulk maghemite (γ-Fe2O3) but
nevertheless quite a satisfying value for IONPs. Therefore, all the IONP batches were oxidized
intentionally to control the magnetic phase of the IONPs, despite lowering the magnetic
saturation and, presumably, their heating efficiency for MFH. All samples reported in this study
exhibit similar saturation magnetization (Figure S4).
A second useful information provided by VSM magnetometry can be obtained by fitting the
DC magnetization curves by the Langevin function characteristic of superparamagnetism,
convolved by a log-normal distribution of diameters to take into account size-dispersity.21 The
resulting magnetic domain diameters lay below the outer diameter measured by TEM for
nanoflowers: 25.1±12.0 nm for 35ff, 21.9±10.6 nm for 31ff, while almost identical to TEM
(within experimental uncertainty) for 34ff smooth nanospheres: 18.8±6.5 nm.
Sensitive magnetometry performed on the commercial MPMS system on the oxidized and
non-oxidized 15ff nanoflowers (Figure S13) led to ZFC and FC magnetization curves vs.
temperature both lower for the non-oxidized as compared to the oxidized 15ff NPs. Such non-
classical ZFC-FC curve profile has been already reported for large (18 and 22 nm) Fe3O4 NPs
synthesized by iron(III) oleate thermal decomposition,40 and was partially explained by the so-
This document is the author manuscript version of published paper Inorganic Chemistry, 2017, 56(14), 8232−8243, after peer review and technical editing by the publisher. Final version visible on DOI:10.1021/acs.inorgchem.7b00956
26
called Verwey or charge ordering transition,40, 41 when such IONPs undergo a slight
crystallographic distortion from cubic, electrically conducting, to inverse spinel, electrically
insulating, structure, this change of crystalline structure also impacting the magnetic properties.
A suitable method to estimate the blocking temperature TB, defined at the transition from the
ferrimagnetic state to the superparamagnetic regime, consists in plotting the derivative of the
MFC-MZFC curve difference with respect to temperature.22 For the two different batches (non-
oxidized and oxidized 15ff), the plot exhibits three maxima (Figure S13). The peak near 90 K is
ascribed to the Verwey transition of magnetite, yet it is not clear why it also appears on the
oxidized sample. The two other peaks correspond to characteristic temperatures, respectively
near 200 and 300 K. It is rather uncommon for a sample to exhibit two values of blocking
temperatures. One hypothesis is that TB1≈200 K is ascribed to individual magnetic domains of
diameter 7.4±1.4 nm and TB2≈300 K to the whole magnetic multi-core structure of outer
diameter 36.9±4.8 nm. The complete interpretation of these data, e.g. in term of superspin glass
transition, would necessitate complementary AC susceptometry experiments vs. temperature, to
study the slow relaxation dynamics of the frustrated spins in multi-core nanoflowers as reported
by Kostopoulou et al.,10 but it is beyond the scope of this article.
This document is the author manuscript version of published paper Inorganic Chemistry, 2017, 56(14), 8232−8243, after peer review and technical editing by the publisher. Final version visible on DOI:10.1021/acs.inorgchem.7b00956
27
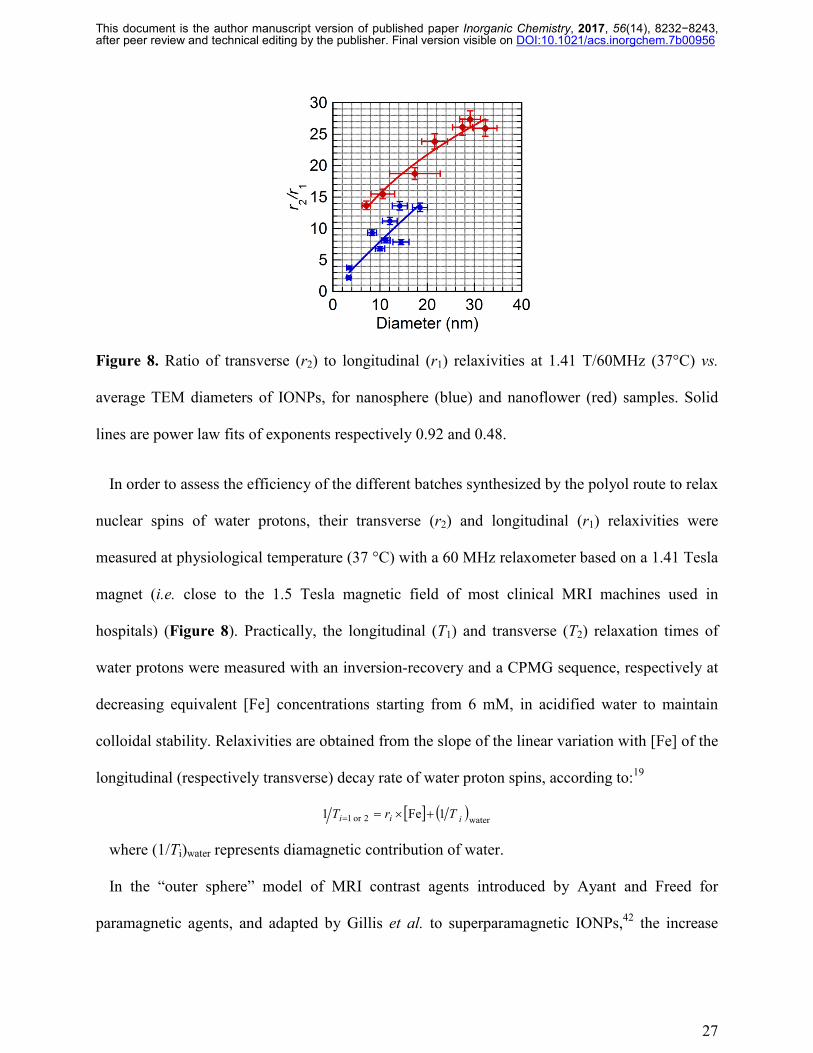
Figure 8. Ratio of transverse (r2) to longitudinal (r1) relaxivities at 1.41 T/60MHz (37°C) vs.
average TEM diameters of IONPs, for nanosphere (blue) and nanoflower (red) samples. Solid
lines are power law fits of exponents respectively 0.92 and 0.48.
In order to assess the efficiency of the different batches synthesized by the polyol route to relax
nuclear spins of water protons, their transverse (r2) and longitudinal (r1) relaxivities were
measured at physiological temperature (37 °C) with a 60 MHz relaxometer based on a 1.41 Tesla
magnet (i.e. close to the 1.5 Tesla magnetic field of most clinical MRI machines used in
hospitals) (Figure 8). Practically, the longitudinal (T1) and transverse (T2) relaxation times of
water protons were measured with an inversion-recovery and a CPMG sequence, respectively at
decreasing equivalent [Fe] concentrations starting from 6 mM, in acidified water to maintain
colloidal stability. Relaxivities are obtained from the slope of the linear variation with [Fe] of the
longitudinal (respectively transverse) decay rate of water proton spins, according to:19
[ ] ( )water2or1 1Fe1 iii TrT +×==
where (1/Ti)water represents diamagnetic contribution of water.
In the “outer sphere” model of MRI contrast agents introduced by Ayant and Freed for
paramagnetic agents, and adapted by Gillis et al. to superparamagnetic IONPs,42 the increase
This document is the author manuscript version of published paper Inorganic Chemistry, 2017, 56(14), 8232−8243, after peer review and technical editing by the publisher. Final version visible on DOI:10.1021/acs.inorgchem.7b00956
28
relaxation rate 1/T2 compared to pure water originates from fluctuating dipolar interactions
between nuclear spins of water protons and the electronic magnetic moment of IONPs. For a
limited range of diameters called “motional averaging regime”, the superparamagnetic particle
can be considered immobile during the echo time (TE) of the sequence compared to random
trajectories of water molecules diffusing all around the magnetic sphere. In this case, Vuong et
al. have shown that r2 follows a universal scaling law that is quadratic both with the
magnetization and with the radius of the “outer sphere”, defined as the minimum approach
distance between H2O molecules and the IONP center.43 For the IONP batches prepared in this
study, the quadratic law is perfectly observed for the smooth sphere NPs (Figure S14),
validating the proton diffusive model. This brings additional evidence that no organic layer
remains on their surface after the washing steps. If not, water protons could not reach IONP
surface and the quadratic law would not be observed. In the case of nanoflowers, the variation of
r2 vs. size appears erratic, presumably because of their rough geometry and very high specific
area mentioned before, that can be up to 60% larger than the geometrical area of a smooth sphere
(see case of ff35 batch on Figure S1). Proton relaxivity may arise by a combination of “outer
sphere” and “inner sphere” mechanisms, meaning that water molecules can be transiently
adsorbed in the porosity of nanoflowers, relaxation dynamics can therefore not be modelled by a
single translational diffusion constant of water molecules around the particle.
The ratio of relaxivities r2/r1 is commonly used to determine whether NPs are most suitable as
T1 (positive) or T2 (negative) MRI contrast agents. With r2/r1 ratios larger than 5, most of the
IONPs synthesized here are suitable as negative contrast agents for T2 weighted MRI
applications, such as commercial medical products Resovist®, Feridex®, Cliavist® or Clariscan®.44
With much smaller r2/r1 ratios, UUSPIOs of just a few nm diameters synthesized in pure DEG
This document is the author manuscript version of published paper Inorganic Chemistry, 2017, 56(14), 8232−8243, after peer review and technical editing by the publisher. Final version visible on DOI:10.1021/acs.inorgchem.7b00956
29
would rather be perfectly suitable as T1-type, positive contrast agents. Such UUSPIO-based T1-
type contrast agents not yet commercially available would however be an excellent alternative to
gadolinium chelates currently used and suspected of toxicity.45 Free gadolinium ions (i.e. not
complexed by very strong ligands) are indeed nephrotoxic and neurotoxic, and undesirable side
effects may arise in patients with renal insufficiency. Iron oxides having been proven perfectly
safe in clinical use, these UUSPIOs are likely to find applications as alternative T1 contrast
agents in clinical MRI in a near future.
CONCLUSIONS
We have presented herein a comprehensive study of IONPs synthesis and characterization.
IONPs were synthesized by the forced hydrolysis of iron(II, III) chlorides either in pure DEG
polyol or in a mixture with NMDEA poly(hydroxy)amine. We have evidenced the importance of
controlling the amount and timing of water addition for a successful synthesis and proper control
over IONP morphology. A library of samples was obtained, ranging from “ultra-ultra-small” (∼3
nm) UUSPIOs obtained by water “hot injection” in DEG at 220°C and fast growth (20 min), to
large IONPs (up to 37 nm) obtained by a longer “heating up” protocol in a DEG/NMDEA 1:1
mixture. Depending on reaction conditions (natural mixing vs. mechanical stirring), either
smooth sphere or nanoflower morphologies were obtained. The structural and magnetic
properties of these nanoparticles were extensively studied. They all exhibit superparamagnetic
behavior characterized by a reversible magnetization curve in static magnetic field, with a strong
saturation magnetization above 3×10⁵ A⋅m-1. On the physical point of view, the specific
absorption rate (SAR) was first tested at given AMF conditions (755 kHz, 10.2 kA⋅m-1) and iron
oxide concentration (3 g⋅L-1). These parameters were also varied over a broad range of field
This document is the author manuscript version of published paper Inorganic Chemistry, 2017, 56(14), 8232−8243, after peer review and technical editing by the publisher. Final version visible on DOI:10.1021/acs.inorgchem.7b00956
30
strength and frequencies with the use of an AC magnetometer that is much faster than
calorimetric experiments for estimating the SAR. The efficiency of most of synthesized batches
as MRI contrast agents were also evaluated by proton relaxometry measurements. Several
scaling laws were derived for the SAR and the relaxivity ratio r2/r1, both being estimated at
physiological body temperature (37 °C). At given AMF condition, the SAR exhibits quadratic
variation with diameter for smooth nanospheres and slower variations (viz. square root) for
nanoflowers. Transverse relaxivity r2 exhibits also quadratic variation with diameter for smooth
nanospheres, in line with the “motional averaging regime” of the “outer sphere” model of MRI
contrast agents. The r2/r1 ratios, calculated to distinguish IONPs better suited as T1 or T2 MRI
contrast agents, varies linearly on diameter for nanospheres, and with a lower exponent (viz.
square root) for nanoflowers. In the case of the smallest diameter IONPs synthesized (USPIOs),
their longitudinal relaxivity r1 at 1.41 T associated with moderate r2/r1 ratio make them
alternatives to gadolinium chelates as positive MRI contrast agents, with lower risk of side
effects on patients.
The AC hysteresis loops measured at varying AMF frequency and intensity brought more
information on the magnetic hyperthermia mechanisms. In the case of nanoflowers and large
nanospheres, the SAR vs. field intensity curve shows an inflexion point between low and high
fields. Below this threshold field, they present perfect superparamagnetic behavior, whereas
above this field they behave more like ferromagnets. The threshold field can be associated with
an anisotropy field as was done in the two-level Stoner-Wohlfarth model developed by Carrey et
al. for blocked magnetic moments.32
Besides these obvious applications as nanoheaters in magnetic fluid hyperthermia and as MRI
contrast agents, other uses can be envisioned. These very large diameter IONPs yet forming
This document is the author manuscript version of published paper Inorganic Chemistry, 2017, 56(14), 8232−8243, after peer review and technical editing by the publisher. Final version visible on DOI:10.1021/acs.inorgchem.7b00956
31
stable colloidal suspensions exhibit extremely large magnetic susceptibility in DC magnetic field
(χ up to 100), which can be a requested property for delicate experimental setups based on weak
DC magnetic fields such as the “magnetic tweezers” to manipulate living tissues or embryos,46 or
micromechanical experiments to assess the flexural rigidity of magnetic wires.47
Another application could also be magnetic particle imaging (MPI) that requires IONPs
optimally in the 20-25 nm diameter range so that magnetization saturates at low field strengths.48
Such versatility of sizes, morphologies and thus of physical properties was achieved by playing
only on the nature of polyols as well as the amount and way of introducing water in the reaction
vessel (“hot injection” vs. “heating up”), in solvent reflux conditions. In brief, robust, gram-scale
and easily reproducible synthesis protocols were described to prepare from ultra-ultra-small
superparamagnetic cores to very large size magnetic smooth nanospheres and nanoflowers, the
latter offering among the highest magnetic heating properties reported so far for synthetic iron
oxide nanoparticles.
ASSOCIATED CONTENT
Supporting Information. The Supporting Information is available free of charge on the ACS
Publications website at DOI: 10.1021/acs.inorgchem.7b00956.
SANS curves, NMR analyses, Zeta potential, ATR-IR spectrum, DC magnetization curves, DLS
curves, Summary of characteristics of the sample library, AC hysteresis cycles, SAR and
hysteresis area vs. applied magnetic field at constant radiofrequency, ZFC-FC curves by MPMS
magnetometry, longitudinal and transverse relaxivities (PDF).
This document is the author manuscript version of published paper Inorganic Chemistry, 2017, 56(14), 8232−8243, after peer review and technical editing by the publisher. Final version visible on DOI:10.1021/acs.inorgchem.7b00956
32
AUTHOR INFORMATION
Corresponding Author
* [email protected] and [email protected]
Author Contributions
The manuscript was written through contributions of all authors. All authors have given
approval to the final version of the manuscript.
Funding Sources
G.H.’s doctoral fellowship was funded by the 2014 call of the Department of Science and
Technology of the University of Bordeaux (APUB1–ST2014). A. K.’s internship was supported
by the US-France-Belgium iREU Site in Translational Chemistry funded by the National Science
Foundation (Grant No. CHE 1560390) headed by Pr Randall J. Duran. Basque Government
(Grant No. IT-1005-16) and Agence Nationale de la Recherche (Grant ANR-13-BS08-0017
MagnetoChemoBlast) are also acknowledged for financial support. This article is based upon
work from COST Action RADIOMAG (TD1402), supported by COST (European Cooperation
in Science and Technology).
ACKNOWLEDGMENT
Laboratoire Léon Brillouin (CEA-Saclay) also is acknowledged for giving access to G.H. to
the PACE spectrometer during the 2015 annual training on neutron scattering techniques (Fan du
LLB/Orphée). TEM images were taken at the Bordeaux Imaging Center (BIC) of the University
of Bordeaux with the acknowledged help of Sabrina Lacomme and Etienne Gontier on
equipment funded by France Life Imaging. Authors also want to thank SGIker (UPV/EHU) for
the technical and human support as well as the VSM and ZFC-FC measurements.
This document is the author manuscript version of published paper Inorganic Chemistry, 2017, 56(14), 8232−8243, after peer review and technical editing by the publisher. Final version visible on DOI:10.1021/acs.inorgchem.7b00956
33
ABBREVIATIONS
AMF, alternating magnetic field; DEG, diethylene glycol; DLS, dynamic light scattering;
ATR-IR, attenuated total reflection infrared spectroscopy; ILP, intrinsic loss power; IONP, iron
oxide nanoparticle; IEP, isoelectric point; MFH, magnetic fluid hyperthermia; MPMS, magnetic
property measurement system; NMDEA, N-methyl diethanolamine; NP, nanoparticle; OD,
optical density (or absorbance); SANS, small angle neutron scattering; SAR, specific absorption
rate; UUSPIO, ultra-ultra-small superparamagnetic iron oxide.
REFERENCES
1. Hervault, A.; Thanh, N. T. K. Magnetic nanoparticle-based therapeutic agents for thermo-chemotherapy treatment of cancer. Nanoscale 2014, 6 (20), 11553-11573. 2. Périgo, E. A.; Hemery, G.; Sandre, O.; Ortega, D.; Garaio, E.; Plazaola, F.; Teran, F. J. Fundamentals and advances in magnetic hyperthermia. Applied Physics Reviews 2015, 2 (4), 041302. 3. Massart, R. Preparation of aqueous magnetic liquids in alkaline and acidic media. IEEE Transactions on Magnetics 1981, 17 (2), 1247-1248. 4. Caruntu, D.; Caruntu, G.; Chen, Y.; O'Connor, C. J.; Goloverda, G.; Kolesnichenko, V. L. Synthesis of Variable-Sized Nanocrystals of Fe3O4 with High Surface Reactivity. Chemistry of Materials 2004, 16 (25), 5527-5534. 5. Hyeon, T.; Lee, S. S.; Park, J.; Chung, Y.; Na, H. B. Synthesis of Highly Crystalline and Monodisperse Maghemite Nanocrystallites without a Size-Selection Process. J. Am. Chem. Soc. 2001, 123 (51), 12798-12801. 6. Horner, O.; Neveu, S.; Montredon, S. d.; Siaugue, J.-M.; Cabuil, V. Hydrothermal synthesis of large maghemite nanoparticles: influence of the pH on the particle size. J. Nanopart. Res. 2009, 11 (5), 1247-1250. 7. Shubitidze, F.; Kekalo, K.; Stigliano, R.; Baker, I. Magnetic nanoparticles with high specific absorption rate of electromagnetic energy at low field strength for hyperthermia therapy. Journal of Applied Physics 2015, 117 (9), 094302. 8. Blanco-Andujar, C.; Ortega, D.; Southern, P.; Pankhurst, Q. A.; Thanh, N. T. K. High performance multi-core iron oxide nanoparticles for magnetic hyperthermia: microwave synthesis, and the role of core-to-core interactions. Nanoscale 2015, 7 (5), 1768-1775. 9. Lartigue, L.; Hugounenq, P.; Alloyeau, D.; Clarke, S. P.; Lévy, M.; Bacri, J.-C.; Bazzi, R.; Brougham, D. F.; Wilhelm, C.; Gazeau, F. Cooperative Organization in Iron Oxide Multi-Core Nanoparticles Potentiates Their Efficiency as Heating Mediators and MRI Contrast Agents. ACS Nano 2012, 6 (12), 10935-10949.
This document is the author manuscript version of published paper Inorganic Chemistry, 2017, 56(14), 8232−8243, after peer review and technical editing by the publisher. Final version visible on DOI:10.1021/acs.inorgchem.7b00956
34
10. Kostopoulou, A.; Brintakis, K.; Vasilakaki, M.; Trohidou, K. N.; Douvalis, A. P.; Lascialfari, A.; Manna, L.; Lappas, A. Assembly-mediated interplay of dipolar interactions and surface spin disorder in colloidal maghemite nanoclusters. Nanoscale 2014, 6 (7), 3764-3776. 11. Caruntu, D.; Remond, Y.; Chou, N. H.; Jun, M.-J.; Caruntu, G.; He, J.; Goloverda, G.; O'Connor, C.; Kolesnichenko, V. Reactivity of 3d Transition Metal Cations in Diethylene Glycol Solutions. Synthesis of Transition Metal Ferrites with the Structure of Discrete Nanoparticles Complexed with Long-Chain Carboxylate Anions. Inorganic Chemistry 2002, 41 (23), 6137-6146. 12. Cheng, C.; Xua, F.; Gu, H. Facile synthesis and morphology evolution of magnetic iron oxide nanoparticles in different polyol processes. NewJ. Chem. 2011, 35, 1072–1079. 13. Hachani, R.; Lowdell, M.; Birchall, M.; Hervault, A.; Mertz, D.; Begin-Colin, S.; Thanh, N. T. K. Polyol synthesis, functionalisation, and biocompatibility studies of superparamagnetic iron oxide nanoparticles as potential MRI contrast agents. Nanoscale 2016, 8 (6), 3278-3287. 14. Hugounenq, P.; Levy, M.; Alloyeau, D.; Lartigue, L.; Dubois, E.; Cabuil, V.; Ricolleau, C.; Roux, S.; Wilhelm, C.; Gazeau, F.; Bazzi, R. Iron Oxide Monocrystalline Nanoflowers for Highly Efficient Magnetic Hyperthermia. J. Phys. Chem. C 2012, 116 (29), 15702–15712. 15. Forge, D.; Roch, A.; Laurent, S.; Tellez, H.; Gossuin, Y.; Renaux, F.; Vander Elst, L.; Muller, R. N. Optimization of the Synthesis of Superparamagnetic Contrast Agents by the Design of Experiments Method. The Journal of Physical Chemistry C 2008, 112 (49), 19178-19185. 16. Sakellari, D.; Brintakis, K.; Kostopoulou, A.; Myrovali, E.; Simeonidis, K.; Lappas, A.; Angelakeris, M. Ferrimagnetic nanocrystal assemblies as versatile magnetic particle hyperthermia mediators. Materials Science and Engineering: C 2016, 58, 187-193. 17. Tourinho, F. A.; Franck, R.; Massart, R. Aqueous ferrofluids based on manganese and cobalt ferrites. Journal of Materials Science 1990, 25 (7), 3249-3254. 18. Koppel, D. E. Analysis of Macromolecular Polydispersity in Intensity Correlation Spectroscopy: The Method of Cumulants. The Journal of Chemical Physics 1972, 57 (11), 4814-4820. 19. Henoumont, C.; Laurent, S.; Vander Elst, L. How to perform accurate and reliable measurements of longitudinal and transverse relaxation times of MRI contrast media in aqueous solutions. Contrast Media & Molecular Imaging 2009, 4 (6), 312-321. 20. Hemery, G.; Garanger, E.; Lecommandoux, S.; Wong, A. D.; Gillies, E. R.; Pedrono, B.; Bayle, T.; Jacob, D.; Sandre, O. Thermosensitive polymer-grafted iron oxide nanoparticles studied by in situ dynamic light backscattering under magnetic hyperthermia. Journal of Physics D: Applied Physics 2015, 48 (49), 494001. 21. Garaio, E.; Sandre, O.; Collantes, J.-M.; Garcia, J. A.; Mornet, S.; Plazaola, F. Specific absorption rate dependence on temperature in magnetic field hyperthermia measured by dynamic hysteresis losses (ac magnetometry). Nanotechnology 2015, 26 (1), 015704. 22. Bruvera, I. J.; Mendoza Zélis, P.; Pilar Calatayud, M.; Goya, G. F.; Sánchez, F. H. Determination of the blocking temperature of magnetic nanoparticles: The good, the bad, and the ugly. Journal of Applied Physics 2015, 118 (18), 184304. 23. Brûlet, A.; Lairez, D.; Lapp, A.; Cotton, J.-P. Improvement of data treatment in small-angle neutron scattering. Journal of Applied Crystallography 2007, 40, 165-177. 24. Tromsdorf, U. I.; Bruns, O. T.; Salmen, S. C.; Beisiegel, U.; Weller, H. A Highly Effective, Nontoxic T1 MR Contrast Agent Based on Ultrasmall PEGylated Iron Oxide Nanoparticles. Nano Letters 2009, 9 (12), 4434-4440.
This document is the author manuscript version of published paper Inorganic Chemistry, 2017, 56(14), 8232−8243, after peer review and technical editing by the publisher. Final version visible on DOI:10.1021/acs.inorgchem.7b00956
35
25. Ninjbadgar, T.; Brougham, D. F. Epoxy Ring Opening Phase Transfer as a General Route to Water Dispersible Superparamagnetic Fe3O4 Nanoparticles and Their Application as Positive MRI Contrast Agents. Advanced Functional Materials 2011, 21 (24), 4769-4775. 26. Borase, T.; Ninjbadgar, T.; Kapetanakis, A.; Roche, S.; O'Connor, R.; Kerskens, C.; Heise, A.; Brougham, D. F. Stable Aqueous Dispersions of Glycopeptide-Grafted Selectably Functionalized Magnetic Nanoparticles. Angewandte Chemie International Edition 2013, 52 (11), 3164-3167. 27. Hannecart, A.; Stanicki, D.; Vander Elst, L.; Muller, R. N.; Lecommandoux, S.; Thevenot, J.; Bonduelle, C.; Trotier, A.; Massot, P.; Miraux, S.; Sandre, O.; Laurent, S. Nano-thermometers with thermo-sensitive polymer grafted USPIOs behaving as positive contrast agents in low-field MRI. Nanoscale 2015, 7 (8), 3754-3767. 28. Sandre, O.; Genevois, C.; Garaio, E.; Adumeau, L.; Mornet, S.; Couillaud, F. In Vivo Imaging of Local Gene Expression Induced by Magnetic Hyperthermia. Genes 2017, 8 (2), 61. 29. Sanz, B.; Calatayud, M. P.; De Biasi, E.; Lima, E., Jr.; Mansilla, M. V.; Zysler, R. D.; Ibarra, M. R.; Goya, G. F. In Silico before In Vivo: how to Predict the Heating Efficiency of Magnetic Nanoparticles within the Intracellular Space. Sci Rep. 2016, 6, 38733. 30. Iacob, N.; Schinteie, G.; Palade, P.; Ticos, C. M.; Kuncser, V. Stepped heating procedure for experimental SAR evaluation of ferrofluids. The European Physical Journal E 2015, 38 (6), 57. 31. Kallumadil, M.; Tada, M.; Nakagawa, T.; Abe, M.; Southern, P.; Pankhurst, Q. A. Suitability of commercial colloids for magnetic hyperthermia. Journal of Magnetism and Magnetic Materials 2009, 321 (10), 1509-1513. 32. Carrey, J.; Mehdaoui, B.; Respaud, M. Simple models for dynamic hysteresis loop calculations of magnetic single-domain nanoparticles: Application to magnetic hyperthermia optimization. Journal of Applied Physics 2011, 109 (8), 083921. 33. Garaio, E.; Collantes, J. M.; Garcia, J. A.; Plazaola, F.; Mornet, S.; Couillaud, F.; Sandre, O. A wide-frequency range AC magnetometer to measure the specific absorption rate in nanoparticles for magnetic hyperthermia. Journal of Magnetism and Magnetic Materials 2014, 368, 432-437. 34. Lacroix, L.-M.; Malaki, R. B.; Carrey, J.; Lachaize, S.; Respaud, M.; Goya, G. F.; Chaudret, B. Magnetic hyperthermia in single-domain monodisperse FeCo nanoparticles: Evidences for Stoner–Wohlfarth behavior and large losses. Journal of Applied Physics 2009, 105 (2), 023911. 35. Mehdaoui, B.; Meffre, A.; Carrey, J.; Lachaize, S.; Lacroix, L.-M.; Gougeon, M.; Chaudret, B.; Respaud, M. Optimal Size of Nanoparticles for Magnetic Hyperthermia: A Combined Theoretical and Experimental Study. Advanced Functional Materials 2011, 21 (23), 4573-4581. 36. Hergt, R.; Dutz, S. Magnetic particle hyperthermia—biophysical limitations of a visionary tumour therapy. Journal of Magnetism and Magnetic Materials 2007, 311 (1), 187-192. 37. Marciello, M.; Connord, V.; Veintemillas-Verdaguer, S.; Verges, M. A.; Carrey, J.; Respaud, M.; Serna, C. J.; Morales, M. P. Large scale production of biocompatible magnetite nanocrystals with high saturation magnetization values through green aqueous synthesis. Journal of Materials Chemistry B 2013, 1 (43), 5995-6004.
This document is the author manuscript version of published paper Inorganic Chemistry, 2017, 56(14), 8232−8243, after peer review and technical editing by the publisher. Final version visible on DOI:10.1021/acs.inorgchem.7b00956
36
38. Kashevsky, B. E.; Kashevsky, S. B.; Korenkov, V. S.; Istomin, Y. P.; Terpinskaya, T. I.; Ulashchik, V. S. Magnetic hyperthermia with hard-magnetic nanoparticles. Journal of Magnetism and Magnetic Materials 2015, 380, 335-340. 39. Baaziz, W.; Pichon, B. P.; Fleutot, S.; Liu, Y.; Lefevre, C.; Greneche, J.-M.; Toumi, M.; Mhiri, T.; Begin-Colin, S. Magnetic Iron Oxide Nanoparticles: Reproducible Tuning of the Size and Nanosized-Dependent Composition, Defects, and Spin Canting. The Journal of Physical Chemistry C 2014, 118 (7), 3795-3810. 40. Salas, G.; Casado, C.; Teran, F. J.; Miranda, R.; Serna, C. J.; Morales, M. P. Controlled synthesis of uniform magnetite nanocrystals with high-quality properties for biomedical applications. Journal of Materials Chemistry 2012, 22 (39), 21065-21075. 41. Goya, G. F.; Berquó, T. S.; Fonseca, F. C.; Morales, M. P. Static and dynamic magnetic properties of spherical magnetite nanoparticles. Journal of Applied Physics 2003, 94 (5), 3520-3528. 42. Gillis, P.; Roch, A.; Brooks, R. A. Corrected Equations for Susceptibility-Induced T2-Shortening. Journal of Magnetic Resonance 1999, 137 (2), 402-407. 43. Vuong, Q. L.; Berret, J.-F.; Fresnais, J.; Gossuin, Y.; Sandre, O. A Universal Scaling Law to Predict the Efficiency of Magnetic Nanoparticles as MRI T2-Contrast Agents. Advanced Healthcare Materials 2012, 1 (4), 502-512. 44. Wang, Y.-X. J. Superparamagnetic iron oxide based MRI contrast agents: Current status of clinical application. Quantitative Imaging in Medicine and Surgery 2011, 1 (1), 35-40. 45. Thomsen, H. S.; Morcos, S. K.; Dawson, P. Is there a causal relation between the administration of gadolinium based contrast media and the development of nephrogenic systemic fibrosis (NSF)? Clinical Radiology 2006, 61 (11), 905-906. 46. Serwane, F.; Mongera, A.; Rowghanian, P.; Kealhofer, D. A.; Lucio, A. A.; Hockenbery, Z. M.; Campas, O. In vivo quantification of spatially varying mechanical properties in developing tissues. Nat Meth 2017, 14 (2), 181-186. 47. Gerbal, F.; Wang, Y. Optical detection of nanometric thermal fluctuations to measure the stiffness of rigid superparamagnetic microrods. Proceedings of the National Academy of Sciences 2017, 114 (10), 2456-2461. 48. Bauer, L. M.; Situ, S. F.; Griswold, M. A.; Samia, A. C. S. High-performance iron oxide nanoparticles for magnetic particle imaging - guided hyperthermia (hMPI). Nanoscale 2016, 8 (24), 12162-12169.
This document is the author manuscript version of published paper Inorganic Chemistry, 2017, 56(14), 8232−8243, after peer review and technical editing by the publisher. Final version visible on DOI:10.1021/acs.inorgchem.7b00956
37
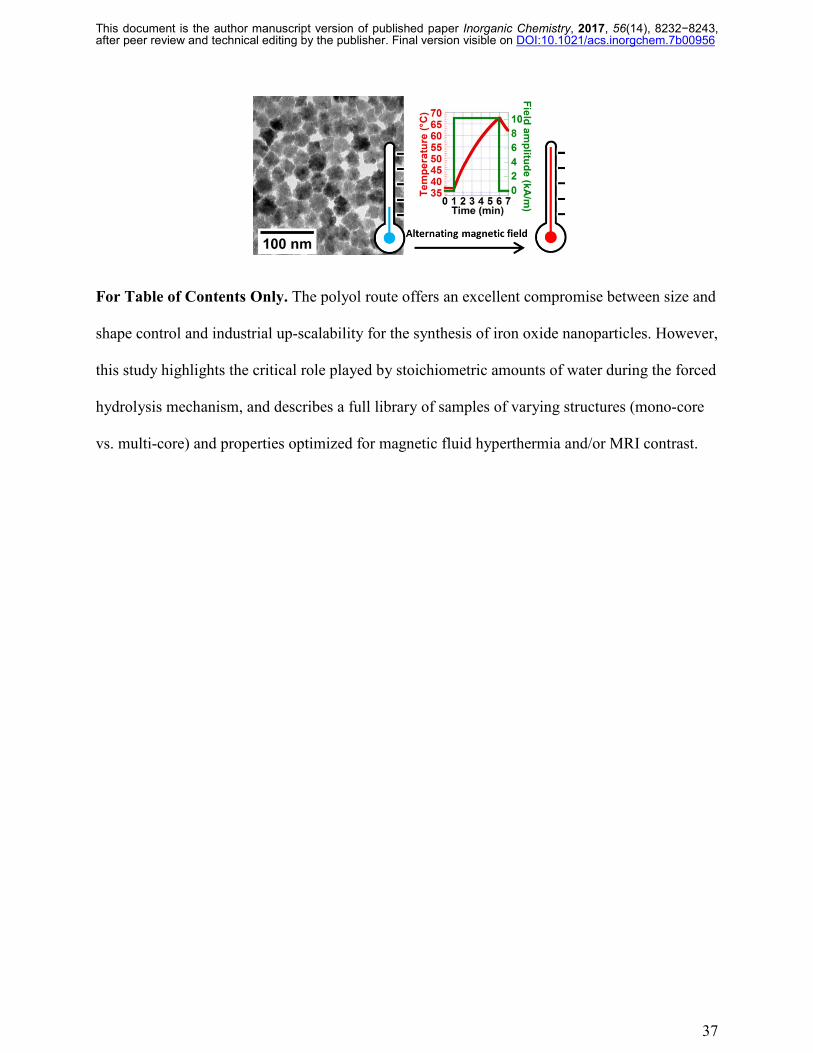
For Table of Contents Only. The polyol route offers an excellent compromise between size and
shape control and industrial up-scalability for the synthesis of iron oxide nanoparticles. However,
this study highlights the critical role played by stoichiometric amounts of water during the forced
hydrolysis mechanism, and describes a full library of samples of varying structures (mono-core
vs. multi-core) and properties optimized for magnetic fluid hyperthermia and/or MRI contrast.