Embed Size (px)
Citation preview
TUNNELING IN ACIDIC, ALTERED AND
SEDIMENTARY ROCK IN ICELAND
BÚÐARHÁLSVIRKJUN

Master’s Thesis Preface
Hallgrímur Örn Arngrímsson i DTU-Byg, HÍ 2009 Þorri Björn Gunnarsson
PREFACE
This Master´s Thesis is written at the Department of Civil Engineering, DTU-Byg, Technical University of Denmark in the field of geotechnical engineering and rock mechanics. It was worked out in cooperation with the University of Iceland, Faculty of Civil and Environmental Engineering (HÍ). The thesis has the size of 30 ECTS credit points and the work was carried out over a period of six months from February to July 2009.
Project supervisors were Niels Foged and Sigurður Erlingsson. The project was in part funded by the Icelandic Road Administration (Vegagerðin).
_______________________________________
Hallgrímur Örn Arngrímsson
_______________________________________
Þorri Björn Gunnarsson


Master’s Thesis Acknowledgements
Hallgrímur Örn Arngrímsson iii DTU-Byg, HÍ 2009 Þorri Björn Gunnarsson
ACKNOWLEDGEMENTS
We would like to express our gratitude to those who helped us on this thesis and give special thanks to:
Niels Foged – For his guidance and interest in the project. His interests in rock mechanics, arctic- and Icelandic geology is inspiring.
Sigurður Erlingsson – For his guidance during the project work, selection of rock cores and useful comments on thesis structure and Phase2 modelling.
Katrine Alling Andreason – For her guidance during the triaxial tests in MTS 815 Rock Triaxial System, useful comments and providing literature.
Vilhjálmur Ívar Sigurjónsson – For preparation of rock cores for transport to DTU in Denmark.
Vita Larsen – For friendly help in the DTU laboratory.
GEO – For allowance in using their equipment; diamond disc saw and compression machine. We would also like to give special thanks to Kaj West for instructions on the diamond disc saw, Frederik Ditlevsen for guidance on the compression testing machine and Helle F. Christensen for her discussions on the test procedure.
Vegagerðin – For their interest in the thesis and financial support.
Landsvirkjun – For their interest in the project, access to the Búðarháls project area, access to rock cores from Búðarháls and shipment of the cores to Denmark.
Matthías Loftsson – For his guidance in selection of rock cores, discussions on previous geological research performed at Búðarháls and for providing important literature on the subject.
Jón H. Steingrímsson – For his discussions and providing literature on preliminary investigations and testing.
Gunnar Bjarnason – For invaluable proofreading of the thesis and good comments.
Haukur Arngrímsson – For his help moving the rock core boxes when selecting samples.
Snorri Pálmason – For his help improving figure quality in reference pictures.
Ásta Sóllilja Snorradóttir, Sunna Dís Hallgrímsdóttir, Snorri Snær Hallgrímsson, Guðrún Bjartmarz and Alexander Jóhann Þorrason - For their love and support during our work on this project.

Master’s Thesis Abstract
Hallgrímur Örn Arngrímsson v DTU-Byg, HÍ 2009 Þorri Björn Gunnarsson
ABSTRACT
The geology in Iceland is special compared to other parts of the world. Iceland is located on a mid-ocean ridge with a hotspot underneath which has generated energetic volcanism over the past 25 million years. The bedrock is built up of multiple volcanic layers and sediments produced in the Tertiary and Quaternary periods. Central volcanoes, seismic activity, geothermal system and glacial erosion also increase the geological variety of Iceland.
Tunneling conditions in Iceland are challenging especially when excavations include mixed face conditions, ground water inflow, faults and dikes. Special care has to be taken when tunneling through soft rock formations, for example: sedimentary rock, scoria, altered rock or other weak rock formations. Under these difficult conditions special care needs to be taken when tunnel support systems are designed.
The focus of this thesis is tunneling in acidic, altered and sedimentary rock in Iceland. These rock types are found in Búðarháls which is the location of a new hydropower station in the south of Iceland. The Búðarháls project includes an excavation of a 4 km long tunnel through various rock types and challenging tunneling conditions. Excavation has not started in Búðarháls but preliminary investigations have given information about the geology in the area and access to borehole cores which were used for this investigation. At the northern end of the tunnel there are acidic rock formations which are rare in Icelandic tunneling history and interesting to examine more closely.
The aim of this thesis is to investigate by means of numerical analysis the structural integrity of the tunnel design in Búðarháls. Core samples were collected on eight different rock types and their rock mechanical properties determined from Brazil, Uniaxial Compression and Triaxial Compression tests performed at the Geological Institute of Denmark (GEO) and Technical University of Denmark (DTU). The Geological Strength Index (GSI) was used to estimate rock mass properties. Three different tunnel cross-sections were analyzed in the finite element program Phase2 using the designed rock support classes recommended in the contract documents.
The results revealed that all the cross-sections could be supported and built as they have been designed. The greatest displacements occurred in the walls and weak layers and those areas would in some cases need extra support. More investigations will need to be performed to determine some parameters accurately, such as on the dilation angle and horizontal in-situ stresses.

Master’s Thesis Útdráttur
Hallgrímur Örn Arngrímsson vii DTU-Byg, HÍ 2009 Þorri Björn Gunnarsson
ÚTDRÁTTUR
Jarðfræði Íslands er sérstök borin saman við jarðfræði heimsins. Ísland er staðsett á útsjávarhrygg með heitum reit sem síðustu 25 milljón ár hefur verið mjög eldvirkt svæði. Jarðlaga staflinn er byggður upp af fjölmörgum hraunlögum og setmyndunum frá Tertíer og Kvarter tímabilunum. Megineldstöðvar, jarðskjálftar, jarðhitasvæði og jökulrof auka einnig fjölbreytni jarðfræðinnar á Íslandi.
Aðstæður til jarðgangnagerðar á Íslandi eru oft erfiðar, sérstaklega þegar göng innihalda fjölbreytt jarðlög í stafni, grunnvatn, sprungur og innskot. Mjúk jarðlög geta verið erfið viðureignar t.d. setberg, kargi og ummyndað berg. Við þessar erfiðu aðstæður þarf að huga vel að hönnun styrkinga.
Markmið þessa verkefnis er að kanna aðstæður til jarðgangnagerðar í súru-, ummynduðu- og setbergi. Þessar berggerðir eru allar að finna í Búðarhálsi þar sem fyrirhuguð er ný 80 MW vatnsfallsvirkjun. Búðarhálsvirkjun er hönnuð með 4 km löngum göngum þvert í gegnum margvíslegar bergmyndanir í Búðarhálsi. Vinna við göngin er ekki byrjuð en búið er að rannsaka svæðið vel og kortleggja jarðfræði hálsins með túlkun borholna. Niðurstöður fyrri rannsókna og kjarnar úr borholum eru grunnurinn sem þessi rannsóknarvinna er byggð á. Í norðurhlíðum Búðarháls er að finna súrt berg sem er sjaldgjæft í jarðgangnagerð á Íslandi og er þar af leiðandi áhugvert að skoða sérstaklega.
Verkefnið mun fjalla um styrkingarþörf jarðgangnanna í Búðarhálsi með aðstoð reiknilíkans. Átta bergtegundum var safnað úr borholum og bergfræðilegir eiginleikar þeirra rannsakaðir með Brazil, Uniaxial Compression og Triaxial Compression prófunaraðferðum. Geological Strength Index (GSI) var notaður til að meta bergmassa eiginleika bergtegundanna. Þrjú þversnið voru rannsökuð í einingaraðferðar forritinu Phase2.
Helstu niðurstöður sýna að þversniðin standast álagið miðað við núverandi hönnun á styrkingum. Stærstu færslurnar verða í veggjum og veikum lögum sem líklega verður að styrkja sérstaklega með staðbundnum styrkingaraðferðum. Rannsaka þarf betur nokkur atriði eins og útvíkkunar horn (dilation angle) bergtegundanna og láréttar spennur á svæðinu.

Master’s Thesis Table of contents
Hallgrímur Örn Arngrímsson ix DTU-Byg, HÍ 2009 Þorri Björn Gunnarsson
TABLE OF CONTENTS
Preface ................................................................................................................................... i Acknowledgements .............................................................................................................. iii Abstract ............................................................................................................................... v
Útdráttur ............................................................................................................................ vii Table of contents ................................................................................................................. ix
List of Figures ................................................................................................................... xiii List of Tables .................................................................................................................... xix
1 Introduction .................................................................................................................. 1
2 Geological history of Iceland ......................................................................................... 3
2.1 The creation of Iceland ........................................................................................... 3
2.2 Volcanic- & seismic activity ................................................................................... 4
2.3 Central volcanoes .................................................................................................... 6
2.4 Icelandic bedrock .................................................................................................... 7
2.4.1 Igneous rocks.................................................................................................... 9
2.4.2 Petrology ........................................................................................................ 10
2.4.3 Geotechnical classification of basalts ............................................................. 13
2.4.4 Acidic & intermediate rock ............................................................................ 13
2.4.5 Sub- and intraglacial rock .............................................................................. 14
2.4.6 Sedimentary rock ........................................................................................... 15
2.4.7 Weathering and alteration of rock ................................................................. 15
3 Hydropower Dams in Iceland ..................................................................................... 19
3.1 History .................................................................................................................. 19
3.2 Design types ......................................................................................................... 20
4 Hydropower Tunnels in Iceland .................................................................................. 21
4.1 History .................................................................................................................. 21
4.2 Design ................................................................................................................... 22
4.3 Tunneling methods ............................................................................................... 22
4.3.1 Drill and blast ................................................................................................ 23
4.3.2 TBM .............................................................................................................. 25
4.3.3 Roadheader .................................................................................................... 26
4.4 Tunneling Conditions in Iceland .......................................................................... 26
4.4.1 Mixed face ...................................................................................................... 27
4.4.2 Groundwater .................................................................................................. 28
4.4.3 Dikes .............................................................................................................. 28
Master’s Thesis Table of contents
Hallgrímur Örn Arngrímsson x DTU-Byg, HÍ 2009 Þorri Björn Gunnarsson
4.4.4 Faults and seismic activity ............................................................................ 29
4.4.1 Rock mechanical properties of Icelandic rock ................................................ 31
5 Rock mass & rock stress ............................................................................................. 35
5.1 Intact rock and rock mass .................................................................................... 35
5.2 Joints & block size ................................................................................................ 36
5.3 Rock stresses ......................................................................................................... 37
5.4 Tunneling stress .................................................................................................... 40
6 Rock mass strength ..................................................................................................... 43
6.1 Mohr-Coulomb failure criterion ............................................................................ 43
6.2 p´,q-diagram ......................................................................................................... 44
6.3 Madland procedure ............................................................................................... 46
6.4 Hoek Brown failure criterion ................................................................................ 46
6.5 RocLab.................................................................................................................. 47
6.6 Dilation angle ....................................................................................................... 48
7 Reinforcement strategies ............................................................................................. 51
7.1 Rock mass classification systems .......................................................................... 51
7.1.1 RQD ............................................................................................................... 51
7.1.2 RSR ................................................................................................................ 52
7.1.3 RMR .............................................................................................................. 54
7.1.4 Q-system ........................................................................................................ 56
7.1.5 GSI ................................................................................................................. 58
7.1.6 RMi ................................................................................................................ 62
7.2 Comparison between systems ............................................................................... 62
8 Rock mass support systems ........................................................................................ 65
8.1 Shotcrete ............................................................................................................... 65
8.2 Rockbolts .............................................................................................................. 66
8.3 Pre-cast concrete .................................................................................................. 69
8.4 Optimal support time ........................................................................................... 70
9 Búðarháls Power Station - tunnel .............................................................................. 73
9.1 Project .................................................................................................................. 73
9.2 Preliminary investigations .................................................................................... 74
9.2.1 Geology, faults and water inflow ................................................................... 76
9.2.2 Tunneling condition ....................................................................................... 77
9.2.3 Geotechnical testing ....................................................................................... 77
9.3 Tunnel and reinforcement design ......................................................................... 78
9.3.1 Tunnel design ................................................................................................. 78
9.3.2 Rock reinforcement design ............................................................................. 78
Master’s Thesis Table of contents
Hallgrímur Örn Arngrímsson xi DTU-Byg, HÍ 2009 Þorri Björn Gunnarsson
9.4 Field investigation - joints & block size ............................................................... 79
9.5 Other considerations ............................................................................................. 82
10 Laboratory testing ...................................................................................................... 83
10.1 Sample description ................................................................................................ 83
10.2 Sample preparation ............................................................................................... 83
10.3 Brazil tests ............................................................................................................ 86
10.4 Unconfined compression tests ............................................................................... 87
10.5 Triaxial tests ......................................................................................................... 88
10.5.1 Preparation .................................................................................................... 90
10.5.2 Test procedure ............................................................................................... 90
10.5.3 Young´s modulus ........................................................................................... 92
10.5.4 Poisson´s ratio ............................................................................................... 92
10.5.5 Triaxial compression failure ........................................................................... 92
10.5.6 Volume, bulk density, water content and porosity ........................................ 93
10.6 Laboratory Results ............................................................................................... 93
10.6.1 Bulk density & strength ................................................................................ 94
10.6.2 Triaxial test results ........................................................................................ 96
10.7 Interpreted results ................................................................................................ 96
10.7.1 Madland procedure ........................................................................................ 97
10.8 Comparison of results ........................................................................................... 98
10.9 Discussions on laboratory testing ........................................................................ 100
10.10 Interpretation using RocLab ................................................................................ 101
11 Numerical analysis ..................................................................................................... 105
11.1 Tunnel cross-sections ........................................................................................... 105
11.2 Discussion of input parameters ............................................................................ 108
11.2.1 Field stress and load split ............................................................................. 108
11.2.2 Material parameters ...................................................................................... 110
11.2.3 Shotcrete and rockbolts ................................................................................ 113
11.3 Results ................................................................................................................. 115
11.3.1 Rhyolite cross section ................................................................................... 117
11.3.2 Deepest cross-section .................................................................................... 121
11.3.3 Typical Icelandic cross-section ...................................................................... 124
11.4 Discussion of results............................................................................................. 127
12 Conclusion .................................................................................................................. 129
13 General Discussions & Future work .......................................................................... 133
14 References .................................................................................................................. 135

Master’s Thesis Table of contents
Hallgrímur Örn Arngrímsson xii DTU-Byg, HÍ 2009 Þorri Björn Gunnarsson
APPENDICES:
1. Appendix – Supplementary information
2. Appendix – Búðarháls project overview
3. Appendix – Previous test results and core logs
4. Appendix – Selected rock cores
5. Appendix – Laboratory tests
6. Appendix – Numerical analysis
Master’s Thesis List of Figures
Hallgrímur Örn Arngrímsson xiii DTU-Byg, HÍ 2009 Þorri Björn Gunnarsson
LIST OF FIGURES
Figure 2-1. Timescale of the geological history of Iceland [Jóhannesson, 1991]. .................. 4
Figure 2-2. The volcanic zones active in Iceland and its insular shelf during Holocene and Late-Pleistocene. The numbers refer to volcanic systems mentioned in article [Jakobsson, Jónasson & Sigurðsson, 2008]. .............................................................................................. 5
Figure 2-3. Earthquake epicentres (red dots) recorded 1994-2007 by the SIL seismic system [Einarsson, 2008]. ..................................................................................................... 5
Figure 2-4. Central volcanoes in Iceland. Tertiary volcanoes (open circles), Plio-Pleistocene (crossed circles) and active volcanoes (orange circles) [Harðarson, Fitton & Hjartarsson, 2008]. ............................................................................................................... 6
Figure 2-5. Geological map of Iceland [The National Land Survey of Iceland]. .................. 8
Figure 2-6. TAS classification system used for volcanic rocks [Le Maitre, 2002]. .............. 10
Figure 2-7. Plot of Na2O+K2O versus SiO2 showing the compositional range of the volcanic rocks in Iceland [Jakobsson, Jónasson & Sigurðsson, 2008]. ................................ 11
Figure 2-8. Frequency distribution of 1378 analyzed rock samples of the three rock series with respect to their MgO content [Jakobsson, Jónasson & Sigurðsson, 2008]. ................ 12
Figure 2-9. Simplified cross-section of sub- and interglacial volcanoes [Jakobsson & Guðmundsson, 2008]. ......................................................................................................... 14
Figure 2-10. Zeolite zones in basaltic rock in Iceland, indication of previous burial depth [Sæmundsson 1999]. ........................................................................................................... 16
Figure 3-1. Hydropower plant at Elliðaá [Sigurðardóttir, 2008]. ....................................... 19
Figure 3-2. Kárahnjúkar hydropower dam [National geographic, 2009]. ........................... 20
Figure 4-1. First tunneling project in Iceland, a road tunnel through Arnarneshamar finished in 1949 [Guðmundsson 1999]. ............................................................................... 21
Figure 4-2. Road tunnels in Iceland [Road administration of Iceland, 2009]. .................... 22
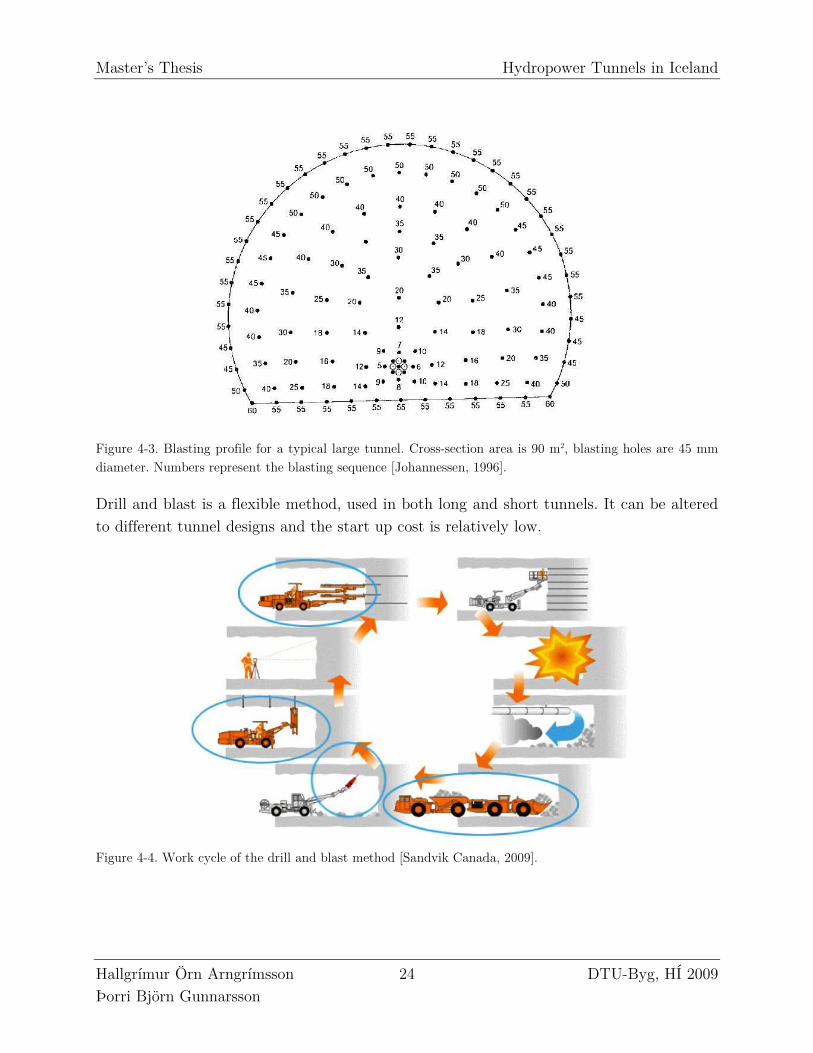
Figure 4-3. Blasting profile for a typical large tunnel. Cross-section area is 90 m2, blasting holes are 45 mm diameter. Numbers represent the blasting sequence [Johannessen, 1996]. ........................................................................................................................................... 24
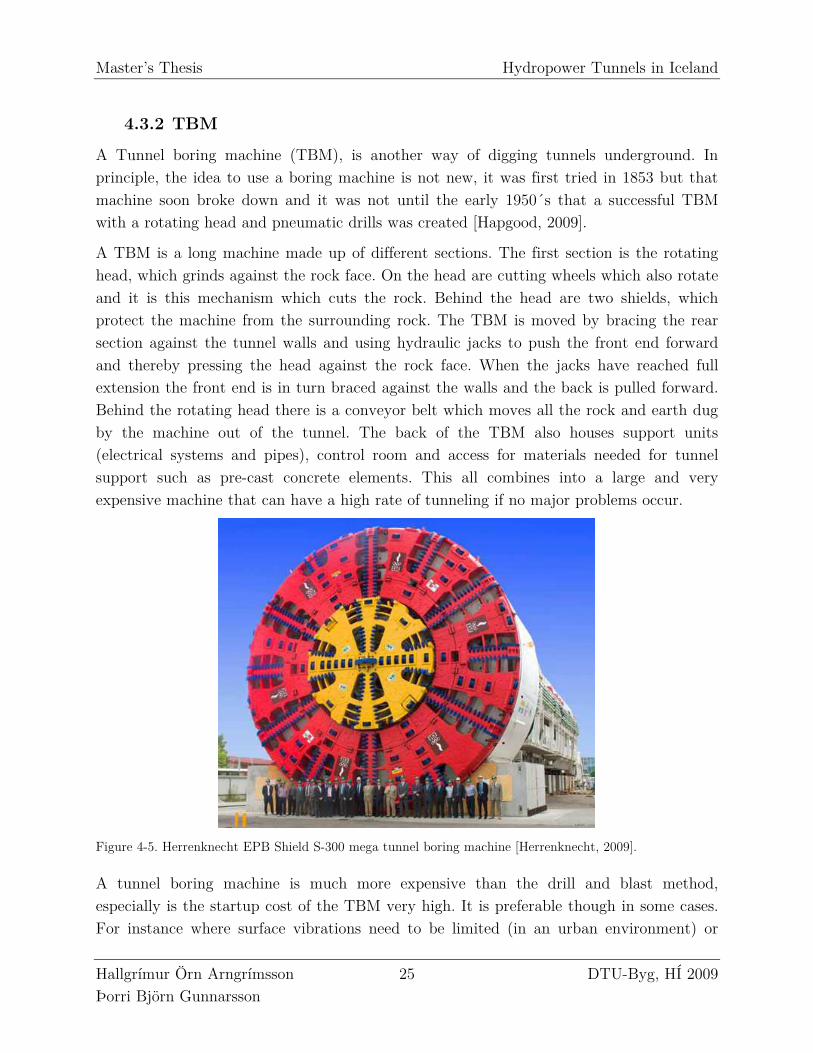
Figure 4-4. Work cycle of the drill and blast method [Sandvik Canada, 2009]. ................ 24
Figure 4-5. Herrenknecht EPB Shield S-300 mega tunnel boring machine [Herrenknecht, 2009]. .................................................................................................................................. 25
Figure 4-6. A Roadheader excavation machine [Dosco, 2009]. .......................................... 26
Figure 4-7. Typical mixed face for Icelandic conditions [Harðarsson, 1991] ...................... 27
Figure 4-8. Excavation opposite to dip direction (left). Excavation in the same direction as dip (right) [Jóhannsson, 1997]. ...................................................................................... 28
Master’s Thesis List of Figures
Hallgrímur Örn Arngrímsson xiv DTU-Byg, HÍ 2009 Þorri Björn Gunnarsson
Figure 4-9. Dikes cutting the stratified formation [Einarsson, 1994]. ................................ 29
Figure 4-10. Ground response to seismic waves [Wang, 1991]. .......................................... 30
Figure 4-11. Horizontal acceleration map for Icelandic bedrock [Staðlaráð Íslands, 2002]. 31
Figure 4-12. Columnar basalt at Reynisdrangar in Iceland [Pbase, 2009]. ........................ 32
Figure 5-1. Idealized diagram showing the transition from intact rock to a heavily jointed rock mass with increasing sample size [Hoek & Brown, 1982]. .......................................... 35
Figure 5-2. Correlation between different methods for block size measurements [Palmstrom, 2005]. ............................................................................................................. 37
Figure 5-3. Principal planes of stress [Hoek & Brown, 1982]. ............................................ 38
Figure 5-4. Stress ratio k0 as a function of depth and horizontal Young´s modulus Eh. Based on Sheorey´s equation [Hoek & Brown, 1982]. ........................................................ 39
Figure 5-5. The deformation in the rock mass surrounding an advancing tunnel [Hoek, 2007]. .................................................................................................................................. 41
Figure 5-6. Influence of excavation orientation upon the formation of unstable wedges in rock masses containing major structural discontinuities [Hoek & Brown 1982]. ............... 42
Figure 6-1. Strain/stress curves for brittle and ductile failure [Edelbro, 2003]. ................. 43
Figure 6-2. Mohr-Coulomb criterion in terms of a) principal stresses and b) normal and shear stresses [Edelbro, 2003]. ............................................................................................ 44
Figure 6-3. Triaxial failure tests and the determination of the failure line and yield zone represented on p´,q-diagram. σt is not correctly positioned on this diagram [Andersen, 1995]. .................................................................................................................................. 45
Figure 6-4. The display screen in the software program RocLab. ..................................... 48
Figure 6-5. Definition of angle of dilation ψ [Wood, 1990]. ............................................... 49
Figure 7-1. Rock structure rating. Parameter A: General area geology ............................ 53
Figure 7-2. Rock structure rating. Parameter B: Joint pattern, direction of driver. ......... 53
Figure 7-3. Rock structure rating. Parameter C: Groundwater and joint condition. ........ 54
Figure 7-4. Estimated support categories based on the Q-system [Barton, 2002]. ............ 57
Figure 7-5. Limitations in the Q-system rock support diagram [Palmstrom, 2002]. .......... 58
Figure 7-6. Geological strength index for weaker heterogeneous rock masses [Hoek and Marinos, 2000]. ................................................................................................................... 59
Figure 7-7. Geological strength index for jointed rocks [Hoek and Marinos, 2000]. .......... 60
Figure 7-8. Degradation of block volume and joint surface condition from peak to residual state [Cai & Kaiser, 2006]. ................................................................................................. 61
Figure 7-9. Common correlation between Q and RMR [Bieniawski, 1989]. ....................... 63
Figure 8-1. Schematic figure of rockbolting in roof. Also shows the interlocking effect rockbolting has on individual blocks [Luo, 1999]. .............................................................. 67
Figure 8-2. Systematic bolting in tunnel roof. [Norconsult, 2009]. .................................... 67
Master’s Thesis List of Figures
Hallgrímur Örn Arngrímsson xv DTU-Byg, HÍ 2009 Þorri Björn Gunnarsson
Figure 8-3. Types of rockbolts: end-anchored (top left), grouted (top right), combination (bottom left) and frictional (bottom right). [Norconsult, 2009]. ........................................ 68
Figure 8-4. Pre-cast concrete support sections [Post-Gazette, 2008 ]. ............................... 70
Figure 8-5. Pressure relief of the rock mass after excavation and the influence of lining stiffness on predicted lining pressure [Mair, 2008]. ............................................................ 71
Figure 8-6. Ground reaction curve for different GSI values [C.Carranza-Torres & C. Fairhurst, 2000]. ................................................................................................................. 71
Figure 9-1. Map overview of Búðarháls area [Hönnun, 2001]. ........................................... 73
Figure 9-2. Búðarháls hydropower project, overview with borehole locations [Hönnun, 2001]. .................................................................................................................................. 75
Figure 9-3. Longitudinal cross-section of Búðarháls and the location of some bore holes. Light brown; pillow lava, green; normal magnetised basalt, blue; reversely magnetised basalt, pink; sedimentary rock, brown; altered olivine basalt, light blue, rhyolite [Hönnun, 2001]. Figure is also shown in appendix 2. ......................................................................... 76
Figure 9-4. Headrace tunnel cross-section with possible rock bedding [Hönnun, 2001]. .... 78
Figure 9-5. Excavation at Búðarháls intake, height approximately 15 m [Gunnarsson photo, 2009]. ....................................................................................................................... 80
Figure 9-6. Excavation at Búðarháls Power Station foundation, sprayed concrete on walls [Gunnarsson photo, 2009]. .................................................................................................. 81
Figure 9-7. Excavation at Búðarháls Power Station foundation, note the small columnar joints, sprayed concrete and rockbolts [Gunnarsson photo, 2009]. .................................... 81
Figure 10-1. Core samples measured. ................................................................................. 84
Figure 10-2. Core sample cut in diamond disc saw. ........................................................... 84
Figure 10-3. Final preparation of samples. ......................................................................... 84
Figure 10-4. Samples marked. ............................................................................................ 85
Figure 10-5. Cut of waste away during sawing of samples. ............................................... 85
Figure 10-6: Workshop at GEO. ........................................................................................ 85
Figure 10-7. Samples being saturated in water. ................................................................. 86
Figure 10-8. Test setup for Brazil test, includes a loading frame, a data logger, a load cell, a vertical strain gauge and a computer. ............................................................................. 87
Figure 10-9. Sample placed in between the two jaws and ready for testing. .................... 87
Figure 10-10. The test setup for the uniaxial compression test. ....................................... 88
Figure 10-11. The MTS rock mechanic test system 815 at DTU used in the triaxial tests. ........................................................................................................................................... 89
Figure 10-12. Seen inside the triaxial testing cell. ............................................................ 89
Figure 10-13. Sample has been prepared for triaxial testing. ........................................... 89
Figure 10-14. Time vs. axial stress during triaxial test on sample no. 23. ........................ 91
Master’s Thesis List of Figures
Hallgrímur Örn Arngrímsson xvi DTU-Byg, HÍ 2009 Þorri Björn Gunnarsson
Figure 10-15. Stress vs. strain during triaxial test on sample no. 23. ................................ 91
Figure 10-16. Bulk density vs. tensile strength. ................................................................. 95
Figure 10-17. Bulk density vs. unconfined compression strength. .................................... 95
Figure 10-18. Bulk density vs. E-modulus. ....................................................................... 96
Figure 10-19. Sample results plotted on a p´ vs. q diagram. ............................................ 97
Figure 10-20. Results for phi and c’ calculated from all the test results on the p´-q diagram. ............................................................................................................................. 97
Figure 10-21. Difference between calculation methods for finding phi’ calculated from p´-q diagram and the Madland procedure. ................................................................................ 98
Figure 10-22. Unconfined compression test results on various Icelandic rock types. ......... 99
Figure 10-23. Brazil test results on various Icelandic rock types. ...................................... 99
Figure 10-24. E-modulus for various Icelandic rock types. ............................................... 100
Figure 11-1. Entire profile made from Rhyolite. ............................................................... 106
Figure 11-2. Deepest profile in tunnel (200 m). Layers are (from bottom up): Altered olivinie tholeiite, scoria, sandstone and conglomerate. ..................................................... 107
Figure 11-3. Typical Icelandic mixed-face tunnel with layers of basalt (green), vesicular basalt (light green), scoria (red) and sandstone (yellow). ................................................. 108
Figure 11-4. Load splitting test, rock mass in cross-section 2 takes up 70 % of loads before support is installed. Maximum displacement is 49 mm. The grey line on the figure shows the tunnel displacement (multiplied by a factor of 100) ................................................... 110
Figure 11-5. A strength factor figure showing example of failure in stage 1, the lighter color next to the excavation wall indicates stress release in the rock and that it has started to cave in. ............................................................................................................. 116
Figure 11-6. Force in an individual bolt from the deepest cross-section. .......................... 117
Figure 11-7. Strength factor for RSC 3 base GSI (rhyolite cross-section). ....................... 119
Figure 11-8. Strength factor for RSC 3 min GSI (rhyolite cross-section). ........................ 119
Figure 11-9. Total displacement for RSC 3 base GSI, max displacement 16 mm (rhyolite cross-section). .................................................................................................................... 120
Figure 11-10. Total displacement for RSC 3 with min GSI, max displacement 18 mm (rhyolite cross-section). ..................................................................................................... 120
Figure 11-11. Strength factor for RSC 3 base GSI (deepest cross-section). ...................... 122
Figure 11-12. Strength factor for RSC 3 min GSI (deepest cross-section). ....................... 122
Figure 11-13 Total displacement for RSC 3 base GSI, max displacement is 26 mm (deepest cross-section). ...................................................................................................... 123
Figure 11-14. Total displacement for RSC 3 min GSI, max displacement is 23 mm (deepest cross-section). ...................................................................................................... 123
Figure 11-15. Strength factor for RSC 3 base GSI (typical cross-section). ....................... 125

Master’s Thesis
Hallgrímur Örn Arngrímsson xvii DTU-Byg, HÍ 2009 Þorri Björn Gunnarsson
Figure 11-16. Strength factor for RSC 3 min GSI (typical cross-section). ........................ 125
Figure 11-17. Total displacement for RSC 3 base GSI, max displacement is 15 mm (typical cross-section). ....................................................................................................... 126
Figure 11-18. Total displacement for RSC 3 min GSI, max displacement is 15 mm (typical cross-section). .................................................................................................................... 126

Master’s Thesis List of Tables
Hallgrímur Örn Arngrímsson xix DTU-Byg, HÍ 2009 Þorri Björn Gunnarsson
LIST OF TABLES
Table 2-1. Igneous rock (tholeiitic series) classification based on SiO2 content and solidification [Einarsson, 1994]. ............................................................................................ 9
Table 2-2. The volcanic rock types which make up the three igneous rock series of Iceland [Jakobsson, Jónasson & Sigurðsson, 2008]. ........................................................................ 11
Table 2-3. Icelandic basalt classified according to rock engineering properties [Jónsson, 1996] ................................................................................................................................... 13
Table 4-1. Typical geotechnical properties of Icelandic rock [Guðmundsson, Jóhannesson, & Harðarson, 1991]. UCS is uniaxial compression strength, Q value is based on the Q-system developed by the Norwegian Geotechnical Institute, DRI stands for drilling rate index and BWI is bit wear index. ...................................................................................... 32
Table 5-1. Some main methods for measuring block size [Palmstrom, 2005]. ................... 36
Table 5-2. Degree of jointing based on Jv method [Palmstrom, 2005]............................... 37
Table 5-3. Stability problems with increasing depth [Hoek & Brown, 1982]. .................... 40
Table 7-1. Categories for rock mass quality designation. ................................................... 52
Table 7-2. Parameters in Rock Mass Rating system [Bieniawski, 1989]. ........................... 55
Table 8-1. Advantages and disadvantages of dry and wet mix shotcrete [Erlingsson, 2007]. ........................................................................................................................................... 65
Table 9-1. Changes in rock types during excavation of Búðarháls tunnel [Hönnun, 2001]. ........................................................................................................................................... 77
Table 9-2. Rock Support Classes RSC 1 - 4 used in Búðarháls tunnels [Contract documents BUD-01, 2009], [Hönnun, 2001]. ...................................................................... 79
Table 10-1. Results from Uniaxial compression strength & Brazil tests. ........................... 94
Table 10-2. Rupture and calculated values from the triaxial tests. ................................... 96
Table 10-3. Results for the RocLab parameters σci and mi compared to other published values. ............................................................................................................................... 103
Table 11-1. Field stress values that were used in the analysis. ........................................ 109
Table 11-2. UCS and Elastic modulus values that were used in the analysis. For comparison, average and minimum values from the laboratory research are shown in columns 2 and 3 in the table. ............................................................................................ 111
Table 11-3. GSI values that were used in the analysis. .................................................... 111
Table 11-4. Poisson´s ratio values that were used in the analysis.................................... 112
Table 11-5. Hoek-Brown material parameters (Peak and residual) for average GSI. ....... 112
Table 11-6. Hoek-Brown material parameters (Peak and residual) for minimum GSI. .... 113
Table 11-8. Material parameters for shotcrete in the analysis. ......................................... 114

Master’s Thesis List of Tables
Hallgrímur Örn Arngrímsson xx DTU-Byg, HÍ 2009 Þorri Björn Gunnarsson
Table 11-9. Material parameters for the rockbolts in the analysis. .................................. 114
Table 11-10. Results from rhyolite model analysis. Displacement is in m. ....................... 117
Table 11-11. Results from the deepest cross-section. Displacement is in m. .................... 121
Table 11-12. Results for typical Icelandic tunnel section. ................................................. 124
Master’s Thesis Introduction
Hallgrímur Örn Arngrímsson 1 DTU-Byg, HÍ 2009 Þorri Björn Gunnarsson
1 INTRODUCTION
Tunneling conditions in Iceland are highly varied. The Icelandic stratum is generally built up of thin layers that can be of different origin with diverse rock mechanical properties. Most interesting in tunneling are weak layers that can cause challenges during excavation and abnormal or special geological conditions that require further research. In Iceland weak layers include scoria, sedimentary rock and highly altered rock. Special geological conditions are for example in and around central volcanoes where acidic rock is common.
The Icelandic national power company, Landsvirkjun, is planning an 80 MW hydropower station in Búðarháls, located in south Iceland. The station will fulfill increasing demand for electric energy for industrial and private use and increase the productivity from the water resources in the Þjórsá area. A 4 km headrace tunnel will lead the water from the intake reservoir to the power station. The tunnel will be excavated through different rock and soil layers which present a wide variety of challenges in supporting the tunnel. Some of the materials, most notably rhyolite and altered olivine tholeiite, have not been tested extensively in Iceland and therefore not much is known about their rock mechanical properties. Rhyolite is not common in Iceland but is found in specific locations and it is therefore interesting to extend knowledge on it and the other materials.
The aim of this research project is to gather information on rock mechanical properties in Búðarháls and use the results to estimate the required rock support in the tunnel excavation. Samples from borehole cores will be tested in Brazil, Uniaxial compression and Triaxial compression tests to find rock mechanical properties for rock types in Búðarháls. These properties will then be used to model different tunnel cross-sections using a finite element numerical analysis program, called Phase2 and the support required for the tunnel will be estimated. The program is based on the Hoek-Brown failure criterion which uses a rock mass classification system called the Geological Strength Index (GSI). The tunnel in Búðarháls has been designed using rock support classes determined by the Q-system, which is mostly used in Iceland. The tunnel will be analyzed based on the rock support class design and rock mechanical properties determined from laboratory tests. Various rock mass properties using different GSI values will be compared.
The project report consists of 13 chapters and 6 appendices out of which chapters 2-8 are condensed introduction to specific topics and theory. Chapters 9-13 consist of project investigations, main results from laboratory testing and results from numerical analysis modeling. Appendices contain all results and supplementary literature.

Master’s Thesis Geological history of Iceland
Hallgrímur Örn Arngrímsson 3 DTU-Byg, HÍ 2009 Þorri Björn Gunnarsson
2 GEOLOGICAL HISTORY OF ICELAND
Iceland is located north on the Mid-Atlantic ridge in the rift plate boundary between the Eurasian and North American plates. It rose from the sea 24 million years ago through multiple volcanic eruptions with lava from the mantle generated by the constant movement of the two plates in opposite directions. Since it first surfaced, volcanic activity has been continuous producing multiple volcanic rock layers. The Icelandic bedrock is built up of these layers, interspaced with sedimentary layers.
2.1 THE CREATION OF ICELAND
The Cenozoic Era is the youngest, ongoing era in the geological history of the world and it is divided between two periods, Tertiary and Quaternary. The Tertiary period spans most of the Cenozoic era which began about 65 million years ago (mya) and the Quaternary period which started 3,1 mya and continues to present day. The Tertiary period has five epochs, Paleocene, Eocene, Oligocene, Miocene and Pliocene. The Quaternary period has two epochs, Pleistocene and Holocene. The geological history of Iceland takes place in the Neogene period which consist of the late Tertiary- (Miocene and Pliocene) and the Quaternary periods.
The plate tectonic theory states that during the Mesozoic Era (221-65 mya) the N-Atlantic Ocean did not exist and Greenland, Scandinavia and Great Britain where joined in a massive continental plate. In the beginning of the Tertiary period (65 mya) the countries split up and drifted apart, forming the Atlantic Ocean. The Mid Atlantic Ridge was formed producing volcanic eruptions which can be seen e.g. in N-Ireland, E-Greenland, W-Greenland and Baffin Island [Einarsson, 1994]. The movement of the two plates on each side of the ridge is about 10±0,5 mm each year [Árnadóttir, Geirsson & Jiang, 2008].
The Mid Atlantic Ridge produces igneous rock, mostly basalts, directly from the mantel. When lava emerges from underwater volcanic vents the main rock type formed is pillow lava. When the build up of pillow lava is large enough it forms islands like Iceland. The high volcanic activity in Iceland has been explained by a mantle plume or hot spot situated under the island [Vink, 1984].
The geological formation of Iceland in the Tertiary period is characterized by build up of multible lava layers. Sedimentary rock and organic fossils are found in between the lava layers which suggests that the volcanic activity was not constant. The temperature was about 10°C higher than today and vegetation was mainly leaf trees and forests similar to present day Eastern USA. The Tertiary layers which are found on the west and east cost
Master’s Thesis Geological history of Iceland
Hallgrímur Örn Arngrímsson 4 DTU-Byg, HÍ 2009 Þorri Björn Gunnarsson
of Iceland are tilted a few degrees inland to the rift boundary because of tectonic plate isostasy and movement.
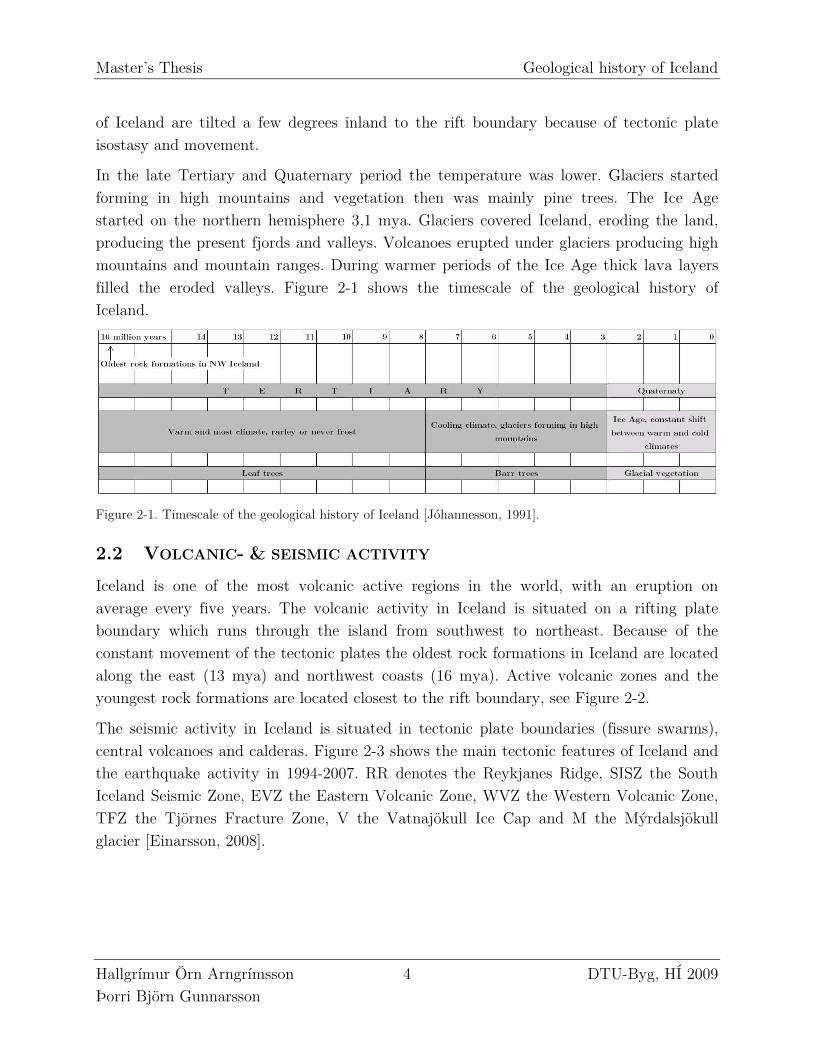
In the late Tertiary and Quaternary period the temperature was lower. Glaciers started forming in high mountains and vegetation then was mainly pine trees. The Ice Age started on the northern hemisphere 3,1 mya. Glaciers covered Iceland, eroding the land, producing the present fjords and valleys. Volcanoes erupted under glaciers producing high mountains and mountain ranges. During warmer periods of the Ice Age thick lava layers filled the eroded valleys. Figure 2-1 shows the timescale of the geological history of Iceland.
Figure 2-1. Timescale of the geological history of Iceland [Jóhannesson, 1991].
2.2 VOLCANIC- & SEISMIC ACTIVITY
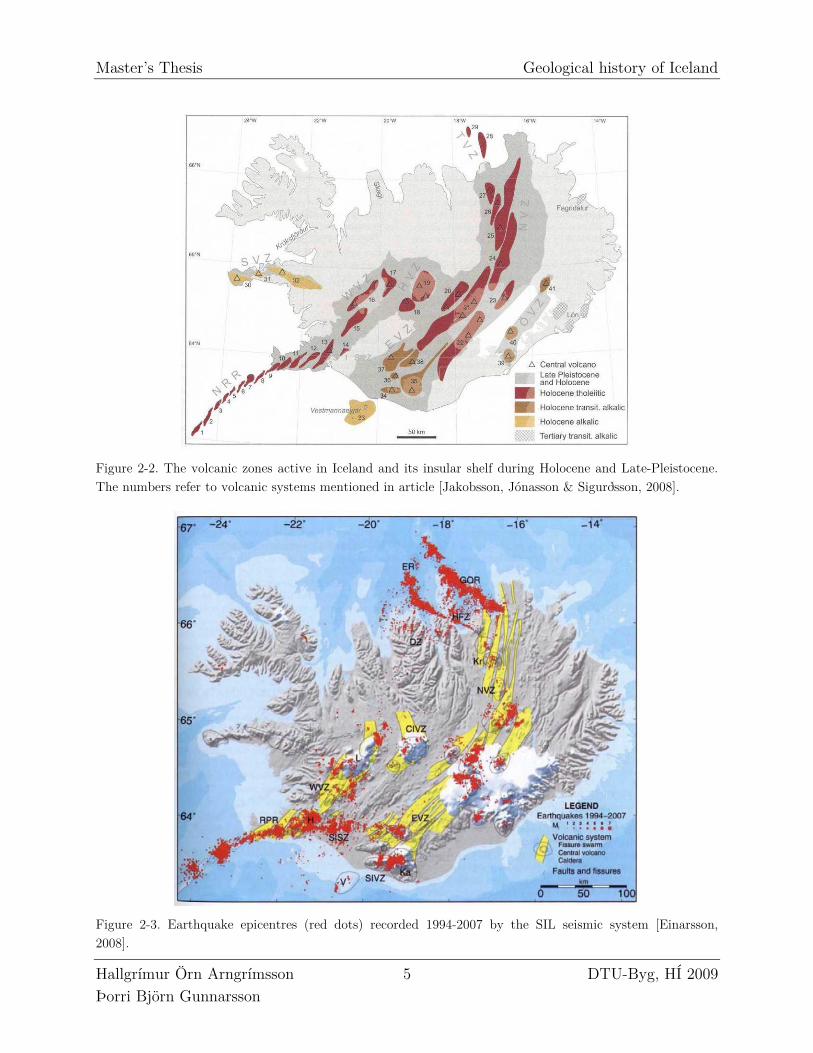
Iceland is one of the most volcanic active regions in the world, with an eruption on average every five years. The volcanic activity in Iceland is situated on a rifting plate boundary which runs through the island from southwest to northeast. Because of the constant movement of the tectonic plates the oldest rock formations in Iceland are located along the east (13 mya) and northwest coasts (16 mya). Active volcanic zones and the youngest rock formations are located closest to the rift boundary, see Figure 2-2.
The seismic activity in Iceland is situated in tectonic plate boundaries (fissure swarms), central volcanoes and calderas. Figure 2-3 shows the main tectonic features of Iceland and the earthquake activity in 1994-2007. RR denotes the Reykjanes Ridge, SISZ the South Iceland Seismic Zone, EVZ the Eastern Volcanic Zone, WVZ the Western Volcanic Zone, TFZ the Tjörnes Fracture Zone, V the Vatnajökull Ice Cap and M the Mýrdalsjökull glacier [Einarsson, 2008].
Master’s Thesis Geological history of Iceland
Hallgrímur Örn Arngrímsson 5 DTU-Byg, HÍ 2009 Þorri Björn Gunnarsson
Figure 2-2. The volcanic zones active in Iceland and its insular shelf during Holocene and Late-Pleistocene. The numbers refer to volcanic systems mentioned in article [Jakobsson, Jónasson & Sigurðsson, 2008].
Figure 2-3. Earthquake epicentres (red dots) recorded 1994-2007 by the SIL seismic system [Einarsson, 2008].
Master’s Thesis Geological history of Iceland
Hallgrímur Örn Arngrímsson 6 DTU-Byg, HÍ 2009 Þorri Björn Gunnarsson
2.3 CENTRAL VOLCANOES
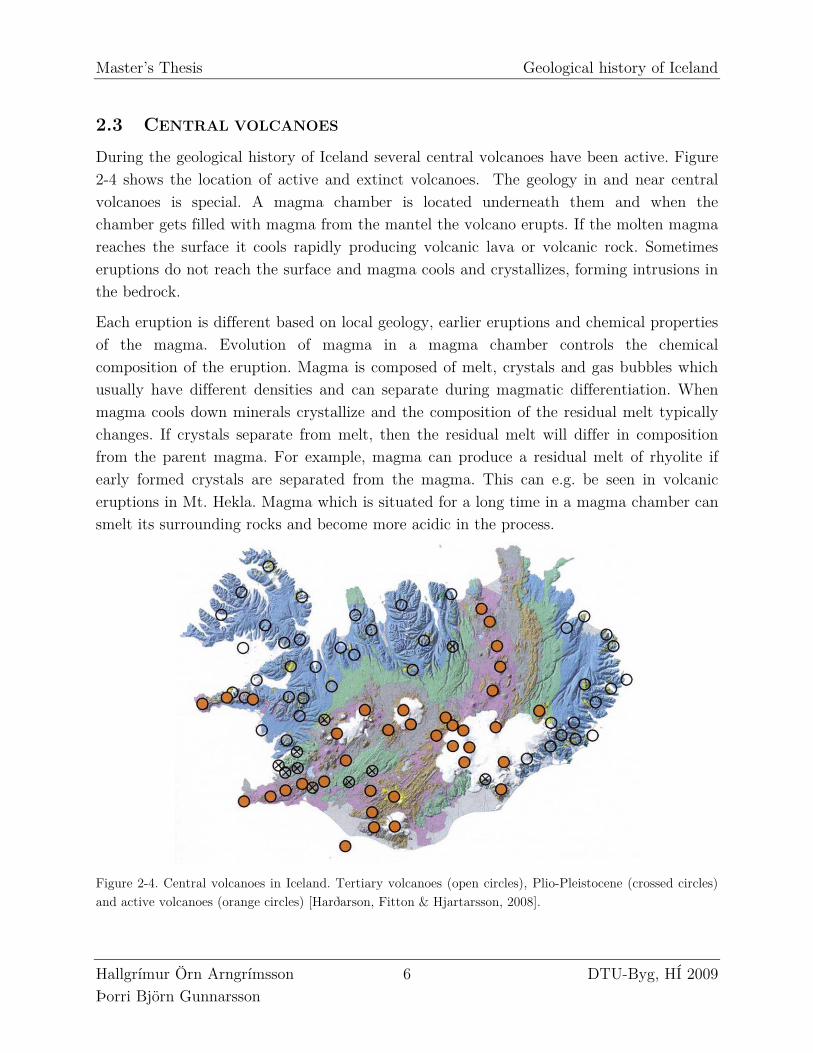
During the geological history of Iceland several central volcanoes have been active. Figure 2-4 shows the location of active and extinct volcanoes. The geology in and near central volcanoes is special. A magma chamber is located underneath them and when the chamber gets filled with magma from the mantel the volcano erupts. If the molten magma reaches the surface it cools rapidly producing volcanic lava or volcanic rock. Sometimes eruptions do not reach the surface and magma cools and crystallizes, forming intrusions in the bedrock.
Each eruption is different based on local geology, earlier eruptions and chemical properties of the magma. Evolution of magma in a magma chamber controls the chemical composition of the eruption. Magma is composed of melt, crystals and gas bubbles which usually have different densities and can separate during magmatic differentiation. When magma cools down minerals crystallize and the composition of the residual melt typically changes. If crystals separate from melt, then the residual melt will differ in composition from the parent magma. For example, magma can produce a residual melt of rhyolite if early formed crystals are separated from the magma. This can e.g. be seen in volcanic eruptions in Mt. Hekla. Magma which is situated for a long time in a magma chamber can smelt its surrounding rocks and become more acidic in the process.
Figure 2-4. Central volcanoes in Iceland. Tertiary volcanoes (open circles), Plio-Pleistocene (crossed circles) and active volcanoes (orange circles) [Harðarson, Fitton & Hjartarsson, 2008].
Master’s Thesis Geological history of Iceland
Hallgrímur Örn Arngrímsson 7 DTU-Byg, HÍ 2009 Þorri Björn Gunnarsson
2.4 ICELANDIC BEDROCK
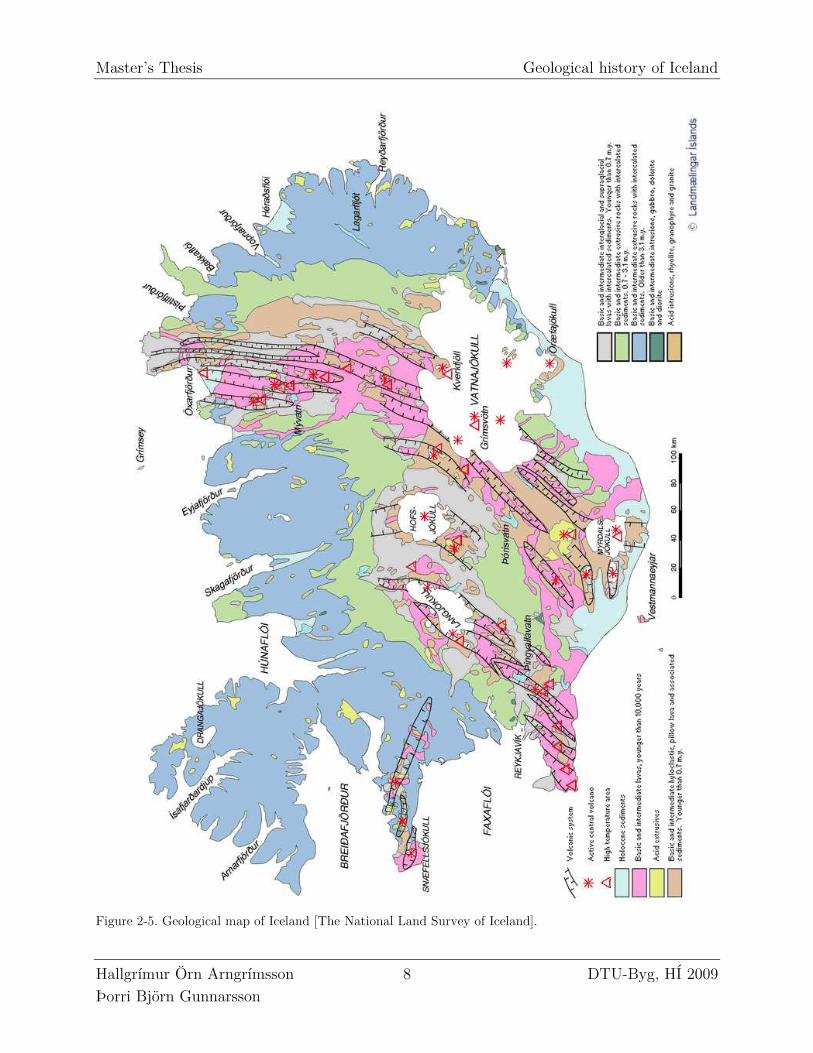
Rocks are grouped in three main rock types, igneous-, sedimentary- and metamorphic rock. Iceland is geologically young and therefore no metamorphic rock is found there, only igneous- and sedimentary rock. The Icelandic bedrock is composed almost entirely of ocean-basalt, with 5-10% acidic and intermediate rocks and 5-10% of sedimentary interbeds. They are generally divided into four main groups: Tertiary plateau basalt formation, Pleistocene basalt formation, Pleistocene hyaloclastic formation and Holocene formations which include postglacial lavas and sediments see Figure 2-5.
The Tertiary bedrock is built up of numerous, extensive and relatively thin basalt lava layers lying on top of each other, often interspaced by very thin sedimentary layers. Lava layer consists of dense basalt in the middle with top and bottom scoria which is composed of basalt fragments, partially glassy and partially crystalline forming a porous breccia. The rock has irregular columnar joint pattern resulted by cooling. The sedimentary rocks are mostly composed of thin, fine grained tuffaceous interbeds and occasional thicker conglomerates (rock consisting of individual stones that have become cemented together), see detailed figure in appendix 1. The Pleistocene hyaloclastite formation consists of fine grained stratified tuffs, glassy fragmented breccia, pillow lava and irregular jointed basalts. The sedimentary rocks are abundant because of glacial erosion. They consist of sandstone and conglomerates of glacial origin and fine-grained tuffaceous interbeds [Harðarsson, 1991].
Master’s Thesis Geological history of Iceland
Hallgrímur Örn Arngrímsson 8 DTU-Byg, HÍ 2009 Þorri Björn Gunnarsson
Figure 2-5. Geological map of Iceland [The National Land Survey of Iceland].
Master’s Thesis Geological history of Iceland
Hallgrímur Örn Arngrímsson 9 DTU-Byg, HÍ 2009 Þorri Björn Gunnarsson
2.4.1 Igneous rocks
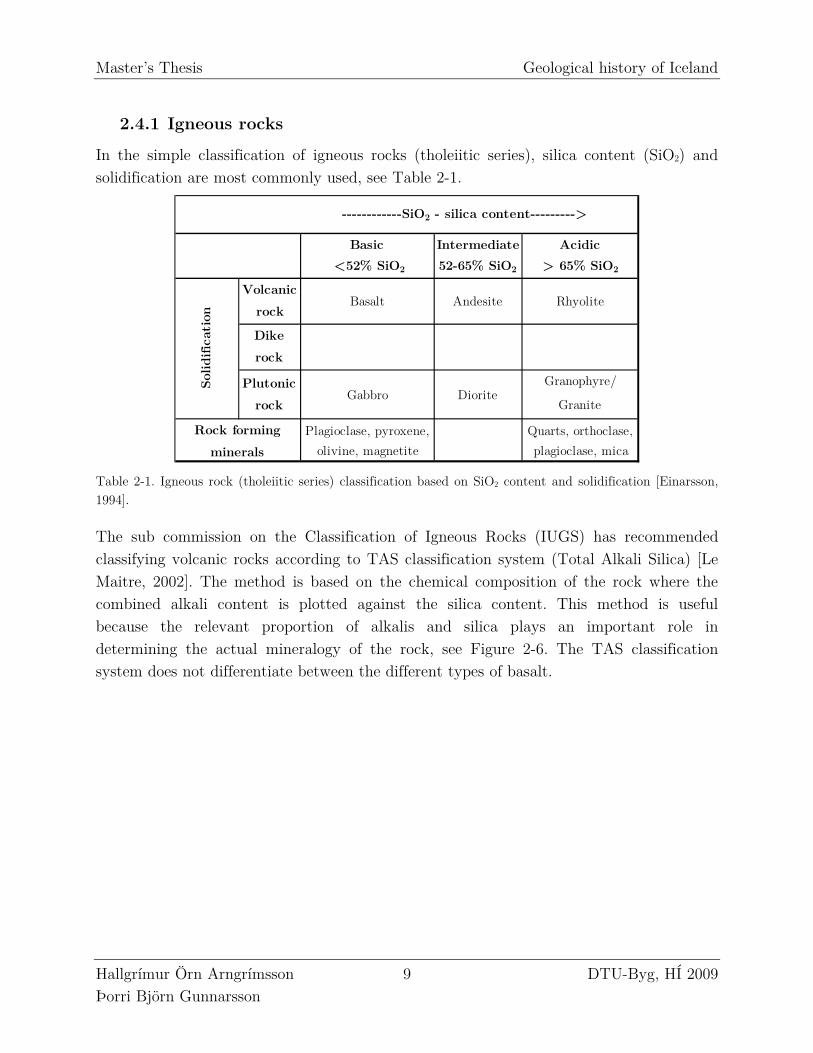
In the simple classification of igneous rocks (tholeiitic series), silica content (SiO2) and solidification are most commonly used, see Table 2-1.
Basic Intermediate Acidic
<52% SiO2 52-65% SiO2 > 65% SiO2
Granophyre/
Granite
Plagioclase, pyroxene,
olivine, magnetite
Quarts, orthoclase,
plagioclase, mica
Rock forming
minerals
Plutonic
rockGabbro Diorite
------------SiO2 - silica content---------> Solidification
Volcanic
rockBasalt Andesite Rhyolite
Dike
rock
Table 2-1. Igneous rock (tholeiitic series) classification based on SiO2 content and solidification [Einarsson, 1994].
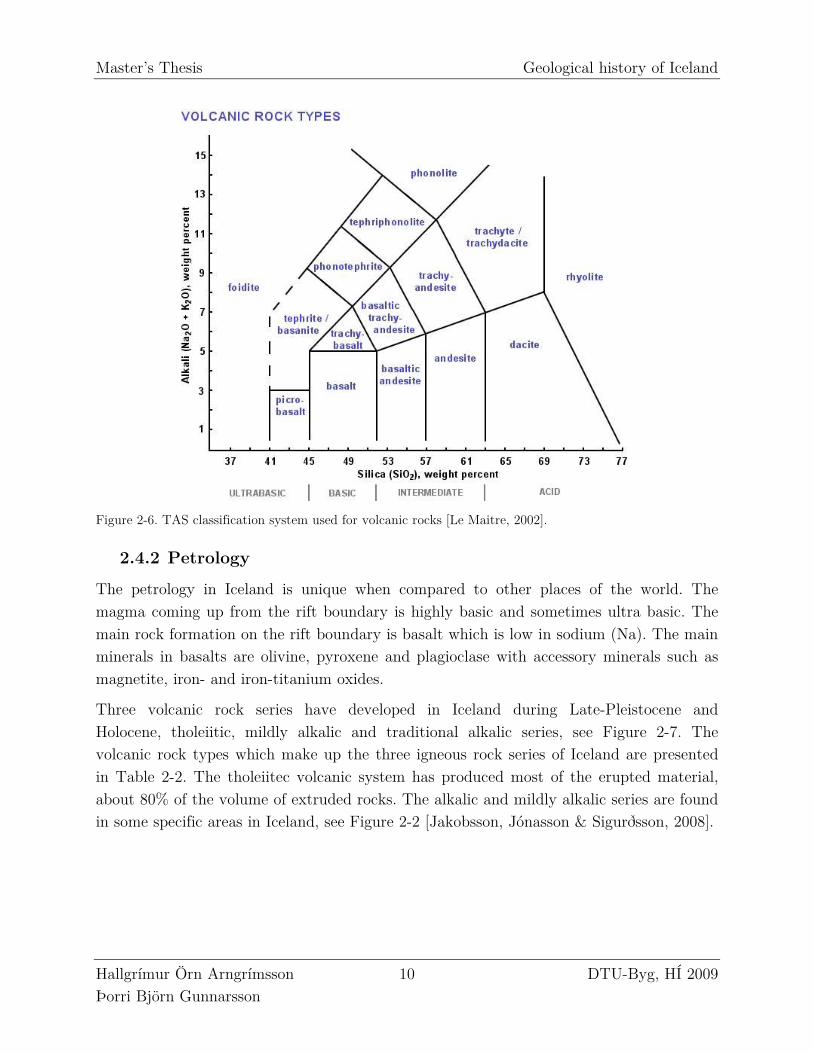
The sub commission on the Classification of Igneous Rocks (IUGS) has recommended classifying volcanic rocks according to TAS classification system (Total Alkali Silica) [Le Maitre, 2002]. The method is based on the chemical composition of the rock where the combined alkali content is plotted against the silica content. This method is useful because the relevant proportion of alkalis and silica plays an important role in determining the actual mineralogy of the rock, see Figure 2-6. The TAS classification system does not differentiate between the different types of basalt.
Master’s Thesis Geological history of Iceland
Hallgrímur Örn Arngrímsson 10 DTU-Byg, HÍ 2009 Þorri Björn Gunnarsson
Figure 2-6. TAS classification system used for volcanic rocks [Le Maitre, 2002].
2.4.2 Petrology
The petrology in Iceland is unique when compared to other places of the world. The magma coming up from the rift boundary is highly basic and sometimes ultra basic. The main rock formation on the rift boundary is basalt which is low in sodium (Na). The main minerals in basalts are olivine, pyroxene and plagioclase with accessory minerals such as magnetite, iron- and iron-titanium oxides.
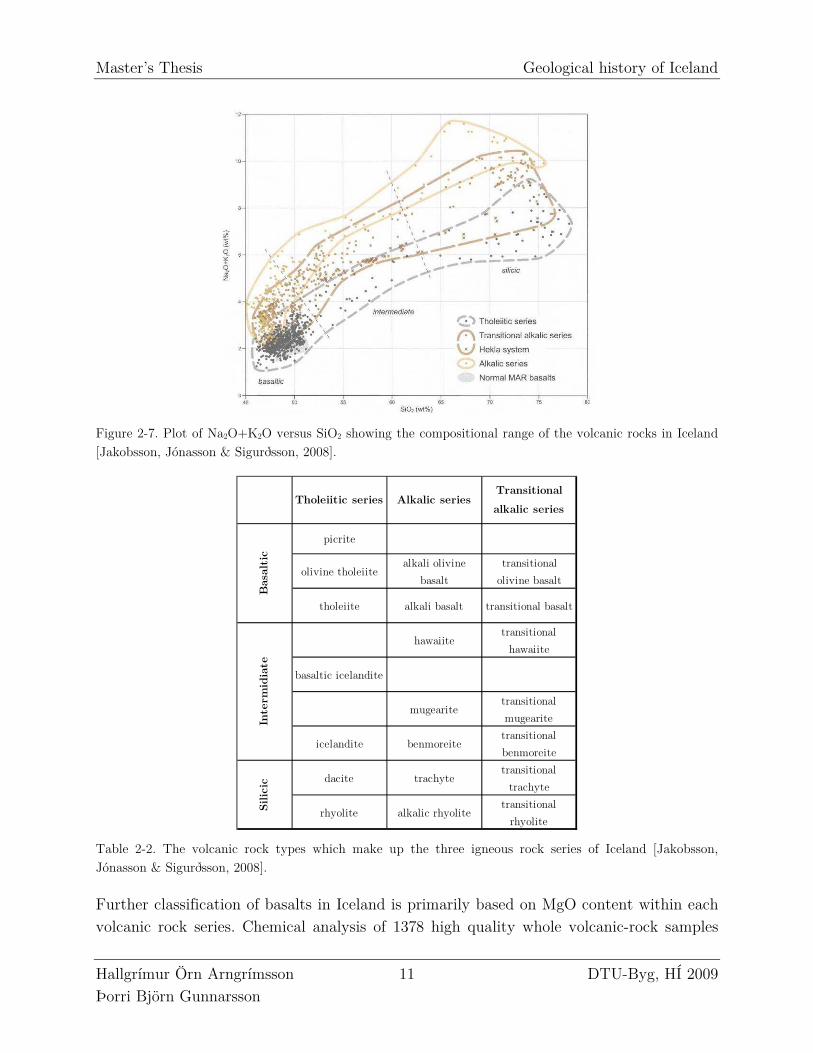
Three volcanic rock series have developed in Iceland during Late-Pleistocene and Holocene, tholeiitic, mildly alkalic and traditional alkalic series, see Figure 2-7. The volcanic rock types which make up the three igneous rock series of Iceland are presented in Table 2-2. The tholeiitec volcanic system has produced most of the erupted material, about 80% of the volume of extruded rocks. The alkalic and mildly alkalic series are found in some specific areas in Iceland, see Figure 2-2 [Jakobsson, Jónasson & Sigurðsson, 2008].
Master’s Thesis Geological history of Iceland
Hallgrímur Örn Arngrímsson 11 DTU-Byg, HÍ 2009 Þorri Björn Gunnarsson
Figure 2-7. Plot of Na2O+K2O versus SiO2 showing the compositional range of the volcanic rocks in Iceland [Jakobsson, Jónasson & Sigurðsson, 2008].
picrite
olivine tholeiitealkali olivine
basalt
transitional
olivine basalt
tholeiite alkali basalt transitional basalt
hawaiitetransitional
hawaiite
basaltic icelandite
mugearitetransitional
mugearite
icelandite benmoreitetransitional
benmoreite
dacite trachytetransitional
trachyte
rhyolite alkalic rhyolitetransitional
rhyolite
Silicic
Tholeiitic series Alkalic seriesTransitional
alkalic series
Basaltic
Interm
idiate
Table 2-2. The volcanic rock types which make up the three igneous rock series of Iceland [Jakobsson, Jónasson & Sigurðsson, 2008].
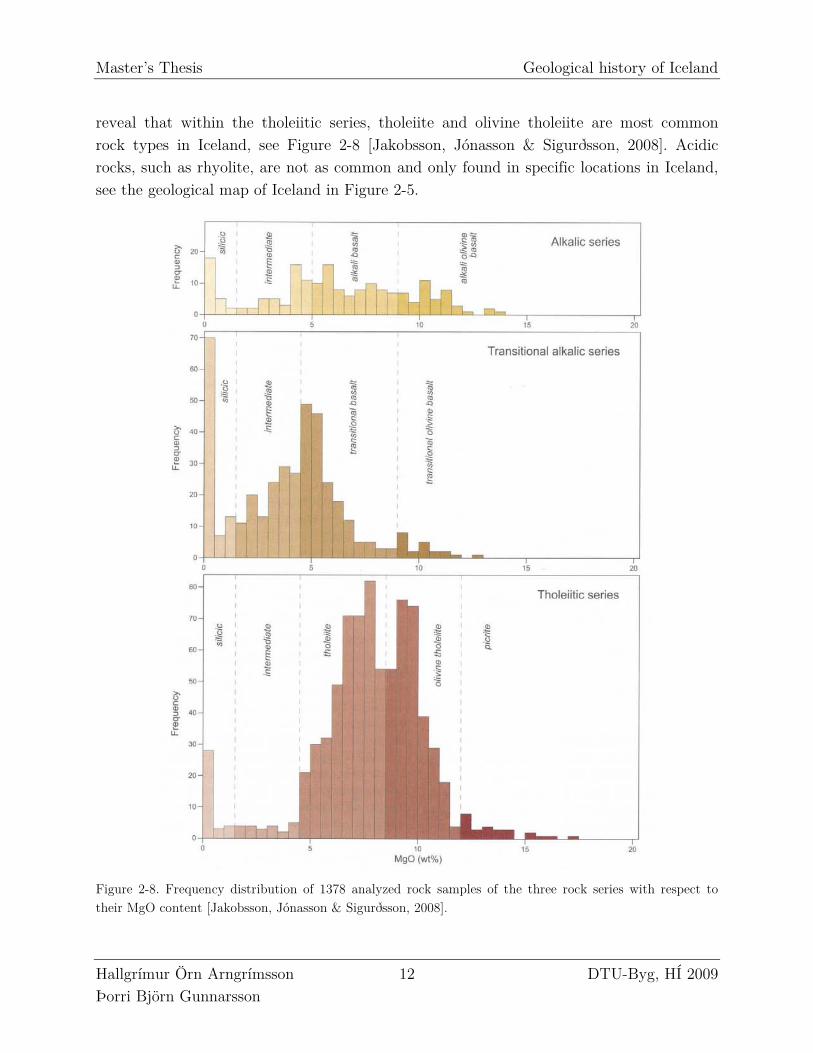
Further classification of basalts in Iceland is primarily based on MgO content within each volcanic rock series. Chemical analysis of 1378 high quality whole volcanic-rock samples
Master’s Thesis Geological history of Iceland
Hallgrímur Örn Arngrímsson 12 DTU-Byg, HÍ 2009 Þorri Björn Gunnarsson
reveal that within the tholeiitic series, tholeiite and olivine tholeiite are most common rock types in Iceland, see Figure 2-8 [Jakobsson, Jónasson & Sigurðsson, 2008]. Acidic rocks, such as rhyolite, are not as common and only found in specific locations in Iceland, see the geological map of Iceland in Figure 2-5.
Figure 2-8. Frequency distribution of 1378 analyzed rock samples of the three rock series with respect to their MgO content [Jakobsson, Jónasson & Sigurðsson, 2008].
Master’s Thesis Geological history of Iceland
Hallgrímur Örn Arngrímsson 13 DTU-Byg, HÍ 2009 Þorri Björn Gunnarsson
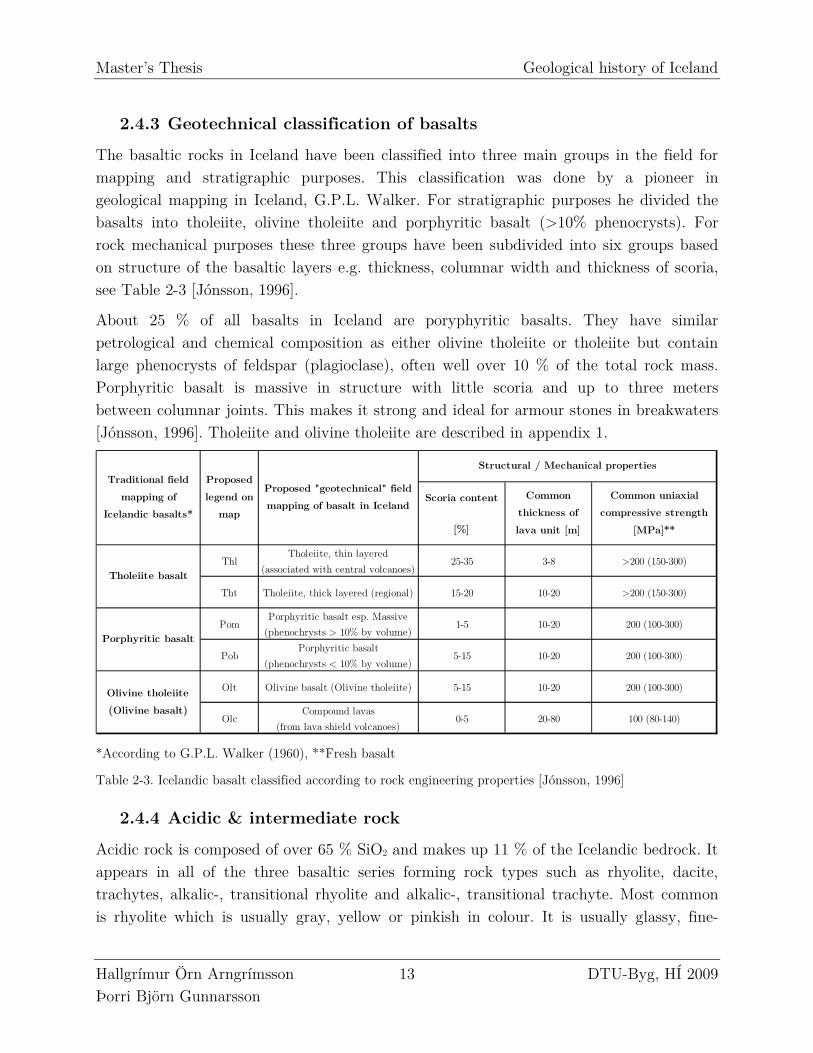
2.4.3 Geotechnical classification of basalts
The basaltic rocks in Iceland have been classified into three main groups in the field for mapping and stratigraphic purposes. This classification was done by a pioneer in geological mapping in Iceland, G.P.L. Walker. For stratigraphic purposes he divided the basalts into tholeiite, olivine tholeiite and porphyritic basalt (>10% phenocrysts). For rock mechanical purposes these three groups have been subdivided into six groups based on structure of the basaltic layers e.g. thickness, columnar width and thickness of scoria, see Table 2-3 [Jónsson, 1996].
About 25 % of all basalts in Iceland are poryphyritic basalts. They have similar petrological and chemical composition as either olivine tholeiite or tholeiite but contain large phenocrysts of feldspar (plagioclase), often well over 10 % of the total rock mass. Porphyritic basalt is massive in structure with little scoria and up to three meters between columnar joints. This makes it strong and ideal for armour stones in breakwaters [Jónsson, 1996]. Tholeiite and olivine tholeiite are described in appendix 1.
Scoria content
[%]
ThlTholeiite, thin layered
(associated with central volcanoes)25-35 3-8 >200 (150-300)
Tht Tholeiite, thick layered (regional) 15-20 10-20 >200 (150-300)
PomPorphyritic basalt esp. Massive
(phenochrysts > 10% by volume)1-5 10-20 200 (100-300)
PobPorphyritic basalt
(phenochrysts < 10% by volume)5-15 10-20 200 (100-300)
Olt Olivine basalt (Olivine tholeiite) 5-15 10-20 200 (100-300)
OlcCompound lavas
(from lava shield volcanoes)0-5 20-80 100 (80-140)
Structural / Mechanical properties
Common
thickness of
lava unit [m]
Common uniaxial
compressive strength
[MPa]**
Porphyritic basalt
Olivine tholeiite
(Olivine basalt)
Tholeiite basalt
Traditional field
mapping of
Icelandic basalts*
Proposed
legend on
map
Proposed "geotechnical" field
mapping of basalt in Iceland
*According to G.P.L. Walker (1960), **Fresh basalt
Table 2-3. Icelandic basalt classified according to rock engineering properties [Jónsson, 1996]
2.4.4 Acidic & intermediate rock
Acidic rock is composed of over 65 % SiO2 and makes up 11 % of the Icelandic bedrock. It appears in all of the three basaltic series forming rock types such as rhyolite, dacite, trachytes, alkalic-, transitional rhyolite and alkalic-, transitional trachyte. Most common is rhyolite which is usually gray, yellow or pinkish in colour. It is usually glassy, fine-
Master’s Thesis Geological history of Iceland
Hallgrímur Örn Arngrímsson 14 DTU-Byg, HÍ 2009 Þorri Björn Gunnarsson
grained, vesicular and flow banded. The plutonic acidic rocks are called granophyre and granite with granophyre appearing more fine-grained than granite [Einarsson, 1994].
Some rhyolite rocks are structurally weak and have to be distinguished for engineering purposes. “Sound” rhyolite, which is a competent rock in spite of being extremely jointed and flow banded. Altered and decomposed rhyolite can cause squeezing in tunnels. Rhyolitic ash can be several meters thick and badly cemented [Jónsson, 1996].
Intermediate rocks include the volcanic rock andesite and the plutonic rock dacite. Andesite often looks like dense flow-banded tholeiite and displayes similar engineering properties [Jónsson, 1996].
2.4.5 Sub- and intraglacial rock
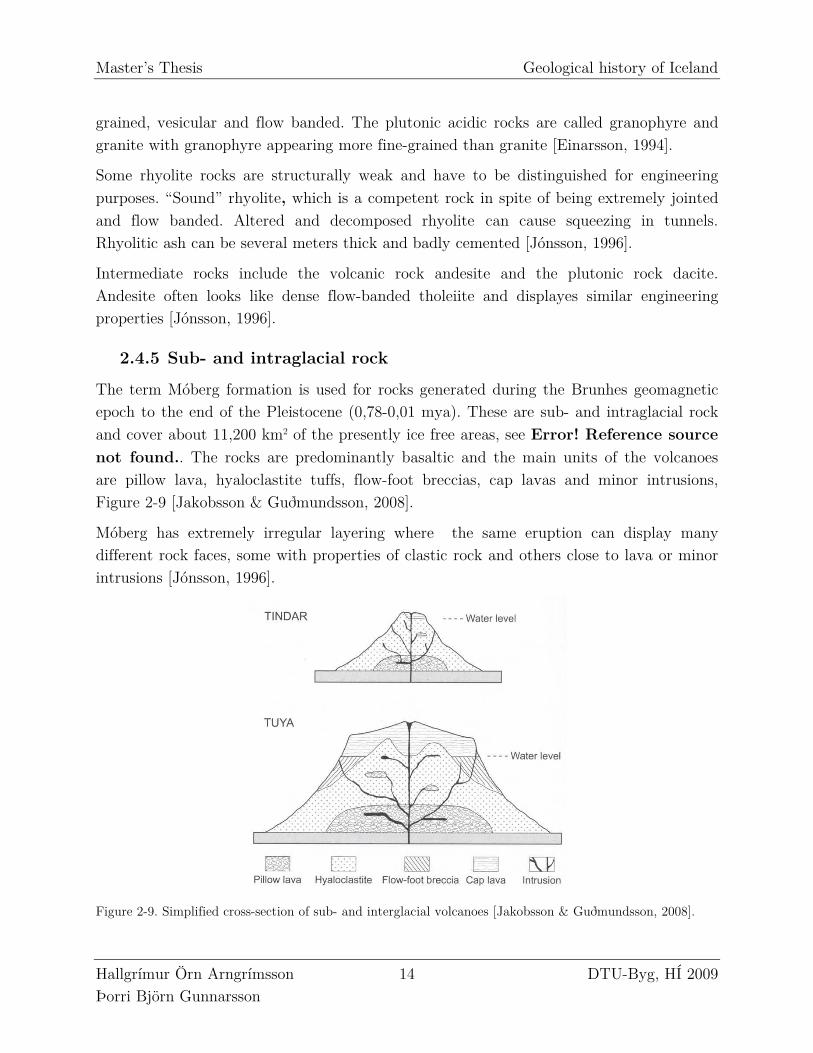
The term Móberg formation is used for rocks generated during the Brunhes geomagnetic epoch to the end of the Pleistocene (0,78-0,01 mya). These are sub- and intraglacial rock and cover about 11,200 km2 of the presently ice free areas, see Error! Reference source not found.. The rocks are predominantly basaltic and the main units of the volcanoes are pillow lava, hyaloclastite tuffs, flow-foot breccias, cap lavas and minor intrusions, Figure 2-9 [Jakobsson & Guðmundsson, 2008].
Móberg has extremely irregular layering where the same eruption can display many different rock faces, some with properties of clastic rock and others close to lava or minor intrusions [Jónsson, 1996].
Figure 2-9. Simplified cross-section of sub- and interglacial volcanoes [Jakobsson & Guðmundsson, 2008].
Master’s Thesis Geological history of Iceland
Hallgrímur Örn Arngrímsson 15 DTU-Byg, HÍ 2009 Þorri Björn Gunnarsson
2.4.6 Sedimentary rock
The bedrock in Iceland only consists of about 5-10% sedimentary rock. The sedimentary rock is formed by the overburden pressure created by the weight of the overlaying materials. It is classified into three groups according to the source of their sediments, Chemical-, Organic- and Clastic sediments. Chemical sediments form when minerals in solution become oversaturated and precipitate. There is little chemical sediment in Iceland, only in mature and current warm water/hot spring areas. Minerals precipitate from the evaporation of water forming evaporation minerals e.g. halite, sulfur and gypsum. Organic sedimentary rocks contain materials generated by living organisms which is rare in Iceland and only found in some specific locations such as Tjörnes.
Clastic sediments are the most common sediments in Iceland and occur as interbeds in the bedrock. They are formed by discrete rock fragments of different sizes and shape by mechanical and chemical weathering. The sediments are mostly made of silt (diameter = 0,004-0,063 mm) and sands (diameter = 0,063-2 mm) forming siltstone and sandstone. Various grain sizes form conglomerate. These are glacial, post-glacial and pre-glacial deposits with thickness ranging from a few centimeters up to around one hundred meters. The gravel size components of conglomerate consist mainly of dense basalt and it is generally good for tunnelling, showing similar strength properties as weak concrete. The siltstone has much lower tensile strength and can cause stability problems especially in tunnel roofs. The reason for this weakness is the alteration of siltstone which can produce swelling clay minerals [Jónsson, 1996].
Other sediments include volcanic ash both of basic and acidic origin, tuffaceous sand- and siltstone and tillite.
2.4.7 Weathering and alteration of rock
Alteration is a chemical weathering process where the chemical or mineralogical composition of a rock is changed, usually produced by oxidation, hydration and solution. Because of the volcanic activity and high geothermal gradient in Iceland, rock alteration is common where the weakest rocks in the bedrock are most vulnerable e.g. siltstone and porous basalt.
Geothermal systems in Iceland are classified into high and low-temperature systems. In low-temperature systems the temperatures are below 150°C in the uppermost 1000 m but >200°C above 1000 m depth in high-temperature systems [Böðvarsson, 1961], [Friðleifsson, 1979]. High temperature systems are located at the plate boundary and near central volcanoes. Because of the plate movements many fossil high-temperature geothermal systems in Tertiary and Early-Quaternary formations have been exhumed by
Master’s Thesis Geological history of Iceland
Hallgrímur Örn Arngrímsson 16 DTU-Byg, HÍ 2009 Þorri Björn Gunnarsson
erosion. Low-temperature systems are widespread and frequently in association with active fractures, faults and dyke intrusions. Hydrothermal alteration can be quite intense, especially in high temperature geothermal systems where the decomposition and alteration of the rock is high.
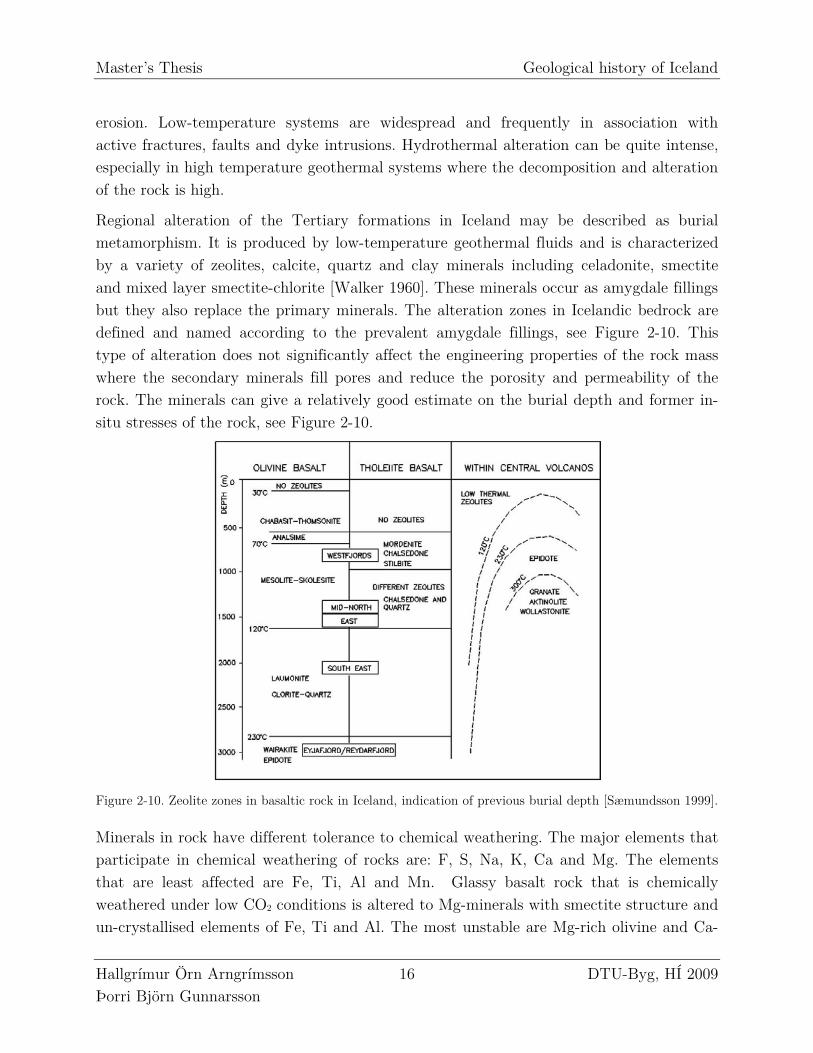
Regional alteration of the Tertiary formations in Iceland may be described as burial metamorphism. It is produced by low-temperature geothermal fluids and is characterized by a variety of zeolites, calcite, quartz and clay minerals including celadonite, smectite and mixed layer smectite-chlorite [Walker 1960]. These minerals occur as amygdale fillings but they also replace the primary minerals. The alteration zones in Icelandic bedrock are defined and named according to the prevalent amygdale fillings, see Figure 2-10. This type of alteration does not significantly affect the engineering properties of the rock mass where the secondary minerals fill pores and reduce the porosity and permeability of the rock. The minerals can give a relatively good estimate on the burial depth and former in-situ stresses of the rock, see Figure 2-10.
Figure 2-10. Zeolite zones in basaltic rock in Iceland, indication of previous burial depth [Sæmundsson 1999].
Minerals in rock have different tolerance to chemical weathering. The major elements that participate in chemical weathering of rocks are: F, S, Na, K, Ca and Mg. The elements that are least affected are Fe, Ti, Al and Mn. Glassy basalt rock that is chemically weathered under low CO2 conditions is altered to Mg-minerals with smectite structure and un-crystallised elements of Fe, Ti and Al. The most unstable are Mg-rich olivine and Ca-

Master’s Thesis Geological history of Iceland
Hallgrímur Örn Arngrímsson 17 DTU-Byg, HÍ 2009 Þorri Björn Gunnarsson
rich plagioclase but the most stable are Fe-Ti oxides. Water, heat and pH-value also affects this process [Gíslason, 2008]. Smectite is a clay mineral prone to large volume changes which are related to changes in water content. Altered basalt can be a good tunnelling rock, if the alteration is not too intense. Moderate alteration can cause some cementing on joint planes and thus enhancing rock stability [Jónsson, 1996].

Master’s Thesis Hydropower Dams in Iceland
Hallgrímur Örn Arngrímsson 19 DTU-Byg, HÍ 2009 Þorri Björn Gunnarsson
3 HYDROPOWER DAMS IN ICELAND
3.1 HISTORY
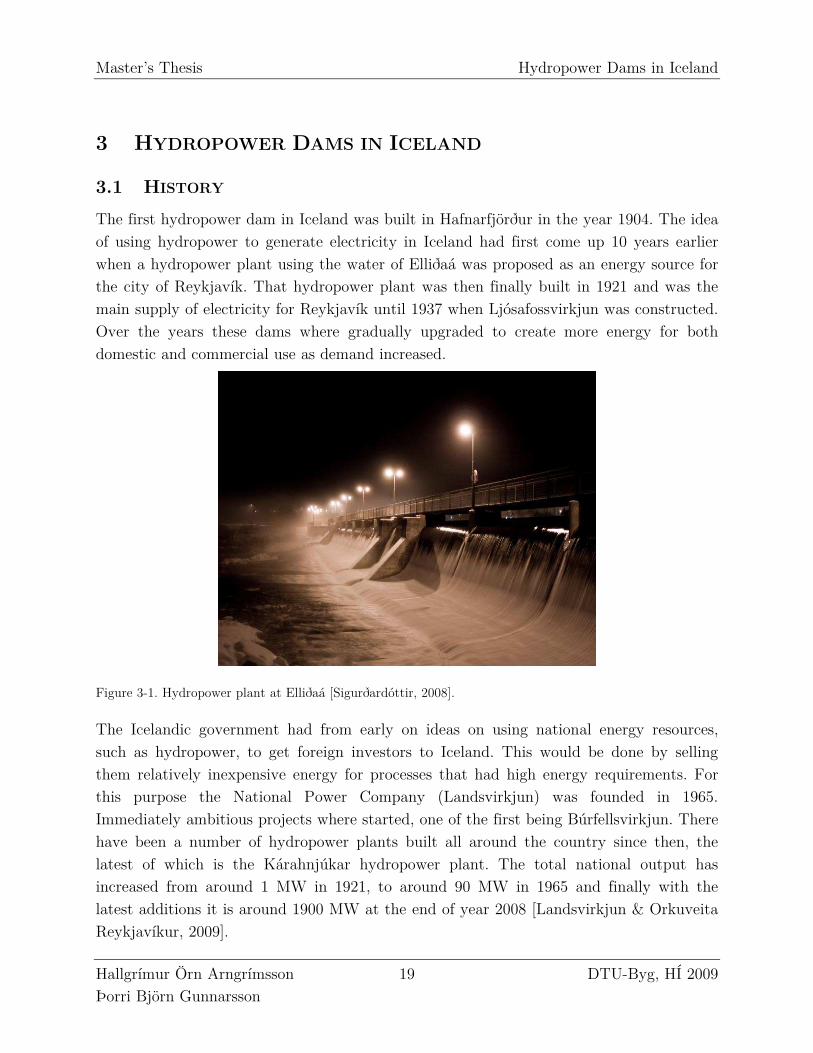
The first hydropower dam in Iceland was built in Hafnarfjörður in the year 1904. The idea of using hydropower to generate electricity in Iceland had first come up 10 years earlier when a hydropower plant using the water of Elliðaá was proposed as an energy source for the city of Reykjavík. That hydropower plant was then finally built in 1921 and was the main supply of electricity for Reykjavík until 1937 when Ljósafossvirkjun was constructed. Over the years these dams where gradually upgraded to create more energy for both domestic and commercial use as demand increased.
Figure 3-1. Hydropower plant at Elliðaá [Sigurðardóttir, 2008].
The Icelandic government had from early on ideas on using national energy resources, such as hydropower, to get foreign investors to Iceland. This would be done by selling them relatively inexpensive energy for processes that had high energy requirements. For this purpose the National Power Company (Landsvirkjun) was founded in 1965. Immediately ambitious projects where started, one of the first being Búrfellsvirkjun. There have been a number of hydropower plants built all around the country since then, the latest of which is the Kárahnjúkar hydropower plant. The total national output has increased from around 1 MW in 1921, to around 90 MW in 1965 and finally with the latest additions it is around 1900 MW at the end of year 2008 [Landsvirkjun & Orkuveita Reykjavíkur, 2009].
Master’s Thesis Hydropower Dams in Iceland
Hallgrímur Örn Arngrímsson 20 DTU-Byg, HÍ 2009 Þorri Björn Gunnarsson
3.2 DESIGN TYPES
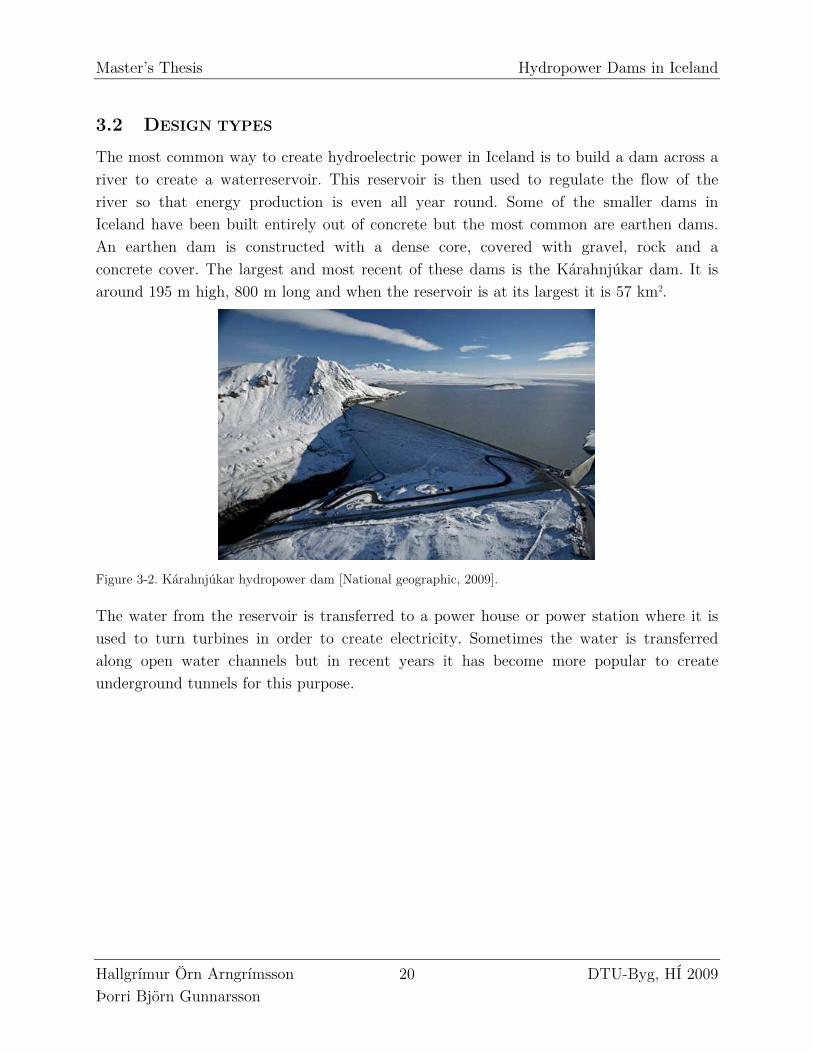
The most common way to create hydroelectric power in Iceland is to build a dam across a river to create a waterreservoir. This reservoir is then used to regulate the flow of the river so that energy production is even all year round. Some of the smaller dams in Iceland have been built entirely out of concrete but the most common are earthen dams. An earthen dam is constructed with a dense core, covered with gravel, rock and a concrete cover. The largest and most recent of these dams is the Kárahnjúkar dam. It is around 195 m high, 800 m long and when the reservoir is at its largest it is 57 km2.
Figure 3-2. Kárahnjúkar hydropower dam [National geographic, 2009].
The water from the reservoir is transferred to a power house or power station where it is used to turn turbines in order to create electricity. Sometimes the water is transferred along open water channels but in recent years it has become more popular to create underground tunnels for this purpose.
Master’s Thesis Hydropower Tunnels in Iceland
Hallgrímur Örn Arngrímsson 21 DTU-Byg, HÍ 2009 Þorri Björn Gunnarsson
4 HYDROPOWER TUNNELS IN ICELAND
4.1 HISTORY
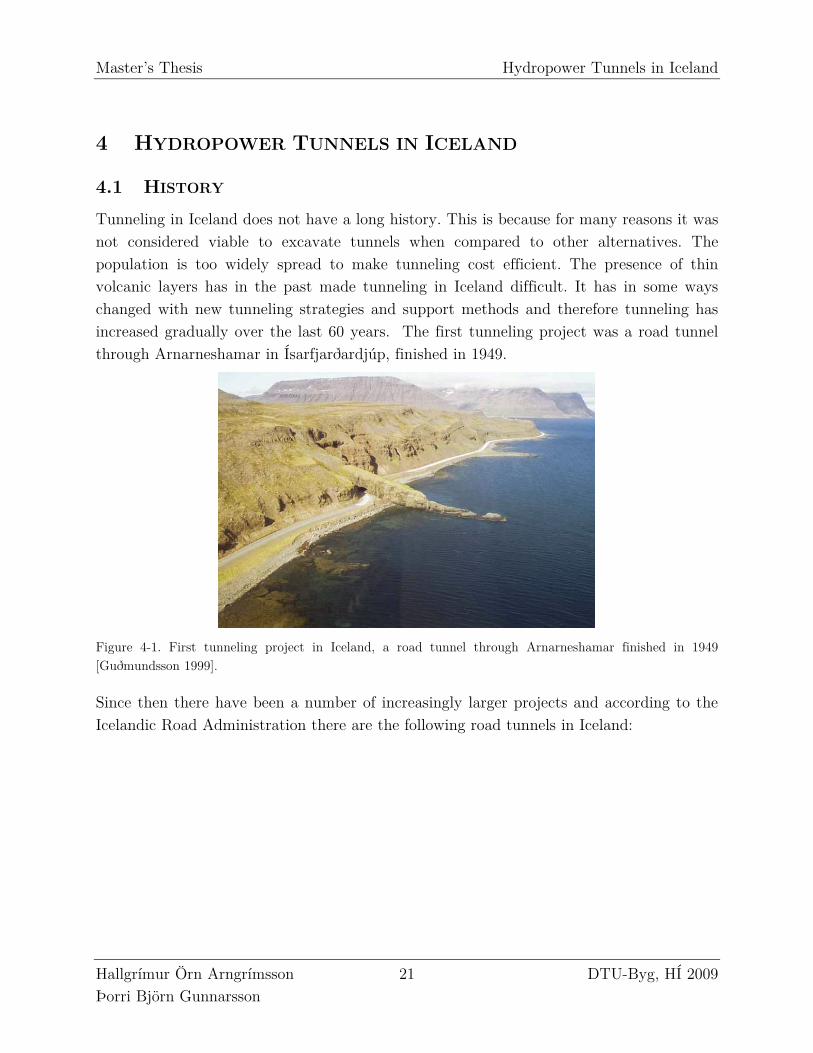
Tunneling in Iceland does not have a long history. This is because for many reasons it was not considered viable to excavate tunnels when compared to other alternatives. The population is too widely spread to make tunneling cost efficient. The presence of thin volcanic layers has in the past made tunneling in Iceland difficult. It has in some ways changed with new tunneling strategies and support methods and therefore tunneling has increased gradually over the last 60 years. The first tunneling project was a road tunnel through Arnarneshamar in Ísarfjarðardjúp, finished in 1949.
Figure 4-1. First tunneling project in Iceland, a road tunnel through Arnarneshamar finished in 1949 [Guðmundsson 1999].
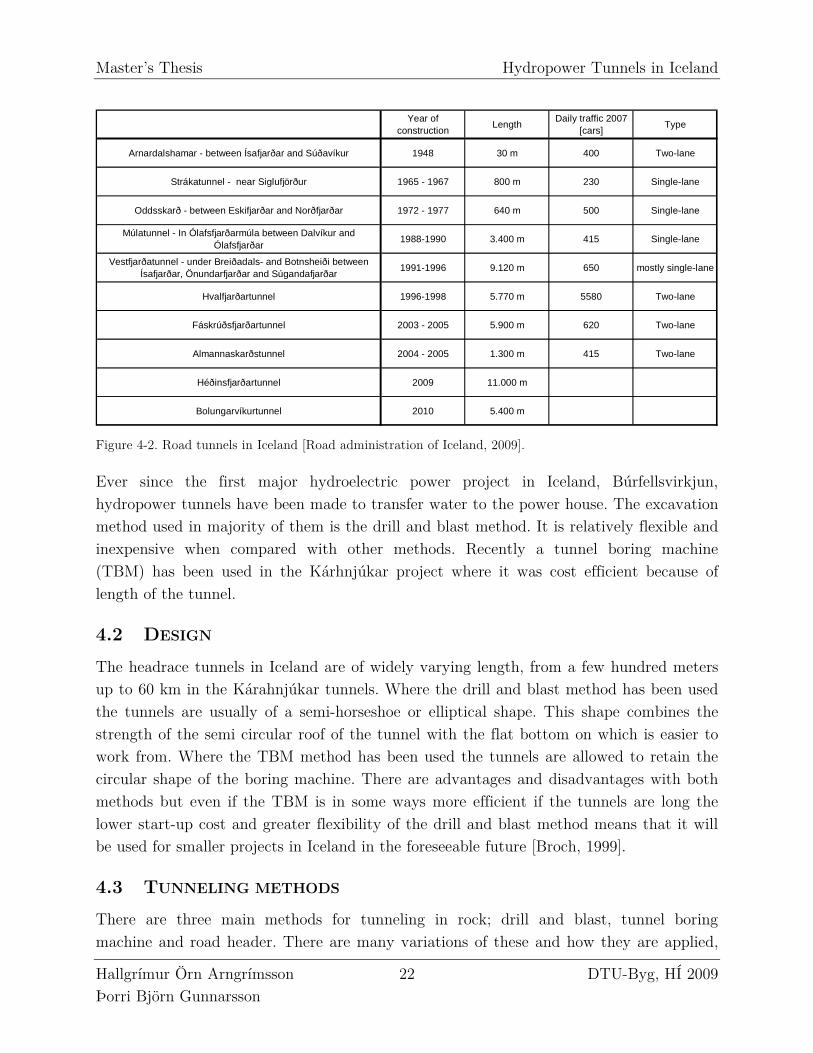
Since then there have been a number of increasingly larger projects and according to the Icelandic Road Administration there are the following road tunnels in Iceland:
Master’s Thesis Hydropower Tunnels in Iceland
Hallgrímur Örn Arngrímsson 22 DTU-Byg, HÍ 2009 Þorri Björn Gunnarsson
Year of construction
LengthDaily traffic 2007
[cars]Type
Arnardalshamar - between Ísafjarðar and Súðavíkur 1948 30 m 400 Two-lane
Strákatunnel - near Siglufjörður 1965 - 1967 800 m 230 Single-lane
Oddsskarð - between Eskifjarðar and Norðfjarðar 1972 - 1977 640 m 500 Single-lane
Múlatunnel - In Ólafsfjarðarmúla between Dalvíkur and Ólafsfjarðar
1988-1990 3.400 m 415 Single-lane
Vestfjarðatunnel - under Breiðadals- and Botnsheiði between Ísafjarðar, Önundarfjarðar and Súgandafjarðar
1991-1996 9.120 m 650 mostly single-lane
Hvalfjarðartunnel 1996-1998 5.770 m 5580 Two-lane
Fáskrúðsfjarðartunnel 2003 - 2005 5.900 m 620 Two-lane
Almannaskarðstunnel 2004 - 2005 1.300 m 415 Two-lane
Héðinsfjarðartunnel 2009 11.000 m
Bolungarvíkurtunnel 2010 5.400 m
Figure 4-2. Road tunnels in Iceland [Road administration of Iceland, 2009].
Ever since the first major hydroelectric power project in Iceland, Búrfellsvirkjun, hydropower tunnels have been made to transfer water to the power house. The excavation method used in majority of them is the drill and blast method. It is relatively flexible and inexpensive when compared with other methods. Recently a tunnel boring machine (TBM) has been used in the Kárhnjúkar project where it was cost efficient because of length of the tunnel.
4.2 DESIGN
The headrace tunnels in Iceland are of widely varying length, from a few hundred meters up to 60 km in the Kárahnjúkar tunnels. Where the drill and blast method has been used the tunnels are usually of a semi-horseshoe or elliptical shape. This shape combines the strength of the semi circular roof of the tunnel with the flat bottom on which is easier to work from. Where the TBM method has been used the tunnels are allowed to retain the circular shape of the boring machine. There are advantages and disadvantages with both methods but even if the TBM is in some ways more efficient if the tunnels are long the lower start-up cost and greater flexibility of the drill and blast method means that it will be used for smaller projects in Iceland in the foreseeable future [Broch, 1999].
4.3 TUNNELING METHODS
There are three main methods for tunneling in rock; drill and blast, tunnel boring machine and road header. There are many variations of these and how they are applied,
Master’s Thesis Hydropower Tunnels in Iceland
Hallgrímur Örn Arngrímsson 23 DTU-Byg, HÍ 2009 Þorri Björn Gunnarsson
here the most basic applications will be described, how they are performed and in what situations each is practical.
4.3.1 Drill and blast
With the development of dynamite in 1866, which was much more efficient and powerful than gunpowder, the use of explosives in tunneling was finally made practical. At the same time the invention of more powerful steam and air compressed drills made the development of the drill and blast tunneling method possible.
The drill and blast process follows the following cycle [Sandvik Canada, 2009]: First a drilling machine is used to drill holes into the rock surface. These machines are equipped with multiple arms so that several holes can be drilled at the same time. In most cases the holes are parallel into the rock face but it is also possible to create fan shaped cuts, where the holes are drilled in at an angle. Fan shaped drilling is more effective than parallel because it creates a larger free face in each explosion. It is, however, harder to drill correctly and therefore not used as much today [Bruland, A & Sohkrollah, Z, 2001].
The next step is to pack the holes with explosives, except in the case of parallel holes where a larger hole created in the middle is left unfilled as a free face. A free face is created so that the explosives can blast the rock into the space. If there is no free face the rock will only crack and is still left relatively intact. When the explosives have been connected to fuses they are blown in a certain order to ensure that each set of charges is blown into the space left by the preceding charges, usually starting in the middle. In Figure 4-3 a typical blasting profile is shown for a large tunnel. When the charges have all blown the area is ventilated so that poisonous gases and rock dust is not left in the area. The broken rock and dirt left by the blasting is called muck and after ventilation it is dug out by machines and carried out by haulers. When the muck has been removed the walls and ceiling are cleared of all loose materials and rock support systems are installed as needed. This can involve rockbolts, shotcrete, pre-cast concrete or even steel arches. When the support has been set into place the entire process can start again at the next rock face. In some cases the support phase of the process is left for a few drill and blast cycles and then done all at the same time. This can be more efficient but can only be done if the rock mass is strong enough to support itself for some time.
Master’s Thesis Hydropower Tunnels in Iceland
Hallgrímur Örn Arngrímsson 24 DTU-Byg, HÍ 2009 Þorri Björn Gunnarsson
Figure 4-3. Blasting profile for a typical large tunnel. Cross-section area is 90 m2, blasting holes are 45 mm diameter. Numbers represent the blasting sequence [Johannessen, 1996].
Drill and blast is a flexible method, used in both long and short tunnels. It can be altered to different tunnel designs and the start up cost is relatively low.
Figure 4-4. Work cycle of the drill and blast method [Sandvik Canada, 2009].
Master’s Thesis Hydropower Tunnels in Iceland
Hallgrímur Örn Arngrímsson 25 DTU-Byg, HÍ 2009 Þorri Björn Gunnarsson
4.3.2 TBM
A Tunnel boring machine (TBM), is another way of digging tunnels underground. In principle, the idea to use a boring machine is not new, it was first tried in 1853 but that machine soon broke down and it was not until the early 1950´s that a successful TBM with a rotating head and pneumatic drills was created [Hapgood, 2009].
A TBM is a long machine made up of different sections. The first section is the rotating head, which grinds against the rock face. On the head are cutting wheels which also rotate and it is this mechanism which cuts the rock. Behind the head are two shields, which protect the machine from the surrounding rock. The TBM is moved by bracing the rear section against the tunnel walls and using hydraulic jacks to push the front end forward and thereby pressing the head against the rock face. When the jacks have reached full extension the front end is in turn braced against the walls and the back is pulled forward. Behind the rotating head there is a conveyor belt which moves all the rock and earth dug by the machine out of the tunnel. The back of the TBM also houses support units (electrical systems and pipes), control room and access for materials needed for tunnel support such as pre-cast concrete elements. This all combines into a large and very expensive machine that can have a high rate of tunneling if no major problems occur.
Figure 4-5. Herrenknecht EPB Shield S-300 mega tunnel boring machine [Herrenknecht, 2009].
A tunnel boring machine is much more expensive than the drill and blast method, especially is the startup cost of the TBM very high. It is preferable though in some cases. For instance where surface vibrations need to be limited (in an urban environment) or
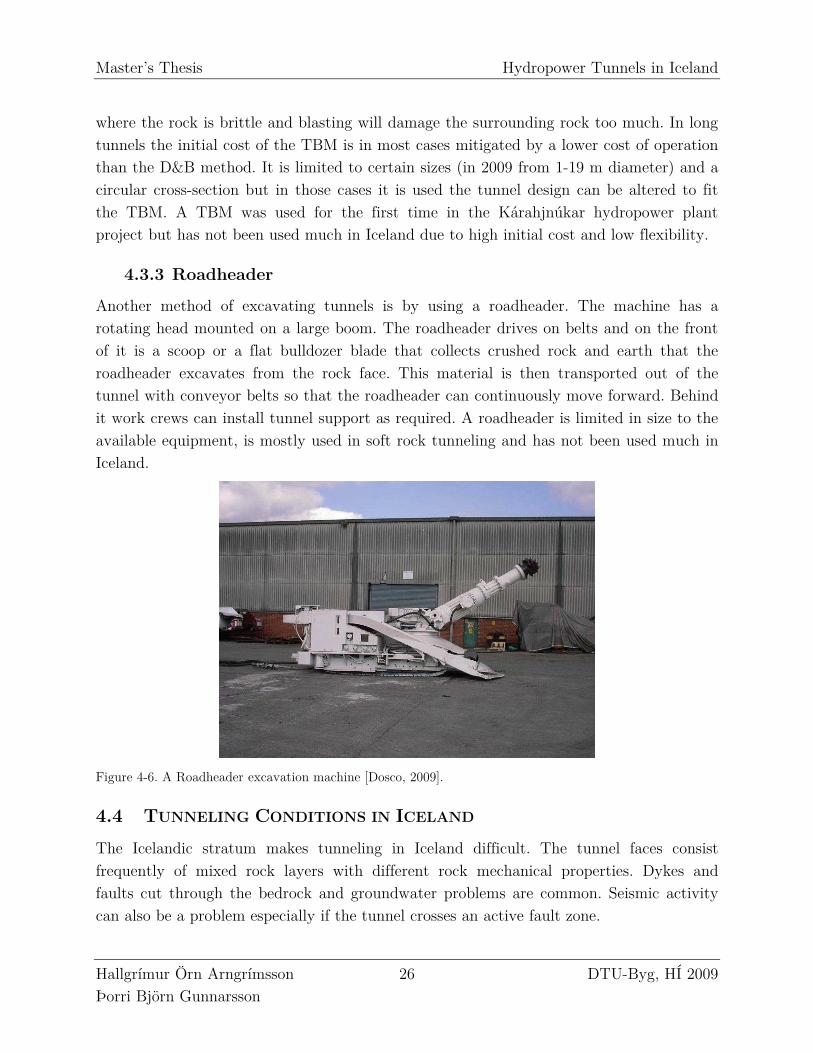
Master’s Thesis Hydropower Tunnels in Iceland
Hallgrímur Örn Arngrímsson 26 DTU-Byg, HÍ 2009 Þorri Björn Gunnarsson
where the rock is brittle and blasting will damage the surrounding rock too much. In long tunnels the initial cost of the TBM is in most cases mitigated by a lower cost of operation than the D&B method. It is limited to certain sizes (in 2009 from 1-19 m diameter) and a circular cross-section but in those cases it is used the tunnel design can be altered to fit the TBM. A TBM was used for the first time in the Kárahjnúkar hydropower plant project but has not been used much in Iceland due to high initial cost and low flexibility.
4.3.3 Roadheader
Another method of excavating tunnels is by using a roadheader. The machine has a rotating head mounted on a large boom. The roadheader drives on belts and on the front of it is a scoop or a flat bulldozer blade that collects crushed rock and earth that the roadheader excavates from the rock face. This material is then transported out of the tunnel with conveyor belts so that the roadheader can continuously move forward. Behind it work crews can install tunnel support as required. A roadheader is limited in size to the available equipment, is mostly used in soft rock tunneling and has not been used much in Iceland.
Figure 4-6. A Roadheader excavation machine [Dosco, 2009].
4.4 TUNNELING CONDITIONS IN ICELAND
The Icelandic stratum makes tunneling in Iceland difficult. The tunnel faces consist frequently of mixed rock layers with different rock mechanical properties. Dykes and faults cut through the bedrock and groundwater problems are common. Seismic activity can also be a problem especially if the tunnel crosses an active fault zone.
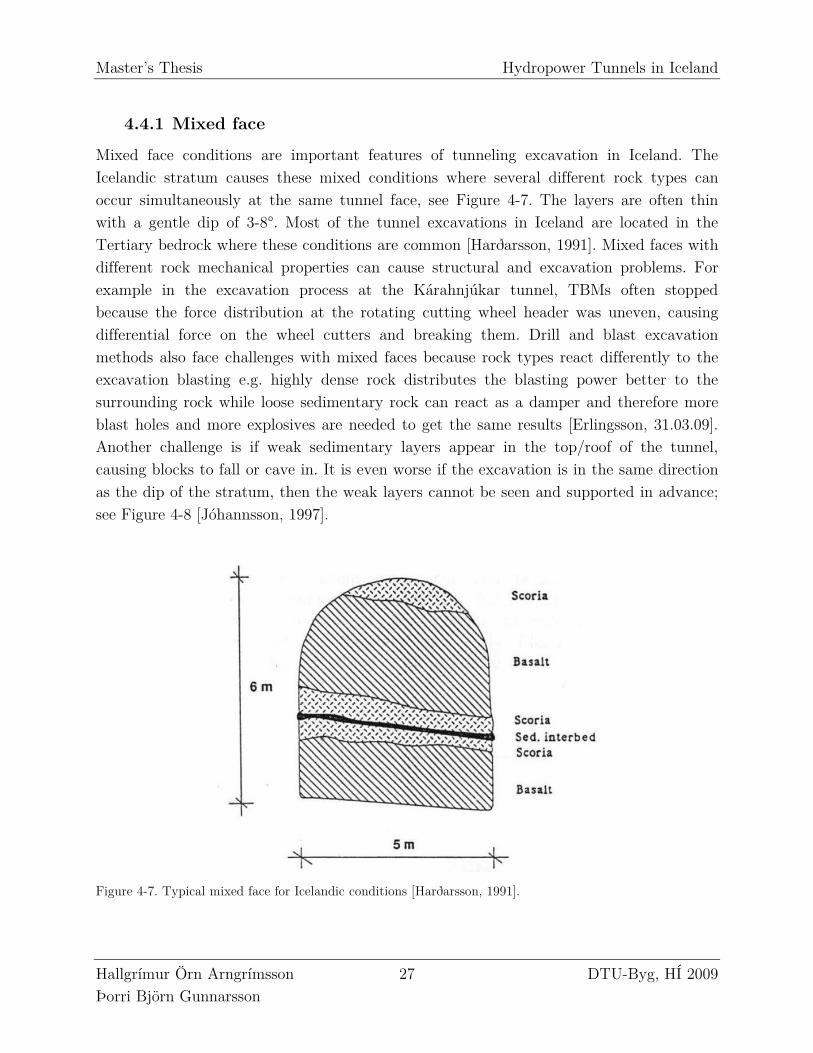
Master’s Thesis Hydropower Tunnels in Iceland
Hallgrímur Örn Arngrímsson 27 DTU-Byg, HÍ 2009 Þorri Björn Gunnarsson
4.4.1 Mixed face
Mixed face conditions are important features of tunneling excavation in Iceland. The Icelandic stratum causes these mixed conditions where several different rock types can occur simultaneously at the same tunnel face, see Figure 4-7. The layers are often thin with a gentle dip of 3-8°. Most of the tunnel excavations in Iceland are located in the Tertiary bedrock where these conditions are common [Harðarsson, 1991]. Mixed faces with different rock mechanical properties can cause structural and excavation problems. For example in the excavation process at the Kárahnjúkar tunnel, TBMs often stopped because the force distribution at the rotating cutting wheel header was uneven, causing differential force on the wheel cutters and breaking them. Drill and blast excavation methods also face challenges with mixed faces because rock types react differently to the excavation blasting e.g. highly dense rock distributes the blasting power better to the surrounding rock while loose sedimentary rock can react as a damper and therefore more blast holes and more explosives are needed to get the same results [Erlingsson, 31.03.09]. Another challenge is if weak sedimentary layers appear in the top/roof of the tunnel, causing blocks to fall or cave in. It is even worse if the excavation is in the same direction as the dip of the stratum, then the weak layers cannot be seen and supported in advance; see Figure 4-8 [Jóhannsson, 1997].
Figure 4-7. Typical mixed face for Icelandic conditions [Harðarsson, 1991].
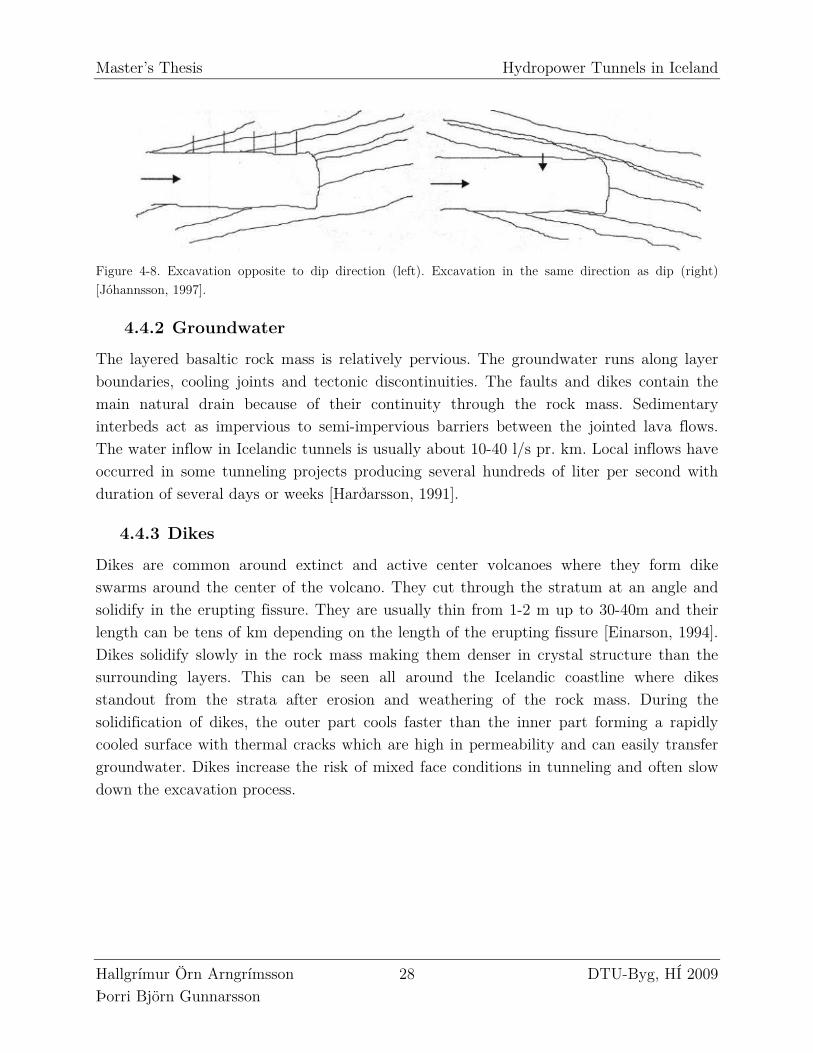
Master’s Thesis Hydropower Tunnels in Iceland
Hallgrímur Örn Arngrímsson 28 DTU-Byg, HÍ 2009 Þorri Björn Gunnarsson
Figure 4-8. Excavation opposite to dip direction (left). Excavation in the same direction as dip (right) [Jóhannsson, 1997].
4.4.2 Groundwater
The layered basaltic rock mass is relatively pervious. The groundwater runs along layer boundaries, cooling joints and tectonic discontinuities. The faults and dikes contain the main natural drain because of their continuity through the rock mass. Sedimentary interbeds act as impervious to semi-impervious barriers between the jointed lava flows. The water inflow in Icelandic tunnels is usually about 10-40 l/s pr. km. Local inflows have occurred in some tunneling projects producing several hundreds of liter per second with duration of several days or weeks [Harðarsson, 1991].
4.4.3 Dikes
Dikes are common around extinct and active center volcanoes where they form dike swarms around the center of the volcano. They cut through the stratum at an angle and solidify in the erupting fissure. They are usually thin from 1-2 m up to 30-40m and their length can be tens of km depending on the length of the erupting fissure [Einarson, 1994]. Dikes solidify slowly in the rock mass making them denser in crystal structure than the surrounding layers. This can be seen all around the Icelandic coastline where dikes standout from the strata after erosion and weathering of the rock mass. During the solidification of dikes, the outer part cools faster than the inner part forming a rapidly cooled surface with thermal cracks which are high in permeability and can easily transfer groundwater. Dikes increase the risk of mixed face conditions in tunneling and often slow down the excavation process.
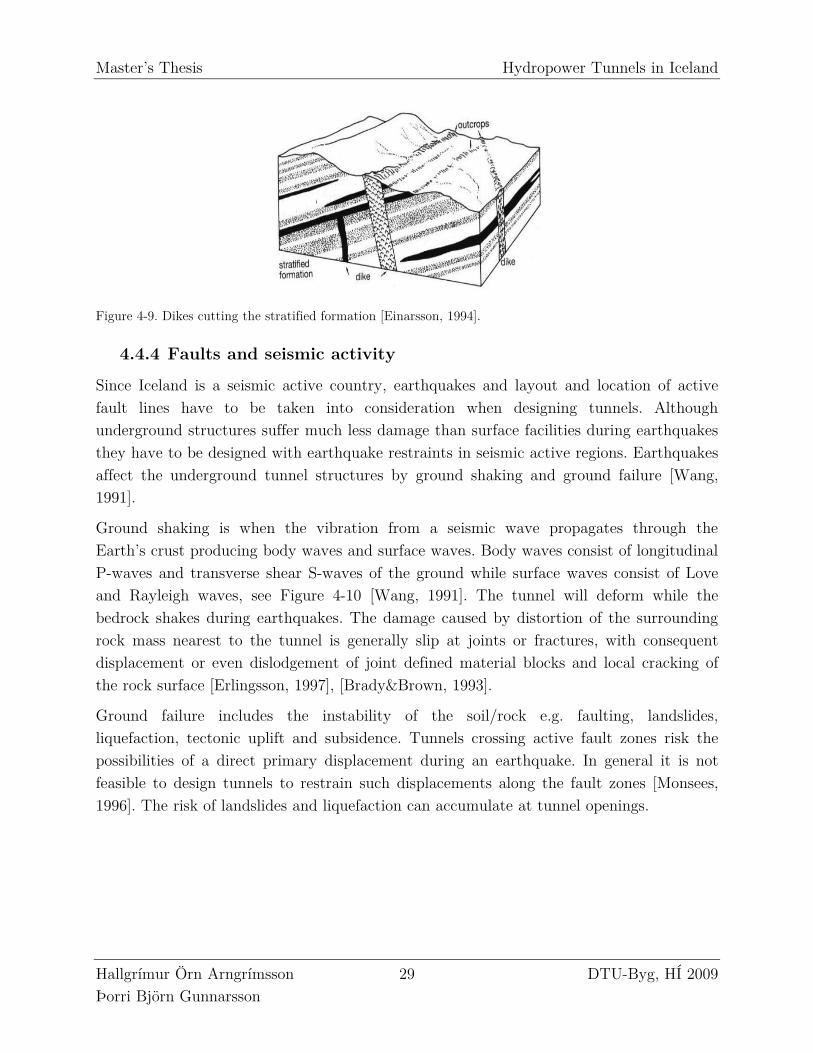
Master’s Thesis Hydropower Tunnels in Iceland
Hallgrímur Örn Arngrímsson 29 DTU-Byg, HÍ 2009 Þorri Björn Gunnarsson
Figure 4-9. Dikes cutting the stratified formation [Einarsson, 1994].
4.4.4 Faults and seismic activity
Since Iceland is a seismic active country, earthquakes and layout and location of active fault lines have to be taken into consideration when designing tunnels. Although underground structures suffer much less damage than surface facilities during earthquakes they have to be designed with earthquake restraints in seismic active regions. Earthquakes affect the underground tunnel structures by ground shaking and ground failure [Wang, 1991].
Ground shaking is when the vibration from a seismic wave propagates through the Earth’s crust producing body waves and surface waves. Body waves consist of longitudinal P-waves and transverse shear S-waves of the ground while surface waves consist of Love and Rayleigh waves, see Figure 4-10 [Wang, 1991]. The tunnel will deform while the bedrock shakes during earthquakes. The damage caused by distortion of the surrounding rock mass nearest to the tunnel is generally slip at joints or fractures, with consequent displacement or even dislodgement of joint defined material blocks and local cracking of the rock surface [Erlingsson, 1997], [Brady&Brown, 1993].
Ground failure includes the instability of the soil/rock e.g. faulting, landslides, liquefaction, tectonic uplift and subsidence. Tunnels crossing active fault zones risk the possibilities of a direct primary displacement during an earthquake. In general it is not feasible to design tunnels to restrain such displacements along the fault zones [Monsees, 1996]. The risk of landslides and liquefaction can accumulate at tunnel openings.
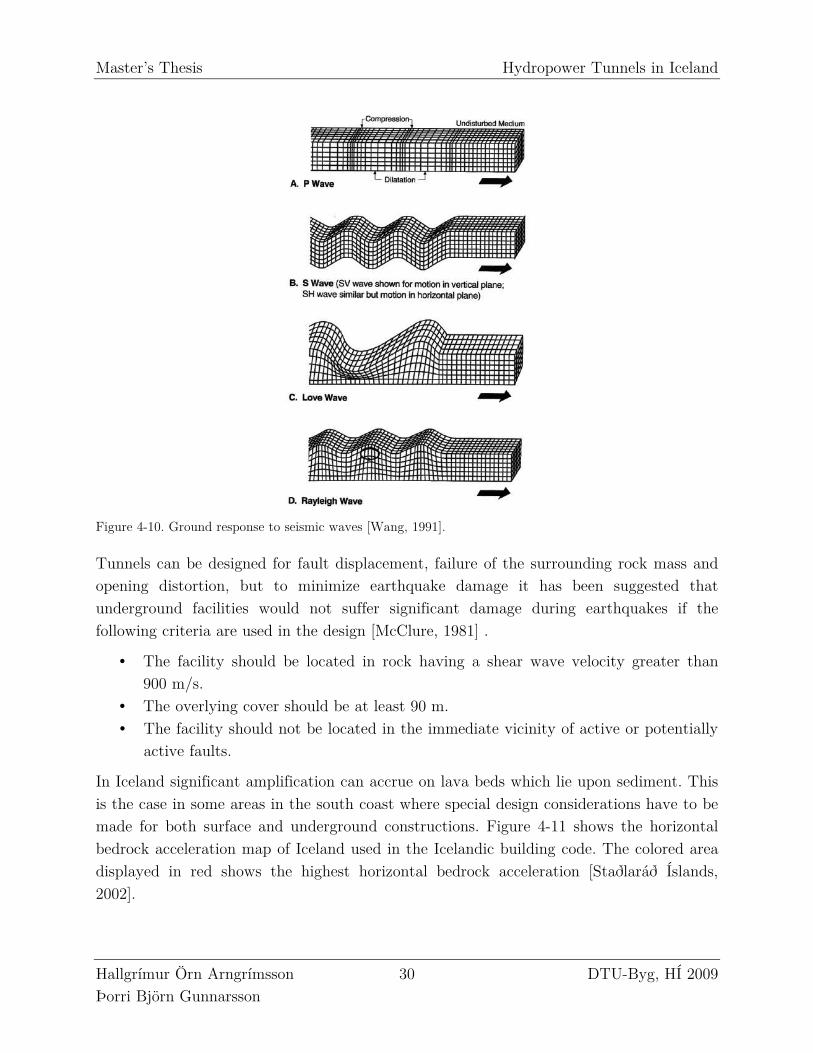
Master’s Thesis Hydropower Tunnels in Iceland
Hallgrímur Örn Arngrímsson 30 DTU-Byg, HÍ 2009 Þorri Björn Gunnarsson
Figure 4-10. Ground response to seismic waves [Wang, 1991].
Tunnels can be designed for fault displacement, failure of the surrounding rock mass and opening distortion, but to minimize earthquake damage it has been suggested that underground facilities would not suffer significant damage during earthquakes if the following criteria are used in the design [McClure, 1981] .
• The facility should be located in rock having a shear wave velocity greater than 900 m/s.
• The overlying cover should be at least 90 m. • The facility should not be located in the immediate vicinity of active or potentially
active faults.
In Iceland significant amplification can accrue on lava beds which lie upon sediment. This is the case in some areas in the south coast where special design considerations have to be made for both surface and underground constructions. Figure 4-11 shows the horizontal bedrock acceleration map of Iceland used in the Icelandic building code. The colored area displayed in red shows the highest horizontal bedrock acceleration [Staðlaráð Íslands, 2002].
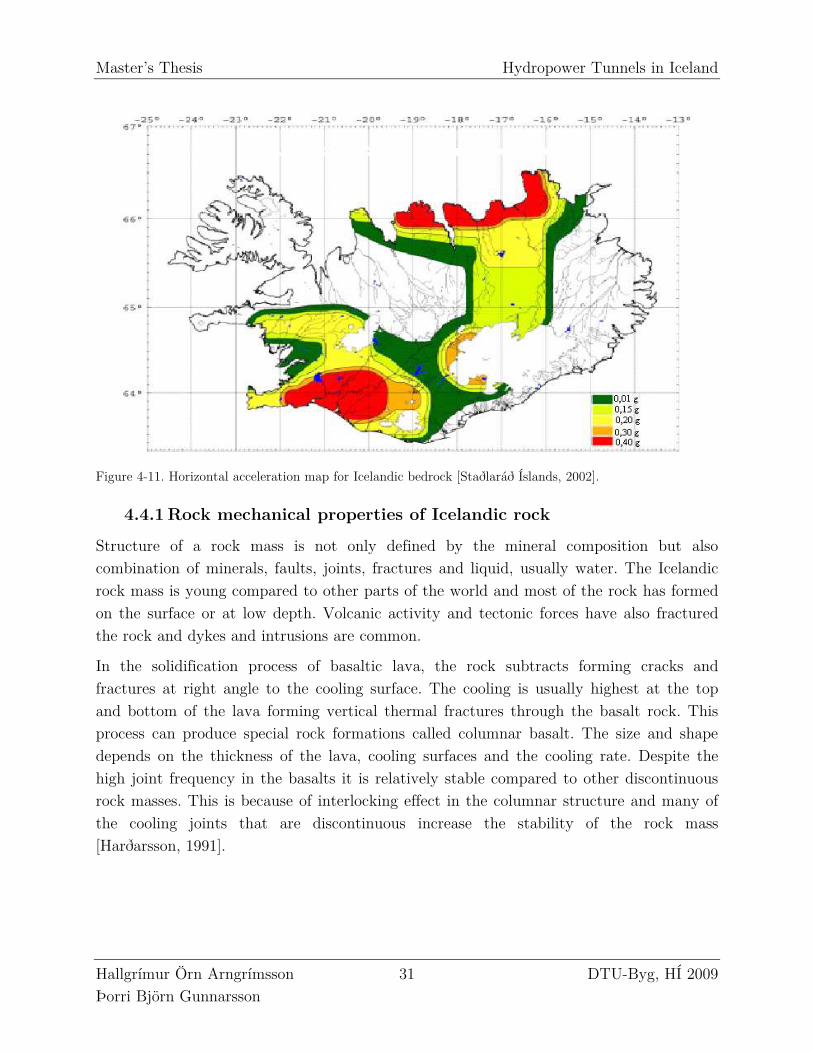
Master’s Thesis Hydropower Tunnels in Iceland
Hallgrímur Örn Arngrímsson 31 DTU-Byg, HÍ 2009 Þorri Björn Gunnarsson
Figure 4-11. Horizontal acceleration map for Icelandic bedrock [Staðlaráð Íslands, 2002].
4.4.1 Rock mechanical properties of Icelandic rock
Structure of a rock mass is not only defined by the mineral composition but also combination of minerals, faults, joints, fractures and liquid, usually water. The Icelandic rock mass is young compared to other parts of the world and most of the rock has formed on the surface or at low depth. Volcanic activity and tectonic forces have also fractured the rock and dykes and intrusions are common.
In the solidification process of basaltic lava, the rock subtracts forming cracks and fractures at right angle to the cooling surface. The cooling is usually highest at the top and bottom of the lava forming vertical thermal fractures through the basalt rock. This process can produce special rock formations called columnar basalt. The size and shape depends on the thickness of the lava, cooling surfaces and the cooling rate. Despite the high joint frequency in the basalts it is relatively stable compared to other discontinuous rock masses. This is because of interlocking effect in the columnar structure and many of the cooling joints that are discontinuous increase the stability of the rock mass [Harðarsson, 1991].
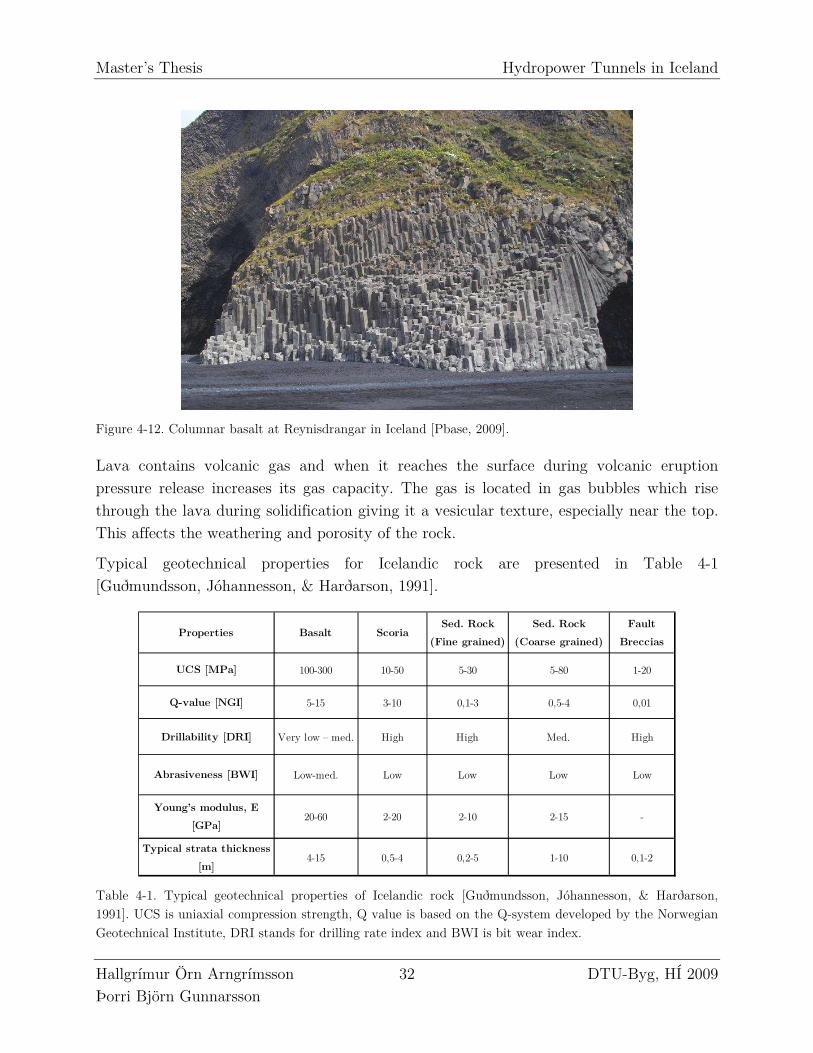
Master’s Thesis Hydropower Tunnels in Iceland
Hallgrímur Örn Arngrímsson 32 DTU-Byg, HÍ 2009 Þorri Björn Gunnarsson
Figure 4-12. Columnar basalt at Reynisdrangar in Iceland [Pbase, 2009].
Lava contains volcanic gas and when it reaches the surface during volcanic eruption pressure release increases its gas capacity. The gas is located in gas bubbles which rise through the lava during solidification giving it a vesicular texture, especially near the top. This affects the weathering and porosity of the rock.
Typical geotechnical properties for Icelandic rock are presented in Table 4-1 [Guðmundsson, Jóhannesson, & Harðarson, 1991].
Properties Basalt ScoriaSed. Rock
(Fine grained)
Sed. Rock
(Coarse grained)
Fault
Breccias
UCS [MPa] 100-300 10-50 5-30 5-80 1-20
Q-value [NGI] 5-15 3-10 0,1-3 0,5-4 0,01
Drillability [DRI] Very low – med. High High Med. High
Abrasiveness [BWI] Low-med. Low Low Low Low
Young’s modulus, E
[GPa]20-60 2-20 2-10 2-15 -
Typical strata thickness
[m]4-15 0,5-4 0,2-5 1-10 0,1-2
Table 4-1. Typical geotechnical properties of Icelandic rock [Guðmundsson, Jóhannesson, & Harðarson, 1991]. UCS is uniaxial compression strength, Q value is based on the Q-system developed by the Norwegian Geotechnical Institute, DRI stands for drilling rate index and BWI is bit wear index.

Master’s Thesis Hydropower Tunnels in Iceland
Hallgrímur Örn Arngrímsson 33 DTU-Byg, HÍ 2009 Þorri Björn Gunnarsson
In Icelandic the NGI Tunnelling Quality Index (Q-system) has been used most often to evaluate rock properties. In other countries plutonic rock is more common and the rock fractures are usually fewer but longer and farther apart. This makes it difficult to use foreign rock classification systems directly on Icelandic rock mass [Erlingsson, 1994].

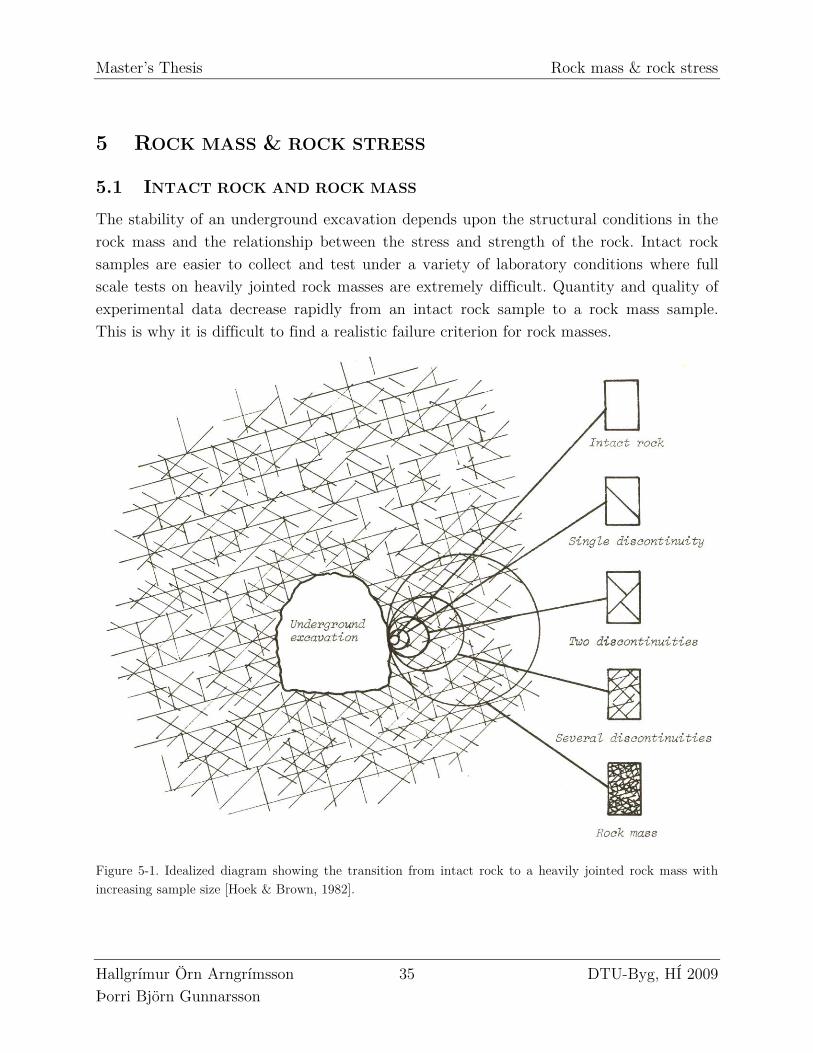
Master’s Thesis Rock mass & rock stress
Hallgrímur Örn Arngrímsson 35 DTU-Byg, HÍ 2009 Þorri Björn Gunnarsson
5 ROCK MASS & ROCK STRESS
5.1 INTACT ROCK AND ROCK MASS
The stability of an underground excavation depends upon the structural conditions in the rock mass and the relationship between the stress and strength of the rock. Intact rock samples are easier to collect and test under a variety of laboratory conditions where full scale tests on heavily jointed rock masses are extremely difficult. Quantity and quality of experimental data decrease rapidly from an intact rock sample to a rock mass sample. This is why it is difficult to find a realistic failure criterion for rock masses.
Figure 5-1. Idealized diagram showing the transition from intact rock to a heavily jointed rock mass with increasing sample size [Hoek & Brown, 1982].
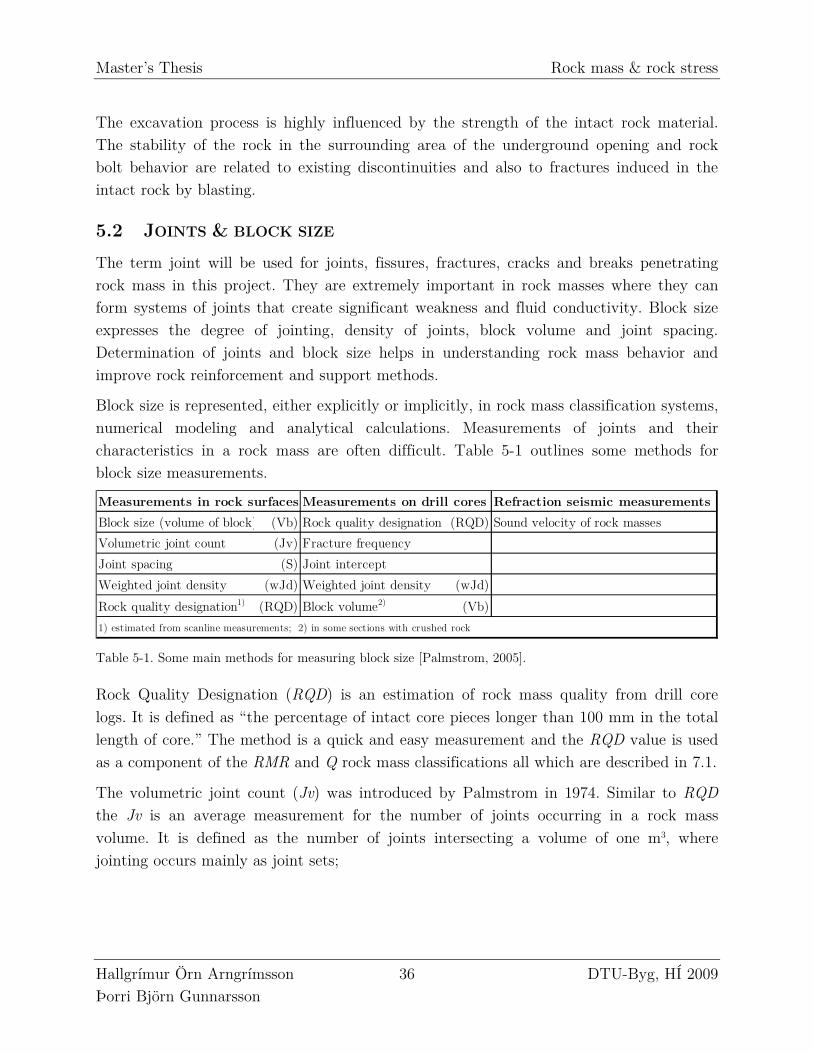
Master’s Thesis Rock mass & rock stress
Hallgrímur Örn Arngrímsson 36 DTU-Byg, HÍ 2009 Þorri Björn Gunnarsson
The excavation process is highly influenced by the strength of the intact rock material. The stability of the rock in the surrounding area of the underground opening and rock bolt behavior are related to existing discontinuities and also to fractures induced in the intact rock by blasting.
5.2 JOINTS & BLOCK SIZE
The term joint will be used for joints, fissures, fractures, cracks and breaks penetrating rock mass in this project. They are extremely important in rock masses where they can form systems of joints that create significant weakness and fluid conductivity. Block size expresses the degree of jointing, density of joints, block volume and joint spacing. Determination of joints and block size helps in understanding rock mass behavior and improve rock reinforcement and support methods.
Block size is represented, either explicitly or implicitly, in rock mass classification systems, numerical modeling and analytical calculations. Measurements of joints and their characteristics in a rock mass are often difficult. Table 5-1 outlines some methods for block size measurements.
Refraction seismic measurements
Block size (volume of block) (Vb) Rock quality designation (RQD) Sound velocity of rock masses
Volumetric joint count (Jv) Fracture frequency
Joint spacing (S) Joint intercept
Weighted joint density (wJd) Weighted joint density (wJd)
Rock quality designation1) (RQD) Block volume2) (Vb)
1) estimated from scanline measurements; 2) in some sections with crushed rock
Measurements in rock surfaces Measurements on drill cores
Table 5-1. Some main methods for measuring block size [Palmstrom, 2005].
Rock Quality Designation (RQD) is an estimation of rock mass quality from drill core logs. It is defined as “the percentage of intact core pieces longer than 100 mm in the total length of core.” The method is a quick and easy measurement and the RQD value is used as a component of the RMR and Q rock mass classifications all which are described in 7.1.
The volumetric joint count (Jv) was introduced by Palmstrom in 1974. Similar to RQD the Jv is an average measurement for the number of joints occurring in a rock mass volume. It is defined as the number of joints intersecting a volume of one m3, where jointing occurs mainly as joint sets;
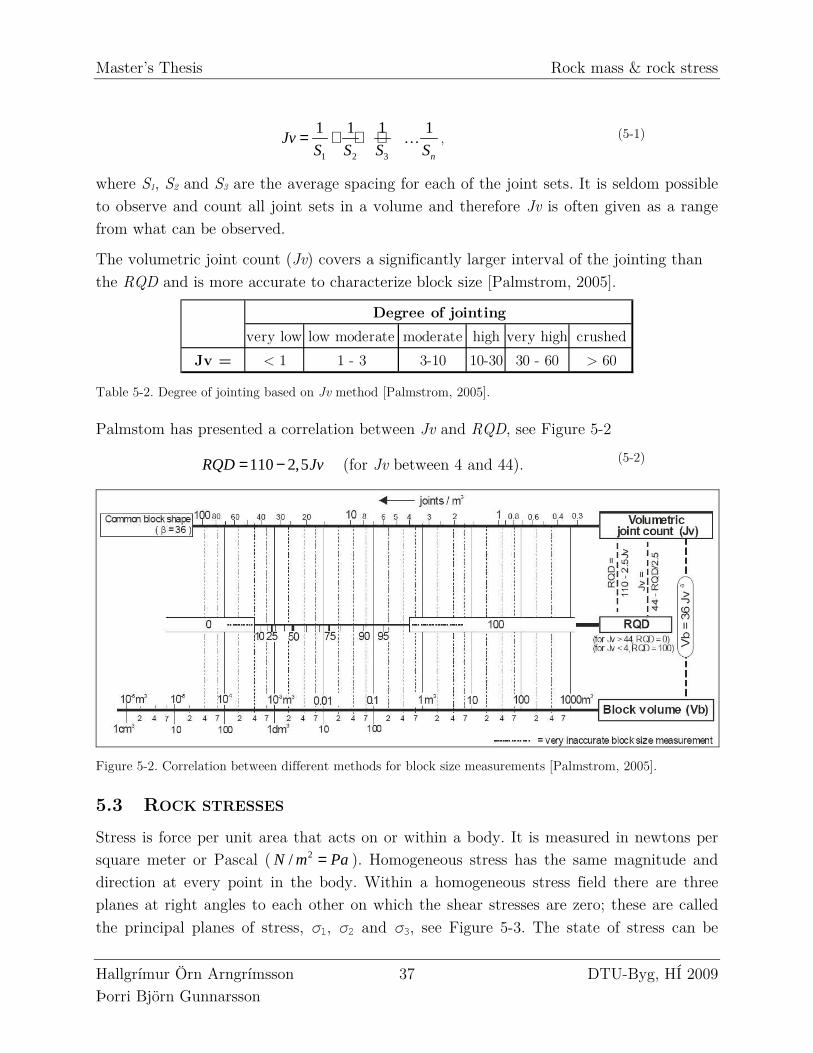
Master’s Thesis Rock mass & rock stress
Hallgrímur Örn Arngrímsson 37 DTU-Byg, HÍ 2009 Þorri Björn Gunnarsson
1 2 3
1 1 1 1
n
JvS S S S
= + + +… , (5-1)
where S1, S2 and S3 are the average spacing for each of the joint sets. It is seldom possible to observe and count all joint sets in a volume and therefore Jv is often given as a range from what can be observed.
The volumetric joint count (Jv) covers a significantly larger interval of the jointing than the RQD and is more accurate to characterize block size [Palmstrom, 2005].
very low low moderate moderate high very high crushed
Jv = < 1 1 - 3 3-10 10-30 30 - 60 > 60
Degree of jointing
Table 5-2. Degree of jointing based on Jv method [Palmstrom, 2005].
Palmstom has presented a correlation between Jv and RQD, see Figure 5-2
110 2,5RQD Jv= − (for Jv between 4 and 44). (5-2)
Figure 5-2. Correlation between different methods for block size measurements [Palmstrom, 2005].
5.3 ROCK STRESSES
Stress is force per unit area that acts on or within a body. It is measured in newtons per square meter or Pascal ( 2/N m Pa= ). Homogeneous stress has the same magnitude and direction at every point in the body. Within a homogeneous stress field there are three planes at right angles to each other on which the shear stresses are zero; these are called the principal planes of stress, σ1, σ2 and σ3, see Figure 5-3. The state of stress can be
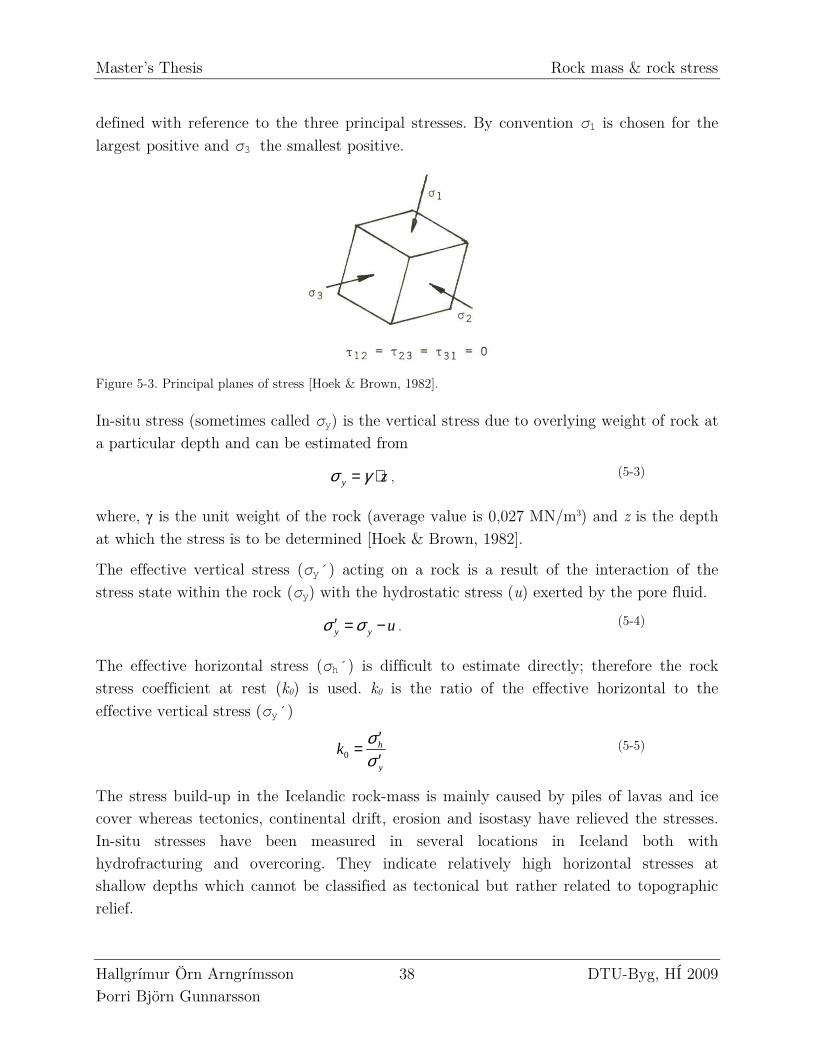
Master’s Thesis Rock mass & rock stress
Hallgrímur Örn Arngrímsson 38 DTU-Byg, HÍ 2009 Þorri Björn Gunnarsson
defined with reference to the three principal stresses. By convention σ1 is chosen for the largest positive and σ3 the smallest positive.
Figure 5-3. Principal planes of stress [Hoek & Brown, 1982].
In-situ stress (sometimes called σy) is the vertical stress due to overlying weight of rock at a particular depth and can be estimated from
y zσ γ= ⋅ , (5-3)
where, γ is the unit weight of the rock (average value is 0,027 MN/m3) and z is the depth at which the stress is to be determined [Hoek & Brown, 1982].
The effective vertical stress (σy´ ) acting on a rock is a result of the interaction of the stress state within the rock (σy) with the hydrostatic stress (u) exerted by the pore fluid.
y y uσ σ′ = − . (5-4)
The effective horizontal stress (σh´ ) is difficult to estimate directly; therefore the rock stress coefficient at rest (k0) is used. k0 is the ratio of the effective horizontal to the effective vertical stress (σy´ )
0h
y
kσσ
′=
′ (5-5)
The stress build-up in the Icelandic rock-mass is mainly caused by piles of lavas and ice cover whereas tectonics, continental drift, erosion and isostasy have relieved the stresses. In-situ stresses have been measured in several locations in Iceland both with hydrofracturing and overcoring. They indicate relatively high horizontal stresses at shallow depths which cannot be classified as tectonical but rather related to topographic relief.
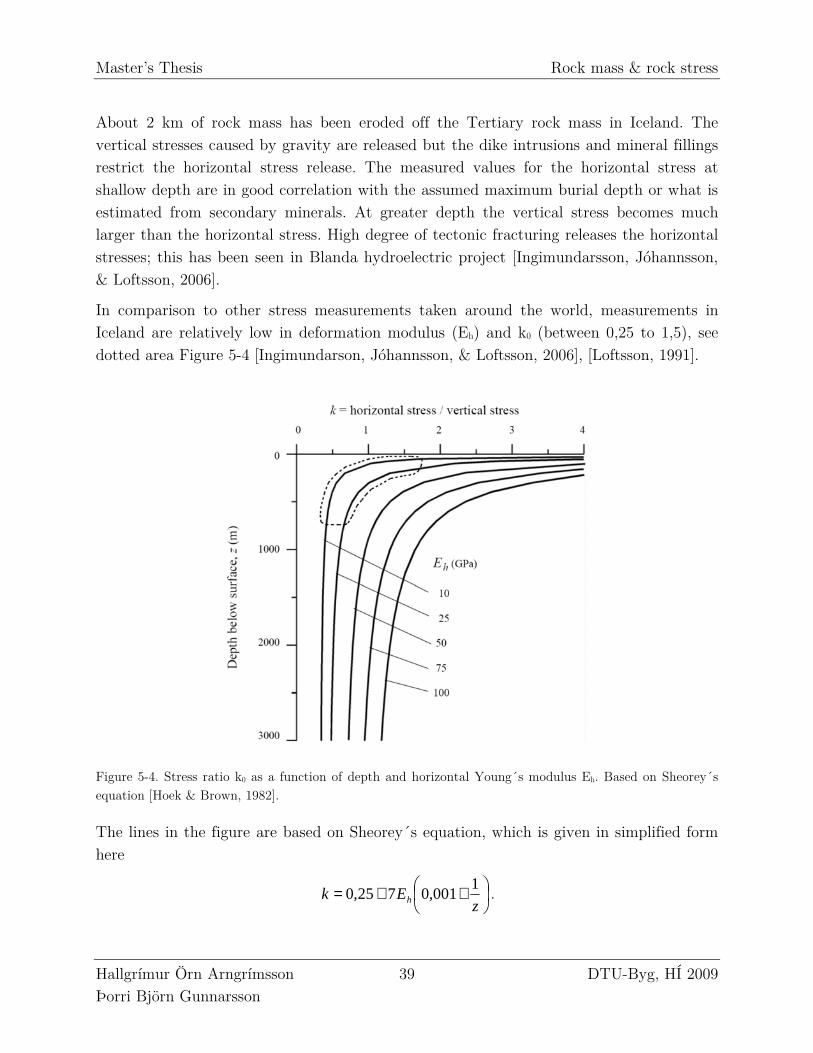
Master’s Thesis Rock mass & rock stress
Hallgrímur Örn Arngrímsson 39 DTU-Byg, HÍ 2009 Þorri Björn Gunnarsson
About 2 km of rock mass has been eroded off the Tertiary rock mass in Iceland. The vertical stresses caused by gravity are released but the dike intrusions and mineral fillings restrict the horizontal stress release. The measured values for the horizontal stress at shallow depth are in good correlation with the assumed maximum burial depth or what is estimated from secondary minerals. At greater depth the vertical stress becomes much larger than the horizontal stress. High degree of tectonic fracturing releases the horizontal stresses; this has been seen in Blanda hydroelectric project [Ingimundarsson, Jóhannsson, & Loftsson, 2006].
In comparison to other stress measurements taken around the world, measurements in Iceland are relatively low in deformation modulus (Eh) and k0 (between 0,25 to 1,5), see dotted area Figure 5-4 [Ingimundarson, Jóhannsson, & Loftsson, 2006], [Loftsson, 1991].
Figure 5-4. Stress ratio k0 as a function of depth and horizontal Young´s modulus Eh. Based on Sheorey´s equation [Hoek & Brown, 1982].
The lines in the figure are based on Sheorey´s equation, which is given in simplified form here
++=z
Ek h
1001,0725,0 .
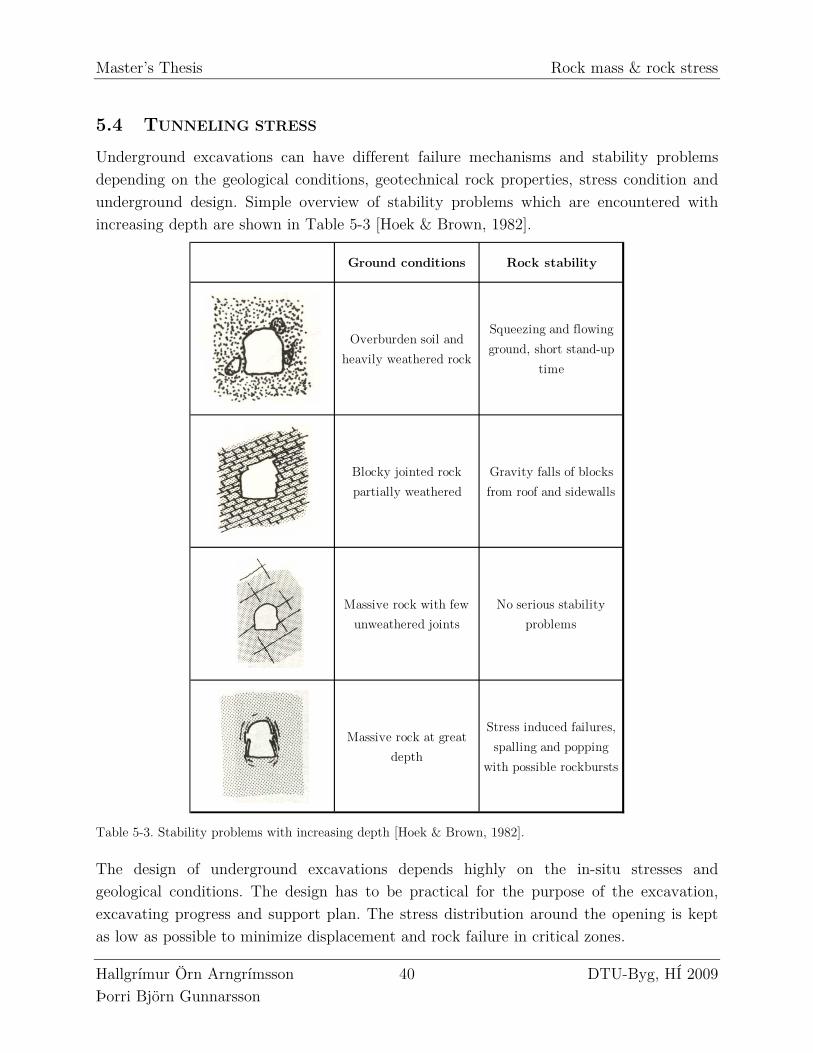
Master’s Thesis Rock mass & rock stress
Hallgrímur Örn Arngrímsson 40 DTU-Byg, HÍ 2009 Þorri Björn Gunnarsson
5.4 TUNNELING STRESS
Underground excavations can have different failure mechanisms and stability problems depending on the geological conditions, geotechnical rock properties, stress condition and underground design. Simple overview of stability problems which are encountered with increasing depth are shown in Table 5-3 [Hoek & Brown, 1982].
Ground conditions Rock stability
Overburden soil and
heavily weathered rock
Squeezing and flowing
ground, short stand-up
time
Blocky jointed rock
partially weathered
Gravity falls of blocks
from roof and sidewalls
Massive rock with few
unweathered joints
No serious stability
problems
Massive rock at great
depth
Stress induced failures,
spalling and popping
with possible rockbursts
Table 5-3. Stability problems with increasing depth [Hoek & Brown, 1982].
The design of underground excavations depends highly on the in-situ stresses and geological conditions. The design has to be practical for the purpose of the excavation, excavating progress and support plan. The stress distribution around the opening is kept as low as possible to minimize displacement and rock failure in critical zones.
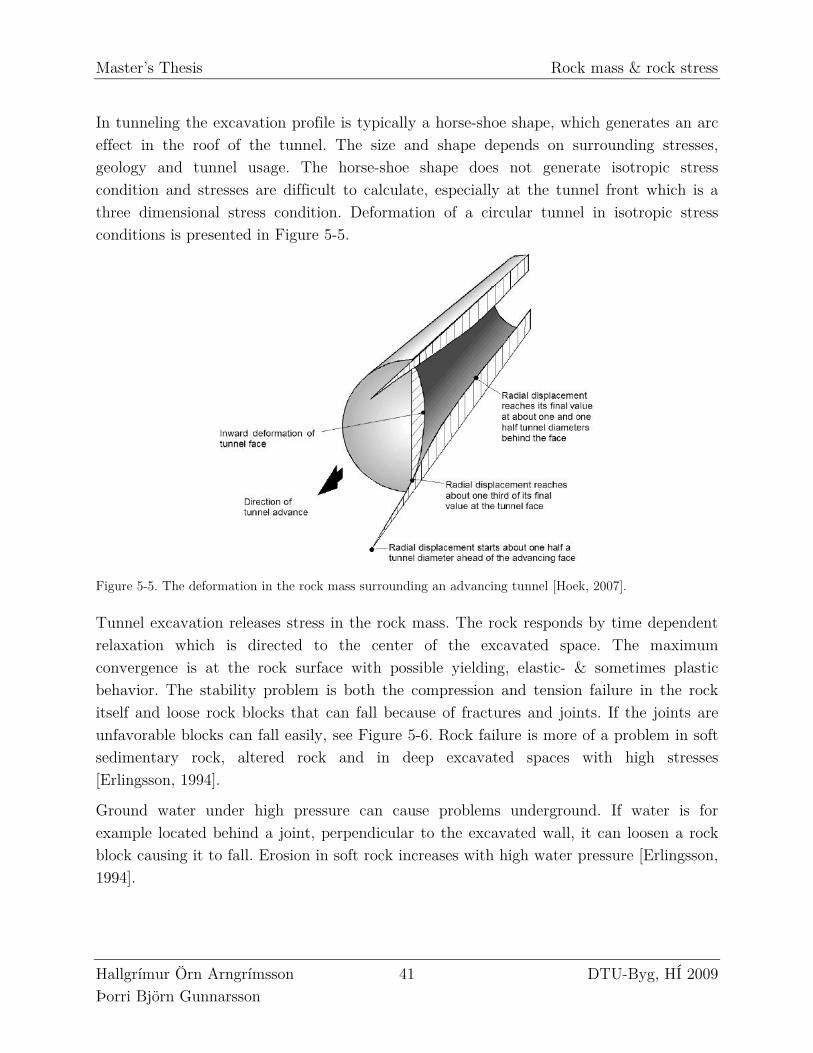
Master’s Thesis Rock mass & rock stress
Hallgrímur Örn Arngrímsson 41 DTU-Byg, HÍ 2009 Þorri Björn Gunnarsson
In tunneling the excavation profile is typically a horse-shoe shape, which generates an arc effect in the roof of the tunnel. The size and shape depends on surrounding stresses, geology and tunnel usage. The horse-shoe shape does not generate isotropic stress condition and stresses are difficult to calculate, especially at the tunnel front which is a three dimensional stress condition. Deformation of a circular tunnel in isotropic stress conditions is presented in Figure 5-5.
Figure 5-5. The deformation in the rock mass surrounding an advancing tunnel [Hoek, 2007].
Tunnel excavation releases stress in the rock mass. The rock responds by time dependent relaxation which is directed to the center of the excavated space. The maximum convergence is at the rock surface with possible yielding, elastic- & sometimes plastic behavior. The stability problem is both the compression and tension failure in the rock itself and loose rock blocks that can fall because of fractures and joints. If the joints are unfavorable blocks can fall easily, see Figure 5-6. Rock failure is more of a problem in soft sedimentary rock, altered rock and in deep excavated spaces with high stresses [Erlingsson, 1994].
Ground water under high pressure can cause problems underground. If water is for example located behind a joint, perpendicular to the excavated wall, it can loosen a rock block causing it to fall. Erosion in soft rock increases with high water pressure [Erlingsson, 1994].
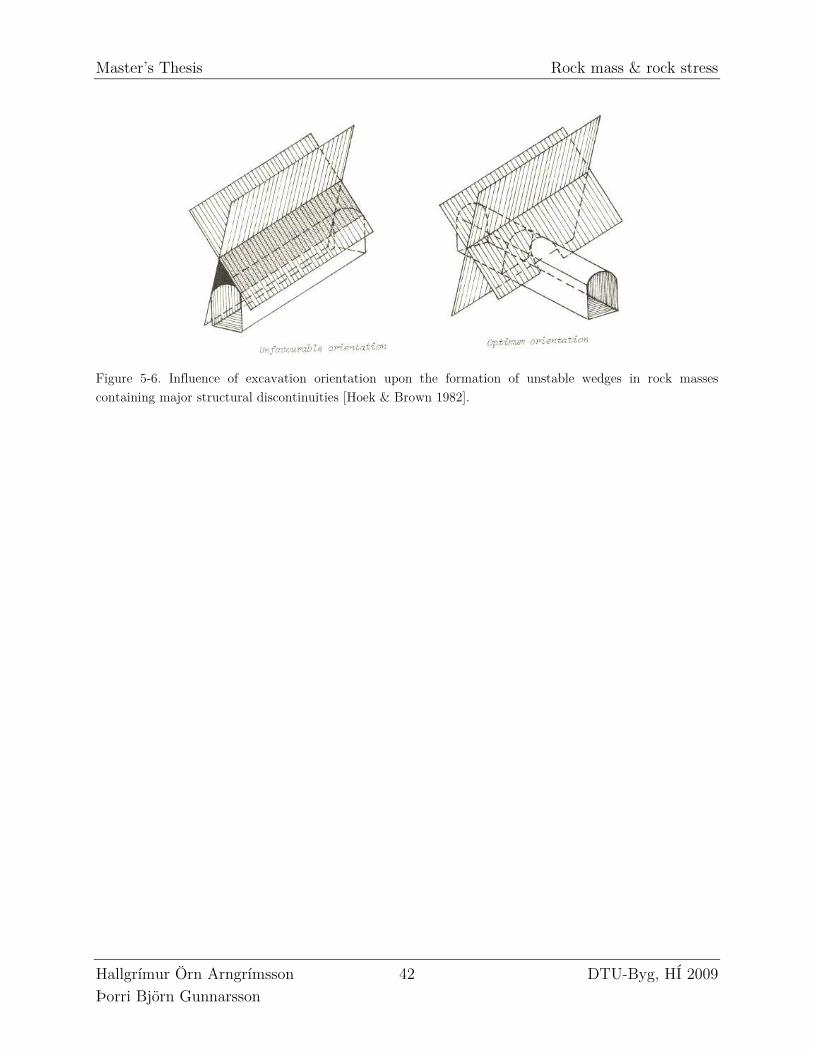
Master’s Thesis Rock mass & rock stress
Hallgrímur Örn Arngrímsson 42 DTU-Byg, HÍ 2009 Þorri Björn Gunnarsson
Figure 5-6. Influence of excavation orientation upon the formation of unstable wedges in rock masses containing major structural discontinuities [Hoek & Brown 1982].
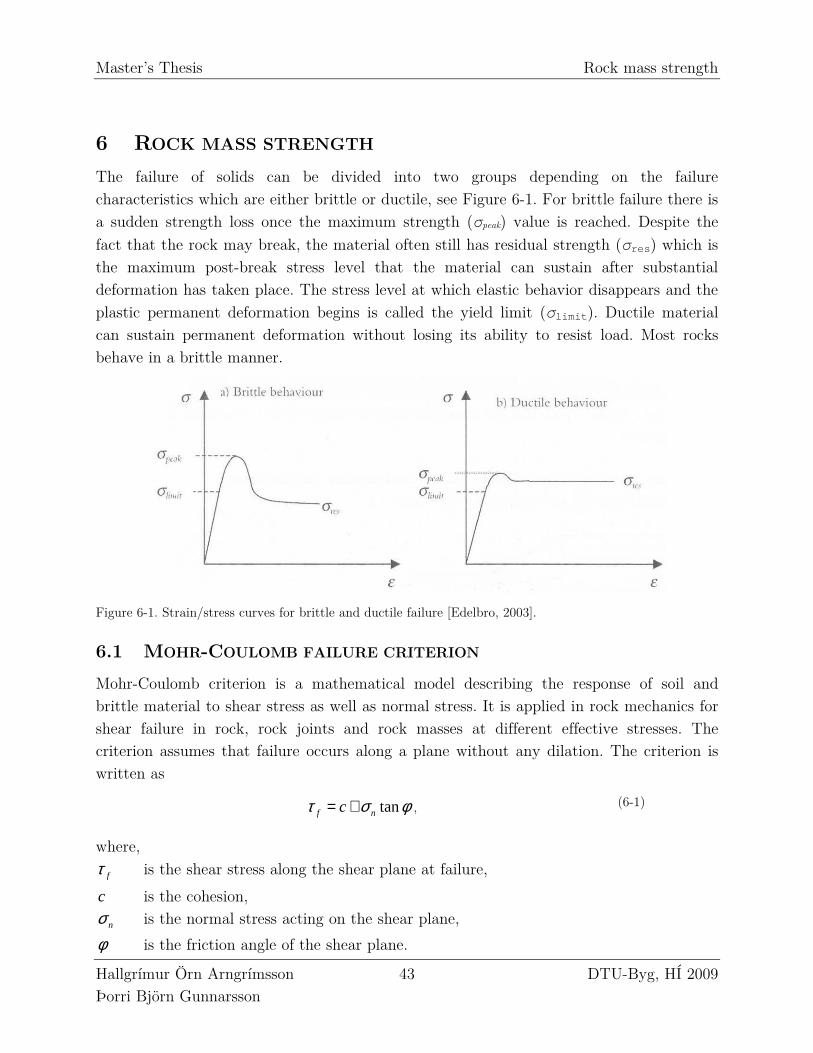
Master’s Thesis Rock mass strength
Hallgrímur Örn Arngrímsson 43 DTU-Byg, HÍ 2009 Þorri Björn Gunnarsson
6 ROCK MASS STRENGTH
The failure of solids can be divided into two groups depending on the failure characteristics which are either brittle or ductile, see Figure 6-1. For brittle failure there is a sudden strength loss once the maximum strength (σpeak) value is reached. Despite the fact that the rock may break, the material often still has residual strength (σres ) which is the maximum post-break stress level that the material can sustain after substantial deformation has taken place. The stress level at which elastic behavior disappears and the plastic permanent deformation begins is called the yield limit (σlimit ). Ductile material can sustain permanent deformation without losing its ability to resist load. Most rocks behave in a brittle manner.
Figure 6-1. Strain/stress curves for brittle and ductile failure [Edelbro, 2003].
6.1 MOHR-COULOMB FAILURE CRITERION
Mohr-Coulomb criterion is a mathematical model describing the response of soil and brittle material to shear stress as well as normal stress. It is applied in rock mechanics for shear failure in rock, rock joints and rock masses at different effective stresses. The criterion assumes that failure occurs along a plane without any dilation. The criterion is written as
tanf ncτ σ φ= + , (6-1)
where,
fτ is the shear stress along the shear plane at failure,
c is the cohesion,
nσ is the normal stress acting on the shear plane,
φ is the friction angle of the shear plane.
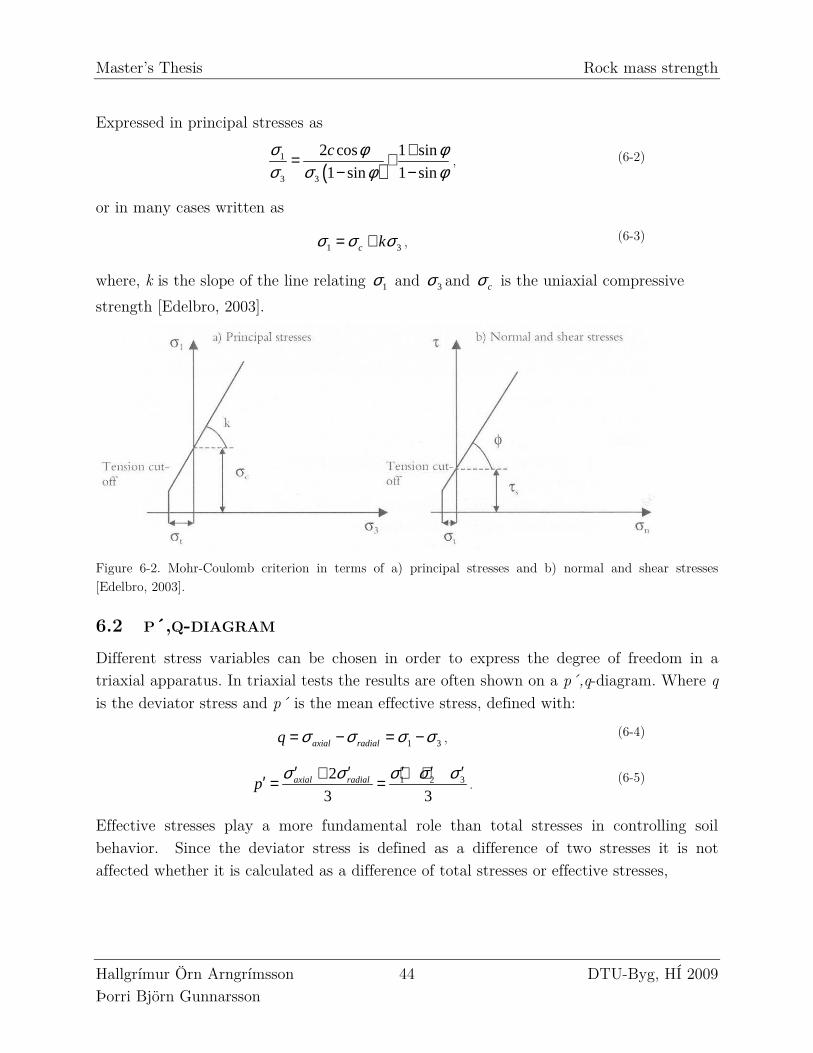
Master’s Thesis Rock mass strength
Hallgrímur Örn Arngrímsson 44 DTU-Byg, HÍ 2009 Þorri Björn Gunnarsson
Expressed in principal stresses as
( )1
3 3
2 cos 1 sin
1 sin 1 sin
cσ φ φσ σ φ φ
+= +− −
, (6-2)
or in many cases written as
1 3c kσ σ σ= + , (6-3)
where, k is the slope of the line relating 1σ and 3σ and cσ is the uniaxial compressive
strength [Edelbro, 2003].
Figure 6-2. Mohr-Coulomb criterion in terms of a) principal stresses and b) normal and shear stresses [Edelbro, 2003].
6.2 P´,Q-DIAGRAM
Different stress variables can be chosen in order to express the degree of freedom in a triaxial apparatus. In triaxial tests the results are often shown on a p´,q-diagram. Where q is the deviator stress and p´ is the mean effective stress, defined with:
1 3axial radialq σ σ σ σ= − = − , (6-4)
1 2 32
3 3axial radialp
σ σ σ σ σ′ ′ ′ ′ ′+ + +′ = = . (6-5)
Effective stresses play a more fundamental role than total stresses in controlling soil behavior. Since the deviator stress is defined as a difference of two stresses it is not affected whether it is calculated as a difference of total stresses or effective stresses,
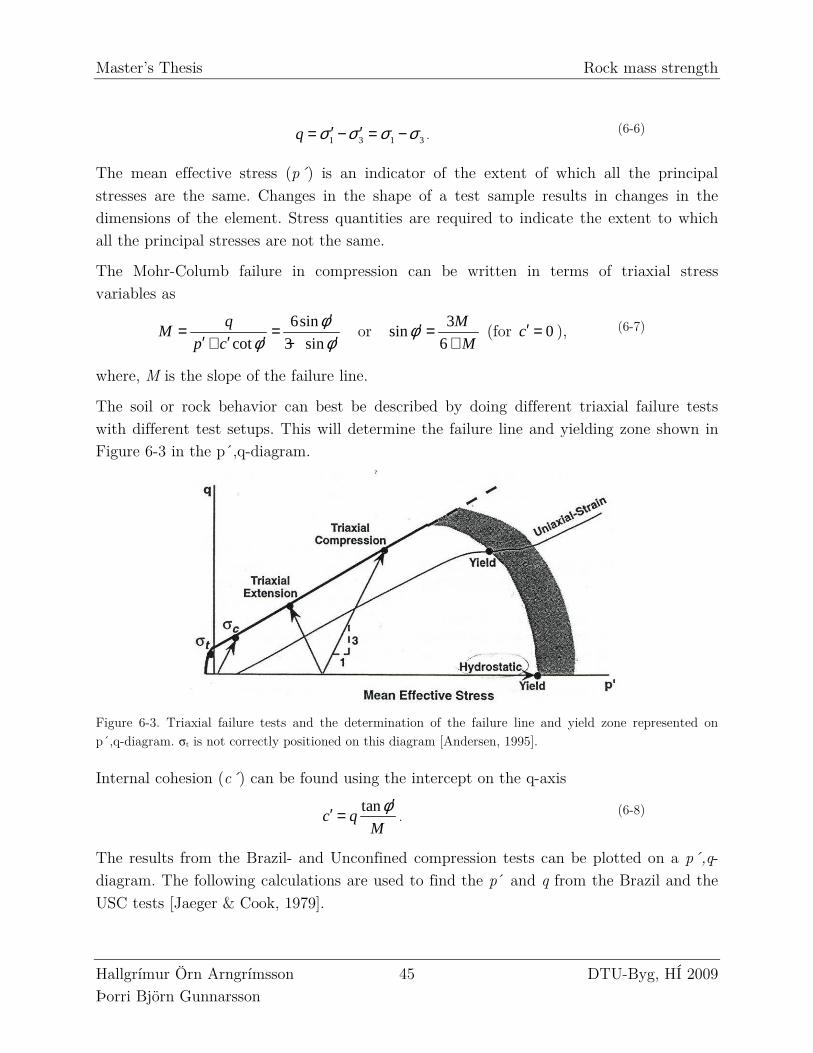
Master’s Thesis Rock mass strength
Hallgrímur Örn Arngrímsson 45 DTU-Byg, HÍ 2009 Þorri Björn Gunnarsson
1 3 1 3q σ σ σ σ′ ′= − = − . (6-6)
The mean effective stress (p´) is an indicator of the extent of which all the principal stresses are the same. Changes in the shape of a test sample results in changes in the dimensions of the element. Stress quantities are required to indicate the extent to which all the principal stresses are not the same.
The Mohr-Columb failure in compression can be written in terms of triaxial stress variables as
6sin
cot 3 sin
qM
p c
φφ φ
′= =
′ ′ ′ ′+ − or
3sin
6
M
Mφ′ =
+ (for 0c′ = ), (6-7)
where, M is the slope of the failure line.
The soil or rock behavior can best be described by doing different triaxial failure tests with different test setups. This will determine the failure line and yielding zone shown in Figure 6-3 in the p´,q-diagram.
Figure 6-3. Triaxial failure tests and the determination of the failure line and yield zone represented on p´,q-diagram. σt is not correctly positioned on this diagram [Andersen, 1995].
Internal cohesion (c´) can be found using the intercept on the q-axis
tanc q
M
φ′′ = . (6-8)
The results from the Brazil- and Unconfined compression tests can be plotted on a p´,q-diagram. The following calculations are used to find the p´ and q from the Brazil and the USC tests [Jaeger & Cook, 1979].
Master’s Thesis Rock mass strength
Hallgrímur Örn Arngrímsson 46 DTU-Byg, HÍ 2009 Þorri Björn Gunnarsson
Brazil tests:
( )1 2 33 0
3 3t tp
σ σσ σ σ + + −′ ′ ′+ +′ = = , (6-9)
13 tq σ= ⋅ . (6-10)
UCS tests:
1 2 3 0 0
3 3cp
σ σ σ σ′ ′ ′+ + + +′ = = , (6-11)
cq σ= . (6-12)
6.3 MADLAND PROCEDURE
Madland procedure is a alternative method of interpreting tensile and compression strength results to find cohesion and friction angle for soil and rock masses. It uses the average values from both Brazil and USC tests with the following equations [Korsnes, Madland & Risnes, 2002]
,
,
c avgratio
t avg
σσ
σ= , (6-13)
where,
,c avgσ is the average compression strength,
,t avgσ is the average tensile strength,
4a sin
2ratio
ratio
σϕσ −′ = −
, (6-14)
,
1 sin
2cosc avgcϕσϕ
′ −′ = ′ . (6-15)
The effective cohesion can also be simplified to
,´ 3 t avgc σ= × . (6-16)
6.4 HOEK BROWN FAILURE CRITERION
A well known rock mass failure criteria is the Hoek-Brown failure criterion (published in 1980 and updated in 1983, 1988, 1995, 1997, 2001 and 2002). In the original version the rock mass rating parameters from the RMR-system were used but for the generalized
Master’s Thesis Rock mass strength
Hallgrímur Örn Arngrímsson 47 DTU-Byg, HÍ 2009 Þorri Björn Gunnarsson
Hoek-Brown criterion from 1995 the Geological Strength Index (GSI) was suggested. This was because the RMR and the Q-system were deemed not suitable for poor rock masses [Edelbro, 2003]. RMR, Q-system and GSI are described in 7.1.
The 2002 edition of the Hoek-Brown failure criterion [Hoek, 2002] the generalized expression is used
31 3
a
c bc
m sσσ σ σσ
′′ ′= + +
, (6-17)
the material constants mb, s and a are written as,
100exp
28 14b i
GSIm m
D
− = − ,
100exp
9 3
GSIs
D
− = − ,
( )/15 20 /31 1
2 6GSIa e e− −= + − ,
where, mi is a material constant for intact rock, mb is reduced value for the material constant mi, s is a material constant for rock mass (s = 1 for intact rock), a is a material constant for rock mass, D is a disturbance factor (D = 0 for undisturbed in situ rock masses and D = 1 for
very disturbed rock mass).
6.5 ROCLAB
Rock properties can be determined from direct measurements of intact rock samples in the lab e.g. Uniaxial compression test (σc), Brazil test (σt) and Triaxial test (σc, E, ν). The values cannot be used directly in a research model because of scaling and discontinuities in the rock mass. Therefore the software program RocLab is used for determining rock mass strength parameters based on the generalized Hoek-Brown failure criterion.
RocLab uses the input parameters σci, mi, GSI, and D for determination of Hoek-Brown failure criterion parameters mb, s and a, where σci is the in-situ stress [Hoek 2002]. The parameters σci, mi, can also be determined, from experimental data for example, Brazil-, Uniaxial compression- and Triaxial results. Rock mass properties determined by RocLab can e.g. be used as input for numerical analysis programs such as Phase2.
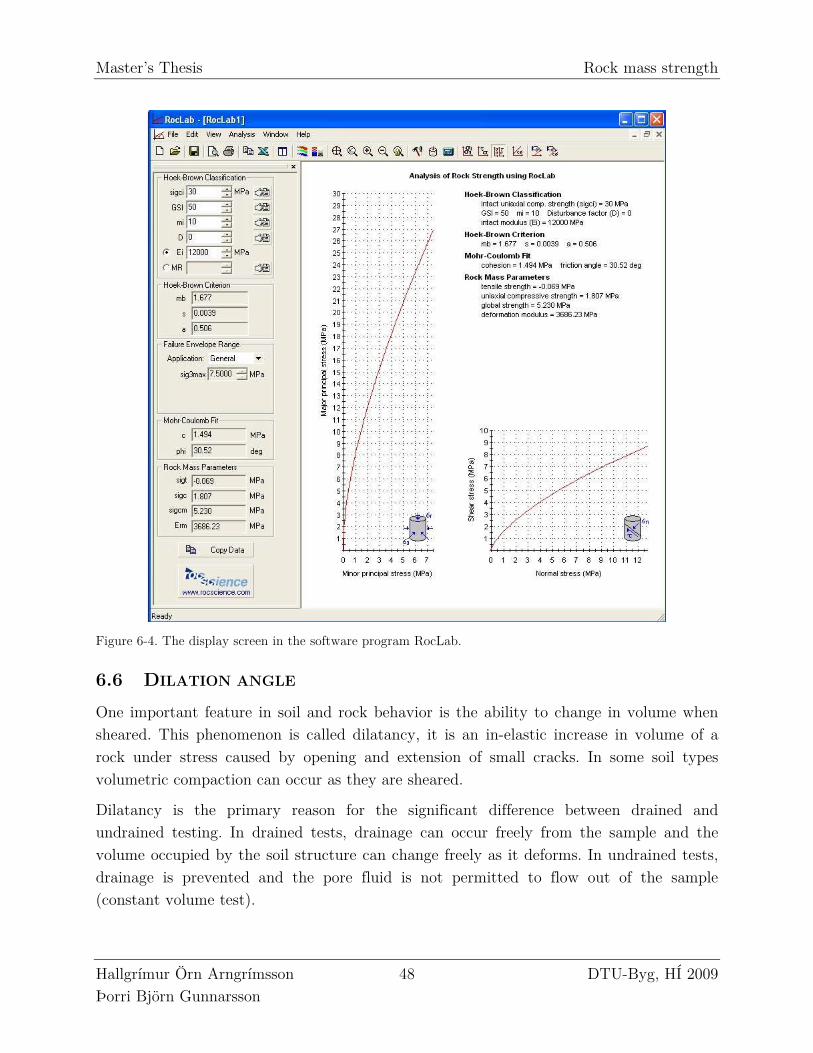
Master’s Thesis Rock mass strength
Hallgrímur Örn Arngrímsson 48 DTU-Byg, HÍ 2009 Þorri Björn Gunnarsson
Figure 6-4. The display screen in the software program RocLab.
6.6 DILATION ANGLE
One important feature in soil and rock behavior is the ability to change in volume when sheared. This phenomenon is called dilatancy, it is an in-elastic increase in volume of a rock under stress caused by opening and extension of small cracks. In some soil types volumetric compaction can occur as they are sheared.
Dilatancy is the primary reason for the significant difference between drained and undrained testing. In drained tests, drainage can occur freely from the sample and the volume occupied by the soil structure can change freely as it deforms. In undrained tests, drainage is prevented and the pore fluid is not permitted to flow out of the sample (constant volume test).
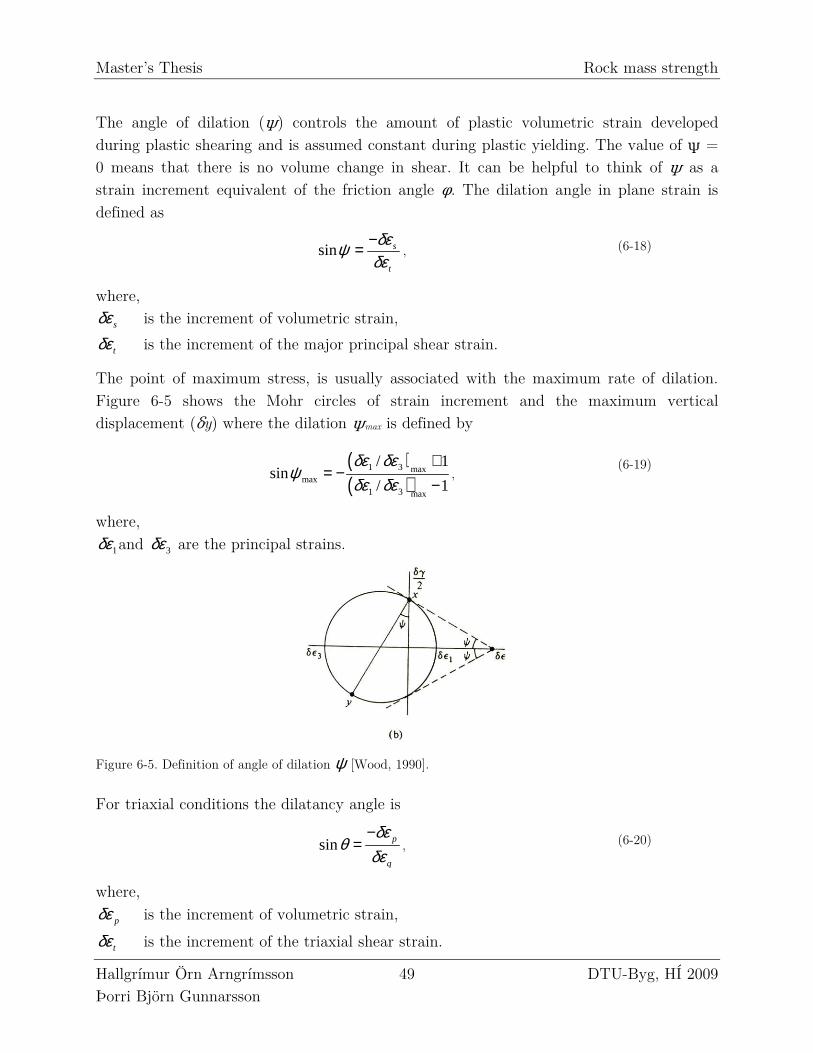
Master’s Thesis Rock mass strength
Hallgrímur Örn Arngrímsson 49 DTU-Byg, HÍ 2009 Þorri Björn Gunnarsson
The angle of dilation (ψ) controls the amount of plastic volumetric strain developed during plastic shearing and is assumed constant during plastic yielding. The value of ψ = 0 means that there is no volume change in shear. It can be helpful to think of ψ as a strain increment equivalent of the friction angle φ. The dilation angle in plane strain is defined as
sin s
t
δεψδε
−= , (6-18)
where,
sδε is the increment of volumetric strain,
tδε is the increment of the major principal shear strain.
The point of maximum stress, is usually associated with the maximum rate of dilation. Figure 6-5 shows the Mohr circles of strain increment and the maximum vertical displacement (δy) where the dilation ψmax is defined by
( )( )
1 3 maxmax
1 3 max
/ 1sin
/ 1
δε δεψ
δε δε+
= −−
, (6-19)
where,
1δε and 3δε are the principal strains.
Figure 6-5. Definition of angle of dilation ψ [Wood, 1990].
For triaxial conditions the dilatancy angle is
sin p
q
δεθ
δε−
= , (6-20)
where,
pδε is the increment of volumetric strain,
tδε is the increment of the triaxial shear strain.

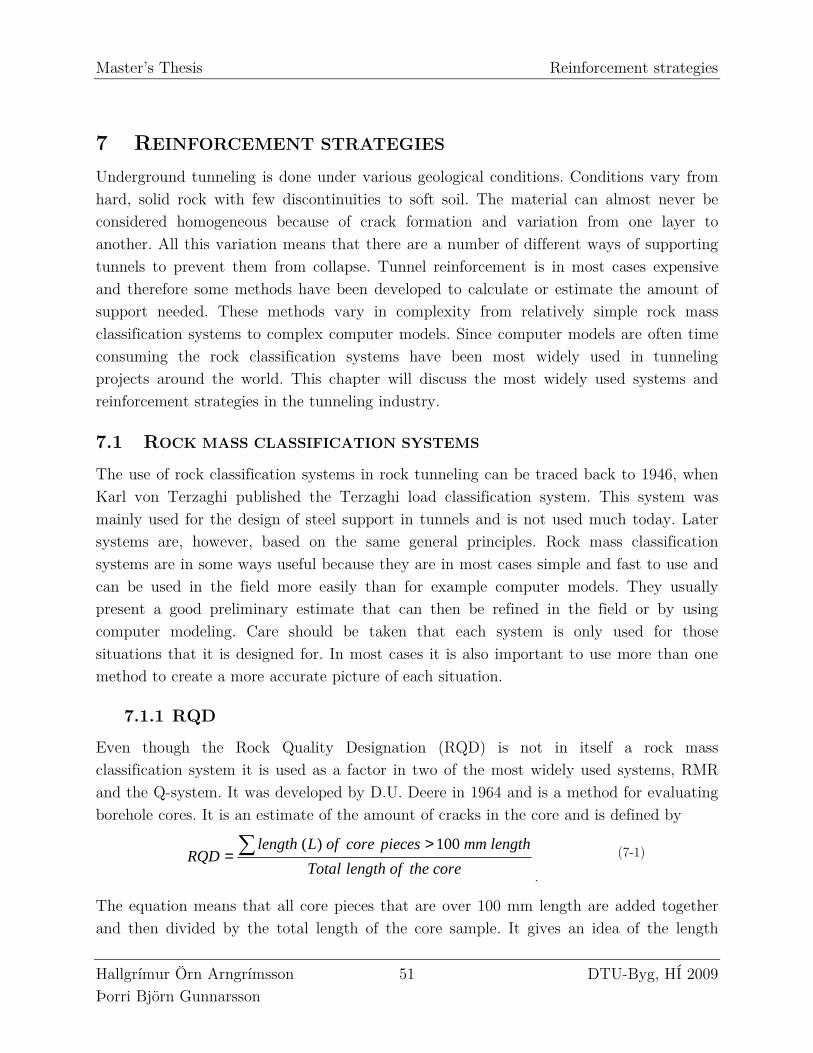
Master’s Thesis Reinforcement strategies
Hallgrímur Örn Arngrímsson 51 DTU-Byg, HÍ 2009 Þorri Björn Gunnarsson
7 REINFORCEMENT STRATEGIES
Underground tunneling is done under various geological conditions. Conditions vary from hard, solid rock with few discontinuities to soft soil. The material can almost never be considered homogeneous because of crack formation and variation from one layer to another. All this variation means that there are a number of different ways of supporting tunnels to prevent them from collapse. Tunnel reinforcement is in most cases expensive and therefore some methods have been developed to calculate or estimate the amount of support needed. These methods vary in complexity from relatively simple rock mass classification systems to complex computer models. Since computer models are often time consuming the rock classification systems have been most widely used in tunneling projects around the world. This chapter will discuss the most widely used systems and reinforcement strategies in the tunneling industry.
7.1 ROCK MASS CLASSIFICATION SYSTEMS
The use of rock classification systems in rock tunneling can be traced back to 1946, when Karl von Terzaghi published the Terzaghi load classification system. This system was mainly used for the design of steel support in tunnels and is not used much today. Later systems are, however, based on the same general principles. Rock mass classification systems are in some ways useful because they are in most cases simple and fast to use and can be used in the field more easily than for example computer models. They usually present a good preliminary estimate that can then be refined in the field or by using computer modeling. Care should be taken that each system is only used for those situations that it is designed for. In most cases it is also important to use more than one method to create a more accurate picture of each situation.
7.1.1 RQD
Even though the Rock Quality Designation (RQD) is not in itself a rock mass classification system it is used as a factor in two of the most widely used systems, RMR and the Q-system. It was developed by D.U. Deere in 1964 and is a method for evaluating borehole cores. It is an estimate of the amount of cracks in the core and is defined by
coretheoflengthTotal
lengthmmpiecescoreofLlengthRQD ∑ >
=100)(
.
(7-1)
The equation means that all core pieces that are over 100 mm length are added together and then divided by the total length of the core sample. It gives an idea of the length
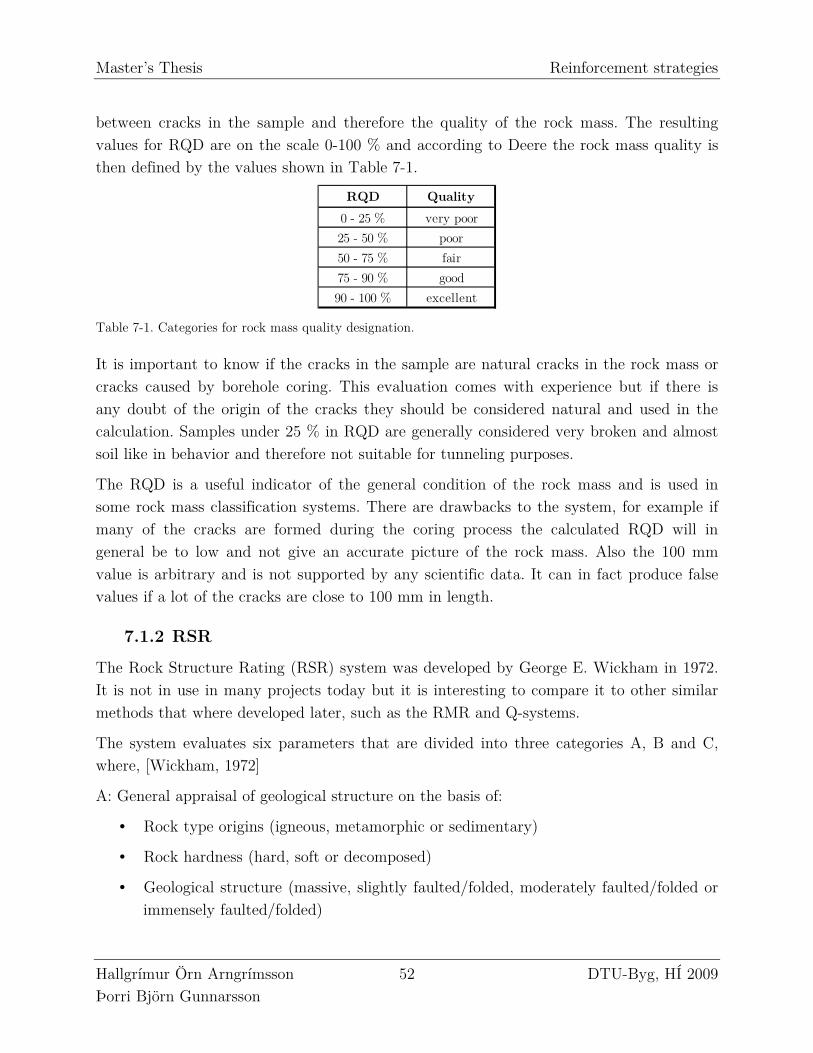
Master’s Thesis Reinforcement strategies
Hallgrímur Örn Arngrímsson 52 DTU-Byg, HÍ 2009 Þorri Björn Gunnarsson
between cracks in the sample and therefore the quality of the rock mass. The resulting values for RQD are on the scale 0-100 % and according to Deere the rock mass quality is then defined by the values shown in Table 7-1.
RQD Quality
0 - 25 % very poor
25 - 50 % poor
50 - 75 % fair
75 - 90 % good
90 - 100 % excellent Table 7-1. Categories for rock mass quality designation.
It is important to know if the cracks in the sample are natural cracks in the rock mass or cracks caused by borehole coring. This evaluation comes with experience but if there is any doubt of the origin of the cracks they should be considered natural and used in the calculation. Samples under 25 % in RQD are generally considered very broken and almost soil like in behavior and therefore not suitable for tunneling purposes.
The RQD is a useful indicator of the general condition of the rock mass and is used in some rock mass classification systems. There are drawbacks to the system, for example if many of the cracks are formed during the coring process the calculated RQD will in general be to low and not give an accurate picture of the rock mass. Also the 100 mm value is arbitrary and is not supported by any scientific data. It can in fact produce false values if a lot of the cracks are close to 100 mm in length.
7.1.2 RSR
The Rock Structure Rating (RSR) system was developed by George E. Wickham in 1972. It is not in use in many projects today but it is interesting to compare it to other similar methods that where developed later, such as the RMR and Q-systems.
The system evaluates six parameters that are divided into three categories A, B and C, where, [Wickham, 1972]
A: General appraisal of geological structure on the basis of:
• Rock type origins (igneous, metamorphic or sedimentary)
• Rock hardness (hard, soft or decomposed)
• Geological structure (massive, slightly faulted/folded, moderately faulted/folded or immensely faulted/folded)
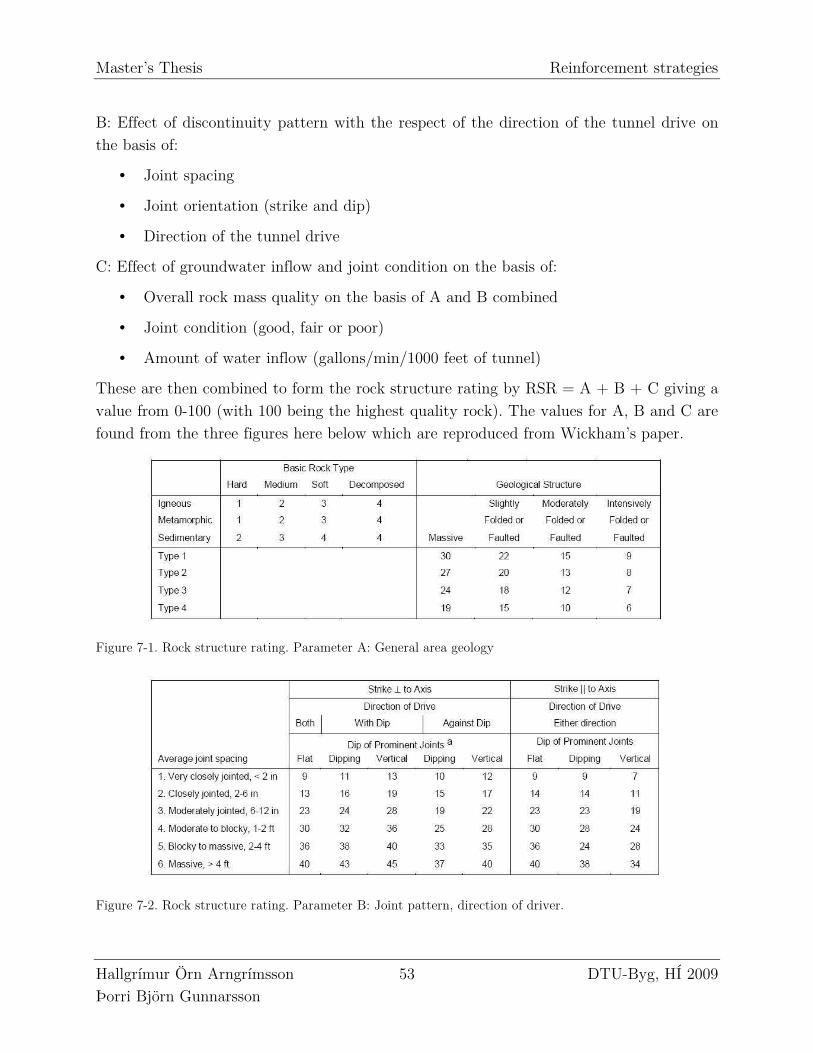
Master’s Thesis Reinforcement strategies
Hallgrímur Örn Arngrímsson 53 DTU-Byg, HÍ 2009 Þorri Björn Gunnarsson
B: Effect of discontinuity pattern with the respect of the direction of the tunnel drive on the basis of:
• Joint spacing
• Joint orientation (strike and dip)
• Direction of the tunnel drive
C: Effect of groundwater inflow and joint condition on the basis of:
• Overall rock mass quality on the basis of A and B combined
• Joint condition (good, fair or poor)
• Amount of water inflow (gallons/min/1000 feet of tunnel)
These are then combined to form the rock structure rating by RSR = A + B + C giving a value from 0-100 (with 100 being the highest quality rock). The values for A, B and C are found from the three figures here below which are reproduced from Wickham’s paper.
Figure 7-1. Rock structure rating. Parameter A: General area geology
Figure 7-2. Rock structure rating. Parameter B: Joint pattern, direction of driver.
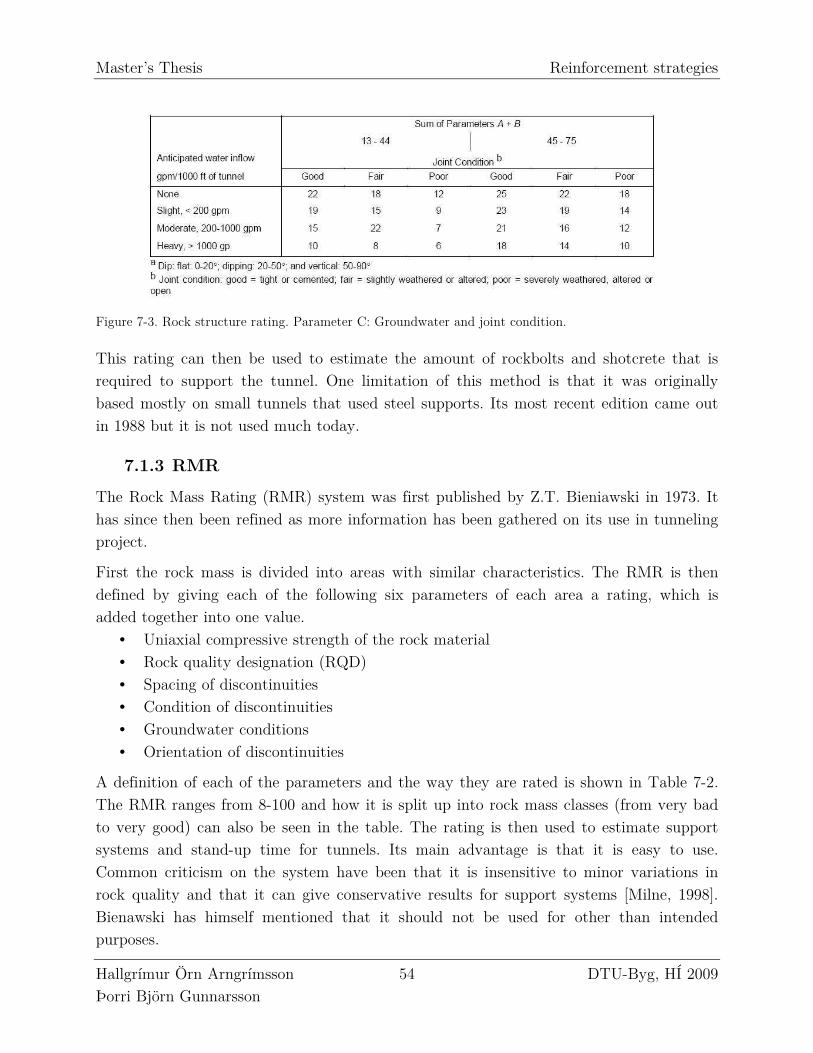
Master’s Thesis Reinforcement strategies
Hallgrímur Örn Arngrímsson 54 DTU-Byg, HÍ 2009 Þorri Björn Gunnarsson
Figure 7-3. Rock structure rating. Parameter C: Groundwater and joint condition.
This rating can then be used to estimate the amount of rockbolts and shotcrete that is required to support the tunnel. One limitation of this method is that it was originally based mostly on small tunnels that used steel supports. Its most recent edition came out in 1988 but it is not used much today.
7.1.3 RMR
The Rock Mass Rating (RMR) system was first published by Z.T. Bieniawski in 1973. It has since then been refined as more information has been gathered on its use in tunneling project.
First the rock mass is divided into areas with similar characteristics. The RMR is then defined by giving each of the following six parameters of each area a rating, which is added together into one value.
• Uniaxial compressive strength of the rock material • Rock quality designation (RQD) • Spacing of discontinuities • Condition of discontinuities • Groundwater conditions • Orientation of discontinuities
A definition of each of the parameters and the way they are rated is shown in Table 7-2. The RMR ranges from 8-100 and how it is split up into rock mass classes (from very bad to very good) can also be seen in the table. The rating is then used to estimate support systems and stand-up time for tunnels. Its main advantage is that it is easy to use. Common criticism on the system have been that it is insensitive to minor variations in rock quality and that it can give conservative results for support systems [Milne, 1998]. Bienawski has himself mentioned that it should not be used for other than intended purposes.
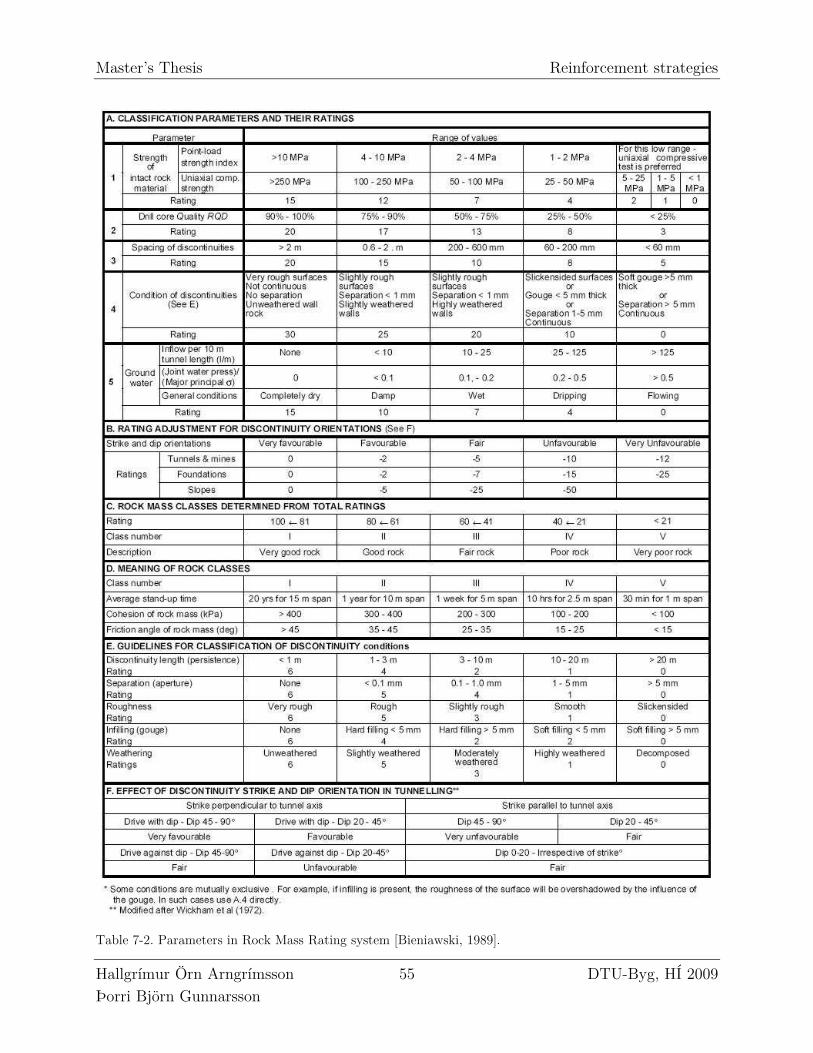
Master’s Thesis Reinforcement strategies
Hallgrímur Örn Arngrímsson 55 DTU-Byg, HÍ 2009 Þorri Björn Gunnarsson
Table 7-2. Parameters in Rock Mass Rating system [Bieniawski, 1989].
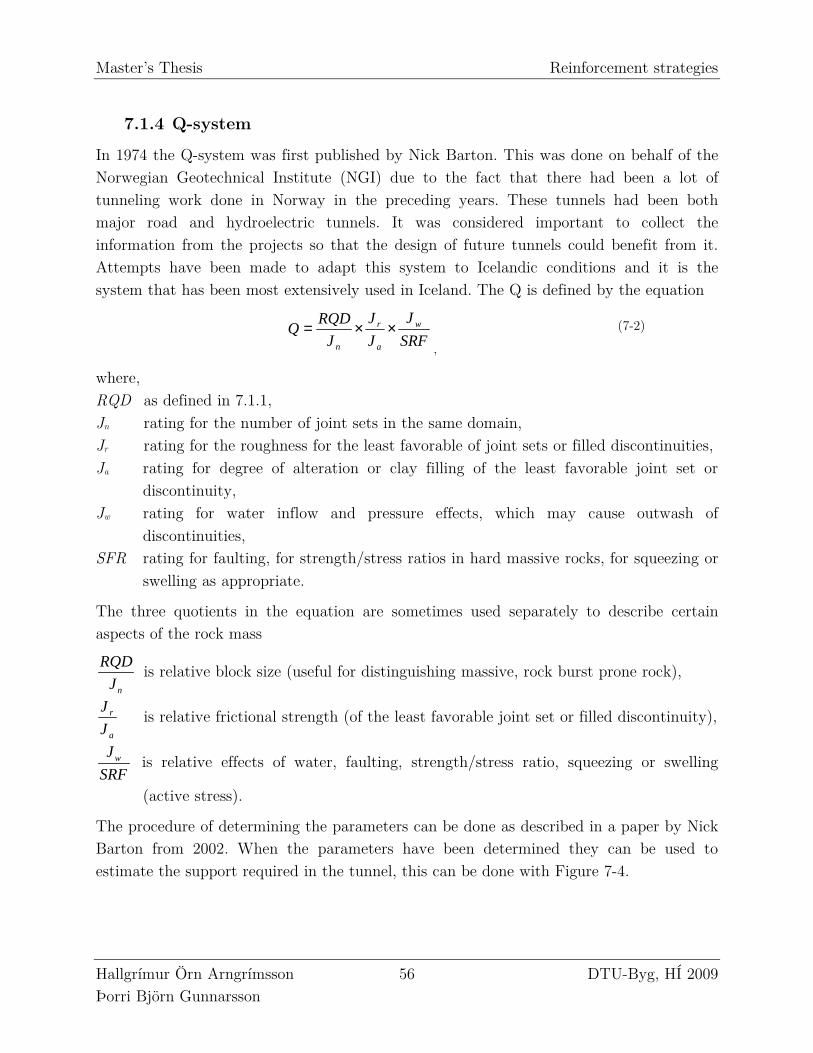
Master’s Thesis Reinforcement strategies
Hallgrímur Örn Arngrímsson 56 DTU-Byg, HÍ 2009 Þorri Björn Gunnarsson
7.1.4 Q-system
In 1974 the Q-system was first published by Nick Barton. This was done on behalf of the Norwegian Geotechnical Institute (NGI) due to the fact that there had been a lot of tunneling work done in Norway in the preceding years. These tunnels had been both major road and hydroelectric tunnels. It was considered important to collect the information from the projects so that the design of future tunnels could benefit from it. Attempts have been made to adapt this system to Icelandic conditions and it is the system that has been most extensively used in Iceland. The Q is defined by the equation
SRF
J
J
J
J
RQDQ w
a
r
n
××=,
(7-2)
where, RQD as defined in 7.1.1, Jn rating for the number of joint sets in the same domain, Jr rating for the roughness for the least favorable of joint sets or filled discontinuities, Ja rating for degree of alteration or clay filling of the least favorable joint set or
discontinuity, Jw rating for water inflow and pressure effects, which may cause outwash of
discontinuities, SFR rating for faulting, for strength/stress ratios in hard massive rocks, for squeezing or
swelling as appropriate.
The three quotients in the equation are sometimes used separately to describe certain aspects of the rock mass
n
RQD
J is relative block size (useful for distinguishing massive, rock burst prone rock),
a
r
J
J is relative frictional strength (of the least favorable joint set or filled discontinuity),
wJ
SRF is relative effects of water, faulting, strength/stress ratio, squeezing or swelling
(active stress).
The procedure of determining the parameters can be done as described in a paper by Nick Barton from 2002. When the parameters have been determined they can be used to estimate the support required in the tunnel, this can be done with Figure 7-4.
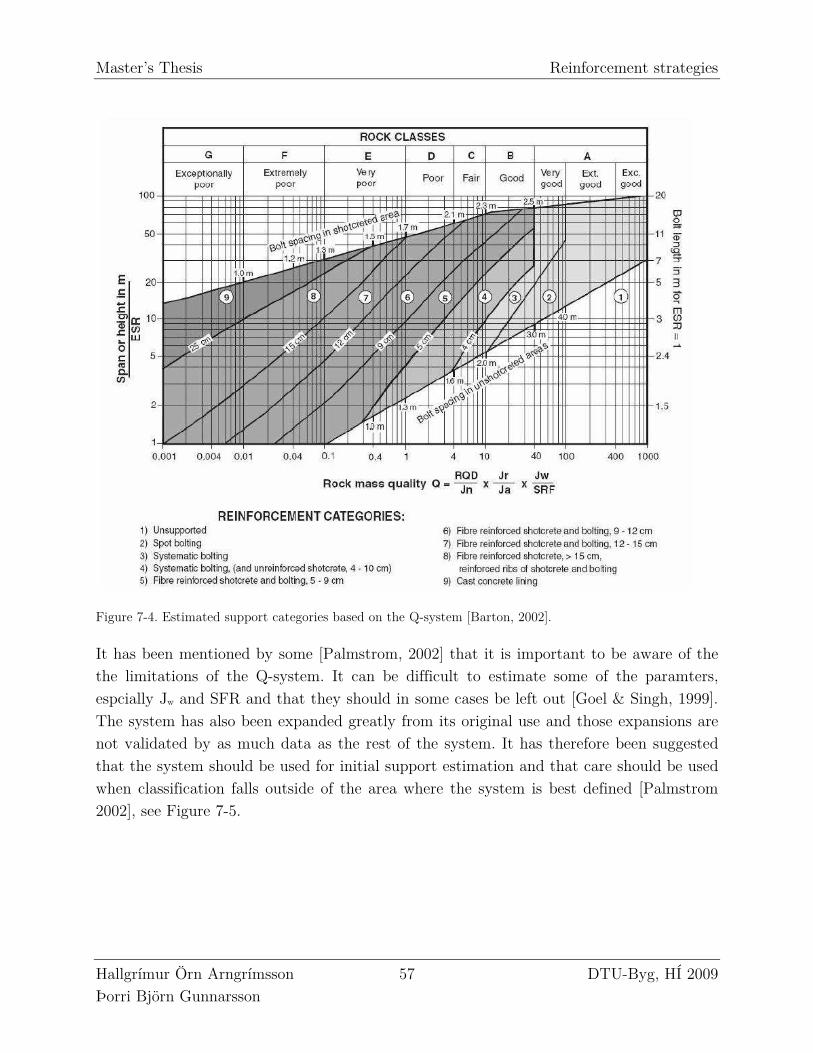
Master’s Thesis Reinforcement strategies
Hallgrímur Örn Arngrímsson 57 DTU-Byg, HÍ 2009 Þorri Björn Gunnarsson
Figure 7-4. Estimated support categories based on the Q-system [Barton, 2002].
It has been mentioned by some [Palmstrom, 2002] that it is important to be aware of the the limitations of the Q-system. It can be difficult to estimate some of the paramters, espcially Jw and SFR and that they should in some cases be left out [Goel & Singh, 1999]. The system has also been expanded greatly from its original use and those expansions are not validated by as much data as the rest of the system. It has therefore been suggested that the system should be used for initial support estimation and that care should be used when classification falls outside of the area where the system is best defined [Palmstrom 2002], see Figure 7-5.
Master’s Thesis Reinforcement strategies
Hallgrímur Örn Arngrímsson 58 DTU-Byg, HÍ 2009 Þorri Björn Gunnarsson
Figure 7-5. Limitations in the Q-system rock support diagram [Palmstrom, 2002].
7.1.5 GSI
The Geological Strength Index (GSI) was first published by Hoek in 1992. It was then developed further for use in the Hoek and Brown failure criterion (1994, ´95 and ´97). It was developed as an alternate classification system where the emphasis would be on the geological estimation of rock mass properties rather than on the required tunnel reinforcement and support. It was also developed because it had been found that in some cases of poor rock the other classification systems, such as RMR were difficult to apply and did not work as well as for better quality rock [Hoek, 2005b]. There are two parameters that are estimated according to the GSI system, these are the rock mass structure and surface quality. These parameters are estimated from figures (examples are shown on Figure 7-6 and Figure 7-7) and based on them a value for GSI is determined. GSI is not used in the same way as the other rock mass classification systems, to
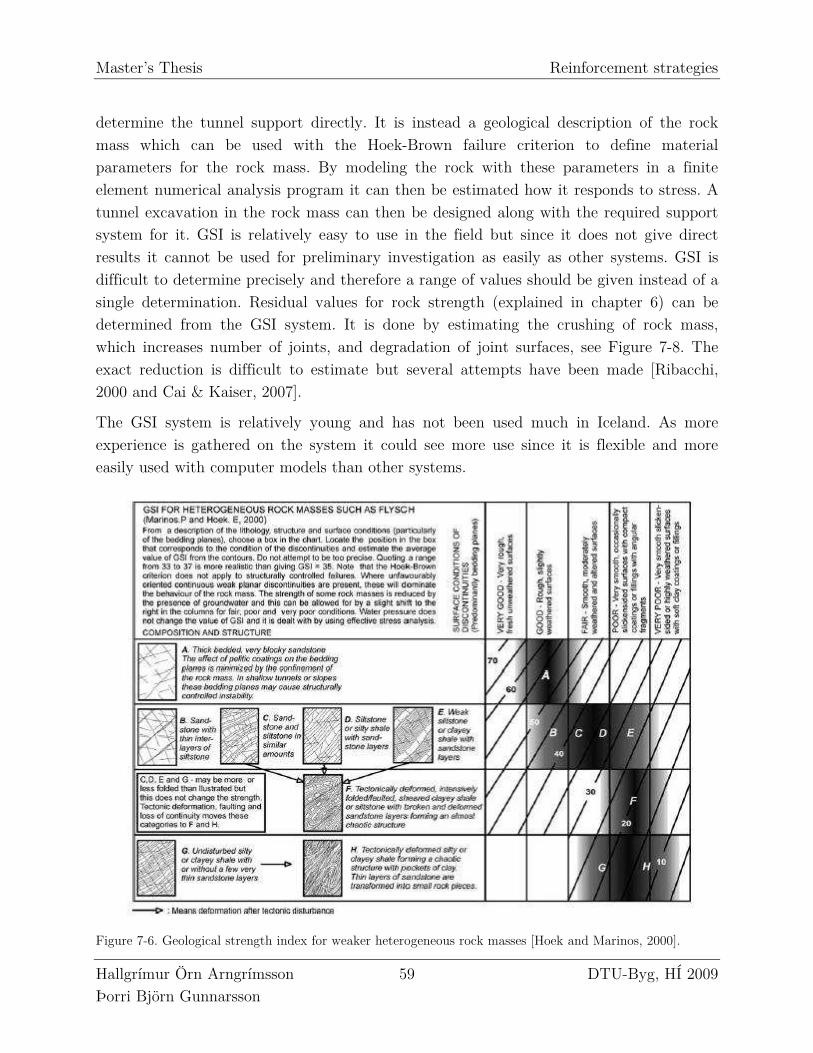
Master’s Thesis Reinforcement strategies
Hallgrímur Örn Arngrímsson 59 DTU-Byg, HÍ 2009 Þorri Björn Gunnarsson
determine the tunnel support directly. It is instead a geological description of the rock mass which can be used with the Hoek-Brown failure criterion to define material parameters for the rock mass. By modeling the rock with these parameters in a finite element numerical analysis program it can then be estimated how it responds to stress. A tunnel excavation in the rock mass can then be designed along with the required support system for it. GSI is relatively easy to use in the field but since it does not give direct results it cannot be used for preliminary investigation as easily as other systems. GSI is difficult to determine precisely and therefore a range of values should be given instead of a single determination. Residual values for rock strength (explained in chapter 6) can be determined from the GSI system. It is done by estimating the crushing of rock mass, which increases number of joints, and degradation of joint surfaces, see Figure 7-8. The exact reduction is difficult to estimate but several attempts have been made [Ribacchi, 2000 and Cai & Kaiser, 2007].
The GSI system is relatively young and has not been used much in Iceland. As more experience is gathered on the system it could see more use since it is flexible and more easily used with computer models than other systems.
Figure 7-6. Geological strength index for weaker heterogeneous rock masses [Hoek and Marinos, 2000].
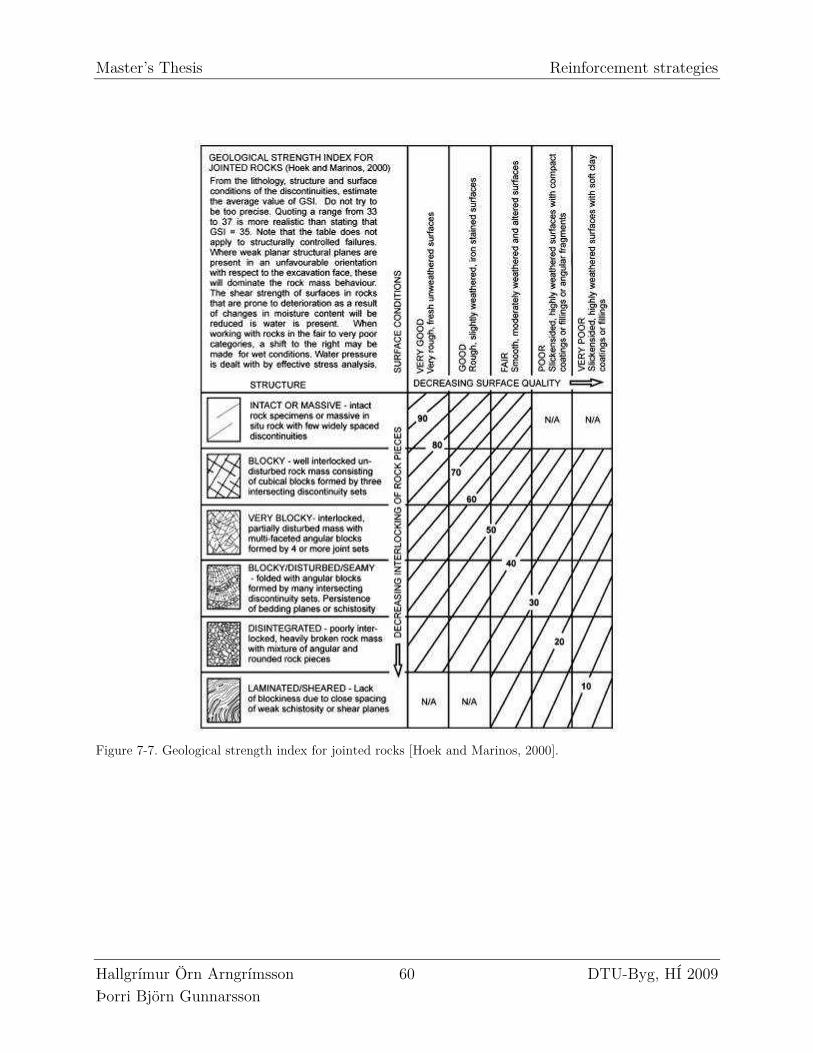
Master’s Thesis Reinforcement strategies
Hallgrímur Örn Arngrímsson 60 DTU-Byg, HÍ 2009 Þorri Björn Gunnarsson
Figure 7-7. Geological strength index for jointed rocks [Hoek and Marinos, 2000].
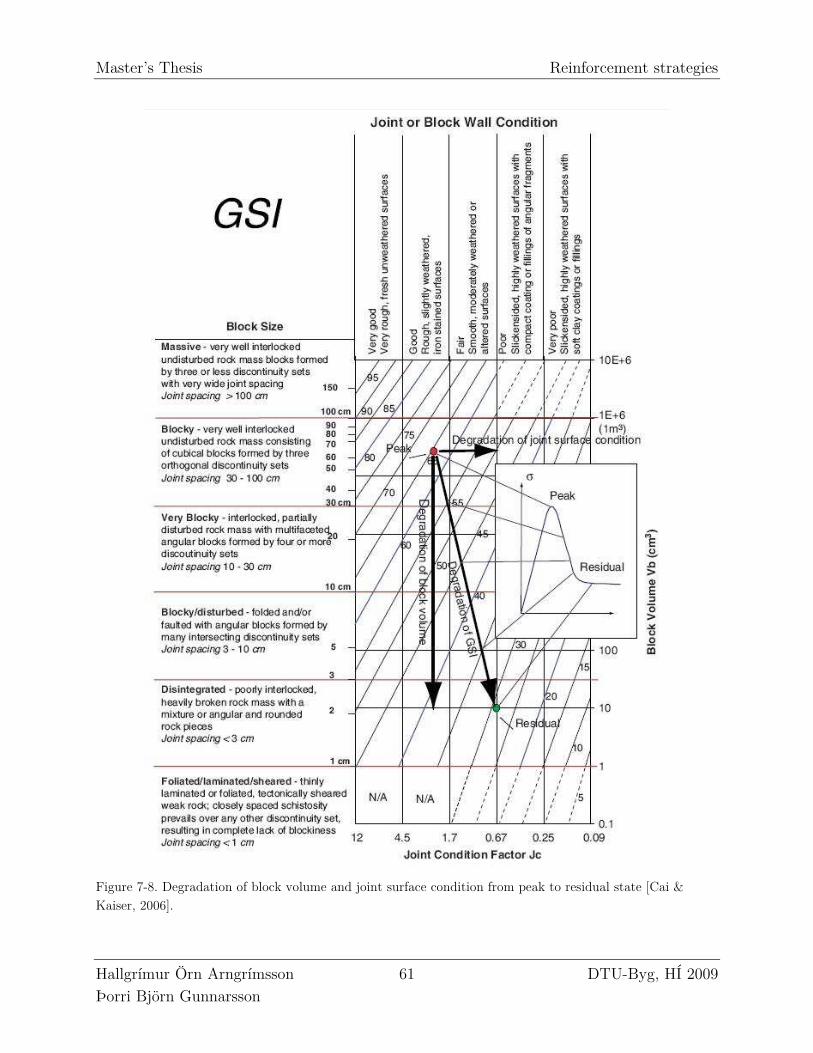
Master’s Thesis Reinforcement strategies
Hallgrímur Örn Arngrímsson 61 DTU-Byg, HÍ 2009 Þorri Björn Gunnarsson
Figure 7-8. Degradation of block volume and joint surface condition from peak to residual state [Cai & Kaiser, 2006].
Master’s Thesis Reinforcement strategies
Hallgrímur Örn Arngrímsson 62 DTU-Byg, HÍ 2009 Þorri Björn Gunnarsson
7.1.6 RMi
Another system in estimating the properties of rock properties was proposed by Palmstrom in 1995. This system, the Rock Mass Index (RMi), characterizes the rock mass as a construction material and is expressed in the following equation
pc JqRMi ⋅= [MPa] (7-3)
where, qc Uniaxial compressive strength of the intact rock material [MPa], Jp Jointing parameter composed by the following jointing characteristics; density
(block volume), roughness, alteration and size.
The value Jp is defined as: 0,50,2( ) ( )DpJ jC Vb= ⋅ (7-4)
where, 2,037,0 −⋅= jCD ,
Vb Block volume [m3], jC Joint condition factor found with:
)/( jAjRjLjC =
where, jA Joint alteration, jR Joint roughness, jL Joint size.
7.2 COMPARISON BETWEEN SYSTEMS
Since various rock mass classification systems have been developed for different purposes by using different input parameters, a direct comparison between the systems is difficult. Some equations have been created which describe these relationships but they should be used carefully [Erlingsson, 1994].
For the two most common systems the following correlation has been found
AQRMR += ln9 (7-5)
where, A is a value from 26 to 62 with a mean value of 44 [Bieniawski, 1989]
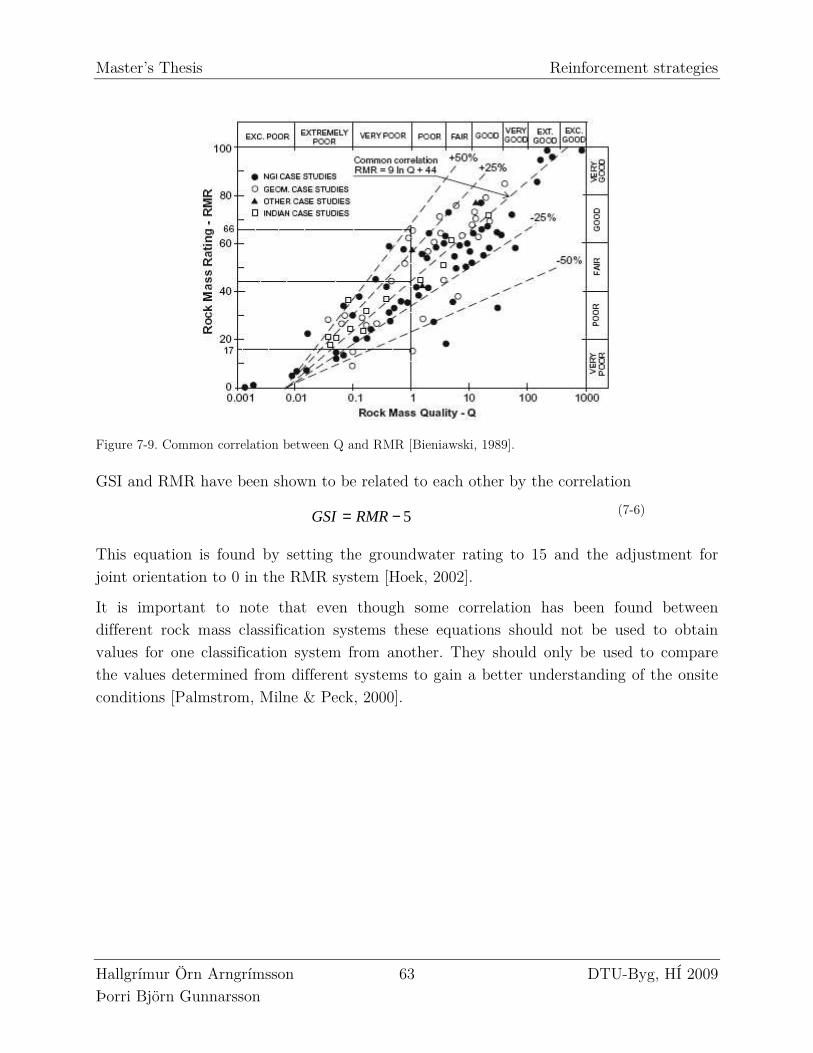
Master’s Thesis Reinforcement strategies
Hallgrímur Örn Arngrímsson 63 DTU-Byg, HÍ 2009 Þorri Björn Gunnarsson
Figure 7-9. Common correlation between Q and RMR [Bieniawski, 1989].
GSI and RMR have been shown to be related to each other by the correlation
5−= RMRGSI (7-6)
This equation is found by setting the groundwater rating to 15 and the adjustment for joint orientation to 0 in the RMR system [Hoek, 2002].
It is important to note that even though some correlation has been found between different rock mass classification systems these equations should not be used to obtain values for one classification system from another. They should only be used to compare the values determined from different systems to gain a better understanding of the onsite conditions [Palmstrom, Milne & Peck, 2000].

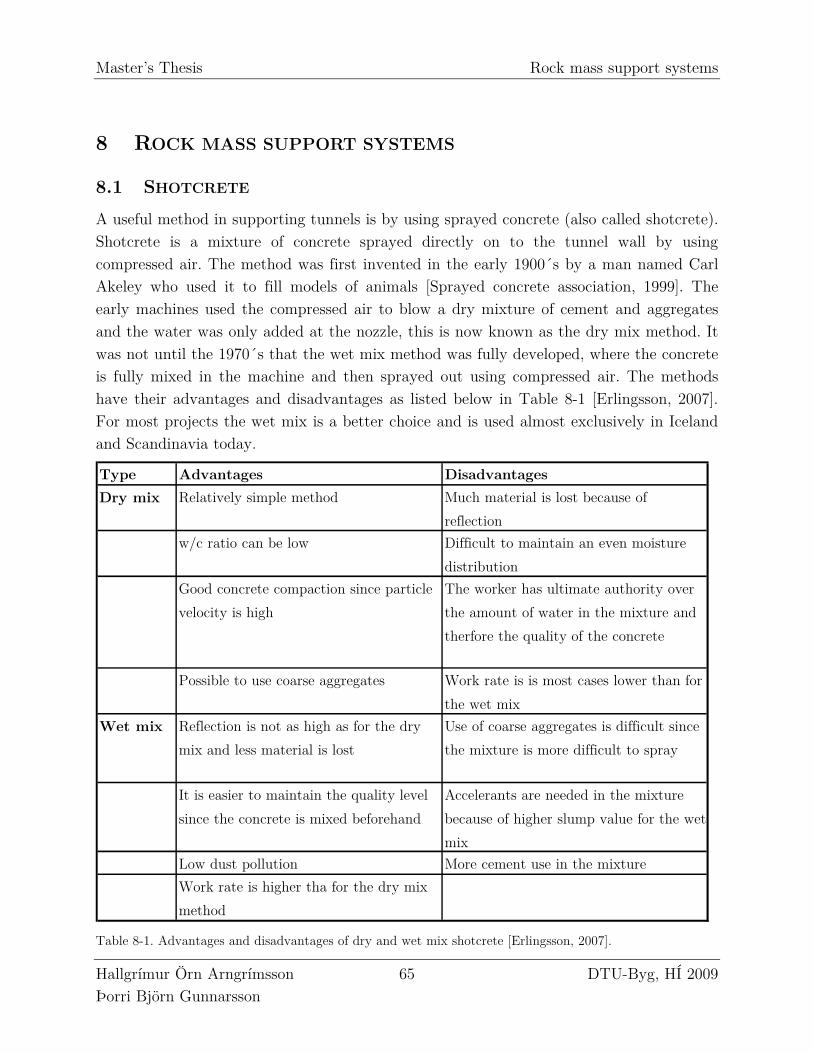
Master’s Thesis Rock mass support systems
Hallgrímur Örn Arngrímsson 65 DTU-Byg, HÍ 2009 Þorri Björn Gunnarsson
8 ROCK MASS SUPPORT SYSTEMS
8.1 SHOTCRETE
A useful method in supporting tunnels is by using sprayed concrete (also called shotcrete). Shotcrete is a mixture of concrete sprayed directly on to the tunnel wall by using compressed air. The method was first invented in the early 1900´s by a man named Carl Akeley who used it to fill models of animals [Sprayed concrete association, 1999]. The early machines used the compressed air to blow a dry mixture of cement and aggregates and the water was only added at the nozzle, this is now known as the dry mix method. It was not until the 1970´s that the wet mix method was fully developed, where the concrete is fully mixed in the machine and then sprayed out using compressed air. The methods have their advantages and disadvantages as listed below in Table 8-1 [Erlingsson, 2007]. For most projects the wet mix is a better choice and is used almost exclusively in Iceland and Scandinavia today.
Type Advantages Disadvantages
Dry mix Relatively simple method Much material is lost because of
reflection
w/c ratio can be low Difficult to maintain an even moisture
distribution
Good concrete compaction since particle
velocity is high
The worker has ultimate authority over
the amount of water in the mixture and
therfore the quality of the concrete
Possible to use coarse aggregates Work rate is is most cases lower than for
the wet mix
Wet mix Reflection is not as high as for the dry
mix and less material is lost
Use of coarse aggregates is difficult since
the mixture is more difficult to spray
It is easier to maintain the quality level
since the concrete is mixed beforehand
Accelerants are needed in the mixture
because of higher slump value for the wet
mix
Low dust pollution More cement use in the mixture
Work rate is higher tha for the dry mix
method Table 8-1. Advantages and disadvantages of dry and wet mix shotcrete [Erlingsson, 2007].
Master’s Thesis Rock mass support systems
Hallgrímur Örn Arngrímsson 66 DTU-Byg, HÍ 2009 Þorri Björn Gunnarsson
Theoretically the stiffness (kc) of shotcrete can be estimated for a cylindrical tunnel with radius ri as:
, (8-1)
where, Ec Youngs modulus of the shotcrete [MPa], νc Poisson´s ratio of the shotcrete [-], tc Thickness of the shotcrete layer [m].
For tc << ri this expression can be shortened to:
2i
ccc r
tEk
×≅ . (8-2)
The maximum pressure that the shotcrete can withstand before failure can be determined for a hollow cylinder under uniform load as
( )
−−=
2
2
12
1
i
cicccMAX
r
trp σ , (8-3)
where, σcc is the uniaxial compression strength of the concrete.
8.2 ROCKBOLTS
Some form of rockbolts has been used in tunneling and mining projects since the early 1900s. [Meacham, 2007]. Rockbolts where used primarily as short term support until proper timber or steel supports could be placed. It was not until the 1940´s that rockbolts and methods to use them properly had been developed so that they could be considered as the primary support system [Luo, 1999]. The main function of the bolt is to bind individual blocks of rock material into place by drilling the bolt through the block and fastening it into the surrounding rock mass. This secures the block and helps preventing movements in the rock mass.
Bolting is performed mainly with three methods; Spot-, systematic- and prebolting. Spot bolting is used to anchor individual, loose blocks of rock in the rock mass. With spot bolting a decision is made during the excavation process if there are blocks of rock that are in danger of falling down if left unsupported. A rock bolt is then used to secure the block to the surrounding rock mass. Systematic bolting is performed in the same way as spot bolting but instead of securing individual blocks a bolting system is created
( )[ ]( ) ( ) ( )[ ]22
22
211 ciicc
ciicc
trr
trrEk
−+−+−−=
υυ
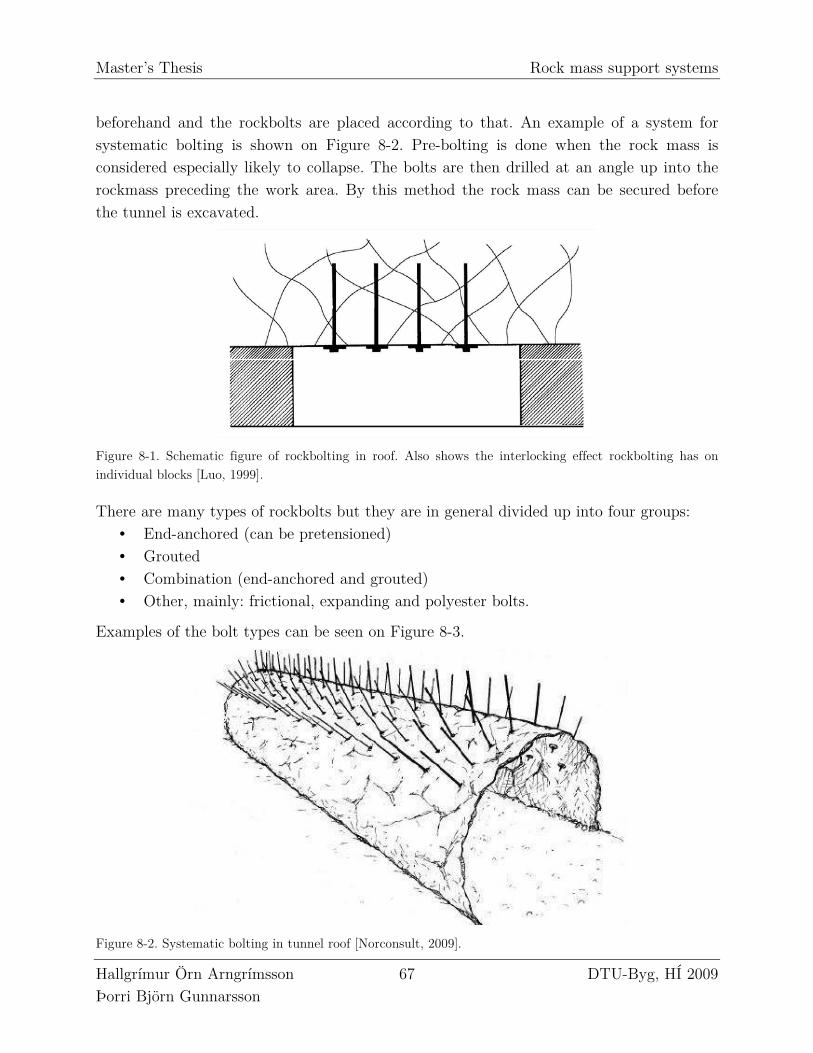
Master’s Thesis Rock mass support systems
Hallgrímur Örn Arngrímsson 67 DTU-Byg, HÍ 2009 Þorri Björn Gunnarsson
beforehand and the rockbolts are placed according to that. An example of a system for systematic bolting is shown on Figure 8-2. Pre-bolting is done when the rock mass is considered especially likely to collapse. The bolts are then drilled at an angle up into the rockmass preceding the work area. By this method the rock mass can be secured before the tunnel is excavated.
Figure 8-1. Schematic figure of rockbolting in roof. Also shows the interlocking effect rockbolting has on individual blocks [Luo, 1999].
There are many types of rockbolts but they are in general divided up into four groups: • End-anchored (can be pretensioned) • Grouted • Combination (end-anchored and grouted) • Other, mainly: frictional, expanding and polyester bolts.
Examples of the bolt types can be seen on Figure 8-3.
Figure 8-2. Systematic bolting in tunnel roof [Norconsult, 2009].
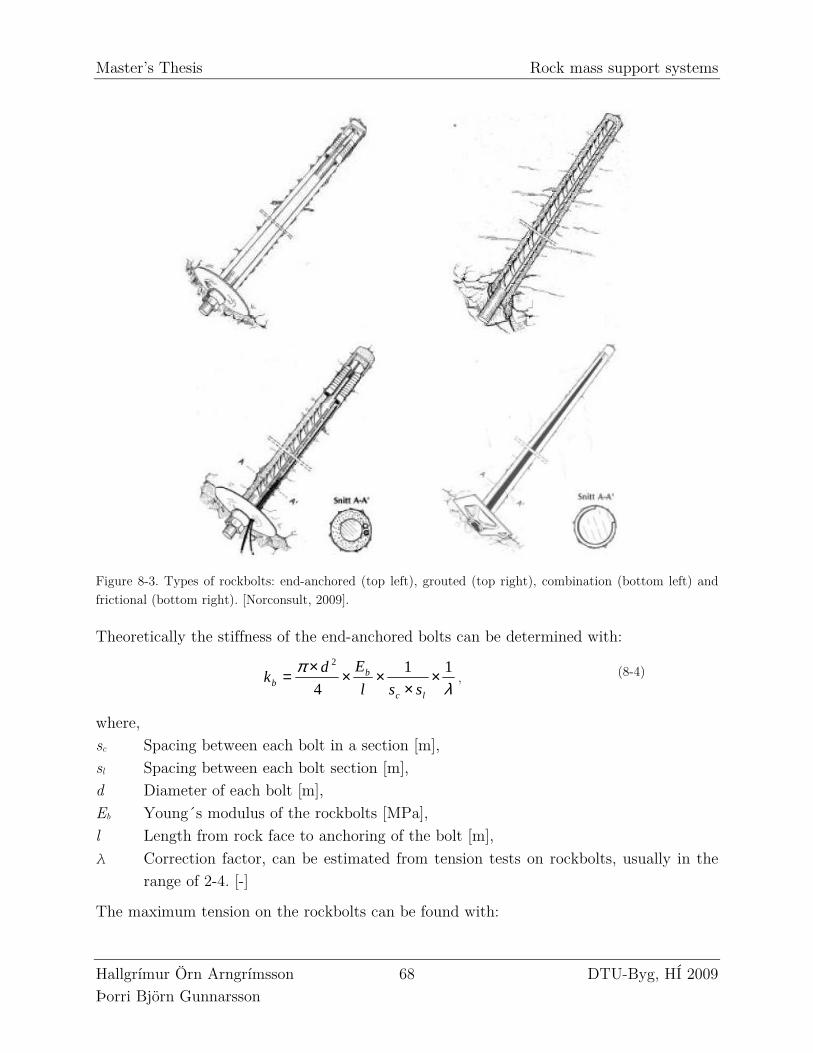
Master’s Thesis Rock mass support systems
Hallgrímur Örn Arngrímsson 68 DTU-Byg, HÍ 2009 Þorri Björn Gunnarsson
Figure 8-3. Types of rockbolts: end-anchored (top left), grouted (top right), combination (bottom left) and frictional (bottom right). [Norconsult, 2009].
Theoretically the stiffness of the end-anchored bolts can be determined with:
λπ 11
4
2
××
×××=lc
bb ssl
Edk , (8-4)
where, sc Spacing between each bolt in a section [m], sl Spacing between each bolt section [m], d Diameter of each bolt [m], Eb Young´s modulus of the rockbolts [MPa], l Length from rock face to anchoring of the bolt [m], λ Correction factor, can be estimated from tension tests on rockbolts, usually in the
range of 2-4. [-]
The maximum tension on the rockbolts can be found with:
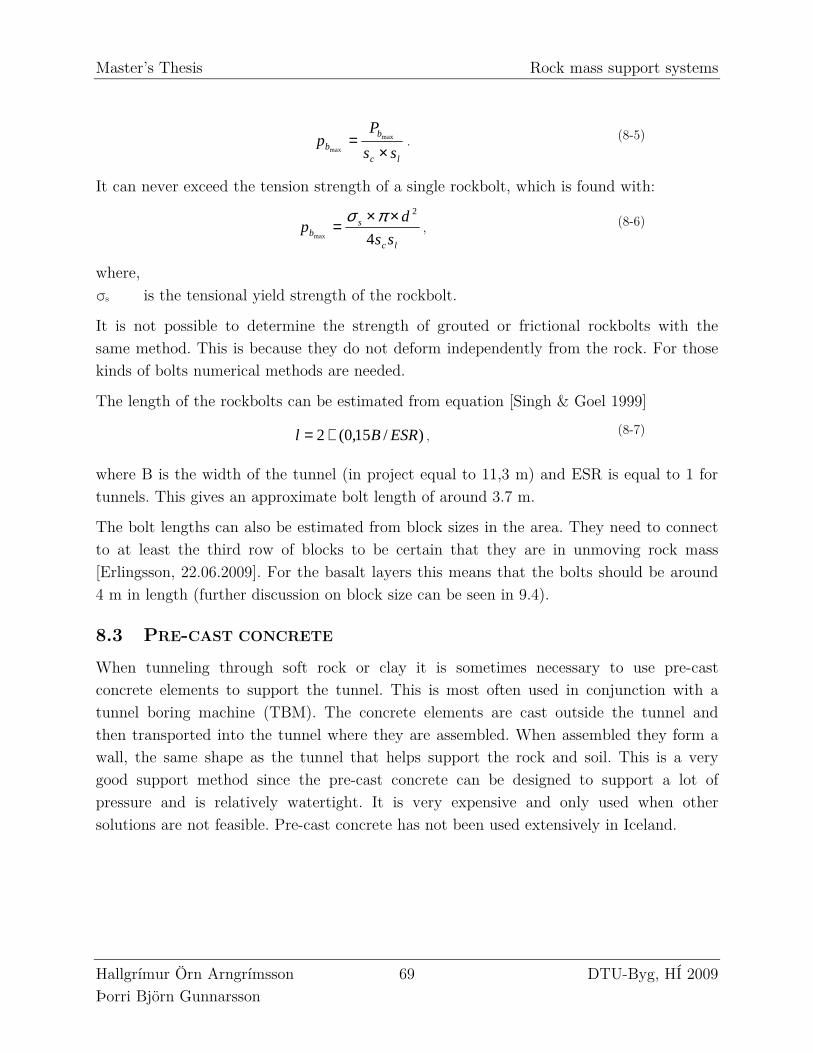
Master’s Thesis Rock mass support systems
Hallgrímur Örn Arngrímsson 69 DTU-Byg, HÍ 2009 Þorri Björn Gunnarsson
lc
b
b ss
Pp
×= max
max. (8-5)
It can never exceed the tension strength of a single rockbolt, which is found with:
lc
sb ss
dp
4
2
max
××=
πσ, (8-6)
where, σs is the tensional yield strength of the rockbolt.
It is not possible to determine the strength of grouted or frictional rockbolts with the same method. This is because they do not deform independently from the rock. For those kinds of bolts numerical methods are needed.
The length of the rockbolts can be estimated from equation [Singh & Goel 1999]
)/15,0(2 ESRBl += , (8-7)
where B is the width of the tunnel (in project equal to 11,3 m) and ESR is equal to 1 for tunnels. This gives an approximate bolt length of around 3.7 m.
The bolt lengths can also be estimated from block sizes in the area. They need to connect to at least the third row of blocks to be certain that they are in unmoving rock mass [Erlingsson, 22.06.2009]. For the basalt layers this means that the bolts should be around 4 m in length (further discussion on block size can be seen in 9.4).
8.3 PRE-CAST CONCRETE
When tunneling through soft rock or clay it is sometimes necessary to use pre-cast concrete elements to support the tunnel. This is most often used in conjunction with a tunnel boring machine (TBM). The concrete elements are cast outside the tunnel and then transported into the tunnel where they are assembled. When assembled they form a wall, the same shape as the tunnel that helps support the rock and soil. This is a very good support method since the pre-cast concrete can be designed to support a lot of pressure and is relatively watertight. It is very expensive and only used when other solutions are not feasible. Pre-cast concrete has not been used extensively in Iceland.
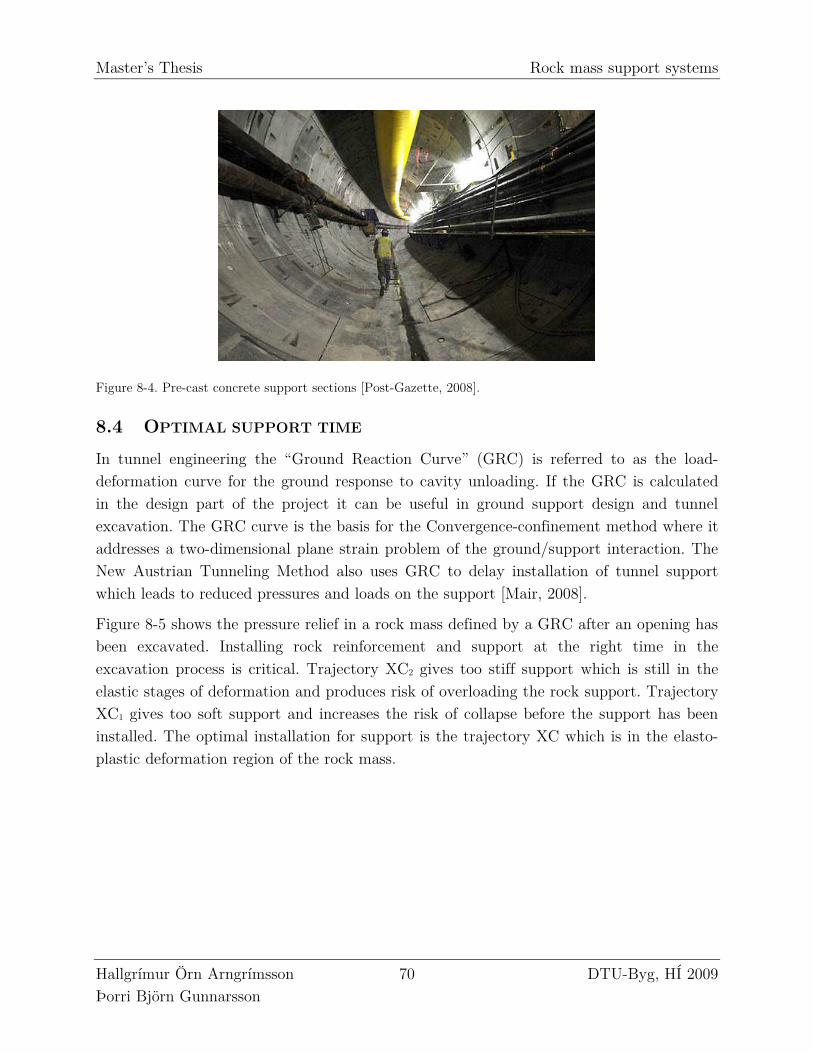
Master’s Thesis Rock mass support systems
Hallgrímur Örn Arngrímsson 70 DTU-Byg, HÍ 2009 Þorri Björn Gunnarsson
Figure 8-4. Pre-cast concrete support sections [Post-Gazette, 2008].
8.4 OPTIMAL SUPPORT TIME
In tunnel engineering the “Ground Reaction Curve” (GRC) is referred to as the load-deformation curve for the ground response to cavity unloading. If the GRC is calculated in the design part of the project it can be useful in ground support design and tunnel excavation. The GRC curve is the basis for the Convergence-confinement method where it addresses a two-dimensional plane strain problem of the ground/support interaction. The New Austrian Tunneling Method also uses GRC to delay installation of tunnel support which leads to reduced pressures and loads on the support [Mair, 2008].
Figure 8-5 shows the pressure relief in a rock mass defined by a GRC after an opening has been excavated. Installing rock reinforcement and support at the right time in the excavation process is critical. Trajectory XC2 gives too stiff support which is still in the elastic stages of deformation and produces risk of overloading the rock support. Trajectory XC1 gives too soft support and increases the risk of collapse before the support has been installed. The optimal installation for support is the trajectory XC which is in the elasto-plastic deformation region of the rock mass.
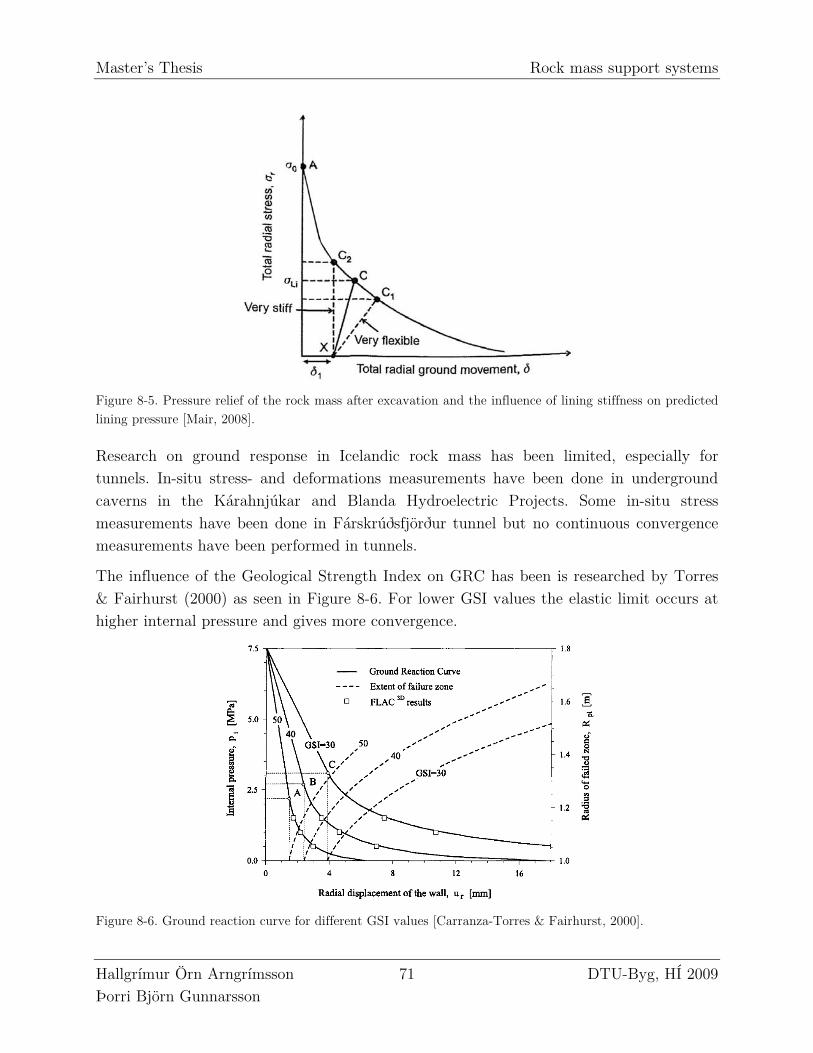
Master’s Thesis Rock mass support systems
Hallgrímur Örn Arngrímsson 71 DTU-Byg, HÍ 2009 Þorri Björn Gunnarsson
Figure 8-5. Pressure relief of the rock mass after excavation and the influence of lining stiffness on predicted lining pressure [Mair, 2008].
Research on ground response in Icelandic rock mass has been limited, especially for tunnels. In-situ stress- and deformations measurements have been done in underground caverns in the Kárahnjúkar and Blanda Hydroelectric Projects. Some in-situ stress measurements have been done in Fárskrúðsfjörður tunnel but no continuous convergence measurements have been performed in tunnels.
The influence of the Geological Strength Index on GRC has been is researched by Torres & Fairhurst (2000) as seen in Figure 8-6. For lower GSI values the elastic limit occurs at higher internal pressure and gives more convergence.
Figure 8-6. Ground reaction curve for different GSI values [Carranza-Torres & Fairhurst, 2000].
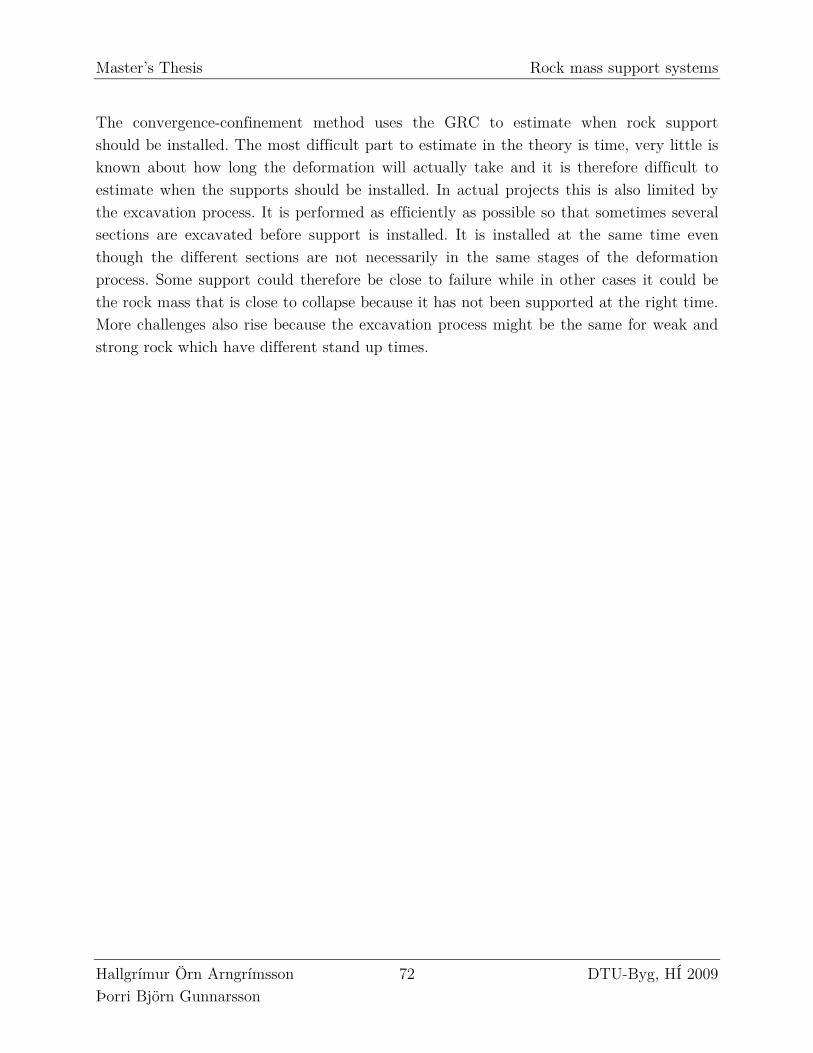
Master’s Thesis Rock mass support systems
Hallgrímur Örn Arngrímsson 72 DTU-Byg, HÍ 2009 Þorri Björn Gunnarsson
The convergence-confinement method uses the GRC to estimate when rock support should be installed. The most difficult part to estimate in the theory is time, very little is known about how long the deformation will actually take and it is therefore difficult to estimate when the supports should be installed. In actual projects this is also limited by the excavation process. It is performed as efficiently as possible so that sometimes several sections are excavated before support is installed. It is installed at the same time even though the different sections are not necessarily in the same stages of the deformation process. Some support could therefore be close to failure while in other cases it could be the rock mass that is close to collapse because it has not been supported at the right time. More challenges also rise because the excavation process might be the same for weak and strong rock which have different stand up times.
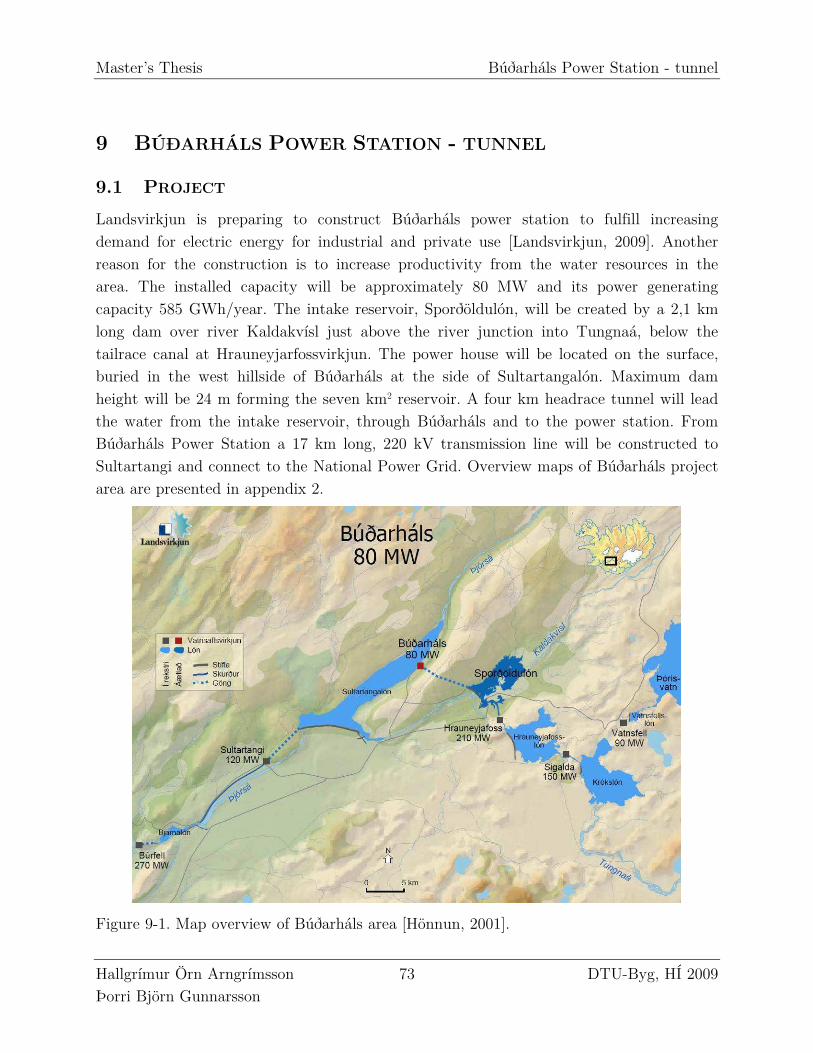
Master’s Thesis Búðarháls Power Station - tunnel
Hallgrímur Örn Arngrímsson 73 DTU-Byg, HÍ 2009 Þorri Björn Gunnarsson
9 BÚÐARHÁLS POWER STATION - TUNNEL
9.1 PROJECT
Landsvirkjun is preparing to construct Búðarháls power station to fulfill increasing demand for electric energy for industrial and private use [Landsvirkjun, 2009]. Another reason for the construction is to increase productivity from the water resources in the area. The installed capacity will be approximately 80 MW and its power generating capacity 585 GWh/year. The intake reservoir, Sporðöldulón, will be created by a 2,1 km long dam over river Kaldakvísl just above the river junction into Tungnaá, below the tailrace canal at Hrauneyjarfossvirkjun. The power house will be located on the surface, buried in the west hillside of Búðarháls at the side of Sultartangalón. Maximum dam height will be 24 m forming the seven km2 reservoir. A four km headrace tunnel will lead the water from the intake reservoir, through Búðarháls and to the power station. From Búðarháls Power Station a 17 km long, 220 kV transmission line will be constructed to Sultartangi and connect to the National Power Grid. Overview maps of Búðarháls project area are presented in appendix 2.
Figure 9-1. Map overview of Búðarháls area [Hönnun, 2001].
Master’s Thesis Búðarháls Power Station - tunnel
Hallgrímur Örn Arngrímsson 74 DTU-Byg, HÍ 2009 Þorri Björn Gunnarsson
Preliminary designs for Búðarháls power station were done in 1989 but the final design was not completed until 1999. In the final design the location of the power house was changed from being underground, south in Búðarháls having a tailrace tunnel to Sultartangalón, to being above ground north of Búðarháls with headrace tunnel through Búðarháls. One of the reasons for this was that the tunnel could be excavated through rock that was less altered. The design has also changed to increase productivity in consideration to other power station further upstream.
Búðarháls hydropower station is a traditional hydropower design with water level difference of approximately 40 m. The water travels from the reservoir intake through a four km headrace tunnel and ends in a surge basin before finally entering two penstocks and the power station. A tailrace canal leads the water to Sultartangalón. The dam is designed with a spillway which leads excess water from the reservoir to the downstream side of the dam.
The Búðarháls Power Station project got approved by the Planning Agency and the Ministry of the Environment in 2001 and construction permits were issued. Landsvirkjun has constructed the access road to Búðarháls, including a bridge over Tungnaá and surface excavation has been done both on the intake and the power house foundation.
9.2 PRELIMINARY INVESTIGATIONS
Investigations in Búðarháls started in 1970 with geological mapping of the area. In the late 70´s Orkustofnun started core drilling for a possible hydropower station in Tungná in south Búðarháls. Investigations stopped during 1980-1990. In 1991 drilling started again and in 1992 possible tunnel designs were introduced and research was performed by Jarðtæknistofan hf. From 1993 all investigation at Búðarháls power station has been done by Hönnun hf. (now Mannvit hf.).
In the summer of 1992 core drilling was done at the top of Búðarháls with a 270 m long hole called BH-6 (between BH-4 and BH-5), see Figure 9-2. It revealed highly altered, clayish basalt not feasible for tunneling. This alteration is possibly caused by an old geothermal area but the size of it is unknown. In 1993 the following year another hole was drilled further south, BH-7 (between BH-2 and BH-3). It revealed good rock for tunneling and it was easy to find relation to BH-2 and BH-3. Past research indicates some geological disturbance in the vest end of Búðarháls which makes it difficult to map geologically. In order to find a good exit for the tunnel in the vest, BH-8 was drilled and revealed a thick jointed rhyolite layer.
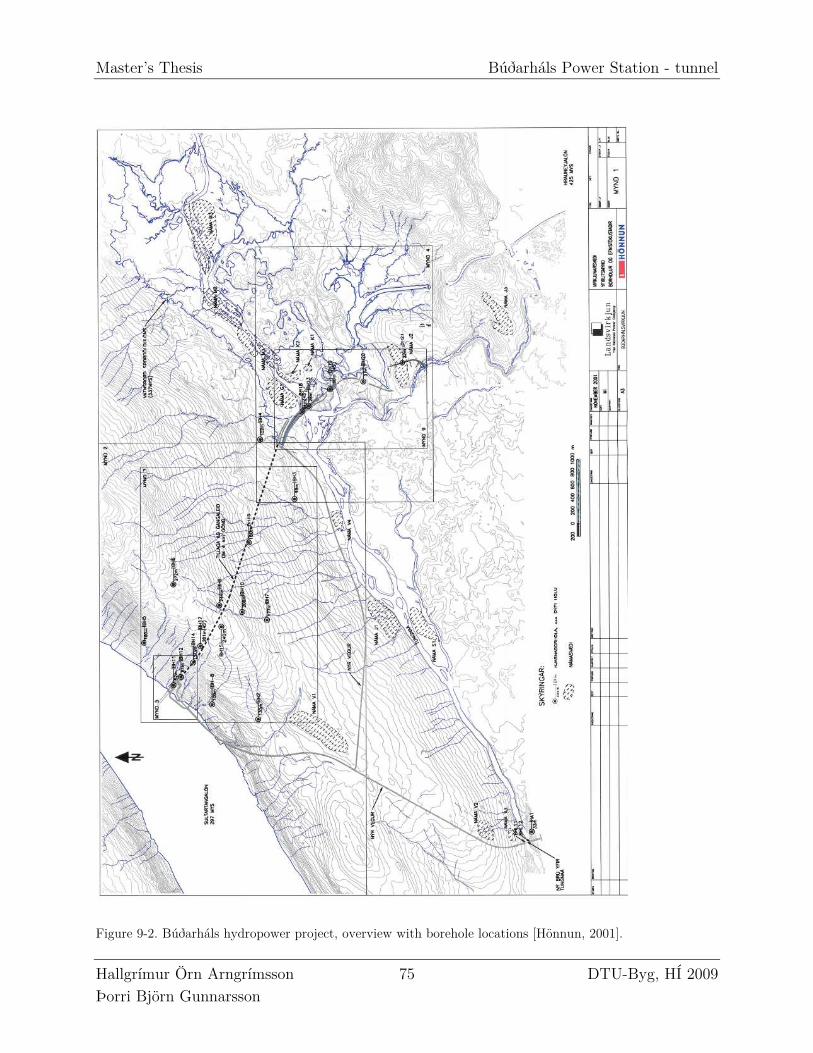
Master’s Thesis Búðarháls Power Station - tunnel
Hallgrímur Örn Arngrímsson 75 DTU-Byg, HÍ 2009 Þorri Björn Gunnarsson
Figure 9-2. Búðarháls hydropower project, overview with borehole locations [Hönnun, 2001].
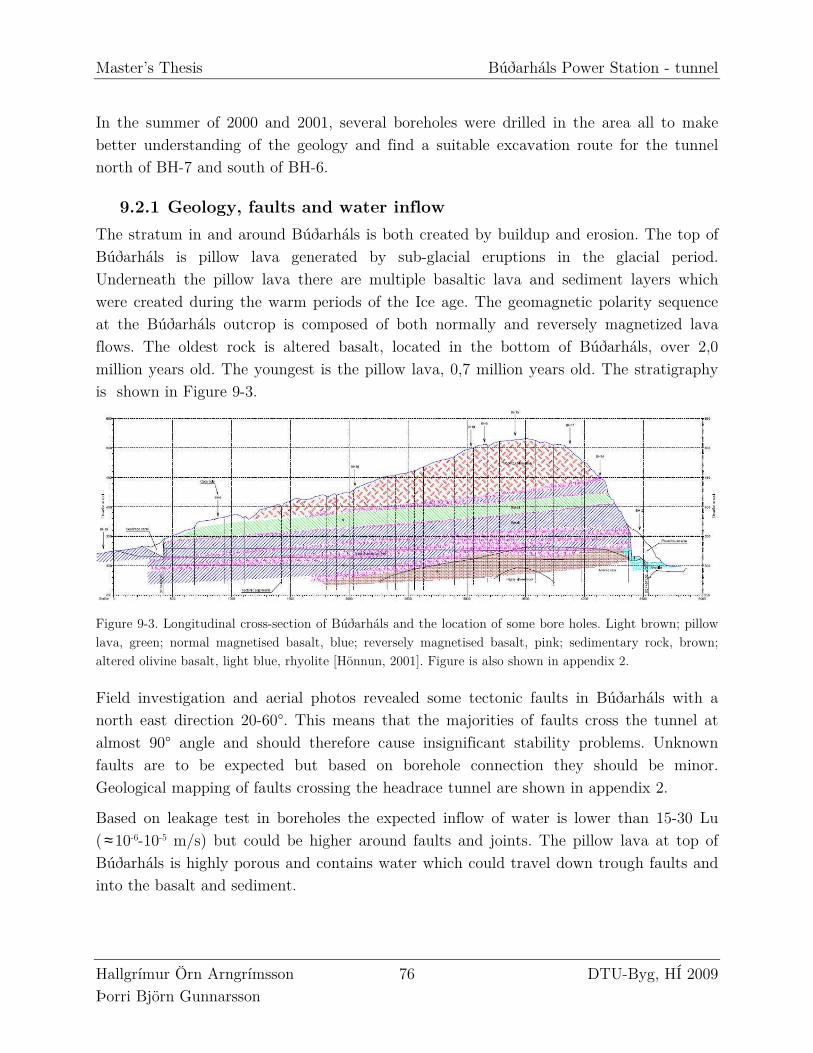
Master’s Thesis Búðarháls Power Station - tunnel
Hallgrímur Örn Arngrímsson 76 DTU-Byg, HÍ 2009 Þorri Björn Gunnarsson
In the summer of 2000 and 2001, several boreholes were drilled in the area all to make better understanding of the geology and find a suitable excavation route for the tunnel north of BH-7 and south of BH-6.
9.2.1 Geology, faults and water inflow
The stratum in and around Búðarháls is both created by buildup and erosion. The top of Búðarháls is pillow lava generated by sub-glacial eruptions in the glacial period. Underneath the pillow lava there are multiple basaltic lava and sediment layers which were created during the warm periods of the Ice age. The geomagnetic polarity sequence at the Búðarháls outcrop is composed of both normally and reversely magnetized lava flows. The oldest rock is altered basalt, located in the bottom of Búðarháls, over 2,0 million years old. The youngest is the pillow lava, 0,7 million years old. The stratigraphy is shown in Figure 9-3.
Figure 9-3. Longitudinal cross-section of Búðarháls and the location of some bore holes. Light brown; pillow lava, green; normal magnetised basalt, blue; reversely magnetised basalt, pink; sedimentary rock, brown; altered olivine basalt, light blue, rhyolite [Hönnun, 2001]. Figure is also shown in appendix 2.
Field investigation and aerial photos revealed some tectonic faults in Búðarháls with a north east direction 20-60°. This means that the majorities of faults cross the tunnel at almost 90° angle and should therefore cause insignificant stability problems. Unknown faults are to be expected but based on borehole connection they should be minor. Geological mapping of faults crossing the headrace tunnel are shown in appendix 2.
Based on leakage test in boreholes the expected inflow of water is lower than 15-30 Lu ( ≈10-6-10-5 m/s) but could be higher around faults and joints. The pillow lava at top of Búðarháls is highly porous and contains water which could travel down trough faults and into the basalt and sediment.
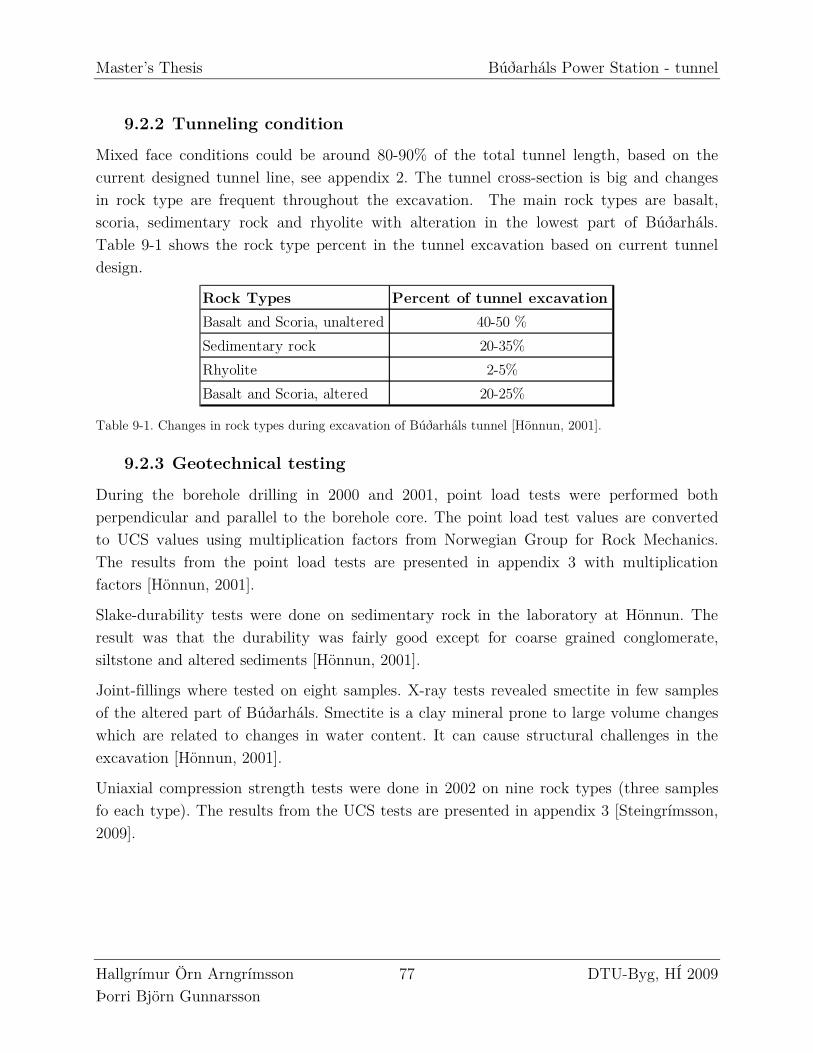
Master’s Thesis Búðarháls Power Station - tunnel
Hallgrímur Örn Arngrímsson 77 DTU-Byg, HÍ 2009 Þorri Björn Gunnarsson
9.2.2 Tunneling condition
Mixed face conditions could be around 80-90% of the total tunnel length, based on the current designed tunnel line, see appendix 2. The tunnel cross-section is big and changes in rock type are frequent throughout the excavation. The main rock types are basalt, scoria, sedimentary rock and rhyolite with alteration in the lowest part of Búðarháls. Table 9-1 shows the rock type percent in the tunnel excavation based on current tunnel design.
Rock Types Percent of tunnel excavation
Basalt and Scoria, unaltered 40-50 %
Sedimentary rock 20-35%
Rhyolite 2-5%
Basalt and Scoria, altered 20-25% Table 9-1. Changes in rock types during excavation of Búðarháls tunnel [Hönnun, 2001].
9.2.3 Geotechnical testing
During the borehole drilling in 2000 and 2001, point load tests were performed both perpendicular and parallel to the borehole core. The point load test values are converted to UCS values using multiplication factors from Norwegian Group for Rock Mechanics. The results from the point load tests are presented in appendix 3 with multiplication factors [Hönnun, 2001].
Slake-durability tests were done on sedimentary rock in the laboratory at Hönnun. The result was that the durability was fairly good except for coarse grained conglomerate, siltstone and altered sediments [Hönnun, 2001].
Joint-fillings where tested on eight samples. X-ray tests revealed smectite in few samples of the altered part of Búðarháls. Smectite is a clay mineral prone to large volume changes which are related to changes in water content. It can cause structural challenges in the excavation [Hönnun, 2001].
Uniaxial compression strength tests were done in 2002 on nine rock types (three samples fo each type). The results from the UCS tests are presented in appendix 3 [Steingrímsson, 2009].
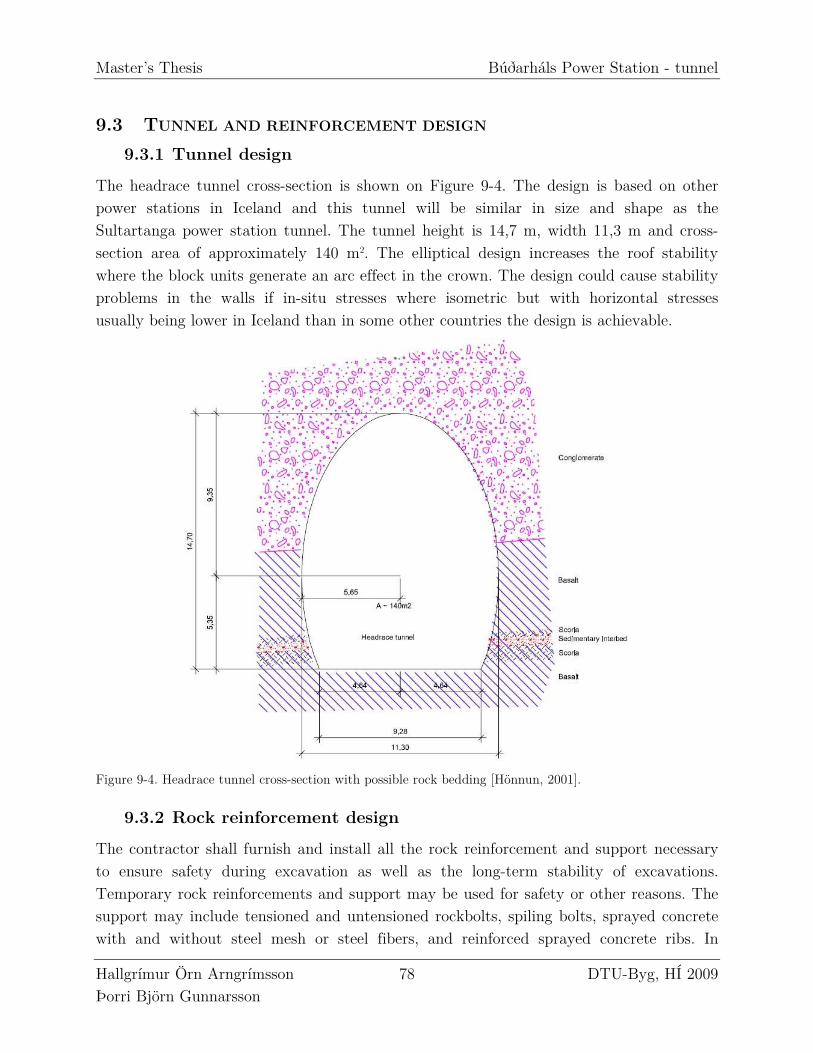
Master’s Thesis Búðarháls Power Station - tunnel
Hallgrímur Örn Arngrímsson 78 DTU-Byg, HÍ 2009 Þorri Björn Gunnarsson
9.3 TUNNEL AND REINFORCEMENT DESIGN
9.3.1 Tunnel design
The headrace tunnel cross-section is shown on Figure 9-4. The design is based on other power stations in Iceland and this tunnel will be similar in size and shape as the Sultartanga power station tunnel. The tunnel height is 14,7 m, width 11,3 m and cross-section area of approximately 140 m2. The elliptical design increases the roof stability where the block units generate an arc effect in the crown. The design could cause stability problems in the walls if in-situ stresses where isometric but with horizontal stresses usually being lower in Iceland than in some other countries the design is achievable.
Figure 9-4. Headrace tunnel cross-section with possible rock bedding [Hönnun, 2001].
9.3.2 Rock reinforcement design
The contractor shall furnish and install all the rock reinforcement and support necessary to ensure safety during excavation as well as the long-term stability of excavations. Temporary rock reinforcements and support may be used for safety or other reasons. The support may include tensioned and untensioned rockbolts, spiling bolts, sprayed concrete with and without steel mesh or steel fibers, and reinforced sprayed concrete ribs. In
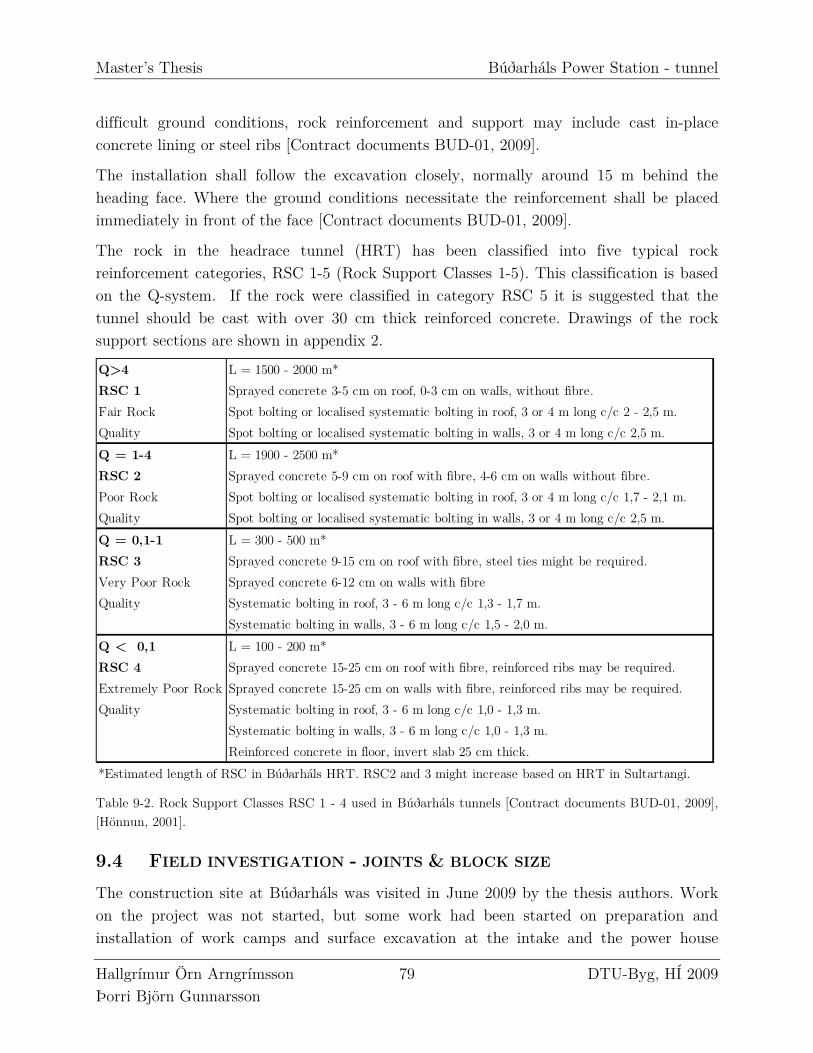
Master’s Thesis Búðarháls Power Station - tunnel
Hallgrímur Örn Arngrímsson 79 DTU-Byg, HÍ 2009 Þorri Björn Gunnarsson
difficult ground conditions, rock reinforcement and support may include cast in-place concrete lining or steel ribs [Contract documents BUD-01, 2009].
The installation shall follow the excavation closely, normally around 15 m behind the heading face. Where the ground conditions necessitate the reinforcement shall be placed immediately in front of the face [Contract documents BUD-01, 2009].
The rock in the headrace tunnel (HRT) has been classified into five typical rock reinforcement categories, RSC 1-5 (Rock Support Classes 1-5). This classification is based on the Q-system. If the rock were classified in category RSC 5 it is suggested that the tunnel should be cast with over 30 cm thick reinforced concrete. Drawings of the rock support sections are shown in appendix 2.
Q>4 L = 1500 - 2000 m*
RSC 1 Sprayed concrete 3-5 cm on roof, 0-3 cm on walls, without fibre.
Fair Rock Spot bolting or localised systematic bolting in roof, 3 or 4 m long c/c 2 - 2,5 m.
Quality Spot bolting or localised systematic bolting in walls, 3 or 4 m long c/c 2,5 m.
Q = 1-4 L = 1900 - 2500 m*
RSC 2 Sprayed concrete 5-9 cm on roof with fibre, 4-6 cm on walls without fibre.
Poor Rock Spot bolting or localised systematic bolting in roof, 3 or 4 m long c/c 1,7 - 2,1 m.
Quality Spot bolting or localised systematic bolting in walls, 3 or 4 m long c/c 2,5 m.
Q = 0,1-1 L = 300 - 500 m*
RSC 3 Sprayed concrete 9-15 cm on roof with fibre, steel ties might be required.
Very Poor Rock Sprayed concrete 6-12 cm on walls with fibre
Quality Systematic bolting in roof, 3 - 6 m long c/c 1,3 - 1,7 m.
Systematic bolting in walls, 3 - 6 m long c/c 1,5 - 2,0 m.
Q < 0,1 L = 100 - 200 m*
RSC 4 Sprayed concrete 15-25 cm on roof with fibre, reinforced ribs may be required.
Extremely Poor Rock Sprayed concrete 15-25 cm on walls with fibre, reinforced ribs may be required.
Quality Systematic bolting in roof, 3 - 6 m long c/c 1,0 - 1,3 m.
Systematic bolting in walls, 3 - 6 m long c/c 1,0 - 1,3 m.
Reinforced concrete in floor, invert slab 25 cm thick.
*Estimated length of RSC in Búðarháls HRT. RSC2 and 3 might increase based on HRT in Sultartangi. Table 9-2. Rock Support Classes RSC 1 - 4 used in Búðarháls tunnels [Contract documents BUD-01, 2009], [Hönnun, 2001].
9.4 FIELD INVESTIGATION - JOINTS & BLOCK SIZE
The construction site at Búðarháls was visited in June 2009 by the thesis authors. Work on the project was not started, but some work had been started on preparation and installation of work camps and surface excavation at the intake and the power house
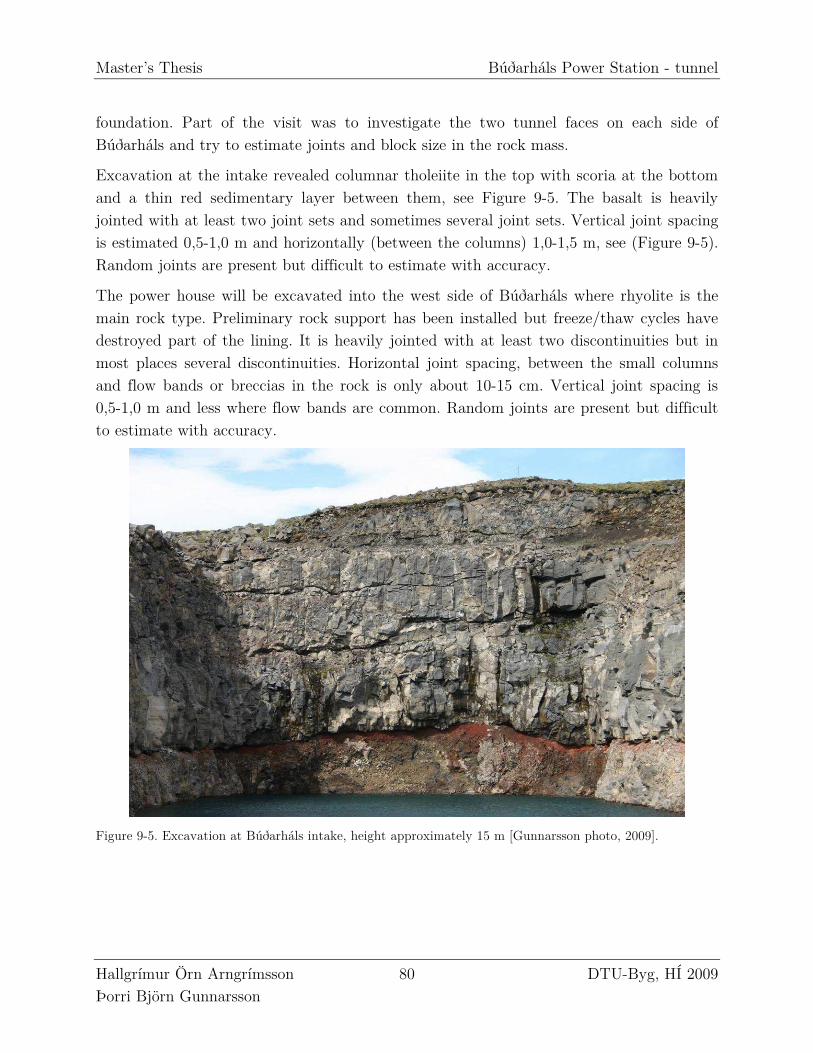
Master’s Thesis Búðarháls Power Station - tunnel
Hallgrímur Örn Arngrímsson 80 DTU-Byg, HÍ 2009 Þorri Björn Gunnarsson
foundation. Part of the visit was to investigate the two tunnel faces on each side of Búðarháls and try to estimate joints and block size in the rock mass.
Excavation at the intake revealed columnar tholeiite in the top with scoria at the bottom and a thin red sedimentary layer between them, see Figure 9-5. The basalt is heavily jointed with at least two joint sets and sometimes several joint sets. Vertical joint spacing is estimated 0,5-1,0 m and horizontally (between the columns) 1,0-1,5 m, see (Figure 9-5). Random joints are present but difficult to estimate with accuracy.
The power house will be excavated into the west side of Búðarháls where rhyolite is the main rock type. Preliminary rock support has been installed but freeze/thaw cycles have destroyed part of the lining. It is heavily jointed with at least two discontinuities but in most places several discontinuities. Horizontal joint spacing, between the small columns and flow bands or breccias in the rock is only about 10-15 cm. Vertical joint spacing is 0,5-1,0 m and less where flow bands are common. Random joints are present but difficult to estimate with accuracy.
Figure 9-5. Excavation at Búðarháls intake, height approximately 15 m [Gunnarsson photo, 2009].
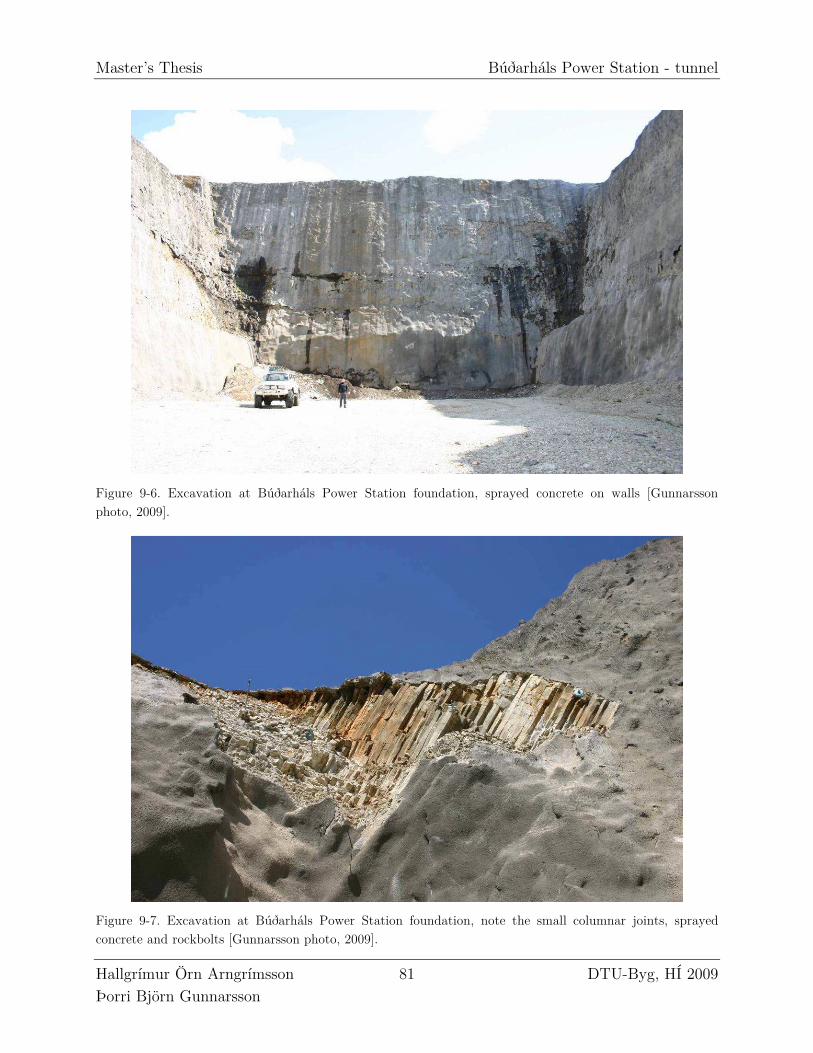
Master’s Thesis Búðarháls Power Station - tunnel
Hallgrímur Örn Arngrímsson 81 DTU-Byg, HÍ 2009 Þorri Björn Gunnarsson
Figure 9-6. Excavation at Búðarháls Power Station foundation, sprayed concrete on walls [Gunnarsson photo, 2009].
Figure 9-7. Excavation at Búðarháls Power Station foundation, note the small columnar joints, sprayed concrete and rockbolts [Gunnarsson photo, 2009].
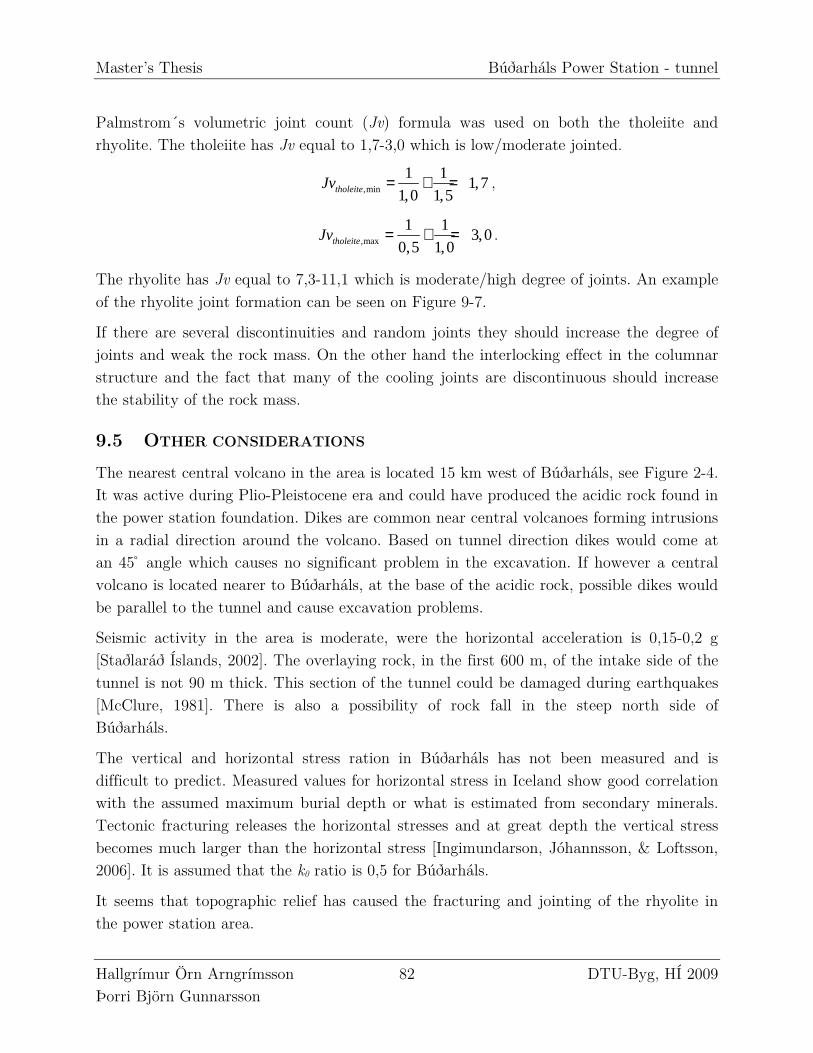
Master’s Thesis Búðarháls Power Station - tunnel
Hallgrímur Örn Arngrímsson 82 DTU-Byg, HÍ 2009 Þorri Björn Gunnarsson
Palmstrom´s volumetric joint count (Jv) formula was used on both the tholeiite and rhyolite. The tholeiite has Jv equal to 1,7-3,0 which is low/moderate jointed.
,min
1 11,7
1,0 1,5tholeiteJv = + = ,
,max
1 13,0
0,5 1,0tholeiteJv = + = .
The rhyolite has Jv equal to 7,3-11,1 which is moderate/high degree of joints. An example of the rhyolite joint formation can be seen on Figure 9-7.
If there are several discontinuities and random joints they should increase the degree of joints and weak the rock mass. On the other hand the interlocking effect in the columnar structure and the fact that many of the cooling joints are discontinuous should increase the stability of the rock mass.
9.5 OTHER CONSIDERATIONS
The nearest central volcano in the area is located 15 km west of Búðarháls, see Figure 2-4. It was active during Plio-Pleistocene era and could have produced the acidic rock found in the power station foundation. Dikes are common near central volcanoes forming intrusions in a radial direction around the volcano. Based on tunnel direction dikes would come at an 45 ̊ angle which causes no significant problem in the excavation. If however a central volcano is located nearer to Búðarháls, at the base of the acidic rock, possible dikes would be parallel to the tunnel and cause excavation problems.
Seismic activity in the area is moderate, were the horizontal acceleration is 0,15-0,2 g [Staðlaráð Íslands, 2002]. The overlaying rock, in the first 600 m, of the intake side of the tunnel is not 90 m thick. This section of the tunnel could be damaged during earthquakes [McClure, 1981]. There is also a possibility of rock fall in the steep north side of Búðarháls.
The vertical and horizontal stress ration in Búðarháls has not been measured and is difficult to predict. Measured values for horizontal stress in Iceland show good correlation with the assumed maximum burial depth or what is estimated from secondary minerals. Tectonic fracturing releases the horizontal stresses and at great depth the vertical stress becomes much larger than the horizontal stress [Ingimundarson, Jóhannsson, & Loftsson, 2006]. It is assumed that the k0 ratio is 0,5 for Búðarháls.
It seems that topographic relief has caused the fracturing and jointing of the rhyolite in the power station area.
Master’s Thesis Laboratory testing
Hallgrímur Örn Arngrímsson 83 DTU-Byg, HÍ 2009 Þorri Björn Gunnarsson
10 LABORATORY TESTING
Rock samples were collected from boreholes drilled in the preliminary research phase of Búðarháls power station. They originate from different boreholes near to the designed tunnel location and at a depth near to the designed tunnel depth. They represent the most common rock types which the tunnel will be excavated through. Total of about 7 meters of cores were collected from boreholes, BH-9, BH-11, BH -12, BH-15 and BH-16 (locations can be seen in appendix 2). The core samples were transported from Landsvirkjun storage area in Iceland to Denmark where they were tested. The laboratory tests were performed at Technical University of Denmark (DTU) and Danish Geotechnical Institute (GEO). Pictures of cores and core logs are presented in appendix 3 and 4.
The laboratory tests performed at GEO were Brazil tests and Unconfined Compression Strength (UCS) tests. The Triaxial tests where performed at DTU under guidance of Ph.D. student Katrine Alling Andreassen.
10.1 SAMPLE DESCRIPTION
The samples were classified into eight different categories according to the Icelandic geological lithology and also their rock engineering properties.
• Igneous basalt rock: o Tholeiite basalt, with low olivine crystals content. o Tholeiite basalt (vesicular), with low olivine crystals content and vesicular. o Altered olivine tholeiite basalt, chemically altered with high olivine crystal
content. o Rhyolite (homogeneous), acidic rock with high SiO2 content. o Rhyolite (inhomogeneous), acidic rock with pumice fragments. o Scoria, cooling part of the basalt in the top and bottom.
• Sedimentary rock o Conglomerate, maximum grain size is gravel (diameter = 2-64 mm). o Sandstone, maximum grain size is sand (diameter = 0,063-2 mm).
10.2 SAMPLE PREPARATION
The core samples have a diameter of 45 mm. The samples were cut at GEO using a diamond disc saw. All core samples were cut according to ISRM standard. The height of the Brazil samples was half a diameter, approximately 22 mm. The height of the unconfined compression and triaxial samples was 90 mm.
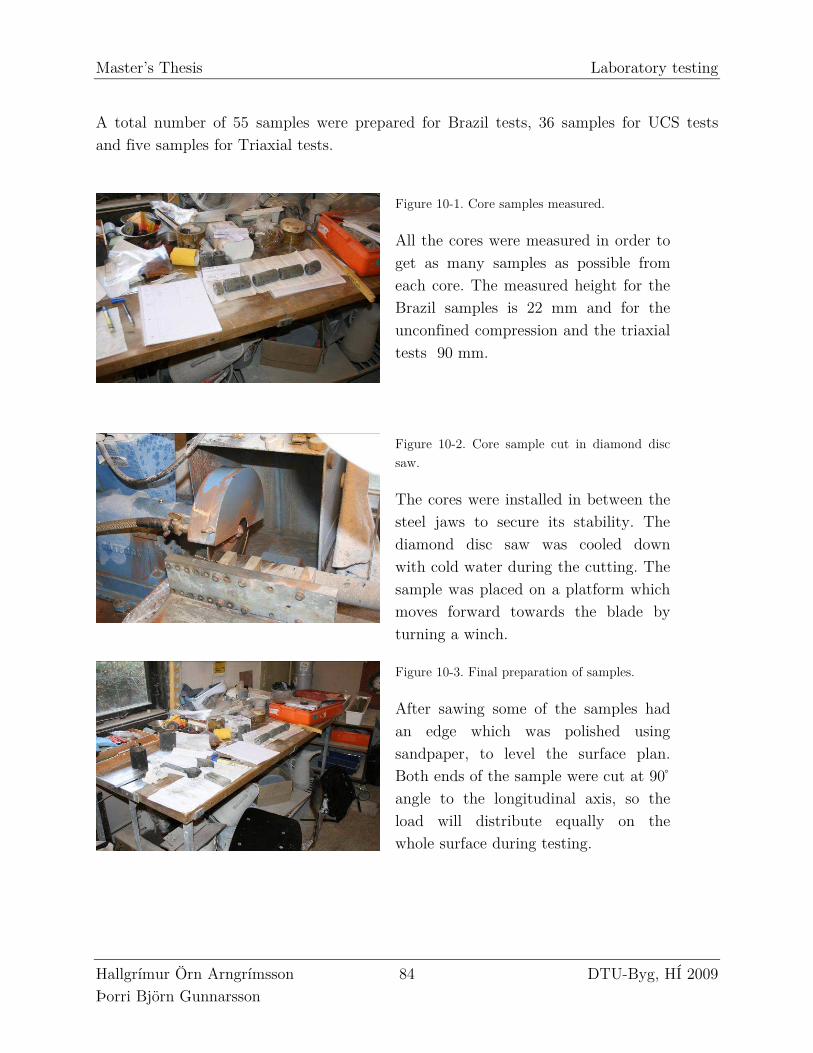
Master’s Thesis Laboratory testing
Hallgrímur Örn Arngrímsson 84 DTU-Byg, HÍ 2009 Þorri Björn Gunnarsson
A total number of 55 samples were prepared for Brazil tests, 36 samples for UCS tests and five samples for Triaxial tests.
Figure 10-1. Core samples measured.
All the cores were measured in order to get as many samples as possible from each core. The measured height for the Brazil samples is 22 mm and for the unconfined compression and the triaxial tests 90 mm.
Figure 10-2. Core sample cut in diamond disc saw.
The cores were installed in between the steel jaws to secure its stability. The diamond disc saw was cooled down with cold water during the cutting. The sample was placed on a platform which moves forward towards the blade by turning a winch.
Figure 10-3. Final preparation of samples.
After sawing some of the samples had an edge which was polished using sandpaper, to level the surface plan. Both ends of the sample were cut at 90 ̊ angle to the longitudinal axis, so the load will distribute equally on the whole surface during testing.
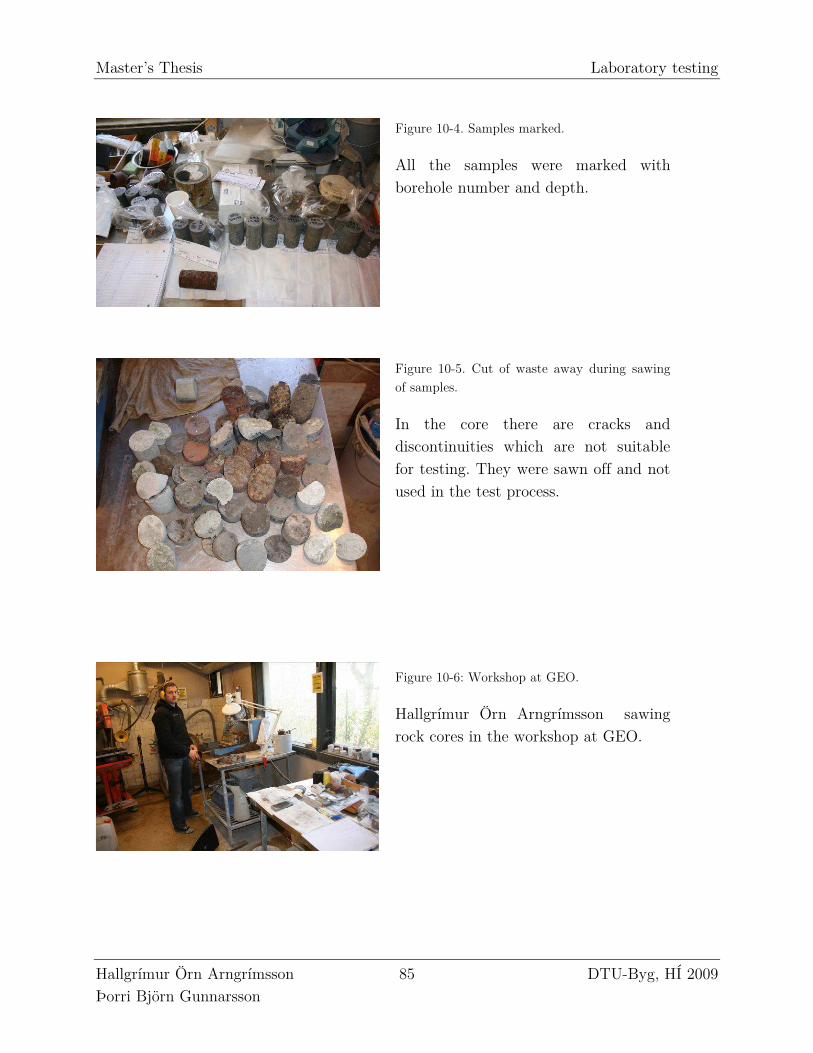
Master’s Thesis Laboratory testing
Hallgrímur Örn Arngrímsson 85 DTU-Byg, HÍ 2009 Þorri Björn Gunnarsson
Figure 10-4. Samples marked.
All the samples were marked with borehole number and depth.
Figure 10-5. Cut of waste away during sawing of samples.
In the core there are cracks and discontinuities which are not suitable for testing. They were sawn off and not used in the test process.
Figure 10-6: Workshop at GEO.
Hallgrímur Örn Arngrímsson sawing rock cores in the workshop at GEO.
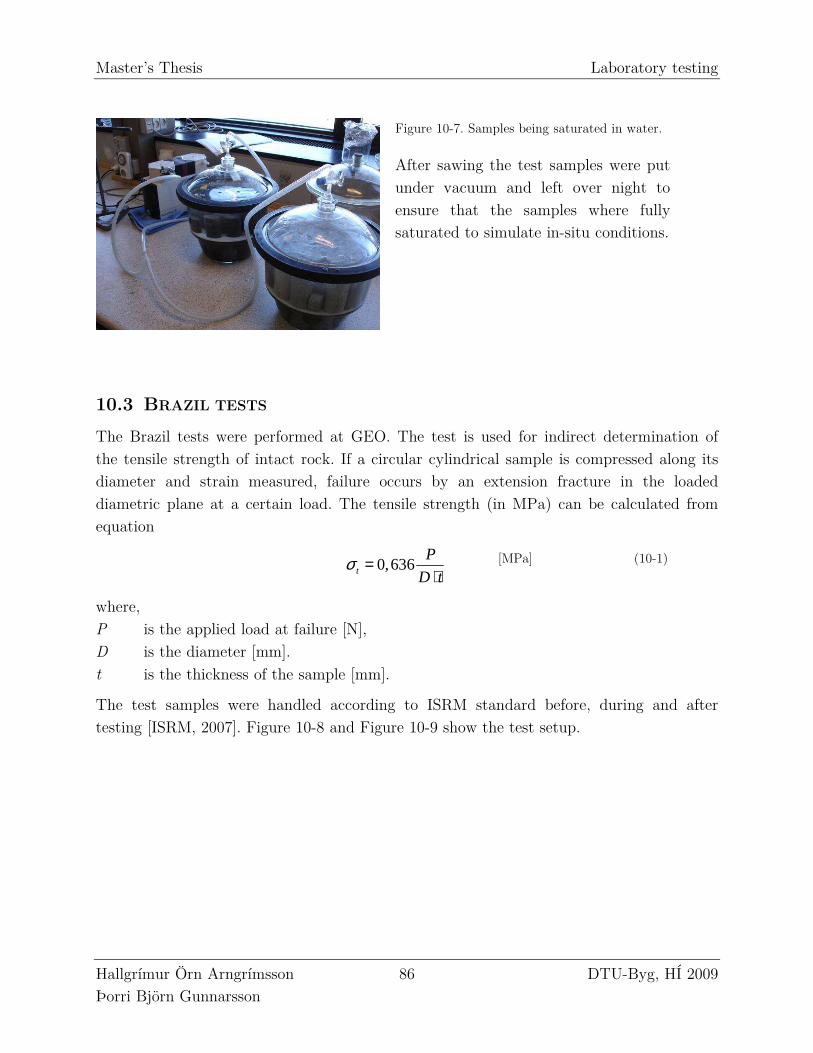
Master’s Thesis Laboratory testing
Hallgrímur Örn Arngrímsson 86 DTU-Byg, HÍ 2009 Þorri Björn Gunnarsson
Figure 10-7. Samples being saturated in water.
After sawing the test samples were put under vacuum and left over night to ensure that the samples where fully saturated to simulate in-situ conditions.
10.3 BRAZIL TESTS
The Brazil tests were performed at GEO. The test is used for indirect determination of the tensile strength of intact rock. If a circular cylindrical sample is compressed along its diameter and strain measured, failure occurs by an extension fracture in the loaded diametric plane at a certain load. The tensile strength (in MPa) can be calculated from equation
0,636t
P
D tσ =
⋅
[MPa] (10-1)
where, P is the applied load at failure [N], D is the diameter [mm]. t is the thickness of the sample [mm].
The test samples were handled according to ISRM standard before, during and after testing [ISRM, 2007]. Figure 10-8 and Figure 10-9 show the test setup.
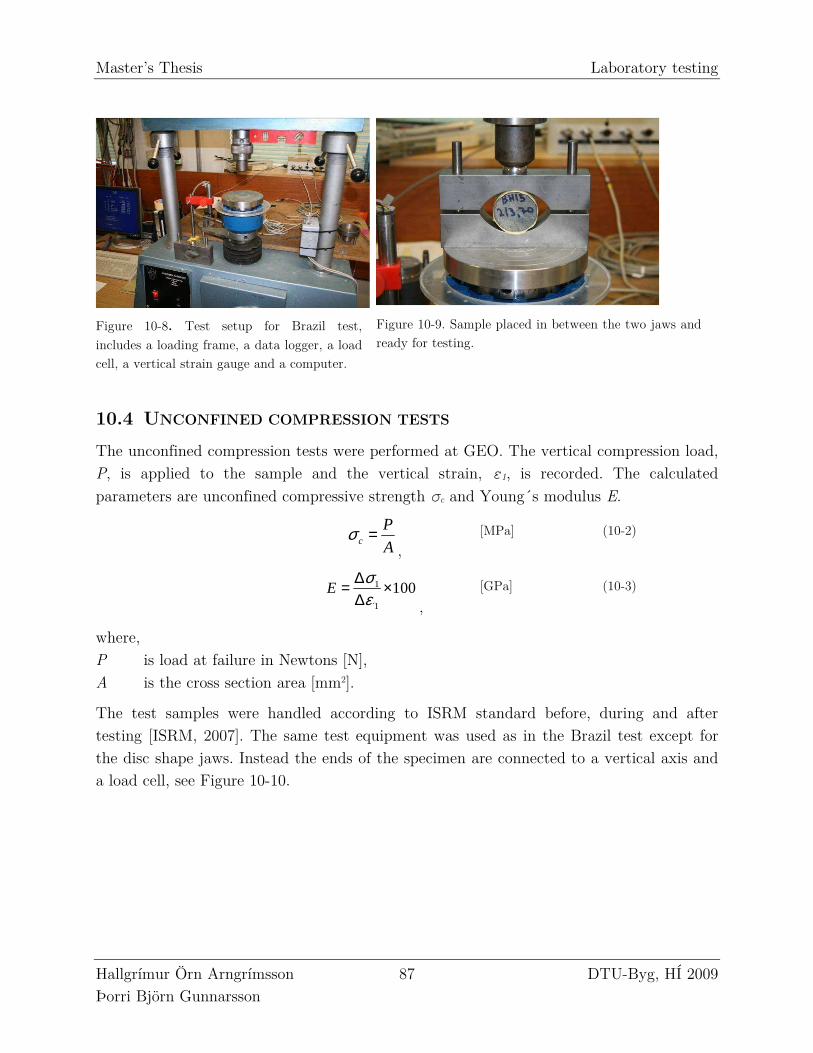
Master’s Thesis Laboratory testing
Hallgrímur Örn Arngrímsson 87 DTU-Byg, HÍ 2009 Þorri Björn Gunnarsson
Figure 10-8. Test setup for Brazil test, includes a loading frame, a data logger, a load cell, a vertical strain gauge and a computer.
Figure 10-9. Sample placed in between the two jaws and ready for testing.
10.4 UNCONFINED COMPRESSION TESTS
The unconfined compression tests were performed at GEO. The vertical compression load, P, is applied to the sample and the vertical strain, ε1, is recorded. The calculated parameters are unconfined compressive strength σc and Young´s modulus E.
c
P
Aσ =
, [MPa] (10-2)
1
1́
100Eσε
∆= ×∆ ,
[GPa] (10-3)
where, P is load at failure in Newtons [N], A is the cross section area [mm2].
The test samples were handled according to ISRM standard before, during and after testing [ISRM, 2007]. The same test equipment was used as in the Brazil test except for the disc shape jaws. Instead the ends of the specimen are connected to a vertical axis and a load cell, see Figure 10-10.
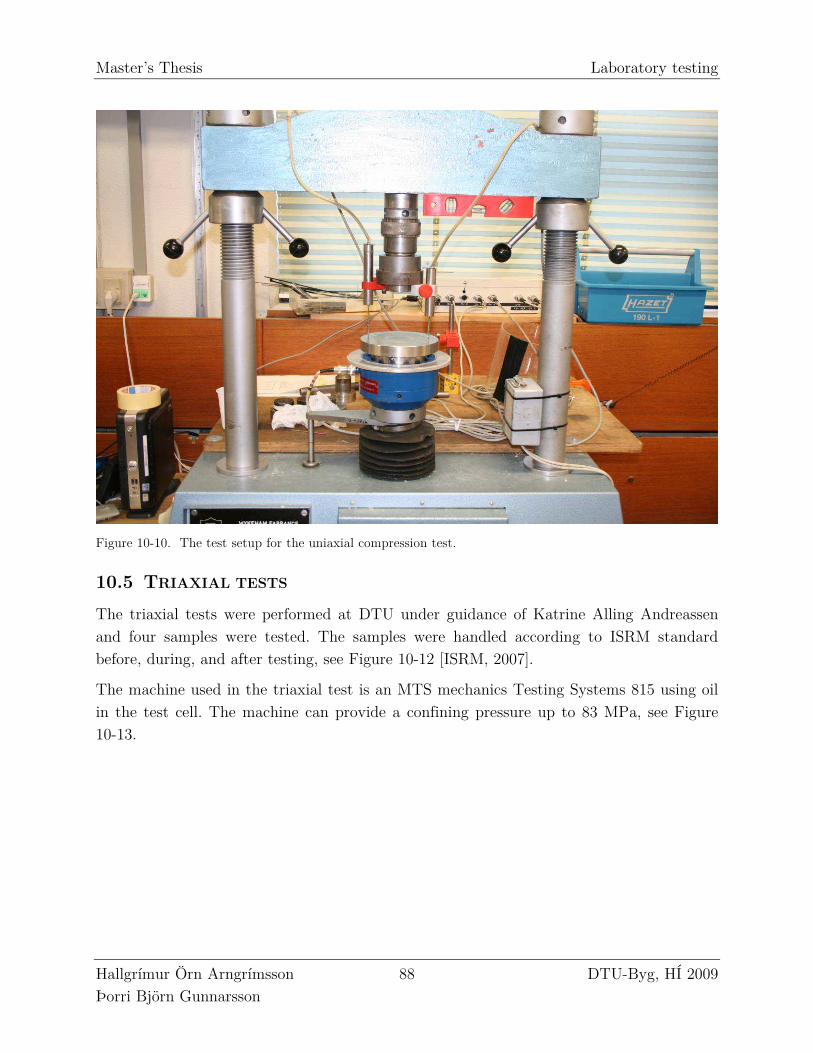
Master’s Thesis Laboratory testing
Hallgrímur Örn Arngrímsson 88 DTU-Byg, HÍ 2009 Þorri Björn Gunnarsson
Figure 10-10. The test setup for the uniaxial compression test.
10.5 TRIAXIAL TESTS
The triaxial tests were performed at DTU under guidance of Katrine Alling Andreassen and four samples were tested. The samples were handled according to ISRM standard before, during, and after testing, see Figure 10-12 [ISRM, 2007].
The machine used in the triaxial test is an MTS mechanics Testing Systems 815 using oil in the test cell. The machine can provide a confining pressure up to 83 MPa, see Figure 10-13.
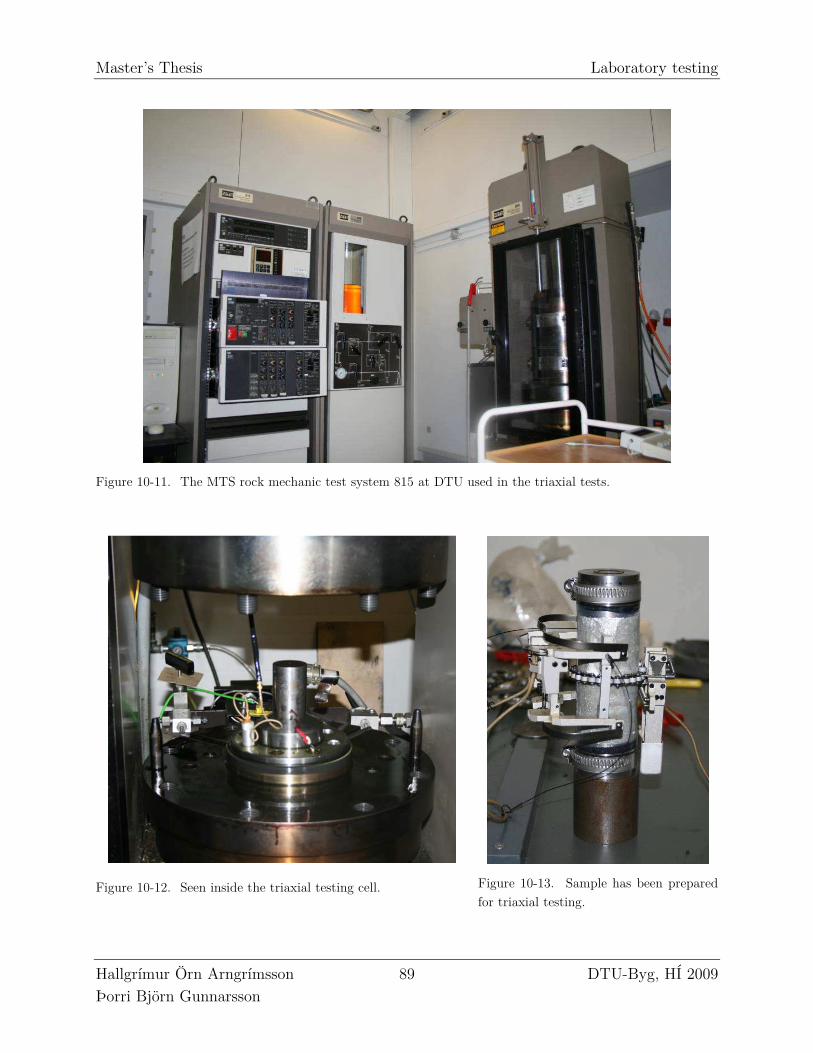
Master’s Thesis Laboratory testing
Hallgrímur Örn Arngrímsson 89 DTU-Byg, HÍ 2009 Þorri Björn Gunnarsson
Figure 10-11. The MTS rock mechanic test system 815 at DTU used in the triaxial tests.
Figure 10-12. Seen inside the triaxial testing cell.
Figure 10-13. Sample has been prepared for triaxial testing.
Master’s Thesis Laboratory testing
Hallgrímur Örn Arngrímsson 90 DTU-Byg, HÍ 2009 Þorri Björn Gunnarsson
10.5.1 Preparation
Two pressure heads are placed on each end of the sample. Self vulcanizing tape is applied on the pressure heads. Heat-shrinkable tubing is cut in the right length to make a rubber membrane around the sample, overlapping the vulcanising tape. The tube is heated with a heat gun to fit the sample tightly. Lock wire and hose clamps are fastened on the upper and lower pressure head to make a tight seal.
The axial and radial extensometers are fitted on the sample, see Figure 10-13. A chain for the radial extensometer is first adjusted to fit the sample.
10.5.2 Test procedure
The test procedure in the Triaxial test was as follows:
The samples were loaded in the axial and radial direction with “k0-loading” where radial and axial strains are kept constant. This was done until the radial stress reached 2 MPa which represents the in-situ horizontal stress (except for altered olivine tholeiite which was only 1 MPa, because of miscalculation in test procedure). Then the axial stress (σ1) was increased until it reached 20-30% of estimated failure load. This stress condition was maintained for about 30-60 min to simulate creep. The sample was driven toward failure with an unload/reload procedure. The axial load was decreased down to 7-9 MPa and then reloaded with constant k0-loading again up to 10 MPa. After this point in the procedure the confining pressure (σ3) was kept constant and the sample loaded towards failure.
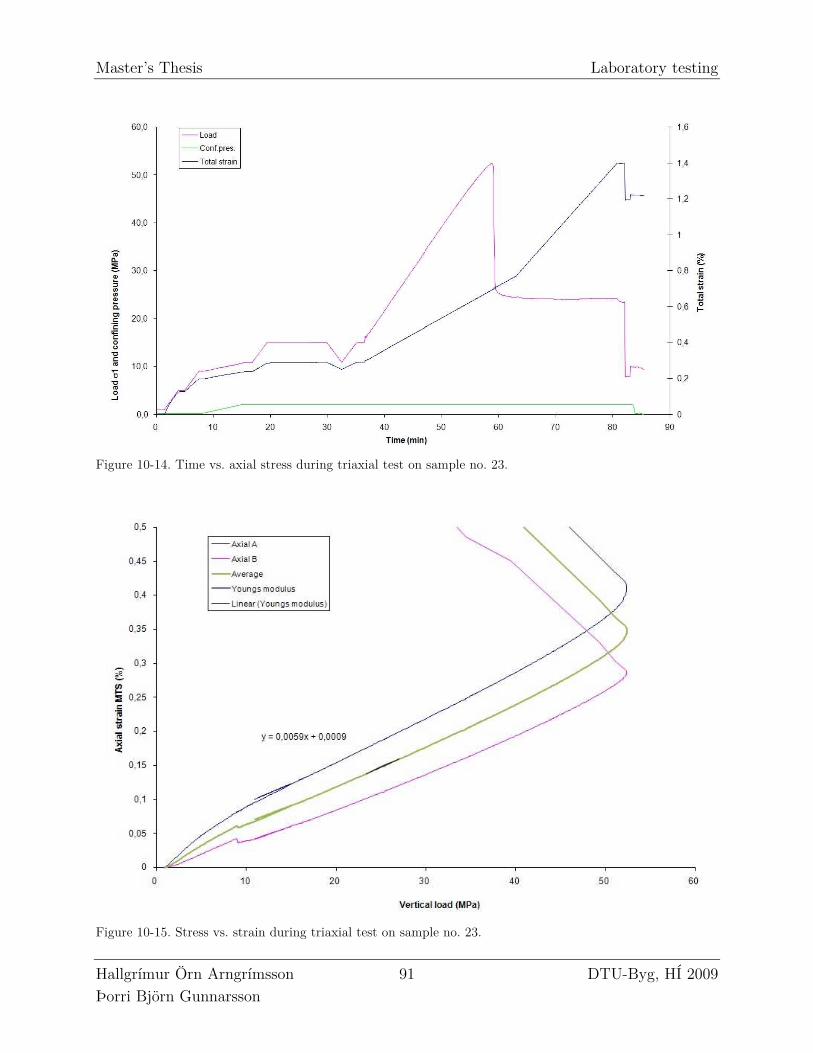
Master’s Thesis Laboratory testing
Hallgrímur Örn Arngrímsson 91 DTU-Byg, HÍ 2009 Þorri Björn Gunnarsson
Figure 10-14. Time vs. axial stress during triaxial test on sample no. 23.
Figure 10-15. Stress vs. strain during triaxial test on sample no. 23.
Master’s Thesis Laboratory testing
Hallgrímur Örn Arngrímsson 92 DTU-Byg, HÍ 2009 Þorri Björn Gunnarsson
The following parameters where calculated from this procedure: Young’s-modulus, Poisson ratio and triaxial compression failure value.
10.5.3 Young´s modulus
The modulus of elasticity or Young’s modulus (E) was measured in the reloading phase after unloading of the sample.
Eσε
∂=∂ ,
(10-4)
where, σ∂ is the change in stress, ε∂ is the change in strain.
The closest approximation to a modulus of elasticity derived from a truly elastic response is the initial tangent modulus, which was measured at 50% of peak stress value (σpeak), called E50.
10.5.4 Poisson´s ratio
Possion´s ratio (ν) is the ratio between the radial- and axial strain, defined as
radial
axial
ευε
∂= −∂ ,
(10-5)
where,
radialε is the change in radial strain (negative for axial tension, positive for axial
compression).
axialε is the change in axial strain (positive for axial tension, negative for axial
compression).
It is measured on a radial strain vs. axial strain diagram, at the same point in time as the Young’s modulus, E50.
10.5.5 Triaxial compression failure
The triaxial compression failure is where the sample looses strength and breaks because of external load. Each test was stopped a few minutes after the peak stress value was reached.
Master’s Thesis Laboratory testing
Hallgrímur Örn Arngrímsson 93 DTU-Byg, HÍ 2009 Þorri Björn Gunnarsson
10.5.6 Volume, bulk density, water content and porosity
The volume (V) of each sample was measured using two methods. First the height and diameter was measured on several points of sample and then the average values used to calculate the volume. Secondly the sample was weighed in water and the volume calculated using law of Archimedes.
Each sample was weighed before and after testing. Then the sample was put in an oven at 105 ̊C for minimum of 48 hours and then weighed again. From this it is possible to calculate the bulk density (ρb), water content (w), porosity (n) and void ratio (e).
solidsb
total
m
Vρ =
, (10-6)
where,
solidsm is the bulk mass of solids in the sample [g],
totalV is the total volume of the sample [cm3].
water
solids
mw
m=
, (10-7)
where,
waterm is the mass of water in the sample [g].
water
total
Vn
V= (fully saturated) (10-8)
1
ne
n=
− ,
(10-9)
where,
waterV is the total volume of water in a saturated surface dry sample [cm3].
10.6 LABORATORY RESULTS
Transportation and preparation of the test samples went according to plan. In one of the Brazil tests a rhyolite (inhomogenous) sample failed during installation. In the UCS tests two tholeiite and two rhyolite (homogenous) samples had to be tested in a different machine at DTU. This was because of their high density and strength and the machine at GEO was not able to measure the pressure needed for sample failure.
The five samples were selected for the Triaxial tests but only four were tested. They were carefully selected to be the most intact and with as few joints and discontinuities as possible. This was done because of how few samples were tested, it was important that
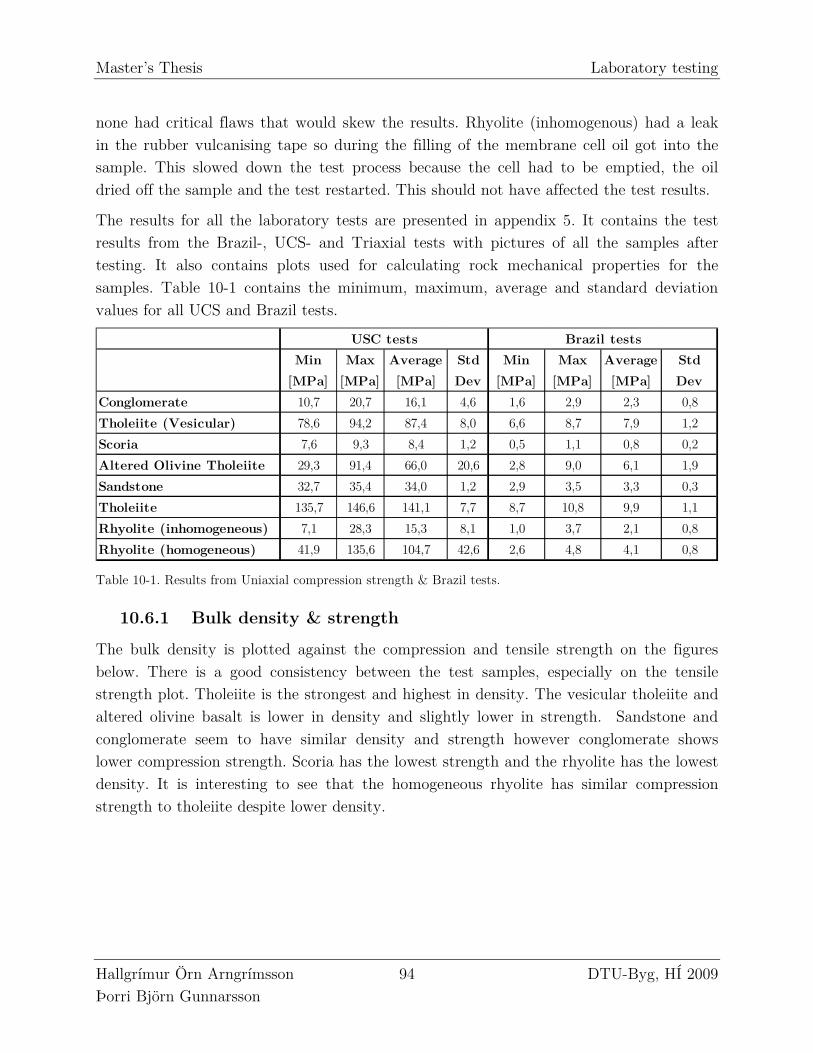
Master’s Thesis Laboratory testing
Hallgrímur Örn Arngrímsson 94 DTU-Byg, HÍ 2009 Þorri Björn Gunnarsson
none had critical flaws that would skew the results. Rhyolite (inhomogenous) had a leak in the rubber vulcanising tape so during the filling of the membrane cell oil got into the sample. This slowed down the test process because the cell had to be emptied, the oil dried off the sample and the test restarted. This should not have affected the test results.
The results for all the laboratory tests are presented in appendix 5. It contains the test results from the Brazil-, UCS- and Triaxial tests with pictures of all the samples after testing. It also contains plots used for calculating rock mechanical properties for the samples. Table 10-1 contains the minimum, maximum, average and standard deviation values for all UCS and Brazil tests.
Min
[MPa]
Max
[MPa]
Average
[MPa]
Std
Dev
Min
[MPa]
Max
[MPa]
Average
[MPa]
Std
Dev
Conglomerate 10,7 20,7 16,1 4,6 1,6 2,9 2,3 0,8
Tholeiite (Vesicular) 78,6 94,2 87,4 8,0 6,6 8,7 7,9 1,2
Scoria 7,6 9,3 8,4 1,2 0,5 1,1 0,8 0,2
Altered Olivine Tholeiite 29,3 91,4 66,0 20,6 2,8 9,0 6,1 1,9
Sandstone 32,7 35,4 34,0 1,2 2,9 3,5 3,3 0,3
Tholeiite 135,7 146,6 141,1 7,7 8,7 10,8 9,9 1,1
Rhyolite (inhomogeneous) 7,1 28,3 15,3 8,1 1,0 3,7 2,1 0,8
Rhyolite (homogeneous) 41,9 135,6 104,7 42,6 2,6 4,8 4,1 0,8
Brazil testsUSC tests
Table 10-1. Results from Uniaxial compression strength & Brazil tests.
10.6.1 Bulk density & strength
The bulk density is plotted against the compression and tensile strength on the figures below. There is a good consistency between the test samples, especially on the tensile strength plot. Tholeiite is the strongest and highest in density. The vesicular tholeiite and altered olivine basalt is lower in density and slightly lower in strength. Sandstone and conglomerate seem to have similar density and strength however conglomerate shows lower compression strength. Scoria has the lowest strength and the rhyolite has the lowest density. It is interesting to see that the homogeneous rhyolite has similar compression strength to tholeiite despite lower density.
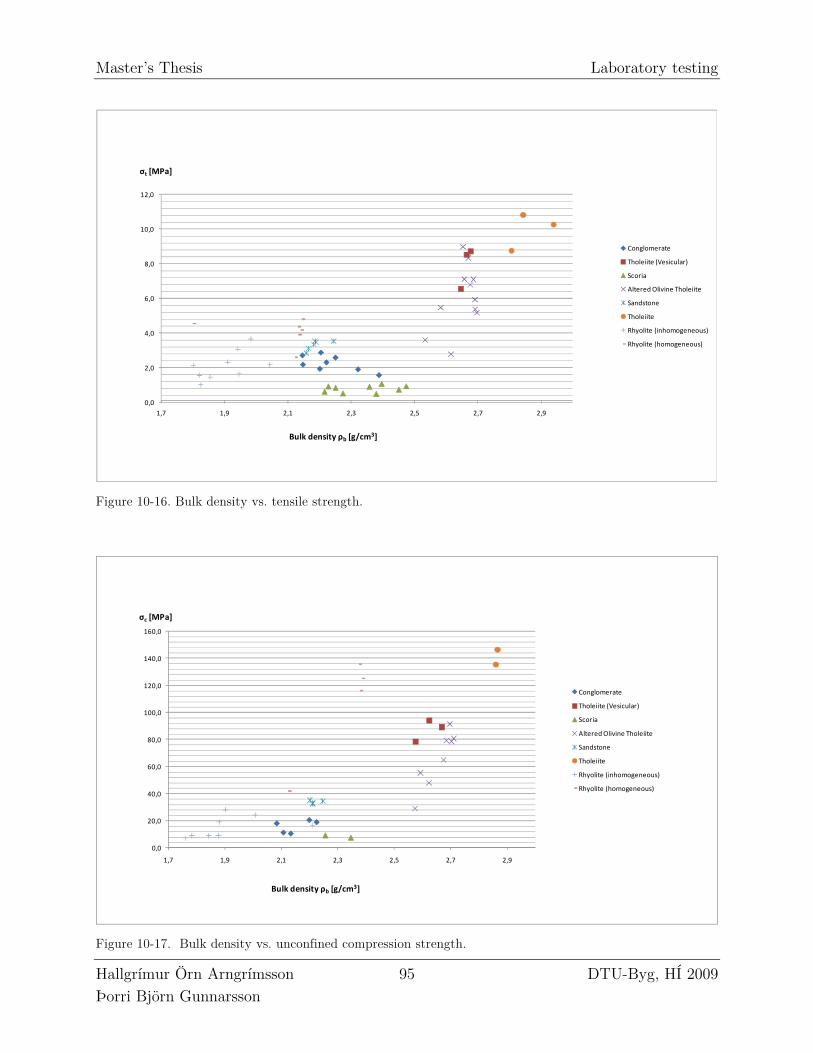
Master’s Thesis Laboratory testing
Hallgrímur Örn Arngrímsson 95 DTU-Byg, HÍ 2009 Þorri Björn Gunnarsson
0,0
2,0
4,0
6,0
8,0
10,0
12,0
1,7 1,9 2,1 2,3 2,5 2,7 2,9
Conglomerate
Tholeiite (Vesicular)
Scoria
Altered Olivine Tholeiite
Sandstone
Tholeiite
Rhyolite (inhomogeneous)
Rhyolite (homogeneous)
Bulk density ρb [g/cm3]
σt [MPa]
Figure 10-16. Bulk density vs. tensile strength.
0,0
20,0
40,0
60,0
80,0
100,0
120,0
140,0
160,0
1,7 1,9 2,1 2,3 2,5 2,7 2,9
Conglomerate
Tholeiite (Vesicular)
Scoria
Altered Olivine Tholeiite
Sandstone
Tholeiite
Rhyolite (inhomogeneous)
Rhyolite (homogeneous)
Bulk density ρb [g/cm3]
σc [MPa]
Figure 10-17. Bulk density vs. unconfined compression strength.
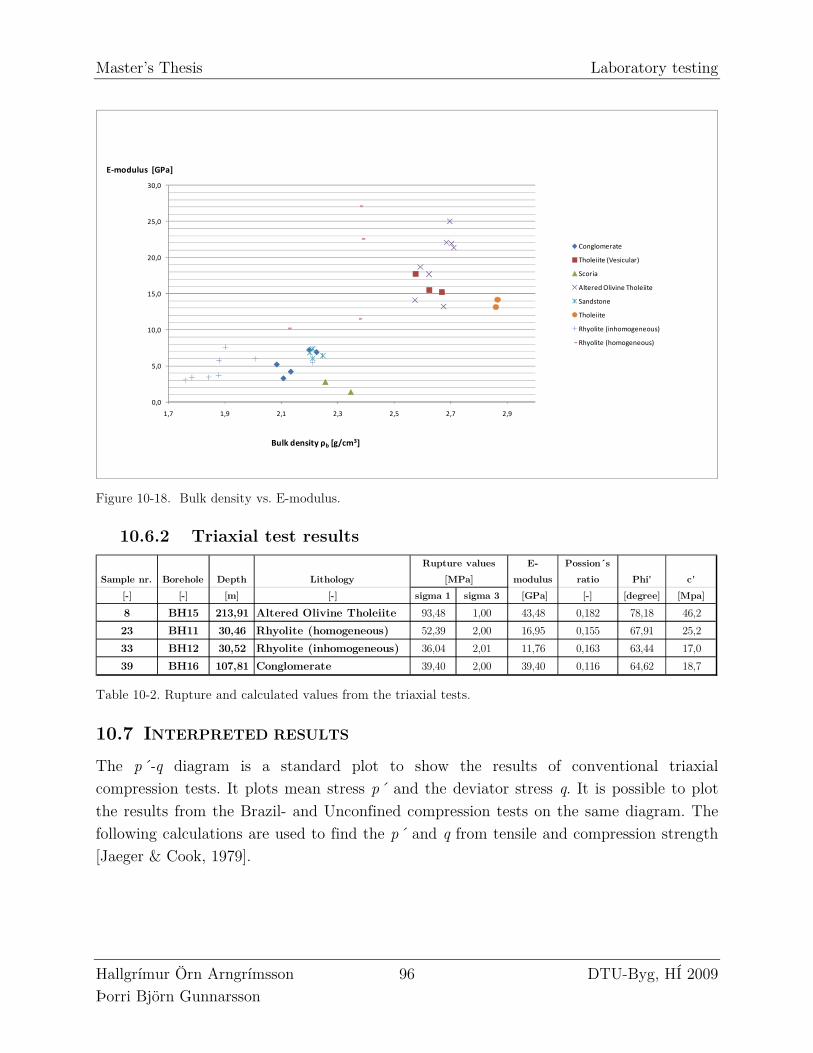
Master’s Thesis Laboratory testing
Hallgrímur Örn Arngrímsson 96 DTU-Byg, HÍ 2009 Þorri Björn Gunnarsson
0,0
5,0
10,0
15,0
20,0
25,0
30,0
1,7 1,9 2,1 2,3 2,5 2,7 2,9
Conglomerate
Tholeiite (Vesicular)
Scoria
Altered Olivine Tholeiite
Sandstone
Tholeiite
Rhyolite (inhomogeneous)
Rhyolite (homogeneous)
Bulk density ρb [g/cm3]
E-modulus [GPa]
Figure 10-18. Bulk density vs. E-modulus.
10.6.2 Triaxial test results
Sample nr. Borehole Depth Lithology
E-
modulus
Possion´s
ratio Phi' c'
[-] [-] [m] [-] sigma 1 sigma 3 [GPa] [-] [degree] [Mpa]
8 BH15 213,91 Altered Olivine Tholeiite 93,48 1,00 43,48 0,182 78,18 46,2
23 BH11 30,46 Rhyolite (homogeneous) 52,39 2,00 16,95 0,155 67,91 25,2
33 BH12 30,52 Rhyolite (inhomogeneous) 36,04 2,01 11,76 0,163 63,44 17,0
39 BH16 107,81 Conglomerate 39,40 2,00 39,40 0,116 64,62 18,7
Rupture values
[MPa]
Table 10-2. Rupture and calculated values from the triaxial tests.
10.7 INTERPRETED RESULTS
The p´-q diagram is a standard plot to show the results of conventional triaxial compression tests. It plots mean stress p´ and the deviator stress q. It is possible to plot the results from the Brazil- and Unconfined compression tests on the same diagram. The following calculations are used to find the p´ and q from tensile and compression strength [Jaeger & Cook, 1979].
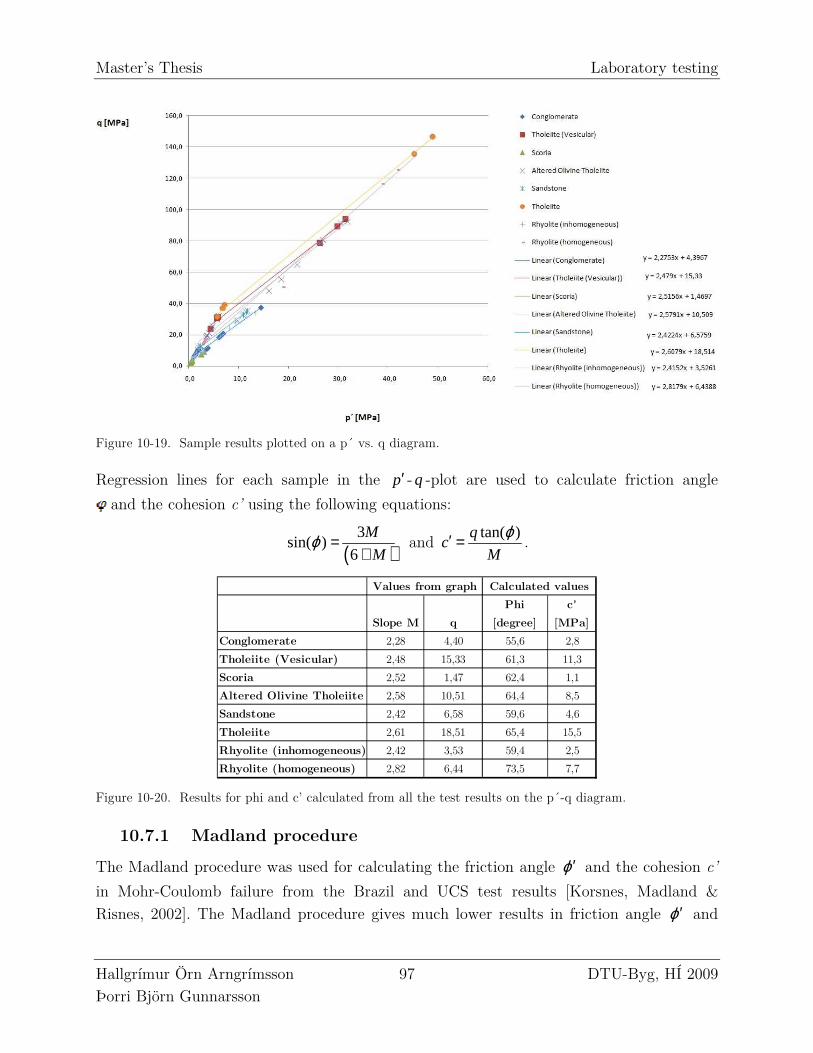
Master’s Thesis Laboratory testing
Hallgrímur Örn Arngrímsson 97 DTU-Byg, HÍ 2009 Þorri Björn Gunnarsson
Figure 10-19. Sample results plotted on a p´ vs. q diagram.
Regression lines for each sample in the p′ - q -plot are used to calculate friction angle
and the cohesion c’ using the following equations:
( )3
sin( )6
M
Mϕ =
+ and
tan( )qc
M
ϕ′ = .
Slope M q
Phi
[degree]
c'
[MPa]
Conglomerate 2,28 4,40 55,6 2,8
Tholeiite (Vesicular) 2,48 15,33 61,3 11,3
Scoria 2,52 1,47 62,4 1,1
Altered Olivine Tholeiite 2,58 10,51 64,4 8,5
Sandstone 2,42 6,58 59,6 4,6
Tholeiite 2,61 18,51 65,4 15,5
Rhyolite (inhomogeneous) 2,42 3,53 59,4 2,5
Rhyolite (homogeneous) 2,82 6,44 73,5 7,7
Values from graph Calculated values
Figure 10-20. Results for phi and c’ calculated from all the test results on the p´-q diagram.
10.7.1 Madland procedure
The Madland procedure was used for calculating the friction angle ϕ′ and the cohesion c’
in Mohr-Coulomb failure from the Brazil and UCS test results [Korsnes, Madland & Risnes, 2002]. The Madland procedure gives much lower results in friction angle ϕ′ and
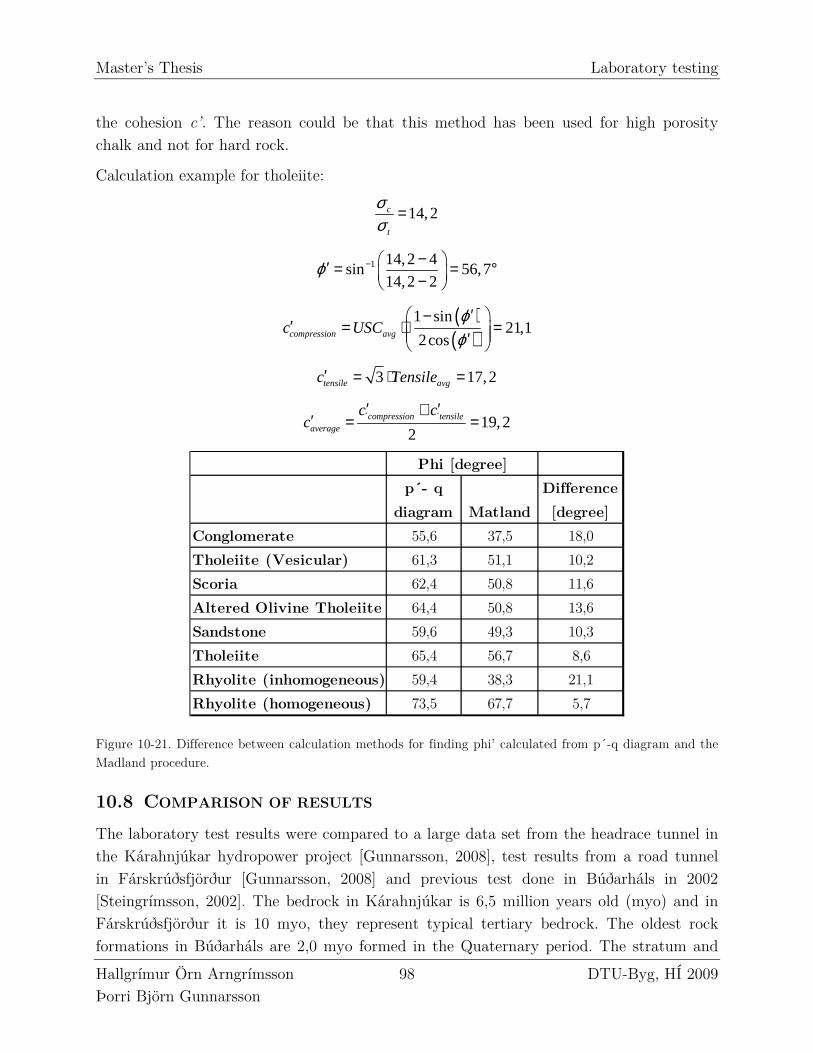
Master’s Thesis Laboratory testing
Hallgrímur Örn Arngrímsson 98 DTU-Byg, HÍ 2009 Þorri Björn Gunnarsson
the cohesion c’. The reason could be that this method has been used for high porosity chalk and not for hard rock.
Calculation example for tholeiite:
14,2c
t
σσ
=
1 14,2 4sin 56,7
14,2 2ϕ − − ′ = = ° −
( )( )
1 sin21,1
2coscompression avgc USCϕϕ
′−′ = ⋅ = ′
3 17,2tensile avgc Tensile′ = ⋅ =
´ ´ 19,22
compression tensileaverage
c cc
′ ′+′ = =
p´- q
diagram Matland
Difference
[degree]
Conglomerate 55,6 37,5 18,0
Tholeiite (Vesicular) 61,3 51,1 10,2
Scoria 62,4 50,8 11,6
Altered Olivine Tholeiite 64,4 50,8 13,6
Sandstone 59,6 49,3 10,3
Tholeiite 65,4 56,7 8,6
Rhyolite (inhomogeneous) 59,4 38,3 21,1
Rhyolite (homogeneous) 73,5 67,7 5,7
Phi [degree]
Figure 10-21. Difference between calculation methods for finding phi’ calculated from p´-q diagram and the Madland procedure.
10.8 COMPARISON OF RESULTS
The laboratory test results were compared to a large data set from the headrace tunnel in the Kárahnjúkar hydropower project [Gunnarsson, 2008], test results from a road tunnel in Fárskrúðsfjörður [Gunnarsson, 2008] and previous test done in Búðarháls in 2002 [Steingrímsson, 2002]. The bedrock in Kárahnjúkar is 6,5 million years old (myo) and in Fárskrúðsfjörður it is 10 myo, they represent typical tertiary bedrock. The oldest rock formations in Búðarháls are 2,0 myo formed in the Quaternary period. The stratum and
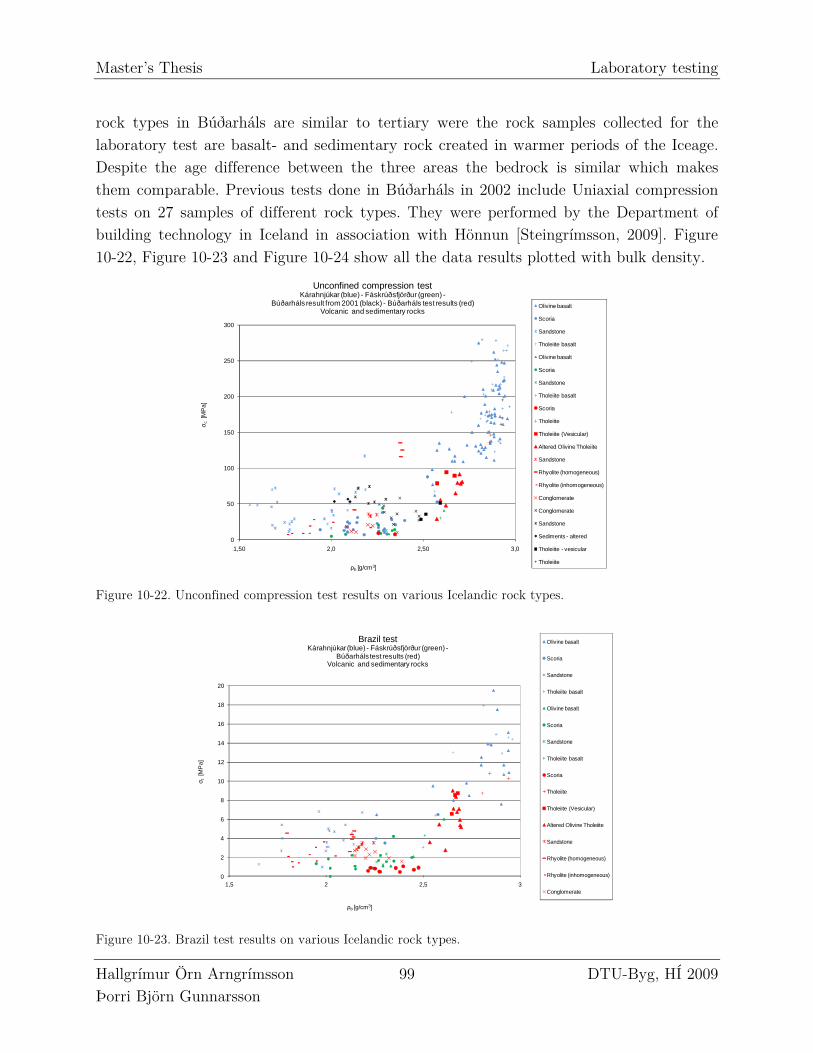
Master’s Thesis Laboratory testing
Hallgrímur Örn Arngrímsson 99 DTU-Byg, HÍ 2009 Þorri Björn Gunnarsson
rock types in Búðarháls are similar to tertiary were the rock samples collected for the laboratory test are basalt- and sedimentary rock created in warmer periods of the Iceage. Despite the age difference between the three areas the bedrock is similar which makes them comparable. Previous tests done in Búðarháls in 2002 include Uniaxial compression tests on 27 samples of different rock types. They were performed by the Department of building technology in Iceland in association with Hönnun [Steingrímsson, 2009]. Figure 10-22, Figure 10-23 and Figure 10-24 show all the data results plotted with bulk density.
0
50
100
150
200
250
300
1,50 2,0 2,50 3,0
σc
[MP
a]
ρb [g/cm3]
Unconfined compression testKárahnjúkar (blue) - Fáskrúðsfjörður (green) -
Búðarháls result from 2001 (black) - Búðarháls test results (red) Volcanic and sedimentary rocks
Olivine basalt
Scoria
Sandstone
Tholeiite basalt
Olivine basalt
Scoria
Sandstone
Tholeiite basalt
Scoria
Tholeiite
Tholeiite (Vesicular)
Altered Olivine Tholeiite
Sandstone
Rhyolite (homogeneous)
Rhyolite (inhomogeneous)
Conglomerate
Conglomerate
Sandstone
Sediments - altered
Tholeiite - vesicular
Tholeiite
Figure 10-22. Unconfined compression test results on various Icelandic rock types.
0
2
4
6
8
10
12
14
16
18
20
1,5 2 2,5 3
σt
[MP
a]
ρb [g/cm3]
Brazil testKárahnjúkar (blue) - Fáskrúðsfjörður (green) -
Búðarháls test results (red)Volcanic and sedimentary rocks
Olivine basalt
Scoria
Sandstone
Tholeiite basalt
Olivine basalt
Scoria
Sandstone
Tholeiite basalt
Scoria
Tholeiite
Tholeiite (Vesicular)
Altered Olivine Tholeiite
Sandstone
Rhyolite (homogeneous)
Rhyolite (inhomogeneous)
Conglomerate
Figure 10-23. Brazil test results on various Icelandic rock types.
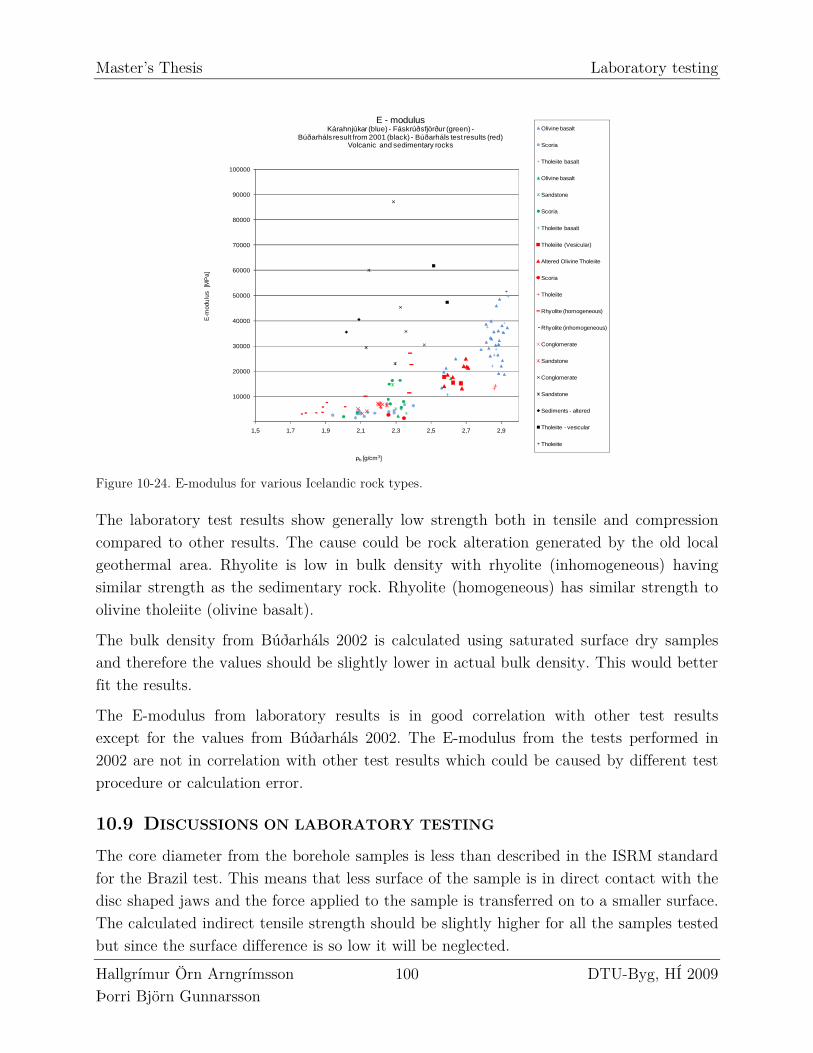
Master’s Thesis Laboratory testing
Hallgrímur Örn Arngrímsson 100 DTU-Byg, HÍ 2009 Þorri Björn Gunnarsson
10000
20000
30000
40000
50000
60000
70000
80000
90000
100000
1,5 1,7 1,9 2,1 2,3 2,5 2,7 2,9
E-m
odu
lus
[M
Pa]
ρb [g/cm3]
E - modulusKárahnjúkar (blue) - Fáskrúðsfjörður (green) -
Búðarháls result from 2001 (black) - Búðarháls test results (red) Volcanic and sedimentary rocks
Olivine basalt
Scoria
Tholeiite basalt
Olivine basalt
Sandstone
Scoria
Tholeiite basalt
Tholeiite (Vesicular)
Altered Olivine Tholeiite
Scoria
Tholeiite
Rhyolite (homogeneous)
Rhyolite (inhomogeneous)
Conglomerate
Sandstone
Conglomerate
Sandstone
Sediments - altered
Tholeiite - vesicular
Tholeiite
Figure 10-24. E-modulus for various Icelandic rock types.
The laboratory test results show generally low strength both in tensile and compression compared to other results. The cause could be rock alteration generated by the old local geothermal area. Rhyolite is low in bulk density with rhyolite (inhomogeneous) having similar strength as the sedimentary rock. Rhyolite (homogeneous) has similar strength to olivine tholeiite (olivine basalt).
The bulk density from Búðarháls 2002 is calculated using saturated surface dry samples and therefore the values should be slightly lower in actual bulk density. This would better fit the results.
The E-modulus from laboratory results is in good correlation with other test results except for the values from Búðarháls 2002. The E-modulus from the tests performed in 2002 are not in correlation with other test results which could be caused by different test procedure or calculation error.
10.9 DISCUSSIONS ON LABORATORY TESTING
The core diameter from the borehole samples is less than described in the ISRM standard for the Brazil test. This means that less surface of the sample is in direct contact with the disc shaped jaws and the force applied to the sample is transferred on to a smaller surface. The calculated indirect tensile strength should be slightly higher for all the samples tested but since the surface difference is so low it will be neglected.
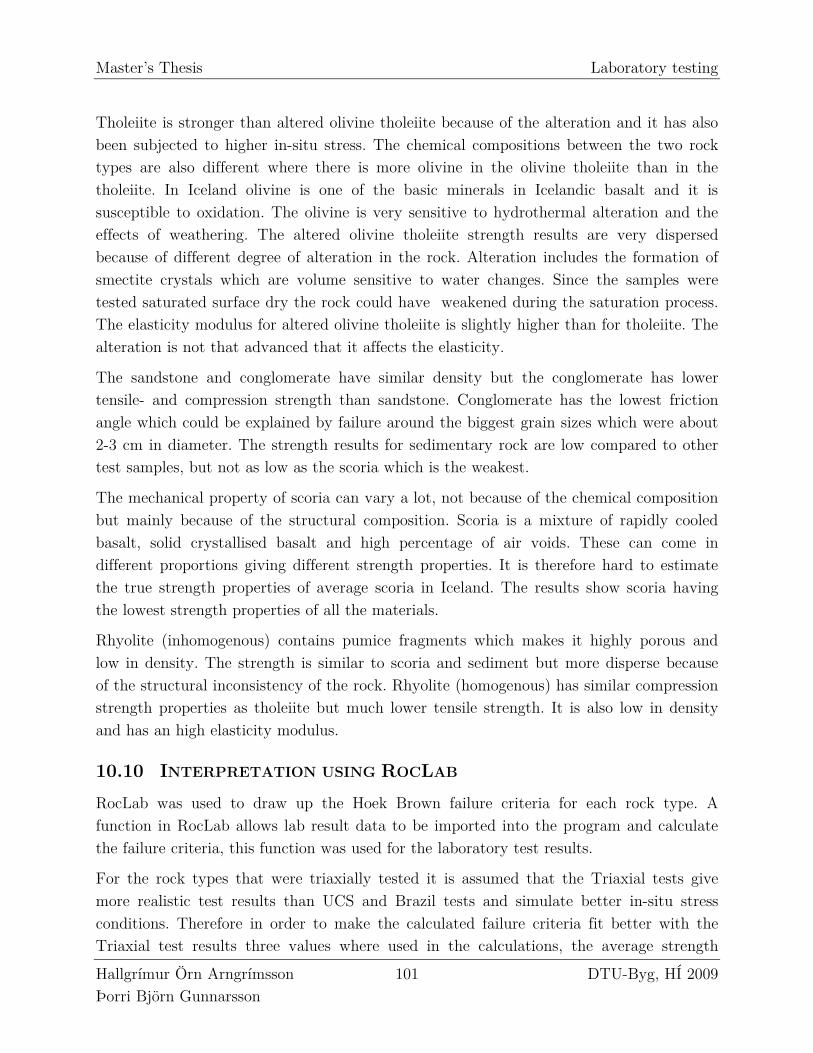
Master’s Thesis Laboratory testing
Hallgrímur Örn Arngrímsson 101 DTU-Byg, HÍ 2009 Þorri Björn Gunnarsson
Tholeiite is stronger than altered olivine tholeiite because of the alteration and it has also been subjected to higher in-situ stress. The chemical compositions between the two rock types are also different where there is more olivine in the olivine tholeiite than in the tholeiite. In Iceland olivine is one of the basic minerals in Icelandic basalt and it is susceptible to oxidation. The olivine is very sensitive to hydrothermal alteration and the effects of weathering. The altered olivine tholeiite strength results are very dispersed because of different degree of alteration in the rock. Alteration includes the formation of smectite crystals which are volume sensitive to water changes. Since the samples were tested saturated surface dry the rock could have weakened during the saturation process. The elasticity modulus for altered olivine tholeiite is slightly higher than for tholeiite. The alteration is not that advanced that it affects the elasticity.
The sandstone and conglomerate have similar density but the conglomerate has lower tensile- and compression strength than sandstone. Conglomerate has the lowest friction angle which could be explained by failure around the biggest grain sizes which were about 2-3 cm in diameter. The strength results for sedimentary rock are low compared to other test samples, but not as low as the scoria which is the weakest.
The mechanical property of scoria can vary a lot, not because of the chemical composition but mainly because of the structural composition. Scoria is a mixture of rapidly cooled basalt, solid crystallised basalt and high percentage of air voids. These can come in different proportions giving different strength properties. It is therefore hard to estimate the true strength properties of average scoria in Iceland. The results show scoria having the lowest strength properties of all the materials.
Rhyolite (inhomogenous) contains pumice fragments which makes it highly porous and low in density. The strength is similar to scoria and sediment but more disperse because of the structural inconsistency of the rock. Rhyolite (homogenous) has similar compression strength properties as tholeiite but much lower tensile strength. It is also low in density and has an high elasticity modulus.
10.10 INTERPRETATION USING ROCLAB
RocLab was used to draw up the Hoek Brown failure criteria for each rock type. A function in RocLab allows lab result data to be imported into the program and calculate the failure criteria, this function was used for the laboratory test results.
For the rock types that were triaxially tested it is assumed that the Triaxial tests give more realistic test results than UCS and Brazil tests and simulate better in-situ stress conditions. Therefore in order to make the calculated failure criteria fit better with the Triaxial test results three values where used in the calculations, the average strength
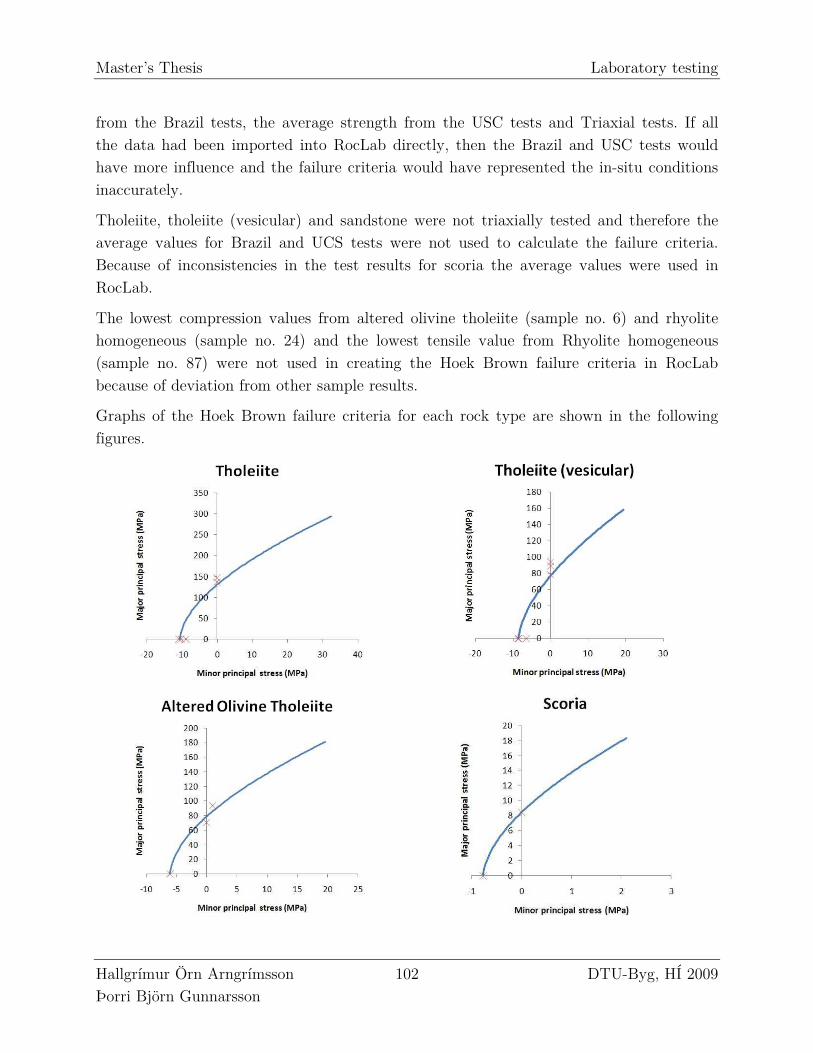
Master’s Thesis Laboratory testing
Hallgrímur Örn Arngrímsson 102 DTU-Byg, HÍ 2009 Þorri Björn Gunnarsson
from the Brazil tests, the average strength from the USC tests and Triaxial tests. If all the data had been imported into RocLab directly, then the Brazil and USC tests would have more influence and the failure criteria would have represented the in-situ conditions inaccurately.
Tholeiite, tholeiite (vesicular) and sandstone were not triaxially tested and therefore the average values for Brazil and UCS tests were not used to calculate the failure criteria. Because of inconsistencies in the test results for scoria the average values were used in RocLab.
The lowest compression values from altered olivine tholeiite (sample no. 6) and rhyolite homogeneous (sample no. 24) and the lowest tensile value from Rhyolite homogeneous (sample no. 87) were not used in creating the Hoek Brown failure criteria in RocLab because of deviation from other sample results.
Graphs of the Hoek Brown failure criteria for each rock type are shown in the following figures.
Master’s Thesis Laboratory testing
Hallgrímur Örn Arngrímsson 103 DTU-Byg, HÍ 2009 Þorri Björn Gunnarsson
The main parameters for intact rock in RocLab, σci and mi are presented in Table 10-3. There is a difference in using all the data or the average data in the calculations which was explained earlier. Compared to other published values, σci gives similar results but the failure criterion parameter mi is lower.
sigci mi sigci mi sigci mi Reference sigci/mi
Tholeiite (Vesicular) 77,3 8,9 77,3 8,9 50-70 20-30 Jónsson, 1996/Hoek&Brown, 2002
Sandstone 31,8 9,0 31,8 9,0 5-30 13-22 Guðmundsson, 1991/Hoek&Brown, 2002
Tholeiite 129,8 12,2 129,8 12,2 100-300 20-30 Guðmundsson, 1991/Hoek&Brown, 2002
Conglomerate 14,8 5,4 23,4 10,9 5-80 18-24 Guðmundsson, 1991/Hoek&Brown, 2002
Scoria 3,9 4,0 8,4 10,9 10-50 8-18 Guðmundsson, 1991/Hoek&Brown, 2002
Altered Olivine Tholeiite 49,5 6,9 78,7 12,9 50-70 - Jónsson, 1996/-
Rhyolite (inhomogeneous) 12,4 4,1 21,3 10,0 - - -/-
Rhyolite (homogeneous) 69,0 15,6 66,8 16,3 - 20-30 -/Hoek&Brown, 2002
All data Average data Published values
Table 10-3. Results for the RocLab parameters σci and mi compared to other published values.

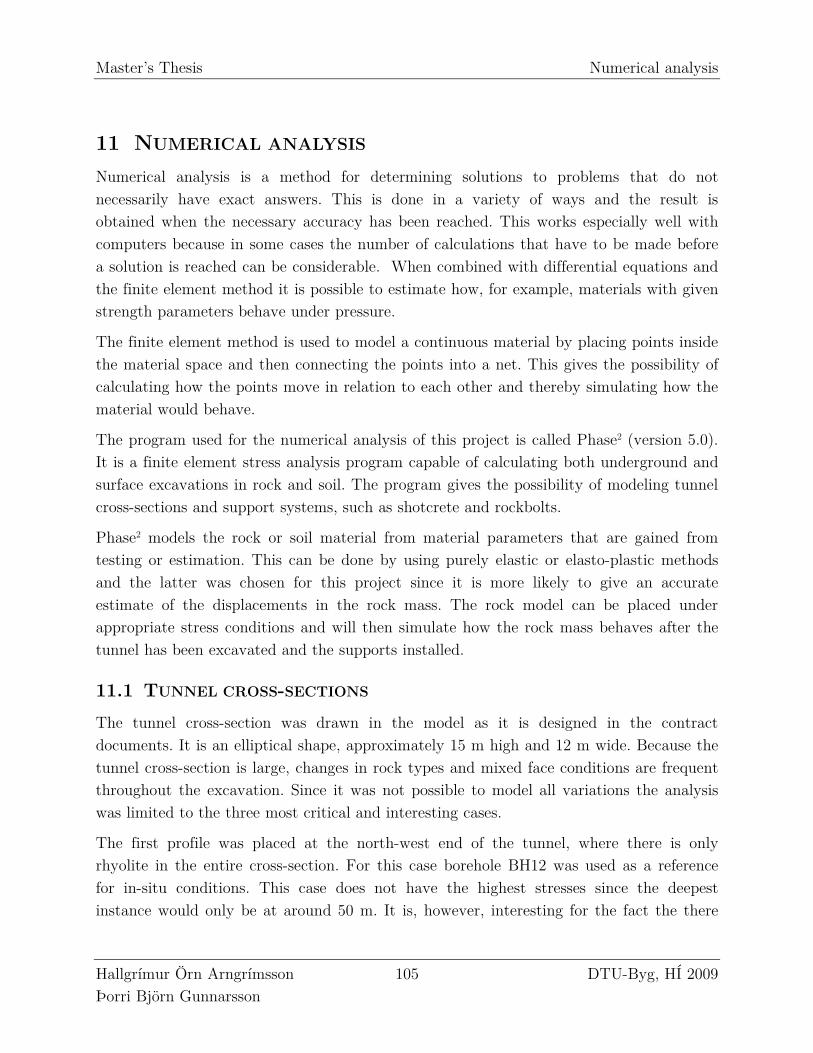
Master’s Thesis Numerical analysis
Hallgrímur Örn Arngrímsson 105 DTU-Byg, HÍ 2009 Þorri Björn Gunnarsson
11 NUMERICAL ANALYSIS
Numerical analysis is a method for determining solutions to problems that do not necessarily have exact answers. This is done in a variety of ways and the result is obtained when the necessary accuracy has been reached. This works especially well with computers because in some cases the number of calculations that have to be made before a solution is reached can be considerable. When combined with differential equations and the finite element method it is possible to estimate how, for example, materials with given strength parameters behave under pressure.
The finite element method is used to model a continuous material by placing points inside the material space and then connecting the points into a net. This gives the possibility of calculating how the points move in relation to each other and thereby simulating how the material would behave.
The program used for the numerical analysis of this project is called Phase2 (version 5.0). It is a finite element stress analysis program capable of calculating both underground and surface excavations in rock and soil. The program gives the possibility of modeling tunnel cross-sections and support systems, such as shotcrete and rockbolts.
Phase2 models the rock or soil material from material parameters that are gained from testing or estimation. This can be done by using purely elastic or elasto-plastic methods and the latter was chosen for this project since it is more likely to give an accurate estimate of the displacements in the rock mass. The rock model can be placed under appropriate stress conditions and will then simulate how the rock mass behaves after the tunnel has been excavated and the supports installed.
11.1 TUNNEL CROSS-SECTIONS
The tunnel cross-section was drawn in the model as it is designed in the contract documents. It is an elliptical shape, approximately 15 m high and 12 m wide. Because the tunnel cross-section is large, changes in rock types and mixed face conditions are frequent throughout the excavation. Since it was not possible to model all variations the analysis was limited to the three most critical and interesting cases.
The first profile was placed at the north-west end of the tunnel, where there is only rhyolite in the entire cross-section. For this case borehole BH12 was used as a reference for in-situ conditions. This case does not have the highest stresses since the deepest instance would only be at around 50 m. It is, however, interesting for the fact the there
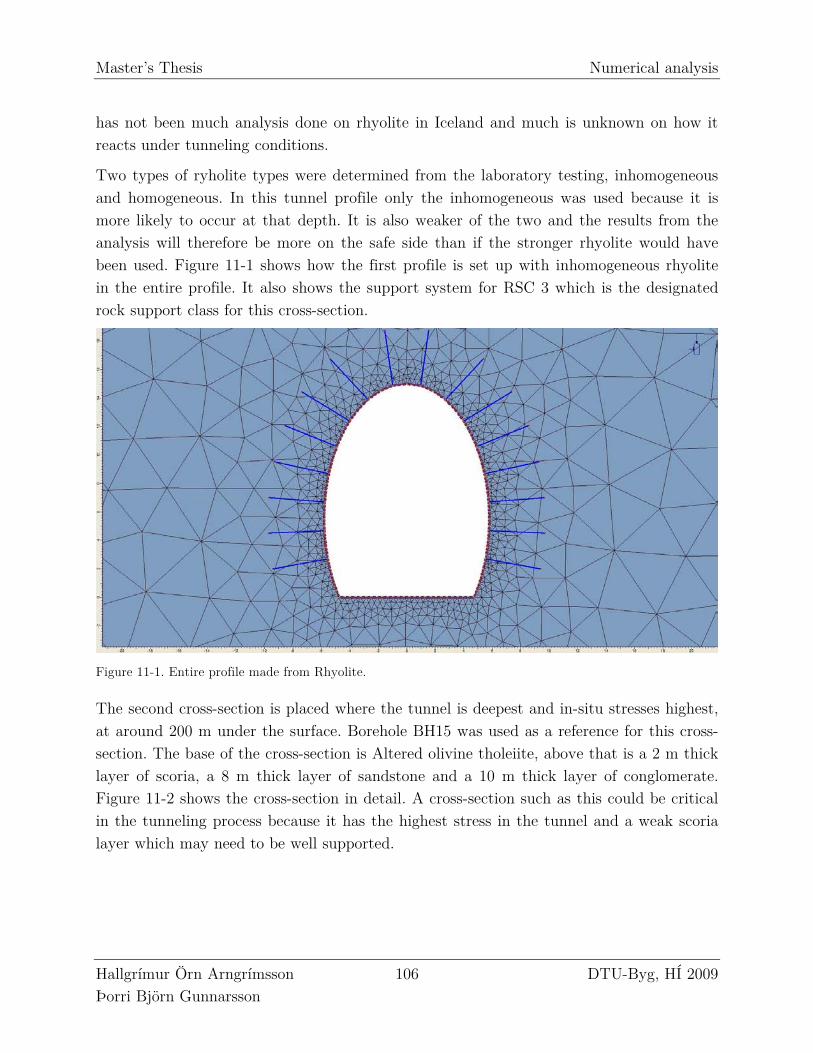
Master’s Thesis Numerical analysis
Hallgrímur Örn Arngrímsson 106 DTU-Byg, HÍ 2009 Þorri Björn Gunnarsson
has not been much analysis done on rhyolite in Iceland and much is unknown on how it reacts under tunneling conditions.
Two types of ryholite types were determined from the laboratory testing, inhomogeneous and homogeneous. In this tunnel profile only the inhomogeneous was used because it is more likely to occur at that depth. It is also weaker of the two and the results from the analysis will therefore be more on the safe side than if the stronger rhyolite would have been used. Figure 11-1 shows how the first profile is set up with inhomogeneous rhyolite in the entire profile. It also shows the support system for RSC 3 which is the designated rock support class for this cross-section.
Figure 11-1. Entire profile made from Rhyolite.
The second cross-section is placed where the tunnel is deepest and in-situ stresses highest, at around 200 m under the surface. Borehole BH15 was used as a reference for this cross-section. The base of the cross-section is Altered olivine tholeiite, above that is a 2 m thick layer of scoria, a 8 m thick layer of sandstone and a 10 m thick layer of conglomerate. Figure 11-2 shows the cross-section in detail. A cross-section such as this could be critical in the tunneling process because it has the highest stress in the tunnel and a weak scoria layer which may need to be well supported.
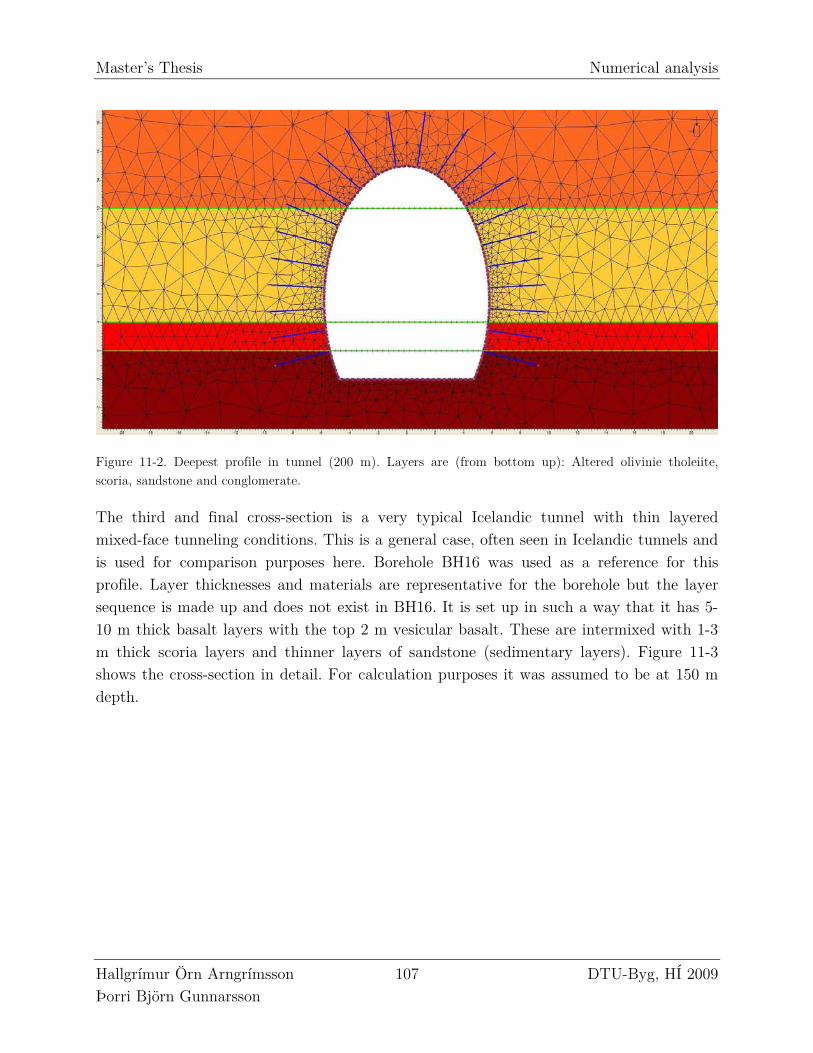
Master’s Thesis Numerical analysis
Hallgrímur Örn Arngrímsson 107 DTU-Byg, HÍ 2009 Þorri Björn Gunnarsson
Figure 11-2. Deepest profile in tunnel (200 m). Layers are (from bottom up): Altered olivinie tholeiite, scoria, sandstone and conglomerate.
The third and final cross-section is a very typical Icelandic tunnel with thin layered mixed-face tunneling conditions. This is a general case, often seen in Icelandic tunnels and is used for comparison purposes here. Borehole BH16 was used as a reference for this profile. Layer thicknesses and materials are representative for the borehole but the layer sequence is made up and does not exist in BH16. It is set up in such a way that it has 5-10 m thick basalt layers with the top 2 m vesicular basalt. These are intermixed with 1-3 m thick scoria layers and thinner layers of sandstone (sedimentary layers). Figure 11-3 shows the cross-section in detail. For calculation purposes it was assumed to be at 150 m depth.
Master’s Thesis Numerical analysis
Hallgrímur Örn Arngrímsson 108 DTU-Byg, HÍ 2009 Þorri Björn Gunnarsson
Figure 11-3. Typical Icelandic mixed-face tunnel with layers of basalt (green), vesicular basalt (light green), scoria (red) and sandstone (yellow).
11.2 DISCUSSION OF INPUT PARAMETERS
Phase2 is capable of modeling rock and soil materials with several methods. They can be assumed to be isotropic, transversely isotropic or orthotropic. They can be made perfectly elastic or elasto-plastic. Finally the material can be assumed to fail under three different failure criterions; Mohr-Coulomb, Hoek-Brown or Drucker-Prager.
For this project the material will be modeled as elasto-plastic since that should give a more realistic result for the displacements. The failure criterion used will be the Hoek-Brown since the two programs used to model the failure criterion (Phase2 and RocLab) are both designed for this criterion and should therefore give more accurate results. Finally, all materials are assumed to be isotropic.
11.2.1 Field stress and load split
The analysis uses a constant field stress over the entire area. This means that the vertical stress (major in-plane principal stress, σ1) is calculated based on burial depth and then k0 is determined for the site assumed to be equal to 0,5.
The out-of-plane stress (σz) is assumed to be equal to σ3 because of isotropic conditions. These field stresses are assumed to be constant over the entire area around the tunnel; this is possible because the tunnel is relatively deep. For excavations near or at the surface it would be more accurate to vary the stress with depth. All the stress values used
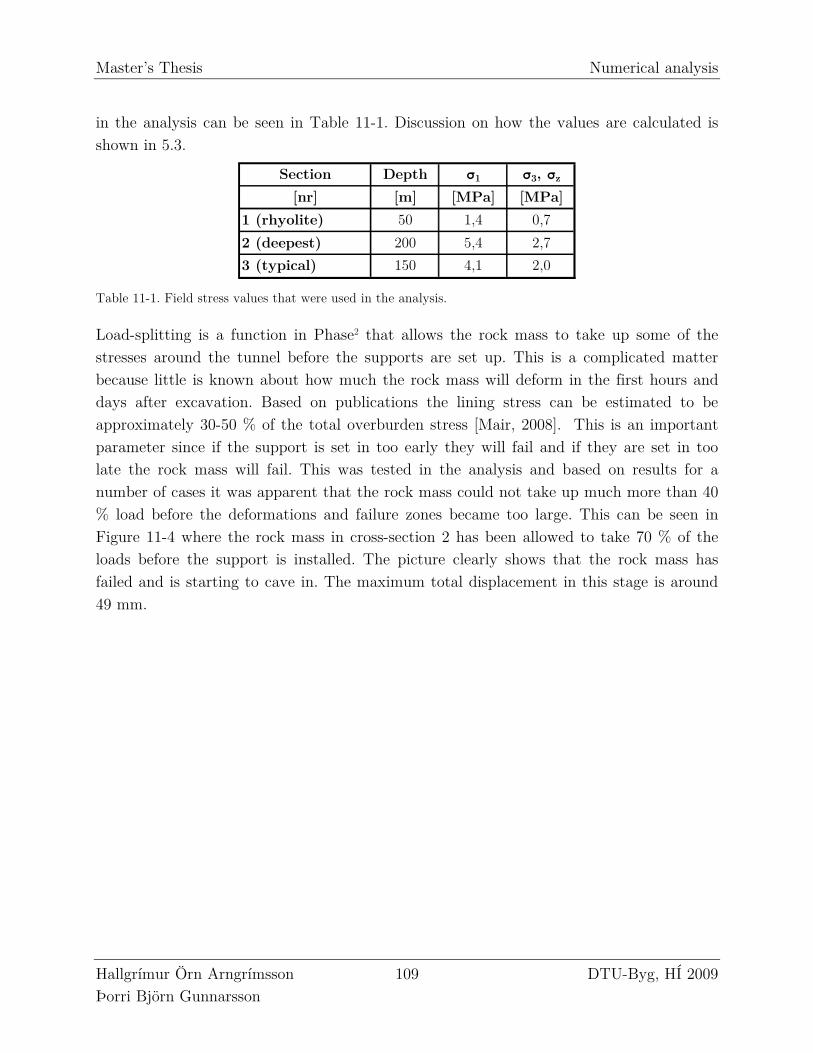
Master’s Thesis Numerical analysis
Hallgrímur Örn Arngrímsson 109 DTU-Byg, HÍ 2009 Þorri Björn Gunnarsson
in the analysis can be seen in Table 11-1. Discussion on how the values are calculated is shown in 5.3.
Section Depth σ1 σ3, σz[nr] [m] [MPa] [MPa]
1 (rhyolite) 50 1,4 0,7
2 (deepest) 200 5,4 2,7
3 (typical) 150 4,1 2,0
Table 11-1. Field stress values that were used in the analysis.
Load-splitting is a function in Phase2 that allows the rock mass to take up some of the stresses around the tunnel before the supports are set up. This is a complicated matter because little is known about how much the rock mass will deform in the first hours and days after excavation. Based on publications the lining stress can be estimated to be approximately 30-50 % of the total overburden stress [Mair, 2008]. This is an important parameter since if the support is set in too early they will fail and if they are set in too late the rock mass will fail. This was tested in the analysis and based on results for a number of cases it was apparent that the rock mass could not take up much more than 40 % load before the deformations and failure zones became too large. This can be seen in Figure 11-4 where the rock mass in cross-section 2 has been allowed to take 70 % of the loads before the support is installed. The picture clearly shows that the rock mass has failed and is starting to cave in. The maximum total displacement in this stage is around 49 mm.
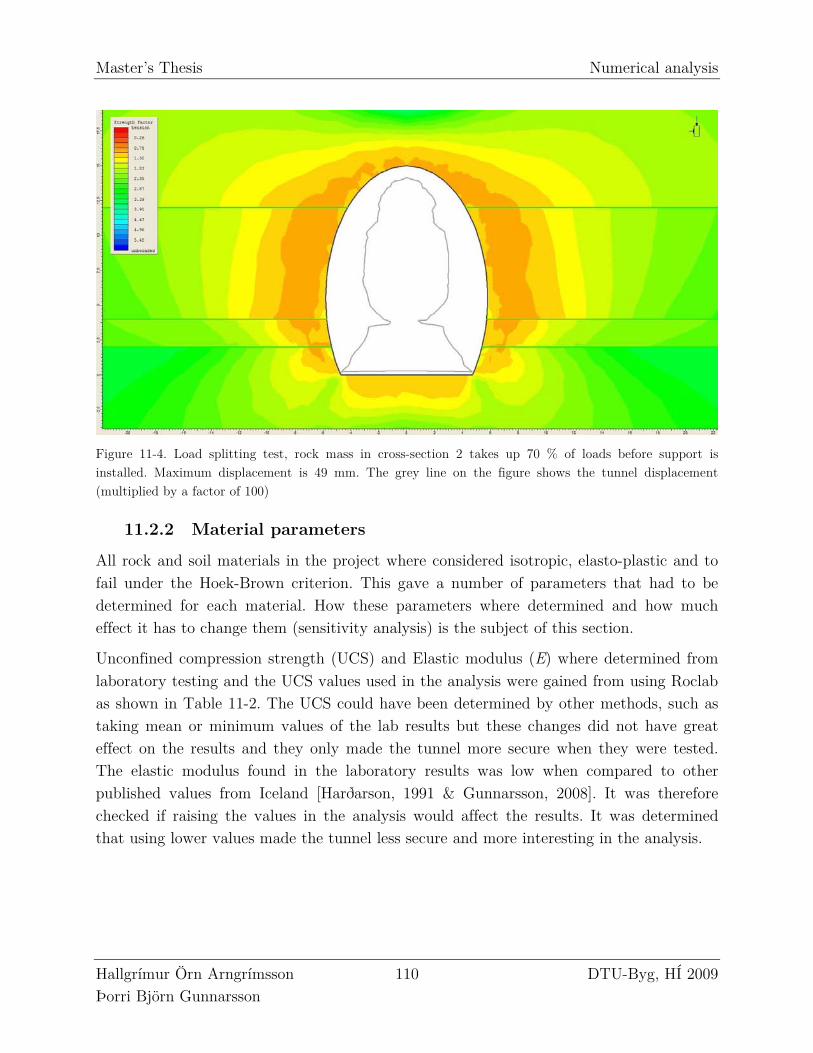
Master’s Thesis Numerical analysis
Hallgrímur Örn Arngrímsson 110 DTU-Byg, HÍ 2009 Þorri Björn Gunnarsson
Figure 11-4. Load splitting test, rock mass in cross-section 2 takes up 70 % of loads before support is installed. Maximum displacement is 49 mm. The grey line on the figure shows the tunnel displacement (multiplied by a factor of 100)
11.2.2 Material parameters
All rock and soil materials in the project where considered isotropic, elasto-plastic and to fail under the Hoek-Brown criterion. This gave a number of parameters that had to be determined for each material. How these parameters where determined and how much effect it has to change them (sensitivity analysis) is the subject of this section.
Unconfined compression strength (UCS) and Elastic modulus (E) where determined from laboratory testing and the UCS values used in the analysis were gained from using Roclab as shown in Table 11-2. The UCS could have been determined by other methods, such as taking mean or minimum values of the lab results but these changes did not have great effect on the results and they only made the tunnel more secure when they were tested. The elastic modulus found in the laboratory results was low when compared to other published values from Iceland [Harðarson, 1991 & Gunnarsson, 2008]. It was therefore checked if raising the values in the analysis would affect the results. It was determined that using lower values made the tunnel less secure and more interesting in the analysis.
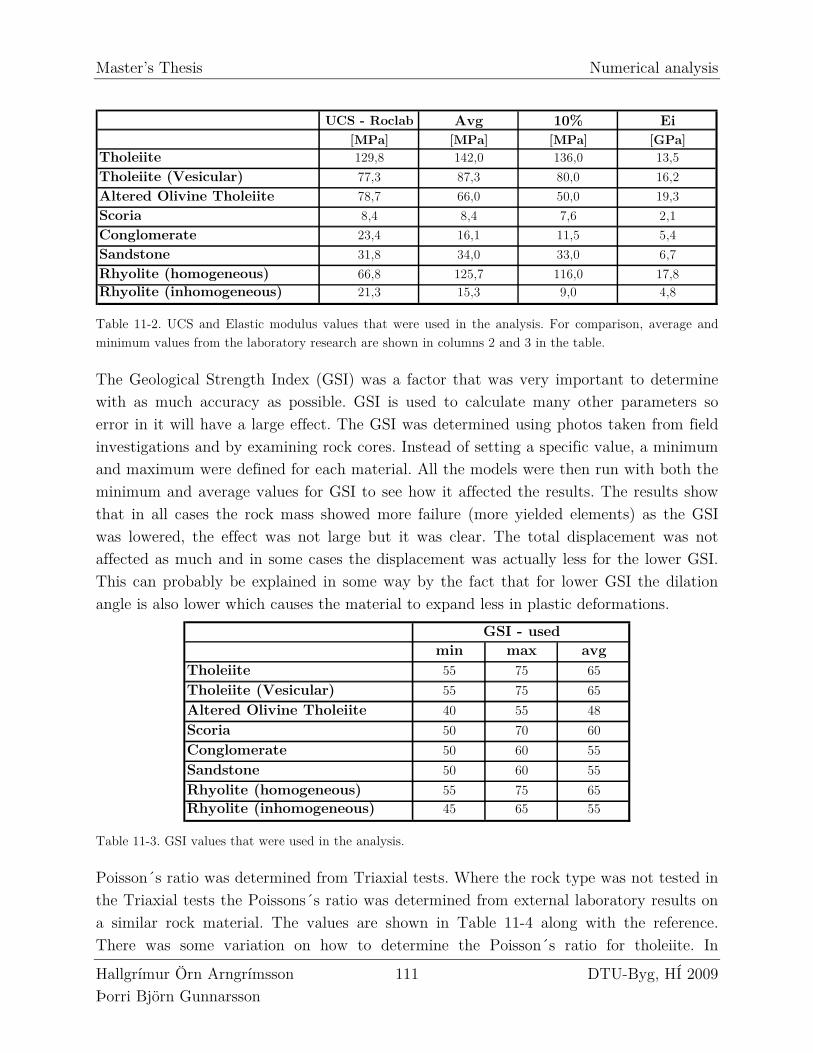
Master’s Thesis Numerical analysis
Hallgrímur Örn Arngrímsson 111 DTU-Byg, HÍ 2009 Þorri Björn Gunnarsson
UCS - Roclab Avg 10% Ei[MPa] [MPa] [MPa] [GPa]
Tholeiite 129,8 142,0 136,0 13,5
Tholeiite (Vesicular) 77,3 87,3 80,0 16,2
Altered Olivine Tholeiite 78,7 66,0 50,0 19,3
Scoria 8,4 8,4 7,6 2,1
Conglomerate 23,4 16,1 11,5 5,4
Sandstone 31,8 34,0 33,0 6,7
Rhyolite (homogeneous) 66,8 125,7 116,0 17,8Rhyolite (inhomogeneous) 21,3 15,3 9,0 4,8 Table 11-2. UCS and Elastic modulus values that were used in the analysis. For comparison, average and minimum values from the laboratory research are shown in columns 2 and 3 in the table.
The Geological Strength Index (GSI) was a factor that was very important to determine with as much accuracy as possible. GSI is used to calculate many other parameters so error in it will have a large effect. The GSI was determined using photos taken from field investigations and by examining rock cores. Instead of setting a specific value, a minimum and maximum were defined for each material. All the models were then run with both the minimum and average values for GSI to see how it affected the results. The results show that in all cases the rock mass showed more failure (more yielded elements) as the GSI was lowered, the effect was not large but it was clear. The total displacement was not affected as much and in some cases the displacement was actually less for the lower GSI. This can probably be explained in some way by the fact that for lower GSI the dilation angle is also lower which causes the material to expand less in plastic deformations.
min max avgTholeiite 55 75 65
Tholeiite (Vesicular) 55 75 65
Altered Olivine Tholeiite 40 55 48
Scoria 50 70 60
Conglomerate 50 60 55
Sandstone 50 60 55
Rhyolite (homogeneous) 55 75 65Rhyolite (inhomogeneous) 45 65 55
GSI - used
Table 11-3. GSI values that were used in the analysis.
Poisson´s ratio was determined from Triaxial tests. Where the rock type was not tested in the Triaxial tests the Poissons´s ratio was determined from external laboratory results on a similar rock material. The values are shown in Table 11-4 along with the reference. There was some variation on how to determine the Poisson´s ratio for tholeiite. In
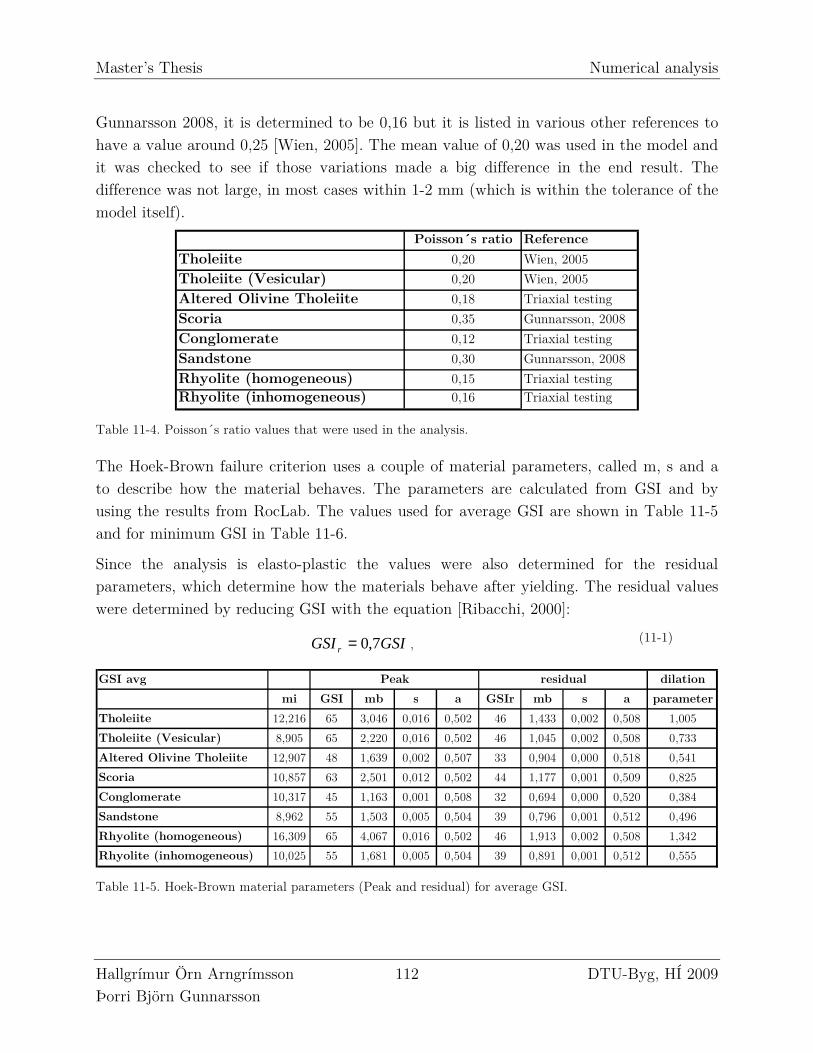
Master’s Thesis Numerical analysis
Hallgrímur Örn Arngrímsson 112 DTU-Byg, HÍ 2009 Þorri Björn Gunnarsson
Gunnarsson 2008, it is determined to be 0,16 but it is listed in various other references to have a value around 0,25 [Wien, 2005]. The mean value of 0,20 was used in the model and it was checked to see if those variations made a big difference in the end result. The difference was not large, in most cases within 1-2 mm (which is within the tolerance of the model itself).
Poisson´s ratio Reference
Tholeiite 0,20 Wien, 2005
Tholeiite (Vesicular) 0,20 Wien, 2005
Altered Olivine Tholeiite 0,18 Triaxial testing
Scoria 0,35 Gunnarsson, 2008
Conglomerate 0,12 Triaxial testing
Sandstone 0,30 Gunnarsson, 2008
Rhyolite (homogeneous) 0,15 Triaxial testingRhyolite (inhomogeneous) 0,16 Triaxial testing
Table 11-4. Poisson´s ratio values that were used in the analysis.
The Hoek-Brown failure criterion uses a couple of material parameters, called m, s and a to describe how the material behaves. The parameters are calculated from GSI and by using the results from RocLab. The values used for average GSI are shown in Table 11-5 and for minimum GSI in Table 11-6.
Since the analysis is elasto-plastic the values were also determined for the residual parameters, which determine how the materials behave after yielding. The residual values were determined by reducing GSI with the equation [Ribacchi, 2000]:
GSIGSI r 7,0= , (11-1)
GSI avg dilation
mi GSI mb s a GSIr mb s a parameter
Tholeiite 12,216 65 3,046 0,016 0,502 46 1,433 0,002 0,508 1,005
Tholeiite (Vesicular) 8,905 65 2,220 0,016 0,502 46 1,045 0,002 0,508 0,733
Altered Olivine Tholeiite 12,907 48 1,639 0,002 0,507 33 0,904 0,000 0,518 0,541
Scoria 10,857 63 2,501 0,012 0,502 44 1,177 0,001 0,509 0,825
Conglomerate 10,317 45 1,163 0,001 0,508 32 0,694 0,000 0,520 0,384
Sandstone 8,962 55 1,503 0,005 0,504 39 0,796 0,001 0,512 0,496
Rhyolite (homogeneous) 16,309 65 4,067 0,016 0,502 46 1,913 0,002 0,508 1,342
Rhyolite (inhomogeneous) 10,025 55 1,681 0,005 0,504 39 0,891 0,001 0,512 0,555
Peak residual
Table 11-5. Hoek-Brown material parameters (Peak and residual) for average GSI.
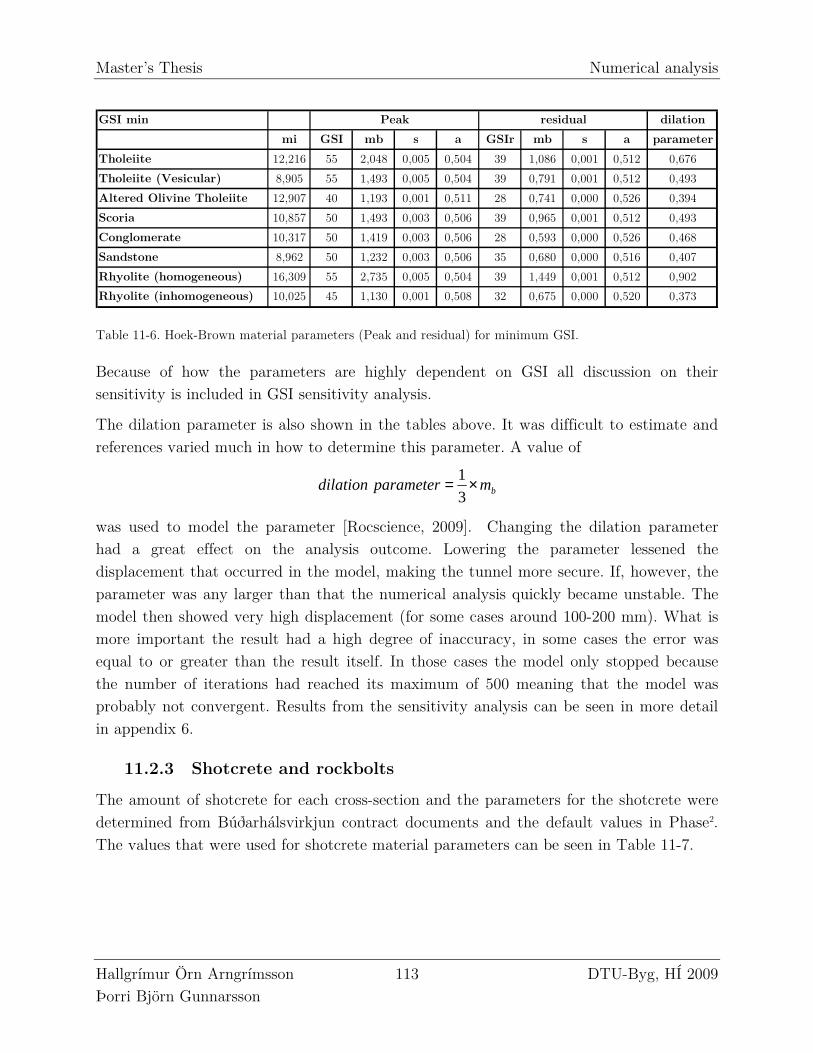
Master’s Thesis Numerical analysis
Hallgrímur Örn Arngrímsson 113 DTU-Byg, HÍ 2009 Þorri Björn Gunnarsson
GSI min dilation
mi GSI mb s a GSIr mb s a parameter
Tholeiite 12,216 55 2,048 0,005 0,504 39 1,086 0,001 0,512 0,676
Tholeiite (Vesicular) 8,905 55 1,493 0,005 0,504 39 0,791 0,001 0,512 0,493
Altered Olivine Tholeiite 12,907 40 1,193 0,001 0,511 28 0,741 0,000 0,526 0,394
Scoria 10,857 50 1,493 0,003 0,506 39 0,965 0,001 0,512 0,493
Conglomerate 10,317 50 1,419 0,003 0,506 28 0,593 0,000 0,526 0,468
Sandstone 8,962 50 1,232 0,003 0,506 35 0,680 0,000 0,516 0,407
Rhyolite (homogeneous) 16,309 55 2,735 0,005 0,504 39 1,449 0,001 0,512 0,902
Rhyolite (inhomogeneous) 10,025 45 1,130 0,001 0,508 32 0,675 0,000 0,520 0,373
Peak residual
Table 11-6. Hoek-Brown material parameters (Peak and residual) for minimum GSI.
Because of how the parameters are highly dependent on GSI all discussion on their sensitivity is included in GSI sensitivity analysis.
The dilation parameter is also shown in the tables above. It was difficult to estimate and references varied much in how to determine this parameter. A value of
bmparameterdilation ×=3
1
was used to model the parameter [Rocscience, 2009]. Changing the dilation parameter had a great effect on the analysis outcome. Lowering the parameter lessened the displacement that occurred in the model, making the tunnel more secure. If, however, the parameter was any larger than that the numerical analysis quickly became unstable. The model then showed very high displacement (for some cases around 100-200 mm). What is more important the result had a high degree of inaccuracy, in some cases the error was equal to or greater than the result itself. In those cases the model only stopped because the number of iterations had reached its maximum of 500 meaning that the model was probably not convergent. Results from the sensitivity analysis can be seen in more detail in appendix 6.
11.2.3 Shotcrete and rockbolts
The amount of shotcrete for each cross-section and the parameters for the shotcrete were determined from Búðarhálsvirkjun contract documents and the default values in Phase2. The values that were used for shotcrete material parameters can be seen in Table 11-7.
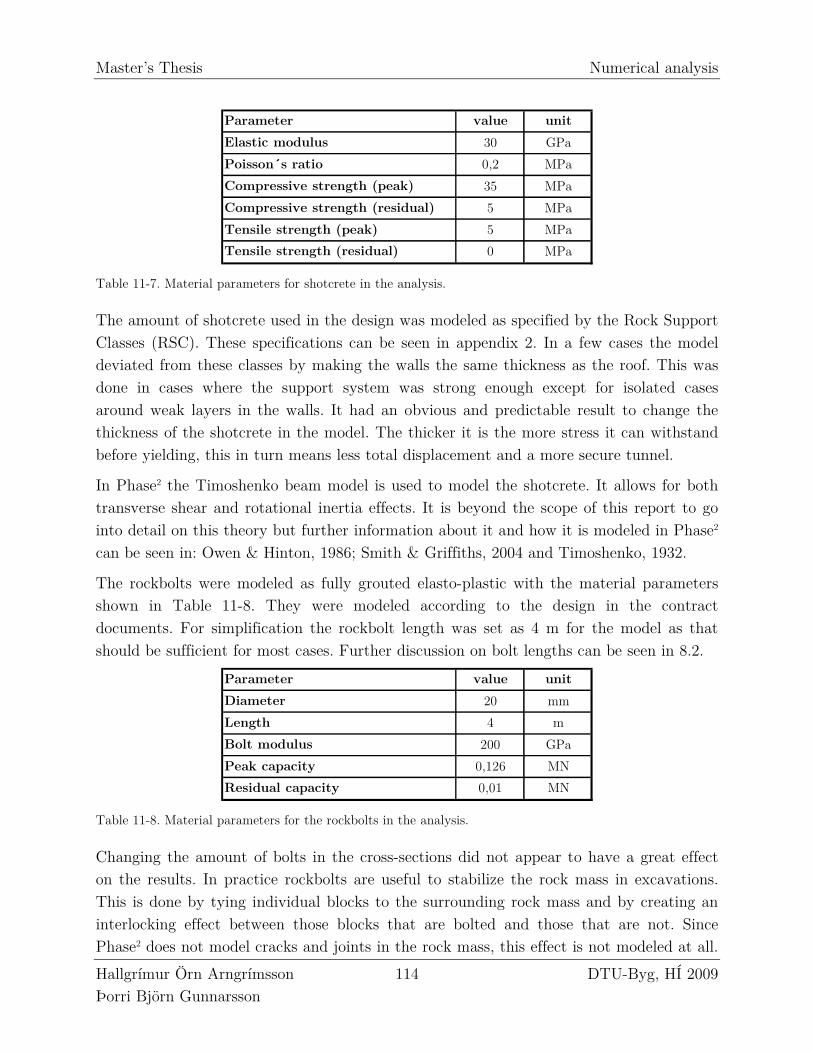
Master’s Thesis Numerical analysis
Hallgrímur Örn Arngrímsson 114 DTU-Byg, HÍ 2009 Þorri Björn Gunnarsson
Parameter value unit
Elastic modulus 30 GPa
Poisson´s ratio 0,2 MPa
Compressive strength (peak) 35 MPa
Compressive strength (residual) 5 MPa
Tensile strength (peak) 5 MPa
Tensile strength (residual) 0 MPa
Table 11-7. Material parameters for shotcrete in the analysis.
The amount of shotcrete used in the design was modeled as specified by the Rock Support Classes (RSC). These specifications can be seen in appendix 2. In a few cases the model deviated from these classes by making the walls the same thickness as the roof. This was done in cases where the support system was strong enough except for isolated cases around weak layers in the walls. It had an obvious and predictable result to change the thickness of the shotcrete in the model. The thicker it is the more stress it can withstand before yielding, this in turn means less total displacement and a more secure tunnel.
In Phase2 the Timoshenko beam model is used to model the shotcrete. It allows for both transverse shear and rotational inertia effects. It is beyond the scope of this report to go into detail on this theory but further information about it and how it is modeled in Phase2 can be seen in: Owen & Hinton, 1986; Smith & Griffiths, 2004 and Timoshenko, 1932.
The rockbolts were modeled as fully grouted elasto-plastic with the material parameters shown in Table 11-8. They were modeled according to the design in the contract documents. For simplification the rockbolt length was set as 4 m for the model as that should be sufficient for most cases. Further discussion on bolt lengths can be seen in 8.2.
Parameter value unit
Diameter 20 mm
Length 4 m
Bolt modulus 200 GPa
Peak capacity 0,126 MN
Residual capacity 0,01 MN
Table 11-8. Material parameters for the rockbolts in the analysis.
Changing the amount of bolts in the cross-sections did not appear to have a great effect on the results. In practice rockbolts are useful to stabilize the rock mass in excavations. This is done by tying individual blocks to the surrounding rock mass and by creating an interlocking effect between those blocks that are bolted and those that are not. Since Phase2 does not model cracks and joints in the rock mass, this effect is not modeled at all.
Master’s Thesis Numerical analysis
Hallgrímur Örn Arngrímsson 115 DTU-Byg, HÍ 2009 Þorri Björn Gunnarsson
It is therefore possible that Phase2 does not fully show the effectiveness of rockbolts in its results.
The fully bonded (grouted) bolt model in Phase2 works as follows: The bolts are divided into elements, the same as the materials in the model. The elements do not influence each other directly, only through their effect on the rock mass. Failure of the rock bolt is in tension, when the axial force on the bolt element exceeds the axial capacity. The interface between rock mass and bolt is not accounted for, the bolt is considered fully bonded to the rock and the interface does not fail. After failure of the rock bolt it is still considered to have residual capacity. The rockbolt material parameters are shown in Table 11-8
11.3 RESULTS
Three cross-sections where modeled and it was checked if the rock support classes recommended by the design in the contract documents would support the tunnel. These cross-section have been discussed in detail in section 11.1. All the models were modeled with both the base (average values) GSI for the materials as well as the minimum and both results are shown for each cross-section. The results of the analysis are discussed in this section along with figures that show these results.
There are mostly two types of figures shown, one which shows the strength factor in the rock mass and one which shows the total displacements. Strength factor is the maximum compression stress of the rock mass divided by the observed stress. This means that when the number is close to 1 the rock is plasticizing, orange in the figures. The total displacement is defined by
22 YXTD += ,
where X is the displacement in the x direction and Y the displacement in the y direction. It is shown on the figures by using colors ranging from blue (least displacement) to red (maximum displacement). The figures also show those elements that have yielded and are plasticizing. The yielded elements in the rock mass are marked with x (shear failure) and o (tension failure). Yielded support elements (bolts and shotcrete) are colored red. The total number of yielded elements is dependent on the total number of elements in the model and it is therefore not useful to compare one cross-section to another. It can be useful to compare different parameters within the same cross-section to see some of the effect it has when they are changed. A grey line inside the excavation shows how the tunnel deforms under maximum load and with the support system in place. In all the figures it has been exaggerated 100 times to better observe the displacements.
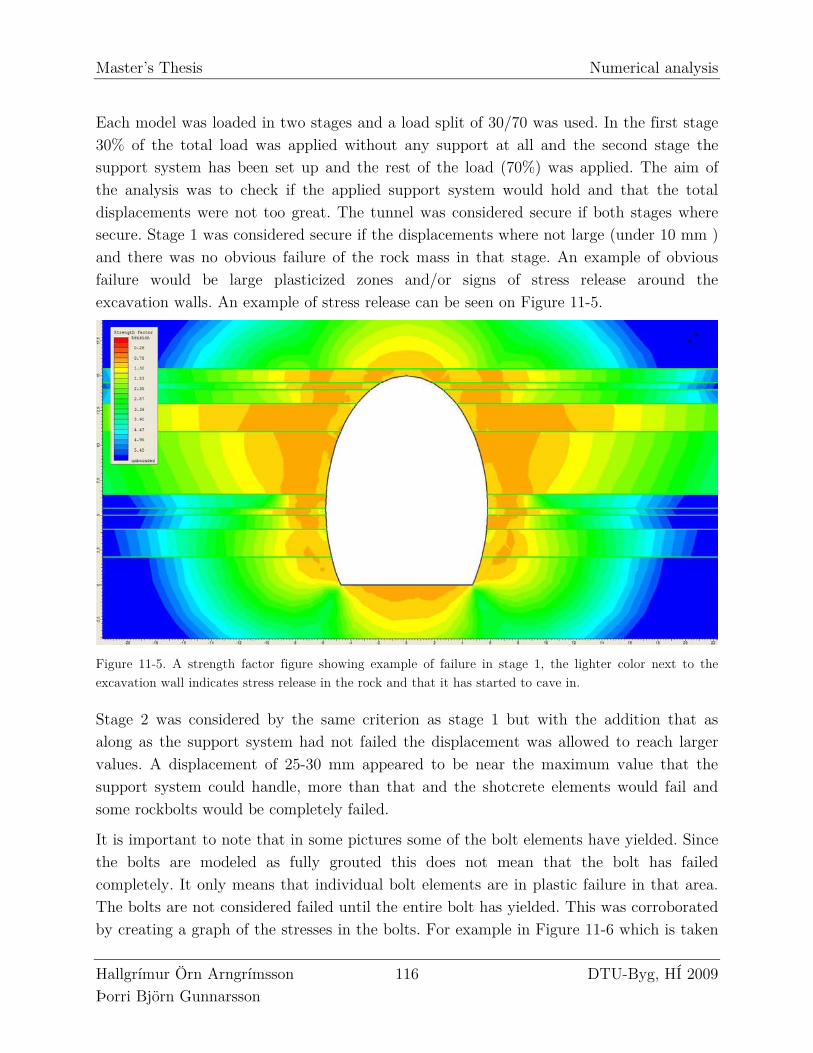
Master’s Thesis Numerical analysis
Hallgrímur Örn Arngrímsson 116 DTU-Byg, HÍ 2009 Þorri Björn Gunnarsson
Each model was loaded in two stages and a load split of 30/70 was used. In the first stage 30% of the total load was applied without any support at all and the second stage the support system has been set up and the rest of the load (70%) was applied. The aim of the analysis was to check if the applied support system would hold and that the total displacements were not too great. The tunnel was considered secure if both stages where secure. Stage 1 was considered secure if the displacements where not large (under 10 mm ) and there was no obvious failure of the rock mass in that stage. An example of obvious failure would be large plasticized zones and/or signs of stress release around the excavation walls. An example of stress release can be seen on Figure 11-5.
Figure 11-5. A strength factor figure showing example of failure in stage 1, the lighter color next to the excavation wall indicates stress release in the rock and that it has started to cave in.
Stage 2 was considered by the same criterion as stage 1 but with the addition that as along as the support system had not failed the displacement was allowed to reach larger values. A displacement of 25-30 mm appeared to be near the maximum value that the support system could handle, more than that and the shotcrete elements would fail and some rockbolts would be completely failed.
It is important to note that in some pictures some of the bolt elements have yielded. Since the bolts are modeled as fully grouted this does not mean that the bolt has failed completely. It only means that individual bolt elements are in plastic failure in that area. The bolts are not considered failed until the entire bolt has yielded. This was corroborated by creating a graph of the stresses in the bolts. For example in Figure 11-6 which is taken
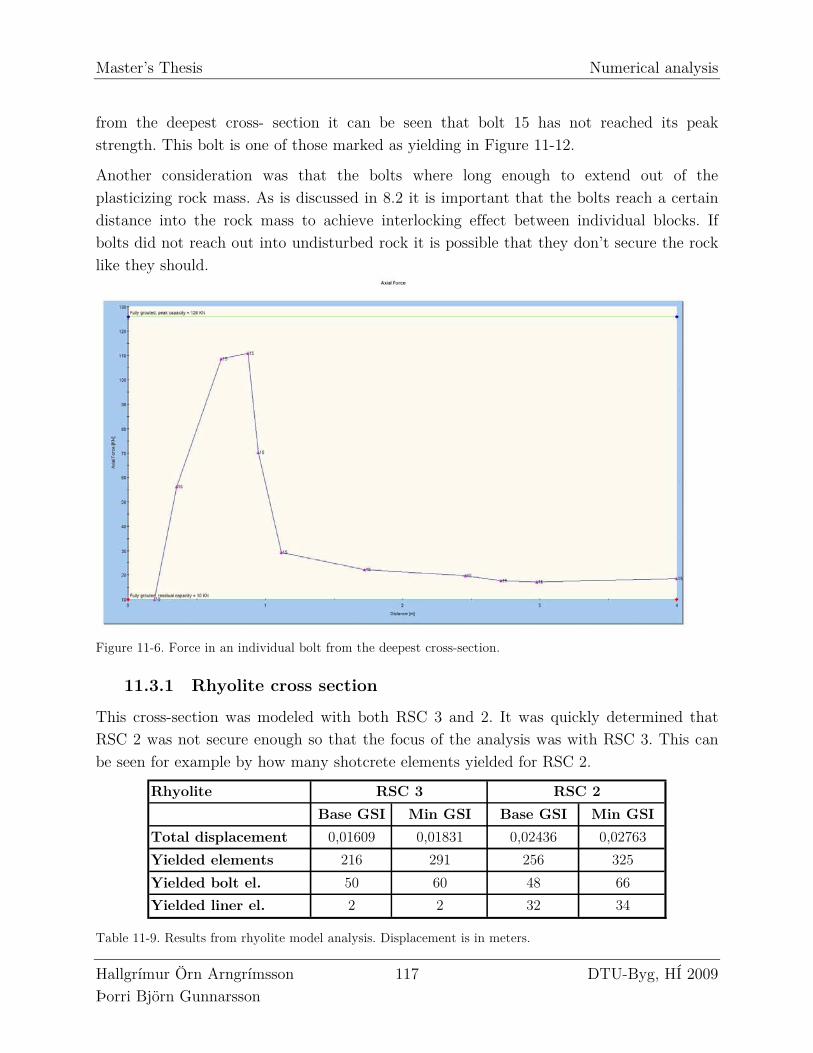
Master’s Thesis Numerical analysis
Hallgrímur Örn Arngrímsson 117 DTU-Byg, HÍ 2009 Þorri Björn Gunnarsson
from the deepest cross- section it can be seen that bolt 15 has not reached its peak strength. This bolt is one of those marked as yielding in Figure 11-12.
Another consideration was that the bolts where long enough to extend out of the plasticizing rock mass. As is discussed in 8.2 it is important that the bolts reach a certain distance into the rock mass to achieve interlocking effect between individual blocks. If bolts did not reach out into undisturbed rock it is possible that they don’t secure the rock like they should.
Figure 11-6. Force in an individual bolt from the deepest cross-section.
11.3.1 Rhyolite cross section
This cross-section was modeled with both RSC 3 and 2. It was quickly determined that RSC 2 was not secure enough so that the focus of the analysis was with RSC 3. This can be seen for example by how many shotcrete elements yielded for RSC 2.
Rhyolite
Base GSI Min GSI Base GSI Min GSI
Total displacement 0,01609 0,01831 0,02436 0,02763
Yielded elements 216 291 256 325
Yielded bolt el. 50 60 48 66
Yielded liner el. 2 2 32 34
RSC 3 RSC 2
Table 11-9. Results from rhyolite model analysis. Displacement is in meters.

Master’s Thesis Numerical analysis
Hallgrímur Örn Arngrímsson 118 DTU-Byg, HÍ 2009 Þorri Björn Gunnarsson
It can be seen from these results that RSC 3 should be adequate for this cross section. There are only two yielded shotcrete elements and none of the bolts have failed completely. This is further supported by the fact that the total displacement is less than 20 mm for both GSI cases. There is some concern in the min GSI case that the plastic zone around the tunnel almost reaches the bolt ends. This could have the effect that the bolts do not secure the tunnel like they should. Perhaps the bolts should be made longer so that they reach clearly outside of the plastic area (6 m in this case).
According to the Q-system this tunnel profile is rated Q = 0,1 -1 which means that it should be in RSC 3 and this compares quite well to the result from the analysis.
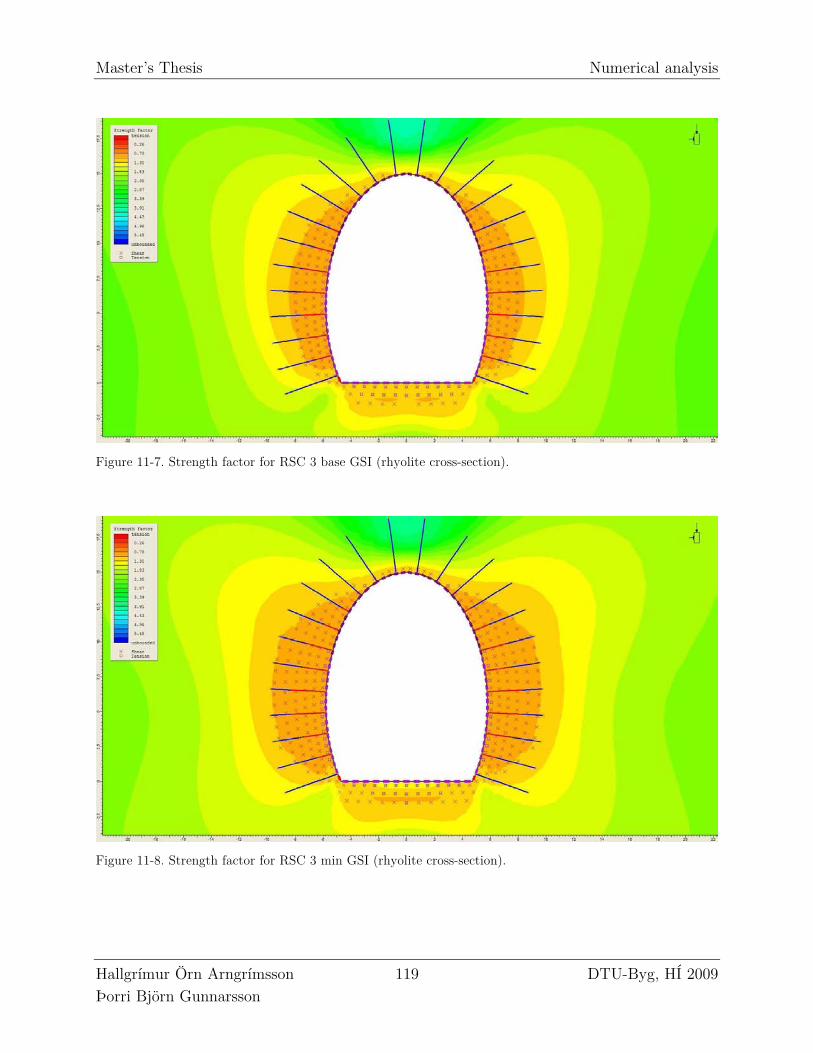
Master’s Thesis Numerical analysis
Hallgrímur Örn Arngrímsson 119 DTU-Byg, HÍ 2009 Þorri Björn Gunnarsson
Figure 11-7. Strength factor for RSC 3 base GSI (rhyolite cross-section).
Figure 11-8. Strength factor for RSC 3 min GSI (rhyolite cross-section).
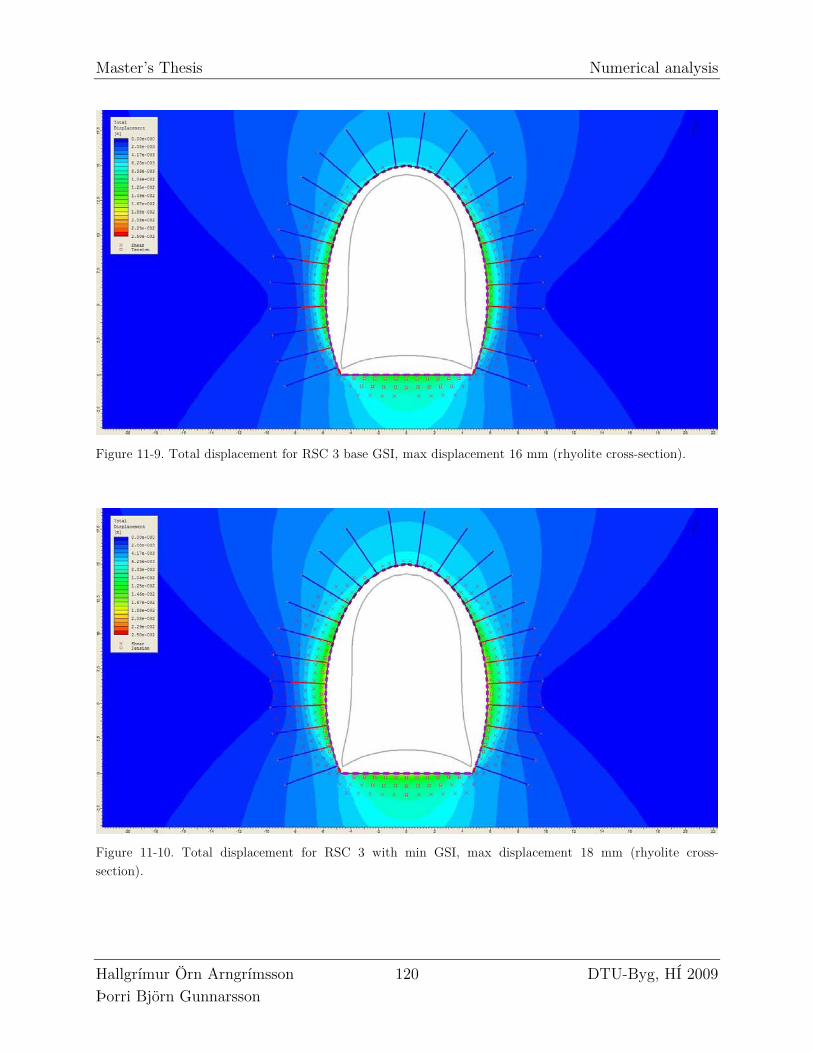
Master’s Thesis Numerical analysis
Hallgrímur Örn Arngrímsson 120 DTU-Byg, HÍ 2009 Þorri Björn Gunnarsson
Figure 11-9. Total displacement for RSC 3 base GSI, max displacement 16 mm (rhyolite cross-section).
Figure 11-10. Total displacement for RSC 3 with min GSI, max displacement 18 mm (rhyolite cross-section).
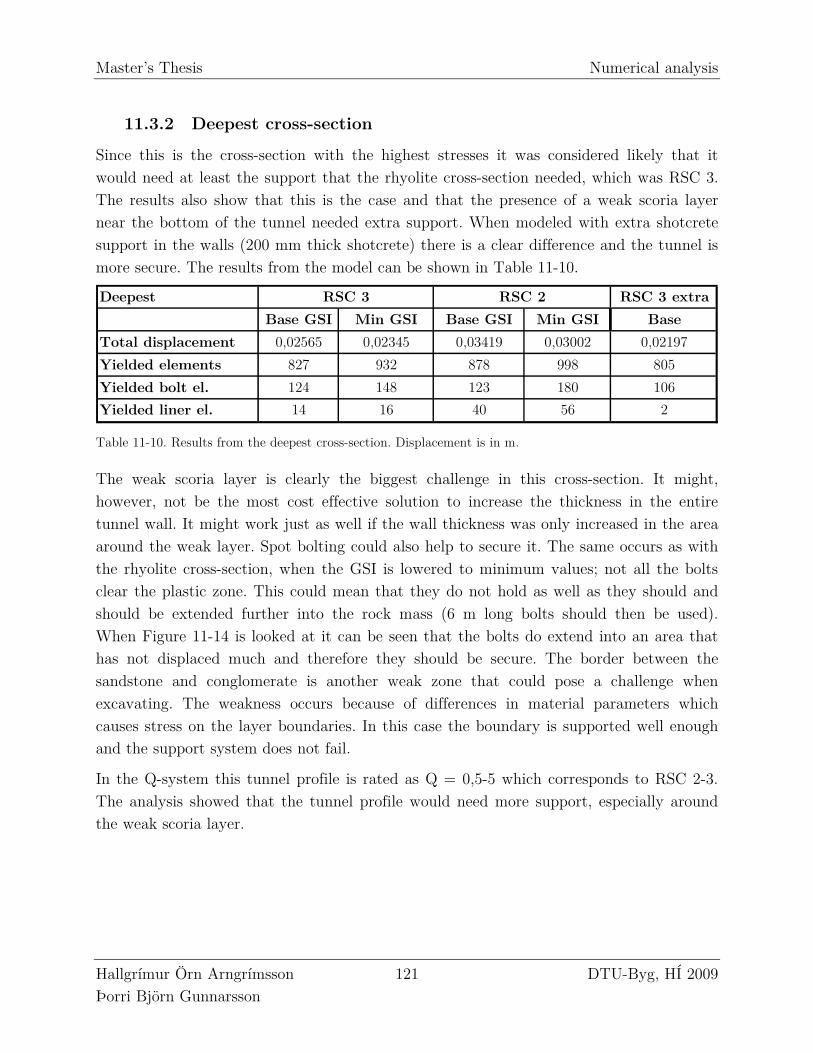
Master’s Thesis Numerical analysis
Hallgrímur Örn Arngrímsson 121 DTU-Byg, HÍ 2009 Þorri Björn Gunnarsson
11.3.2 Deepest cross-section
Since this is the cross-section with the highest stresses it was considered likely that it would need at least the support that the rhyolite cross-section needed, which was RSC 3. The results also show that this is the case and that the presence of a weak scoria layer near the bottom of the tunnel needed extra support. When modeled with extra shotcrete support in the walls (200 mm thick shotcrete) there is a clear difference and the tunnel is more secure. The results from the model can be shown in Table 11-10.
Deepest RSC 3 extra
Base GSI Min GSI Base GSI Min GSI Base
Total displacement 0,02565 0,02345 0,03419 0,03002 0,02197
Yielded elements 827 932 878 998 805
Yielded bolt el. 124 148 123 180 106
Yielded liner el. 14 16 40 56 2
RSC 3 RSC 2
Table 11-10. Results from the deepest cross-section. Displacement is in m.
The weak scoria layer is clearly the biggest challenge in this cross-section. It might, however, not be the most cost effective solution to increase the thickness in the entire tunnel wall. It might work just as well if the wall thickness was only increased in the area around the weak layer. Spot bolting could also help to secure it. The same occurs as with the rhyolite cross-section, when the GSI is lowered to minimum values; not all the bolts clear the plastic zone. This could mean that they do not hold as well as they should and should be extended further into the rock mass (6 m long bolts should then be used). When Figure 11-14 is looked at it can be seen that the bolts do extend into an area that has not displaced much and therefore they should be secure. The border between the sandstone and conglomerate is another weak zone that could pose a challenge when excavating. The weakness occurs because of differences in material parameters which causes stress on the layer boundaries. In this case the boundary is supported well enough and the support system does not fail.
In the Q-system this tunnel profile is rated as Q = 0,5-5 which corresponds to RSC 2-3. The analysis showed that the tunnel profile would need more support, especially around the weak scoria layer.
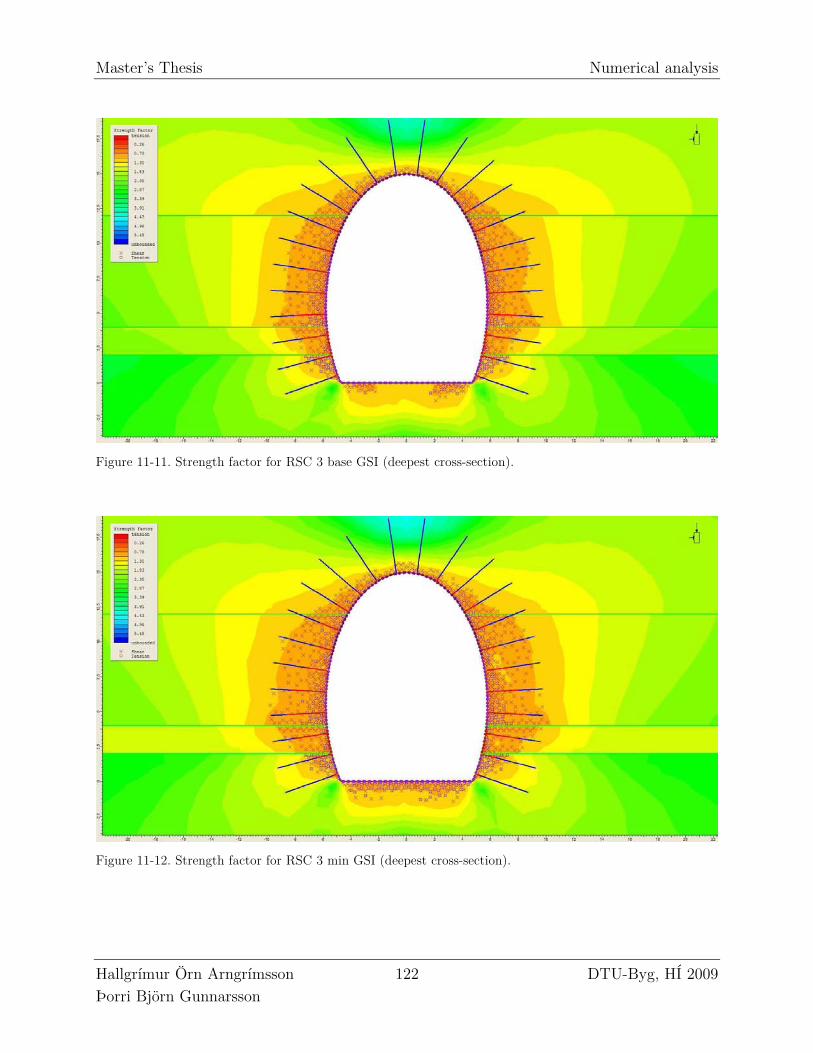
Master’s Thesis Numerical analysis
Hallgrímur Örn Arngrímsson 122 DTU-Byg, HÍ 2009 Þorri Björn Gunnarsson
Figure 11-11. Strength factor for RSC 3 base GSI (deepest cross-section).
Figure 11-12. Strength factor for RSC 3 min GSI (deepest cross-section).
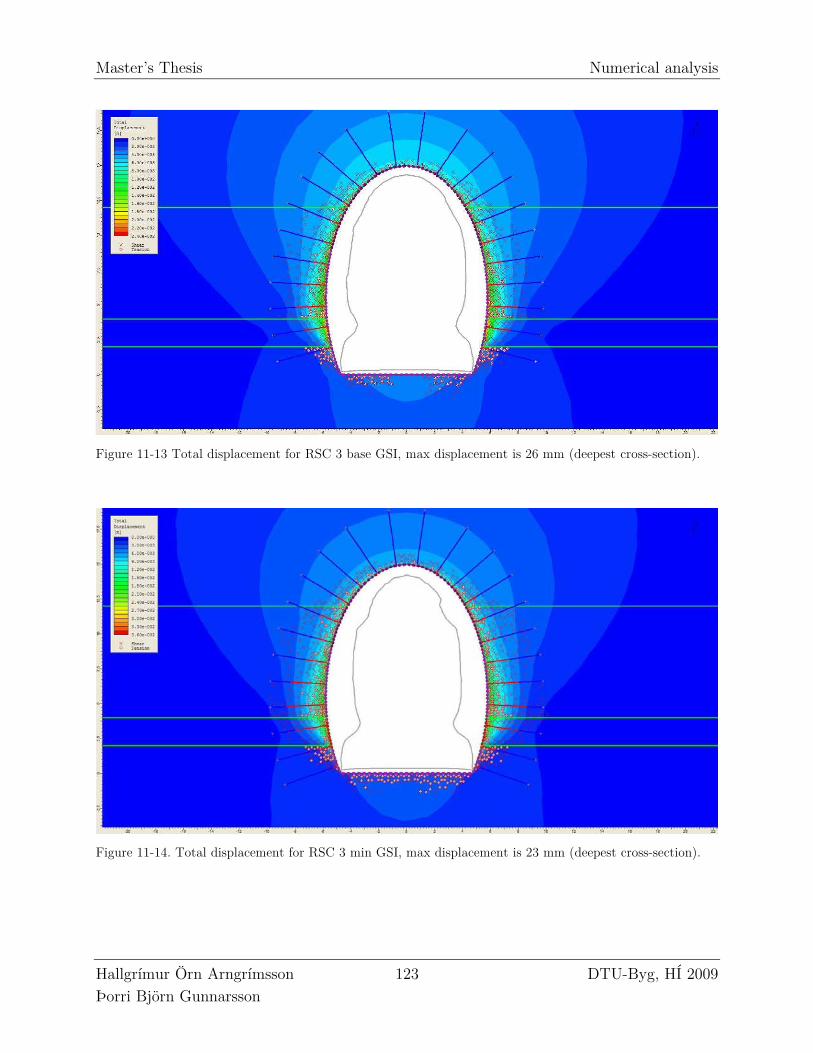
Master’s Thesis Numerical analysis
Hallgrímur Örn Arngrímsson 123 DTU-Byg, HÍ 2009 Þorri Björn Gunnarsson
Figure 11-13 Total displacement for RSC 3 base GSI, max displacement is 26 mm (deepest cross-section).
Figure 11-14. Total displacement for RSC 3 min GSI, max displacement is 23 mm (deepest cross-section).
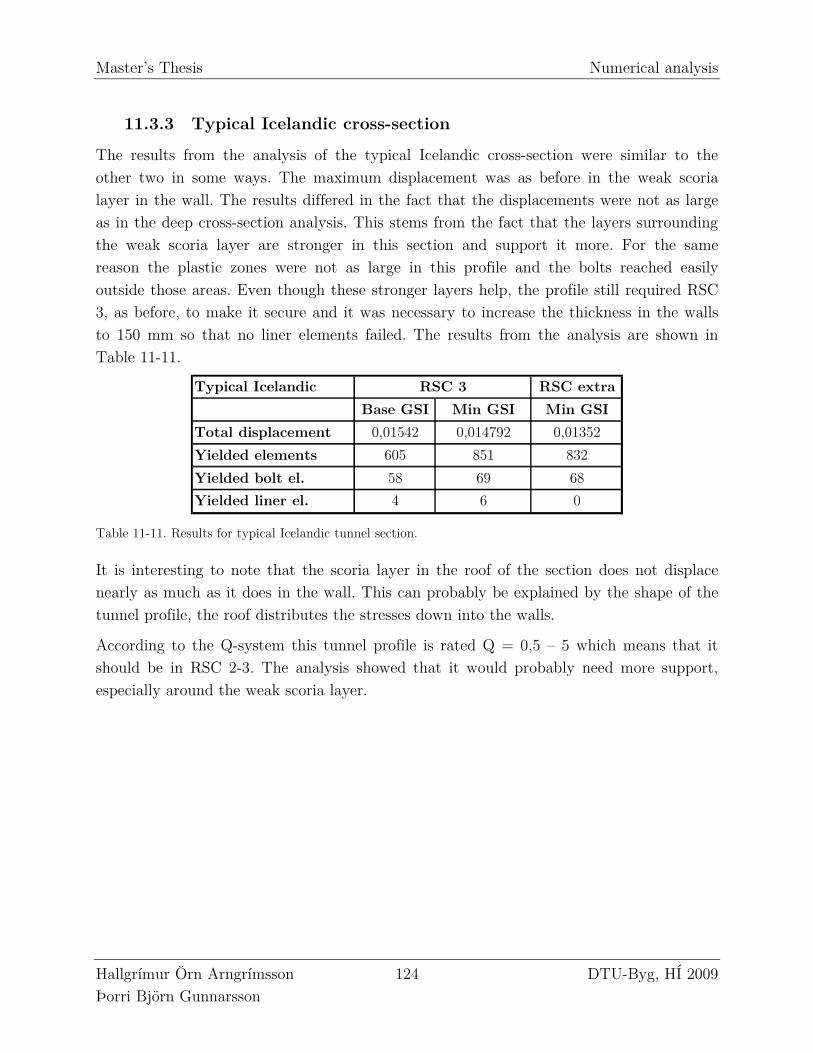
Master’s Thesis Numerical analysis
Hallgrímur Örn Arngrímsson 124 DTU-Byg, HÍ 2009 Þorri Björn Gunnarsson
11.3.3 Typical Icelandic cross-section
The results from the analysis of the typical Icelandic cross-section were similar to the other two in some ways. The maximum displacement was as before in the weak scoria layer in the wall. The results differed in the fact that the displacements were not as large as in the deep cross-section analysis. This stems from the fact that the layers surrounding the weak scoria layer are stronger in this section and support it more. For the same reason the plastic zones were not as large in this profile and the bolts reached easily outside those areas. Even though these stronger layers help, the profile still required RSC 3, as before, to make it secure and it was necessary to increase the thickness in the walls to 150 mm so that no liner elements failed. The results from the analysis are shown in Table 11-11.
Typical Icelandic RSC extra
Base GSI Min GSI Min GSI
Total displacement 0,01542 0,014792 0,01352
Yielded elements 605 851 832
Yielded bolt el. 58 69 68
Yielded liner el. 4 6 0
RSC 3
Table 11-11. Results for typical Icelandic tunnel section.
It is interesting to note that the scoria layer in the roof of the section does not displace nearly as much as it does in the wall. This can probably be explained by the shape of the tunnel profile, the roof distributes the stresses down into the walls.
According to the Q-system this tunnel profile is rated Q = 0,5 – 5 which means that it should be in RSC 2-3. The analysis showed that it would probably need more support, especially around the weak scoria layer.
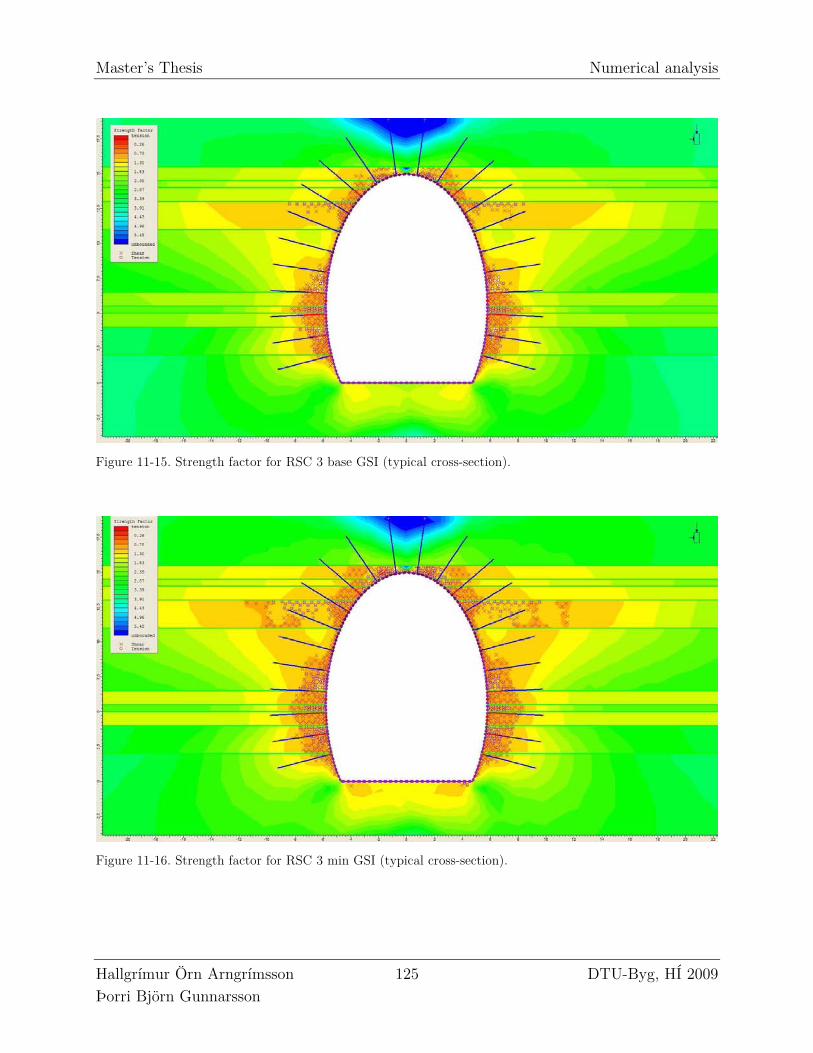
Master’s Thesis Numerical analysis
Hallgrímur Örn Arngrímsson 125 DTU-Byg, HÍ 2009 Þorri Björn Gunnarsson
Figure 11-15. Strength factor for RSC 3 base GSI (typical cross-section).
Figure 11-16. Strength factor for RSC 3 min GSI (typical cross-section).
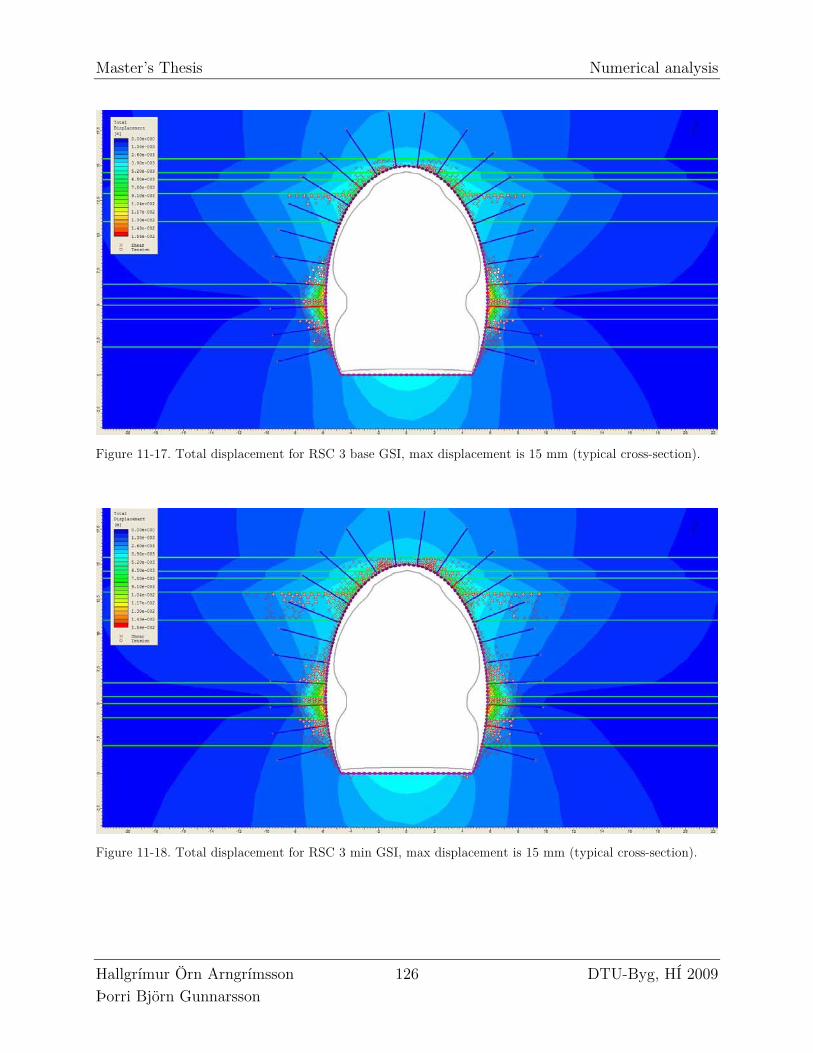
Master’s Thesis Numerical analysis
Hallgrímur Örn Arngrímsson 126 DTU-Byg, HÍ 2009 Þorri Björn Gunnarsson
Figure 11-17. Total displacement for RSC 3 base GSI, max displacement is 15 mm (typical cross-section).
Figure 11-18. Total displacement for RSC 3 min GSI, max displacement is 15 mm (typical cross-section).
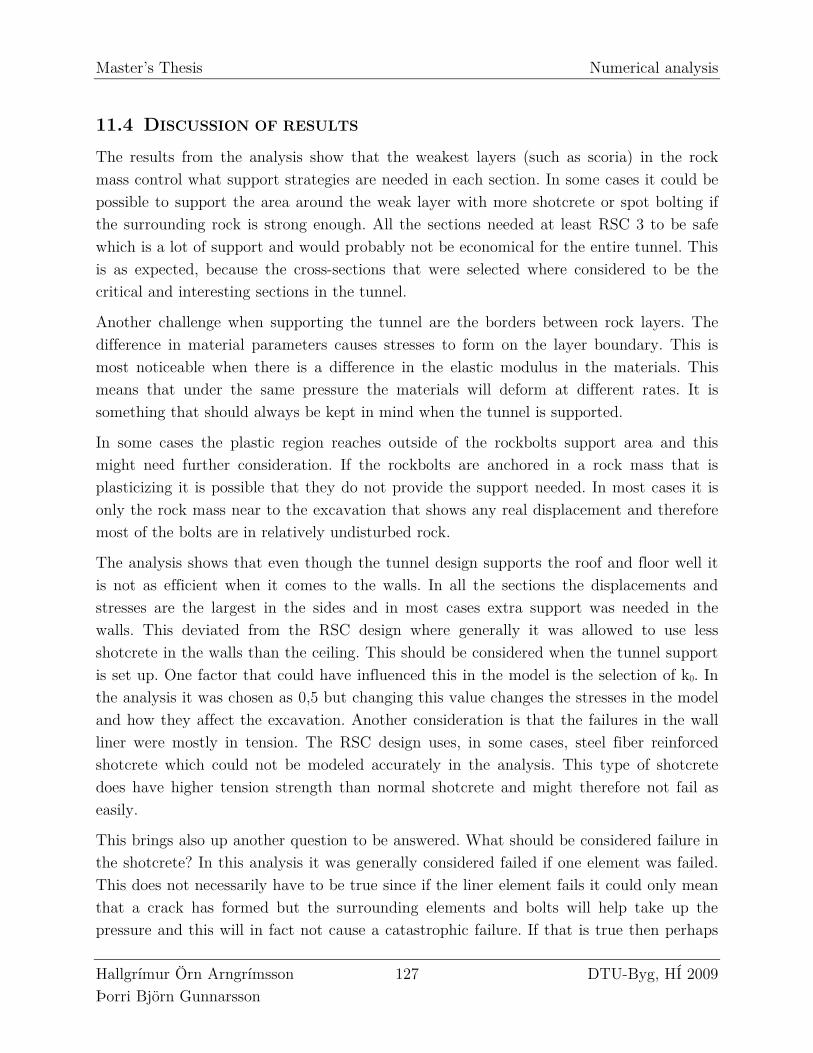
Master’s Thesis Numerical analysis
Hallgrímur Örn Arngrímsson 127 DTU-Byg, HÍ 2009 Þorri Björn Gunnarsson
11.4 DISCUSSION OF RESULTS
The results from the analysis show that the weakest layers (such as scoria) in the rock mass control what support strategies are needed in each section. In some cases it could be possible to support the area around the weak layer with more shotcrete or spot bolting if the surrounding rock is strong enough. All the sections needed at least RSC 3 to be safe which is a lot of support and would probably not be economical for the entire tunnel. This is as expected, because the cross-sections that were selected where considered to be the critical and interesting sections in the tunnel.
Another challenge when supporting the tunnel are the borders between rock layers. The difference in material parameters causes stresses to form on the layer boundary. This is most noticeable when there is a difference in the elastic modulus in the materials. This means that under the same pressure the materials will deform at different rates. It is something that should always be kept in mind when the tunnel is supported.
In some cases the plastic region reaches outside of the rockbolts support area and this might need further consideration. If the rockbolts are anchored in a rock mass that is plasticizing it is possible that they do not provide the support needed. In most cases it is only the rock mass near to the excavation that shows any real displacement and therefore most of the bolts are in relatively undisturbed rock.
The analysis shows that even though the tunnel design supports the roof and floor well it is not as efficient when it comes to the walls. In all the sections the displacements and stresses are the largest in the sides and in most cases extra support was needed in the walls. This deviated from the RSC design where generally it was allowed to use less shotcrete in the walls than the ceiling. This should be considered when the tunnel support is set up. One factor that could have influenced this in the model is the selection of k0. In the analysis it was chosen as 0,5 but changing this value changes the stresses in the model and how they affect the excavation. Another consideration is that the failures in the wall liner were mostly in tension. The RSC design uses, in some cases, steel fiber reinforced shotcrete which could not be modeled accurately in the analysis. This type of shotcrete does have higher tension strength than normal shotcrete and might therefore not fail as easily.
This brings also up another question to be answered. What should be considered failure in the shotcrete? In this analysis it was generally considered failed if one element was failed. This does not necessarily have to be true since if the liner element fails it could only mean that a crack has formed but the surrounding elements and bolts will help take up the pressure and this will in fact not cause a catastrophic failure. If that is true then perhaps
Master’s Thesis Numerical analysis
Hallgrímur Örn Arngrímsson 128 DTU-Byg, HÍ 2009 Þorri Björn Gunnarsson
it would be more interesting to look in more detail on how much maximum displacement should be allowed. Not much is known about what is the maximum allowable displacement in tunnels. In this analysis it seemed reasonable to allow displacements less than 10 mm in stage 1 and less than 25-30 mm in stage 2 as long as the support system was not failed. Interestingly this seemed to be around the value that the liner started to fail anyway, which supported the decision somewhat.
Lower GSI values caused larger plastic zones and more failed elements. There was a small difference between base and min GSI, meaning that as long as the GSI for the rock has been reasonably selected it should not affect the analysis too much.
The displacement results did not change consistently in the analysis. In some cases it became larger when GSI min was used; in other cases it became smaller. In general the difference was not large (within the tolerance of the model itself, 1 mm). Displacement was affected most by the selection of the dilation parameter. It is dependent on the mb parameter in the Hoek-Brown failure criterion and so when the GSI is lowered the mb parameter gets smaller and the dilation parameter becomes smaller as well. Displacement because of dilation is therefore reduced in the GSI min case. The dilation parameter is difficult to define properly for rock materials and its effect is therefore hard to evaluate exactly.
The numerical analysis results where more conservative than the results from the Q-system analysis. This is because the weaker layers, scoria for instance, affected the model results a great deal. In practice in some cases lighter support classes could possibly be used with added support only in the weak areas.
When everything is taken into account the numerical analysis results are in accordance with earlier work and what were considered likely estimates before the work started. The analysis highlighted some areas that will be challenging in the excavation process and showed possible solutions.
Master’s Thesis Conclusion
Hallgrímur Örn Arngrímsson 129 DTU-Byg, HÍ 2009 Þorri Björn Gunnarsson
12 CONCLUSION
Geological investigations done for Búðarháls headrace tunnel showed diverse geological formations. The tunnel cross-section will be varied and many different challenges will need to be conquered to excavate the tunnel safely. Samples were gathered from boreholes and they tested using various methods to determine properties for the rock in the area. The laboratory testing phase went well and important results were gathered, especially on rhyolite and altered olivine tholeiite. These materials have not been tested much in Iceland and the results gave information on their properties. The test results had in general good correlation and only one test sample was lost and gave no results. A further three samples were not used in the modeling because their results were not in correlation with others. The test results were similar to other results from Iceland except for the E-modulus and Poisson´s ratio (ν). E-modulus determined from laboratory results was lower compared to similar results from Iceland. It is possible that the rock material from the area has a low E-modulus but more probable is an error in the strain measurement device. This error could be because the device was either faulty or not calibrated correctly. The Poisson´s ratio was also low which could be caused by the same reason or the influence of the confinement pressure in the triaxial cell. It was difficult to evaluate the results from the Triaxial tests because few samples were tested. If done correctly they should simulate the in-situ stresses more accurately and they were therefore given more weight when parameters were estimated for the computer model.
The results from the laboratory testing were estimated and appropriate material parameters determined for each material. To assist in this process a computer program called RocLab was used. The results were inserted into RocLab and it used to generate material parameters for intact rock (σci and mi) using the Hoek-Brown failure criterion. The Geological Strength Index (GSI) was then used to generate simulated properties for the rock mass parameters (mb, s and a). GSI influences the other parameters and it is therefore important to determine it properly. Because of this a range of values for GSI was determined for each of the rock materials and the analysis was run with them all. The materials where all modeled as elasto-plastic which should give more accurate results for deformation of the rock mass than just using elastic analysis. Residual values for the material parameters also needed to be modeled and a dilation angle determined. This was difficult because much is unknown about how rock responds after peak stress. The dilation angle was especially difficult to determine and since it affected the tunnel displacement a great deal some effort was spent in testing this value during sensitivity analysis.
Master’s Thesis Conclusion
Hallgrímur Örn Arngrímsson 130 DTU-Byg, HÍ 2009 Þorri Björn Gunnarsson
A finite element numerical analysis program called Phase2 was used to create a material model from the determined parameters. Three cross-sections were created in the program, selected because they were considered critical in the tunnel excavation. The cross-sections were based mostly on borehole profiles and support systems were modeled after RSC design in the contract documents. This design is for the most part based on the Q-system which has been used extensively in Iceland. The cross-sections needed similar amounts of support even if evaluated from these two different systems (GSI and Q). From the analysis it was determined that GSI was more flexible but the Q-system easier to use in the field. Since it was relatively easy to change the parameters and support strategies in the computer model it could be calculated what worked best for given circumstances. The Q-system produced single solutions that give good preliminary results but need to be refined when the tunnel is excavated.
The general result was that all the cross-sections could be supported well enough and that the tunnel can be built as it has been designed. The inhomogeneous rhyolite is strong enough when supported with RSC 3 and it should be possible to excavate the tunnel successfully from it. In the other two cross-sections the greatest challenges were present in weak layers, such as scoria. Special care needs to be taken when the weak layer is supported since it will need more support than the surrounding rock mass. In all the cross-sections the greatest displacements occurred in the walls. In some cases more support was needed in the walls than was suggested by the rock support classes in contract documents. The elliptical form of the tunnel is designed to transfer the loads from the roof down into the walls which could in some part cause this amount of deformation. Another parameter that affects this is the selection of k0, changing it will alter the stresses around the excavation and change the results. If k0 is really higher in-situ then horizontal stresses will be higher, causing more displacement in the tunnel.
In the analysis it was attempted to estimate how the support system failed. The shotcrete appeared to fail when displacements reached a value of around 25-30 mm and this was therefore set as a limit in the analysis. The rockbolts where modeled as fully grouted where individual elements in the bolt can start to yield even though the entire bolt is not considered failed. The size of the plastic zone and the size of the blocks in the rock mass were therefore important parameters in estimating bolt failure. The size of the plastic zone in the rock mass was not allowed to reach the end of the bolts before it was considered failed.
Phase2 does not model joints and fractures directly. GSI was used to lower the material parameters to simulate joints in the rock mass. It is important to be aware of this fact because the model does not evaluate how much of the rock mass collapses around joints.
Master’s Thesis Conclusion
Hallgrímur Örn Arngrímsson 131 DTU-Byg, HÍ 2009 Þorri Björn Gunnarsson
Bolting will support some of the loose rock around the excavation and even though they did not always appear to support much in the model, they will be more efficient and useful in the tunnel itself.
As has been stated some of the input parameters into the computer model were difficult to determine with accuracy. An effort was made to test variations on each parameter to see how it would affect the results (sensitivity analysis). Values were used that gave safer results to ensure that the estimated support system was not too weak. Since the output from the computer model is only as good as its input, more experience is required before GSI and Phase2 can be fully recommended for Icelandic conditions. In this project the results from the numerical analysis were plausible and comparable to systems that have been previously used in Iceland.

Master’s Thesis General Discussions & Future work
Hallgrímur Örn Arngrímsson 133 DTU-Byg, HÍ 2009 Þorri Björn Gunnarsson
13 GENERAL DISCUSSIONS & FUTURE WORK
Some challenges came up during the project work that would be interesting if they were investigated further.
Optimal support time is well documented and the theory behind its use appears very useful. It is difficult, however, to connect the theory to actual stand-up time in rock mass and therefore it is hard to use practically. More information is needed to utilize the theory properly. This would be especially useful for a tunneling method such as the drill & blast method. There the excavation is performed in stages, were a certain number of sections are blasted before the support systems are installed. This is more cost efficient than having to support each section as it is blasted but it relies heavily on experience and earlier work instead of reliable theoretical methods. Information could for example be gathered by performing convergence measurements alongside the excavation process.
More research could also be done on optimizing blast profiles and the use of explosives in the drill and blast method. It could possibly be made more cost efficient with multiple blast profiles based on the types of rock encountered in each tunnel.
More investigation could also be done on secondary minerals in Búðarháls. They could be used to determine the former burial depth or in-situ stresses of the bedrock and help determine the horizontal and vertical stress ratio, k0. The parameter is important because it is determined by the in-situ horizontal stresses. The higher the stresses (and therefore k0), the more support will be needed in the tunnel, especially in tunnel walls. The parameter is relatively difficult to determine and more testing could be done to make numerical analysis modeling more accurate.
There are a number of other parameters that were difficult to estimate for the numerical analysis, for example GSI, residual parameters and dilation angle. Of those, the largest influence factor was the dilation angle but references differ very much in how to determine it. It influences the volumetric changes in the rock mass during plastic shearing and therefore the deformation of the tunnel.
The numerical analysis program does not model the joints and fractures in the rock mass directly. Much of the failure in rock mechanics occurs around joints and the model does not take them into account. Numerical analysis and computer modeling of tunnels in rock will always only be as good as the input parameters and therefore it is important that knowledge of them is as accurate as possible.

Master’s Thesis References
Hallgrímur Örn Arngrímsson 135 DTU-Byg, HÍ 2009 Þorri Björn Gunnarsson
14 REFERENCES
Andersen, M.A.: “Petroleum Research in NORTH SEA CHALK”, Ch.5. 1995, p.118.
Árnadóttir, Th., Geirsson, H., Jiang, W.: “Crustal deformation in Iceland: Plate spreading and earthquake deformation”, Jökull no. 58, 2008, pp. 59-74.
Bienawski, Z.T.: “Engineering rock mass classifications” Wiley, New york, 1989.
Brady, B.H.G. & Brown, E.T. “Rock Mechanics for Underground Mining, second edition” Chapman & Hall, London, 1993.
Broch, E.: “Future of rock tunneling”, International tunneling association 25th anniversary commemorative book, 1999.
Bruland, A & Sohkrollah, Z.: “Comparison of tunnel blast design models” Tunneling and underground space technology 21, 2001.
Böðvarsson, G.: “Physical characteristics of heat resources in Iceland”, Jökull no. 11, 1961, pp. 29-38.
Cai, M., Kaiser, P.K., Tasaka, Y. and Minami, M.: ”Determination of residual strength parameters of jointed rock masses using the GSI system”, International journal of rock mechanics and mining sciences, 2007.
Carranza-Torres, C. & Fairhurst, C.: “Application of the Convergence-Confinement Method of Tunnel Design to Rock Masses That Satisfy the Hoek-Brown Failure Criterion”, Tunneling and Underground Space Technology, Vol. 15, No. 2, 2000, pp. 187-213.
Contract documents BUD-01- Draft.: Búðarháls Hydroelectro Project. Review 3, February 2009.
Contract documents KAR-14.: Headrace tunnel, volume 5, part III, General information and appendices, Landsvirkjun, 2003.
Dosco overseas engineering ldt, http://www.dosco.co.uk/ , accessed 16.07.2009Edelbro, C.:”Rock Mass Strength-A Review”, Technical Report in Lulea University of Technology, 2003:13.
Edelbro, C.: “Hard rock mass strength – a technical report”, Lulå University of technology, 2003.
Einarsson, P.: “Plate boundaries, rifts and transforms in Iceland”, Jökull no. 58, 2008, pp. 35-58.
Master’s Thesis References
Hallgrímur Örn Arngrímsson 136 DTU-Byg, HÍ 2009 Þorri Björn Gunnarsson
Einarsson, Þ.: “Geology of Iceland: Rocks and Landscape”. Published by Mál og Menning 1994. Reykjavík, Iceland.
Erlingsson, S., “Bergaflfræði og jarðgagnagerð”, Blað 3. árs nema í umhverfis- og byggingarverkfræði,”...upp í vindinn”, 1994, pp. 19-23.
Erlingsson, S.: “Lecture notes in the course 08.41.48 Sprengitækni”. University of Iceland, Faculty of Engineering, 2007.
Erlingsson, S.: “Seismic Design of Subsea Tunnels with Special Emphasizes to the Hvalfjörður Tunnel in Iceland”. Proceedings of the International Symposium on Rock Support – Applied Solutions for Underground Structures, Lillehammer, 1997. PP. 804-811.
Erlingsson, S.: Meeting 22.06.2009.
Friðleifsson, I. B.: ”Geothermal activity in Iceland”, Jökull no. 29, 1979, pp.47-56.
Gíslasson, S. R.: “Weathering in Iceland”, Jökull no. 58, 2008, pp. 387-408.
Goel, B & Singh, R.K.: “Rock mass classification, a practical approach in civil engineering, 1999.
Guðmundsson, A,, Jóhannesson, H. & Harðaron, B.A.: “Hvalfjörður Tunnel – Geological report – Stratigraphy and Structure”. JTS Geotechnical Servies Ltd. Reykjavík, Iceland, 1991.
Guðmundsson, J.: photo, http://www.vegur.is/8185-01-Arnarneshamar-s.JPG, 1999. Accessed 27.07.2009.
Gunnarsson, G.A. “Rock Mass Characterisation and Reinforcement Strategies for Tunnels in Iceland – Fáskrúðsfjörður Tunnel . Master’s Thesis at Technical University of Denmark, 2008.
Gunnarsson, Þ.: photo. Photos taken at field trip to Búðarháls Power Station. 18.06.2009.
Hapgood, Fred.: “The underground cutting edge”, Innovation & technology magazine, 2004.
Harðarson, B. A.: “Icelandic Rock Tunneling Quality”. ITA and ITS Tunneling Conference 1991.
Harðarson, B.S., Fitton, J.G., Hjartarsson, Á.: “Tertiary volcanism in Iceland”, Jökull no. 58, 2008, pp. 161-178.
Haukur Jóhannesson. 1991. Yfirlit um jarðfræði Tröllaskaga(Miðskaga). Árbók F.Í. 39-56.
Herrenknecht, http://www.herrenknecht.com/, accessed 16.07.2009
Master’s Thesis References
Hallgrímur Örn Arngrímsson 137 DTU-Byg, HÍ 2009 Þorri Björn Gunnarsson
Hoek, E. & Brown, E.T.: “Underground excavations in rock”. London: Institution of Mining an Metallurgy, 1982.
Hoek, E., Carranza-Torres, C. and Corkum, B.:”Howk-Brown failure criterion – 2002 edition. In: “Proceedings of the 5th North American Rock Mechanics Symposium and 17th Tunneling Association of Canada Conference”: NARMS-TAC 2002, July 7-10, University of Toronto, 267-271.
Hoek, E.: “Practical Rock Engineering”. Evert Hoek Consulting Engineer Inc. Vancouver, Canada, 2007.
Hönnun: “Búðarhálsvirkjun – Mat á Umhverfisáhrifum”, Landsvirkjun, 24.jan 2001.
Ingimarsson, A. K.; Jóhannsson, Æ.; Loftsson, M.: “In situ rock Mass Stresses inIceland and Rock Mass Deformation of Underground Caverns in the Kárahnjúkar and Blanda Hydroelectric Projects”. Proceedings of the International Symposium on In-situ Rock Stress. Trondheim, Norway 19th – 21st June 2006.
ISRM. Hudson, J.A.; Ulusay, R.: “The Complete ISRM Suggested Methods for Rock Characterization, Testing and Monitoring: 1974-2006”, 2007.
• Brazil test, pp:177-183 • Unconfined compression test, pp:151-156 • Triaxial test, pp: 157-164 and pp: 217-229
Jaeger, J.C., Cook, N.G.W.: “Fundamentals of rock mechanics”. Chapman and Hall, 1979.
Jakobsson, S.P.,Guðmundsson, M.T.: “Subglacial and intraglacial volcanic formations in Iceland”, Jökull no. 58, 2008, pp. 179-196.
Jakobsson, S. P., Jónasson, K., Sigurðsson, I.A.: “The three igneous rock series of Iceland”, Jökull no. 58, 2008, pp. 117-138.
Johannessen, O.; “Tunneldrift sprengningsplaner”, Universitet i Trondheim, Norges tekniske hogskole, 1996.
Jóhannesson, H.: ”Yfirlit um jarðfræði Tröllaskaga (Miðskaga)”. Árbók F.Í., 1991, pp.39-56.
Jóhannsson, Æ.: “Mechanical Properties of Rock in an Icelandic Lava Stratum measurements in Laboratory”. Master’s Thesis at University of Iceland, 1997.
Jónsson, B.: “Geotechnical Field Classification of Basalts in Iceland”. Nordic Geotechnical Conference 1996, pp.469-473.
Master’s Thesis References
Hallgrímur Örn Arngrímsson 138 DTU-Byg, HÍ 2009 Þorri Björn Gunnarsson
Korsnes, I.R., Madland, M.V., Risnes, R.:”Temperature effects in Brazilian, uniaxial and triaxial compressive tests with high porosity chalk”, SPE (Stavanger University College, Society of Petroleum Engineers Inc) annual technical conference and exhibition held in San Antonio, Texas 2002.
Landsvirkjun.: http://www.thjorsa.is/category.aspx?catID=45, Accessed 20.07.2009
Landsvirkjun: http://www.landsvirkjun.com/EN/category.asp?catID=465, Accessed 12.03.2009.
Le Maitre, R. W.: “Igneous Rocks. A Classification and Glossary of Terms. Recommendations of the International Union of Geological Sciences Subcommission on the Systematics of Igneous Rocks”, 2nd ed. xvi + 236 pp. Cambridge, New York, Melbourne: Cambridge University Press, (ed.) 2002.
Loftsson, M.: “Blanda Hydroelectric Project – Groundwater Conditions and Related Excavation Problems”. ITA and ITS Tunneling Conference 1991.
Luo, J.: “A new Rockbolt design criterion and knowledge based experts system for stratified roof”, Virginia Polytechnic Institute and State University, 1999.
Mair, R. J.: “Tunnelling and geotechnics: new horizons”, Géotechnique 58, 2008, No. 9, 695-736.
McClure, C.R.: “Damage to Underground Structures during Earthquakes Workshop on seismic Performance of Underground Facilities”, Augusta, Georgia, USA, 1981.
Meacham, S.: “Nifty idea made a whole lot of difference”, The Sidney Morning Herald, 2007.
Milne, D., Hadjigeorgiou, J. and Pakalnis R.: “Rock Mass Characterization for Underground Hard Rock Mines”, Tunneling and underground space technology, 1998.
Monsees, J.E.:. “Soft Ground Tunnelling,” In Tunnel Engineering Handbook, Sexond Edition, Bickel, J.O., Kuesel, T.R. & King, E. H. (eds.), Chapman & Hall, 1996, pp. 97-121. National geographic: Photo, http://www.ngsprints.co.uk/images/M/1131677.jpg, accessed 29.07.2009. Norconsult: http://geology.norconsult.no/Temaark/rock_support_1.pdf, Accessed 25.07.2009.
Orkuveita Reykjavíkur: http://www.or.is/Umhverfiogfraedsla/Fraedsla/Frumkvodlarnir/, Accessed 12.03.2009.
Master’s Thesis References
Hallgrímur Örn Arngrímsson 139 DTU-Byg, HÍ 2009 Þorri Björn Gunnarsson
Owen, D.R.J. & Hinton, E.: Finite elements in Plasticity theory and practice, Department of Civil Engineering, University College of Swansea, UK, 1986.
Palmstrom, A.: “Measurements of and Correlations between Block Size and Rock Quality Designation (RQD)”, Tunnels and Underground Space Technology 20, 2005, pp. 362-377.
Palmstrom A., Blindheim O.T. and Broch E.: The Q system – possibilities and limitations. Norwegian annual tunnelling conference in Oslo, 2002,
Palmstrom, A., Milne, D. and Peck, W.: “The reliability of rock mass classification used in underground excavation and support design”, GeoEng workshop, 2000.
Pbase, http://www.pbase.com/rockdoc/image/33045164. Accessed 13.07.2009.
Post-Gazette: picture from “Tunnel drilling under the river passes halfway mark”. 2008. Accessed 25.07.2009
Ribacchi, R.: ”Mechanical tests on pervasively jointed rock material, insight into rock mass behaviour”, Rock mech rock eng, 2000.
Rocscience: Documented help for the numerical analysis program Phase2: http://www.rocscience.com/downloads/phase2/webhelp/FAQs/Phase2_FAQs__Theory.htm, accessed 16.06.2009.
Sandvik Tamrock Canada: http://www.bcminerals.ca/pdf/drill_and_blast_cycle.pdf, Accessed 25.07.2009.
Smith, I.M. & Griffiths, D.V.: Programming the finite element method, Programming the Finite Element Method, 4th Edition, 2004.
Sigurðardóttir, V.:Photo taken in 2008.
Sprayed concrete association, “Intro to sprayed concrete”, 1999.
Staðlaráð Íslands, Íslenskur staðall. “Þjóðarskjal með FS ENV 1998-1-1:1994”. 2002.
Steingrímsson, J.: Meeting 10.04.2009. Unpublished laboratory test results preformed on Búðarháls rock types in 2002 which are not included in the 2001 geological report from Hönnun.
Sæmundsson, K. & Gudlaugsson, E.: “Icelandic rocks and minerals”, Mál og Menning,1999.
The National Land Survey of Iceland. The figure is owned by ©Landmælingar Íslands/©National Land Survey of Iceland. 2008.
Timoshenko, S. P.: Schwingungsprobleme der technik, 1932.
Master’s Thesis References
Hallgrímur Örn Arngrímsson 140 DTU-Byg, HÍ 2009 Þorri Björn Gunnarsson
Torres, C. & Fairhurst, C.: "Application of the convergence-confinement method of tunnel design to rock-masses that satisfy the Hoek-Brown failure criterion". Tunnelling and Underground Space Technology 15(2), 187–213, 2000.
Walker, G. P. L.: Zeolite xones and dike distribution in relation to the structure of basalt in eastern Iceland”, J. Geol. 68, 1960, pp. 515-528.
Wang, J.: “Seismic Design of Tunnels”, published 1991. http://www.pbworld.com/library /fellowship/wang/ Accessed 09.06.2009.
Wickham, G.E., Tiederman, H.R. and Skinner, E.H. “Support determination based on geologic predictions”, Proc. N-American rapid excavation tunneling conference, 1972.
Wien, S: “Limits in strength and deformation properties of jointed basaltic rock masses”, Rock mechanics and rock engineering, 2005.
Wood, D.M.:”Soil Behaviour and Critical State Soil Mechanics”, Cambridge University Press, 1990, p. 234.
Road administration of Iceland:
http://www.vegagerdin.is/vegakerfid/jardgong/jardgvegakerf/, Accessed 12.03.2009
Vink, G.E.: A hotspot model for the Iceland and Vøring plateau, J. Geophys. Res. 89,1984, 9949-9959.