Embed Size (px)
Citation preview

Turkey slide package for a foreign investor
February 2011 Coşkun Sönmez
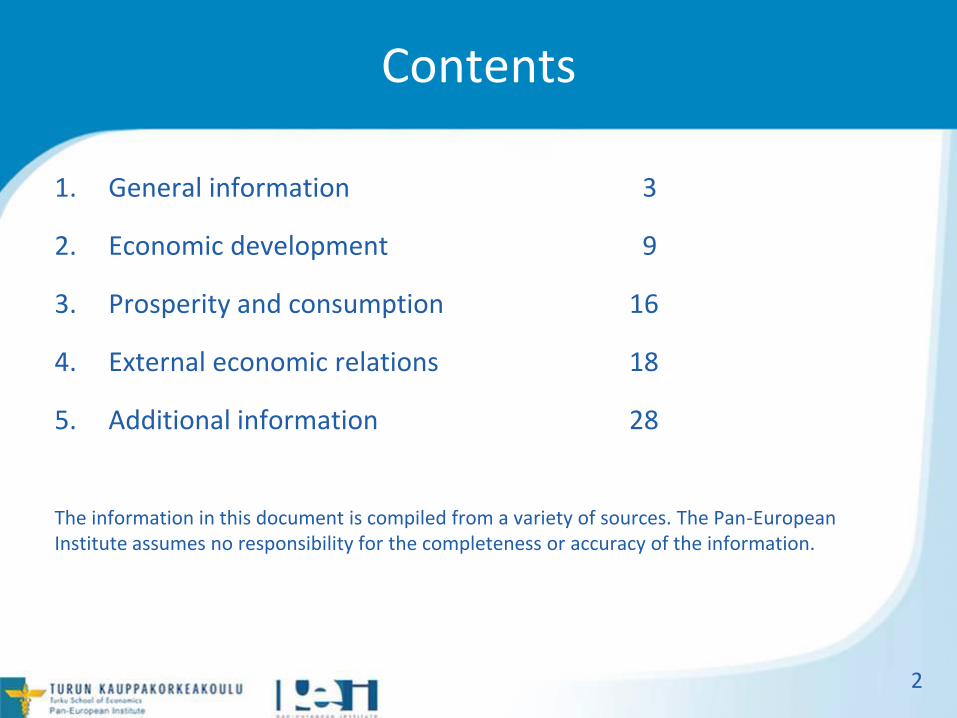
Contents
1. General information 3
2. Economic development 9
3. Prosperity and consumption 16
4. External economic relations 18
5. Additional information 28
The information in this document is compiled from a variety of sources. The Pan-European Institute assumes no responsibility for the completeness or accuracy of the information.
2

1. General information a) Geographical facts
Land area and administrative divisions: 783,562 sq km. The territory of Turkey is subdivided into 81 provinces that are organized into 7 regions. Border countries: Armenia 268 km, Azerbaijan 9 km, Bulgaria 240 km, Georgia 252 km, Greece 206 km, Iran 499 km, Iraq 352 km, Syria 822 km Distances from Ankara to some European capitals:
Berlin 2039 km
Helsinki 2319 km
London 2835 km
Madrid 3086
Paris 2600 km
(geobytes.com)
Sources: CIA World Factbook 3

1. General information b) Population and basic facts
Sources: Turkstat; CIA World Factbook 4
Population: 73 722 988 (December 2010)
Major cities: (Population)
Istanbul 13 255 685
Ankara (capital) 4 771 716
Izmir 3 948 848
Bursa 2 605 495
Share of urban population:
76,3% (December 2010)
Natural resources: Coal, iron ore, copper, chromium, antimony, mercury, gold, barite, borate, celestite (strontium), emery, feldspar, limestone, magnesite, marble, perlite, pumice, pyrites (sulfur), clay, arable land, hydropower
Industries: textiles, food processing, autos, electronics, mining (coal, chromate, copper, boron), steel, petroleum, construction, lumber, paper
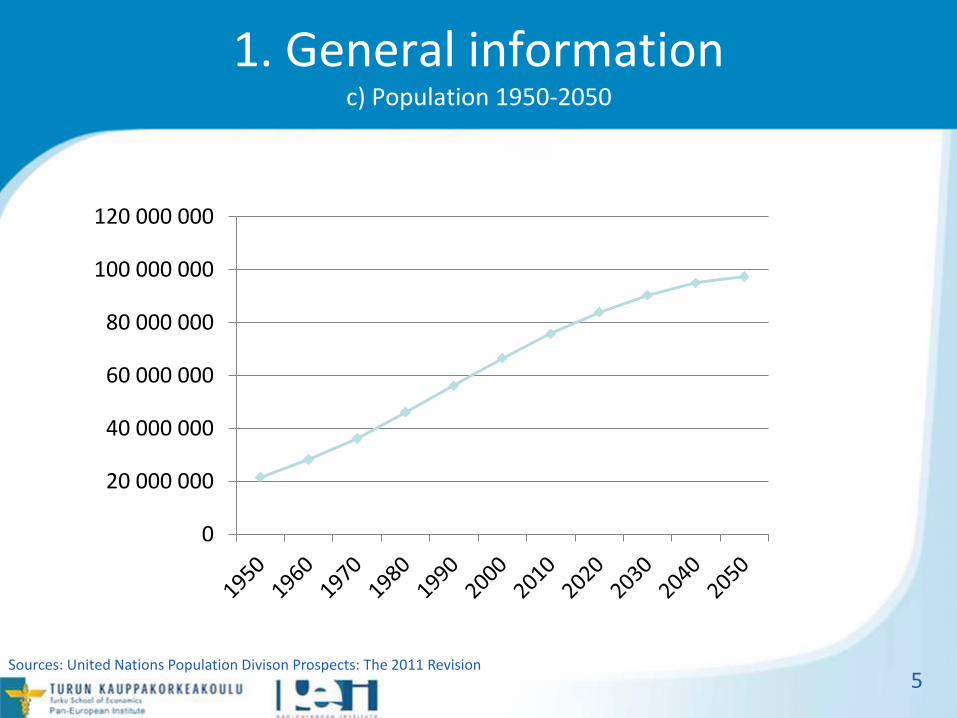
1. General information c) Population 1950-2050
Sources: United Nations Population Divison Prospects: The 2011 Revision 5
0
20 000 000
40 000 000
60 000 000
80 000 000
100 000 000
120 000 000
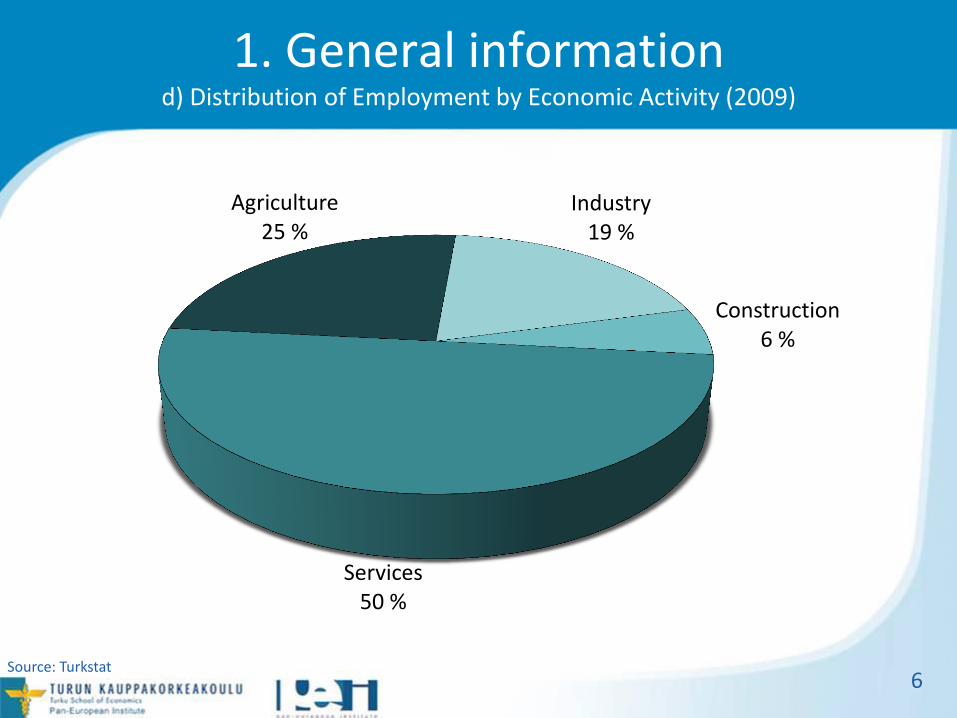
1. General information d) Distribution of Employment by Economic Activity (2009)
Source: Turkstat 6
Services 50 %
Agriculture 25 %
Industry 19 %
Construction 6 %

1. General information e) Transport infrastructure
Airports: 99 (+20 Heliports)
Istanbul (Atatürk and Sabiha Gökcen), Ankara (Esenboga), Izmir
(Adnan Menderes), Adana, Trabzon, Van, Erzurum, Bursa, Samsun, Antalya,
Dalaman, Milas, Bodrum
Ports and Terminals: Aliaga, Diliskelesi, Eregli, Izmir, Kocaeli (Izmit), Mersin Limani, Yarimca
Railways: 8,697 km (1,920 km electrified) (2008)
Roadways: 352,046 km (2008)
Waterways: 1,200 km (2008)
Sources: CIA World Factbook 7
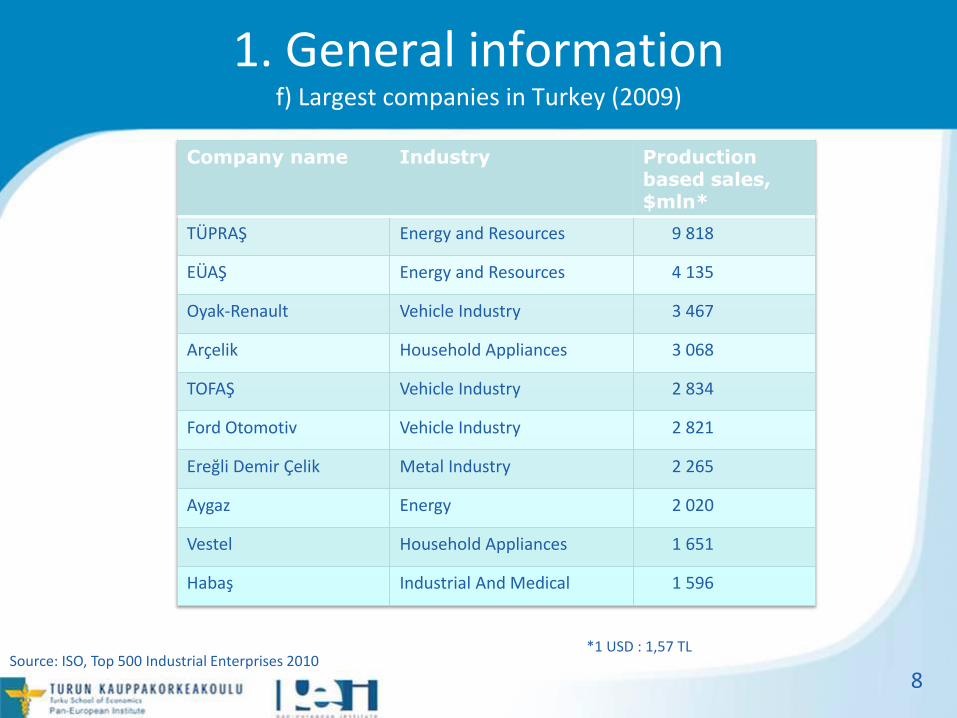
1. General information f) Largest companies in Turkey (2009)
Source: ISO, Top 500 Industrial Enterprises 2010
8
Company name Industry Production based sales, $mln*
TÜPRAŞ Energy and Resources 9 818
EÜAŞ Energy and Resources 4 135
Oyak-Renault Vehicle Industry 3 467
Arçelik Household Appliances 3 068
TOFAŞ Vehicle Industry 2 834
Ford Otomotiv Vehicle Industry 2 821
Ereğli Demir Çelik Metal Industry 2 265
Aygaz Energy 2 020
Vestel Household Appliances 1 651
Habaş Industrial And Medical 1 596
*1 USD : 1,57 TL
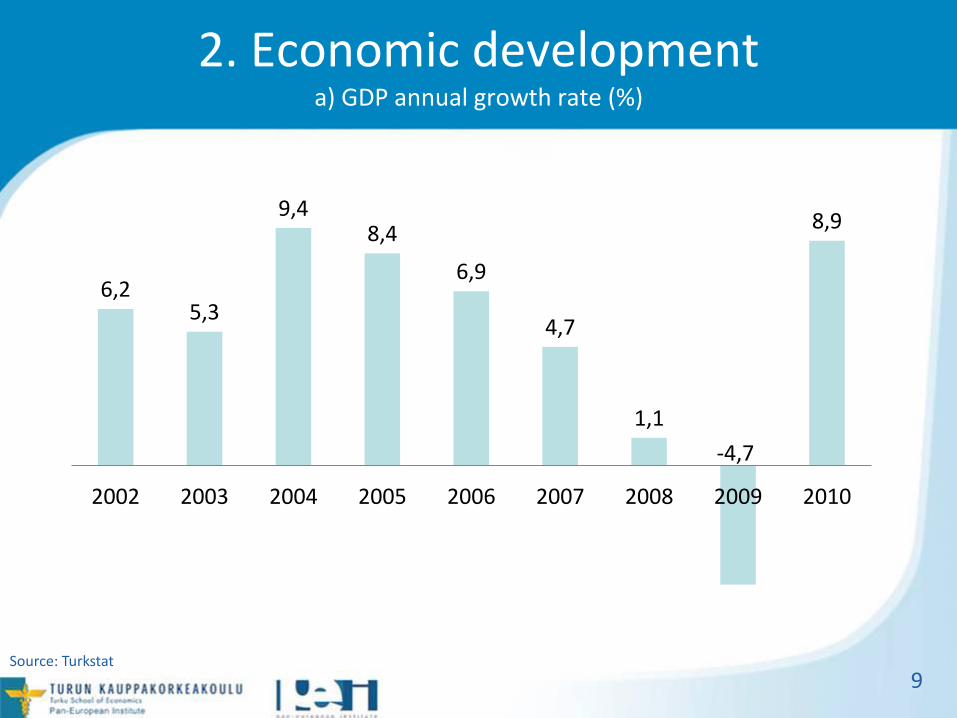
2. Economic development a) GDP annual growth rate (%)
Source: Turkstat
9
6,2 5,3
9,4 8,4
6,9
4,7
1,1
-4,7
8,9
2002 2003 2004 2005 2006 2007 2008 2009 2010

2. Economic development b) GDP per capita (USD)
Source: Turkstat, 2011 Annual Programme
10
3 492
4 559
5 764
7 021 7 583
9 234
10 440
8 578
2002 2003 2004 2005 2006 2007 2008 2009
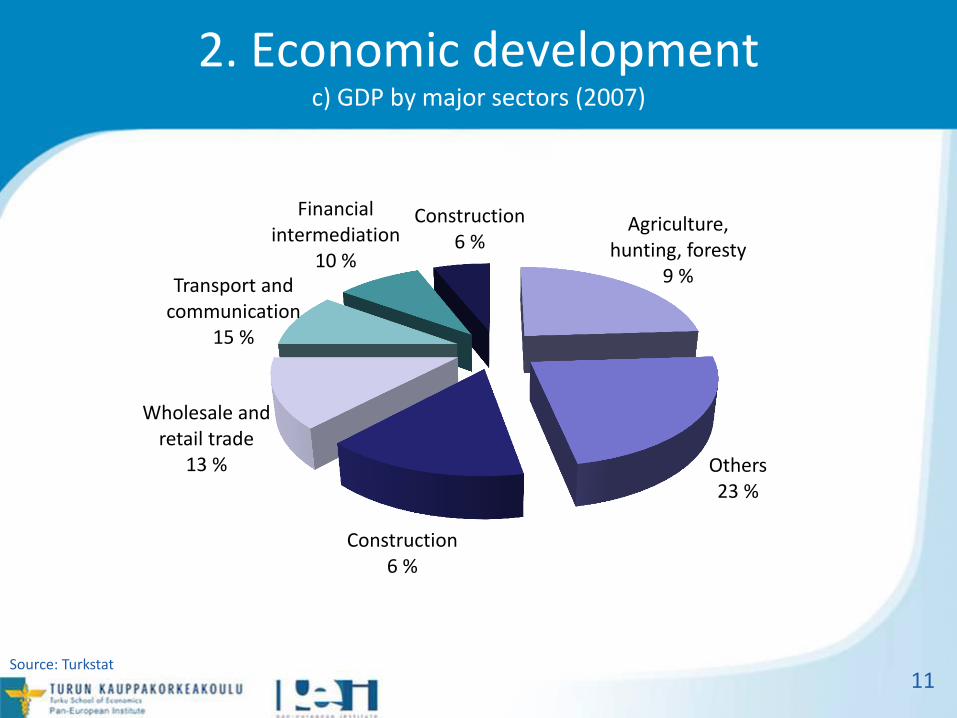
2. Economic development c) GDP by major sectors (2007)
Source: Turkstat 11
Agriculture, hunting, foresty
9 %
Others 23 %
Construction 6 %
Wholesale and retail trade
13 %
Transport and communication
15 %
Financial intermediation
10 %
Construction 6 %

2. Economic development d) Labour force and population
Source: Turkstat 12
2009 2010
Population (1 000) 70 773 71 574
Labour Force (1 000) 25 319 25 873
Employed (1 000) 22 019 22 972
Unemployed (1000) 3 299 2 901

2. Economic development e) Unemployment rate (%)
Source: Turkstat
13
10,8 10,6 10,2 10,3 11,0
14,0
11,2
2004 2005 2006 2007 2008 2009 2010 Oct

2. Economic development f) Turkey´s business environment in comparison
14
Ranking index Rank of Turkey/ Total number of countries
World Democracy Audit overall ranking 2010 [World Audit]
59/150
Index of Economic Freedom 2011 [The Heritage Foundation]
67/179
Corruption Perceptions Index 2010 [Transparency International]
64/178
Global Competitiveness Index 2010-2011 [World Economic Forum]
61/139
Ease of Doing Business 2010 [World Bank]
65/183

2. Economic development g) Industrial production growth rate (%)
15
-8,7
9,5 8,7 9,8
5,6 7,3 7,0
-0,6 -9,9
2001 2002 2003 2004 2005 2006 2007 2008 2009
Source: UNECE Statistical Database

3. Prosperity and consumption a) Monthly minimum wage earnings (€/Month)
16
189
240 240
331 297
353 347 380
419
2003 2004 2005 2006 2007 2008 2009 2010 2011
Source: Ministry of Finance
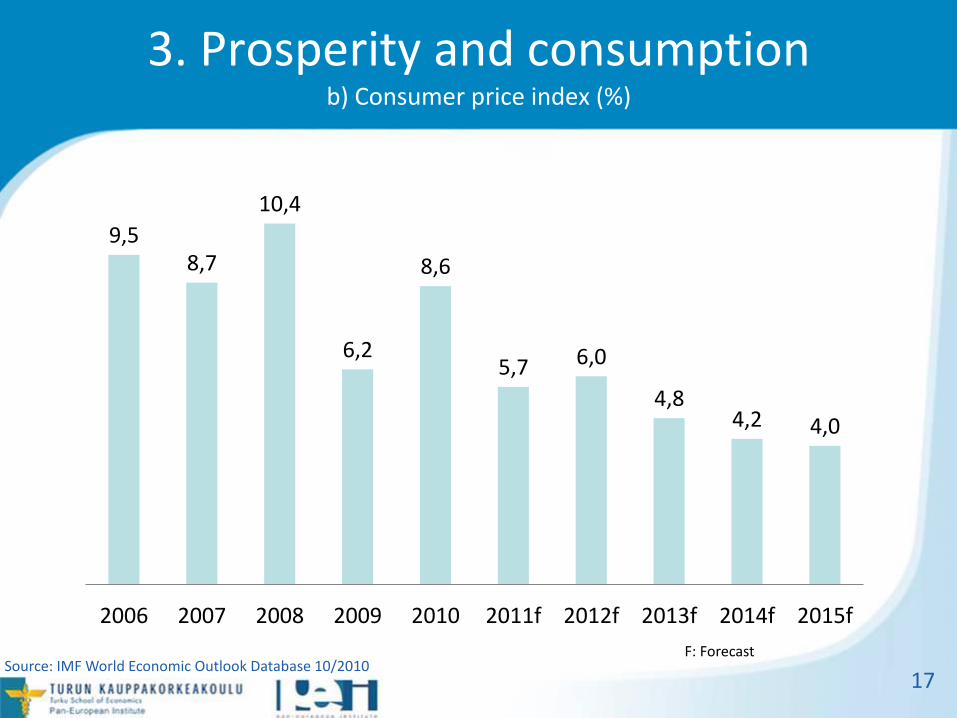
3. Prosperity and consumption b) Consumer price index (%)
17
9,5 8,7
10,4
6,2
8,6
5,7 6,0
4,8 4,2 4,0
2006 2007 2008 2009 2010 2011f 2012f 2013f 2014f 2015f
Source: IMF World Economic Outlook Database 10/2010 F: Forecast
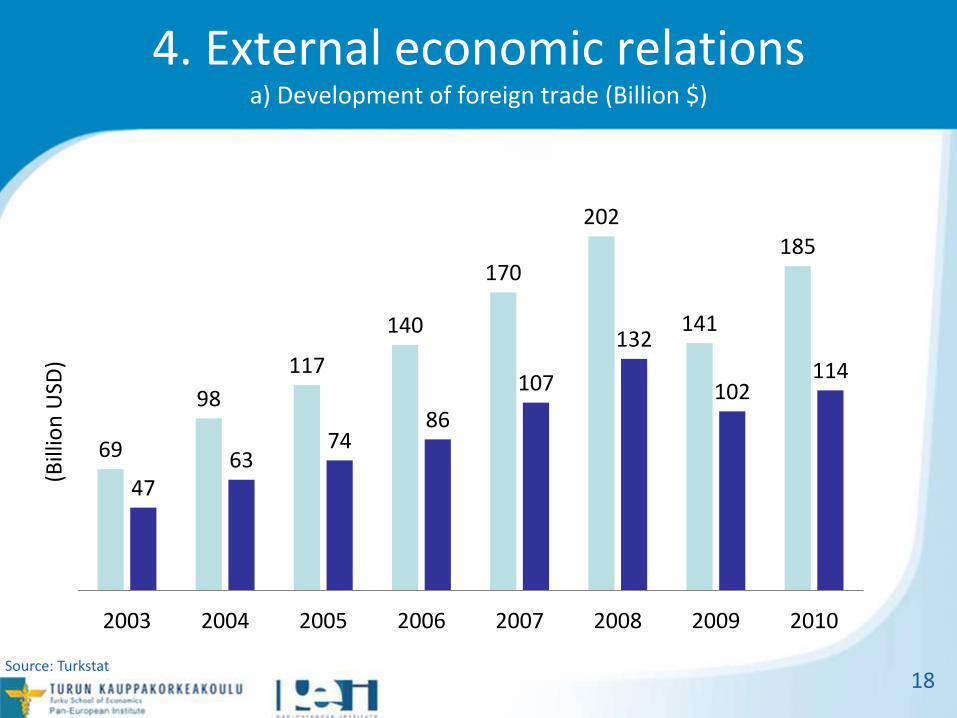
4. External economic relations a) Development of foreign trade (Billion $)
18
69
98
117
140
170
202
141
185
47 63
74 86
107
132
102 114
2003 2004 2005 2006 2007 2008 2009 2010
Source: Turkstat
(Bill
ion
USD
)

4. External economic relations b) Foreign trade structure in 2010
19
Source: Undersecretariat Of The Prime Ministry For Foreign Trade
Mineral fuels and oils
21 %
Machineries 12 %
Iron and steel 9 %
Vehicles other than
railway 7 %
Others 51 %
Imports
Vehicles other than
railway 12 %
Machineries 8 %
Iron and steel 8 %
Mineral fuels and
oils 4 %
Others 68 % Exports

4. External economic relations c) Major export and import partners in 2010
20
Others 67 %
Germany 10 %
United Kingdom
7 % Italy 6 % Iraq 5 %
France 5 %
Exports
Russia 12 % Germany
9 %
China 9 %
Usa 7 %
Italy 5 %
Others 58 %
Imports
Source: Undersecretariat Of The Prime Ministry For Foreign Trade
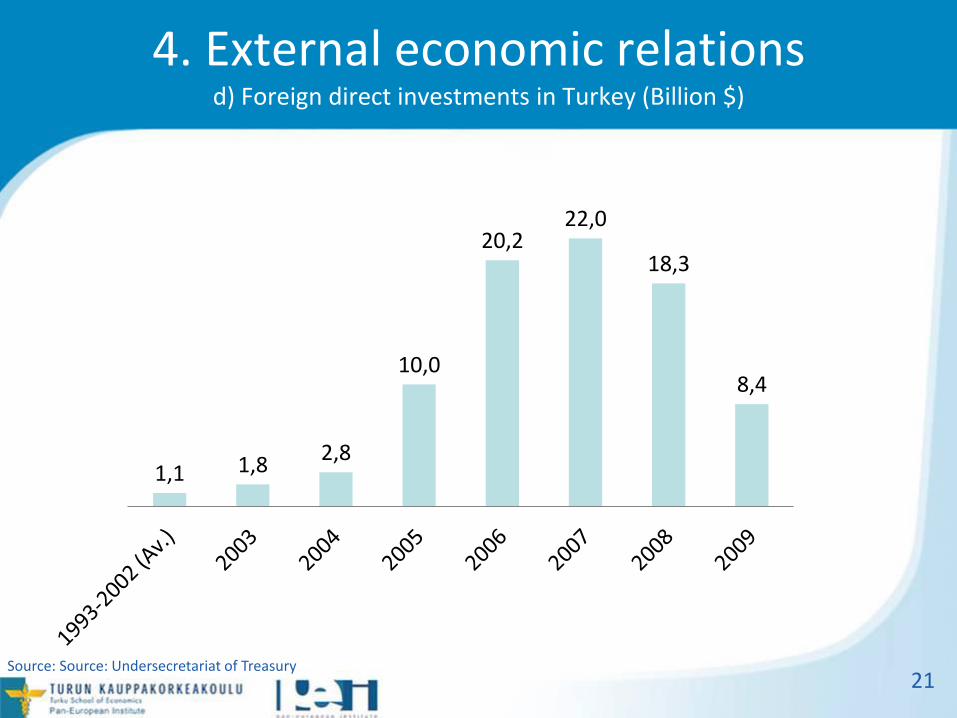
4. External economic relations d) Foreign direct investments in Turkey (Billion $)
21
1,1 1,8 2,8
10,0
20,2 22,0
18,3
8,4
Source: Source: Undersecretariat of Treasury

4. External economic relations e) Foreign direct investment stock (Billion $)
22
39
64
85
104
124
145
165
185
2004 2005 2006 2007 2008 2009 2010f 2011f
Source: World Investment Prospects to 2011; forecast (f)
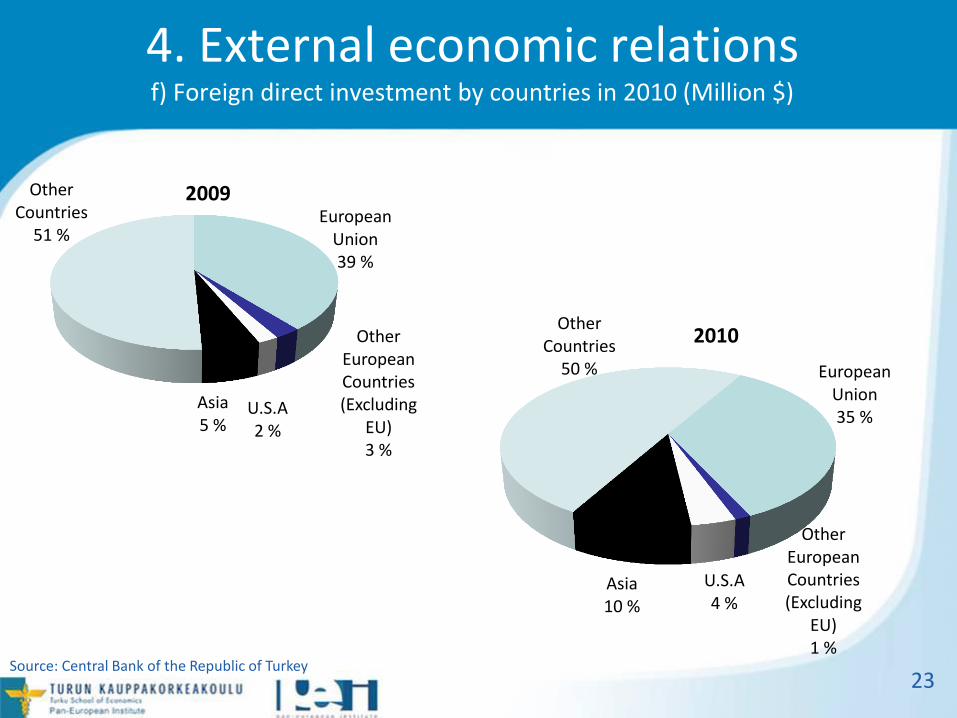
4. External economic relations f) Foreign direct investment by countries in 2010 (Million $)
23 Source: Central Bank of the Republic of Turkey
European Union 39 %
Other European Countries (Excluding
EU) 3 %
U.S.A 2 %
Asia 5 %
Other Countries
51 %
2009
European Union 35 %
Other European Countries (Excluding
EU) 1 %
U.S.A 4 %
Asia 10 %
Other Countries
50 %
2010
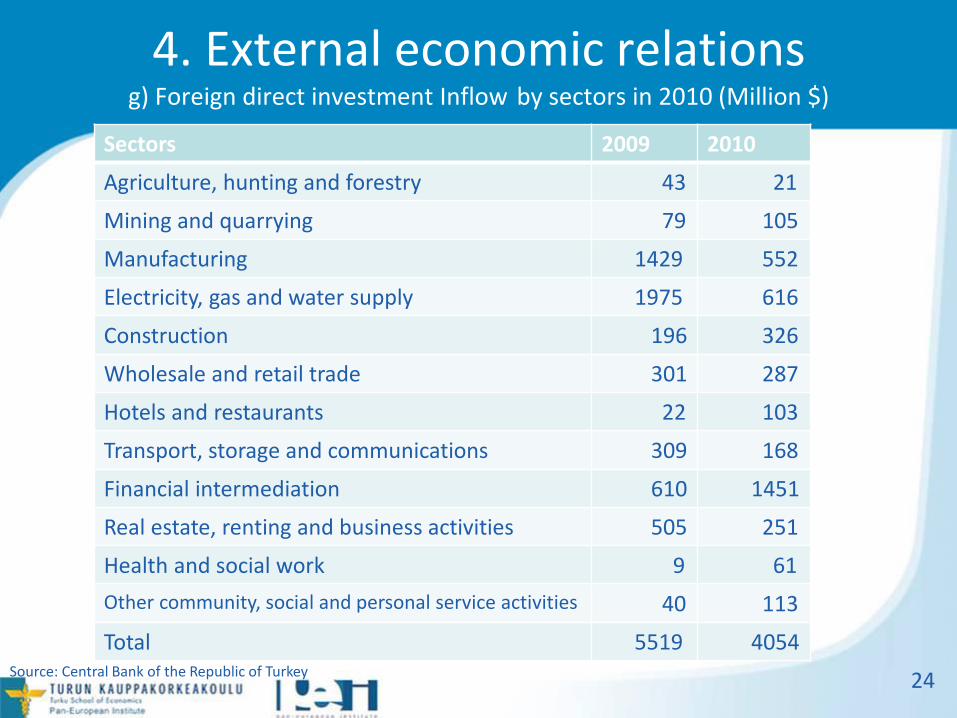
4. External economic relations g) Foreign direct investment Inflow by sectors in 2010 (Million $)
24
Sectors 2009 2010
Agriculture, hunting and forestry 43 21
Mining and quarrying 79 105
Manufacturing 1429 552
Electricity, gas and water supply 1975 616
Construction 196 326
Wholesale and retail trade 301 287
Hotels and restaurants 22 103
Transport, storage and communications 309 168
Financial intermediation 610 1451
Real estate, renting and business activities 505 251
Health and social work 9 61
Other community, social and personal service activities 40 113
Total 5519 4054 Source: Central Bank of the Republic of Turkey
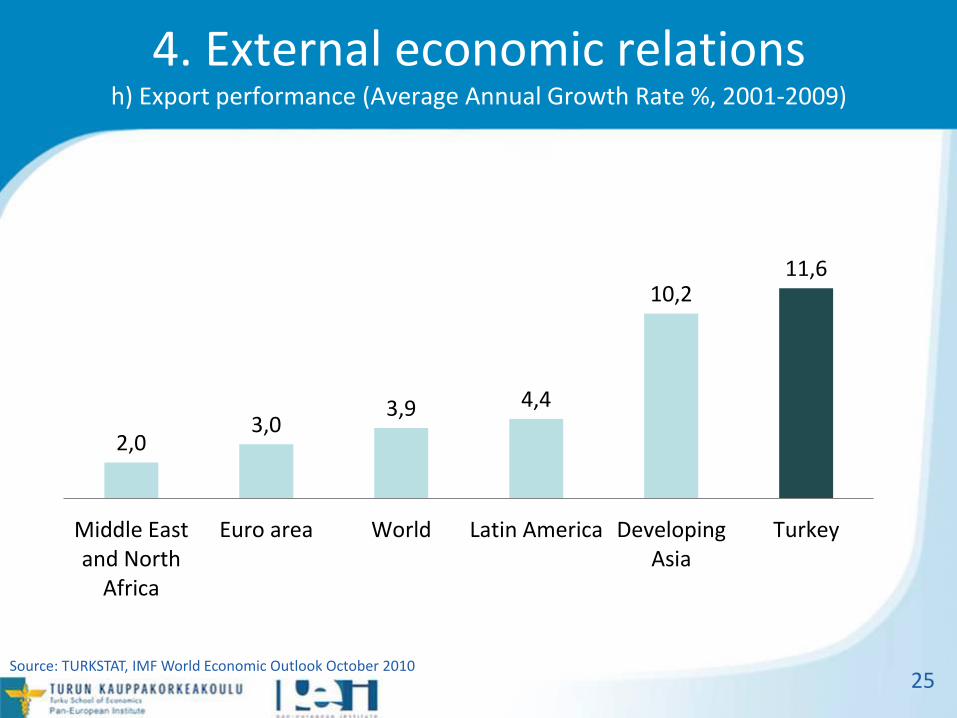
4. External economic relations h) Export performance (Average Annual Growth Rate %, 2001-2009)
25
2,0 3,0
3,9 4,4
10,2 11,6
Middle Eastand North
Africa
Euro area World Latin America DevelopingAsia
Turkey
Source: TURKSTAT, IMF World Economic Outlook October 2010

4. External economic relations i) Distribution of foreign visitors by years (Million)
26 Source: Turkish Tourism Investors Association
13,2 14,0
17,5
21,1 19,8
23,3
26,3 27,0
0,0
5,0
10,0
15,0
20,0
25,0
30,0
2002 2003 2004 2005 2006 2007 2008 2009

4. External economic relations j) Distribution of foreign visitors by countries in 2008
27
Germany 17%
Russia 11%
United Kingdom
8%
Bulgaria 5%
Holland; 4% Others 55%
Source: Turkish Tourism Investors Association
5. Additional information a) Business services and authorities
28
BUSINESS SUPPORTING SERVICES
Business Guide of Turkey
www.turkindex.com
Independent Industrialists and Businessmen´s Association (MUSIAD)
www.musiad.org.tr
Invest in Turkey
www.invest.gov.tr
SOME AUTHORITIES
The Grand National Assembly of Turkey
http://www.tbmm.gov.tr
Ministry of Industry and Trade
http://www.sanayi.gov.tr/
Ministry of Finance
www.maliye.gov.tr
Ministry of Foreign Affairs
www.mfa.gov.tr
Information subject to changes

5. Additional information b) Embassy and European Commission´s Delegation
29
Embassy of Finland, Ankara
Postal address: Embassy of Finland P.K. 22 06692 Kavaklidere Ankara Turkey Visiting address: Kader Sokak No. 44 06700 Gaziosmanpasa Tel: +90-312-457 44 00 (pbx) +90-312-457 44 44 (visa and consular section) Fax: +90-312-468 00 72 +90-312-426 74 29 (visa and consular section)
E-mail: [email protected] Web Site: www.finland.org.tr
Delegation of the European Union to Turkey Address: Uğur Mumcu Cad. No:88, Kat: 4, Gaziosmanpaşa 06700 Ankara – Türkiye Telephone: (+90) (312) 459 87 00 Fax: (+90) (312) 446 67 37 E-mail: [email protected] Web Site: http://www.avrupa.info.tr
Information subject to changes

5. Additional information c) Other sources
The Economist Intelligence Unit EIU
www.eiu.com
Turkstat
http://www.turkstat.gov.tr
Republic of Turkey Prime Ministry Undersecretariat of Treasury
www.treasury.gov.tr
European Bank for Reconstruction and Development EBRD
www.ebrd.com
Eurostat
epp.eurostat.ec.europa.eu
International Labour Organization ILO
www.ilo.org
International Monetary Fund IMF
www.imf.org
United Nations Economic Commission for Europe UNECE
www.unece.org
Information subject to changes
30
Unicef www.unicef.org The World Bank www.worldbank.org